The Dynamics of 0-Group Herring Clupea harengus and Sprat Sprattus sprattus Populations Along the Norwegian Skagerrak Coast
 Florian Berg
 Cecilie Kvamme1
  Richard D. M. Nash
- 1Institute of Marine Research (IMR), Bergen, Norway
- 2University of Bergen, Department of Biological Sciences, Bergen, Norway
Coastal areas are important habitats for early life stages of many fish species. These habitats are used as nursery grounds and can provide a significant contribution to the recruitment of a fish population. In 1919, standardized sampling with a beach seine along the Norwegian Skagerrak coastline was established mainly to target 0-group fish. Here, we focus on Atlantic herring and European sprat to explore whether inter-annual variability in the abundance of these species is indicative of variability in recruitment. We investigated if the abundance of 0-group herring and sprat are affected by environmental factors. Further, the beach seine abundance indices were compared with recruitment estimates of neighboring stocks. There was a clear correlation between herring and sprat abundance in the beach seine samples. While sprat abundance was mainly affected by environmental factors such as temperature and current drift, herring abundance was positively affected by the recruitment of the neighboring stock of western Baltic spring spawners. One plausible explanation could be that sprat recruit to a more local component, while herring of the neighboring stock utilize the Skagerrak coastline as nursery grounds. This study demonstrates the importance of long time series and can provide new insight into the dynamics and structure of multiple fish species.
Introduction
Coastal habitats are known for their high productivity and are therefore important spawning and nursery grounds for many fish species (Blaber and Blaber, 1980; Orth et al., 1984). These coastal habitats are especially vulnerable to variability and trends in hydrographic conditions influencing recruitment, growth and distribution of fish populations (Albretsen et al., 2012). In recent years, the pressure on coastal ecosystems has increased due to anthropogenic activities leading to reduced biodiversity or habitat degradation (Lotze et al., 2006; Worm et al., 2006; Waycott et al., 2009; Illing et al., 2016). The Skagerrak-Kattegat area (Figure 1), a transition area between the North Sea and Baltic Sea, can be considered as a large estuarine area (Munk et al., 2014) and is an important nursery area for many commercially valuable fish. The hydrography of the Norwegian Skagerrak coast is characterize sby the Norwegian Coastal Current (NCC) which flows westward in the Skagerrak and northwards along the Norwegian coast (Sætre, 2007; Albretsen et al., 2012). The NCC is responsible for larval drift along the Norwegian coast and highly influence recruitment of several species (Sætre, 2007; Skagseth et al., 2015). Young-of-the-year (YOY) Atlantic herring (Clupea harengus) and European sprat (Sprattus sprattus) are found in both the Skagerrak and Kattegat with the two species constituting the 2nd and 6th most abundant members of the ichthyoplankton between 1992 and 2010 (Munk et al., 2014). YOY fish are of ecological importance as they determine year class strength and following recruitment success of populations (Oeberst et al., 2009; Eriksen et al., 2011). A major cause for the recruitment variation is the occurring mortality of YOY fish during the early stages of development (Hjort, 1914; Houde, 2008). The Norwegian Skagerrak coastline, with its numerous fjords and bays, provides valuable areas for larval and juvenile fish to grow up. Over relatively small spatial scales, the abundance of fish in these areas can be highly influenced by coastal currents. Fish can originate from local populations and stay within their spawning areas due to larval retention, or from populations that rely upon larval drift from their spawning grounds to their nursery areas. The Norwegian coastal current can play an important role in the recruitment of fish in this area since larvae are dependent on the current transporting them to suitable nursery areas (Skagseth et al., 2015).
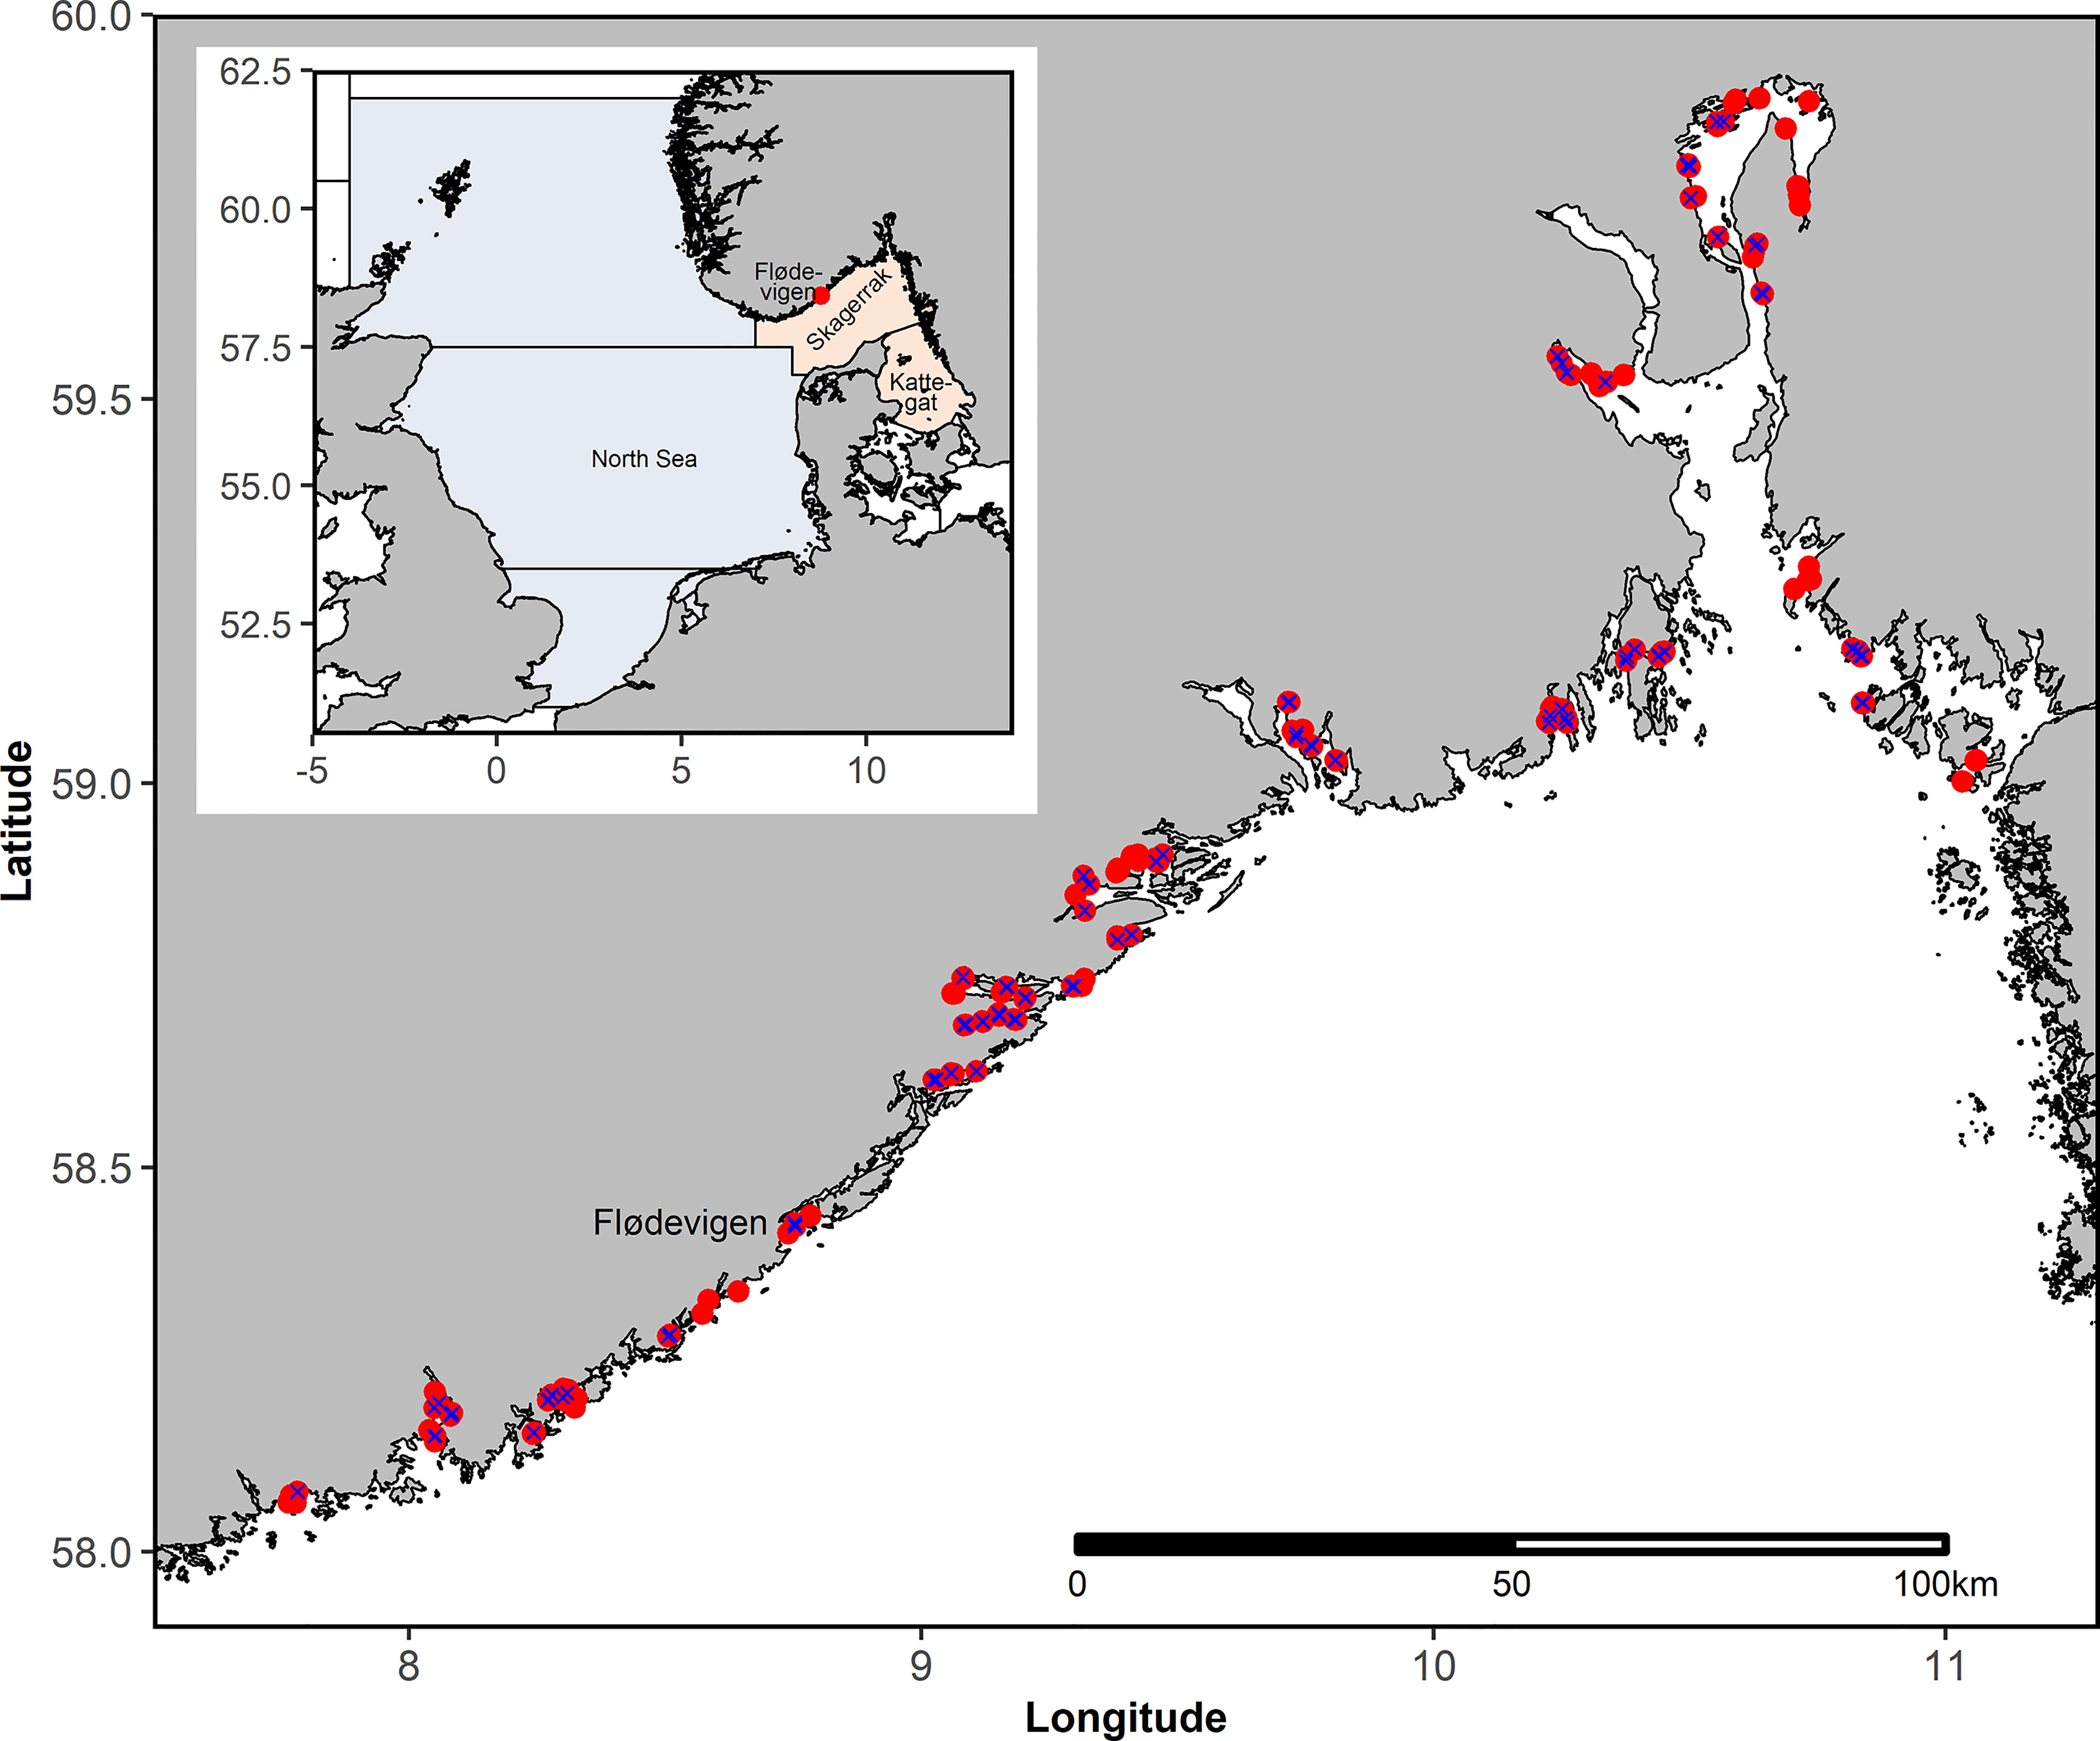
Figure 1 Upper left corner: Overview map showing the North Sea (light blue) and Skagerrak-Kattegat (light red) including the study area. Detailed map including all stations sampled during the annual beach seine survey in September-October between 1919 and 2018. Not all stations are sampled annually. Blue X indicate stations that were sampled more than 95% of the years after 1965.
European sprat and Atlantic herring are important species both economically and ecologically using the Skagerrak-Kattegat area a nursery ground. Both species are selective planktivorous feeders and are important prey for other fish such as several gadoid species (Engelhard et al., 2014). While sprat typically spawn in batches from spring to summer without any clear spawning migrations (Alheit, 1988), herring are total spawners migrating to their specific spawning grounds in defined times mostly, in spring or autumn (Iles and Sinclair, 1982). However, both species show high level of plasticity (Geffen, 2009) and might vary from the general pattern. Local sprat spawning has been directly observed along the Norwegian Skagerrak coast from February to July (Vitale et al., 2015). However, drift of pelagic eggs and larvae from offshore areas was for a long period considered the most important resource of YOY sprat along the coast (Lindquist, 1961). In contrast to sprat, herring lay adhesive eggs on bottom substrate and the eggs are therefore most likely not affected by coastal currents. However, especially in shallow coastal areas storm events can induce egg mortality (Moll et al., 2018). After hatching, however, the larvae can be spread by the currents for 3 to 4 months (Holst and Slotte, 1998; Skagseth et al., 2015). Also for herring, local coastal spawning along the Norwegian Skagerrak coast has been observed during spring (Eggers et al., 2014), but the extent of larval drift, utilizing the coast as nursery area, from other populations in the North Sea and Skagerrak-Kattegat area remains unquantified. Due to well-defined spawning grounds and low connectivity, herring populations within the Skagerrak-Kattegat region are genetically distinct (Bekkevold et al., 2005; Pettersson et al., 2019; Han et al., 2020). However, these populations are considered as a single stock, the Western Baltic spring spawners (WBSS). In addition, a second stock, the North Sea autumn spawners (NSAS), also occur in the area utilizing it as an important nursery ground (Clausen et al., 2015). The relationship between young herring along the Norwegian Skagerrak coast and these two stocks has not been determined. For sprat, recent genetic and otolith shape studies revealed that sprat occurring along the Norwegian coast are distinct from sprat in the North Sea or Skagerrak-Kattegat (Quintela et al., 2020; Quintela et al., 2021; Saltalamacchia et al., 2022). Based on these results and other information, such as survey indices, growth data (see ICES, 2018 for details), sprat in the North Sea or Skagerrak-Kattegat are currently managed as one large single stock excluding sprat along the Norwegian coastline which are currently not assessed (ICES, 2018). A previous study by Torstensen and Gjøsæter (1995), however, indicated that the abundance of sprat along the Norwegian coastline was correlated with the abundance of the offshore stock of sprat in the Skagerrak and Kattegat. Thus, sprat along the Norwegian coastline are pheno- and genotypically distinct from offshore sprat but there might be a synergy between their stock/population dynamics, as indicated by number of recruitments.
Based on the knowledge gap for herring and the contradictory results of previous and current studies for sprat, the aim of the present study is to evaluate the dynamics of young herring and sprat along the Norwegian Skagerrak coast. We investigate whether the variability in abundance of these two species is related to recruitment or spawning stock biomass (reproductive output) of each species and whether there is a synergy between these two species. We also investigate potential linkages between the Western Baltic and local spring-spawning herring stocks and the potential links between the North Sea, Skagerrak-Kattegat and Norwegian coastal sprat stocks. We used an annual beach seine survey designed to monitor the occurrence and abundance of 0-group fish along the Norwegian Skagerrak coast to provide an index of young herring and sprat abundance. This index was compared with stock abundance estimates, recruitment and survey indices from the North Sea, Skagerrak-Kattegat, and the Western Baltic. Linkages to physical forcing, e.g., through annually varying climatic conditions, were investigated using data from local hydrographic stations and climate data.
Material and Methods
The time series for the beach seine catches covers the period 1919-2018, however, other explanatory parameters/observations were not available for the same period. Therefore, it was necessary to vary the time series and the selection of stations at various points in the analyses. For the estimation of correlations, the longest period in which all descriptors were available was chosen.
Beach Seine Survey
On average 115 (range 69-154, excluding the period of the second World War when only 4 station were sampled; Figure S1) stations along the Norwegian Skagerrak coast (Figure 1) have been sampled annually by a beach seine survey in September-October since 1919 (Tveite, 1971; Torstensen and Gjøsæter, 1995). Originally, the beach seine survey was initiated to quantify the recruitment of Atlantic cod (Gadus morhua) and other gadoids. The survey usually starts in the southwest of the Norwegian Skagerrak coast, and continuing northeastwards. In the present study, we use data from 11,470 beach seine hauls taken during the period 1919-2018 (Table S1). The beach seine has a stretched mesh size of 15 mm, is 40 m long and 1.7 m deep, and is estimated to sample an area of up to 390 m2 (Torstensen and Gjøsæter, 1995). For more details about the beach seine survey see Barceló et al. (2016) and references therein.
In general, for each haul, the total abundance of herring and sprat were counted. However, up to the 1960s for unknown reasons herring and/or sprat were not counted in some hauls (276 and 536 for herring and sprat, respectively), instead the abundance for these hauls were indicated using an index from 0-5 [Table S2, similar to Torstensen and Gjøsæter (1995)]. We converted these index values to actual count number by using the midpoint of each index interval as estimated count of herring and sprat for these hauls (Table S2).
Total length was measured in 0.5 cm and 1 cm intervals for herring and sprat, respectively. Based on the length distribution (Figure 2) of herring (2.5-20 cm) and sprat (3-14 cm) and the very low abundance of herring larger than 14.5 cm (128 of a total of 11,520) and sprat larger than 10 cm (62 of a total of 33,512), we assumed that all herring and sprat represent 0-group fish and did not exclude the larger individuals. Based on otolith readings of individuals in this region and time of the year (not part of the beach seine data) we know that 1-year-old herring and sprat usually are larger than 14.5 cm and 10.0 cm, respectively (Figure S2).
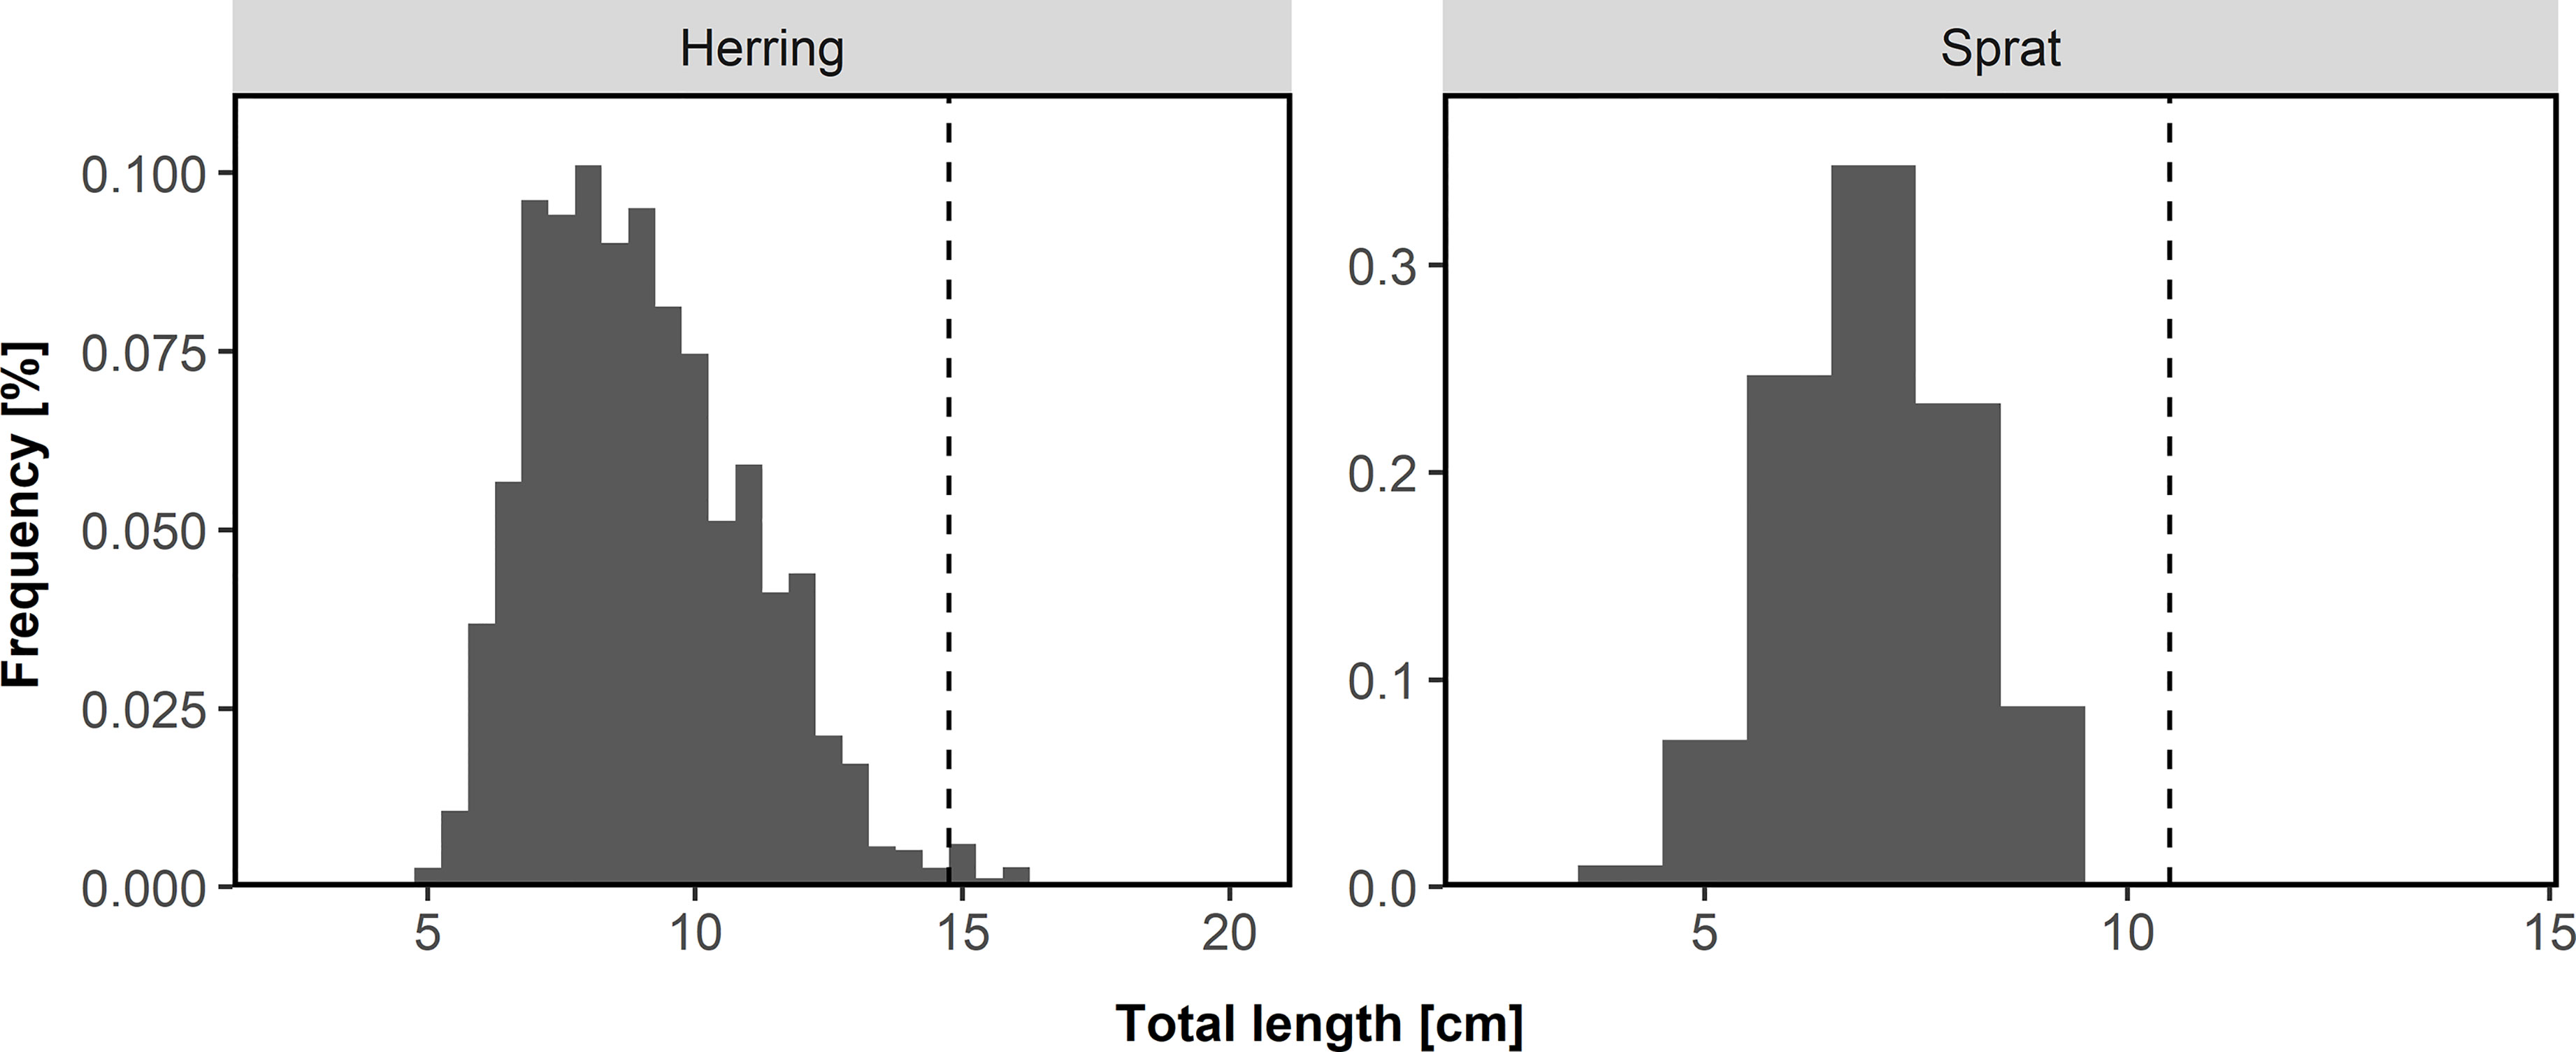
Figure 2 Length distribution of herring and sprat collected from 1919-2018 during the annual beach seine survey along the Norwegian Skagerrak coast by region. Dashed line indicates separation between 0-group and age 1 fish.
Stock Estimates and Survey Indices of Herring and Sprat
We used stock estimates and survey indices provided by the International Council for the Exploration of the Sea (ICES, 2020). Herring abundance from the beach seine time series was compared to stock estimates from North Sea autumn-spawning herring (NSAS) and western Baltic spring-spawning herring (WBSS), whereas sprat abundance was compared to stock estimates of the sprat stock in the North Sea and Skagerrak-Kattegat. The survey indices we used for the three stocks were obtained by the “ICES International Bottom Trawl Surveys” (IBTS; http://ices.dk/community/groups/Pages/IBTSWG.aspx) in quarter 1 (Q1, January-February) and 3 (Q3, July-August), the “ICES coordinated acoustic survey in the Skagerrak and Kattegat, the North Sea, West of Scotland and the Malin Shelf area” (HERAS; ICES, 2015) taking place in June-July, and the “German acoustic autumn survey” (GERAS; ICES, 2017) taking place in October. Since the beach seine data represent 0-group fish, we linked age-based survey indices to the original year class, i.e., the survey index of age 1 fish estimated in 2005 was linked to the 2004 year class of the beach seine. An overview of all survey indices and stock estimates (spawning stock biomass and recruitment) is given in Tables S3, S4.
Zooplankton
The variability in herring and sprat abundance in relation to zooplankton abundance was also investigated. We extracted data provided by the Continuous Plankton Recorder (CPR) surveys (CPR Survey, 2018). We only used data from the North Sea (51.5°N – 62.0°N and 4.0°W – 8.0°E) and Skagerrak-Kattegat (east of 8.0°E). Further, we only included abundance data of Calanus finmarchicus, C. helgolandicus, and large and small copepods which are important prey items for herring and sprat (Falkenhaug and Dalpadado, 2014; Kristiansen et al., 2022). Small copepods (<2 mm) were identified based on the “traverse” counting method, i.e. counted directly on the silk using a microscope, whereas the large copepods (>2 mm) are removed from the silk and counted using a stereomicroscope (Richardson et al., 2006). Annual indices were calculated for further analyses as the average of all observations for each of the four plankton groups (C. finmarchicus, C. helgolandicus, and large and small copepods).
Physical Parameters
Continuous temperature and salinity measurements (daily) from the Institute of Marine Research station in Flødevigen (Figure 1) were used to calculate annual, quarterly, and monthly mean temperatures from 1919-2018. Temperatures were measured at 1 m and 19 m depth. From 1974 onwards, temperatures were also measured at 75 m depth. Mean temperatures were calculated for each depth independently.
To cover a larger area, we also used the Atlantic multi-decadal oscillation (AMO) which is based upon the average anomalies of sea surface temperatures (SST) in the North Atlantic. The AMO is calculated from the Kaplan SST V2 dataset which was provided by NOAA/OAR/ESRL PSD, Boulder, Colorado, USA, from their website at https://www.esrl.noaa.gov/psd/. For this study, we calculated the annual, quarterly, and monthly average anomalies for the North Sea and Skagerrak-Kattegat combined and separately from the Kaplan SST V2 dataset.Lastly, because herring and sprat larvae are in the water column and subject to transport mechanisms, the effect of anomalies in ocean circulation, represented by current velocity vectors, upon the abundance of herring and sprat were investigated. We used simulation data from the global ocean model MPIOM, forced with ERA40 reanalysis data provided by Mathis et al. (2015). We applied an empirical orthogonal function (EOF) analysis, similar to Principal Component Analysis (PCA), to extract anomalies from multi-dimensional variables by taking into account regional correlation and variability patterns (Preisendorfer and Mobley, 1988). In this case, we applied the EOF analysis to the current velocity vectors, including direction and speed. EOFs were applied for the North Sea and Skagerrak-Kattegat combined and separately. The first three EOFs, explaining ~68% of the variability, were included in further analysis (Figure S3).
Data Analyses
All statistical analyses and plotting were conducted in the R software (version 4.0.4; R Core Team, 2020). The significance level p<0.05 was adopted for the whole of this study. We used all stations for the length distribution analysis to demonstrate that mainly 0-group sprat and herring were caught with the beach seine. In the 1960s there have been some changes in sampling stations (Barceló et al., 2016), therefore we used only stations that were sampled in more than 95% of the years after 1965 for further analyses (Figure S1). However, the full time series from 1919-2018 was considered for these stations where possible, no data was dismissed.
The count data (numbers of individuals caught) in these stations were used to estimate an annual abundance index (AAI) for herring and sprat for each year of the time series using the natural logarithm:
We compared the variances of sprat and herring AAI with an F-test using a random walk to investigate which time series was more stable. For the F-test, we tested the against . We conducted a similar comparison of variance of AAIs sample before and after 1965 which we used for the selection of stations. We tested the against for both species, sprat and herring, separately. Correlations between the AAIs and ICES survey indices and stock estimates (Tables S3, S4), plankton and physical parameters (Tables S5−S8) were individually calculated using the cor() function in R estimated to explore the relationship with abundance variability. Annual, quarterly, and monthly mean values for the plankton and physical parameters were calculated and their correlation tested against AAIs of sprat and herring. We also calculated the correlations both for the North Sea and Skagerrak-Kattegat combined, as well as separately. The correlations were estimated for the entire time series or for the longest possible time series based on the available data. Variables with the highest correlations were considered in a following modelling approach.
We followed the protocol of Zuur et al. (2010) for data exploration before applying models. We constructed two models to explain the abundance of 0-group sprat and herring. First, we fitted Bayesian hierarchical temporal models, using the Integrated Nested Laplace Approximation (INLA) methodology (Rue et al., 2009). This approach allows for the existence of temporal autocorrelation between years (t). The chosen general structure for the model selection included a random walk:
where μt represents a temporal trend and εt and vt independent, identical, normal distributed (N) noise and a variance of σ2 For the annual Covariatest we used the following fixed effects structure for sprat:
and for herring:
where ICES, ICESNSAS, ICESWBSS represent the stock/survey index for sprat, NSAS and WBSS herring, respectively, Plankton the plankton data, AMO the Atlantic multi-decadal oscillation data, Temperature the daily temperature data in Flødevigen, and Drift the first three axis of the EOF analysis. For each of the main variables, we selected only the most significant physical variable (i.e. annual, quarterly or monthly mean for Plankton AMO Temperature and Drift), and one ICES index per stock (i.e. stock estimate or survey index by age). The selection of variables was built on 1. significant correlations, 2. correlation coefficient, and 3. biological and ecological meaning (i.e. if everal drift variables were significant, we chose the one closest to the spawning time). Further, variables with missing data were not considered for the modelling approach even though they correlated with the AAIs. The Drift component was related to ocean circulation and, therefore, a full interaction between the first three EOFs was used. We also tested whether using generalized additive models (GAM) improved the model fit, but this was not the case. This was also supported by the validation of the final selected models showing no trends in the residuals. The temporal ranges for the models were limited to the minimum temporal availability of covariates (Tables S3, S4). Consequently, only data from 1982-2012 (restricted by IBTS Q1 – 1982 and EOFs – 2012) were used for sprat and 1991-2012 (restricted by IBTS Q3 – 1991 and EOFs – 2012) for herring. We used the “R-INLA” package (Rue et al., 2009) for model fitting. For model selection, the Deviance Information Criterion (DIC, Spiegelhalter et al., 2002) was used as a metric of goodness of fit. In cases where the DIC difference was less than 5 the simplest model was chosen.
Results
Annual Abundance Index (AAI)
Overall, the AAI of sprat (mean AAI = 0.51) was higher compared to herring (0.28; t-test, p<0.001). AAIs varied inter-annually for sprat and herring (Figure 3). The time series of herring AAI was more stable (lower variance) than for sprat (F-test, ratio of variance = 0.44, p<0.001). However, for both species, the AAIs showed a decreasing trend for at least the last 20 years. The AAIs of sprat and herring were highly positively correlated (r = 0.69, p<0.001, Figure 4). In general, the AAIs showed more variability after 1965 for sprat (F-test, ratio of variance = 0.35, p<0.001) and herring (F-test, ratio of variance = 0.45, p<0.01).
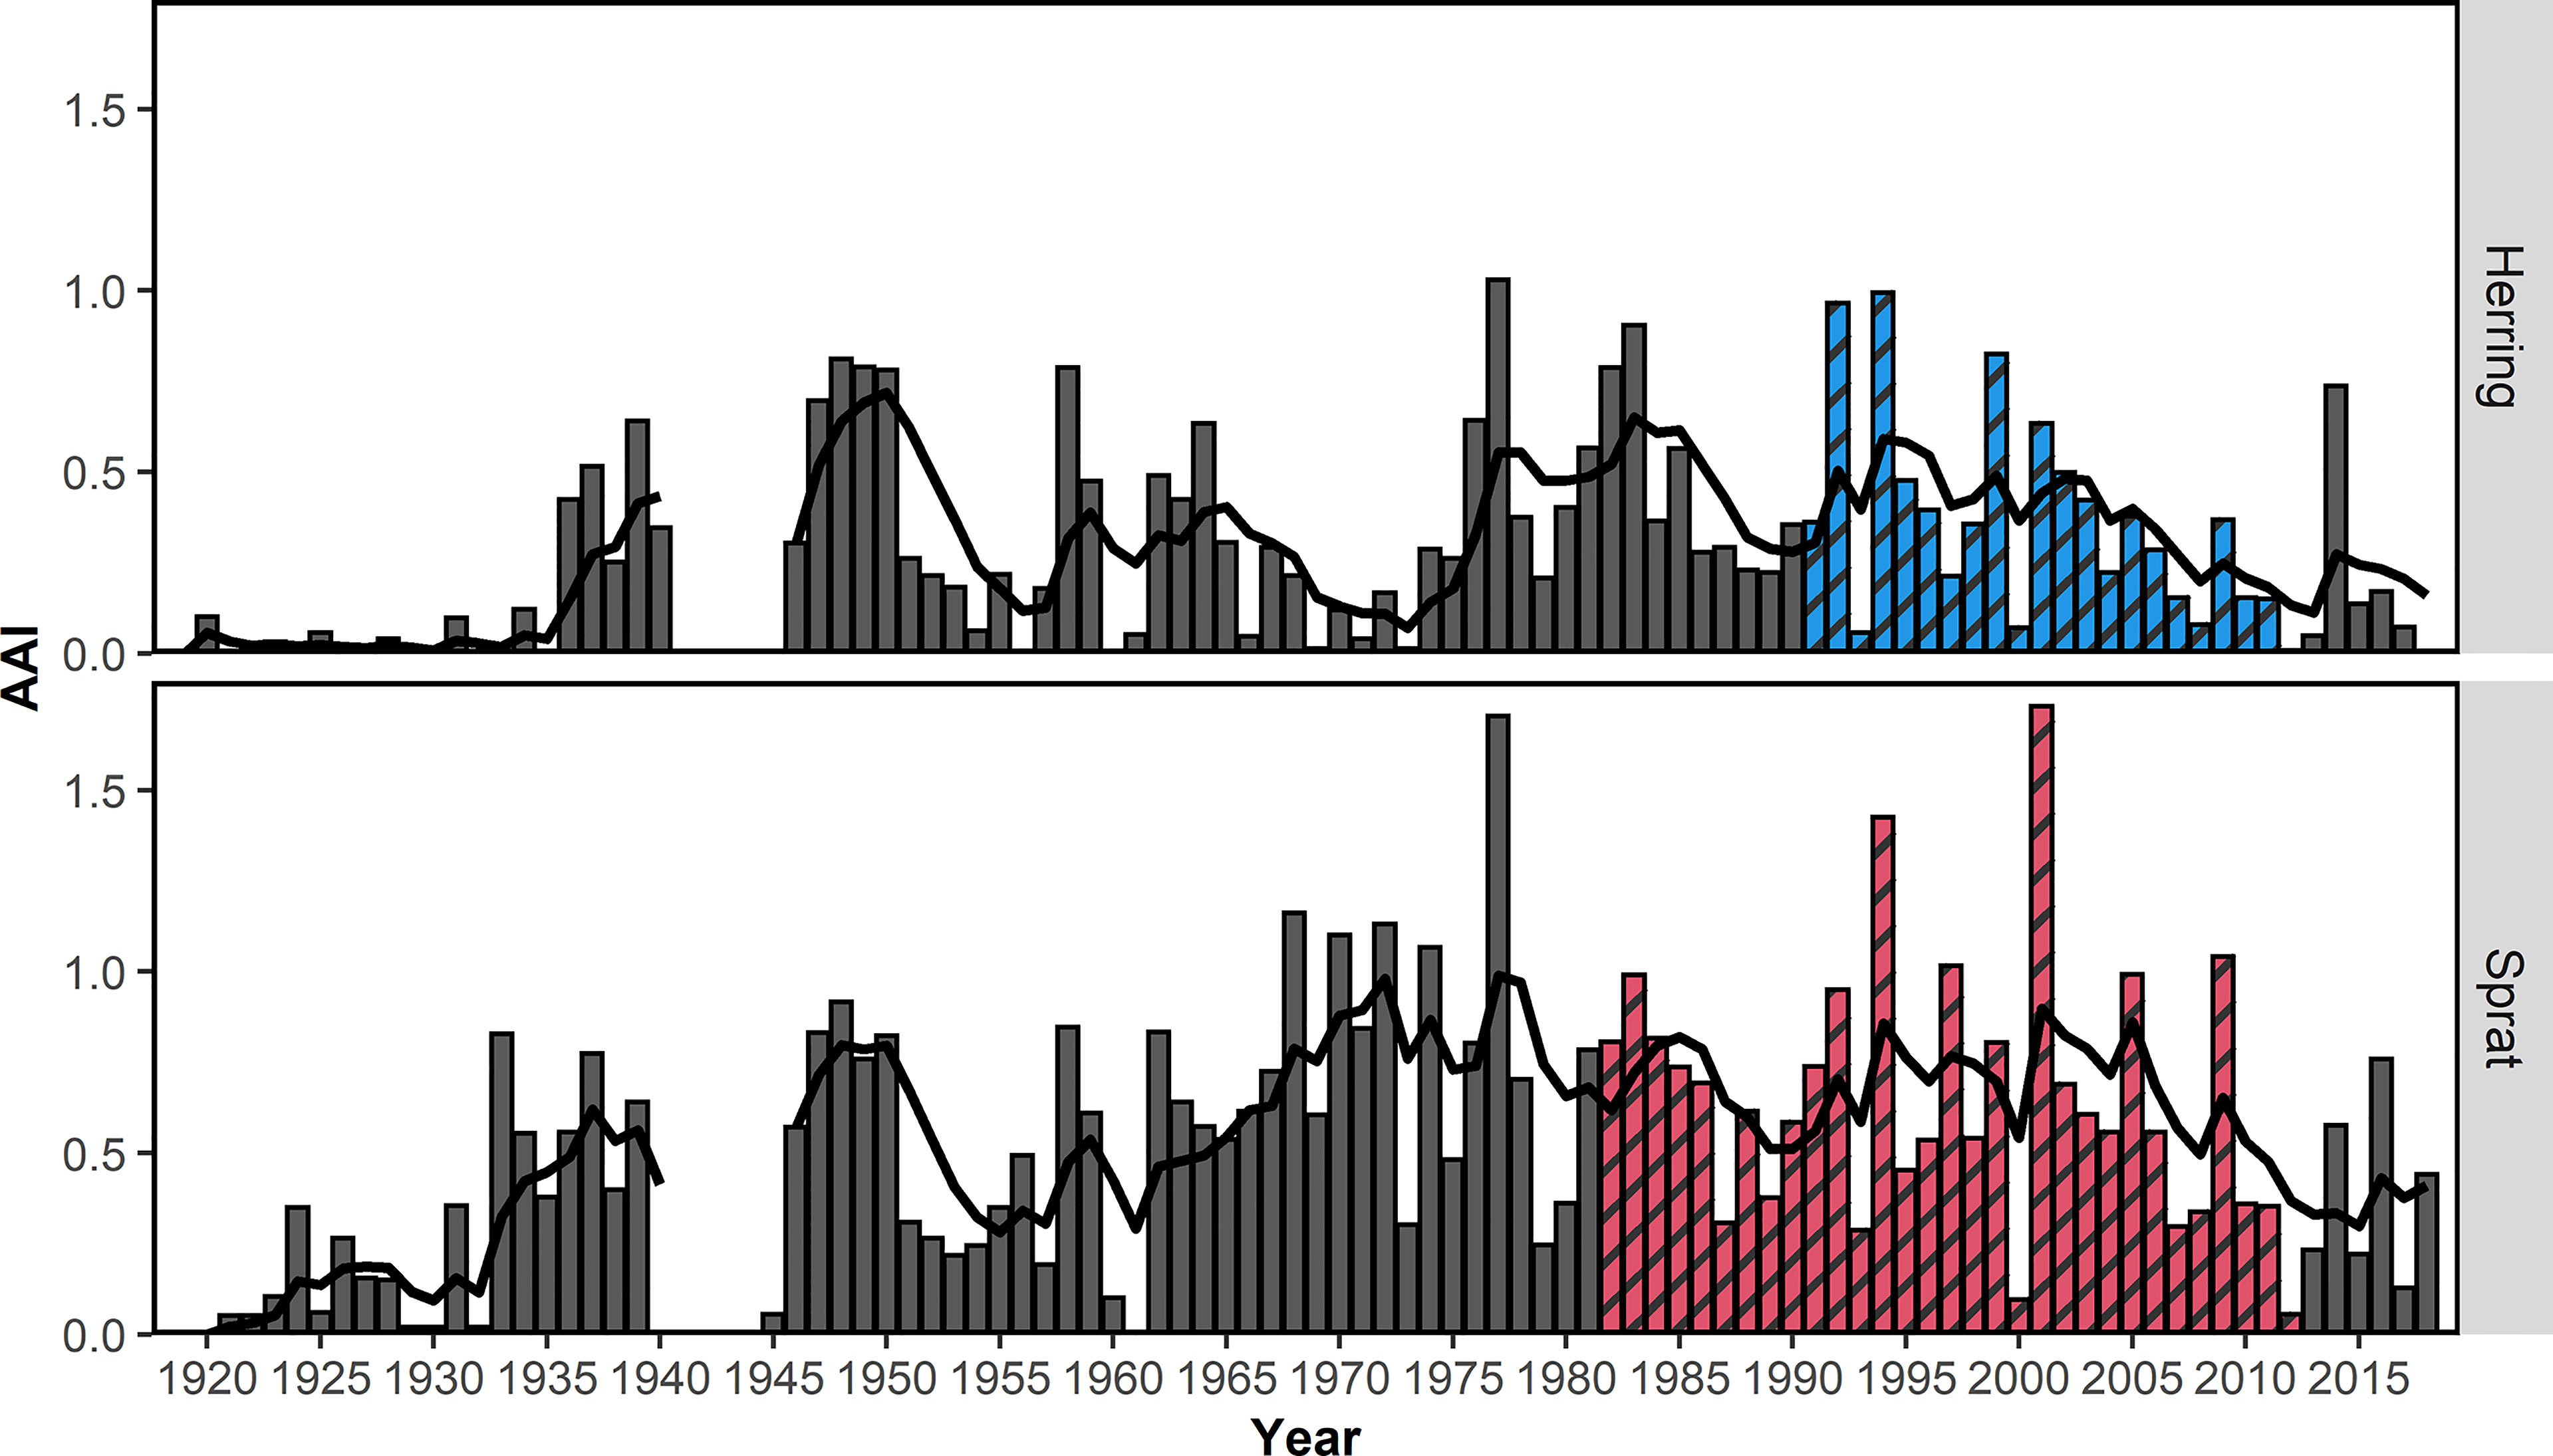
Figure 3 Mean annual abundance index (AAI) of 0-group herring and sprat from the beach seine survey 1919-2018 along the Norwegian Skagerrak coast. Colored and shaded bars (blue for herring, red for sprat) indicate the years which were included in the final model. The black line shows the 5-year-running AAI average. The running average was weighted = (0.8 ^ n) where n represents the difference from the estimated year. No samples were collected during the 2nd World War and no running average was estimated.
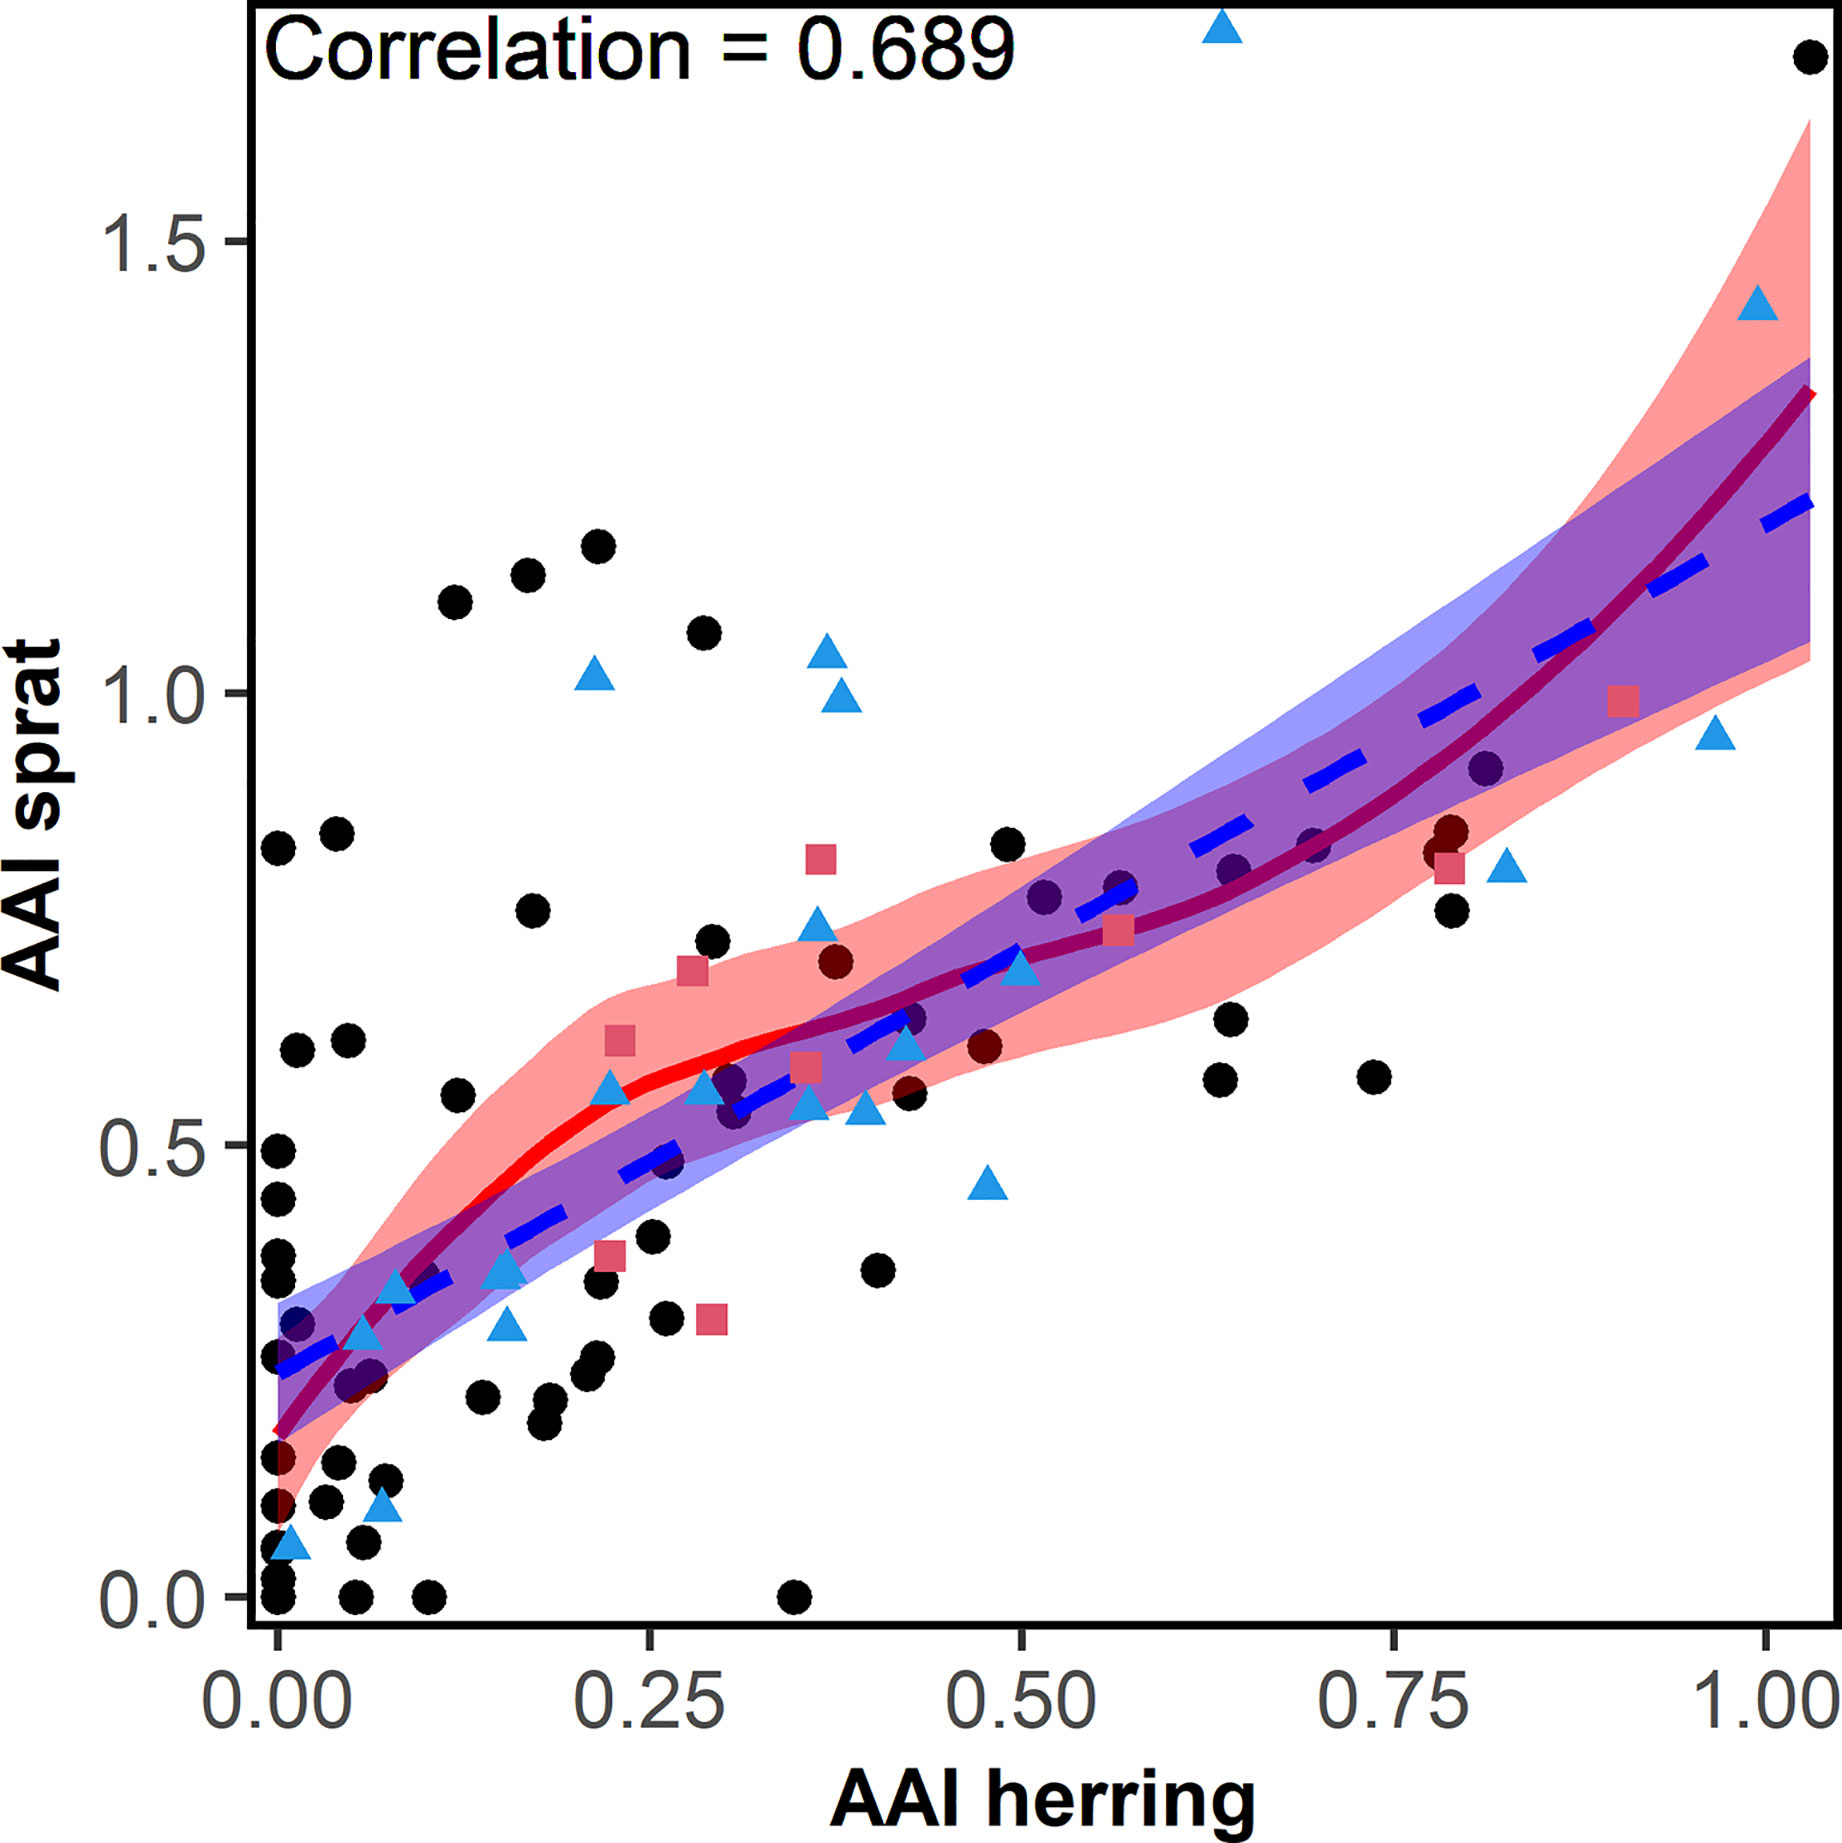
Figure 4 Correlation (including the correlation factor) between the herring and sprat annual abundance index (AAI) collected from 1919-2018 during the annual beach seine survey along the Norwegian Skagerrak coast. Red points (squares) were used for the sprat model, blue points (triangles) were used for both, sprat and herring, models. The fitted linear (dashed-blue) and locally weighted smoothing (loess) line (solid-red) and their 95% confidence intervals are shown.
Effects of Biotic, Environmental, and Physical Factors
No correlations between AAI of sprat and any ICES indices were significant (Table S3). The correlation analyses between AAI of sprat and other factors demonstrated that very few factors were significant (13 of 459 comparisons, Tables S5, S6), and most of them between the AAI of sprat and the temperature at 75 m depth in Flødevigen. For the Bayesian model approach, the important variables do not reflect the results of the correlation analyses (Table 1). The final model for sprat explaining most of the variation of the AAI included the AAI of herring (positive), AMO index (positive), temperature (negative) and the interaction between the first and second EOF (negative, Figure 5; Table 1 for EOFs). The AAI of sprat was not temporally autocorrelated for the sampling period included in the model.
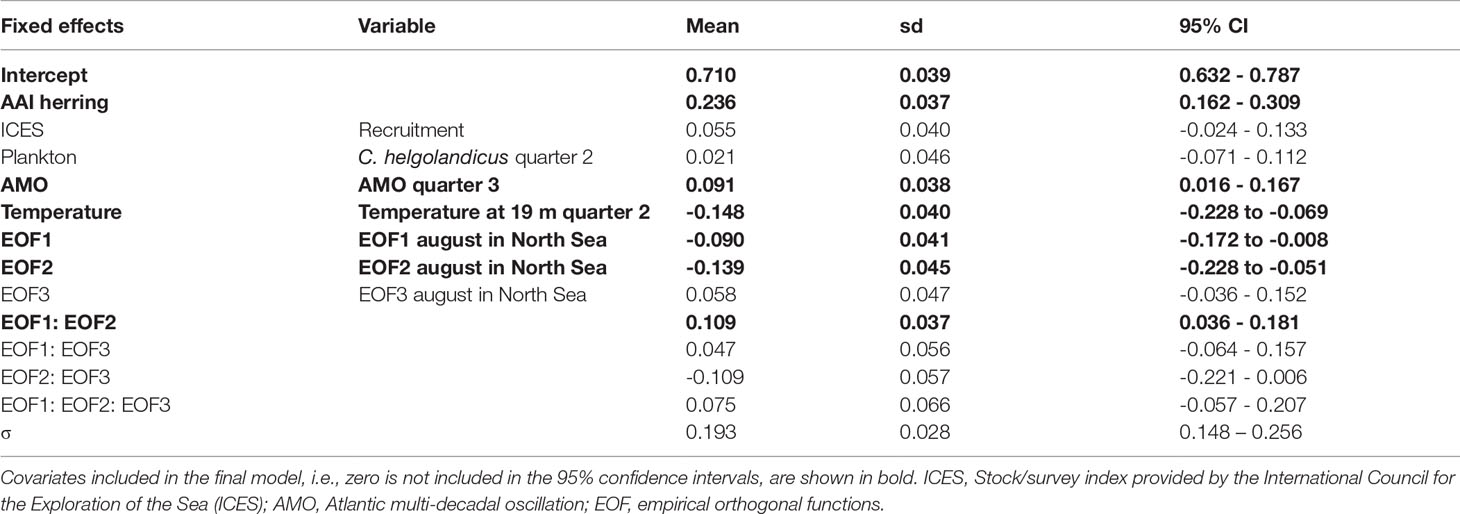
Table 1 Annual abundance index (AAI) of sprat final model for the period 1982-2012: parameter estimates (mean, standard deviation (sd) and 95% confidence interval (CI) for fixed effects and selected variables, and the precision parameter (σ) of the Gaussian distribution.
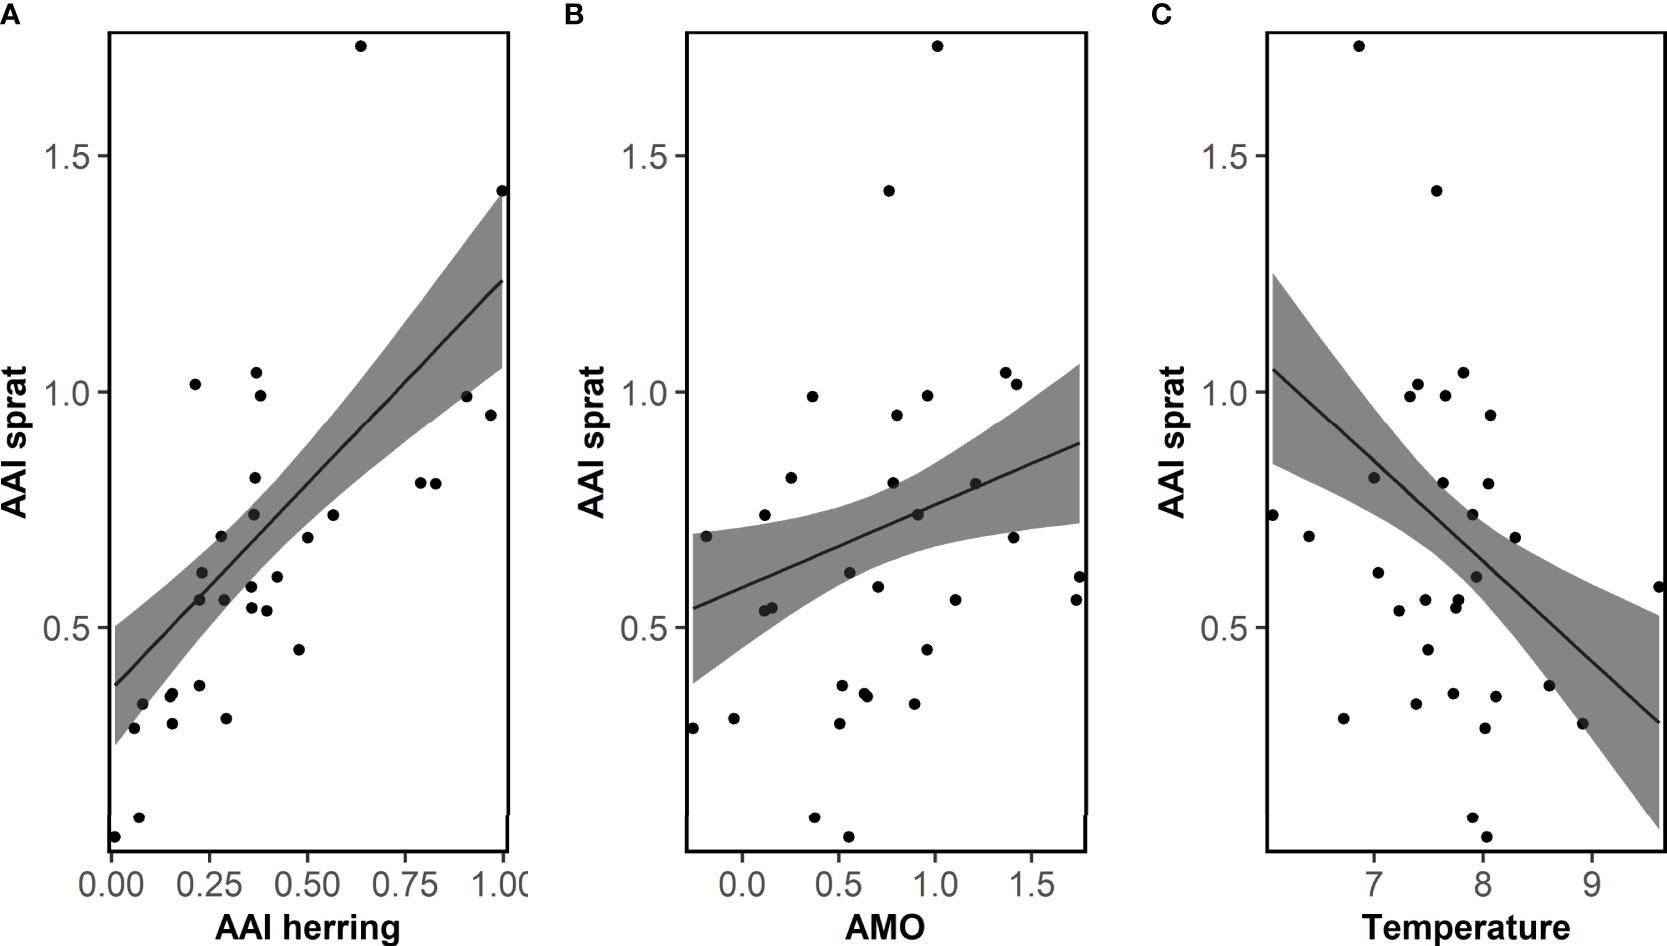
Figure 5 Sprat. Fit of the final model explaining the mean annual abundance index (AAI) of 0-group sprat for the period 1982-2012 by AAI of herring, the Atlantic multi-decadal oscillation (AMO) and temperature. Posterior means and 95% confidence intervals for each variable of importance are shown. See Table 1 for model details.
The AAI of herring was mainly significantly correlated with ICES indices for WBSS (7 out of 8), and only the recruitment index for NSAS (Table S4). Also, environmental and physical factors were more often significantly correlated with herring AAI (30 of 459 comparisons, Tables S7, S8) than sprat. Like sprat, the temperature at 75 m depth in Flødevigen was the factor mostly correlated with herring AAI. Further, several plankton variables were significantly correlated with the AAI of herring. However, neither plankton nor physical factors were of importance for the final model for herring AAI (Table 2): only the abundance of sprat and the WBSS recruitment had a positive effect on the herring AAI (Figure 6). The AAI of herring was not temporally autocorrelated for the sampling period included in the model.
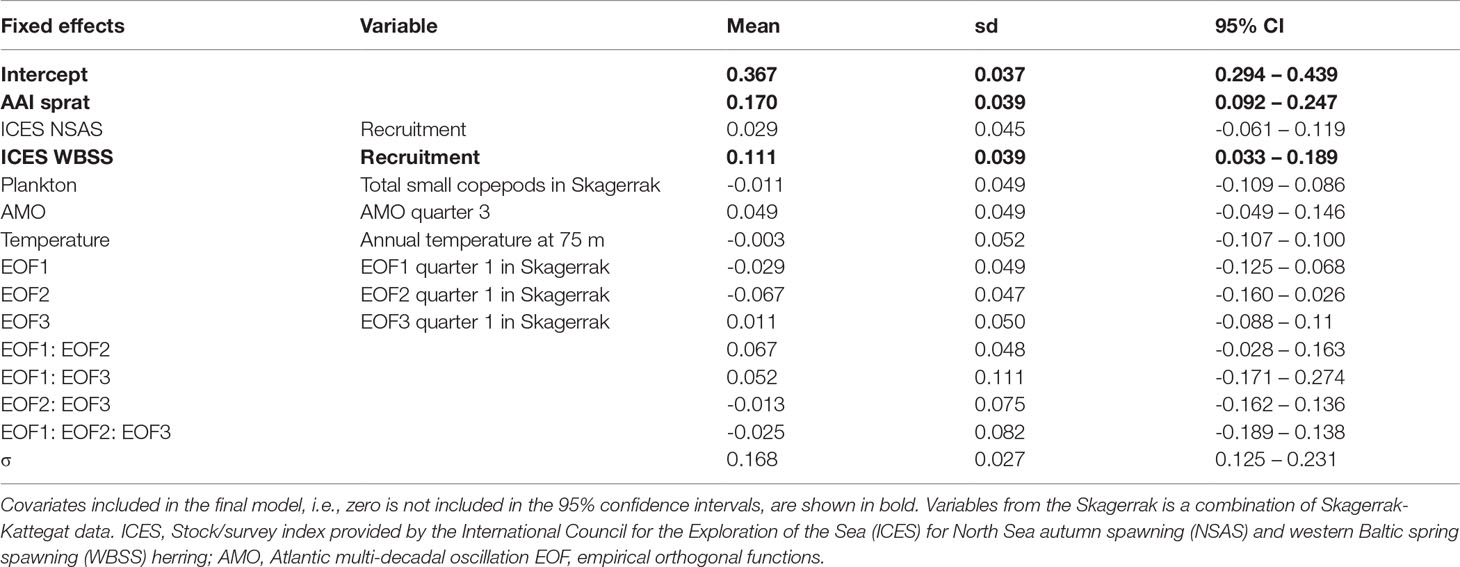
Table 2 Annual abundance index (AAI) of herring final model for the period 1991-2012: parameter estimates (mean, standard deviation (sd) and 95% confidence interval (CI)) for fixed effects and selected variables, and the precision parameter (σ) of the Gaussian distribution.
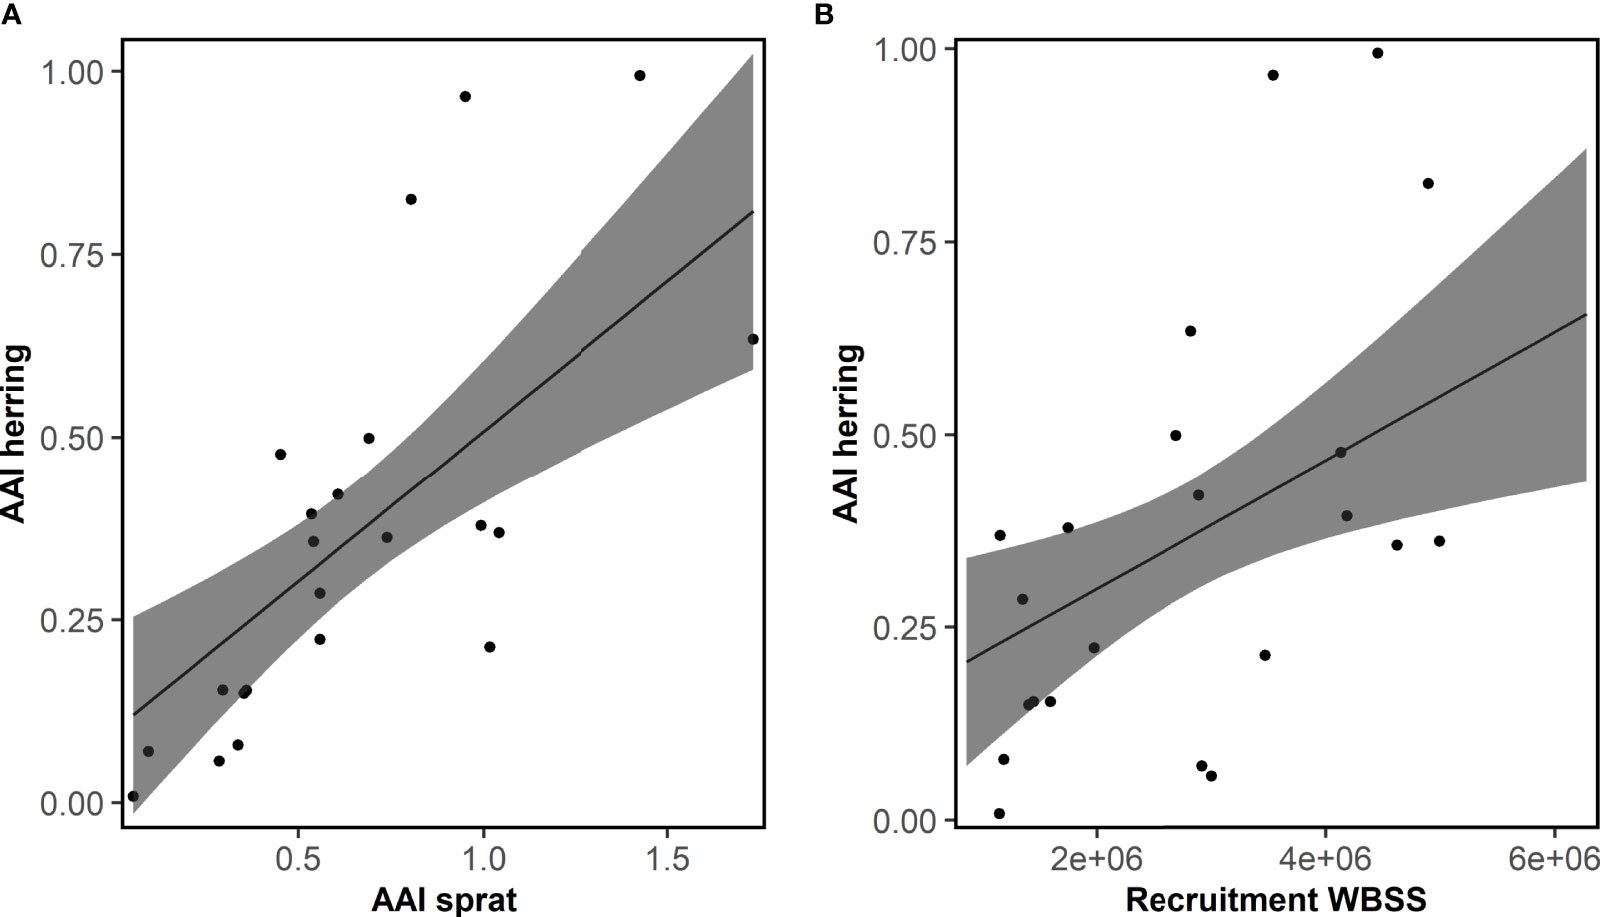
Figure 6 Herring. Fit of the final model explaining the mean annual abundance index (AAI) of 0-group herring for the period 1991-2012 by AAI of sprat and recruitment of western Baltic spring spawning herring (WBSS). Posterior means and 95% confidence intervals for each variable of importance are shown. See Table 2 for model details.
Discussion
Abundance data from the annual beach seine survey along the Norwegian Skagerrak coast provide new insight into the coastal dynamics of herring and sprat. 0-group data on abundance for both species are relatively variable and show high fluctuations between years. Our study indicates a clear synergy between the 0-group dynamics of these two pelagic species. Further, sprat dynamics appear to be solely influenced by environmental factors, whereas the dynamics of herring appear to be mainly affected by the dynamics of neighboring herring populations. Therefore, sprat along the Norwegian Skagerrak coast represent an independent local population being in line with recent genetic and otolith shape analyses (Quintela et al., 2020; Saltalamacchia et al., 2022). On the other hand, herring abundance significantly correlated with dynamics of the major stock occurring in this region, namely the western Baltic spring-spawning herring (WBSS), with recruitment of North Sea autumn-spawning herring (NSAS), and with temperature. However, only the stock dynamics of WBSS are important in the modelling approach which can be a consequence of collinearity between predictor variables, e.g., the decline of WBSS and increasing temperature over the last decade. In general, a reduction in biodiversity has previously been reported for this area (Lekve et al., 1999), but recently the species richness of pelagic fish has increased which is tightly linked to warming temperatures (Barceló et al., 2016). Thus, suggesting a shift in the small pelagic fish community in this region if temperatures continue increasing.
Dynamics of small pelagic fish, such as sprat and herring, are highly dependent on bottom-up processes like abiotic (e.g., temperature) or biotic (e.g., prey quantity and quality) factors or physical processes (e.g., advection or turbulence; Peck et al., 2021). This is clearly the case for sprat along the Norwegian Skagerrak coast where the abundance dynamics were influence by several of these bottom-up processes, mainly temperature and EOFs which reflects the general drift patterns in this region. According to Mathis et al. (2015), negative EOFs correspond to less drift in the region which could explain the negative effect of EOFs on the abundance of sprat could leading to higher larval retention of sprat on their nursery grounds and consequently higher abundance. Furthermore, the population dynamics of sprat have previously been associated with AMO variability in the North Sea and Baltic Sea (Alheit et al., 2005; Alheit et al., 2014) supporting our results for Norwegian coastal sprat.
A common factor negatively affecting the dynamics of sprat and herring was temperature. Even though temperature was not important for the herring models, it was still highly negatively correlated with abundance. This is in line with Polte et al. (2021) demonstrating that warm winters lead to reduced reproductive success in western Baltic herring based on reduced survival rates due to a mismatch between herring larvae and prey availability. Temperature is also the most important bottom-up factor negatively influencing the recruitment of sprat and herring in this region (Margonski et al., 2010; Voss et al., 2012; Corten, 2013). Especially during the larval stage, both species have clearly defined optimal thermal windows for survival (Peck et al., 2012a; Peck et al., 2012b; Dodson et al., 2019). Temperature has similar consequences for the survival and recruitment of sprat and herring which could be a reason that the AAIs of both species were highly correlated and important in the modelling approach since the abundance of 0-group herring and sprat is often used in assessments as an indication of recruitment. Further, the increasing temperature due to climate change might be the underlying cause for the decline in AAI for both sprat and herring in recent years. Besides the environmental effects, it is surprising that there seems to be no connectivity for sprat, having free-drifting pelagic eggs and larvae, with populations in the central part of the Skagerrak-Kattegat or the North Sea. Whilst, there are in theory no physical or biological barriers that would prevent dispersal of egg and larvae from the North Sea into Skagerrak-Kattegat and further to the coast (Knutsen et al., 2004; Stenseth et al., 2006), the occurrence of seasonal fronts (Munk, 2014) may provide barriers to the free movement of eggs and larvae around this frontal area. For other species, like Atlantic cod (Gadus morhua), North Sea ecotypes occur along the Norwegian Skagerrak coast and differ genetically and phenotypically from the fjord ecotypes (Knutsen et al., 2018). However, the concept that sprat occurring along the Norwegian Skagerrak coast are not linked with sprat in neighboring stocks, as indicated in the present study is in line with findings of Torstensen and Gjøsæter (1995) more than 25 years ago. This demonstrates the stability within this ecosystem as an important nursery habitat for small pelagic fish and strengthens the notion of the existence of a local sprat population along the Norwegian coast.
On the other hand, the AAI of herring along the Norwegian Skagerrak coast was clearly linked to the stock dynamics of WBSS. The strong reduction in abundance is in line with very low recruitment in recent years (ICES, 2020). In the present study, we cannot conclude whether there are separate spawning grounds along the Norwegian coast that have similar dynamics to those of WBSS or is utilized as a WBSS nursery ground thus reflecting the recruitment dynamics of this stock. This needs to be further investigated with for example the use of otolith microchemistry to link herring back to their nursery areas (Moll et al., 2019). Otolith microchemistry of 0-group herring collected during the beach seine survey could be used as a baseline and compared with the otolith microchemistry results of adult herring on typical WBSS spawning grounds. This could demonstrate if 0-group herring occurring along the Skagerrak coast are “true” WBSS herring. However, the recent climate changes with rising temperatures are decreasing the productivity of herring in this region (Moyano et al., 2020; Polte et al., 2021) as also indicated be the clear decrease of AAI in recent years.
In general, a beach seine is not the optimal gear to catch highly migratory shoaling fish species, consequently our results must be interpreted with caution. 0-group sprat and herring at that time of a year with an average size of 7.04 and 9.05 cm, respectively, are active swimmers, fully metamorphosed, and could easily avoid the beach seine (Moyano et al., 2016 and references therein). In addition, Torstensen and Gjøsæter (1995) also reported the escape of small individuals through the meshes. However, the survey design with its fixed but randomly distributed stations for more than 100 years using a standardized gear allows for a high number of samples (11,470 hauls) to obtain a reliable annual abundance index (AAI). Furthermore, the length distribution of herring (range 2.5-22.0 cm) indicates that older sprat could have been caught if they were present in the areas covered by this survey. Therefore, the length distributions represent the “true” presence of fish, clearly indicating that both species, herring and sprat, caught during this survey are primarily 0-group fish. This is in line with anecdotal information from fishermen claiming that especially young sprat remains closer to the coastline than older sprat. Even though, only a subset of the time series was used (because of missing data), the respective time series consist of more than 30 and 20 years for sprat and herring, respectively. This subset of data still represents the dynamics of sprat and herring along the Norwegian Skagerrak coast. Furthermore, the change in variability of AAIs after 1965 is most likely caused by changes in the spatial coverage due to increasing number of stations and by the change in how abundance is recorded. In the earliest years, abundance was recorded as an index (see Table S2), whereas this changed in the 1960s when abundance of individuals was reported as number of individuals counted. Thus, the change in variability of AAIs is most likely not ecologically driven. All in all, the estimates AAIs using 0-group fish could represent valid estimates for recruitment as most mortality happens in early life stages (Oeberst et al., 2009; Moyano et al., 2020).
In conclusion, the AAI provided by the beach seine survey along the Norwegian Skagerrak coast, whilst probably reflecting the dynamics of inshore sprat abundance, should not be used as an indication of young sprat abundance in either the North Sea or the Skagerrak-Kattegat management ecoregion. It does, however, support the current practice by ICES of not including near-shore sprat in the North Sea-Skagerrak-Kattegat stock assessments. In contrast, the AAI for herring is clearly linked to the stock dynamics of WBSS, but not to NSAS, and could thus potentially contribute to the assessment of WBSS.
Data Availability Statement
The raw data supporting the conclusions of this article are open-accessible: Berg, F., Kvamme, C., Nash, RDM. (2022) Abundance data of 0-group herring and sprat along the Norwegian Skagerrak coastline provided by a beach seine survey https://doi.org/10.21335/NMDC-651772863.
Ethics Statement
Ethical review and approval were not required for the animal study because The Institute of Marine Research (IMR), which is responsible for monitoring herring and sprat and giving advice to fisheries managers in Norway, has permission to sample herring and sprat at any location along the Norwegian coast by the Directorate of Fisheries, Bergen, Norway.
Author Contributions
FB conceived and designed the study with contributions from CK and RN. FB performed the statistical analysis and visualization of results. FB wrote the first draft of the manuscript. All authors contributed to manuscript revision, read and approved the submitted version.
Funding
The study was partly funded by the Research Council Norway project 299554 (Coast-Risk). FB was partly funded by the Research Council Norway project 254774 (GENSINC). Furthermore, the study was partly founded by the Norwegian Ministry of Trade, Industry and Fisheries.
Conflict of Interest
The authors declare that the research was conducted in the absence of any commercial or financial relationships that could be construed as a potential conflict of interest.
Publisher’s Note
All claims expressed in this article are solely those of the authors and do not necessarily represent those of their affiliated organizations, or those of the publisher, the editors and the reviewers. Any product that may be evaluated in this article, or claim that may be made by its manufacturer, is not guaranteed or endorsed by the publisher.
Acknowledgments
We would like to thank all people being involved in and contributing to the beach seine survey in the last 100 years in all imaginable ways. We acknowledge Moritz Mathis (Helmholtz-Zentrum Hereon, Institute for Coastal Systems, Geesthacht, Germany) who has conducted the MPIOM simulations used in this study.
Supplementary Material
The Supplementary Material for this article can be found online at: https://www.frontiersin.org/articles/10.3389/fmars.2022.831500/full#supplementary-material
References
Albretsen J., Aure J., Sætre R., Danielssen D. S. (2012). Climatic Variability in the Skagerrak and Coastal Waters of Norway. ICES J. Mar. Sci. 69 (5), 758–763. doi: 10.1093/icesjms/fsr187
Alheit J. (1988). Reproductive Biology of Sprat (Sprattus Sprattus): Factors Determining Annual Egg Production. ICES J. Mar. Sci. 44 (2), 162–168. doi: 10.1093/icesjms/44.2.162
Alheit J., Licandro P., Coombs S., Garcia A., Giráldez A., Santamaría M. T. G., et al. (2014). Atlantic Multidecadal Oscillation (AMO) Modulates Dynamics of Small Pelagic Fishes and Ecosystem Regime Shifts in the Eastern North and Central Atlantic. J. Mar. Syst. 131, 21–35. doi: 10.1016/j.jmarsys.2013.11.002
Alheit J., Möllmann C., Dutz J., Kornilovs G., Loewe P., Mohrholz V., et al. (2005). Synchronous Ecological Regime Shifts in the Central Baltic and the North Sea in the Late 1980s. ICES J. Mar. Sci. 62 (7), 1205–1215. doi: 10.1016/j.icesjms.2005.04.024
Barceló C., Ciannelli L., Olsen E. M., Johannessen T., Knutsen H. (2016). Eight Decades of Sampling Reveal a Contemporary Novel Fish Assemblage in Coastal Nursery Habitats. Global Change Biol. 22 (3), 1155–1167. doi: 10.1111/gcb.13047
Bekkevold D., André C., Dahlgren T. G., Clausen L. A. W., Torstensen E., Mosegaard H., et al. (2005). Environmental Correlates of Population Differentiation in Atlantic Herring. Evolution 59 (12), 2656–2668. doi: 10.1111/j.0014-3820.2005.tb00977.x
Blaber S. J. M., Blaber T. G. (1980). Factors Affecting the Distribution of Juvenile Estuarine and Inshore Fish. J. Fish Biol. 17 (2), 143–162. doi: 10.1111/j.1095-8649.1980.tb02749.x
Clausen L. A. W., Stæhr K. J., Rindorf A., Mosegaard H. (2015). Effect of Spatial Differences in Growth on Distribution of Seasonally Co-Occurring Herring Clupea Harengus Stocks. J. Fish Biol. 86 (1), 228–247. doi: 10.1111/jfb.12571
Corten A. (2013). Recruitment Depressions in North Sea Herring. ICES J. Mar. Sci. 70 (1), 1–15. doi: 10.1093/icesjms/fss187
CPR Survey (2018). Operational Oceanographic Products and Services (OOPS) CPR Survey Data Extrac). Mar. Biol. Assoc. doi: 10.17031/w508-x849
Dodson J. J., Daigle G., Hammer C., Polte P., Kotterba P., Winkler G., et al. (2019). Environmental Determinants of Larval Herring (Clupea Harengus) Abundance and Distribution in the Western Baltic Sea. Limnology Oceanography 64 (1), 317–329. doi: 10.1002/lno.11042
Eggers F., Slotte A., Libungan L. A., Johannessen A., Kvamme C., Moland E., et al. (2014). Seasonal Dynamics of Atlantic Herring (Clupea Harengus L.) Populations Spawning in the Vicinity of Marginal Habitats. PLos One 9 (11), e111985. doi: 10.1371/journal.pone.0111985
Engelhard G. H., Peck M. A., Rindorf A., C. Smout S., Van Deurs M., Raab K., et al. (2014). Forage Fish, Their Fisheries, and Their Predators: Who Drives Whom? ICES J. Mar. Sci. 71 (1), 90–104. doi: 10.1093/icesjms/fst087
Eriksen E., Bogstad B., Nakken O. (2011). Ecological Significance of 0-Group Fish in the Barents Sea Ecosystem. Polar Biol. 34 (5), 647–657. doi: 10.1007/s00300-010-0920-y
Falkenhaug T., Dalpadado P. (2014). Diet Composition and Food Selectivity of Sprat (Sprattus Sprattus) in Hardangerfjord, Norway. Mar. Biol. Res. 10 (3), 203–215. doi: 10.1080/17451000.2013.810752
Geffen A. J. (2009). Advances in Herring Biology: From Simple to Complex, Coping With Plasticity and Adaptability. ICES J. Mar. Sci. 66 (8), 1688–1695. doi: 10.1093/icesjms/fsp028
Han F., Jamsandekar M., Pettersson M. E., Su L., Fuentes-Pardo A., Davis B., et al. (2020). Ecological Adaptation in Atlantic Herring is Associated With Large Shifts in Allele Frequencies at Hundreds of Loci. eLife 9, e61076. doi: 10.7554/elife.61076
Hjort J. (1914). Fluctuations in the Great Fisheries of Northern Europe Viewed in the Light of Biological Research. Rapports procès-verbaux Des. réunions / Conseil Permanent Int. pour l’Exploration la Mer 20, 1–228. Available at: http://hdl.handle.net/11250/109177
Holst J. C., Slotte A. (1998). Effects of Juvenile Nursery on Geographic Spawning Distribution in Norwegian Spring-Spawning Herring (Clupea Harengus L.). ICES J. Mar. Sci. 55 (6), 987–996. doi: 10.1006/jmsc.1998.0371
Houde E. D. (2008). Emerging From Hjort’s Shadow. J. Northwest Atlantic Fishery Sci. 41, 53–70. doi: 10.2960/J.v41.m634
ICES (2015). “Manual for International Pelagic Surveys (IPS),” in Series of ICES Survey Protocols SISP 9 – IPS, 92 pp. doi: 10.17895/ices.pub/7582
ICES (2017). “Manual for the International Baltic Acoustic Surveys (IBAS),” in Series of ICES Survey Protocols SISP 8 - IBAS, 47 pp. doi: 10.17895/ices.pub.3368
ICES (2018). Benchmark Workshop on Sprat (WKSPRAT 2018). ICES WKSPRAT Report 2018, 5–9 November 2018 (Copenhagen, Denmark: ICES HQ), 60 pp. ICES C.M. 2018/ACOM:35.
ICES (2020). Herring Assessment Working Group for the Area South of 62° N (HAWG). ICES Sci. Rep. 2 (60), 1–1054. doi: 10.17895/ices.pub.6105
Iles T. D., Sinclair M. (1982). Atlantic Herring: Stock Discreteness and Abundance. Science 215 (4533), 627–633. doi: 10.1126/science.215.4533.627
Illing B., Moyano M., Hufnagl M., Peck M. A. (2016). Projected Habitat Loss for Atlantic Herring in the Baltic Sea. Mar. Environ. Res. 113, 164–173. doi: 10.1016/j.marenvres.2015.12.007
Knutsen H., André C., Jorde P. E., Skogen M. D., Thuróczy E., Stenseth N. C. (2004). Transport of North Sea Cod Larvae Into the Skagerrak Coastal Populations. Proc. R. Soc. London. Ser. B: Biol. Sci. 271 (1546), 1337–1344. doi: 10.1098/rspb.2004.2721
Knutsen H., Jorde P. E., Hutchings J. A., Hemmer-Hansen J., Grønkjaer P., Jørgensen K.-E. M., et al. (2018). Stable Coexistence of Genetically Divergent Atlantic Cod Ecotypes at Multiple Spatial Scales. Evolutionary Appl. 11 (9), 1527–1539. doi: 10.1111/eva.12640
Kristiansen I., Hátún H., Jacobsen J. A., Eliasen S. K., Petursdottir H., Gaard E. (2022). Spatial Variability of the Feeding Conditions for the Norwegian Spring Spawning Herring in May. Front. Mar. Sci. 9. doi: 10.3389/fmars.2022.823006
Lekve K., Stenseth N. C., Gjøsæter J., Fromentin J.-M., Gray J. S. (1999). Spatio-Temporal Patterns in Diversity of a Fish Assemblage Along the Norwegian Skagerrak Coast. Mar. Ecol. Prog. Ser. 178, 17–27. doi: 10.3354/meps178017
Lindquist A. (1961). Swedish Investigations of the Spawning of Sprats in the Boundary Areas Between Skagerrak and Kattegat. 1–3, ICES C.M. 1961/N:20.
Lotze H. K., Lenihan H. S., Bourque B. J., Bradbury R. H., Cooke R. G., Kay M. C., et al. (2006). Depletion, Degradation, and Recovery Potential of Estuaries and Coastal Seas. Science 312 (5781), 1806–1809. doi: 10.1126/science.1128035
Margonski P., Hansson S., Tomczak M. T., Grzebielec R. (2010). Climate Influence on Baltic Cod, Sprat, and Herring Stock–Recruitment Relationships. Prog. Oceanography 87 (1), 277–288. doi: 10.1016/j.pocean.2010.08.003
Mathis M., Elizalde A., Mikolajewicz U., Pohlmann T. (2015). Variability Patterns of the General Circulation and Sea Water Temperature in the North Sea. Prog. Oceanography 135, 91–112. doi: 10.1016/j.pocean.2015.04.009
Moll D., Kotterba P., Jochum K. P., von Nordheim L., Polte P. (2019). Elemental Inventory in Fish Otoliths Reflects Natal Origin of Atlantic Herring (Clupea Harengus) From Baltic Sea Juvenile Areas. Front. Mar. Sci. 6. doi: 10.3389/fmars.2019.00191
Moll D., Kotterba P., Von Nordheim L., Polte P. (2018). Storm-Induced Atlantic Herring (Clupea Harengus) Egg Mortality in Baltic Sea Inshore Spawning Areas. Estuaries Coasts 41 (1), 1–12. doi: 10.1007/s12237-017-0259-5
Moyano M., Illing B., Peschutter P., Huebert K. B., Peck M. A. (2016). Thermal Impacts on the Growth, Development and Ontogeny of Critical Swimming Speed in Atlantic Herring Larvae. Comp. Biochem. Physiol. Part A: Mol. Integr. Physiol. 197, 23–34. doi: 10.1016/j.cbpa.2016.02.020
Moyano M., Illing B., Polte P., Kotterba P., Zablotski Y., Gröhsler T., et al. (2020). Linking Individual Physiological Indicators to the Productivity of Fish Populations: A Case Study of Atlantic Herring. Ecol. Indic. 113, 106146. doi: 10.1016/j.ecolind.2020.106146
Munk P. (2014). Fish Larvae at Fronts: Horizontal and Vertical Distributions of Gadoid Fish Larvae Across a Frontal Zone at the Norwegian Trench. Deep Sea Res. Part II: Topical Stud. Oceanography 107, 3–14. doi: 10.1016/j.dsr2.2014.01.016
Munk P., Cardinale M., Casini M., Rudolphi A.-C. (2014). The Community Structure of Over-Wintering Larval and Small Juvenile Fish in a Large Estuary. Estuarine Coast. Shelf Sci. 139, 27–39. doi: 10.1016/j.ecss.2013.12.024
Oeberst R., Klenz B., Gröhsler T., Dickey-Collas M., Nash R. D. M., Zimmermann C. (2009). When is Year-Class Strength Determined in Western Baltic Herring? ICES J. Mar. Sci. 66 (8), 1667–1672. doi: 10.1093/icesjms/fsp143
Orth R. J., Heck K. L., Van Montfrans J. (1984). Faunal Communities in Seagrass Beds: A Review of the Influence of Plant Structure and Prey Characteristics on Predator-Prey Relationships. Estuaries 7 (4), 339. doi: 10.2307/1351618
Peck M. A., Alheit J., Bertrand A., Catalán I. A., Garrido S., Moyano M., et al. (2021). Small Pelagic Fish in the New Millennium: A Bottom-Up View of Global Research Effort. Prog. Oceanography 191, 102494. doi: 10.1016/j.pocean.2020.102494
Peck M. A., Baumann H., Bernreuther M., Clemmesen C., Herrmann J.-P., Haslob H., et al. (2012a). The Ecophysiology of Sprattus Sprattus in the Baltic and North Seas. Prog. Oceanography 103, 42–57. doi: 10.1016/j.pocean.2012.04.013
Peck M. A., Kanstinger P., Holste L., Martin M. (2012b). Thermal Windows Supporting Survival of the Earliest Life Stages of Baltic Herring (Clupea Harengus). ICES J. Mar. Sci. 69 (4), 529–536. doi: 10.1093/icesjms/fss038
Pettersson M. E., Rochus C. M., Han F., Chen J., Hill J., Wallerman O., et al. (2019). A Chromosome-Level Assembly of the Atlantic Herring Genome—Detection of a Supergene and Other Signals of Selection. Genome Res. 29, 1919–1928. doi: 10.1101/gr.253435.119
Polte P., Gröhsler T., Kotterba P., Von Nordheim L., Moll D., Santos J., et al. (2021). Reduced Reproductive Success of Western Baltic Herring (Clupea Harengus) as a Response to Warming Winters. Front. Mar. Sci. 8. doi: 10.3389/fmars.2021.589242
Preisendorfer R. W., Mobley C. D. (1988). Principal Component Analysis in Meteorology and Oceanography (Elsevier: Amsterdam).
Quintela M., Kvamme C., Bekkevold D., Nash R. D. M., Jansson E., Sørvik A. G., et al. (2020). Genetic Analysis Redraws the Management Boundaries for the European Sprat. Evolutionary Appl. 13 (8), 1906–1922. doi: 10.1111/eva.12942
Quintela M., Richter-Boix À., Bekkevold D., Kvamme C., Berg F., Jansson E., et al. (2021). Genetic Response to Human-Induced Habitat Changes in the Marine Environment: A Century of Evolution of European Sprat in Landvikvannet, Norway. Ecol. Evol. 11 (4), 1691–1718. doi: 10.1002/ece3.7160
R Core Team (2020). R: A Language and Environment for Statistical Computing (Version 4.0.4) (Vienna, Austria: R Foundation for Statistical Computing). Available at: http://www.R-project.org.
Richardson A. J., Walne A. W., John A. W. G., Jonas T. D., Lindley J. A., Sims D. W., et al. (2006). Using Continuous Plankton Recorder Data. Prog. Oceanography 68 (1), 27–74. doi: 10.1016/j.pocean.2005.09.011
Rue H., Martino S., Chopin N. (2009). Approximate Bayesian Inference for Latent Gaussian Models by Using Integrated Nested Laplace Approximations. J. R. Stat. Society: Ser. B (Statistical Methodology) 71 (2), 319–392. doi: 10.1111/j.1467-9868.2008.00700.x
Sætre R. (2007). The Norwegian Coastal Current - Oceanography and Climate (Trondheim: Tapir Academic Press).
Saltalamacchia F., Berg F., Casini M., Davies J. C., Bartolino V. (2022). Population Structure of European Sprat (Sprattus Sprattus) in the Greater North Sea Ecoregion Revealed by Otolith Shape Analysis. Fisheries Res. 245, 106131. doi: 10.1016/j.fishres.2021.106131
Skagseth Ø., Slotte A., Stenevik E. K., Nash R. D. M. (2015). Characteristics of the Norwegian Coastal Current During Years With High Recruitment of Norwegian Spring Spawning Herring (Clupea Harengus L.). PLos One 10 (12), e0144117. doi: 10.1371/journal.pone.0144117
Spiegelhalter D. J., Best N. G., Carlin B. P., van der Linde A. (2002). Bayesian Measures of Model Complexity and Fit. J. R. Stat. Society: Ser. B (Statistical Methodology) 64 (4), 583–639. doi: 10.1111/1467-9868.00353
Stenseth N. C., Jorde P. E., Chan K.-S., Hansen E., Knutsen H., André C., et al. (2006). Ecological and Genetic Impact of Atlantic Cod Larval Drift in the Skagerrak. Proc. R. Soc. B: Biol. Sci. 273 (1590), 1085–1092. doi: 10.1098/rspb.2005.3290
Torstensen E., Gjøsæter J. (1995). Occurrence of 0-Group Sprat (Sprattus Sprattus) in the Littoral Zone Along the Norwegian Skagerrak Coast 1945–1992, Compared With the Occurrence of 0-Group Herring (Clupea Harengus). Fisheries Res. 21 (3), 409–421. doi: 10.1016/0165-7836(94)00297-A
Tveite S. (1971). Fluctuations in Year-Class Strength of Cod and Pollack in Southeastern Norwegian Coastal Waters During 1920-1969. Fiskeridirektoratets Skrifter Serie Havundersøkelser 16 (2), 65–76. Available at: http://hdl.handle.net/11250/114678
Vitale F., Mittermayer F., Krischansson B., Johansson M., Casini M. (2015). Growth and Maturity of Sprat (Sprattus Sprattus) in the Kattegat and Skagerrak, Eastern North Sea. Aquat. Living Resour. 28 (2-4), 127–137. doi: 10.1051/alr/2016007
Voss R., Peck M. A., Hinrichsen H.-H., Clemmesen C., Baumann H., Stepputtis D., et al. (2012). Recruitment Processes in Baltic Sprat – A Re-Evaluation of GLOBEC Germany Hypotheses. Prog. Oceanography 107, 61–79. doi: 10.1016/j.pocean.2012.05.003
Waycott M., Duarte C. M., Carruthers T. J. B., Orth R. J., Dennison W. C., Olyarnik S., et al. (2009). Accelerating Loss of Seagrasses Across the Globe Threatens Coastal Ecosystems. Proc. Natl. Acad. Sci. 106 (30), 12377–12381. doi: 10.1073/pnas.0905620106
Worm B., Barbier E. B., Beaumont N., Duffy J. E., Folke C., Halpern B. S., et al. (2006). Impacts of Biodiversity Loss on Ocean Ecosystem Services. Science 314 (5800), 787–790. doi: 10.1126/science.1132294
Keywords: Skagerrak, herring (Clupea harengus), sprat (Sprattus sprattus), beach seine, time series, recruitment
Citation: Berg F, Kvamme C and Nash RDM (2022) The Dynamics of 0-Group Herring Clupea harengus and Sprat Sprattus sprattus Populations Along the Norwegian Skagerrak Coast. Front. Mar. Sci. 9:831500. doi: 10.3389/fmars.2022.831500
Received: 08 December 2021; Accepted: 09 June 2022;
Published: 18 July 2022.
Edited by:
Priscilla Licandro, Stazione Zoologica Anton Dohrn, ItalyReviewed by:
Mike Jech, Northeast Fisheries Science Center (NOAA), United StatesStefanie Haase, Thünen-Institut, Germany
Silvia Angelini, National Research Council - Institute for Biological Resources and Marine Biotechnology, Italy
Copyright © 2022 Berg, Kvamme and Nash. This is an open-access article distributed under the terms of the Creative Commons Attribution License (CC BY). The use, distribution or reproduction in other forums is permitted, provided the original author(s) and the copyright owner(s) are credited and that the original publication in this journal is cited, in accordance with accepted academic practice. No use, distribution or reproduction is permitted which does not comply with these terms.
*Correspondence: Florian Berg, florian.berg@hi.no
†Present address Richard D. M. Nash, Centre for Environment, Fisheries and Aquaculture Science (CEFAS), Lowestoft, United Kingdom