Exploitation Drives Changes in the Population Connectivity of Queen Conch (Aliger gigas)
 Ana C. Vaz1,2,3*
  Mandy Karnauskas2
  Claire B. Paris3
  Jennifer C. Doerr4
  Ronald L. Hill5
  Calusa Horn6 Margaret H. Miller7
  Melissa Neuman8 Kevin J. McCarthy2 Nicholas A. Farmer5
- 1Cooperative Institute for Marine and Atmospheric Studies, University of Miami, Miami, FL, United States
- 2Southeast Fisheries Science Center, National Oceanic and Atmospheric Administration, National Marine Fisheries Service, Miami, FL, United States
- 3Rosenstiel School of Marine and Atmospheric Science, University of Miami, Miami, FL, United States
- 4Southeast Fisheries Science Center, National Oceanic and Atmospheric Administration, National Marine Fisheries Service, Galveston, TX, United States
- 5Southeast Fisheries Science Center, National Oceanic and Atmospheric Administration, National Marine Fisheries Service, Panama City, FL, United States
- 6Southeast Regional Office, National Oceanic and Atmospheric Administration, National Marine Fisheries Service, St Petersburg, FL, United States
- 7Office of Protected Resources, National Oceanic and Atmospheric Administration, National Marine Fisheries Service, Silver Spring, MD, United States
- 8West Coast Regional Office, National Oceanic and Atmospheric Administration, National Marine Fisheries Service, Long Beach, CA, United States
The queen conch, Aliger gigas, is an endemic and iconic marine gastropod of the Wider Caribbean region that has been harvested for thousands of years. Conch are slow-moving and require contact to mate; overfishing has reduced populations in many areas compromising its rates of reproduction. Long-range dispersal and mixing between distinct populations occur in the queen conch’s early life history stages, when pelagic larvae are transported by oceanic currents. Genetic studies suggest that gene flow between populations decreases as the distance between populations increases. Here, we assessed how the population connectivity of conch changes with spatially variable patterns of fishing exploitation by simulating larval dispersal and comparing the potential connectivity under an unexploited and a contemporary exploited reproductive scenario. Results demonstrate that reduced egg production, due to heterogeneous fishing pressure and localized depletion, significantly alters population connectivity patterns as well as the structuring of populations and metapopulations across the species’ range. This strongly suggests that estimates of contemporary demographic rates, together with estimates of reproductive output need to be included in population connectivity studies. The existence of self-sustained metapopulations of queen conch throughout the Wider Caribbean suggests that replenishment through larval dispersal occurs primarily within sub-regional spatial scales, emphasizing the need for regional and local conservation and management measures to build and protect reproductively active populations and nursery habitat across multiple jurisdictions.
Introduction
The queen conch (Aliger gigas, Maxwell et al., 2020) is an iconic marine gastropod endemic to the Wider Caribbean Region (WCR). The species has been harvested for subsistence, economic, and cultural purposes for thousands of years. The queen conch has been listed in Appendix II of the Convention on International Trade in Endangered Species (CITES) since 1992 due to the significant decline of its populations throughout the Caribbean. Intense fisheries and illegal harvest of queen conch have had a significant impact on population recovery (Stoner and Appeldoorn, 2021). Management of conch fisheries is highly variable across the Caribbean region, including strategies such as marine protected areas, minimum shell lengths and/or lip thicknesses for harvest, fisheries quotas, gear restrictions, and closed seasons (Prada et al., 2017). However, despite these regulations, populations appear to be overfished and in a continuing decline in many Caribbean locations (Stoner and Appeldoorn, 2021).
Adult conch are found over a wide range of habitats, particularly on sand flats and grass beds, but also on rubble and gravel, mostly at depths of 20 meters or shallower (Stoner et al., 1994; McCarthy, 2007; Stoner and Davis, 2010). Queen conch, as all gastropods, are slow-moving organisms (Doerr and Hill, 2013) and require direct physical contact for reproduction (Randall, 1964). Consequently, adult (i.e., mature) density is an important factor governing mating success and reproductive output. The principle of inverse density dependence at low densities is referred to as an Allee effect (Allee, 1931). Recent simulation models (Farmer and Doerr, 2022) indicate that the lack of mating observed at low densities may be attributed to low encounter rates of adults (Stoner and Ray-Culp, 2000) and limited sexual facilitation leading to delayed functional maturity (Gascoigne and Lipcius, 2004). When reproductive fitness declines such that the per capita population growth rate becomes negative, localized extinction may result (Allee, 1931; Courchamp et al., 1999). Long-term observations of depleted populations indicate that even with total fishing moratoria, recovery may take decades or longer (Stoner and Appeldoorn, 2021). Consequently, it is critical for fisheries management to identify how localized depletion patterns, which decrease conch densities and reproductive output, may affect the population throughout its entire distribution.
Unfortunately, inconsistent fishery-independent surveys using different methodologies only provide limited information on current conch densities throughout the WCR (Prada et al., 2017). While there is genetic evidence of stock mixing throughout the Caribbean with some localized population isolation patterns (Pérez-Enriquez et al., 2011; Zamora-Bustillos et al., 2011; Márquez-Pretel et al., 2013; Machkour-M’Rabet et al., 2017; Truelove et al., 2017; Blythe-Mallett et al., 2021), little is known about the ecological connectivity of queen conch throughout its range. The species is largely sessile; thus, most long-distance connections occur during the planktonic early life stages (Davis, 2005; Kough et al., 2019). Indeed, spatial genetic structure has been detected at different spatial scales, both between and within territorial waters of Caribbean jurisdictions, suggesting that queen conch do not form a single panmictic population in the greater Caribbean and that variation in marine currents, surface winds, and meteorological events can either promote larval dispersal or act as barriers enhancing local larval retention (Pérez-Enriquez et al., 2011; Zamora-Bustillos et al., 2011; Márquez-Pretel et al., 2013; Machkour-M’Rabet et al., 2017; Truelove et al., 2017; Kitson-Walters et al., 2018; Blythe-Mallett et al., 2021). While modeling studies of larval dispersal of queen conch corroborate these findings at regional scales (Kough et al., 2019; Souza and Kough, 2020), these studies focused on elucidating connectivity patterns mostly around The Bahamas. Thus, it is still unknown how the interplay of physical processes, biological traits, and localized depletion patterns affect the demographic patterns of queen conch throughout the WCR. Moreover, it is unknown if contemporary adult densities, emerging particularly from localized exploitation patterns, can affect population-wide demographics, as suggested for some populations (Zamora-Bustillos et al., 2011; Márquez-Pretel et al., 2013).
Here we aim to understand how fisheries can alter the population structure and demographics of the queen conch by estimating ecological connectivity under an “unexploited” historical density scenario and an “exploited” contemporary scenario that incorporates realistic localized density patterns. Estimated connectivity patterns are compared among different scenarios of reproductive output to evaluate how localized harvest patterns can affect the population-wide demographics of the species. This is the first effort to identify connectivity patterns of the species throughout the Wider Caribbean Region and incorporate viable reproduction using a comprehensive set of adult densities. The results should inform collaborative management among the various Caribbean states and territories for one of the region’s most economically important species.
Method
Model Configuration
Connectivity Modeling System
To estimate the population connectivity of queen conch, we used the Connectivity Modeling System (CMS), a community multi-scale modeling system, with an Individual-Based Model and stochastic Lagrangian framework (Paris et al., 2013). The CMS simulates complex biophysical dispersive processes during the pelagic early life history of marine organisms, producing estimates of probabilistic connectivity among populations. Our simulations thus captured the queen conch’s early pelagic life-history stages, from hatching to the settlement of competent veligers.
In CMS, embryos and larvae are advected by deterministic velocity fields from hydrodynamic models and by a stochastic component representing unresolved sub-grid scale processes. The velocity field is interpolated for each individual location and time step using a tricubic scheme and integrated to the next time step with a unique spatiotemporal forth-order Runge-Kutta scheme; the stochastic movement is given by a random walk model, scaled by the diffusivity coefficient of the system (Okubo, 1971). CMS also simulates biological traits affecting an organism’s dispersal, such as ontogenetic vertical migration (OVM). Spawning and settlement habitats are represented in the model by 2D discrete polygons. Larvae are advected for the time defined as their maximum pelagic larval duration (PLD), and those older than a defined competency period that are found within polygon boundaries are considered settled and removed from the simulation. The CMS saves individual larval positions and attributes through time, together with files with the spawning and settlement sites and times of successful settlers, allowing for the estimation of dispersal and connectivity patterns.
Ocean Velocity Fields
We used velocity fields from two well-established hydrodynamic products, the hindcast and reanalysis of the Global HYCOM and the Mercator GLORYS12v1 reanalysis (Figure 1, hereafter HYCOM and GLORYS, respectively). By considering different hydrodynamic models, we could capture stochastic changes in flow patterns and explicitly address the uncertainty of connectivity estimates due to the underlying hydrodynamic flow fields. Our model domain extended from 8°N to 37°N and from 98°W to 59°W, and our temporal range was from March to December of 2013 to 2017, capturing both the spatial distribution of the conch and the seasonality of its spawning season. The five-year range is adequate to capture interannual variability in the physical oceanography and stochastic patterns of dispersal.
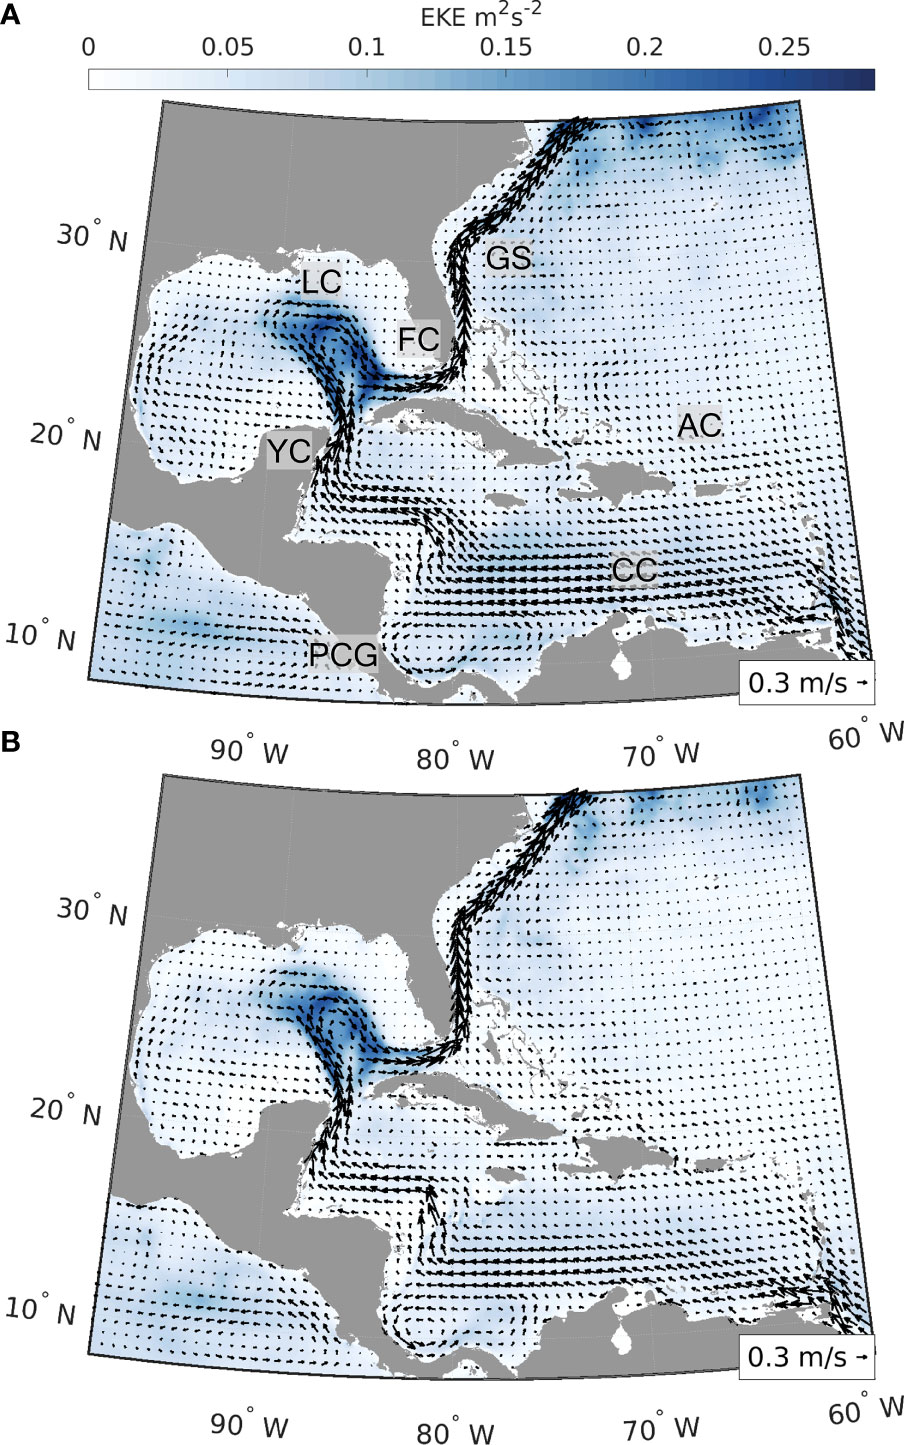
Figure 1 Average surface velocity fields (m s-1) and eddy kinetic energy (EKE, m2 s-2) for HYCOM reanalysis and analysis (A) and GLORYS12v1 reanalysis (B). Figures are based on surface velocity fields from 2013 to 2017 (March to December), the same time period used for the simulations of dispersal. A span of 5 years was chosen to capture the interannual variability in the circulation and derived connectivity patterns. Arrows represent average surface velocity and background color the EKE. Labels in the top panel identify major oceanographic features in the region (CC, Caribbean Current; PCG, Panama-Colombia Gyre; YC, Yucatán Current; LC, Loop Current; FC, Florida Current; GS, Gulf Stream; AC, Antilles Current).
The Global HYCOM + NCODA Global Ocean Forecasting System (GOFS, Chassignet et al., 2007) uses the Navy Coupled Ocean Data Assimilation (NCODA) system (Cummings and Smedstad, 2013) for data assimilation. NCODA assimilates available satellite altimeter and temperature observations, surface and vertical temperature and salinity profiles from XBTs, Argo floats, and buoys. The Global-HYCOM presents 41 vertical layers and a 1/12° (ca. 8 km) horizontal resolution throughout our domain, and we used a 12-hour temporal resolution. HYCOM outputs were obtained from the 3.1 GOFS Reanalysis (expt. 53.X) for the years 2013–2015 and for years that reanalysis was not available, 2016–2017, from the GOFS Analysis (expts. 57.2, 92.8, 57.7, and 92.9).
The Mercator GLORYS version 12v1 is the reanalysis from the Copernicus Marine Environment Monitoring Service (CMEMS), largely based on the CMEMS real-time forecast system (Lellouche et al., 2018; Lellouche et al., 2021). It presents global coverage at 1/12° (ca. 8km) horizontal resolution and 50 vertical levels, and it is available at daily intervals for our study period. The model component is version 3.1 of the NEMO (Nucleus for European Modelling of the Ocean) model, driven at surface by ECMWF ERA-Interim reanalysis. It uses a reduced-order Kalman filter to assimilate sea level anomaly, sea surface temperature, and sea ice concentration from satellite measurements, and in situ temperature and salinity vertical profiles from the CORA (Coriolis Ocean Database ReAnalysis, Lellouche et al., 2018). It also corrects large-scale bias in temperature and salinity.
Habitat
The majority of queen conch spawning habitat occurs in waters less than 20 m depth, in areas of coarse sand and rubble, sometimes with mixed seagrass (Salley, 1986; Berg Jr. et al., 1992; Boidron-Metairon, 1992; Stoner and Sandt, 1992; Stoner and Schwarte, 1994; Delgado and Glazer, 2020). Nursery habitat for queen conch is found in shallower sheltered back reef areas, primarily associated with native seagrass meadows (Stoner, 1989; Stoner et al., 1994; Stoner et al., 1996; Jones and Stoner, 1997; Doerr and Hill, 2018; Boman et al., 2019). Juveniles are mostly found in seagrass but can also recruit to shallow habitats such as algal flats (Glazer and Berg Jr., 1994).
To represent spawning and nursery habitat of queen conch. We used a spatially explicit conch habitat map (Figure 2) composed of 1359 8 × 8 km polygons (Holstein et al., 2014) based on coral reef locations from the Millennium Coral Mapping Project (Spalding et al., 2001; IMaRS-USF 2005; IMaRS-USF and IRD 2005; Andréfouët, 2008; UNEP-WCMC et al., 2021). The polygons covered both spawning and settlement habitat where queen conch occur, including seagrass, sand, and reefs (Kough et al., 2019; Souza and Kough, 2020). Thus, spawning and settlement in our model occurred within the same polygons. Since the majority of conch habitat is restricted to shallow depths of less than 20 m (Salley, 1986; Berg Jr. et al., 1992; Boidron-Metairon, 1992; Stoner and Sandt, 1992; Stoner and Schwarte, 1994; Delgado and Glazer, 2020), our habitat grid was comprised only of polygons with centroid depth between 0 and 20 m (Figure 2).
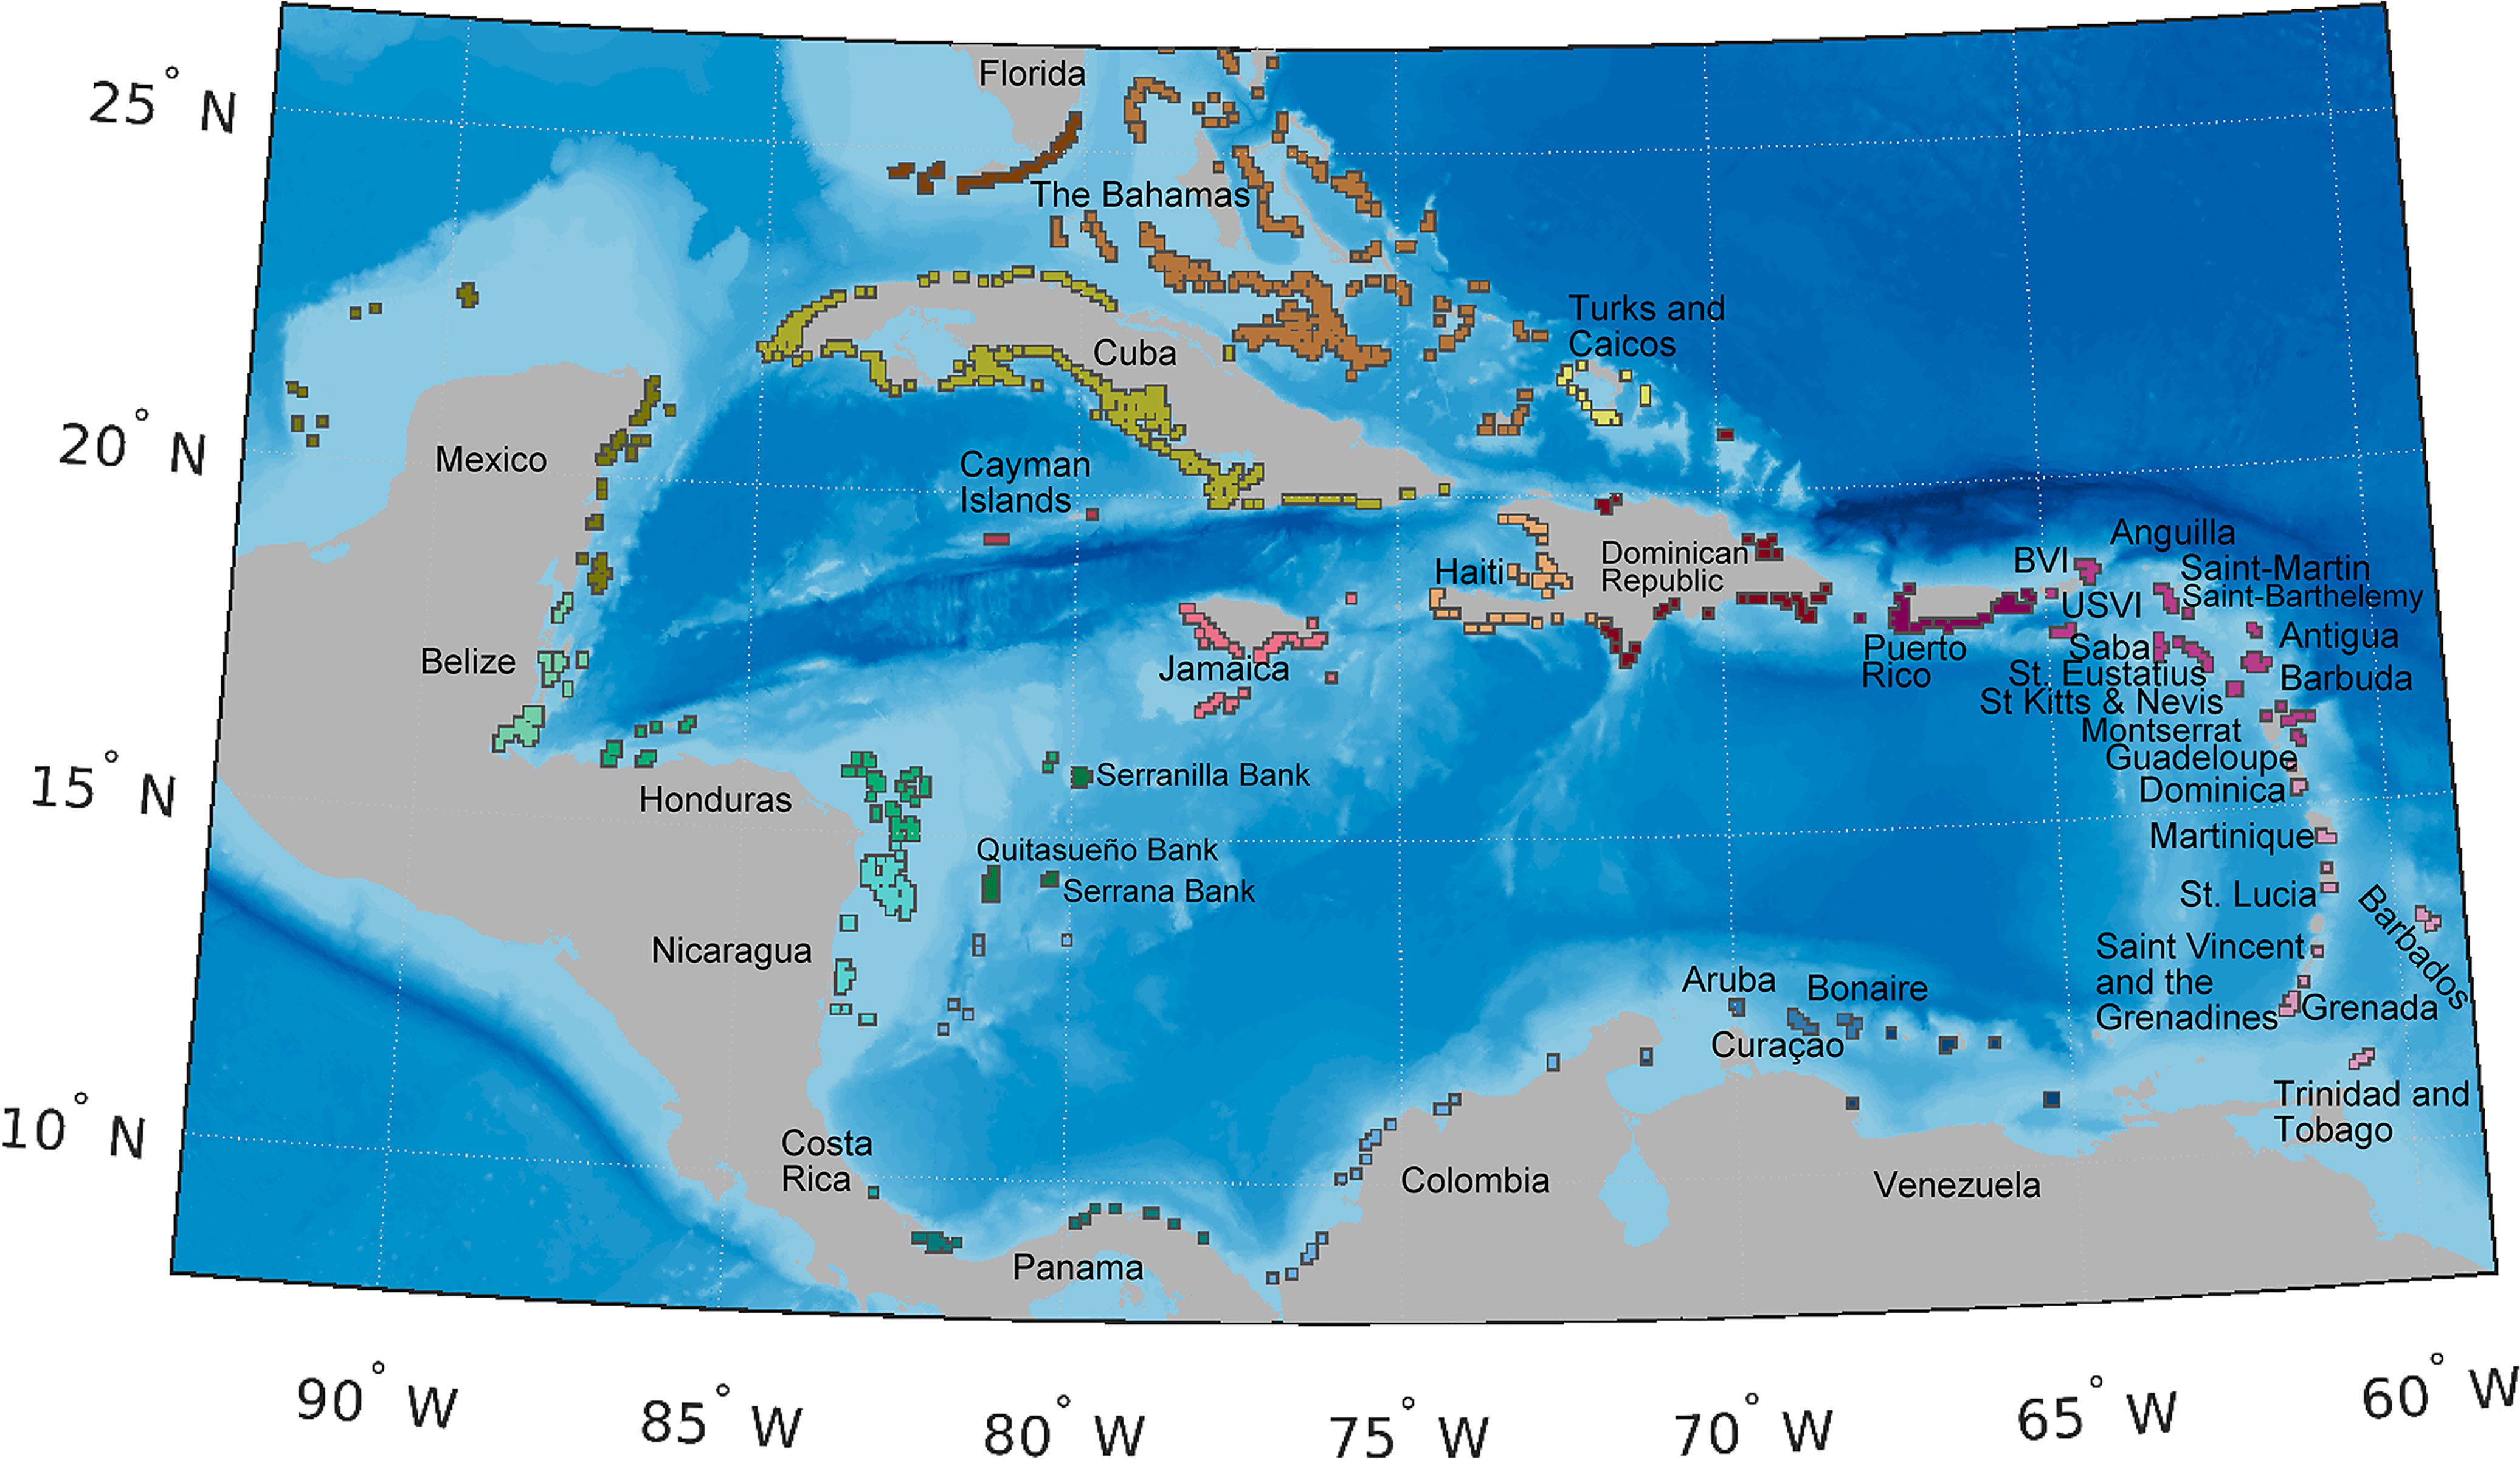
Figure 2 Map of spawning and settlement habitat (polygons), color-coded by jurisdiction. Conch habitat is represented of 1359 8×8 km polygons (Holstein et al., 2014) based on shallow (depth less than 20 m) coral reefs locations from the Millennium Coral Mapping Project (Spalding et al., 2001; IMaRS-USF 2005; IMaRS-USF and IRD 2005; Andréfouët, 2008; UNEP-WCMC et al., 2021). Individual habitats are buffered to facilitate visualization and are not represented to scale. Due to close proximity, some jurisdictions are referred by their regional location, as follows: 1) the Greater Antilles is composed by the Cayman Islands, Cuba, Dominican Republic, Haiti, Jamaica, Puerto Rico; 2) the Leeward Islands are Anguilla, Antigua and Barbuda, British Virgin Islands, United States Virgin Islands, Guadeloupe, Montserrat, Saba, Saint Barthélemy, Collectivity of Saint Martin, Sint-Eustatius, Saint Kitts and Nevis; 3) the Windward Islands are composed by Barbados, Dominica, Grenada, Martinique, Saint Lucia, Saint Vincent and the Grenadines, Trinidad and Tobago.
We compared our habitat area estimates to published seagrass habitat cover and conch fishing areas (SI Figure 3) including compilations of global geomorphic zones (UNEP-WCMC and Short 2021; Allen Coral Atlas, 2020; McKenzie et al., 2020; Schill et al., 2021); studies focused on jurisdictions or regional levels (Wabnitz et al., 2008; Tewfik et al., 2017; León-Pérez et al., 2019) and fishing sites (compiled in Prada et al., 2017). Estimates of seagrass area by jurisdiction were highly variable, and estimates of conch fishing areas were generally much lower than the highest estimates of seagrass cover. Overall, our habitat area estimates were much lower than total seagrass area estimates per jurisdiction and ranged from ~30% to 100% of the area of the fishing bank estimates (SI Figure 3). Our habitat areas were thus a conservative measurement of conch habitat throughout the Caribbean.
To ensure that known spawning sites, including putative deep-water spawning locations, were included in the habitat layer, we ground-truthed our habitat map with spawning sites reported in the literature (Randall, 1964; D'Asaro, 1965; Brownell, 1977; Davis et al., 1984; Weil and Laughlin, 1984; Coulston et al., 1987; Wilkins et al., 1987; Wicklund et al., 1991; Berg Jr. et al., 1992; García-Escobar et al., 1992; Stoner and Sandt, 1992; Márquez-Pretel et al., 1994; Lagos-Bayona et al., 1996; Pérez-Pérez and Aldana-Aranda, 2003; Garcia-Sais et al., 2012; Cala et al., 2013; de Graaf et al., 2014; Meijer zu Schlochtern, 2014; Wynne et al., 2016; Truelove et al., 2017). Following this review, we incorporated 13 shallow-water polygons not initially present in our habitat layer in St. Eustatius, USVI, Colombia, Florida, Mexico, Jamaica, Saba, Bonaire, and The Bahamas (Randall, 1964; Coulston et al., 1987; García-Escobar et al., 1992; Márquez-Pretel et al., 1994; Meijer zu Schlochtern, 2014; Truelove et al, 2017). We also included an additional 14 putative deep spawning sites, located outside of our polygons, as spawning sources exclusively for Venezuela, Cuba, The Bahamas, USVI, Turks and Caicos Islands (TCI), Saba, Colombia, Belize, Honduras, Puerto Rico and Jamaica (i.e., Pedro Bank) (Randall, 1964; Brownell, 1977; Davis et al., 1984; Weil and Laughlin, 1984; Wicklund et al., 1991; Stoner and Sandt, 1992; Lagos-Bayona et al., 1996; Aiken et al., 2006; Garcia-Sais et al., 2012; Cala et al., 2013; de Graaf et al., 2014; Truelove et al., 2017). We assumed that all spawning sites within a given jurisdiction contributed equally to conch biomass and thus spawning, except for The Bahamas, Colombia, and Puerto Rico, where sub-jurisdiction designations were used because studies showed significant variation in conch densities and separate sub-jurisdictional estimates could be compiled.
Adult Densities
Data for adult densities were obtained from a recent comprehensive literature review which compiled fishery-independent densities of adult conch populations for each of the 42 jurisdictions in our study area (Horn et al., 2022, Figure 3). Jurisdiction here was defined as any state, territory, collectivity, municipality, or country within the species range having management authority over queen conch stocks. For each of the 42 jurisdictions, all available comprehensive survey-level estimates of adult queen conch per hectare were compiled to generate cross-shelf adult conch density estimates.
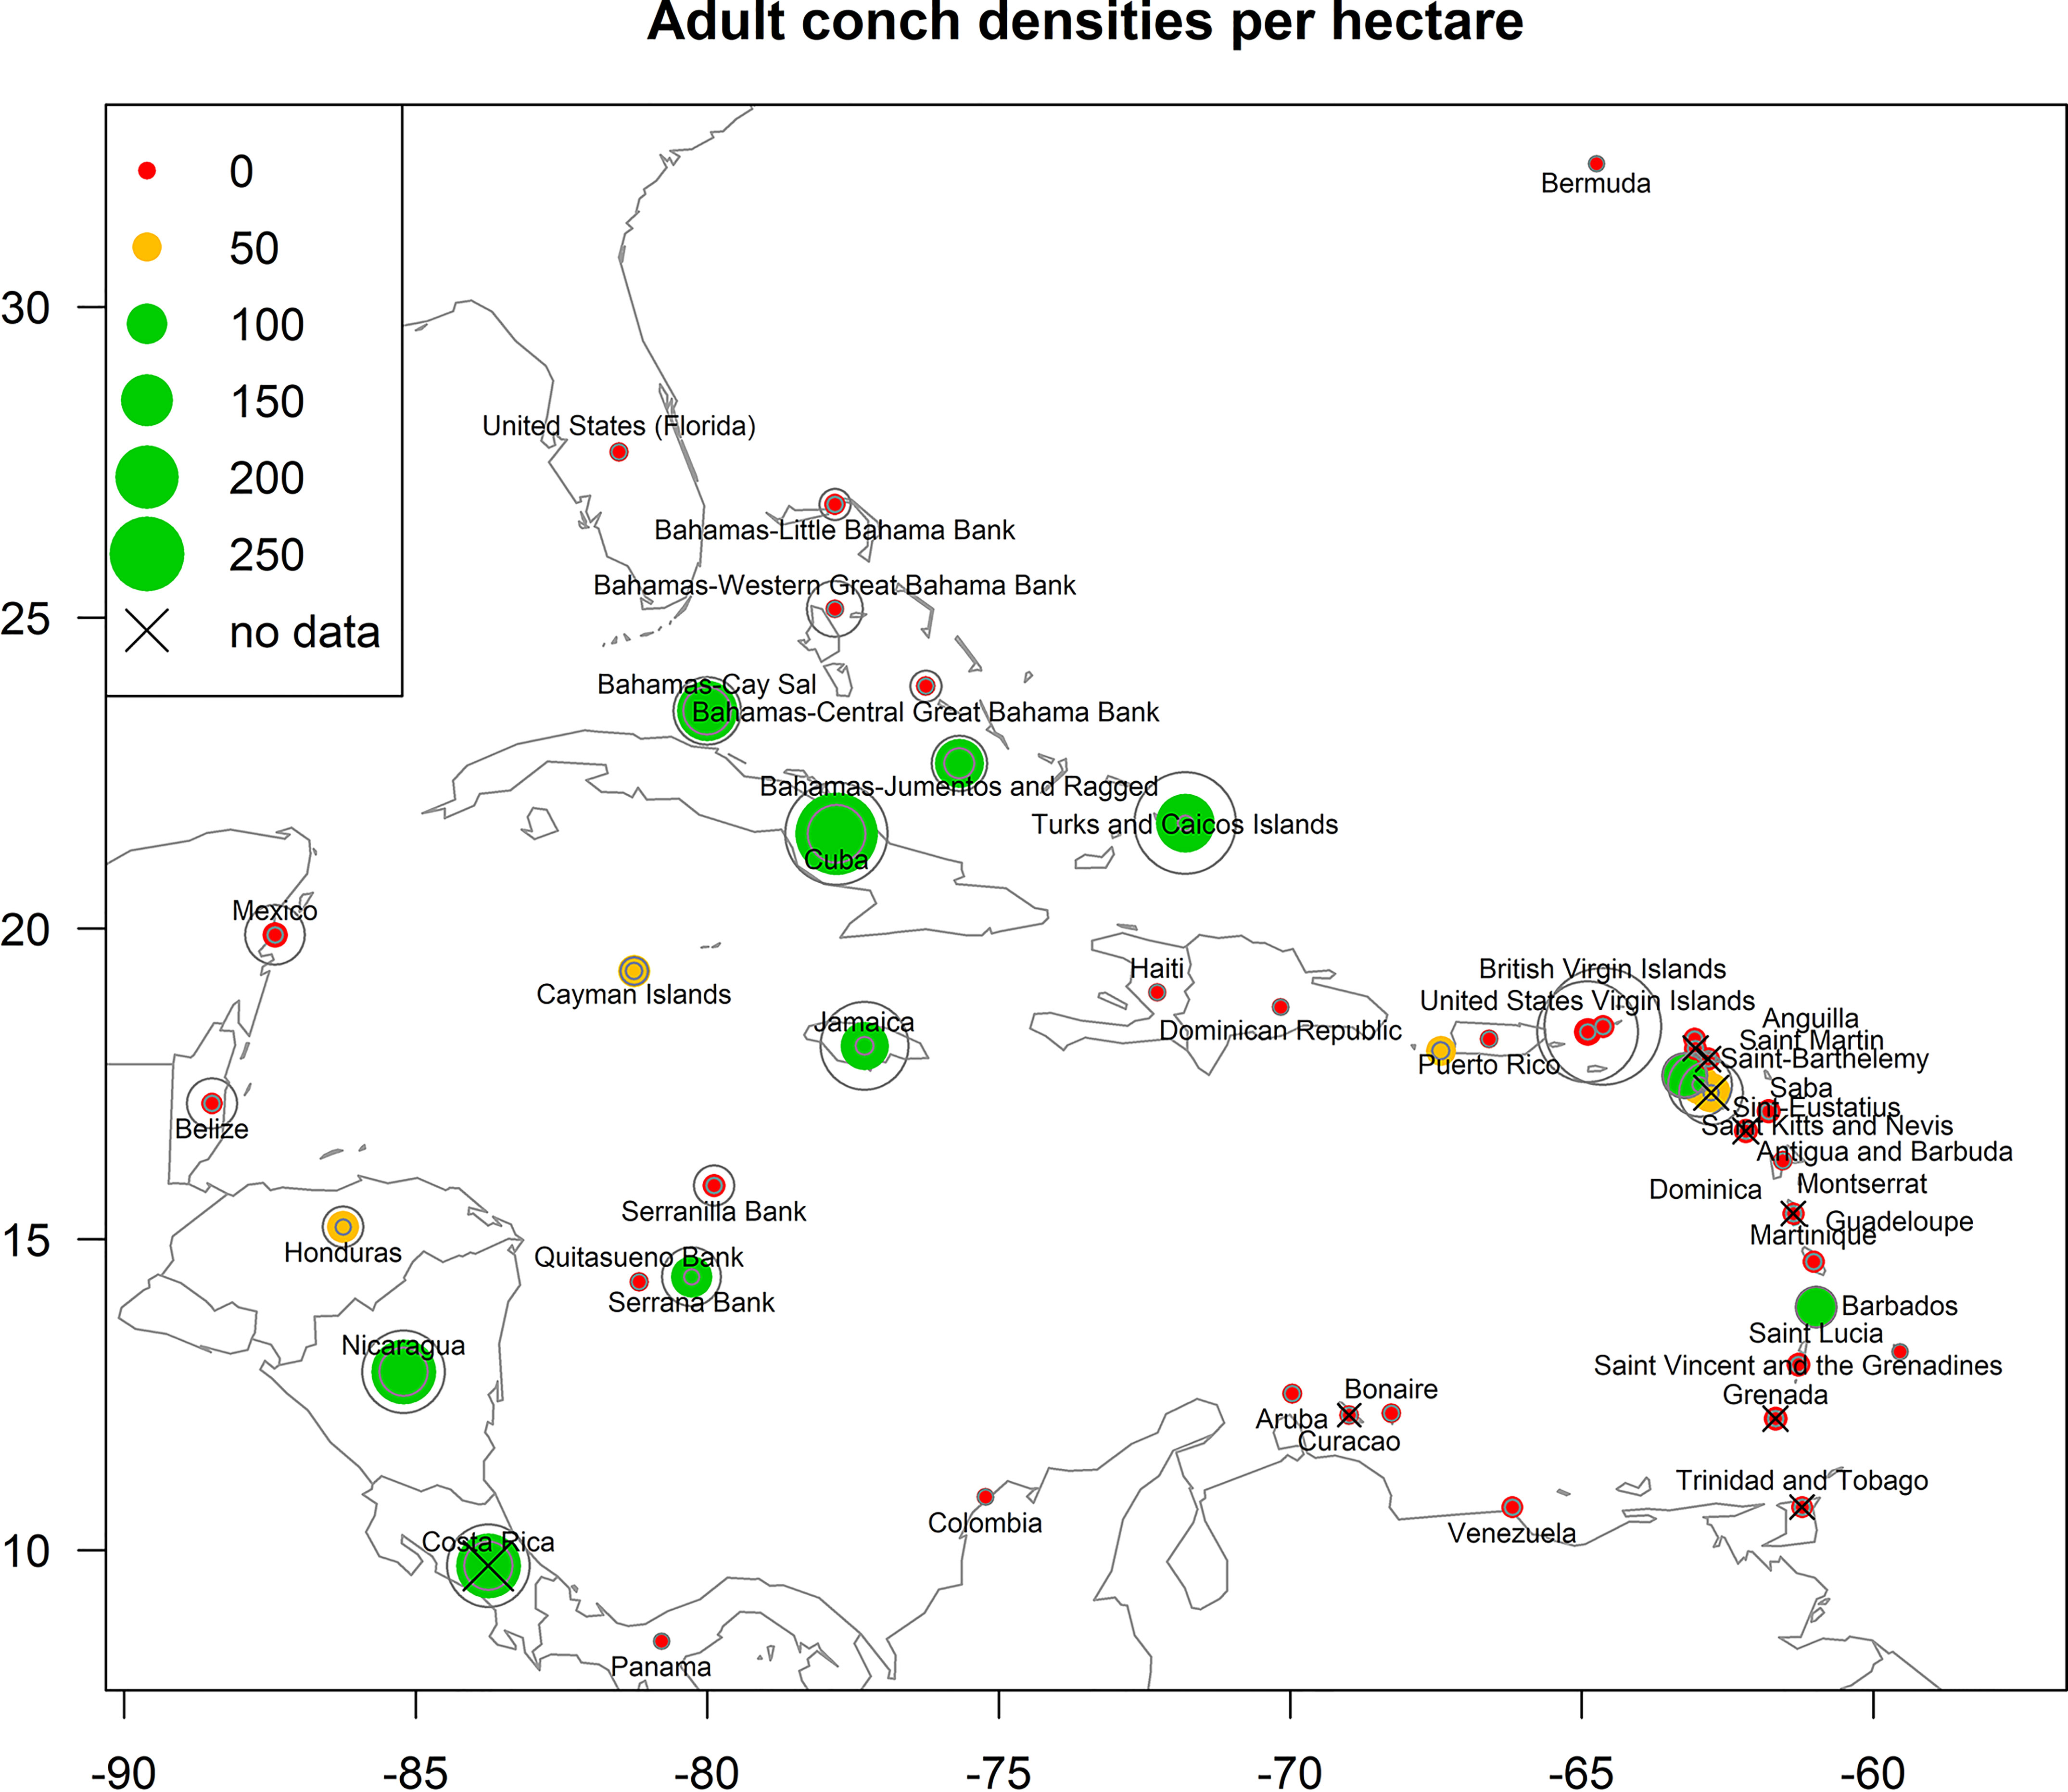
Figure 3 Estimated adult conch densities for the jurisdictions considered in this study (reproduced from Horn et al. 2022, sources listed in Appendix 1). Data points are sized relative to densities; green symbols indicate conch populations with >100 adult conch/ha, gold symbols indicate 50-99.9 adult conch/ha, and red symbols indicate <50 adult conch/ha. Countries without density data are indicated with an X - data for these countries were interpolated from the nearest neighbor. Gray circles represent the 95% confidence interval (2.5 - 97.5% bounds) of density estimates for each jurisdiction. Where densities are summarized on a jurisdiction level, the points appear at the approximate center point of the jurisdiction; where densities are summarized on a subregional level the points appear at the location of fishing banks or subregions (i.e., The Bahamas and Puerto Rico). Please refer to Horn et al. 2022 for more details on the methodology.
Data availability was variable among jurisdictions, and some estimates reflect recent studies which conducted randomized surveys over multiple habitat and shelf areas, while others reflect punctual surveys or data from workshops (SI Appendix 1, Horn et al., 2022). Cross-shelf surveys likely generate more suitable estimates of overall queen conch populations, and cross-shelf surveys seem to be a widely used monitoring method for queen conch stocks. Thus, intra-aggregation density data (e.g., from the few surveys conducted within spawning aggregations) were removed from the dataset (SI Appendix 1).
Priority was given to using surveys carried out after 2000; when this was not possible (Bermuda, Dominican Republic), surveys from the 1990s were used. For jurisdictions where no data were available, densities from the nearest neighbor jurisdiction were used (Costa Rica, Curaçao, Dominica, Grenada, Montserrat, Saint Kitts and Nevis, Saint-Barthelemy, Trinidad and Tobago). When available, we also considered available information regarding the status of stocks and local exploitation/consumption of conch. However, for most jurisdictions, there were multiple independent estimates available (SI Appendix 1). In such cases, we fitted a distribution to the independent estimates of mean conch density (see Horn et al., 2022 for details) and then used the median of the distribution as a best estimate of mean adult queen conch density for each jurisdiction. For jurisdictions with large shelf areas and with data available across multiple regions, significant differences across regions were assessed. Densities for The Bahamas, Colombia, and Puerto Rico were significantly different among regions, and separate density estimates were created for these areas. For The Bahamas, the difference is considered between regional banks (Little Bahama Bank, Western Great Bahama Bank, Central Great Bahama Bank, Jumentos and Ragged, and Cay Sal); for Colombia, the division is between nearshore sites and offshore banks located hundreds of miles away (Serranilla, Quitasueño and Serrana Banks); and for Puerto Rico is between shallow sites and a putative mesophotic spawning site at the Abrir La Sierra mesophotic reef (located in the southeast of the Mona Passage, Garcia-Sais et al., 2012).
The compiled density (Figure 3, Horn et al., 2022) showed that most jurisdictions, or regional divisions of jurisdictions (31 out of 46 jurisdictions), present populations with adult densities varying from 0-50 conch/ha, four jurisdictions present densities from 50-100 conch/ha, and 11 present adult densities over 100 conch/ha.
Spawning Behavior
Queen conch exhibit a seasonal spawning pattern, which varies with latitude across our study region. In our model approach we used a standardized annual spawning curve for all jurisdictions, varying the month of onset and peak of spawning for each jurisdiction. Annual seasonal cycles of spawning activity were derived from five studies which evaluated annual egg production (Weil and Laughlin, 1984; Stoner et al., 1992; Appeldoorn, 1993; Delgado and Glazer, 2020), and each was fit to a series of curves (Normal, Weibull, Lognormal, and Gamma). The Weibull curve was the best fit overall, and the best-fit Weibull curve parameters were then averaged to create a single curve that could be applied to all jurisdictions, representing that the ramping up of spawning occurs at a slightly higher rate than the ramping down of spawning after the peak (SI Figure 1). We compiled the month of spawning peak and onset for each jurisdiction from published visual surveys of reproductive output and gonadal histological studies (Randall, 1964; D'Asaro, 1965; Hesse, 1976; Brownell, 1977; Davis et al., 1984; Appeldoorn, 1985; Cruz, 1986; Salley, 1986; Corral and Ogawa, 1987; Coulston et al., 1987; Berg et al., 1992; Stoner et al., 1992, Appeldoorn, 1993. Márquez-Pretel et al., 1994; Aldana-Aranda et al., 2003; Avila-Poveda and Baqueiro-Cárdenas, 2009; Bissada, 2012; Appeldoorn and Baker, 2013; Cala et al., 2013; Aldana-Aranda et al., 2014; Meijer, 2014; de Graaf et al., 2015; Wynee, 2016; Boman et al. 2018; Tiley et al. 2018; Delgado and Glazer, 2020). Expected spawning activity was then interpolated over all months of the year by using the Weibull curve representing the annual cycle, shifting it temporally such that the peak of the curve matched the reported peak. The expected spawning activity was thus expressed as a series of percentages by month, with the sum of all months equal to 100%. This extrapolation method produced patterns of spawning in space and time that are very similar to other reports (Boman et al., 2018; Stoner and Appeldoorn, 2021). The derived percentages were then applied so that the number of particles released in the simulation follows the specified annual pattern (SI Table 1).
Unexploited and Exploited Spawning Scenarios
To account for the spatially heterogeneous patterns in exploitation and density-dependent processes (Allee effects), we considered two distinct scenarios. For the first set of simulations, the total number of larvae released from each polygon centroid is constant across all countries, with spawning varying over time to capture local seasonality. This set of simulations reflects a historical virgin or “unexploited” population, whereby the density of queen conch spawning biomass is constant across all areas. The actual densities of conch spawning biomass that can be supported will be dependent on habitat attributes of each area; however, we lacked a comprehensive map of habitat types across our wider study region, as well as information on the relationships between habitat types and their respective conch densities at carrying capacity, as they vary across the region. In the absence of such detailed information, we assumed that equal spawning biomass densities and consistent per-capita fecundity rate across the region are reasonable approximations for understanding overall connectivity patterns in a pre-exploitation (i.e., unexploited) scenario.
For the second set of simulations, densities of adult conch populations for each of the 42 jurisdictions of our study area (Horn et al., 2022, Figure 3) were used to scale the conch reproductive output. We applied an additional penalty for very low densities to account for reduced reproductive success at these levels (i.e., Allee effects). This simulation represents the expected connectivity under contemporary exploitation rates. To adjust the number of egg releases on a per-area basis, we used Equation 1, where N is the number of particles released in each year of the simulation per area a, S is a constant scalar to adjust the overall number of particles to computationally viable quantity for the simulation, D is the median of the mean adult conch densities for each jurisdiction c, and f(A) is a function representing the reduction in reproductive output due to Allee effects.
The few studies that have investigated simultaneously the relationship between adult density and reproductive rates found varying results, particularly because the density is dependent on the scale over which observations are recorded (Stoner and Ray-Culp, 2000; Gómez-Campo et al., 2010; Stoner et al., 2012; Cala et al., 2013; Doerr and Hill, 2018; Appeldoorn, 2020). However, field studies suggest a cross-shelf minimum density of 50–100 adults/ha (Stoner and Ray-Culp, 2000; Stoner et al., 2012) or a spawning aggregation (i.e., intra-aggregation) density of 200-300 adults/ha (Delgado and Glazer, 2020) is necessary for successful encounters and mating. For our simulations, we assumed that jurisdictions with cross-shelf densities >100 conch/ha had full reproductive activity [f(A) from Equation 1 is set to 1], with reproductive output decreasing linearly for jurisdictions harboring between 50-100 conch/ha and assumed no reproduction for jurisdictions with densities <50 conch/ha (SI Figure 2). The number of particles released per polygon and jurisdiction was distributed across the annual cycle using the same derived percentages used in the unexploited, uniform spawning, simulation (SI Table 1). Applying this function to our contemporary estimates of adult queen conch density limited spawning to just 15 of the initial 42 jurisdictions (Figure 3 and SI Figure 4).
Vertical Migration Behavior
Hatching of veligers occurs from egg masses on the seafloor. Hatched veligers possess two lobes which are used to immediately swim up to the ocean surface and remain in these layers (Brownell, 1977). Because hatched veligers would reach the surface in a relatively brief amount of time, we did not simulate the process of hatching and swimming to the surface, instead simulating releases directly from surface waters where the early-stage larvae occur more frequently.
We did not simulate diel vertical migration since there is disagreement among studies as to whether significant patterns in diel distributions exist (Chaplin and Sandt, 1992; Stoner and Davis, 1997). However, the body of literature on conch early life history is largely in agreement that distributions shift as veligers become older, and thus we simulated this ontogenetic shift based on the comprehensive surveys from Stoner and Davis (1997). Stages of development were differentiated in the Stoner and Davis (1997) study as newly hatched (300-500 μm length), mid-stage (500-900 μm), and late-stage (>900 μm) larvae. To determine the timing of these phase changes in terms of time elapsed since hatching, we plotted reported ages and lengths from a suite of nine different studies (D’Asaro, 1965; Brownell, 1977; Boidron-Metairon, 1992; Davis et al., 1993; Davis, 1994; Davis et al., 1996; Davis, 2000; Brito-Manzano and Aldana Aranda 2004; Davis, 2005). The relationship between shell length and days post-hatching is linear and highly correlated (R2 = 0.95). We used the relationship as defined by linear regression to translate shell length to estimated age at the transitional phases, which resulted in an estimated transition to mid-stage at 5.6 days post-hatching and transition to late stage at 15.5 days post-hatch. The initial vertical distributions (newly hatched veligers) are based on the averages of larval distributions with depth for newly hatched veligers from Tables 1, 2 in Stoner and Davis (1997). The vertical distributions of mid- and late-stage veligers were extracted from Stoner and Davis (1997), where day and night vertical densities were averaged to determine an overall distribution. The data compilation showed that most early-stage larvae are found in the surface layer, with some distributed slightly deeper within the top 15 m, whereas the mid-stage and late-stage larvae are distributed slightly further down in the water column (from 5-30m), and to a lesser extent in the deeper layers (up to 100m, SI Figure 5). This summary is consistent with other reports of OVM behavior of veligers (Brownell, 1977; Barile et al., 1994; Davis and Stoner, 1994; Stoner et al., 1997; Stoner and Smith, 1998).
Settlement
Minimum pelagic duration is reported in three field studies to be 18 days (Brownell, 1977; Salley, 1986; Davis, 1994) and thus, we set the minimum duration to this value. Upper limits for pelagic larval duration range from 21 to 30 days (D'Asaro, 1965; metapoluation Brownell, 1977; Salley, 1986; Davis, 1994; Paris et al., 2008) with a mean of approximately 25 days; this value was used for the upper range of the allowable PLD in the simulation.
Post-Processing Analysis
Connectivity
CMS saves individual larval positions and attributes through time, together with connectivity files with the spawning and settlement sites of successful settlers. The connectivity output is used to generate transition matrices of connectivity (i,j), where the rows (i) represent the spawning sites and the columns (j) represent the settlement sites (Bodmer and Cavalli-Sforza, 1968; Paris et al., 2007). By normalizing the connectivity matrix by columns, i.e., by the total settlement originating from each spawning site (i), we obtain the probability of settlers from a spawning site i to reach a settlement site j (Pij), and the matrix main diagonal (Pij, j=i) represents the probability that larvae settle within the same jurisdictional boundaries in which they were spawned (Paris-Limouzy, 2011). When the transition matrix is normalized by rows, or by the total settlement at each settlement site (j), the main diagonal of the matrix (Pji, i=j) represents self-recruitment, or the fraction of settlers spawned locally over all settlers in a reef (sensu Paris and Cowen, 2004; Botsford et al., 2009; Burgess et al., 2014; Drury et al., 2018). We also calculated the local retention, which is given by the number of settlers in their natal reef (or jurisdiction) over all larvae spawned in a reef (or jurisdiction, sensu Paris and Cowen, 2004; Botsford et al., 2009; Drury et al., 2018). Together these measures give an indication of how reliant any given jurisdiction is on larvae sourced from other jurisdictions.
Based on the transition matrix, we used graph theory to identify ecological corridors. Graph theory is the study of relationships between objects in a dynamic system, which can range from metapopulations to social or road networks (West 2001). A graph is composed of nodes and the connections between nodes are represented by edges. Thus, graphs are apt representations of the connections between populations created by larval dispersal (Cowen et al., 2006; Treml et al., 2008; Urban et al., 2009; Thomas et al., 2014; Saunders et al., 2016), where the populations are the “nodes’’ and the connections between populations are the “edges.” Several network metrics can be derived from graphs and here we calculate the betweenness centrality (BC), which measures the relative “centrality” of a node in relation to other nodes of the network. For each population (i), their BC is defined as the number of shortest paths (i.e., the shortest routes) between all population pairs which passes through the target population (i) over the number of shortest paths between all nodes in the graph. Thus, BC is a relevant measure of overall “connectedness,” since the shortest paths include both direct and indirect - or multigenerational - connections (Treml et al., 2008; Holstein et al., 2014). Jurisdictions with high BC are generally important for maintaining genetic diversity - if reproductive output from jurisdictions with high centrality were to decline significantly, we would expect reduced genetic mixing over the region. Other metrics, such as in-degree and out-degree (number of connections towards and from a population, respectively), are also estimated. We used the Matlab-bgl package (Gleich, 2008) for all graph analyses. We also estimated a source-sink index (Holstein et al., 2014), which relates the number of settlers leaving or arriving at each jurisdiction’s reefs (SS = settlersout - settlersin/settlersout + settlersin). This index allows the characterization of relative sinks and sources within the region.
We calculated transition matrices using all the conch habitat polygons in the region (1359 polygons), and then grouped the polygons by jurisdiction of origin to calculate transition matrices and conduct other analyses. To create jurisdiction categories, we used boundaries from Exclusive Economic Zones (EEZ) from the Maritime Boundaries Geodatabase (Flanders Marine Institute, 2019). We defined population units within these geographical boundaries because: 1) both habitat and densities of queen conch were available by jurisdiction, and we are unable to provide robust input within jurisdictions and 2) these are the units of management throughout the queen conch distribution. To facilitate the description of results and discussion, the islands and jurisdictions of the Lesser Antilles (Windward and Leeward Islands, and the Leeward Antilles) are often described together, as color-coded and described in Figure 2.
Uncertainty Analyses
To account for the variable range of adult densities observed by fishery-independent surveys at each jurisdiction, we conducted an uncertainty analysis. From the above-mentioned jurisdiction-specific distributions of adult conch densities, we randomly drew 100 draws for each jurisdiction, and then translated the randomly drawn densities of adults to reproductive output as with previous simulations. We then estimated larval exchange between spawning and settlement jurisdictions by multiplying the probabilistic connectivity matrix of the unexploited release case by each reproductive output (egg production * connectivity, Kool et al., 2010; Kool et al., 2011). The results of the 100 transition matrices were aggregated for two extremes: minimum and maximum estimated connectivity. The matrices for each scenario were based on locating the minimum (or maximum) number of larvae exchanged between each spawning-settlement pair for the 100 different possible connectivity results.
Metapopulation
To identify clusters of highly isolated spawning and settlement sites of queen conch within the Wider Caribbean, we applied the graph theory method described in Jacobi et al. (2012). This method is a minimization algorithm that recursively seeks solutions that minimize connections between clusters, while maximizing connections within clusters (Jacobi et al. (2012), Garavelli et al., 2014). Briefly, it minimizes an objective function consisting of the connectivity between populations and a penalty parameter to avoid aggregating sites i.e., to avoid the optimal minimization solution of the connectivity matrix, which would be achieved considering only one cluster composed of all spawning and settlement sites. We used the Jacobi et al. (2012) minimization algorithm from the open-source R-package ConnMatTools (Kaplan et al., 2017). We did 10 different iterations of the algorithm using different penalty parameters (Jacobi et al., 2012). From these iterations, we selected the solution yielding the least amount of connectivity between clusters while resulting in the highest self-recruitment within the cluster. For this, we selected the solution where the connectivity between clusters normalized by the self-recruitment resulted in the smallest values, a value termed “quality” (Jacobi et al., 2012).
Given the distribution of habitat (patches of habitat on coasts, islands, and banks) within the queen conch distribution area, we assumed that each one of these clusters, as characterized by the minimization algorithm and estimated larval dispersal, acts as a metapopulation (sensu Wells and Richmond, 1995). Thus, metapopulations were the results of the clustering analyses, populations were defined by jurisdictional divisions, and distinct banks within a population were considered subpopulations.
Estimation of Genetic Distance
From the probability matrices, we also derived the connectivity distance between each spawning-settlement pair for several generations. We did this by a forward projection of the matrix using a modified model of migration based on Bodmer and Cavalli-Sforza (1968) as described in (Kool et al. 2010; Kool et al. 2011) and Foster et al. (2012). In the unexploited scenario, we assumed that all habitats in our model have the same carrying capacity and reproductive output, and thus, the forward matrix with the allele frequencies expected at time t (Qt) is given by , where M is the connectivity matrix, I is an identity matrix of the same dimension as M, and the bar denotes row-normalization (Kool et al., 2010). While the connectivity matrix reflects single dispersal events between populations during one generation, the forward projection of the matrix captures indirect connections over multiple generations. We then estimated the Nei’s DA genetic distances (Nei’s angular distance, as defined in Nei et al., 1983) between sites using the forward matrices, following Kool et al. (2010). The estimated Nei’s DAs are used for comparisons to the linearized GST (GST/(1- GST)) of a Caribbean-wide genetic study (Truelove et al., 2017) by means of a Mantel-r test (Mantel, 1967; Legendre and Legendre, 2012) to test for isolation by distance using the R package adegent v2.1.1 (Jombart et al., 2008).
Results
Connectivity Patterns
The probabilities of connectivity for both hydrodynamic fields (HYCOM and GLORYS, Figure 4) show that larval exchange tends to follow the main pattern of currents in the Caribbean, Gulf of Mexico, and North Atlantic (Figure 1). In the unexploited scenario, all network nodes (jurisdictions) were generally well connected, with multiple pathways of dispersal for both exporting and receiving larval subsidies - the median number of exporting connections (considering all jurisdictions and both hydrodynamic models) was 9, while the median number of incoming connections was 7. The connectivity from both hydrodynamic products also presented a high likelihood of self-settlement. However, the level of self-retention varied for some jurisdictions by model, e.g., Turks and Caicos Islands, which exhibited a higher likelihood of self-settlement when dispersed with the HYCOM than the GLORYS. Moreover, both networks showed that the only completely isolated node in the network is Bermuda, which did not receive nor provide larval subsidies to any other jurisdiction.
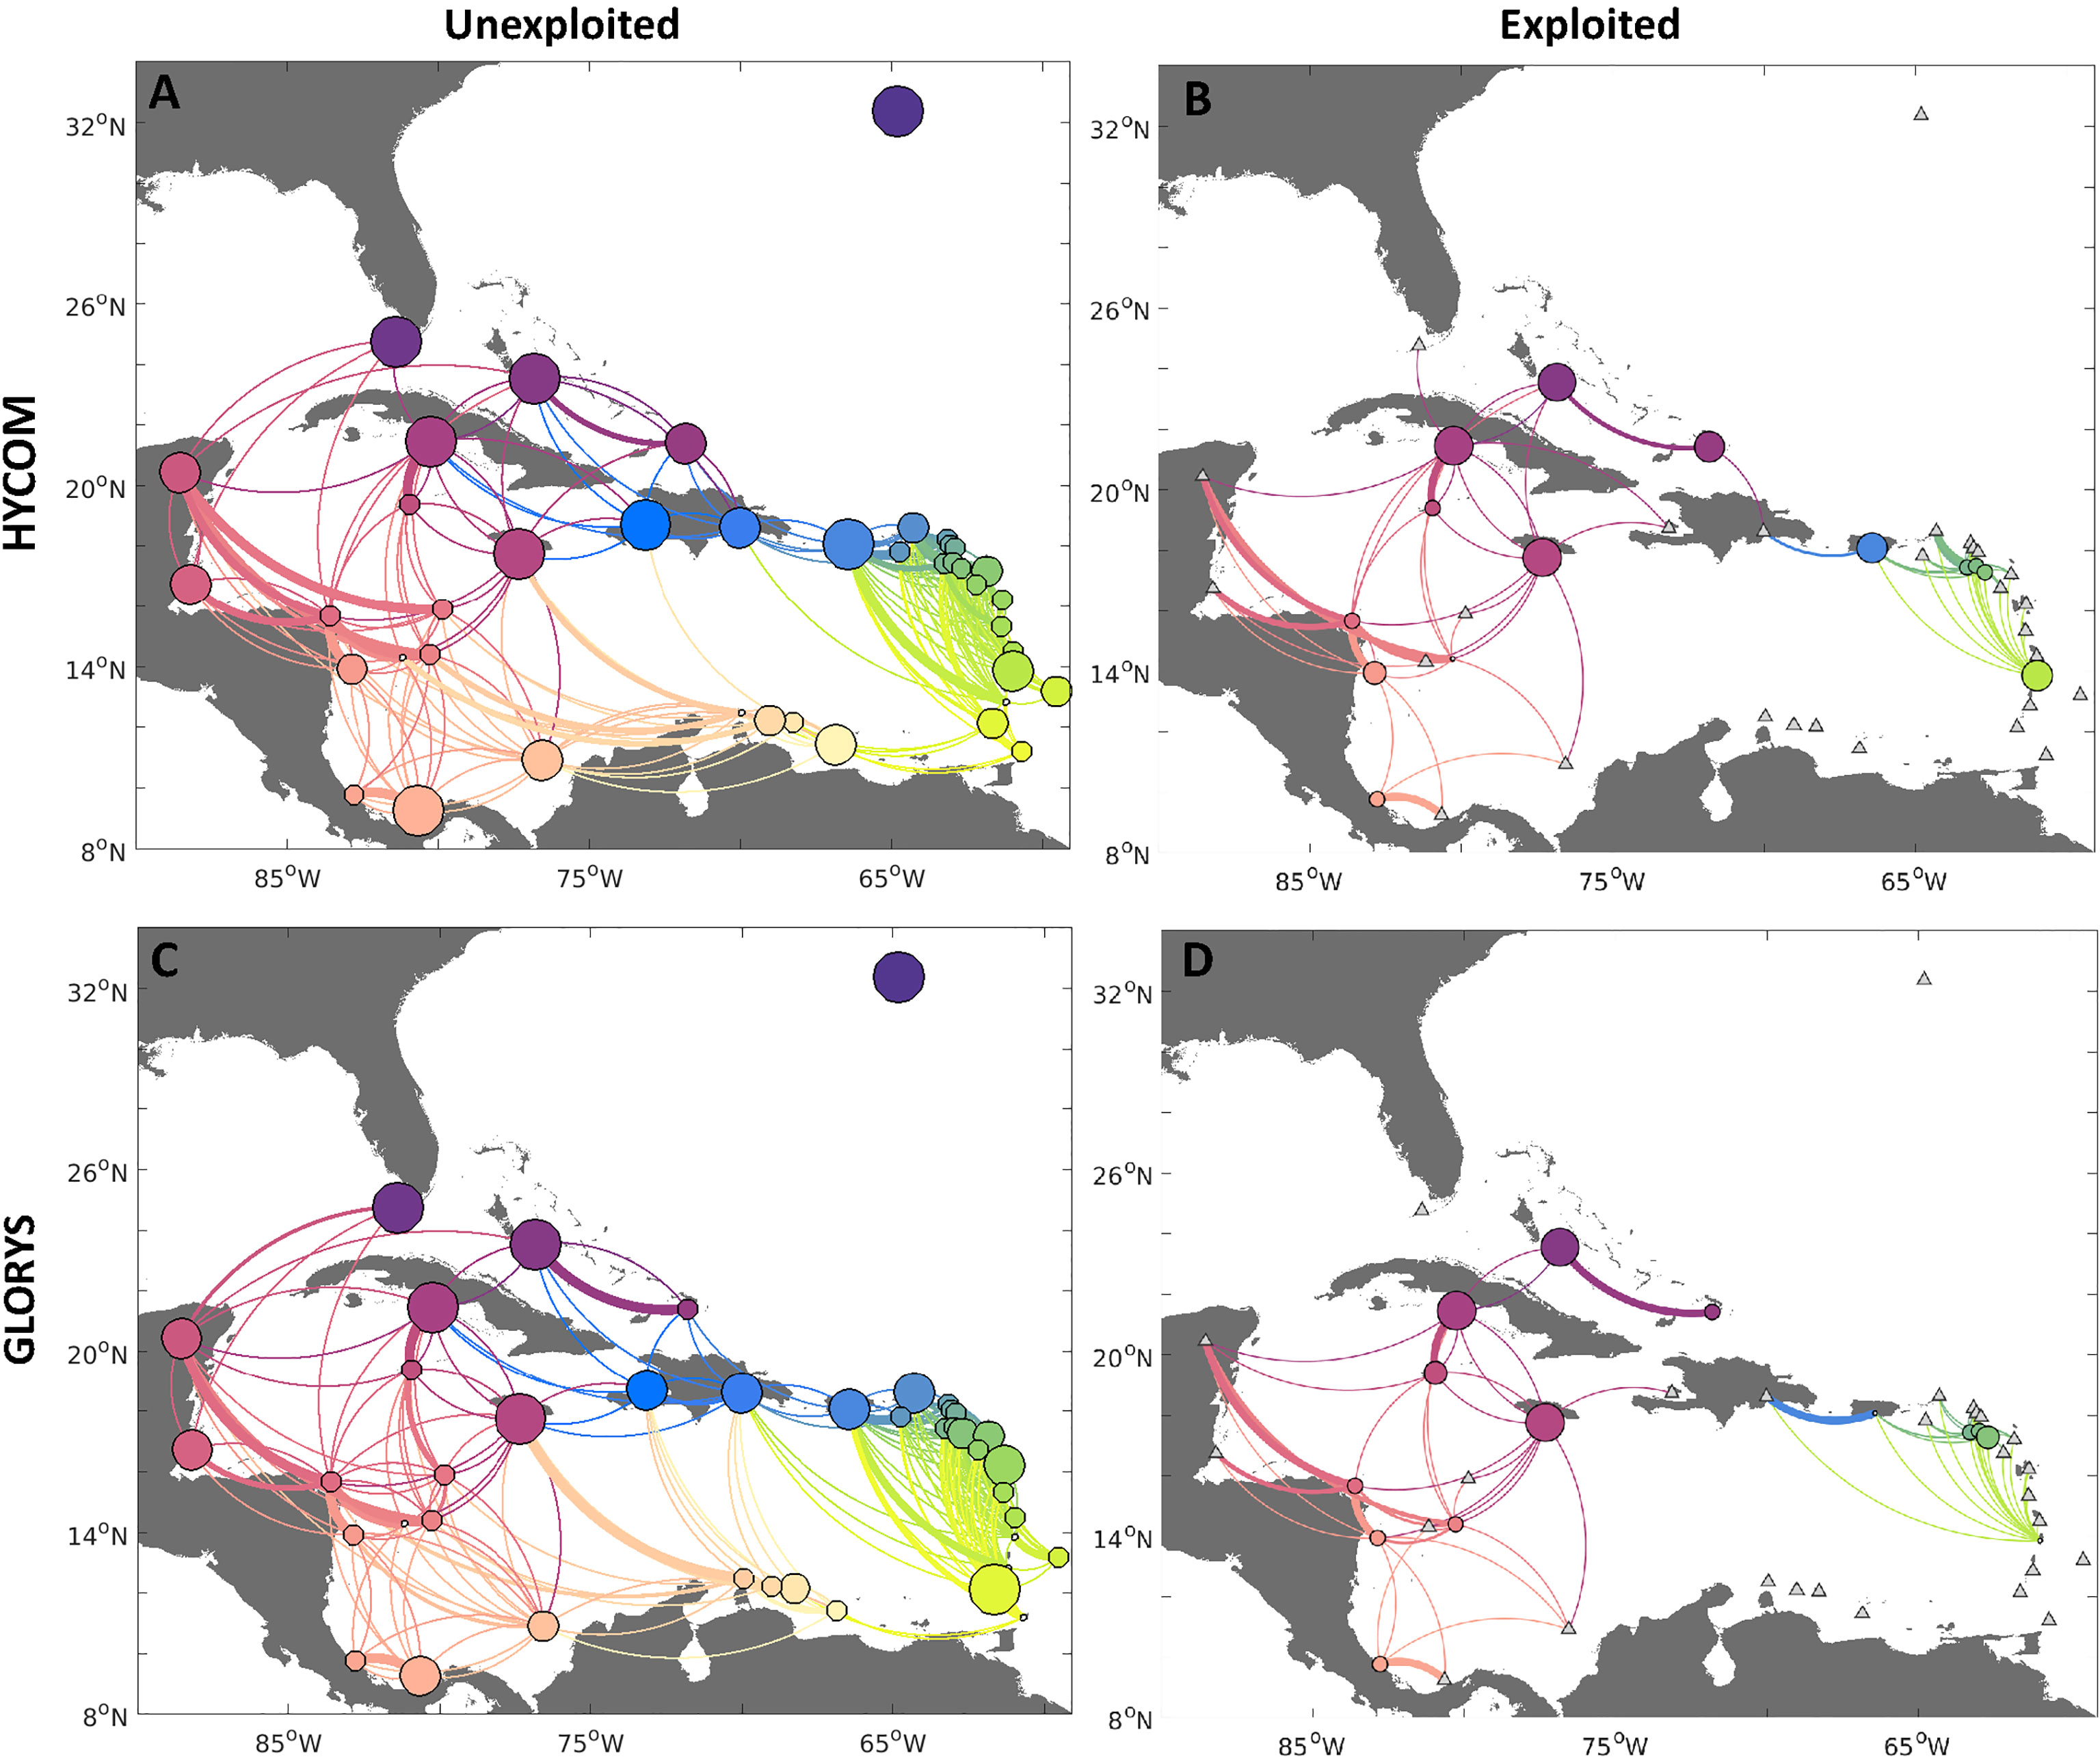
Figure 4 Connectivity networks for queen conch for two different reproductive output scenarios: 1) unexploited, i.e. spawning uniform for each habitat polygon (A, C left column); and 2) exploited, with spawning scaled by median adult densities reported per jurisdiction (B, D right column). Larvae were dispersed with HYCOM (A, B, top row), and GLORYS (C, D, bottom row) velocities. Edges between nodes represent the strength of connections between sites, whereby the direction of larval flow is given by the clockwise direction - concave edges represent export while convex represents import. Node sizes represent the probability of self-settlement. Jurisdictions with no spawning in the exploited density scenario are marked with a triangle. The results for each model were based on 90 releases in the period of five years (2013-2017).
Some key differences between the two ocean circulation models were confined to regional scale connections. For instance, the HYCOM estimated a higher likelihood of exchange 1) between and within reefs in Cuba and The Bahamas, and 2) from Cuba to Mexico and the Greater Antilles, while the GLORYS simulations estimated a higher likelihood of export from Cuba to the Bahamas. Transport within the Windward and Leeward Islands also differed slightly between the two sets of simulations. For the HYCOM, larvae spawned on the Windward and Leeward Islands were estimated to have a higher likelihood of settlement in Puerto Rico and the Dominican Republic when compared to the high likelihood of local settlement observed in the GLORYS for this region.
When we introduced realistic reproductive output levels based on exploitation patterns (Figures 4B, D), connectivity was largely reduced among regions for both models, as expected, and differences in connectivity patterns between the two models became less apparent. Notably, when considering exploited densities (Figures 4, 6), there was a reduction in the likelihood of self-settlement. Indeed, even the highest probability of self-settlement in the exploited scenario (The Bahamas, Jamaica, and Cuba) was smaller than observed in the historical scenario. Other jurisdictions in the network are likely to export most of their larval subsidies. By contrasting the connectivity networks for unexploited and exploited densities, there was a clear reduction of connections between the eastern and western Caribbean. It was also clear that the lack of spawning in Belize and Mexico, and the reduced spawning in Nicaragua, further break the transport to upstream sites, particularly the USA, The Bahamas, and northern Cuba. The regions that remained mostly inter-connected were the Central American jurisdictions (Costa Rica, Honduras, Nicaragua), the westernmost Greater Antilles Islands (Jamaica, Cuba, Turks and Caicos Islands), and the offshore Serrana Bank. Larvae released in these regions were exported to other regional reefs (Belize, Mexico, Panama, Colombia, Haiti, Serrana, and Quitasueño Banks) for both models.
Generally, the pattern of export or import of larvae for the unexploited homogenous spawning scenario matched the experiments with both hydrodynamic fields (Figure 6A, “unexploited”). Mexico, Costa Rica, British Virgin Islands, Anguilla, Saint Martin, and Saint Barthelemy presented a higher likelihood of acting as relative sinks, while the Windward Islands, Nicaragua, and Colombia’s Mesoamerican offshore banks (Quitasueño, Serrana, and Serranilla) appeared as (relative) sources. Once reproductive output was scaled by adult conch densities (Figure 6A, “exploited”), the relative importance of regions as a source and a sink also changed. Saba, Saint Kitts and Nevis, Nicaragua, Serrana Bank, and Turks and Caicos Islands were sources on both models, while Puerto Rico, Honduras, and Cayman Islands became sinks. Two countries with the largest habitat areas, Cuba and Jamaica, appeared as neutral, which is expected since these countries also showed high self-recruitment. The probability of The Bahamas acting as a relative sink slightly increased in the exploited simulations.
The betweenness centrality (BC) for the unexploited scenario (Figure 6B, “unexploited”) showed that despite differences in connectivity patterns between the simulations using different hydrodynamic products, the jurisdictions showing the highest BC were mostly consistent among the two simulations. These were the Dominican Republic, Puerto Rico, Jamaica, and Cuba. Following these were also Honduras, Colombia, and the British Virgin Islands. When considering exploited densities to scale the spawning (Figure 6B, “exploited”), Jamaica and Cuba emerged as central nodes for both hydrodynamic products. The Bahamas, Nicaragua, and Honduras appeared as secondary nodes. A notable change between the unexploited and exploited scenarios was Puerto Rico - when exploited densities were considered, the local reefs were unlikely to serve as an ecological corridor between Caribbean regions.
For the unexploited spawning scenario, local settlers comprised most of the settlers in several jurisdictions, including the Greater Antilles Islands, some of the Windward Islands (Figure 6C, “unexploited”), The Bahamas, Florida, and Bermuda, and results obtained with the two hydrodynamic products largely agreed. When considering exploited distributions (Figure 6C, “exploited”), local settlers comprised most of the settlers in Nicaragua, Jamaica, Cuba, and Turks and Caicos Islands, while largely important for The Bahamas and Saint Kitts and Nevis. Many of the jurisdictions that appeared to mostly rely on their own settlers in the unexploited experiment did not exhibit spawning (e.g., Haiti, Dominican Republic, Barbados, Trinidad and Tobago, Colombia, Belize, US, and Bermuda).
Uncertainty Analyses
Based on the minimum exchange scenario for each jurisdiction (Figures 5A, C), connectivity was further reduced from the exploited scenario, with more countries not producing viable settling larvae (or not spawning), including Honduras, Turks and Caicos Islands, Serrana Bank, St. Kitts and Nevis, and Sint Eustatius. However, the reduction in spawning did not further alter the probability of connectivity with other jurisdictions which were spawning, either for the HYCOM or GLORYS simulations. However, there were differences in the strength of connections and the number of larvae settling on their natal reefs. There was a higher likelihood of self-settlement in Jamaica, Cuba, and The Bahamas for both models. The connectivity between the eastern and western Caribbean regions here was further fragmented.
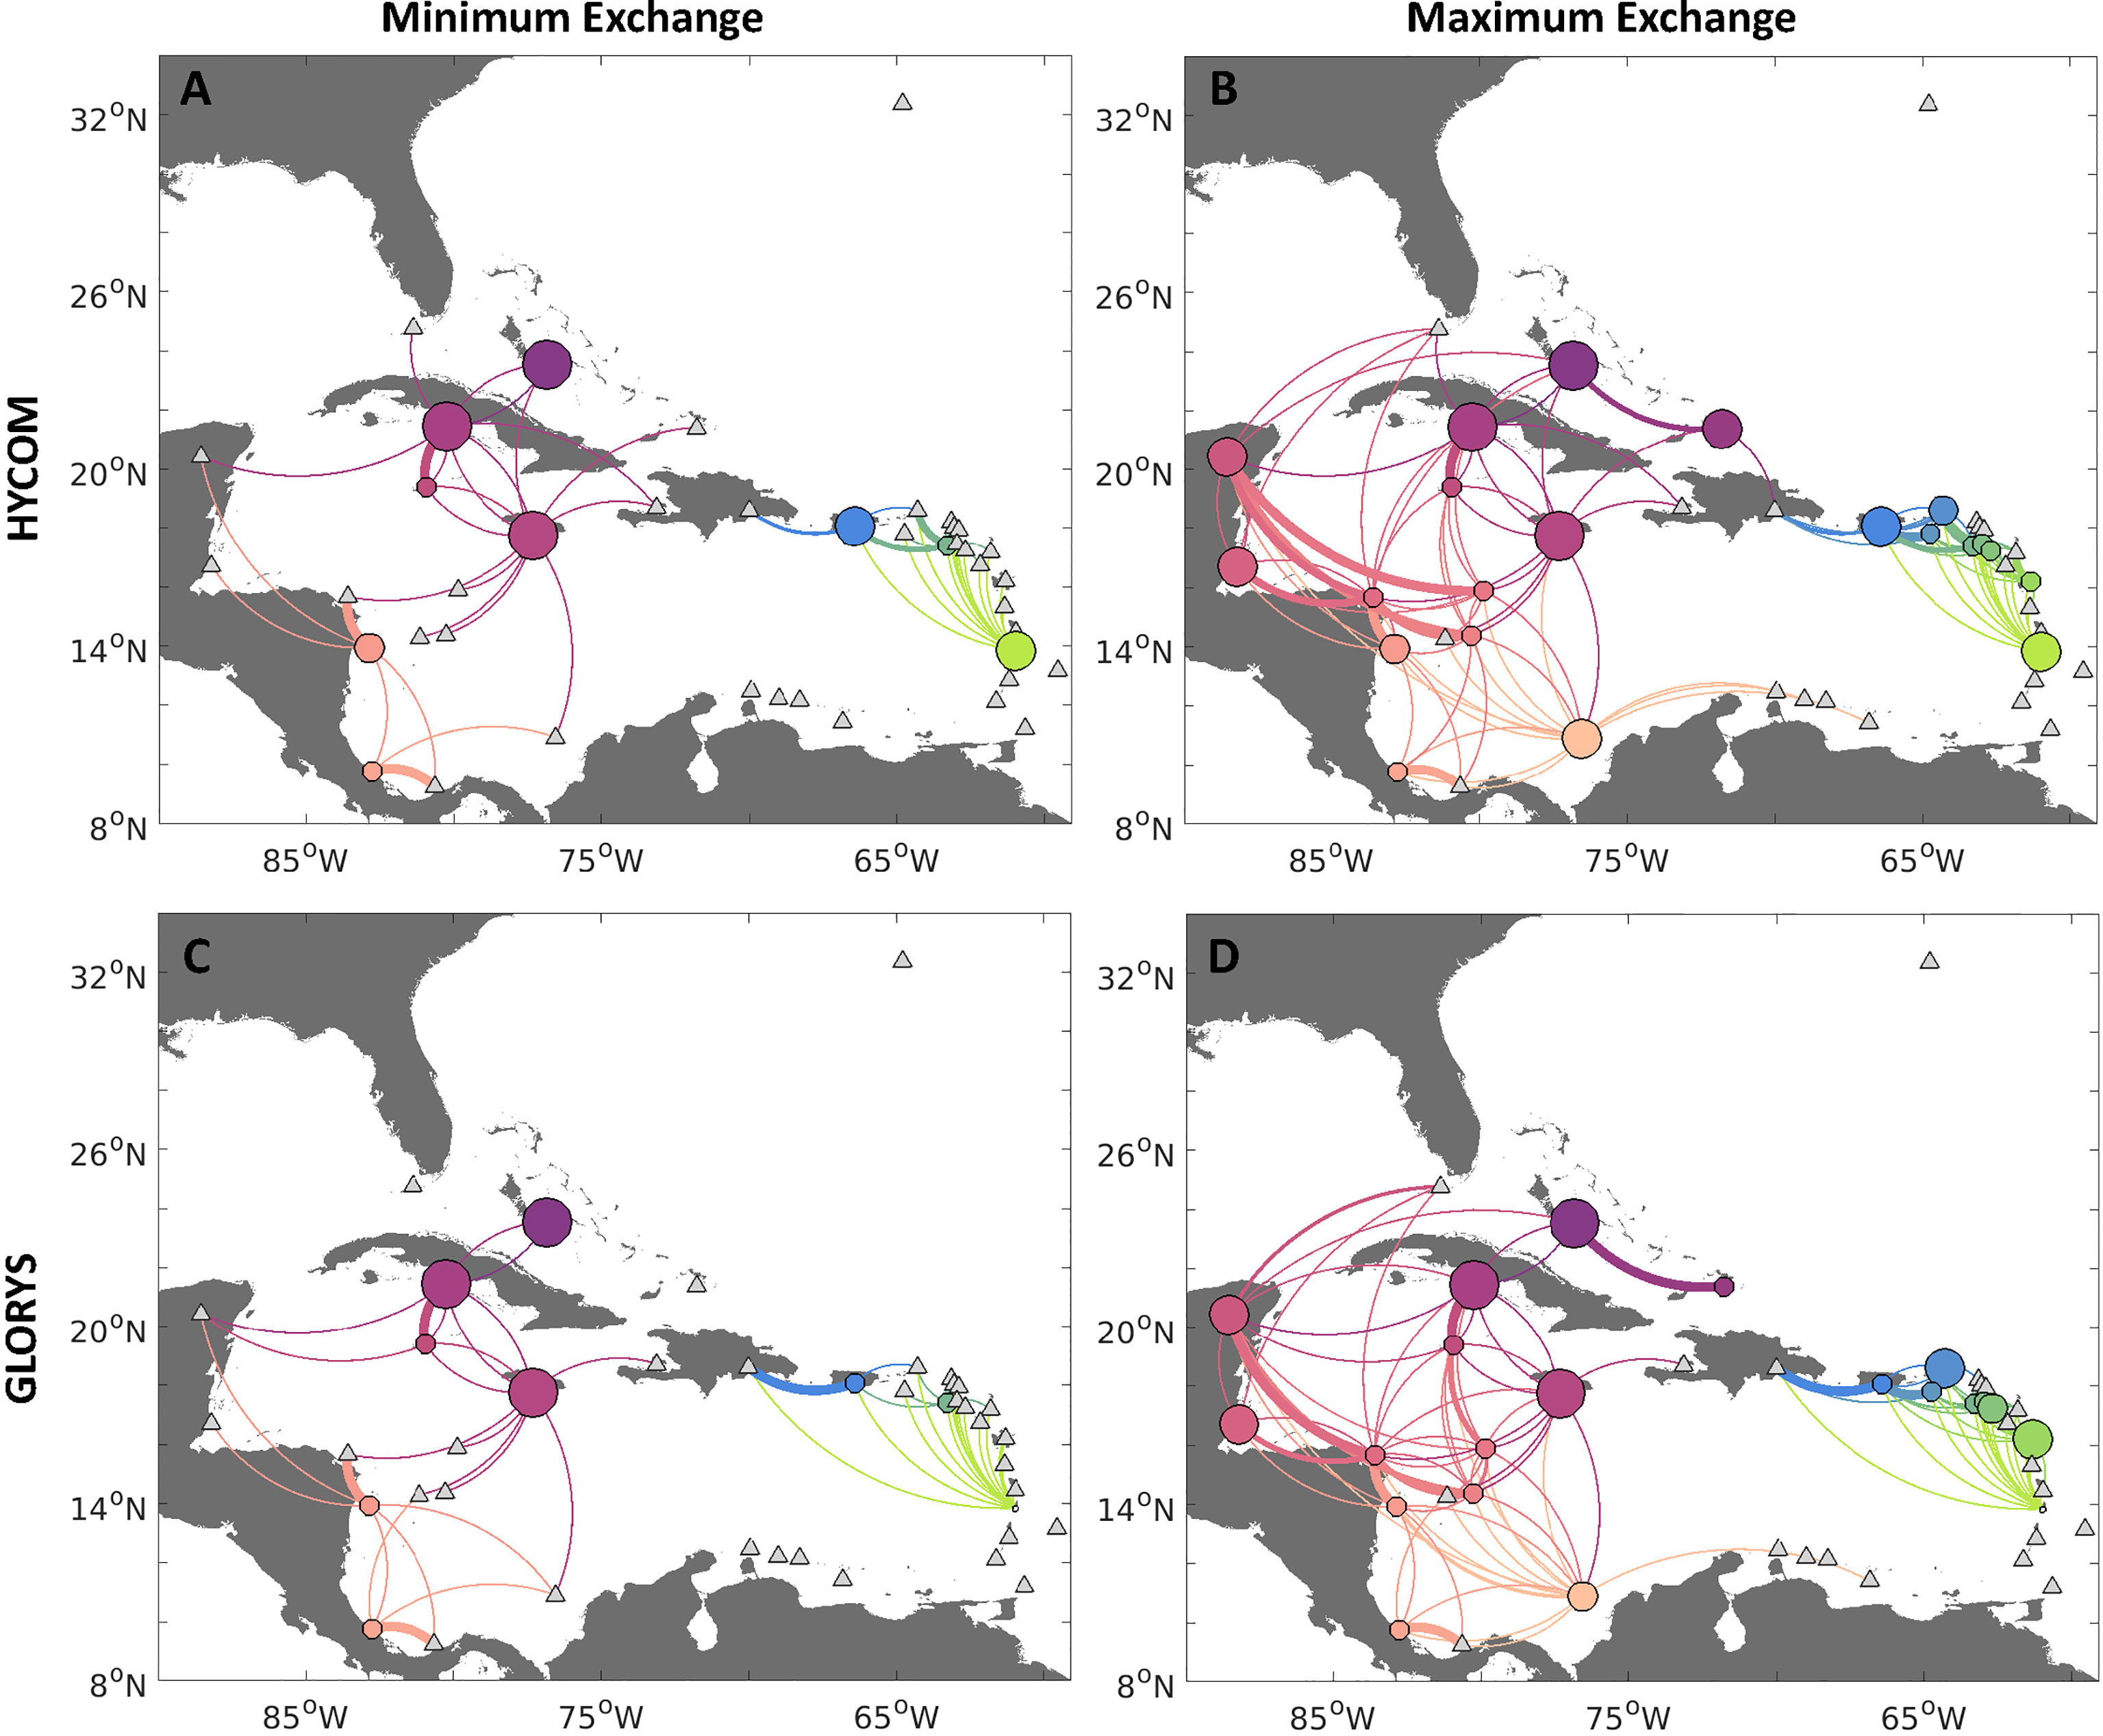
Figure 5 Connectivity network for queen conch considering uncertainty of contemporary (exploited) conch densities, for larvae dispersed with HYCOM (A, B, top row) and GLORYS12v1 (C, D, bottom row) velocities. Panels exhibit the minimum (A, C, left column) and maximum (B, D, right column) potential connectivity based on possible ranges of adult conch densities (from Horn et al., 2022). Minimum (maximum) potential connectivity is obtained from an uncertainty analysis, where we multiply the probabilistic connectivity matrix of the unexploited release case by 100 spawning distributions drawn from the density curves of adult conch per jurisdiction and use the smallest (biggest) number of larvae exchanged between each spawning-settlement pair to generate the probabilistic connectivity. Edges between nodes represent the strength of connections between sites, whereby the direction of larval flow is given by the clockwise direction - concave edges represent export while convex represents import. Node sizes represent the probability of self-settlement.
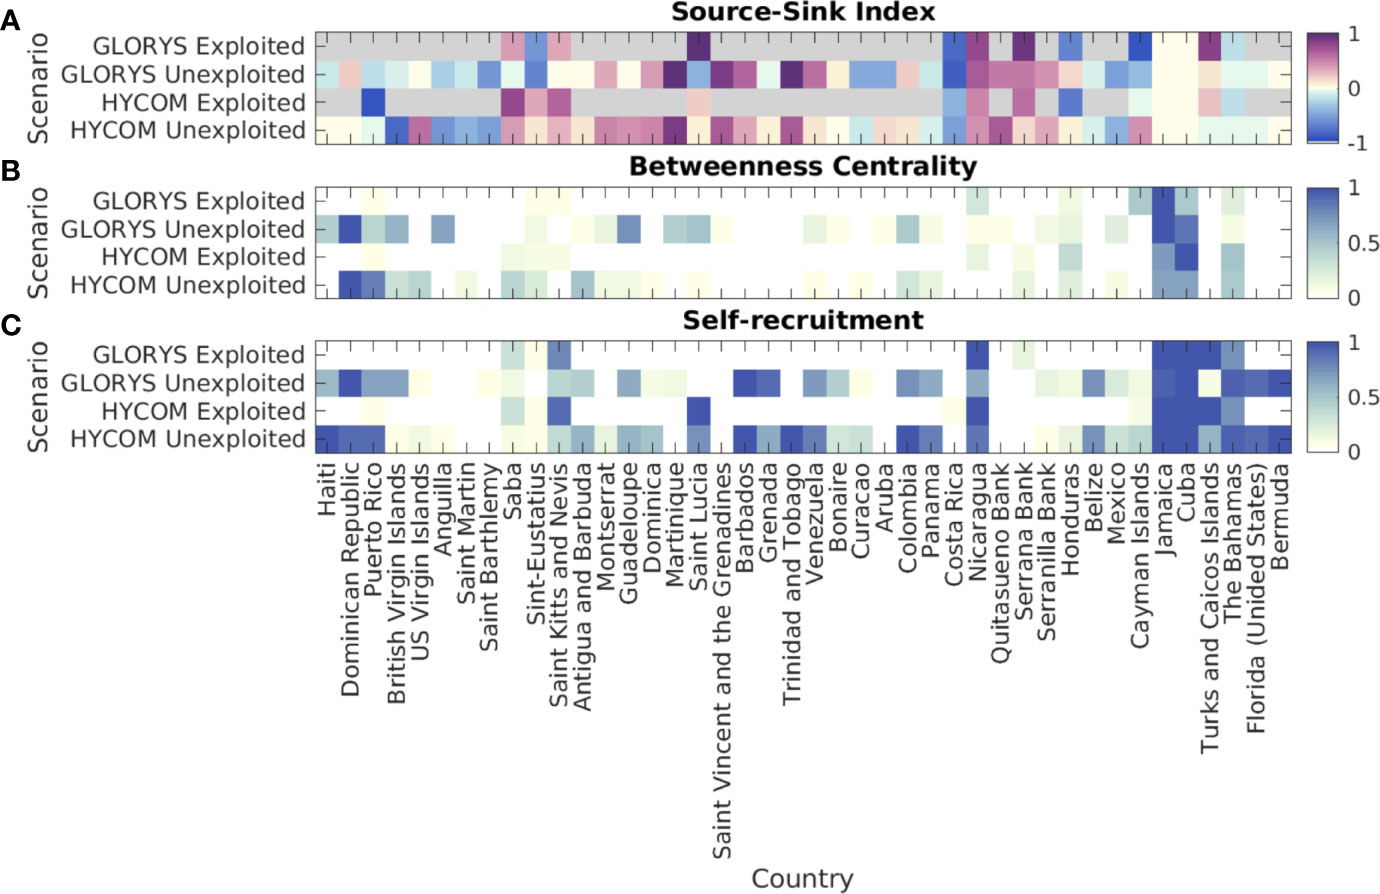
Figure 6 (A) Relative Source-Sink (SS) Index for each jurisdiction in the queen conch network. Positive values of SS Index represent relative source areas while negative represent relative sink areas. (B) Relative betweenness centrality (BC) for each jurisdiction in the queen conch network. BC measures the fraction of shortest paths passing through a node (jurisdiction) - higher values represent most central nodes, or ecological corridors. (C) Probability of self-recruitment for each jurisdiction in the queen conch network, defined as the proportion of settlers spawned locally in each jurisdiction (local settlers over all settlers in a given jurisdiction). Simulations considered two different reproductive output scenarios: 1) unexploited, i.e., uniform spawning for all habitat polygons; and 2) exploited, with spawning scaled by median adult densities reported per jurisdiction. Larvae dispersed with the HYCOM and the GLORYS12v1 velocities. When considering exploited density of adults, areas with no spawning are colored gray on a). Each node represents all polygons from individual jurisdictions, organized in a clockwise direction from Haiti towards Bermuda. Each model’s results are based on 90 releases in the period of five years (2013-2017).
On the other hand, for the scenario considering the maximum connectivity between two countries (Figures 5B, D), spawning occurred in nine additional jurisdictions from the sixteen in the exploited scenario, including the British and US Virgin Islands, Guadeloupe, Colombia, Serranilla Bank, Belize, Mexico, and The Bahamas (Western Great Bahama Bank and Central Great Bahama Bank). As expected, this scenario presented higher connectivity than the exploited scenario (based on median values of densities), although a break in larval transport between the western and eastern Caribbean still emerged, since the centrally located Dominican Republic and Haiti only served as settlement sites and did not support reproductively active populations in this scenario. Several countries also presented a higher likelihood of local settlement in this case, particularly Jamaica, Cuba, The Bahamas, and Colombia. Patterns of transport and local settlement differed between the two hydrodynamic models for the Windward and Leeward Islands, but generally there was a higher likelihood of local settlement for the jurisdictions still reproductively active in this case. The probability of connectivity was still similar for the countries where conch were spawning in the two scenarios. However, in this case, there was much more exchange between the Western Caribbean jurisdictions and a higher likelihood of export of larvae downstream of the local currents, particularly to countries located downstream, such as Mexico and Florida.
Metapopulation
Regional patterns of connectivity between distinct Caribbean and North Atlantic regions showed changes between hydrodynamic models and scenarios (Figure 7 and SI Table 3). The major differences in the unexploited scenario between models were estimated in Cuba, south Florida, the Leeward Antilles, southern Mesoamerica (Costa Rica and Panama), and the southern Leeward Islands for the unexploited scenario and both hydrodynamic models, with six metapopulations. For the HYCOM simulations there were: 1) the Lesser Antilles and Puerto Rico; 2) Venezuela, the Leeward Antilles, northwestern Caribbean, Florida; 3) Haiti, Dominican Republic, The Bahamas, Turks and Caicos Islands; 4) Cuba and Cayman Islands; and 6) Bermuda. For the GLORYS: 1) Western Caribbean, Jamaica, and Cuba; 2) Florida; 3) Puerto Rico and Northern Lesser Antilles; 4) Southern Lesser Antilles; 5) The Bahamas, Turks and Caicos Islands, and Venezuela; and 6) Bermuda.
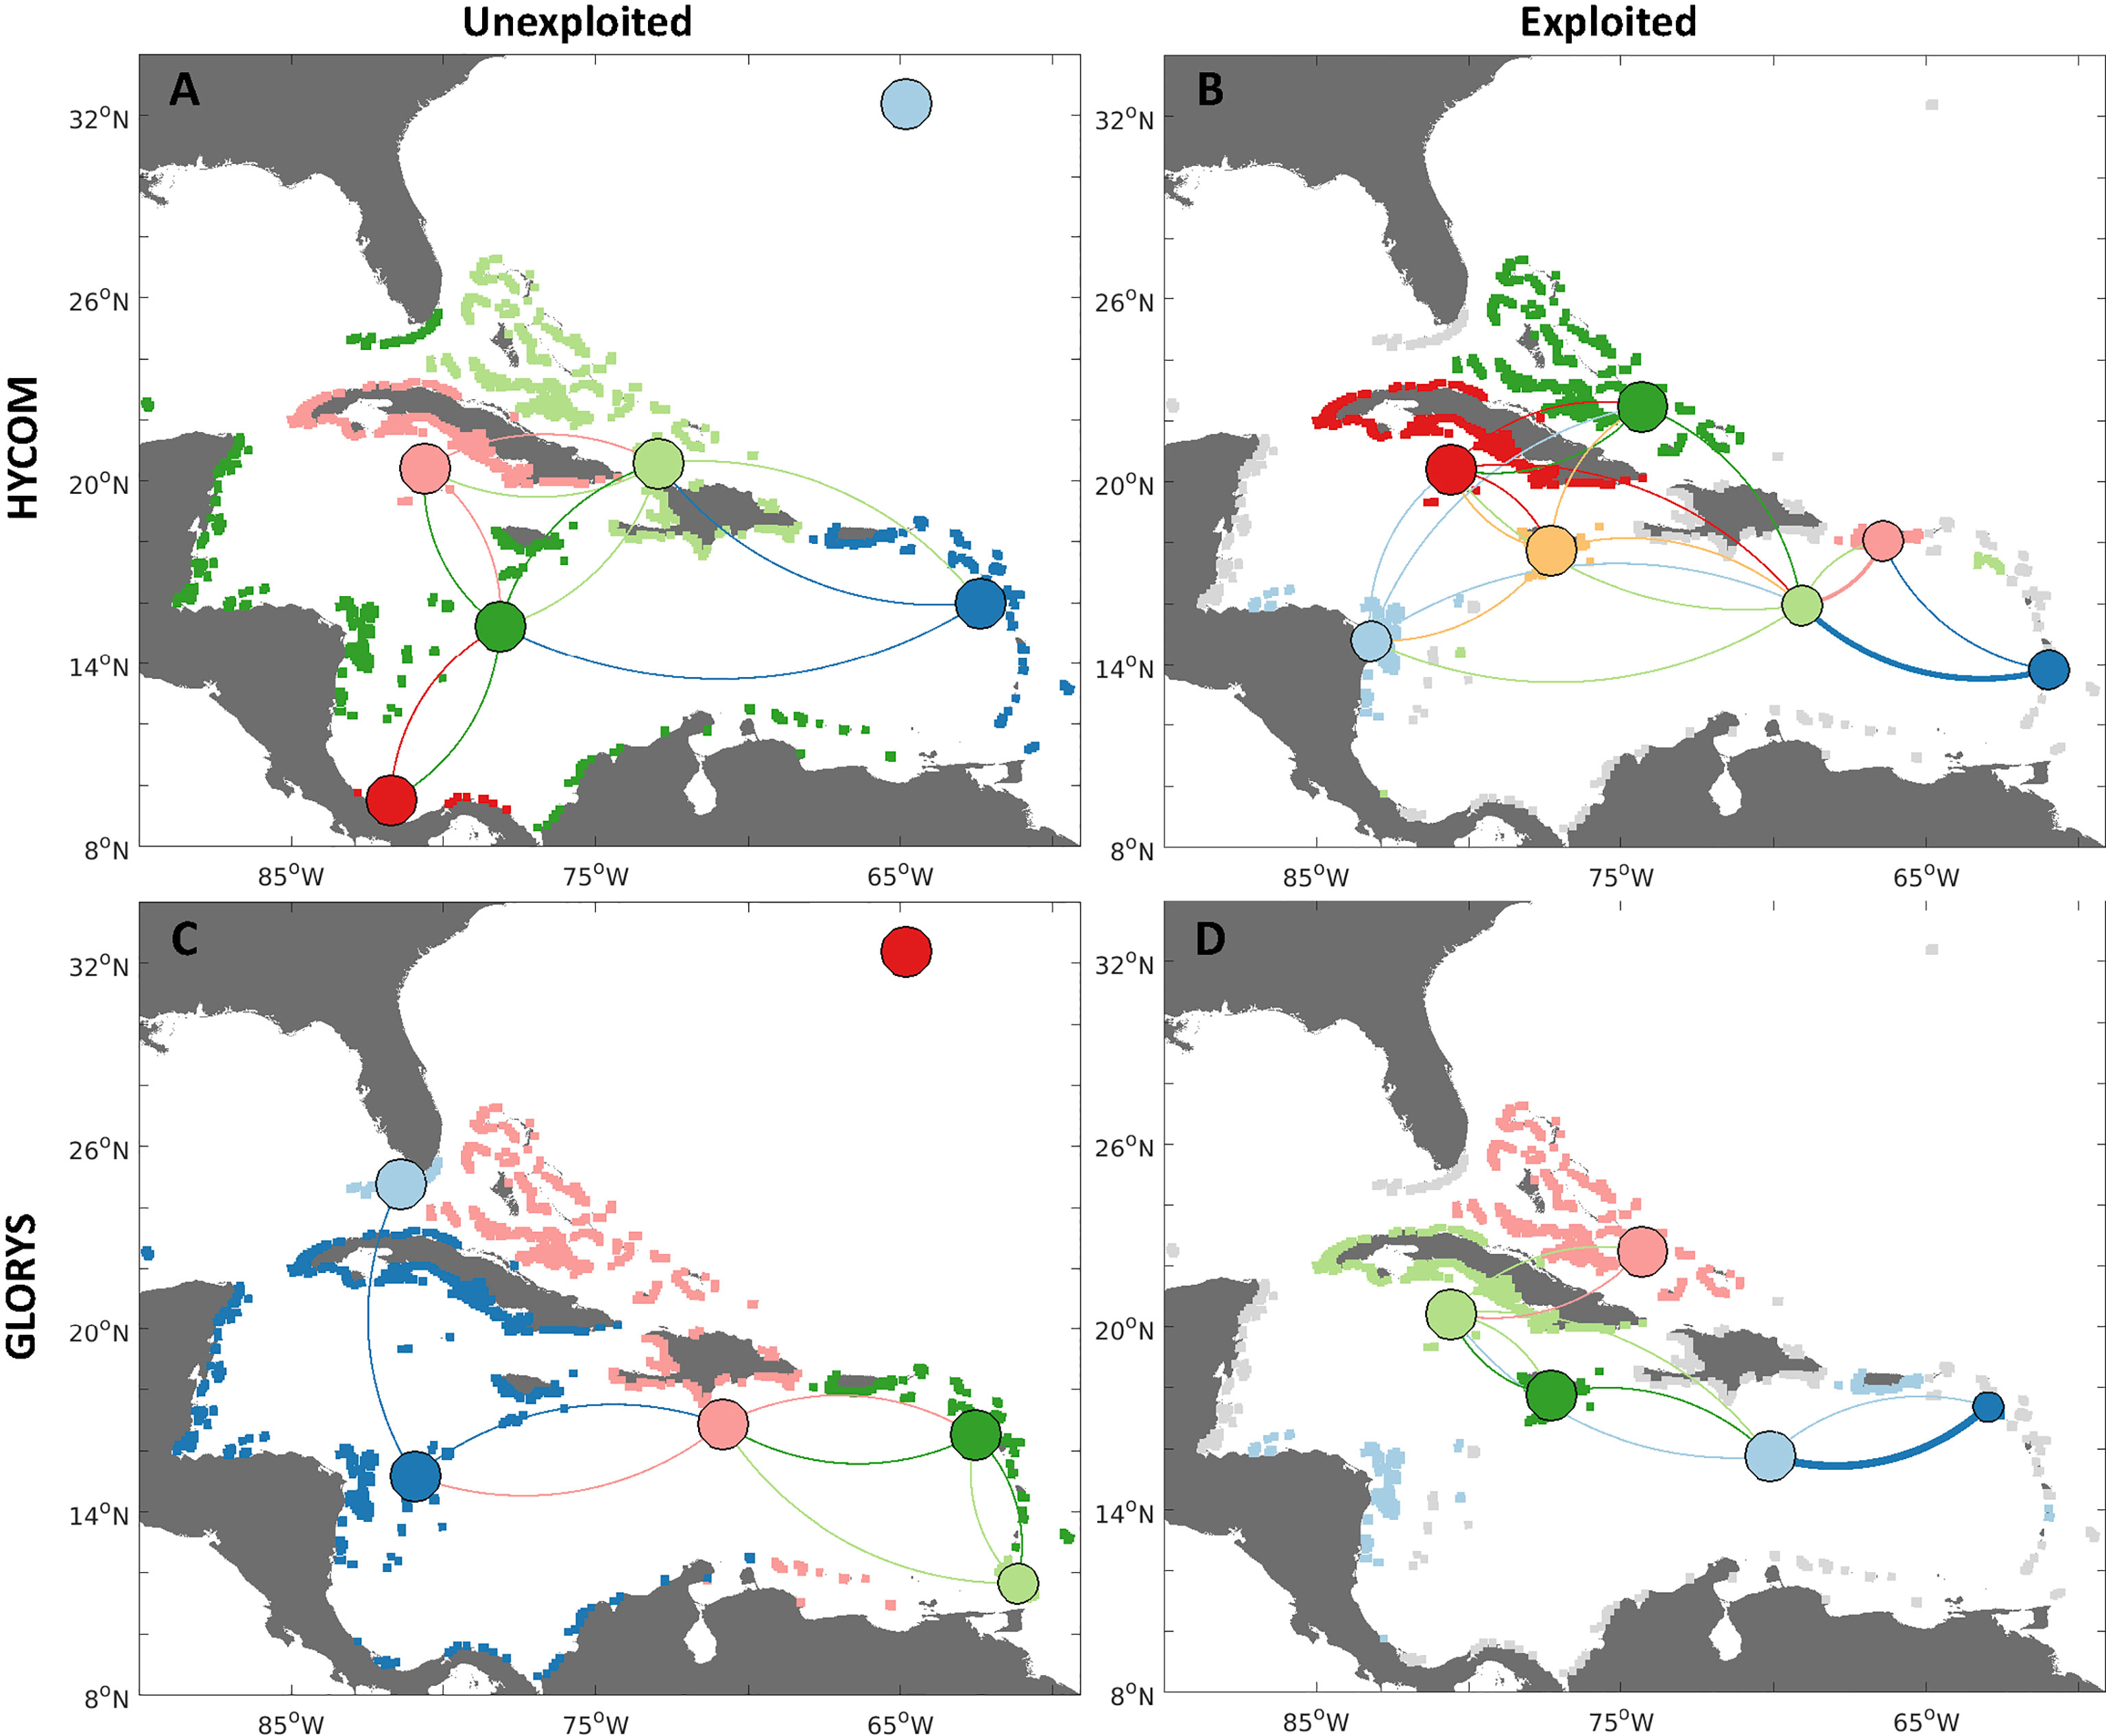
Figure 7 Connectivity network analyses for queen conch metapopulations identified with a minimization algorithm (Jacobi et al., 2012; Garavelli et al., 2014), for two different reproductive output scenarios: 1) unexploited, i.e., uniform spawning for all habitat polygons (A, C left column); and 2) exploited, or spawning scaled by median adult densities reported per jurisdiction (B, D right column). Metapopulations are identified by the habitat polygon colors (gray habitat represents nonreproductive populations, i.e., where no spawning occurs). Larvae are dispersed with HYCOM velocities (A, B, top row), and GLORYS12v1 reanalysis (C, D, bottom row). Edges between nodes represent the strength of connections between regions, whereby the direction of larval flow is given by the clockwise direction - concave edges represent export while convex represents import. Node sizes represent the probability of self-settlement - their location is given by the mean latitude and longitude of all habitat polygons in that specific metapopulation. Colors vary between scenarios, since the number and configuration of metapopulations also change.
When spawning was reduced according to the relative exploited densities of conch, connections were decreased by the lack of spawning in exploited jurisdictions, as particularly evident in Florida, Mexico, Haiti, and the Dominican Republic. However, the entire region was still connected by larval dispersal through connections within the central regions of the network. When exploited densities were considered, there was an increase of metapopulations for the HYCOM (from 6 to 7 metapopulations, SI Table 3) and a decrease for the GLORYS (from 6 to 4 metapopulations). Remarkably, for both models, the jurisdictions harboring the largest conch populations (Cuba, Jamaica, and The Bahamas) became metapopulations by themselves (Jamaica) or only with their nearest neighbors (Cuba and Cayman Islands, The Bahamas, and Turks and Caicos Islands). Both models also diverged in the number of connections exhibited by each node.
The metapopulations obtained with the uncertainty analyses (SI Figure 6) suggested that the metapopulation organization of queen conch is highly dependent on the spatial patterns of reproductive output. The metapopulations obtained with the minimum connectivity (SI Figures 6A, C) were highly distinct for the two hydrodynamic models. While six connected metapopulations were identified for the HYCOM, only two isolated metapopulations emerged for the GLORYS - one encompassing the western Caribbean, and another for the easternmost region (Windward and Leeward Islands and Puerto Rico). For the maximum exchange, the number of metapopulations remained the same for the HYCOM, although with changes to its spatial structure. The number of metapopulations greatly increased for the GLORYS, which showed eight distinct clusters of mostly self-contained habitat. Metapopulations were more similar among the models, i.e., Panama, The Bahamas, and Jamaica were individual metapopulations for both models. Similarly, output from both models resulted in a cluster formed by jurisdictions not exhibiting reproductive activity and that showed a low probability of receiving larval subsidies from other metapopulations.
Ecological and Genetic Connectivity
The origin of settlers at each discrete habitat unit was grouped by the genetic divisions characterized by Truelove et al. (2017, Figure 8). The unexploited spawning scenarios (Figures 8A, B) corresponded well to the patterns observed by Truelove et al. (2017) given that larvae within each region identified by the authors were most likely locally originated. The exception was the high probability of larval exchange between The Bahamas and Turks and Caicos Islands and the Greater Antilles, which occurred for both hydrodynamic models. In the exploited reproductive output scenario, we considered that six of the twelve jurisdictions sampled by Truelove et al. (2017) were not reproductively active. Due to the lack of spawning, it was expected that not all connectivity patterns could be reproduced. Indeed, in this case, the high self-settlement observed for Mexico, Belize, and Florida (Figures 8C, D) was absent due to the lack of reproductive activity. The genetic connectivity analyses subsequently focused only on the results of the unexploited simulations since the results of the exploited density scenario were insignificant due to the reduced number of data points.
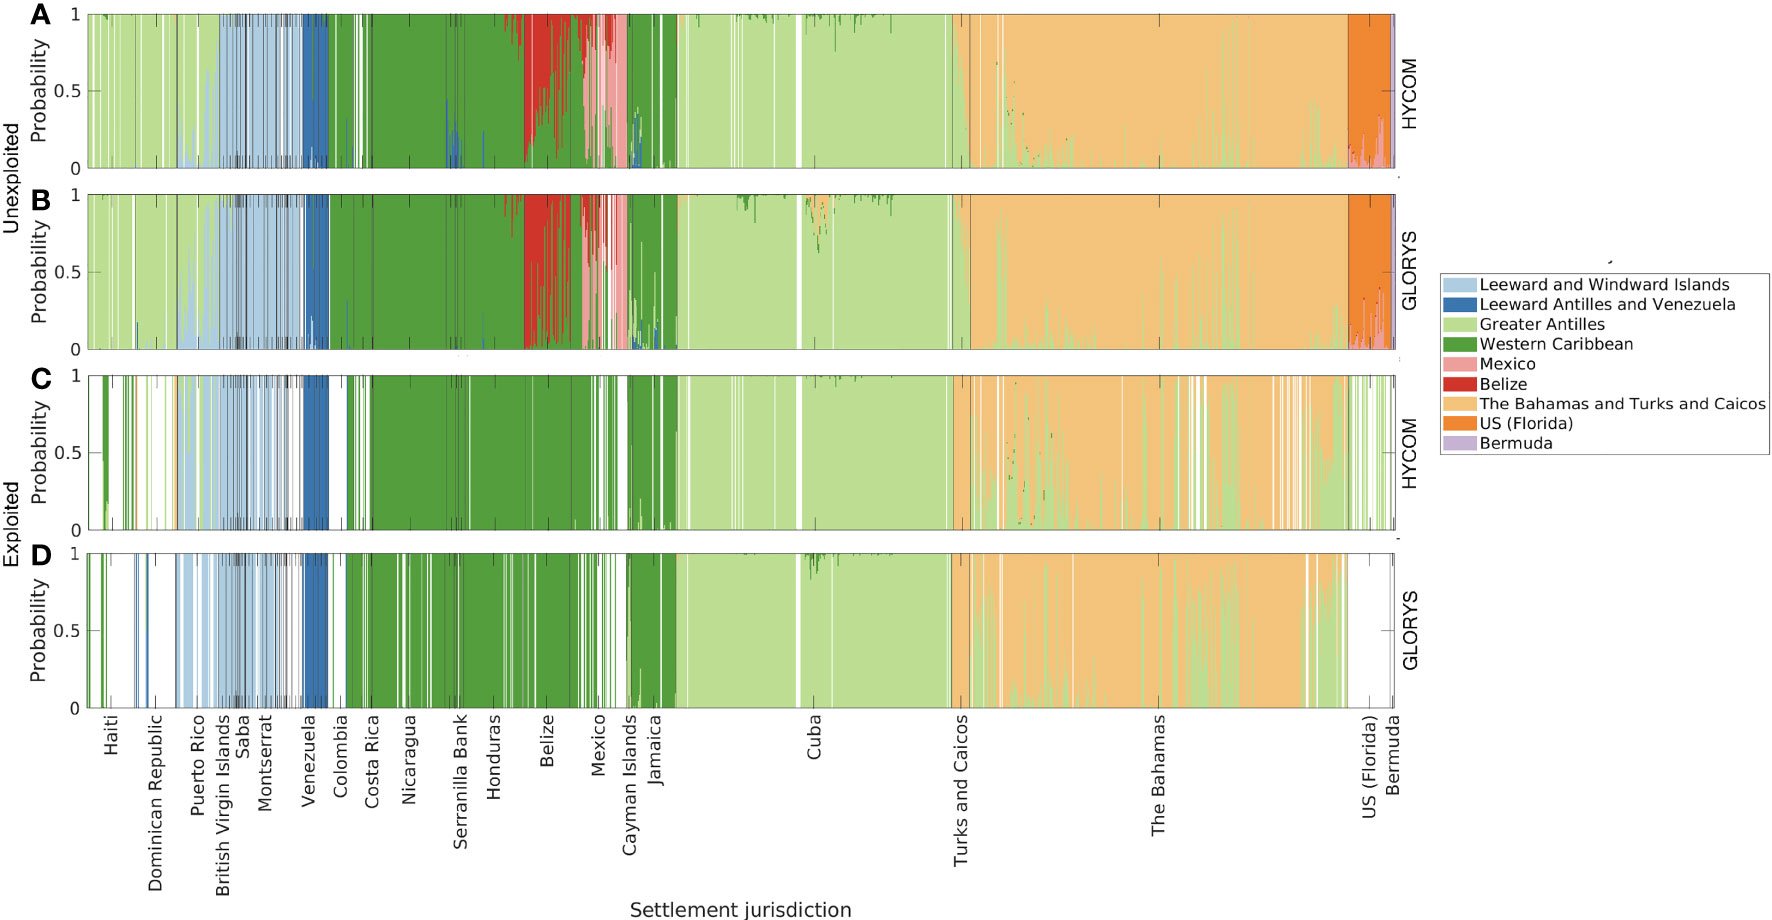
Figure 8 Origin of larvae per settlement polygon, for two different reproductive output scenarios: 1) unexploited, i.e., spawning uniform for all habitat polygons (A, B); and 2) contemporary (exploited), with spawning scaled by median adult densities reported per jurisdiction (C, D). Larvae dispersed with HYCOM (A, C), and GLORYS12v1 (B, D) velocities. Origin areas are relative to genetic divisions identified by Truelove et al., (2017).
The results of the Mantel-r test between GST values from Truelove et al. (2017) and the Nei’s DA genetic distance derived from our connectivity matrices for 10, 50, and 100 generations (SI Table 2) showed that the Mantel-r increased with the number of generations considered. By considering the averages of the Nei’s DA genetic distances calculated for each individual hydrodynamic product, the Mantel-r increased for 50 and 100 generations, while the p decreased. This approach captured the uncertainties of the hydrodynamic field estimated by each individual model and improved our estimations (Figure 9 and SI Figure 7). Results of both the Mantel-r tests (SI Table 2), the scatter plot between the estimated Nei’s DA genetic distances and linearized GSTs from Truelove et al., (2017, Figure 9), and plots of distances between sites (SI Figure 7) suggested that queen conch populations exhibit a distance-by-isolation pattern. Our model explained part of the variability and the consideration of conch specific biological traits improved the results obtained solely by considering oceanographic distances between sites.
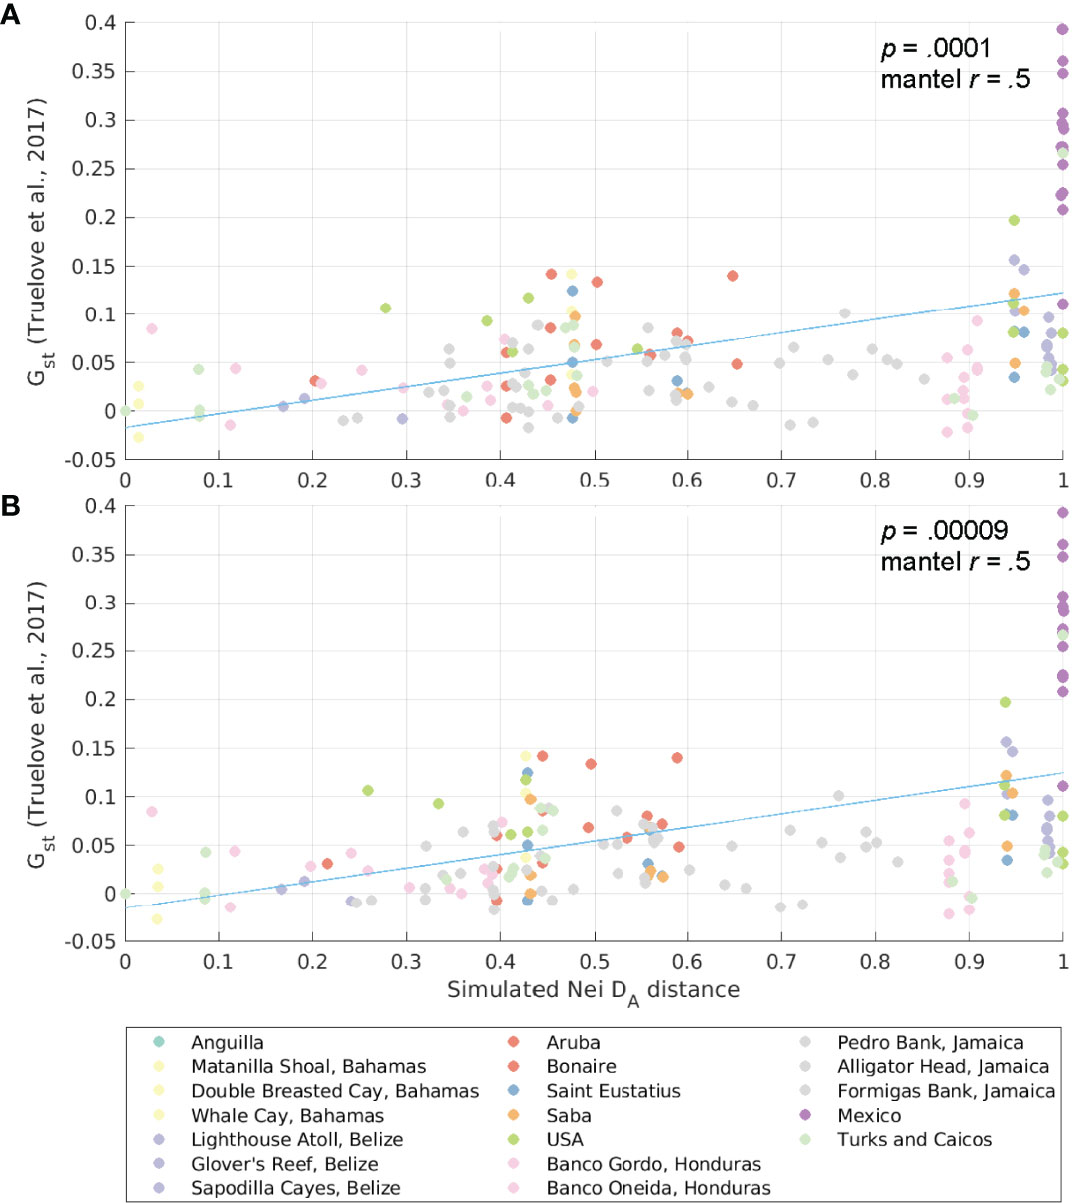
Figure 9 Scatter plot of Nei’s DA genetic distance (from simulations) and pairwise genetic differentiation (linearized GST, based on GST from Truelove et al., 2017) for Aliger gigas. The simulated Nei’s DA genetic distance is an average of the genetic distances obtained with the HYCOM and GLORYS12v1 velocities for (A) 50 generations and (B) 100 generations. The trend line is shown in blue, and dots are color-coded by the sampling jurisdiction (or the source jurisdiction for the larval dispersal model).
Discussion
Connectivity Patterns
The connectivity network (Figure 4) of queen conch for both hydrodynamic models used generally follows the main surface currents in the region - Caribbean Current, Yucatán Current, Loop Current, and Florida Current (Figure 1) - flowing in a clockwise direction from the Lesser Antilles to the Florida Straits. In the northern part of the Greater Antilles, the Antilles Current flowing northwestward favors connections within the Windward and Leeward Islands with the Greater Antilles and Bahamas. Despite the remarkable footprint of this current system, the circulation in the Inter-American Sea is highly variable. The intensity and extension of the currents change at seasonal and inter-annual scales and numerous sub-mesoscale and mesoscale features facilitate recirculation, settlement of larvae close to their spawning sites, and larval exchange with neighboring jurisdictions (Paris and Cowen, 2004; Paris et al., 2005; Kough et al., 2013; Kough et al., 2016; Lopera et al., 2020). Indeed, numerous recurrent gyres are known to occur in the region, notably the semi-permanent cyclonic Panama-Colombia Gyre (Lopera et al., 2020), the transient Honduras and Cozumel Gyres (Carrillo et al., 2015), and the anti-cyclonic gyre around Cayman Islands (Molinari, 1980). Thus, differences in connectivity between the hydrodynamic products reflect the variability of these surface and subsurface flow patterns, particularly around the Lesser and Greater Antilles, which affect the connectivity patterns between The Bahamas, Cuba, and the Windward and Leeward Islands. However, the most apparent differences in connectivity are between our exploitation scenarios, and not between our hydrodynamic products.
The most apparent differences between the unexploited and exploited connectivity emerged from the fact that most jurisdictions were estimated to currently hold conch densities well below the critical threshold for reproduction (Figure 3, Horn et al., 2022), and thus were here considered to be reproductively non-functional (SI Figure 4). These jurisdictions, therefore, could only act as sinks for larvae, not providing larval subsidies for other locations or themselves. The connectivity patterns emerging from the exploited scenarios, considering any range of densities (maximum, minimum, or median Figures 4, 5), are thus drastically different than expected from uniform spawning in the unexploited scenario. For example, due to their up-current position, the Leeward and Windward Islands (i.e., Lesser Antilles) were estimated to be historically important for contributing larval input to other jurisdictions, particularly the Leeward Antilles, Venezuela, and the Greater Antilles. However, due to overfishing, most of these jurisdictions are no longer likely to provide larval subsidies in the exploited scenarios and are relatively isolated from outside replenishment.
Other patterns in comparing the unexploited and exploited simulations were more subtle, but locally significant. For example, historically the Turks and Caicos Islands were estimated to have received subsidies from the Dominican Republic and Haiti. However, due to overfishing in these source jurisdictions, the exploited scenario suggests that the Turks and Caicos Islands are now dependent on reduced local production, which is less likely to be locally retained, with a large percentage of larvae being exported to The Bahamas. Likewise, the unexploited simulation suggests that Florida was dependent on relatively high local retention, with other significant input coming from Mesoamerica (particularly Nicaragua, Belize, and Mexico). These jurisdictions now have estimated densities below the critical reproductive threshold; thus, Florida currently has no significant sources of larvae, except a small likelihood of receiving larvae from Cuba. This could explain why, despite a moratorium on fishing for several decades, Florida’s conch population has not recovered (Delgado and Glazer, 2020).
Heterogeneous fishing pressure and localized depletion also significantly influenced the role of each jurisdiction in the conch network (Figure 6), as exemplified by the changes in the betweenness centrality of the Dominican Republic and Puerto Rico (Figure 6B). These jurisdictions presented some of the highest centrality measures in the unexploited scenario yet no longer function as important connectors in the exploited scenario. An almost complete break in the network was apparent based on the exploited scenario, with the Dominican Republic receiving limited larvae from Cuba, Turks and Caicos Islands, and from a deep mesophotic reef off the west coast of Puerto Rico. The channel between Puerto Rico and the Dominican Republic, the Mona Passage, has been previously shown to act as a transport barrier or filter between these two jurisdictions (Baums et al., 2006; Beltrán et al., 2017). However, the flow in the channel is highly variable (Metcalf et al., 1977), allowing for a small likelihood of periodic connections between populations across the passage (Baums et al., 2006; Beltrán et al., 2017; Prakash et al., 2018, Willis et al., 2022). Since our putative mesophotic spawning site was located at the Abrir La Sierra reef (Garcia-Sais et al., 2012), on the eastern edge of the Mona Passage, it is expected that probabilities of cross-channel connections might be observed in the explored scenario.
While the Dominican Republic and Puerto Rico nodes have been removed from the chain of larval supply, Jamaica and Cuba remained as important connectors in the western portion of the range, and some of the offshore banks in Colombia remained as functional connectors. Although connections have been lost in other locations due to localized overfishing, there were still connection points, albeit reduced, that would allow some exchange of larvae and maintenance of some genetic diversity over time.
Ecological and Genetic Connectivity
Localized patterns of conch overfishing also affected the conch network in the Wider Caribbean Region and could influence both conch demographics and genetic population structure. As shown by the clustering analyses of sub-populations under unexploited and exploited reproductive output (Figure 7 and SI Figure 6), changing the reproductive output dramatically changed metapopulation clusters within the distribution range of queen conch. Comparisons between the GST (from Truelove et al., 2017) and Nei’s DA estimated from the larval dispersal simulations showed that the inclusion of conch life cycle characteristics improved the Mantel-r compared to purely oceanographic distance (Truelove et al., 2017), indicating the importance of considering species-specific biological traits and spatial patterns of fecundity in larval simulation models. By aggregating the estimated Nei’s DA for both hydrodynamic models into an ensemble value, we reduced the uncertainties of the hydrodynamic field improving our connectivity estimations.
In the unexploited scenario, individual settlement habitat units (i.e., polygons) in Mexico and Belize showed a high level of self-recruitment (Figure 6C), which corroborated the genetic patterns observed by Truelove et al. (2017). However, when considering larval exchange probabilities at a jurisdiction level, this pattern was not clear and the populations were not isolated, as also demonstrated by the metapopulations emerging from the metapopulation analyses (Figure 7 and SI Figure 6). Furthermore, these patterns disappear when considering exploited contemporary density estimates of adult conch, highlighting a disconnect between genetic and ecological (or demographic) connectivity of this population.
This disconnect is not unexpected since genetic and ecological connectivity explore processes spanning different spatiotemporal scales. The ecological connectivity covers the shorter scales of early planktonic stages, examining the exchange of individuals between populations (Kough et al., 2017). Typical studies of genetic connectivity unveil patterns occurring through multiple generations or even evolutionary timescales and characterize the gene flow between these populations (Thomas et al., 2014; Brown et al., 2017; Carr et al., 2017). Whereas simulations of larval dispersal can inform the evolutionary connectivity of organisms, characterizing, for instance, transport barriers and isolated populations (Cowen et al., 2006; Baums et al., 2006; Truelove et al., 2017), dispersal models are particularly useful to help elucidate patterns of ecological connectivity (Jones et al., 2009). Indeed, our results reflect the different spatial-temporal scales unveiled by the genetic and ecological connectivity. By comparing similarities for multiple generations obtained from the unexploited scenarios to genetic divergence (linearized GST), we found these to be significantly correlated. However, once we considered localized depletion patterns, these correlations disappeared, suggesting that the genetic results reported by Truelove et al. (2017) could have captured patterns of connectivity that no longer exist under the (conservative) depletion scenarios considered in our study.
Management Implications
The objective of this study was to explore how localized harvest patterns affect the probabilistic ecological connectivity of the queen conch throughout its range. The lack of detailed demographic and habitat information (e.g., population distribution, age structure, adult densities, fecundity, carrying capacities) precludes a direct estimation of the strength of larval recruitment. Regional cooperative management efforts have advocated for a more consistent and uniform collection of these data across the WCR (Prada et al., 2017). These data would allow us to calculate the persistence and replenishment rates of individual populations (Leis, 2006; Burgess et al., 2014; Lowerre-Barbieri et al., 2017; Hamilton et al., 2021). Moreover, the interpretation of ecological and genetic connectivity has important spatial management implications. While small and sporadic exchanges of a few individuals might lead to panmixia of distant sub-populations, a population requires a steady and strong source of larval subsidies for its support (Wright, 1931; Botsford et al., 2003; Lowe and Allendorf, 2010; Paris-Limouzy, 2011; Hawkins et al., 2017). Therefore, ecological connectivity projections provide vital information for management by delineating areas that are self-reliant on their recruits to support their populations and in identifying relative sources and sinks (Botsford et al., 2003; Botsford et al., 2009; Hawkins et al., 2016).
Here, we characterized distinct metapopulation delineations for queen conch for the scenarios considered in our study (distinct hydrodynamic models and assumptions of adult densities) throughout its range. The existence of these self-sustained metapopulations implies the need for effective management measures within these regions. Here we showed that configuration of such metapopulations is strongly affected by localized depletion patterns, more so than by oceanographic patterns, given the changes in the metapopulation configurations in the homogenous and depleted scenarios (Figure 7). As these metapopulations cover multiple jurisdictions, their management would thus require international cooperation (Kough et al., 2017).
Connectivity processes have been explored in many studies using larval dispersal simulations in the last decades; however, studies still consider uniform spawning populations, despite the noted importance of the effects of variable spatio-temporal fecundity on connectivity patterns (Hughes and Tanner, 2000; Karnauskas et al., 2011; Lowerre-Barbieri et al., 2017; Castorani et al., 2017; Johnston et al., 2018; Hamilton et al., 2021). We found that the inclusion of realistic present-day patterns in reproductive output changes connectivity patterns and the structuring of queen conch sub-populations and metapopulations across their range, which must be considered in future studies.
Overharvest not only can change the patterns of connectivity, as addressed in this study, but also lower the genetic diversity of fisheries populations (Pinsky and Palumbi, 2014). A reduction in diversity due to conch overharvest has been suggested by Zamora-Bustillos et al. (2011) investigating genetic diversity and structure of two populations along the Yucatán peninsula in Mexico, and by Kitson-Walters et al. (2018) studying the genetic differentiation within the Jamaican EEZ. Truelove et al. (2017) also observed a reduction in allele frequencies in Mexico and Anguilla, however, it is unclear whether these changes are due to isolation by distance, regional overharvest, local overharvest, or their combined effect. The results of our theoretical “virgin stock” simulations, however, suggested that there are no complete barriers to conch larval transport in our study area and thus, exploited patterns of isolation and inbreeding could be related to anthropogenic actions, such as habitat destruction and overharvest. This is a topic which warrants further investigation.
The simulations relied on several assumptions regarding the spatial structure and demographics of conch populations in the Caribbean. As illustrated by our results (Figures 4-7), estimated ecological connectivity patterns are sensitive to assumptions regarding both the distributions of queen conch populations and their reproductive output. Thus, we highlight the need for updated demographic and habitat information for queen conch, strongly corroborating needs identified in previous studies (Prada et al., 2017; Kough et al., 2017; Truelove et al., 2017; Kitson-Walters et al., 2018; Boman et al., 2021). To refine larval connectivity estimates and fully understand conch demographics – at both broad and smaller spatial scales within jurisdictions – the following are needed: 1) representative surveys of conch population densities across a range of habitats, along with a precise understanding of the areas over which these densities can be extrapolated (Prada et al., 2017; Kough et al., 2017); 2) densities of individuals categorized as juveniles and adults and/or detailed stock size structure reported; 3) detailed maps and/or areal estimates of conch habitat (i.e., areas where the species currently or has historically occurred) in each jurisdiction; and 4) surveys of conch populations located in depths below the typical range of fishing (i.e., >30m) to assess the contribution of mesophotic populations that might serve as deep refugia for shallow populations and which remain largely excluded from conch surveys (Boman et al., 2021).
Overall, our results support that estimates of contemporary demographic rates, and thus of fecundity, need to be considered for ecological connectivity studies (Lowe and Allendorf, 2010; Castorani et al., 2017; Johnston et al., 2018). Moreover, our results strongly corroborate advice for international management and conservation of queen conch, as well as research needs identified in previous conch studies (Prada et al., 2017; Kough et al., 2017; Stoner et al., 2019; Delgado and Glazer 2020; Boman et al., 2021). However, given the high likelihood of local settlement and distribution of distinct metapopulations, replenishment processes through larval dispersal are likely to occur only within the metapopulation spatial scales. Our simulations showed that local sub-population success would depend on effective local management, but also on the management of specific upstream source populations. The combination of local self-seeding and distant larval transport are both required for success throughout the species’ range. Regional management efforts are working to implement many of the management plans and measures detailed by Prada and collaborators (2017). Local measures of conservation and management are thus critical to protect individual reproductively active sub-populations and nursery habitat across multiple jurisdictions.
Data Availability Statement
The raw data supporting the conclusions of this article will be made available by the authors, without undue reservation.
Author Contributions
AV, MK, NF contributed to conception and design of the study. All authors contributed to literature review, acquisition of data, and/or methods for the work. AV ran simulations, AV and MK did statistical analyses. All authors contributed to interpretation of results. AV and MK drafted the manuscript. All authors contributed to manuscript review, read, and approved the submitted version.
Funding
This research was carried out in part under the auspices of the Cooperative Institute for Marine and Atmospheric Studies (CIMAS), a Cooperative Institute of the University of Miami and the National Oceanic and Atmospheric Administration, cooperative agreement # NA20OAR4320472. The Paris Lab (UM) contributed with funding for AV.
Author Disclaimer
The scientific results and conclusions, as well as any views or opinions expressed herein, are those of the author(s) and do not necessarily reflect those of NOAA or the Department of Commerce.
Conflict of Interest
The authors declare that the research was conducted in the absence of any commercial or financial relationships that could be construed as a potential conflict of interest.
Publisher’s Note
All claims expressed in this article are solely those of the authors and do not necessarily represent those of their affiliated organizations, or those of the publisher, the editors and the reviewers. Any product that may be evaluated in this article, or claim that may be made by its manufacturer, is not guaranteed or endorsed by the publisher.
Acknowledgments
We wish to thank scientists and managers that shared information and feedback that improved our manuscript. Particularly, we thank Dr. Andrew Kough, Dr. Robert Glazer, Mr. Gabriel Delgado, Mr. Joe Heublein, Dr. Allan Stoner, Dr. Dalila Aldana Aranda, and Dr. Megan Davis for sharing their knowledge, data, and publications. We thank Dr. Allan Stoner, Dr. Dalila Aldana Aranda, and Dr. Martha Prada for their review of an early draft of this manuscript, which greatly contributed to our work.
Supplementary Material
The Supplementary Material for this article can be found online at: https://www.frontiersin.org/articles/10.3389/fmars.2022.841027/full#supplementary-material
References
Aiken K., Kong A., Smikle S., Appeldoorn R., Warner G. (2006). Managing Jamaica's Queen Conch Resources. Ocean. Coast. Manag. 49, 332–341. doi: 10.1016/j.ocecoaman.2006.03.004
Aldana-Aranda D., Baqueiro-Cárdenas E. R., Martínez Morales I., Ochoa R. I., Brulé T. (2003). “Reproductive Patterns of Strombus Gigas From Alacranes Reef Versus Chinchorro Bank of Mexico,” in Proceedings of the 54th Gulf and Caribbean Fisheries Institute, vol. volume 54. (North Fort Pierce, FL: Gulf and Caribbean Fisheries Institute), Pages 202–225.
Aldana-Aranda D., Chávez-Villegas J. F., Sánchez Crespo M. (2014). Is the Queen Conch Strombus Gigas (Mesogastropoda: Strombidae) a Species With Allee Effect? Rev. Biol. Trop. 62 (3), 207–213. doi: 10.15517/rbt.v62i0.15915
Allee W. C. (1931). “Animal Aggregations,” in A Study in General Sociology (Chicago, IL: The University of Chicago Press).
Allen Coral Atlas (2020). Imagery, Maps and Monitoring of the World's Tropical Coral Reefs. doi: 10.5281/zenodo.3833242
Andréfouët S. (2008). Coral Reef Habitat Mapping Using Remote Sensing: A User vs Producer Perspective. Implications for Research, Management and Capacity Building. J. Spat. Sci. 53, 113–129. doi: 10.1080/14498596.2008.9635140
Appeldoorn R. S. (1985). Growth, Mortality and Dispersion of Juvenile, Laboratory-Reared Conchs, Strombus Gigas and S. Costatus, Released at an Offshore Site. Bull. Mar. Sci. 37 (3), 785–793.
Appeldoorn R. S. (1993). Reproduction, Spawning Potential Ratio and Larval Abundance of Queen Conch Off La Parguera, Puerto Rico. University of Puerto Rico (San Juan, Puerto Rico, Mayaguez, Puerto Rico: Department of Marine Sciences, Manuscript Report to Caribbean Fishery Management Council).
Appeldoorn R. S., Baker N. E. (2013). A literature review of the queen conch, Strombus gigas. (University of Puerto Rico, Department of Marine Sciences: Mayaguez, Puerto Rico)
Appeldoorn R. S. (2020). Size at Maturation, Spawning Variability, and Fecundity in the Queen Conch, Aliger Gigas. Gulf. Caribb. Res. 31(1), GCFI 10–GCFI 19. doi: 10.18785/GCR.3101.11
Avila-Poveda O. H., Baqueiro-Cárdenas E. R. (2009). Reproductive Cycle of Strombus Gigas Linnaeus 1758 (Caenogastropoda: Strombidae) From Archipelago of San Andres, Providencia and Santa Catalina, Colombia. Invertebr. Reprod. Dev. 53 (1), 1–12. doi: 10.1080/07924259.2009.9652284
Barile P. J., Stoner A. W., Young C. M. (1994). Phototaxis and Vertical Migration of the Queen Conch (Strombus Gigas Linne) Veliger Larvae. J. Exp. Mar. Biol. Ecol. 183 (2), 147–162. doi: 10.1016/0022-0981(94)90084-1
Baums I. B., Paris C. B., Chérubin L. M. (2006). A Bio-Oceanographic Filter to Larval Dispersal in a Reef-Building Coral. Limnol. Oceanogr. 51 (5), 1969–1981. doi: 10.4319/lo.2006.51.5.1969
Beltrán D. M., Schizas N. V., Appeldoorn R. S., Prada C. (2017). Effective Dispersal of Caribbean Reef Fish is Smaller Than Current Spacing Among Marine Protected Areas. Sci. Rep. 7 (1), 1–10. doi: 10.1038/s41598-017-04849-5
Berg J. C. J., Couper F., Nisbet K., Ward J. (1992). “Stock Assessment of Queen Conch, Strombus Gigas, and Harbour Conch, S. Costatus, in Bermuda,” in Proceedings of the 41st Gulf and Caribbean Fisheries Institute, vol. volume 41. (North Fort Pierce, FL: Gulf and Caribbean Fisheries Institute), Pages 433–438.
Bissada CE (2012). Aspects of the biology of queen conch, Strombus gigas, in Barbados with implications for fisheries management. MS thesis, University of the West Indies. 105 p.
Blythe-Mallett A., Aiken K. A., Segura-Garcia I., Truelove N. K., Webber M. K., Roye M. E., et al. (2021). Genetic Composition of Queen Conch (Lobatus Gigas) Population on Pedro Bank, Jamaica and Its Use in Fisheries Management. PloS One 16 (4), e0245703. doi: 10.1371/journal.pone.0245703
Bodmer W. F., Cavalli-Sforza L. L. (1968). A Migration Matrix Model for the Study of Random Genetic Drift. Genetics 59 (4), 565–592. doi: 10.1093/genetics/59.4.565
Boidron-Metairon I. F. (1992). “A New Approach to Comparative Studies of Strombus Gigas Larvae at the Developmental and Nutritional Levels,” in Proceedings of the 41st Gulf and Caribbean Fisheries Institute, vol. volume 41. (North Fort Pierce, FL: Gulf and Caribbean Fisheries Institute), Pages 459–467.
Boman E. M., Bervoets T., de Graaf M., Dewenter J., Maitz A., Meijer Zu Schlochtern M. P., et al. (2019). Diet and Growth of Juvenile Queen Conch Lobatus Gigas (Gastropoda: Strombidae) in Native, Mixed and Invasive Seagrass Habitats. Mar. Ecol. Prog. Ser. 621, 143–154. doi: 10.3354/meps12990
Boman E. M., de Graaf M., Kough A. S., Izioka-Kuramae A., Zuur A. F., Smaal A., et al. (2021). Spatial Dependency in Abundance of Queen Conch, Aliger Gigas, in the Caribbean, Indicates the Importance of Surveying Deep-Water Distributions. Diversity Distrib. 3, 1–13. doi: 10.1111/ddi.13392
Boman E. M., de Graaf M., Nagelkerke L. A. J., Stoner A. W., Bissada C. E., Avila-Poveda O. H., et al. (2018). Variability in Size at Maturity and Reproductive Season of Queen Conch Lobatus Gigas (Gastropoda: Strombidae) in the Wider Caribbean Region. Fish. Res. 201, 18–25. doi: 10.1016/j.fishres.2017.12.016
Botsford L. W., Micheli F., Hastings A. (2003). Principles for the Design of Marine Reserves. Ecol. Appl. 13 (1), 25–31. doi: 10.1890/1051-0761(2003)013[0025:PFTDOM]2.0.CO;2
Botsford L. W., White J. W., Coffroth M. A., Paris C. B., Planes S., Shearer T. L., et al. (2009). Connectivity and Resilience of Coral Reef Metapopulations in Marine Protected Areas: Matching Empirical Efforts to Predictive Needs. Coral. Reef. 28 (2), 327–337. doi: 10.1007/s00338-009-0466-z
Brito Manzano N., Aldana-Aranda D. (2004). Development, Growth and Survival of the Larvae of Queen Conch Strombus Gigas Under Laboratory Conditions. Aquaculture 242, 479–487. doi: 10.1016/j.aquaculture.2004.06.035
Brownell W. N. (1977). Reproduction, Laboratory Culture, and Growth of Strombus Gigas, S. Costatus and S. Pugilus in Los Roques, Venezuela. Bull. Mar. Sci. 27 (4), 668–680. https://www.ingentaconnect.com/content/umrsmas/bullmar/1977/00000027/00000004/art00004
Burgess S. C., Nickols K. J., Griesemer C. D., Barnett L. A. K., Dedrick A. G., Satterthwaite E. V., et al. (2014). Beyond Connectivity: How Empirical Methods Can Quantify Population Persistence to Improve Marine Protected-Area Design. Ecol. Appl. 24(2), 257–270. doi: 10.1890/13-0710.1
Cala Y. R., de Jesús-Navarrete A., Ocaña F. A., Oliva-Rivera J. (2013). Density and Reproduction of the Queen Conch Eustrombus Gigas (Mesogastropoda: Strombidae) at Cabo Cruz, Desembarco Del Granma National Park, Cuba. Rev. Biol. Trop. 61 (2), 645–655. doi: 10.15517/rbt.v61i2.11165
Campton D. E., Berg C. J. Jr., Robison L. M., Glazer R. A. (1992). Genetic Patchiness Among Populations of Queen Conch Strombus Gigas in the Bimini. Fish. Bull. 90(2), 250–259.
Carrillo L., Johns E. M., Smith R. H., Lamkin J. T., Largier J. L. (2015). Pathways and Hydrography in the Mesoamerican Barrier Reef System. Part 1: Circulation. Conti. Shelf. Res. 109, 164–176. doi: 10.1016/j.csr.2015.09.014
Carr M. H., Robinson S. P., Wahle C., Davis G., Kroll S., Murray S., et al. (2017). The Central Importance of Ecological Spatial Connectivity to Effective Coastal Marine Protected Areas and to Meeting the Challenges of Climate Change in the Marine Environment. Aquat. Conserv.: Mar. Freshw. Ecosyst. 27, 6–29. doi: 10.1002/aqc.2800
Castorani M. C. N., Reed D. C., Raimondi P. T., Alberto F., Bell T. W., Cavanaugh K. C., et al. (2017). Fluctuations in Population Fecundity Drive Variation in Demographic Connectivity and Metapopulation Dynamics. Proc. R. Soc. B.: Biol. Sci. 284 (1847), 20162086. doi: 10.1098/rspb.2016.2086
Chaplin J., Sandt V. J. (1992). “Vertical Migration and Distribution of Queen Conch Veligers: Progress Report,” in Proceedings of the 42nd Gulf and Caribbean Fisheries Institute, vol. volume 42. (North Fort Pierce, FL: Gulf and Caribbean Fisheries Institute), Pages 158–160.
Chassignet E. P., Hurlburt H. E., Smedstad O. M., Halliwell G. R., Hogan P. J., Wallcraft A. J., et al. (2007). The HYCOM (Hybrid Coordinate Ocean Model) Data Assimilative System. J. Mar. Syst. 65, 60–83. doi: 10.1016/j.jmarsys.2005.09.016
Corral J. L., Ogawa J. (1987). “Cultivo Masivo De Larva De Caracol Strombus Gigas En Estanques De Concreto,” in Proceedings of the 38th Gulf and Caribbean Fisheries Institute, vol. volume 38. (North Fort Pierce, FL: Gulf and Caribbean Fisheries Institute), Pp. 345–352.
Coulston M. L., Berey R. W., Dempsey A. C., Odum P. (1987). “Assessment of the Queen Conch (Strombus Gigas) Population and Predation Studies of Hatchery Reared Juveniles in Salt River Canyon, St. Croix, U.s. Virgin Islands,” in Proceedings of the 38th Gulf and Caribbean Fisheries Institute, vol. volume 38. (North Fort Pierce, FL: Gulf and Caribbean Fisheries Institute), Pages 294–306.
Courchamp F., Clutton-Brock T., Grenfell B. (1999). Inverse Density Dependence and the Allee Effect. Trends Ecol. Evol. 14 (10), 405–410. doi: 10.1016/S0169-5347(99)01683-3
Cowen R. K., Paris C. B., Srinivasan A. (2006). Scaling of Connectivity in Marine Populations. Science 311 (5760), 522–527. doi: 10.1126/science.1122039
Cruz S. ,. R. (1986). “Avances En La Experimentacion De Producción Massiva De Coracol En Quintana Roe, Mexico,” in Proceedings of the 37th Gulf and Caribbean Fisheries Institute, vol. volume 37. (North Fort Pierce, FL: Gulf and Caribbean Fisheries Institute), Pages 12–20.
Cummings J. A., Smedstad O. M. (2013). “VariationalData Assimilation for the Global Ocean,” in Data Assimilation for Atmospheric, Oceanic and Hydrologic Applications. Eds. Park S. K., Xu L. (Berlin, Heidelberg: Springer Berlin Heidelberg), 303–343.
D'Asaro C. N. (1965). Organogenesis, Development, and Metamorphosis in the Queen Conch, Strombus Gigas, With Notes on Breeding Habits. Bull. Mar. Sci. 15 (2), 359–416.
Davis M. (1994a). “Mariculture Techniques for Queen Conch (Strombus Gigas Linne): Egg Mass to Juvenile Stage,” in Queen Conch Biology, Fisheries and Mariculture. Eds. Appeldoom R. S., Rodriguez B. (Caracas, Venezuela: Fundacion Cientıfica Los Roques), Pages 231–252.
Davis M. (1994b). Short-Term Competence in Larvae of Queen Conch Strombus Gigas: Shifts in Behavior, Morphology and Metamorphic Response. Mar. Ecol. Prog. Ser. 104 (1–2), 101–108. doi: 10.3354/meps104101
Davis M. (2000). The Combined Effects of Temperature and Salinity on Growth, Development, and Survival for Tropical Gastropod Veligers of Strombus Gigas. J. Shellf. Res. 19 (2), 883–890.
Davis M. (2005). Species Profile: Queen Conch, Strombus Gigas (Southern Regional Aquaculture Center Publication No. 7203:College Station, TX.).
Davis M., Bolton C. A., Stoner A. W. (1993). A Comparison of Larval Development, Growth, and Shell Morphology in Three Caribbean Strombus Species. Veliger 36, 236–244. https://www.biodiversitylibrary.org/item/134374#page/256/mode/1up
Davis M., Hodgkins G. A. A., Stoner A. W. (1996). A Mesocosm System for Ecological Research With Marine Invertebrate Larvae. Mar. Ecol. Prog. Ser. 130, 97–104. doi: 10.3354/meps130097
Davis M., Mitchell B. A., Brown J. L. (1984). Breeding Behavior of the Queen Conch Strombus Gigas Linné Held in a Natural Enclosed Habitat. J. Shellf. Res. 4 (1), 17–21.
Davis M., Stoner A. W. (1994). Trophic Cues Induce Metamorphosis of Queen Conch Larvae (Strombus Gigas Linnaeus). J. Exp. Mar. Biol. Ecol. 180 (1), 83–102. doi: 10.1016/0022-0981(94)90081-7
de Graaf M., Meijer zu Schlochteren M., Boman E. K. (2014). Non-Detriment Finding Regarding the Export of Queen Conch (Lobatus Gigas) From St Eustatius (Caribbean Netherlands). Insti. Mar. Resour. Ecosyst. Stud.IMARES (Report C173/14:Wageningen, Netherlands)
de Graaf M., Piontek S., Miller D. C.M., Brunel T., Nagelkerke L. A.J. (2015). Status and Trends of St. Eustatius Coral Reef Ecosystem and Fisheries. 2015 report card. Imares, 1–41. http://edepot.wur.nl/367856
Delgado G. A., Glazer R. A. (2020). Demographics Influence Reproductive Output in Queen Conch (Lobatus Gigas): Implications for Fishery Management. Bull. Mar. Sci. 96 (4), 707–721. doi: 10.5343/bms.2019.0098
Doerr J. C., Hill R. L. (2013). Home Range, Movement Rates, and Habitat Use of Queen Conch, Strombus Gigas, in St. John, US Virgin Islands. Caribb. J. Sci. 47 (2-3), 251–259. doi: 10.18475/cjos.v47i3.a13
Doerr J. C., Hill R. L. (2018). Spatial Distribution, Density, and Habitat Associations of Queen Conch Strombus Gigas in St. Croix, US Virgin Islands. Mar. Ecol. Prog. Ser. 594, 119–133. doi: 10.3354/meps12547
Drury C., Paris C. B., Kourafalou V. H., Lirman D. (2018). Dispersal Capacity and Genetic Relatedness in Acropora Cervicornis on the Florida Reef Tract. Coral. Reef. 37 (2), 585–596. doi: 10.1007/s00338-018-1683-0
Farmer N. A., Doerr J. C. (2022). Limiting Factors for Queen Conch (Lobatus Gigas) Reproduction: A Simulation-Based Evaluation. PloS One 17 (3), e0251219. doi: 10.1371/journal.pone.0251219
Flanders Marine Institute (2019) Maritime Boundaries Geodatabase: Internal Waters, Version 3. Available at: https://www.marineregions.org/.
Foster N. L., Paris C. B., Kool J. T., Baums I. B., Stevens J. R., Sanchez J. A., et al. (2012). Connectivity of Caribbean Coral Populations: Complementary Insights From Empirical and Modelled Gene Flow. Mol. Ecol. 21 (5), 1143–1157. doi: 10.1111/j.1365-294X.2012.05455.x
Garavelli L., Kaplan D. M., Colas F., Stotz W., Yannicelli B., Lett C. (2014). Identifying Appropriate Spatial Scales for Marine Conservation and Management Using a Larval Dispersal Model: The Case of Concholepas Concholepas (Loco) in Chile. Progress in Oceanography, 124, 42–53. doi: 10.1016/j.pocean.2014.03.011.
García-Escobar M. I., Mow-P J. M., Cantera-K J. R., Pineda-P F. H. (1992). The Study of the Populations of the Queen Conch (Strombus Gigas) With Fisheries Management Implications in the Different Areas of the Archipelago of San Andres and Providencia, Colombia. Proc. Gulf. Caribb. Fish. Inst. 42, 172–189.
Garcia-Sais J. R., Sabater-Clavell J., Esteves R., Carlo M. (2012). “Fishery Independent Survey of Commercially Exploited Fish and Shellfish Populations From Mesophotic Reefs Within the Puerto Rican Eez,” in Final Report Submitted to CFMC, 91 pp. San Juan, Puerto Rico
Gascoigne J., Lipcius R. N. (2004). Conserving Populations at Low Abundance: Delayed Functional Maturity and Allee Effects in Reproductive Behaviour of the Queen Conch Strombus Gigas. Mar. Ecol. Prog. Ser. 284, 185–194. doi: 10.3354/meps284185
Glazer R. A., Berg C. J. Jr. (1994). “Queen Conch Research in Florida: An Overview,” in Queen Conch Biology, Fisheries and Mariculture. Eds. Appeldoom R. S., Rodriguez B. (Caracas, Venezuela: Fundación Científica Los Roques), Pages 79–95.
Gleich D. (2008) Matlabbgl: A Graph Library for Matlab Based on the Boost Graph Library. Available at: https://github.com/dgleich/matlab-bgl.
Gómez-Campo K., Rueda M., García-Valencia C. (2010). Distribución Espacial, Abundancia Y Relación Con Características Del Hábitat Del Caracol Pala Eustrombus Gigas (Linnaeus) (Mollusca: Strombidae) En El Archipiélago Nuestra Señora Del Rosario, Caribe Colombiano. Boletín. Invest. Mar. Y. Coster. 39 (1), 137–159.
Hamilton R. J., Lozano-Cortés D., Bode M., Almany G. R., Harrison H. B., Pita J., et al. (2021). Larval Dispersal and Fishing Pressure Influence Recruitment in a Coral Reef Fishery. J. Appl. Ecol. 58(12)2924–2935. doi: 10.1111/1365-2664.14027
Hawkins S. J., Bohn K., Sims D. W., Ribeiro P., Faria J., Presa P., et al. (2016). Fisheries Stocks From an Ecological Perspective: Disentangling Ecological Connectivity From Genetic Interchange. Fish. Res. 179, 333–341. doi: 10.1016/j.fishres.2016.01.015
Hesse K. O. (1976). An Ecological Study of the Queen Conch, Strombus Gigas. Master's Thesis (Storrs, CT: University of Connecticut).
Holstein D. M., Paris C. B., Mumby P. J. (2014). Consistency and Inconsistency in Multispecies Population Network Dynamics of Coral Reef Ecosystems. Mar. Ecol. Prog. Ser. 499, 1–18. doi: 10.3354/meps10647
Horn C., Karnauskas M., Doerr J. C., Miller M. H., Neuman M., Hill R., et al. (2022). Endangered Species Act Status Review Report: Queen Conch (Aliger/Lobatus/Strombus Gigas) (NOAA Technical Report NMFS).
Hughes T. P., Tanner J. E. (2000). Recruitment Failure, Life Histories, and Long-Term Decline of Caribbean Corals. Ecology 81 (8), 2250–2263. doi: 10.1890/0012-9658(2000)081[2250:RFLHAL]2.0.CO;2
IMaRS-USF (Institute for Marine Remote Sensing-University of South Florida) (2005). Millennium Coral Reef Mapping Project. Unvalidated Maps. These Maps are Unendorsed by IRD, But Were Further Interpreted by UNEP World Conservation Monitoring Centre (Cambridge (UK: UNEP World Conservation Monitoring Centre).
IMaRS-USF, IRD (Institut de Recherche pour le Developpement) (2005). Millennium Coral Reef Mapping Project. Validated Maps (Cambridge (UK: UNEP World Conservation Monitoring Centre).
Jacobi M. N., André C., Döös K., Jonsson P. R. (2012). Identification of Subpopulations From Connectivity Matrices. Ecography 35 (11), 1004–1016. doi: 10.1111/j.1600-0587.2012.07281.x
Johnston F. D., Allen M. S., Beardmore B., Riepe C., Pagel T., Hühn C., et al. (2018). How Ecological Processes Shape the Outcomes of Stock Enhancement and Harvest Regulations in Recreational Fisheries. Ecol. Appl. 28 (8), 2033–2054. doi: 10.1002/eap.1793
Jombart T. (2008). Adegenet: A R Package for the Multivariate Analysis of Genetic Markers. Bioinformatics 24 (11), 1403–1405. doi: 10.1093/bioinformatics/btn129
Jones G. P., Almany G. R., Russ G. R., Sale P. F., Steneck R. S., Van Oppen M. J. H., et al. (2009). Larval Retention and Connectivity Among Populations of Corals and Reef Fishes: History, Advances and Challenges. Coral. Reef. 28 (2), 307–325. doi: 10.1007/s00338-009-0469-9
Jones R. L., Stoner A. W. (1997). “The Integration of GIS and Remote Sensing in an Ecological Study of Queen Conch, Strombus Gigas, Nursery Habitat,” in Proceedings of the 49th Gulf and Caribbean Fisheries Institute, vol. volume 49. (North Fort Pierce, FL: Gulf and Caribbean Fisheries Institute), Pages 523–530.
Kaplan D. M., Cuif M., Fauvelot C., Vigliola L., Nguyen-Huu T., Tiavouane J., et al. (2017). Uncertainty in Empirical Estimates of Marine Larval Connectivity. ICES J. Mar. Sci. 74 (6), 1723–1734. doi: 10.1093/icesjms/fsw182
Karnauskas M, Chérubin LM, Paris CB. (2011). Adaptive Significance of the Formation of Multi-Species Fish Spawning Aggregations near Submerged Capes. PLOS ONE 6 (7), e22067 doi: 10.1371/journal.pone.0022067
Kool J. T., Paris C. B., Andréfouët S., Cowen R. K. (2010). Complex Migration and the Development of Genetic Structure in Subdivided Populations: An Example From Caribbean Coral Reef Ecosystems. Ecography 33, 597–606. doi: 10.1111/j.1600-0587.2009.06012.x
Kool J. T., Paris C. B., Barber P. H., Cowen R. K. (2011). Connectivity and the Development of Population Genetic Structure in Indo-West Pacific Coral Reef Communities. Global Ecol. Biogeogr. 20 (5), 695–706. doi: 10.1111/j.1466-8238.2010.00637.x
Kough A. S., Belak C. A., Paris C. B., Lundy A., Cronin H., Gnanalingam G., et al. (2019). Ecological Spillover From a Marine Protected Area Replenishes an Over-exploited Population Across an Island Chain. Conserv. Sci. Pract. 1 (3), e17. doi: 10.1111/csp2.17
Kough A. S., Claro R., Lindeman K. C., Paris C. B. (2016). Decadal Analysis of Larval Connectivity From Cuban Snapper (Lutjanidae) Spawning Aggregations Based on Biophysical Modeling. Mar. Ecol. Prog. Ser. 550, 175–190. doi: 10.3354/meps11714
Kough A. S., Cronin H., Skubel R., Belak C. A., Stoner A. W. (2017). Efficacy of an Established Marine Protected Area at Sustaining a Queen Conch Lobatus Gigas Population During Three Decades of Monitoring. Mar. Ecol. Prog. Ser. 573, 177–189. doi: 10.3354/meps12163
Kough A. S., Paris C. B., Butler M. J. IV (2013). Larval Connectivity and the International Management of Fisheries. PloS One 8 (6), e64970. doi: 10.1371/journal.pone.0064970
Lagos-Bayona A. L., Hernández-Barrero S., Rodríguez-Gómez H., Victoria-Daza P. (1996). Algunos Aspectos Bioecológicos Y Reproductivos Del Caracol Pala Strombus Gigas LinnaeuEn El Archipiélago De San Bernardo, Caribe Colombiano. Boletín. Científico. Del. Insti. Nacion. Pesca. Y. Acuicult. (INPA) 4, 141–160.
Legendre P., Legendre L. (2012). Numerical Ecology. 2nd Edition (Elsevier Science: Amsterdam, The Netherlands), 852 pages.
Leis J. M. (2006). Are Larvae of Demersal Fishes Plankton or Nekton? Adv. Mar. Biol. 51, 57–141. doi: 10.1016/S0065-2881(06)51002-8
Lellouche J.-M., Greiner E., Galloudec O., Garric G., Regnier C., Drevillon M., et al. (2018). Recent Updates to the Copernicus Marine Service Global Ocean Monitoring and Forecasting Real-Time 1∕12° High-Resolution System. Ocean. Sci. 14, 1093–1126. doi: 10.5194/os-14-1093-2018
Lellouche J.-M., Greiner E., Romain B.-B., Gilles G., Angélique M., Marie D., et al. (2021). The Copernicus Global 1/12 Oceanic and Sea Ice GLORYS12 Reanalysis. Front. Earth Sci. 9. doi: 10.3389/feart.2021.698876
León-Pérez M. C., Hernández W. J., Armstrong R. A. (2019). Characterization and Distribution of Seagrass Habitats in a Caribbean Nature Reserve Using High-Resolution Satellite Imagery and Field Sampling. J. Coast. Res. 35 (5), 937–947. doi: 10.2112/JCOASTRES-D-18-00106.1
Lopera L., Cardona Y., Zapata-Ramírez P. A. (2020). Circulation in the Seaflower Reserve and Its Potential Impact on Biological Connectivity. Front. Mar. Sci. 7. doi: 10.3389/fmars.2020.00385
Lowe W. H., Allendorf F. W. (2010). What Can Genetics Tell Us About Population Connectivity? Mol. Ecol. 19 (15), 3038–3051. doi: 10.1111/j.1365-294X.2010.04688.x
Lowerre-Barbieri S., DeCelles G., Pepin P., Catalán I. A., Muhling B., Erisman B., et al. (2017). Reproductive Resilience: A Paradigm Shift in Understanding Spawner-Recruit Systems in Exploited Marine Fish. Fish. Fish. 18 (2), 285–312. doi: 10.1111/faf.12180
Machkour-M’Rabet S., Cruz Medina J., García-De León F. J., de Jesús-Navarrete A., Hénaut Y.. (2017). Connectivity and genetic structure of the queen conch on the Mesoamerican Reef. Coral Reefs 36 (2), 535–548.
Mantel N. (1967). The Detection of Disease Clustering and a Generalized Regression Approach. Cancer Res. 27, 209–220. https://aacrjournals.org/cancerres/article-pdf/27/2\_Part\_1/209/2382183/cr0272p10209.pdf
Márquez-Pretel E., Davila-Vila E. O., Gallo-Nieto J.. (1994). Dinámica Poblacional Y Pesquera Del Caracol Pala Strombus Gigas Linnaeus, 1758 en Las Islas De Providencia Y Santa Catalina. Boletín Científico del Instituto Nacional de Pesca y Acuicultura (INPA) 2:110–123.
Márquez E., Landínez-García R. M., Ospina-Guerrero S. P., Aicardo Segura J., Prada M., Castro E, et al (2013). “Genetic Analysis of Queen Conch Strombus Gigas From the Southwest Caribbean,” in Proceedings of the 65th Gulf and Caribbean Fisheries Institute, volume 65. (North Fort Pierce, FL: Gulf and Caribbean Fisheries Institute), Pages 410–416.
Maxwell S. J., Dekkers A. M., Rymer T. L., Congdon B. C. (2020). Towards Resolving the American and West African Strombidae (Mollusca: Gastropoda: Neostromboidae) Using Integrated Taxonomy. The Festivus 52, 3–38.
McCarthy K. (2007). A Review of Queen Conch (Strombus gigas) Life-History. Miami, FL: National Oceanic and Atmospheric Administration. National Marine Fisheries Service. (Southeast Fisheries Science Center), SEDAR 14-DW-4.
Metcalf W.G., Stalcup M.C., Atwood D.K. (1977). Mona Passage Drift Bottle Study. Bull. Mar. Sci. 27 (3), 586–591. doi: 10.54173/F521003
McKenzie L. J., Nordlund L. M., Jones B. L., Cullen-Unsworth L. C., Roelfsema C., Unsworth R. K. F. (2020). The Global Distribution of Seagrass Meadows. Environ. Res. Lett. 15 (7), 074041. doi: 10.1088/1748-9326/ab7d06
Meijer zu Schlochtern M. (2014). “Population Status and Reproductive Biology of Queen Conch (Lobatus Gigas) in the Coastal Waters Around St Eustatius,” in Master's Thesis (Wageningen, Netherlands: Wageningen University).
Molinari R. L. (1980). Current Variability and Its Relation to Sea-Surface Topography in the Caribbean Sea and Gulf of Mexico. Mar. Geodes. 3 (1–4), 409–436. doi: 10.1080/01490418009388006
Nei M., Tajima F., Tateno Y. (1983). Accuracy of Estimated Phylogenetic Trees From Molecular Data. II. Gene Frequency Data. J. Mol. Evol. 19 (2), 153–170. doi: 10.1007/bf02300753
Okubo A. (1971). Oceanic Diffusion Diagrams. Deep-Sea. Res. Oceanogr. Abstr. 1 (8), 789–802. doi: 10.1016/0011-7471(71)90046-5
Paris C. B., Aldana-Aranda D., Pérez-Pérez M., Kool J. (2008). “Connectivity of Queen Conch, Strombus Gigas, Populations From Mexico,” in Proceedings of the 11th International Coral Reef Symposium, vol. volume 11 . Eds. Riegl B., Dodge R. E. (Davie, FL: Nova Southeastern University, National Coral Reef Institute), Pages 439–443.
Paris C. B., Chérubin L. M., Cowen R. K. (2007). Surfing, Diving or Spinning: Effects on Population Connectivity. Mar. Ecol. Prog. Ser. 347, 285–300. Theme Section: Advances in Modelling Physical-biological Interactions in Fish Early Life History. doi: 10.3354/meps06985
Paris C. B., Cowen R. K. (2004). Direct Evidence of a Biophysical Retention Mechanism for Coral Reef Fish Larvae. Limnol. Oceanogr. 49 (6), 1964–1979. doi: 10.4319/lo.2004.49.6.1964
Paris C. B., Cowen R. K., Claro R., Lindeman K. C. (2005). Larval Transport Pathways From Cuban Snapper (Lutjanidae) Spawning Aggregations Based on Biophysical Modeling. Mar. Ecol. Prog. Ser. 296, 93–106. doi: 10.3354/meps296093
Paris C. B., Helgers J., van Sebille E., Srinivasan A. (2013). Connectivity Modeling System: A Probabilistic Modeling Tool for the Multi-Scale Tracking of Biotic and Abiotic Variability in the Ocean. Environ. Modell. Softw. 42, 47–54. doi: 10.1016/j.envsoft.2012.12.006
Paris-Limouzy C. B. (2011). “Reef Interconnectivity and Larval Dispersal,” in Encyclopedia of Modern Coral Reefs: Structure, Form and Process (Encyclopedia of Earth Science Series. Ed. Hopley D. (Springer-Verlag:Dordrecht), 881–889. doi: 10.1007/978-90-481-2639-2_138
Pérez-Enriquez R., Garcia-Rodriguez F. J., Mendoza-Carrion G., Padilla C. (2011). Geographical Variation in the Genetic Diversity and Composition of the Endangered Queen Conch Strombus Gigas (Mesogastropoda: Strombidae) From Yucatán, México. Rev. Biol. Trop. 59 (3), 1115–1126. doi: 10.15517/rbt.v0i0.3384
Pérez-Pérez M., Aldana-Aranda D. (2003). Actividad Reproductiva De Strombus Gigas (Mesogasteropoda: Strombidae) En Diferentes Hábitats Del Arrecife Alacranes, Yucatán. Rev. Biol. Trop. 51 (Supplement 4), 119–126.
Pinsky M. L., Palumbi S. R. (2014). Meta-Analysis Reveals Lower Genetic Diversity in Overfished Populations. Mol. Ecol. 23 (1), 29–39. doi: 10.1111/mec.12509
Prada M. C., Appeldoorn R. S., van Eijs S., Pérez M M. (2017). “Regional Queen Conch Fisheries Management and Conservation Plan,” in Food and Agriculture Organization of the United Nations (Fao), FAO Fisheries and Aquaculture Technical Paper No. 610(FAO:Rome, Italy). 72 p
Prakash D., Dicopolous J., Roarty H., Morel J., Canals M., Evans C. (2018). “Development of Sargassum Seaweed Tracking Tools,” in OCEANS 2018 MTS/IEEE Charleston. 1–6. doi: 10.1109/OCEANS.2018.8604742
Randall J. E. (1964). Contributions to the Biology of the Queen Conch, Strombus Gigas. Bull. Mar. Sci. 14 (2), 246–295.
Salley S. (1986). “Development of the Statocyst of the Queen Conch Larva, Strombus Gigas L.(Gastropoda: Prosobranchia),” in Master's Thesis (Montreal, Canada: McGill University).
Saunders M. I., Brown C. J., Foley M. M., Febria C. M. (2016). Human Impacts on Connectivity in Marine and Freshwater Ecosystems Assessed Using Graph Theory: A Review. Mar. Freshw. Res. 67, 277–290. doi: 10.1071/MF14358
Schill S. R., McNulty V. P., Pollock F. J., Lüthje F., Li J., Knapp D. E., et al. (2021). Regional High-Resolution Benthic Habitat Data From Planet Dove Imagery for Conservation Decision-Making and Marine Planning. Remote Sens. 13, 4215. doi: 10.3390/rs13214215
Souza P. M., Kough A. S. (2020). Queen Conch Lobatus Gigas Population Estimates and Age Structure Suggest a Potential Natural Refuge on the Cay Sal Bank, the Bahamas. Aquat. Conserv.: Mar. Freshw. Ecosyst. 30 (7), 1276–1290. doi: 10.1002/aqc.3348
Spalding M. D., Ravilious C., Green E. P. (2001). World Atlas of Coral Reefs (Berkeley (California, USA: The University of California Press), 436 pp.
Stoner A. W. (1989). Density-Dependent Growth and Grazing Effects of Juvenile Queen Conch Strombus Gigas L. in a Tropical Seagrass Meadow. J. Exp. Mar. Biol. Ecol. 130 (2), 119–133. doi: 10.1016/0022-0981(89)90199-8
Stoner A. W., Appeldoorn R. S. (2021). Synthesis of Research on the Reproductive Biology of Queen Conch (Aliger Gigas): Towards the Goals of Sustainable Fisheries and Species Conservation. Rev. Fish. Sci. Aquacult., 1–45. doi: 10.1080/23308249.2021.1968789
Stoner A. W., Davis M. H. (2010). Queen conch stock assessment historical fishing grounds Andros Island, Bahamas. Community Conch Report by Community Conch to the Nature Conservancy, Nassau, Bahamas..
Stoner A. W., Davis M. (1997). Abundance and Distribution of Queen Conch Veligers (Strombus Gigas Linne) in the Central Bahamas. I. Horizontal Patterns in Relation to Reproductive and Nursery Grounds. J. Shellf. Res. 16 (1), 7–18.
Stoner A. W., Davis M. H., Booker C. J. (2012). Negative Consequences of Allee Effect are Compounded by Fishing Pressure: Comparison of Queen Conch Reproduction in Fishing Grounds and a Marine Protected Area. Bull. Mar. Sci. 88 (1), 89–104. doi: 10.5343/bms.2011.1044
Stoner A. W., Davis M. H., Kough A. S. (2019). Relationships Between Fishing Pressure and Stock Structure in Queen Conch (Lobatus Gigas) Populations: Synthesis of Long-Term Surveys and Evidence for Overfishing in The Bahamas. Rev. Fish. Sci. Aquacult. 27(1),51–71. doi: 10.1080/23308249.2018.1480008
Stoner A. W., Glazer R. A., Barile P. J. (1996). Larval Supply to Queen Conch Nurseries: Relationships With Recruitment Process and Population Size in Florida and the Bahamas. J. Shellf. Res. 15 (2), 407–420.
Stoner A. W., Hanisak M. D., Smith N. P., Armstrong R. A. (1994). “Large-Scale Distribution of Queen Conch Nursery Habitats: Implications for Stock Enhancement,” in Queen Conch Biology, Fisheries and Mariculture. Eds. Appeldoom R. S., Rodriguez B. (Caracas, Venezuela: Fundacion Cientifica Los Roques), Pages 169–189.
Stoner A. W., Mehta N., Lee T. N. (1997). Recruitment of Strombus Veligers to the Florida Keys Reef Tract: Relation to Hydrographic Events. J. Shellf. Res. 16 (1), 1–6. http://ia600504.us.archive.org/11/items/journalofshellfi16nati/journalofshellfi16nati.pdf.
Stoner A. W., Ray-Culp M. (2000). Evidence for Allee Effects in an Over-Harvested Marine Gastropod: Density-dependent Mating and Egg Production. Mar. Ecol. Prog. Ser. 202, 297–302. doi: 10.3354/meps202297
Stoner A. W., Sandt V. J. (1992). Population Structure, Seasonal Movements and Feeding of Queen Conch, Strombus Gigas, in Deep-Water Habitats of the Bahamas. Bull. Mar. Sci. 51 (3), 287–300. https://www.ingentaconnect.com/contentone/umrsmas/bullmar/1992/00000051/00000003/art00002
Stoner A. W., Schwarte K. C. (1994). Queen Conch, Strombus Gigas, Reproductive Stocks in the Central Bahamas: Distribution and Probable Sources. Fish. Bull. 92, 171–179. https://spo.nmfs.noaa.gov/content/queen-conch-strombus-gigas-reproductive-stocks-central-bahamas-distribution-and-probable
Stoner A. W., Smith N. P. (1998). Across-shelf Transport of Gastropod Larvae in the Central Bahamas: Rapid Responses to Local Wind Conditions. J. Plankt. Res. 20, 1–16. doi: 10.1093/plankt/20.1.1
Tewfik A., Babcock E. A., Gibson J., Perez V. R. B., Strindberg S. (2017). Benefits of a Replenishment Zone Revealed Through Trends in Focal Species at Glover's Atoll, Belize. Mar. Ecol. Prog. Ser. 580, 37–56. doi: 10.3354/meps12290
Tiley K, Freeman MA, Dennis MM. (2018). Pathology and reproductive health of queen conch (Lobatus gigas) in St. Kitts. J Invertebr Pathol. 155, 32–37. doi: 10.1016/j.ecolmodel.2013.10.002
Thomas C. J., Lambrechts J., Wolanski E., Traag V. A., Blondel V. D., Deleersnijder E., et al. (2014). Numerical Modelling and Graph Theory Tools to Study Ecological Connectivity in the Great Barrier Reef. Ecol. Modell. 272, 160–174. doi: 10.1016/j.ecolmodel.2013.10.002
Treml E. A., Halpin P. N., Urban D. L., Pratson L. F. (2008). Modeling Population Connectivity by Ocean Currents, a Graph-Theoretic Approach for Marine Conservation. Landscape Ecol. 23 (1), 19–36. doi: 10.1007/s10980-007-9138-y
Truelove N. K., Kough A. S., Behringer D.C., Paris C. B., Box S.J., Preziosi R.F., Butler M.J IV (2017). Isolation by Oceanic Distance and Spatial Genetic Structure in an Overharvested International Fishery. Diversity Distrib. 23 (11), 1292–1300. doi: 10.1111/ddi.12626
UNEP-WCMC, Short F. T. (2021). “Global Distribution of Seagrasses (Version 7.1),” in Seventh Update to the Data Layer Used in Green and Short, (2003) (Cambridge (UK: UN Environment World Conservation Monitoring Centre). doi: 10.34892/x6r3-d211
UNEP-WCMC, WorldFish Centre, WRI, TNC (2021). Global Distribution of Warm-Water Coral Reefs, Compiled From Multiple Sources Including the Millennium Coral Reef Mapping Project. Version 4.1. Includes Contributions From IMaRS-USF and IRD, (2005), Imars-USF, (2005) and Spalding Et Al., (2001) (Cambridge (UK: UN Environment World Conservation Monitoring Centre). doi: 10.34892/t2wk-5t34
Urban D. L., Minor E. S., Treml E. A., Schick R. S. (2009). Graph Models of Habitat Mosaics. Ecol. Lett. 12, 260–273. doi: 10.1111/j.1461-0248.2008.01271.x
Wabnitz C. C., Andréfouët S., Torres-Pulliza D., Müller-Karger F. E., Kramer P. A. (2008). Regional-Scale Seagrass Habitat Mapping in the Wider Caribbean Region Using Landsat Sensors: Applications to Conservation and Ecology. Remote Sens. Environ. 112 (8), 3455–3467. doi: 10.1016/j.rse.2008.01.020
Weil E. M., Laughlin R. G. (1984). Biology, Population Dynamics, and Reproduction of the Queen Conch Strombus Gigas Linné in the Archipiélago De Los Roques National Park. J. Shellf. Res. 4 (1), 45–62. https://www.researchgate.net/publication/285476090_Biology_population_dynamics_and_reproduction_of_the_queen_conch_Strombus_gigas_Linne_in_the_Archipielago_de_Los_Roques_National_Park.
Wells J. V., Richmond B. M. (1995). Populations, Metapopulations, and Species Populations: What are They and Who Should Care? Wildl. Soc. Bull. 23 (3), 458–462 https://www.jstor.org/stable/3782955.
West D. B. (2001). “Introduction to Graph Theory,” in Prentice Hall Upper Saddle River, NJ, 588 pages, ISBN: ISBN: 0130144002.
Wicklund R. I., Hepp L. J., Wenz G. A. (1991). “Preliminary Studies on the Early Life History of the Queen Conch (Strombus Gigas) in the Exuma Cays, Bahamas,” in Proceedings of the 40th Gulf and Caribbean Fisheries Institute, vol. volume 40. (North Fort Pierce, FL: Gulf and Caribbean Fisheries Institute), Pages 283–298.
Wilkins R. M., Goodwin M. H., Reid D. M. (1987). Research Applied to Conch Resource Management in St. Kitts/Nevis (North Fort Pierce, FL: Gulf and Caribbean Fisheries Institute).
Willis S. C., Hollenbeck C. M., Puritz J. B., Portnoy D. S. (2022). Genetic Recruitment Patterns are Patchy and Spatiotemporally Unpredictable in a Deep − Water Snapper (Lutjanus Vivanus) Sampled in Fished and Protected Areas of Western Puerto Rico. Conserv. Genet. 0123456789. doi: 10.1007/s10592-021-01426-2
Wright S. (1931). Evolution in Mendelian Populations. Genetics 16, 97–159. doi: 10.1093/genetics/16.2.97
Wynne S. P., Kuramae I. A., Boman E. M. (2016). Summary of Queen Conch (Lobatus Gigas) Research Undertaken in Anguilla and the Implications for Current Management Practices. Anguilla. Fish. Mar. Resour. Res. Bull. No. 3.
Keywords: queen conch, population connectivity, Langrangian model, larval dispersal, metapopulation, Allee effect
Citation: Vaz AC, Karnauskas M, Paris CB, Doerr JC, Hill RL, Horn C, Miller MH, Neuman M, McCarthy KJ and Farmer NA (2022) Exploitation Drives Changes in the Population Connectivity of Queen Conch (Aliger gigas). Front. Mar. Sci. 9:841027. doi: 10.3389/fmars.2022.841027
Received: 21 December 2021; Accepted: 27 April 2022;
Published: 01 July 2022.
Edited by:
Romuald Lipcius, William & Mary’s Virginia Institute of Marine Science, United StatesReviewed by:
Richard Appeldoorn, University of Puerto Rico at Mayagüez, Puerto RicoAlfonso Aguilar-Perera, Universidad Autónoma de Yucatán, Mexico
Copyright © 2022 Vaz, Karnauskas, Paris, Doerr, Hill, Horn, Miller, Neuman, McCarthy and Farmer. This is an open-access article distributed under the terms of the Creative Commons Attribution License (CC BY). The use, distribution or reproduction in other forums is permitted, provided the original author(s) and the copyright owner(s) are credited and that the original publication in this journal is cited, in accordance with accepted academic practice. No use, distribution or reproduction is permitted which does not comply with these terms.
*Correspondence: Ana C. Vaz, avaz@rsmas.miami.edu