La Niña conditions influence interannual call detections of pygmy blue whales in the eastern Indian Ocean
 Gary Truong1,2*†
  Tracey L. Rogers1,2†
- 1Evolution and Ecology Research Centre, School of Biological Earth and Environmental Sciences, University of New South Wales, Sydney, NSW, Australia
- 2Centre for Marine Science and Innovation, School of Biological Earth and Environmental Sciences, University of New South Wales, Sydney, NSW, Australia
Oceans across the globe are warming rapidly and marine ecosystems are changing as a result. However, there is a lack of information regarding how blue whales are responding to these changing environments, especially in the Southern Hemisphere. This is because long term data are needed to determine whether blue whales respond to variability in environmental conditions. Using over 16 years of passive acoustic data recorded at Cape Leeuwin, we investigated whether oceanic environmental drivers are correlated with the migration patterns of eastern Indian Ocean (EIO) pygmy blue whales off Western Australia. To determine which environmental variables may influence migration patterns, we modelled the number of acoustic call detections of EIO pygmy blue whale calls with broad and fine scale environmental variables. We found a positive correlation between total annual whale call detections and El Niño Southern Oscillation (ENSO) cycles and the Indian Ocean Dipole (IOD), with more whale calls detected during La Niña years. We also found that monthly whale call detections correlated with sea surface height around the hydrophone and chlorophyll-a concentration at a prominent blue whale feeding aggregation area (Bonney Upwelling) where whales feed during the summer before migrating up the west Australian coast. At the interannual scale, ENSO had a stronger relationship with call detections than IOD. During La Niña years, up to ten times more EIO pygmy blue whale calls were detected than in neutral or El Niño years. This is likely linked to changes in productivity in the feeding areas of the Great Australian Bight and Indian Ocean. We propose that in lower productivity years whales either skipped migration or altered their habitat use and moved further offshore from the hydrophones and therefore were not detected. The frequency and intensity of ENSO events are predicted to increase with climate change, which is likely to impact the productivity of the areas used by blue whales. These changes in productivity may affect the physical condition and reproductive success of individual whales. A reduction in reproductive success could have a significant impact on blue whale recovery from historical whaling and their ability to adapt to a changing environment.
Introduction
Global temperatures have been steadily increasing over the past few decades due to the burning of fossil fuels and the emission of greenhouse gases such as carbon dioxide and methane. The ecological impacts of climate change are evident in terrestrial and marine systems, spanning from the warm tropics to the cold polar regions (Walther et al., 2002; Parmesan, 2006). Overall, marine environments are changing at a much faster rate than terrestrial systems (Burrows et al., 2011). Ocean circulation has changed considerably due to increased water temperatures and changes to major ocean currents. Poleward western boundary currents are strengthening, bringing warmer water further south towards mid to high latitude regions (Wu et al., 2012; Yang et al., 2016). In the Southern Ocean, the Antarctic Circumpolar Current is predicted to strengthen and shift its overall position southward (Saenko et al., 2005). At the same time, other abiotic climate stressors in temperate and southern oceans (e.g., shifts in sea surface temperature and acidification, and decreases in winter sea-ice cover) have been found to drive change for marine fauna (Kroeker et al., 2013; Post et al., 2013; Stuart-Smith et al., 2015). To date, abiotic factors have resulted with biotic changes at lower trophic levels. These include decreases in primary productivity and changes in phytoplankton community structure (Montes-Hugo et al., 2009), which in turn influence the structure of grazer communities such as krill and salps (Atkinson et al., 2004). Some of these changes have transferred to higher trophic level species. However, a better understanding of how these lower trophic changes will impact higher trophic levels in the context of climate change is necessary, especially for conservation efforts.
Climate change can increase the risk of extinction of already endangered megafauna with depleted populations. The change in environmental conditions can disrupt the reproductive success of large whales, by affecting resource availability, survival, and growth (Post and Forchhammer, 2008; Molnár et al., 2010; Auer and Martin, 2013). Food availability is strongly correlated with body condition and fecundity in female fin, humpback, and sperm whales (Lockyer, 1986; Wiley and Clapham, 1993; Whitehead, 1996; Braithwaite et al., 2015), as well as in odontocetes, pinnipeds, and sirenians (Read and Gaskin, 1990; Boyd, 1996; Learmonth et al., 2006). A reduction in prey availability can result in increased competition for resources and a decrease in body condition and fecundity during periods of low productivity. Thus, climate change can indirectly threaten the recovery of large whales by influencing their prey. Some of these greatly depleted whale populations have recovered since the banning of commercial whaling, while others have shown little to no signs of recovery (Magera et al., 2013).
Long-term data is required to identify the historical and potential future impacts of climate change on higher trophic marine species (Rosenzweig et al., 2008). This is because cyclic/periodic climatic events such as the El Niño-Southern Oscillation (ENSO) and the Indian Ocean Dipole (IOD) can mask the underlying effects of long-term climate change. These large-scale, ocean basin-wide environmental drivers influence climatic factors such as rainfall and temperature to the point of affecting the likelihood of extreme events such as heatwaves, droughts, and floods. In the ocean, ENSO events can lead to marine heatwaves, changes in primary productivity, and the excessive runoff of nutrients, sediments, pollutants (McPhaden et al., 2006). Few studies have examined how the interannual climatic variability caused by ENSO and the IOD affects marine megafauna, because long-term studies at decadal scales are expensive and logistically difficult to conduct.
Antarctic blue whales, in particular, are likely to be vulnerable to environmental change in the Southern Ocean (Atkinson et al., 2004; Montes-Hugo et al., 2009; Mulvaney et al., 2012; Wijffels et al., 2016; Yang et al., 2016; Turney et al., 2017) because they feed predominantly in the euphausiid-rich waters for a relatively brief period (three to four months) each year in the austral summer. (Branch et al., 2007; Gill et al., 2011). During this time, a high rate of fat layer development is essential for the whales to prepare for long-distance migration to and from low-latitude breeding grounds, a journey which may require fasting for months at a time (Brodie, 1975). Pygmy blue whales, on the other hand, may not be able to build up large blubber stores like Antarctic blue whales as they do not feed in the euphausiid-rich waters surrounding Antarctica. As their reproductive success in linked with their migration, tracking the movement of these animals can reveal how they are responding to environmental changes. The primary methods of studying the movement patterns of whales include visual surveys, satellite tagging, acoustic tracking, and more recently satellite imagery. Visual surveys require high levels of effort, are restricted to daylight hours, and are hindered by adverse weather conditions. Satellite tagging provides precise movement tracks but is expensive and tags only work for a limited duration before falling off. More recently, with improved resolution, satellite imagery has been used to survey whales, but this method requires high levels of image processing and computing power. Passive acoustic monitoring (PAM), on the other hand, provides a relatively cost-effective method and can be effective for monitoring vocal species. PAM can be used to generate long-term data and requires less effort than other methods as the data are collected passively. Therefore, PAM could be used to detect variability in biological signals due to environmental changes.
Blue whales are ideal candidates for using PAM because they produce stereotypical, simple, and low frequency calls (McDonald et al., 2006). In addition, their cryptic nature and distribution in remote areas means that visual surveys are ineffective. Blue whales are traditionally thought to move each year between mid-to-high latitude productive feeding grounds in summer and low-latitude oligotrophic breeding areas to overwinter (Branch et al., 2007). Eastern Indian Ocean (EIO) pygmy blue whale calls are detected across mid-latitude southern Indian Ocean waters, including off the Crozet Islands (Samaran et al., 2010), Amsterdam Island, Reunion Island (Samaran et al., 2013), and in southern Australian waters. Within Australian waters, blue whale aggregations have been observed feeding in the Great South Australian Coastal Upwelling System (GSACUS) near the Bonney coast in the eastern Great Australian Bight (Figure 1, Gill, 2002; Gill et al., 2011), as well as in the subtropical convergence zone (Garcia-Rojas et al., 2018). The GSACUS is a wind-driven coastal upwelling system active from November to May during which upwelling of nutrient-rich water makes the area an important marine biodiversity hot spot (Ward et al., 2006; Kämpf, 2010). The EIO pygmy blue whales are present within the GSACUS from November to May, coinciding with the period that upwelling occurs (Gill, 2002; Gill et al., 2011; Balcazar et al., 2015; Tripovich et al., 2015). Satellite-tracking studies show EIO pygmy blue whales migrate from the south of Australia (starting their migration in March/April), moving past the West Australian coast to reach Indonesia from June after which they return south between the months of October and December (Double et al., 2014; Möller et al., 2020; Thums et al., 2022).
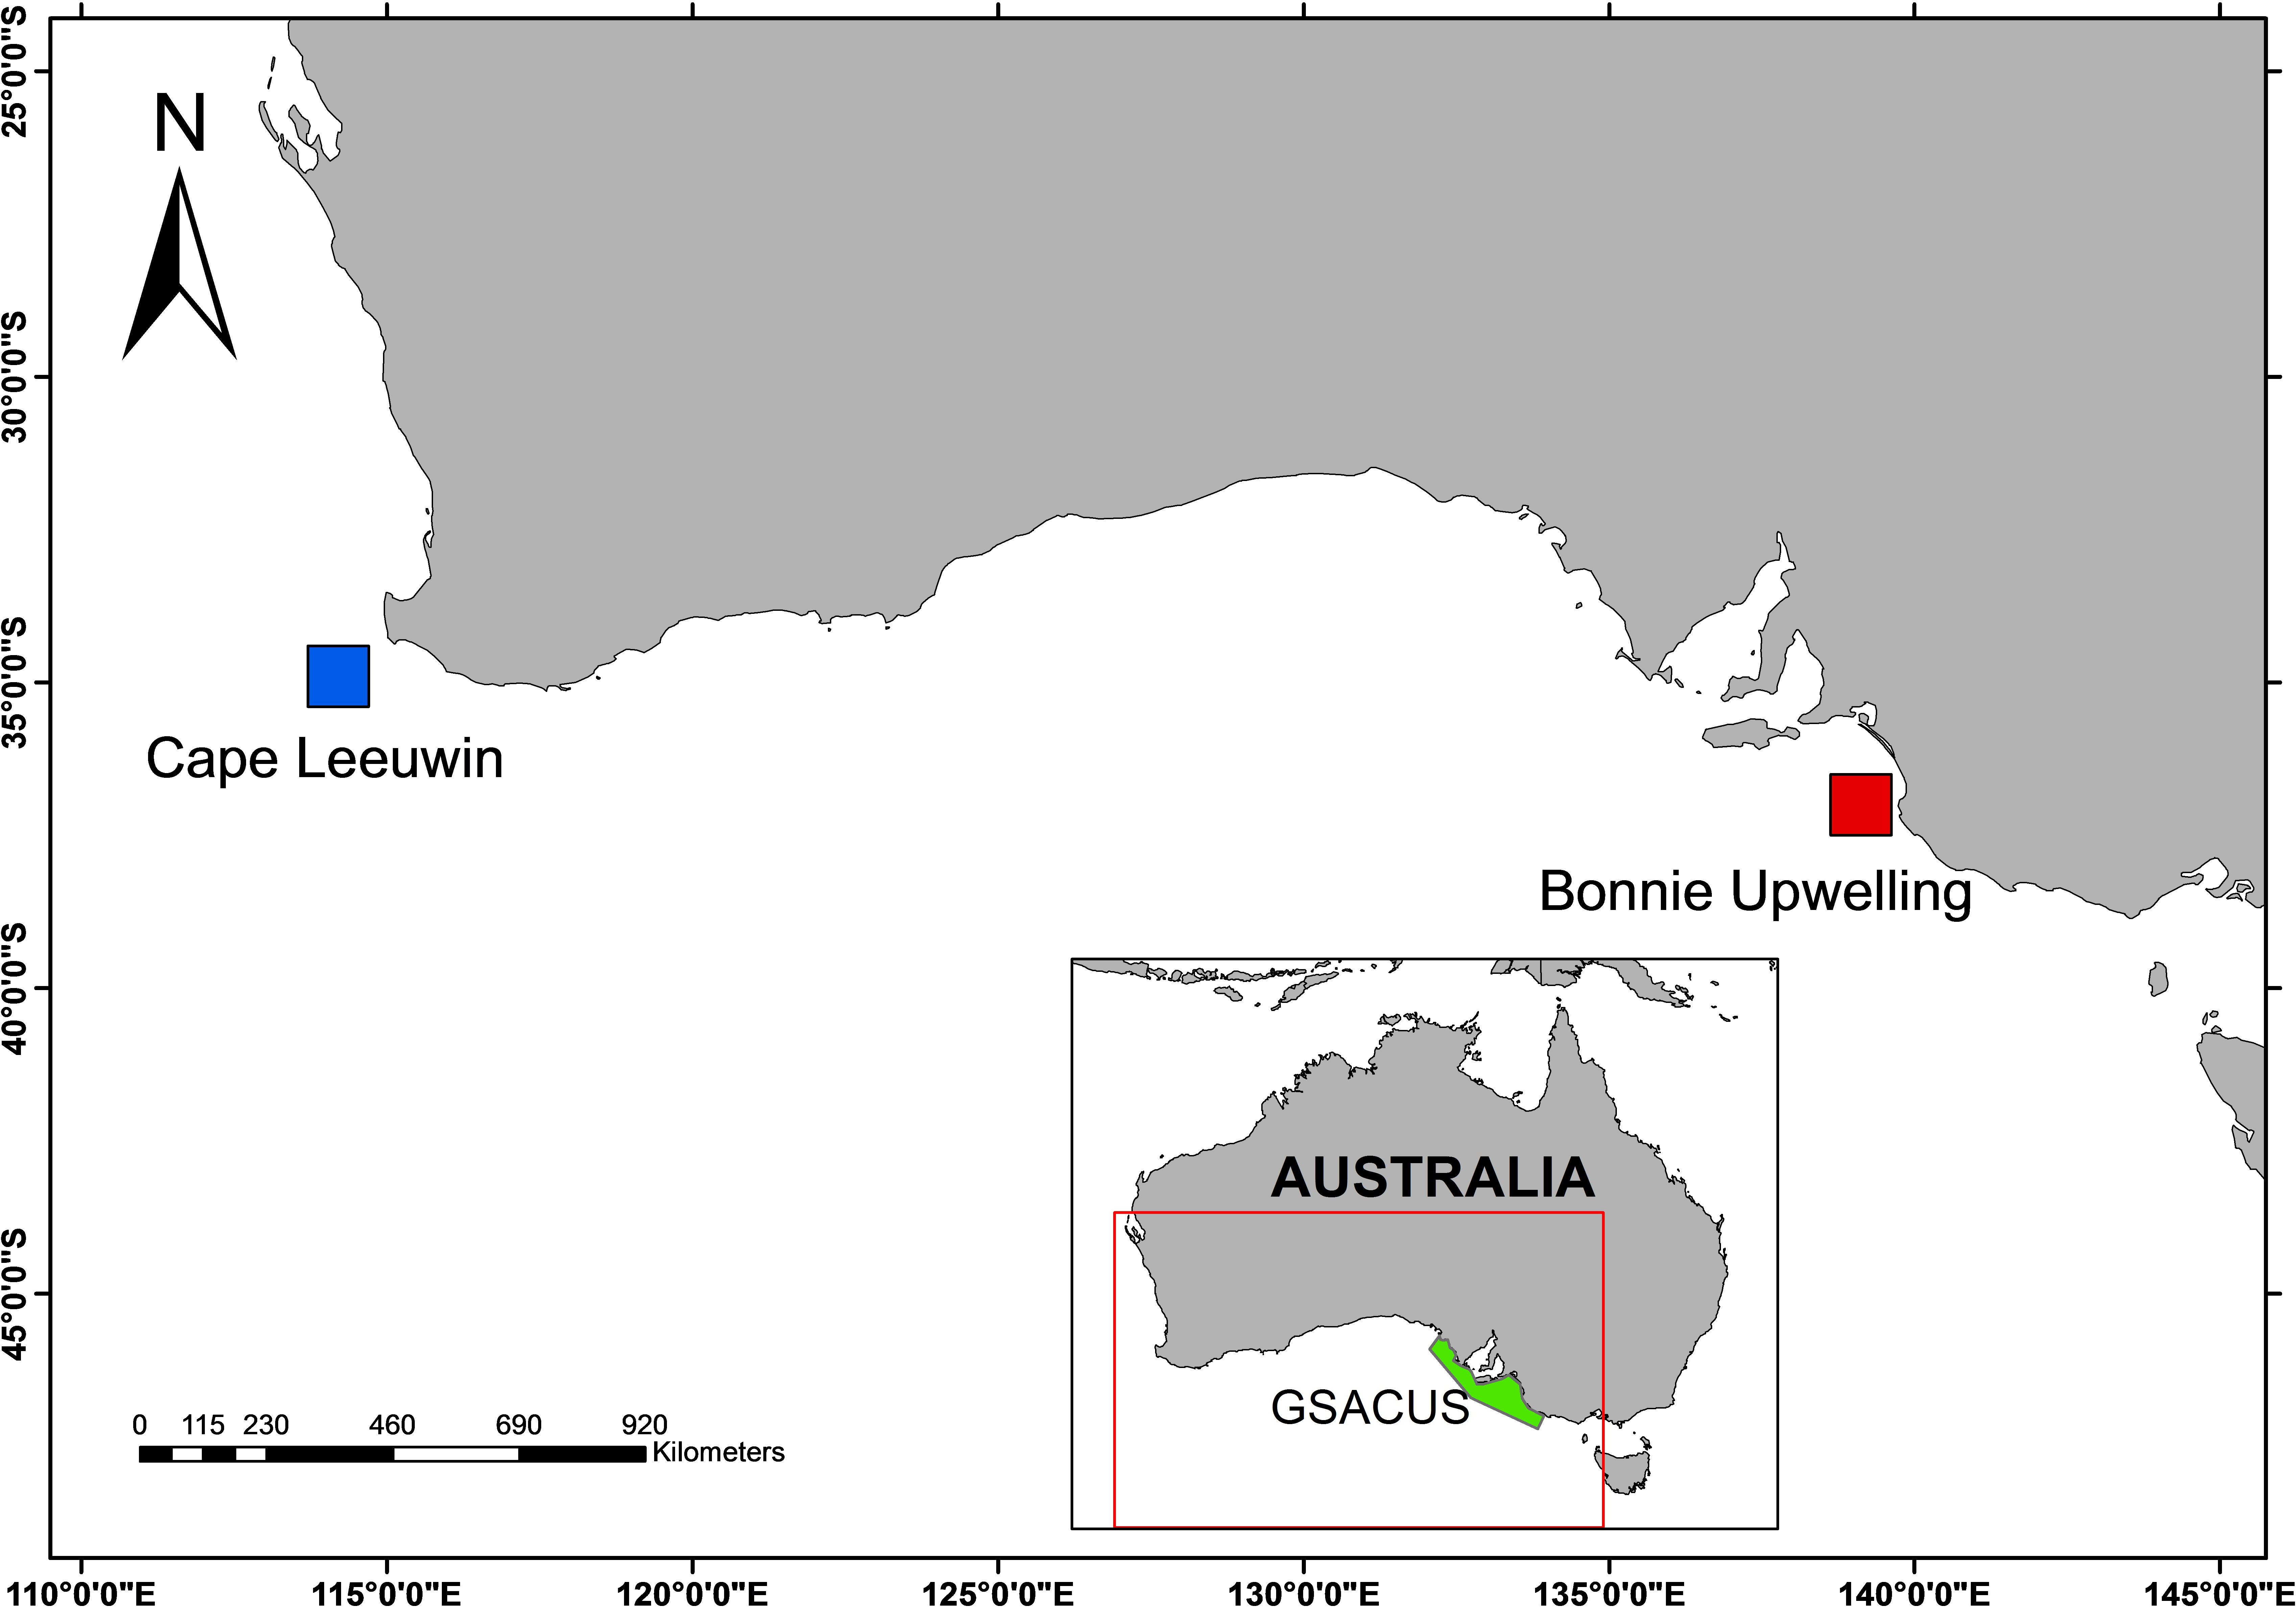
Figure 1 Map of the Australian Bight. The hydrophone H01W1 is located approximately 105 km from the shore at Cape Leeuwin, Western Australia (blue square). The Bonney Upwelling (red square) is the largest and most predictable upwelling location and also a known blue whale feeding aggregation area within the Great South Australian Coastal Upwelling System (GSACUS; highlighted in green).
The aim of this study is to investigate the environmental drivers that are correlated with, and therefore potentially influence, the migration patterns of EIO pygmy blue whales detected off Cape Leeuwin, Western Australia. We use acoustic detections of pygmy blue whales calls as a proxy for whale presence and analyse large-scale oceanic climate drivers such as ENSO and IOD. We hypothesise that fewer whales migrate (indicated by fewer acoustic detections) during years of low productivity in known feeding areas. We examined whether environmental variables such as chlorophyll and ocean temperature and height correlate with changes in whale presence. Establishing a link between environmental variables and whale presence could be used to predict the occurrence of baleen whales in the future and provide valuable information for the conservation and management of these threatened species.
Methods
Acoustic data collection
Passive acoustic data from a hydrophone recording station at Cape Leeuwin was obtained from January 2003 to December 2018. The monitoring station is maintained by the Comprehensive Nuclear Test Ban Treaty Organisation (CTBTO) and forms part of the International Monitoring System. The hydrophones at Cape Leeuwin are moored to the bottom of the ocean in a triplet array with the hydrophones positioned at a depth of 1,063 m. Acoustic data were recorded continuously with a sampling rate of 250 Hz for a flat frequency range of 1-100 Hz. The noise floor of the hydrophones was ≤ 60 dB per μPa (1-Hz band) and ≤ 81 dB per μPa (wide band). Data from a single hydrophone (H01W1; Figure 1; 34.9° S, 114.2° E) were analysed in this study. H01W1 is located approximately 72 km from the nearest point of land at Cape Leeuwin.
To detect EIO pygmy blue whale calls, we used an automated detector with the spectrogram correlation method in the bioacoustics analysis program Ishmael 3.0 (Mellinger et al., 2018). The EIO call typically consists of three units that are repeated, as described in McCauley and Jenner (2010). Our spectrogram correlation detector targeted the third harmonic (66 – 71 Hz) of the second unit of the EIO call using the same parameters described in Truong and Rogers (2021). Variations in the three-unit call have been described recently for this population, with some of the units being either excluded or inserted into the song, leading to different song structures and detection rates (Jolliffe et al., 2019). The second unit was the only unit present in all the song variations described, which is why it was targeted for detection. The proportion of the song variations differed slightly between years that were sampled, but overall, the relative proportions of each song variant were mostly consistent across years (Jolliffe et al., 2019).
Individual calls were verified visually using Raven Pro 1.6 and false positives were removed. False negative rates were quantified by randomly selecting a subset of recordings and manually counting the calls. Our detector was designed to be conservative by using a relatively high detection threshold. This resulted with low false positive rates (0.84%) and high false negative rates (81.35%) as we targeted loud calls produced by whales closer to the hydrophone and excluded fainter calls produced by whales further away. We analysed the whale detection data for EIO pygmy blue whale calls at two temporal scales: an annual scale to assess the relationship between ENSO and whale call detections; and a monthly time series to examine the link between environmental covariates and whale call detections at a finer temporal scale.
Environmental data
The southern oscillation index (SOI) quantifies the atmospheric pressure difference between Tahiti and Darwin and is used as an indicator of ENSO status. Monthly SOI values between 2003 and 2018 were obtained from the Australian Bureau of Meteorology (http://www.bom.gov.au/climate/enso/soi/) and yearly averages were calculated for the interannual analysis. The strength of the IOD is measured using the Dipole Mode Index (DMI). The DMI is represented by an anomalous sea surface temperature (SST) gradient between the western and eastern Indian Ocean. DMI values were obtained from the Global Climate Observing System Working Group on Surface Pressure (https://psl.noaa.gov/gcos_wgsp/Timeseries/DMI/). Satellite-derived environmental variables included SST, sea surface height (SSH), and sea surface chlorophyll-a (SSC), all of which were obtained for 2003 to 2015. SST data were from the NOAA Optimum Interpolation SST V2 from NOAA’s Physical Sciences Lab based in Boulder, Colorado, USA (https://psl.noaa.gov/). SSH data were obtained from the AVISO multi-satellite mission and SSC data from MODIS-Aqua, both acquired from the NOAA Ocean Watch – Central Pacific program (https://oceanwatch.pifsc.noaa.gov/). SSC was measured at the location of the hydrophone (SSC.HP) and at a major upwelling and feeding location, the Bonney Upwelling (SSC.BU) (Figure 1). We wanted to test SSC as it is a proxy for primary productivity which would then likely influence krill abundance. The Bonney Upwelling (37.2° S, 139.5° E) was selected as it is one of the most prominent upwelling locations within the GSACUS in the Great Australian Bight and also a known blue whale feeding aggregation area (Ward et al., 2006). All environmental variables were sampled monthly and averaged over a 1° x 1° latitude and longitude grid (approximately 10,000 km2).
Data analysis
Yearly models
We analysed the interannual variability of whale call detections and yearly average SOI and DMI. In our yearly models, the response variable was the total number of EIO pygmy blue whale detections within each year and the explanatory variables were SOI and DMI. We used a generalised linear model (GLM) with a negative binomial distribution as part of the analysis at a yearly scale to assess the correlation between the interannual variability of whale call detections and yearly averaged SOI values for data up to and including 2018. SST, SSH and SSC were not analysed at the yearly scale as they are highly seasonal and averaging at an annual scale would result in the loss of seasonal variation.
Monthly models
At the monthly scale, we assessed the relationship between environmental covariates and the number of monthly call detections, examining data up to and including 2015. Total monthly detections were used as the response variable in the monthly models. To determine which environmental variables were correlated with the detection of EIO pygmy blue whale calls we used a time series analysis with count data following generalised linear models using the tscount package (Liboschik et al., 2017) in R version 4.0.2 (R Core Team, 2020). The environmental variables used in the models included SOI, SST, SSH, SSC.HP, and SSC.BU. A variance inflation factor was used to check for collinearity and none of the variables were highly correlated (i.e., no values exceeded ten). The time series approach accounted for possible serial dependence (autocorrelation) with past observations. The highly cyclic, seasonal nature of whale call detections and the potential increase in the number of whale calls through time (since this is a recovering population) meant time was an important consideration for this analysis. To account for autocorrelation in the data a first order autoregressive term (β1) was used to capture short-range serial dependence, whereas a 13th order autoregressive term (α13) was used to capture the annual seasonality. The models were fitted using a negative binomial distribution and a “log” link function due to high overdispersion of the data where the variance far exceeded the mean. Model selection was used to identify the best fitting model using a forward stepwise selection approach. The best fitting models were assessed using AIC values.
Results
Interannual and monthly variability in call detections
A total of 74,812 EIO pygmy blue whale calls were detected from Cape Leeuwin between 2003 and 2018, with the highest number of calls being detected in 2008 (Figure 2). The number of calls detected per year between 2008 and 2012 was 9,112 ± 1,324 (mean ± SE). This was substantially higher than in the preceding and following years, where an average of 1,164 ± 403 calls were detected each year between 2003 and 2007 and an average of 3,906 ± 746 calls were detected each year between 2013 and 2018. The monthly whale call detections were seasonal in nature, with calls peaking in April for most years and occasionally peaking in March or May in other years (Figure 3A). The highest monthly detection occurred in June 2011 with 5,950 calls, despite the highest yearly call detections being in 2008. The high number of yearly call detections between 2008 and 2012 was due to increased call detections during the peak months in those years (Figure 3A). Monthly time series of the environmental variables are presented in Figures 3B, C, 4.
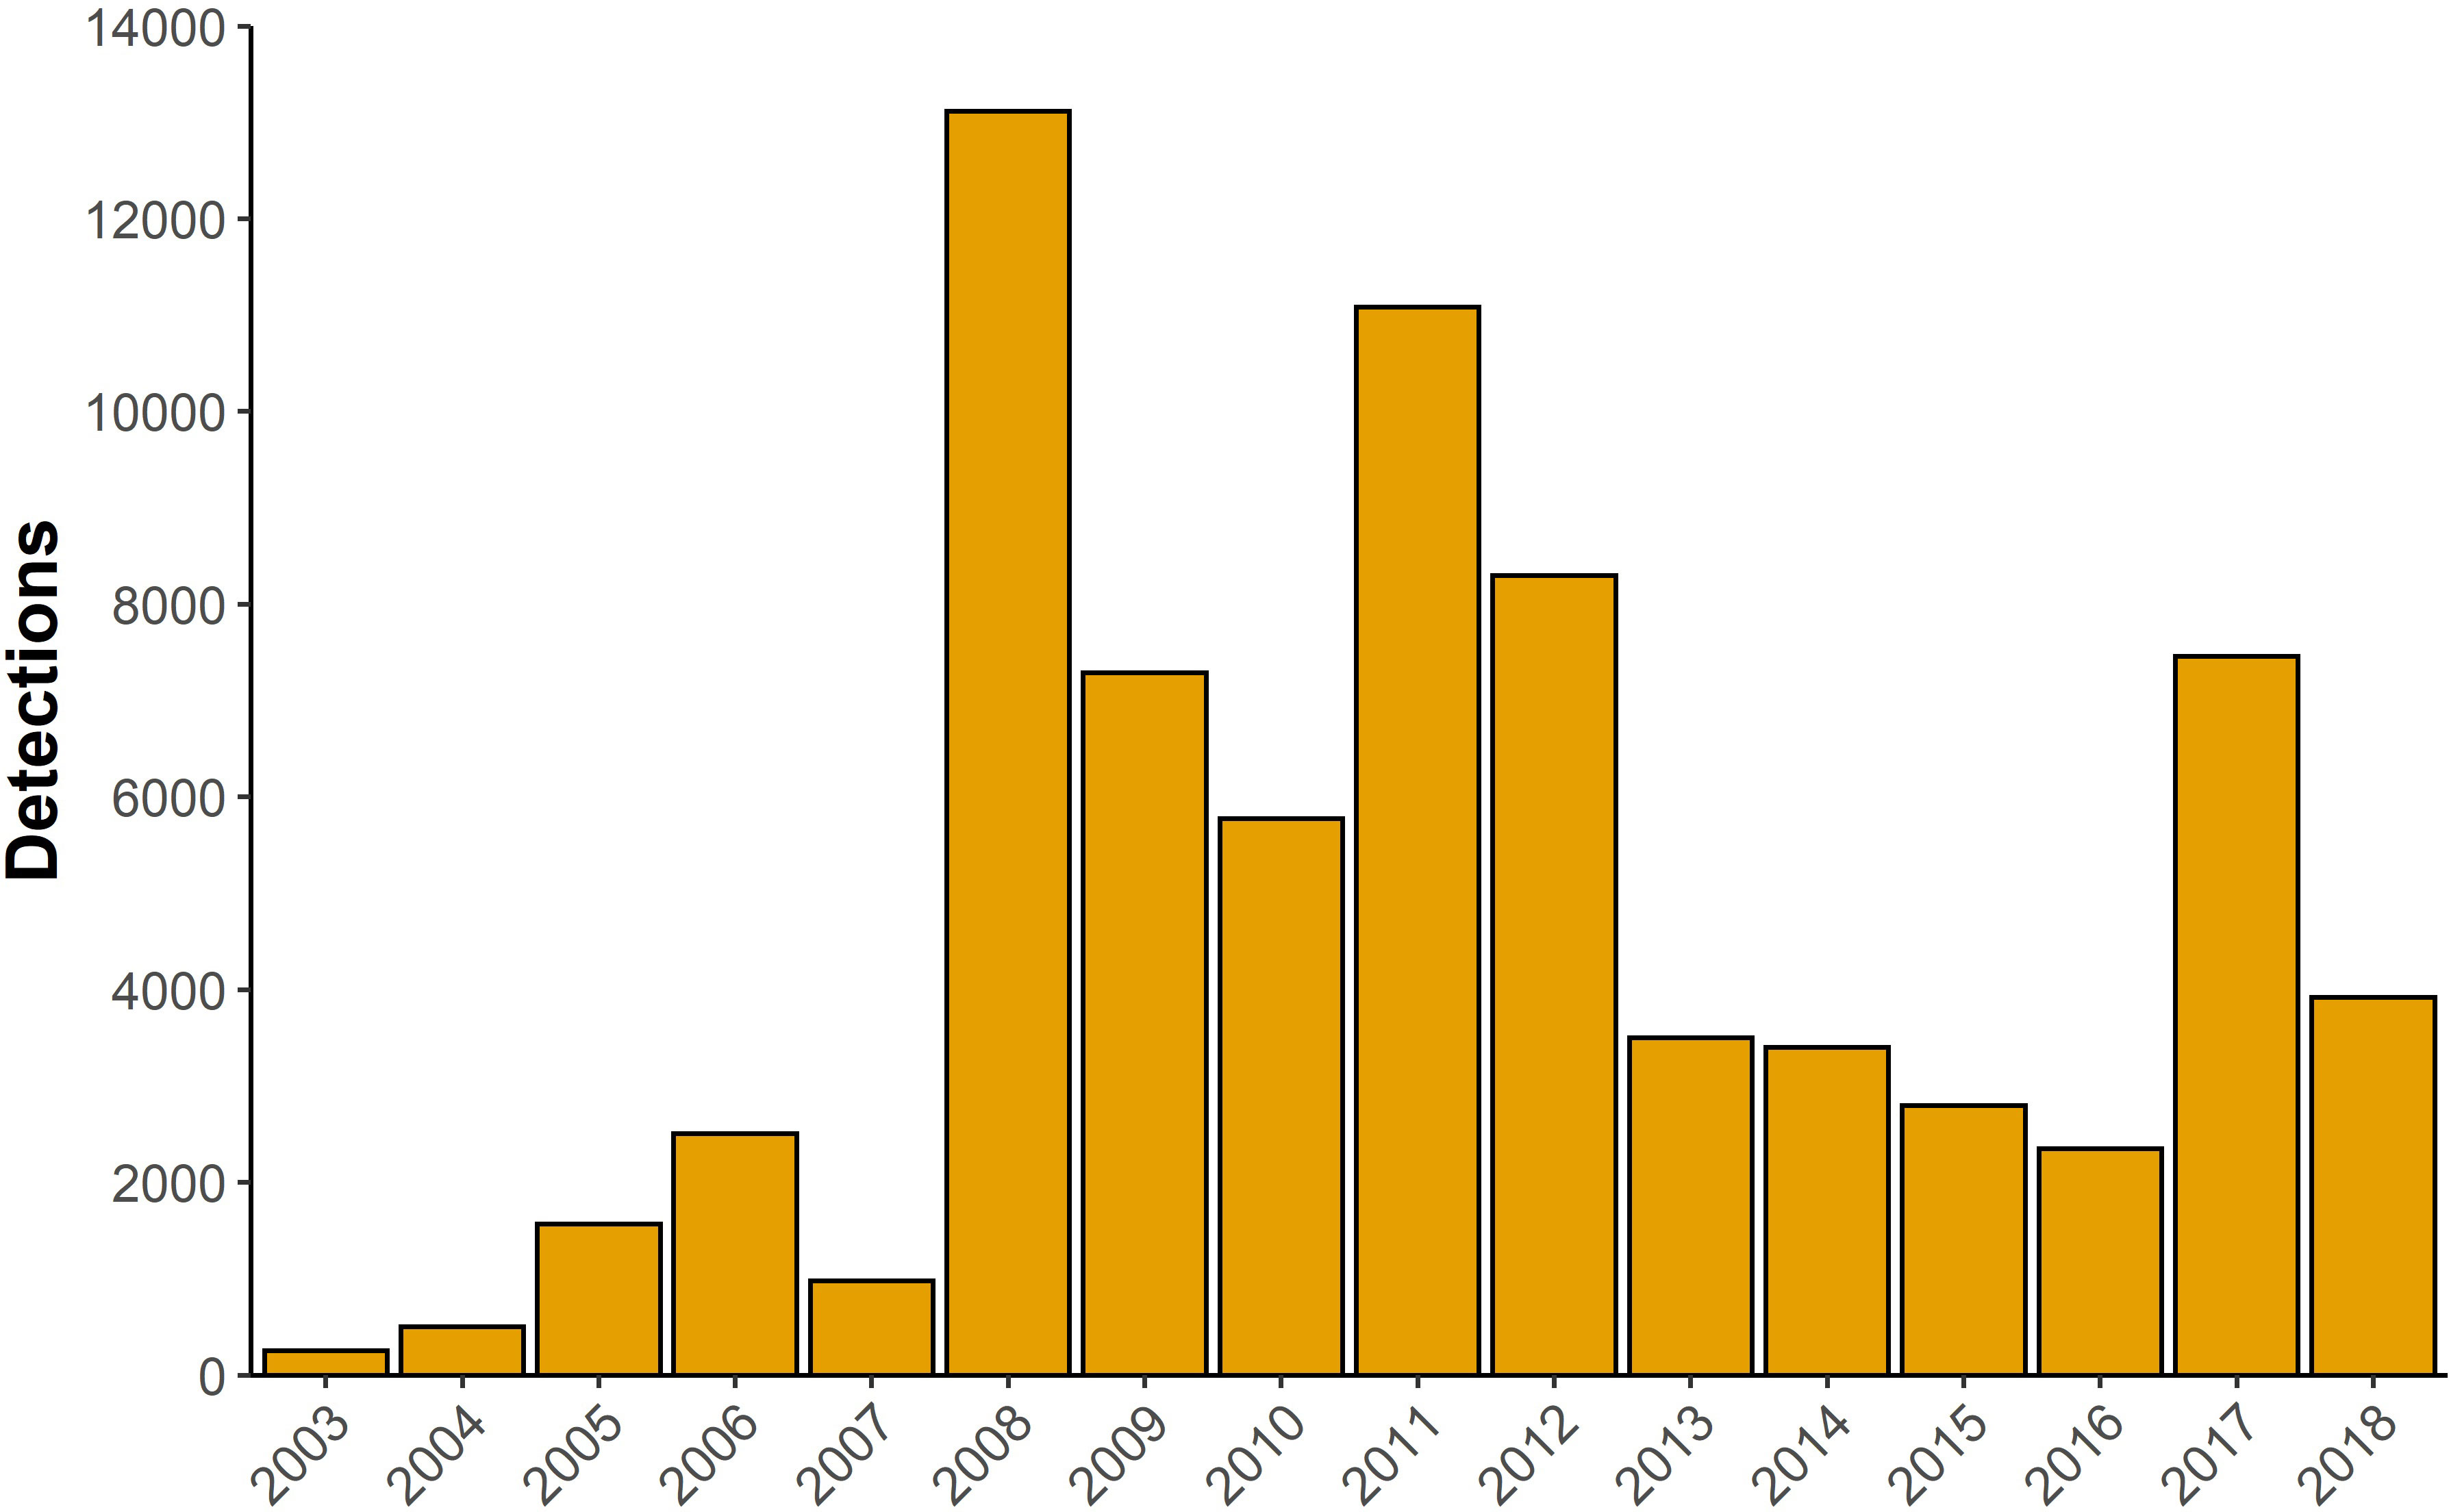
Figure 2 Total yearly number of eastern Indian Ocean (EIO) pygmy blue whale calls detected between 2003 and 2018 at Cape Leeuwin.
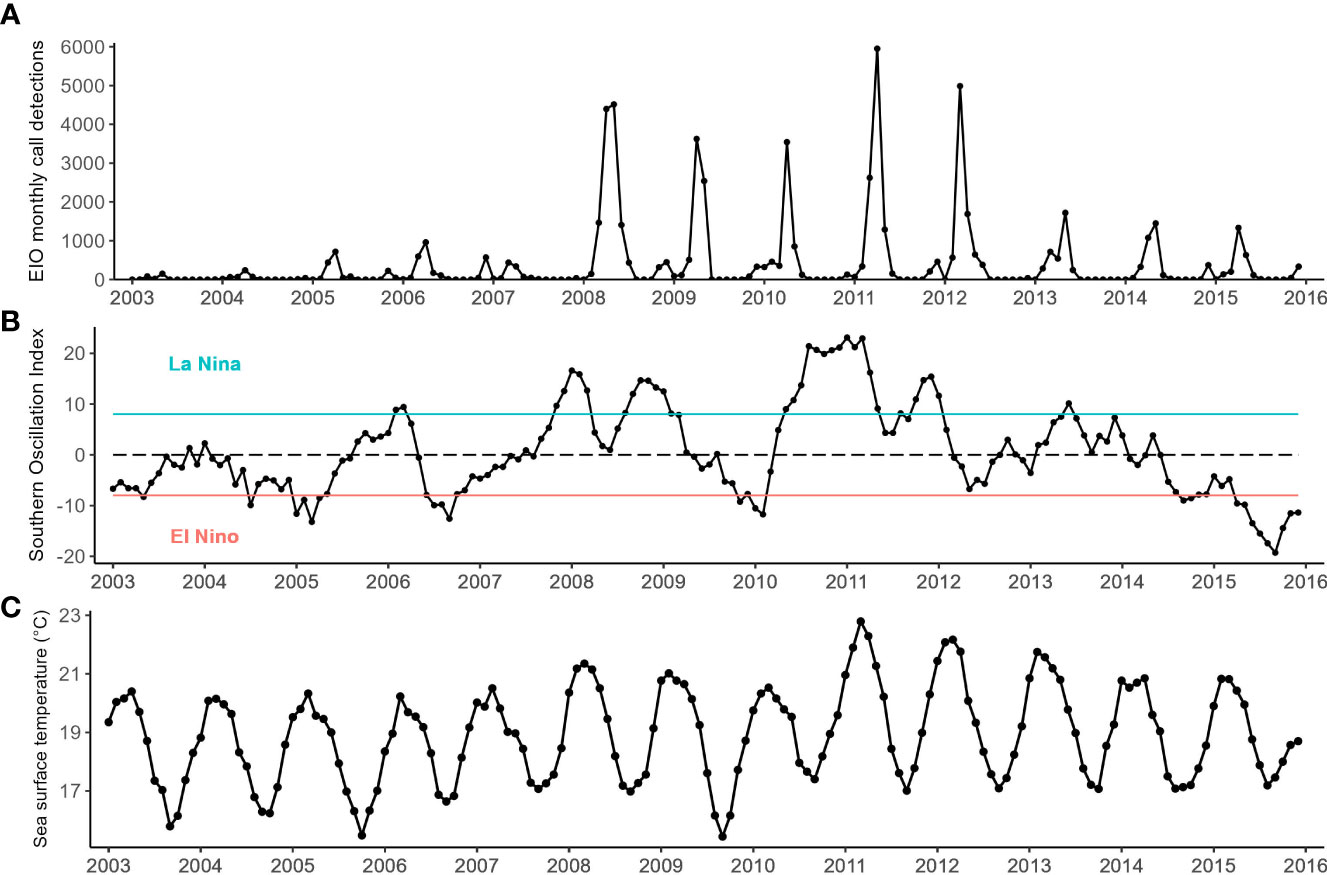
Figure 3 Monthly time series of (A) eastern Indian Ocean (EIO) pygmy blue whale call detections between 2003 and 2016 at Cape Leeuwin, Western Australia, (B) Southern oscillation index (SOI) obtained from the Australian Bureau of Meteorology calculated as a three-month running average between 2003 and 2016 SOI values above the green line indicate La Niña conditions; SOI values below the red line indicate El Niño conditions, (C) mean sea surface temperature measured across a 1° x 1° latitude and longitude grid centred around the Cape Leeuwin hydrophone.
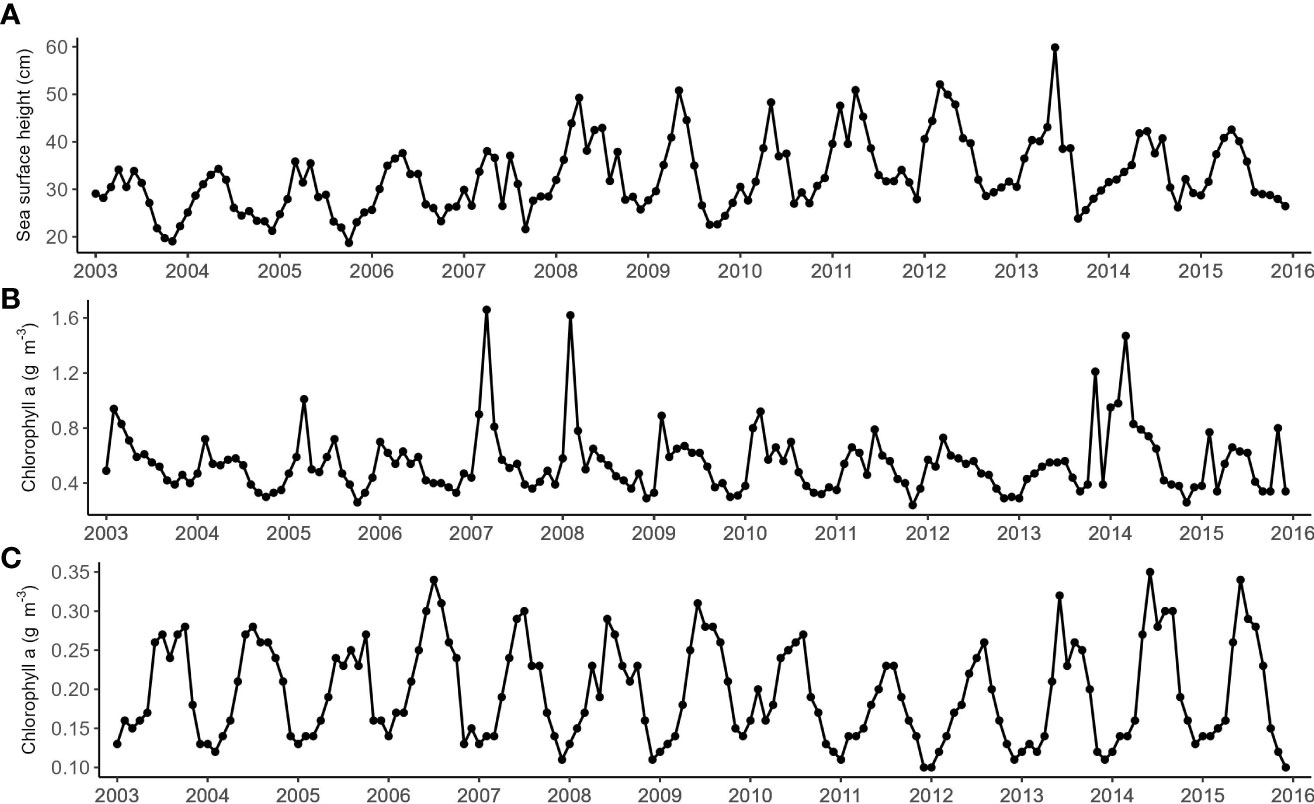
Figure 4 Monthly time series of (A) Sea surface height measured at Cape Leeuwin obtained from the AVISO multi-satellited mission. Chlorophyll-a obtained from Modis Aqua from the NOAA Ocean Watch - Central Pacific Program (B) measured at Cape Leeuwin, and (C) measured at the Bonney Upwelling. All variables were averaged from a 1° x 1° latitude and longitude grid at each location.
Statistical analysis
Yearly models
The negative binomial GLM showed a positive relationship between yearly-averaged SOI values and yearly EIO whale call detections (Figure 5; Coefficient estimate = 0.08, SE = 0.03, p = 0.0078, R2 = 0.567), where more calls were detected in years of higher SOI values corresponding to La Niña conditions. There was also a positive relationship with DMI and yearly call detections (Figure 6; Coefficient estimate = 2.85, SE = 1.24, p = 0.02, R2 = 0.124).
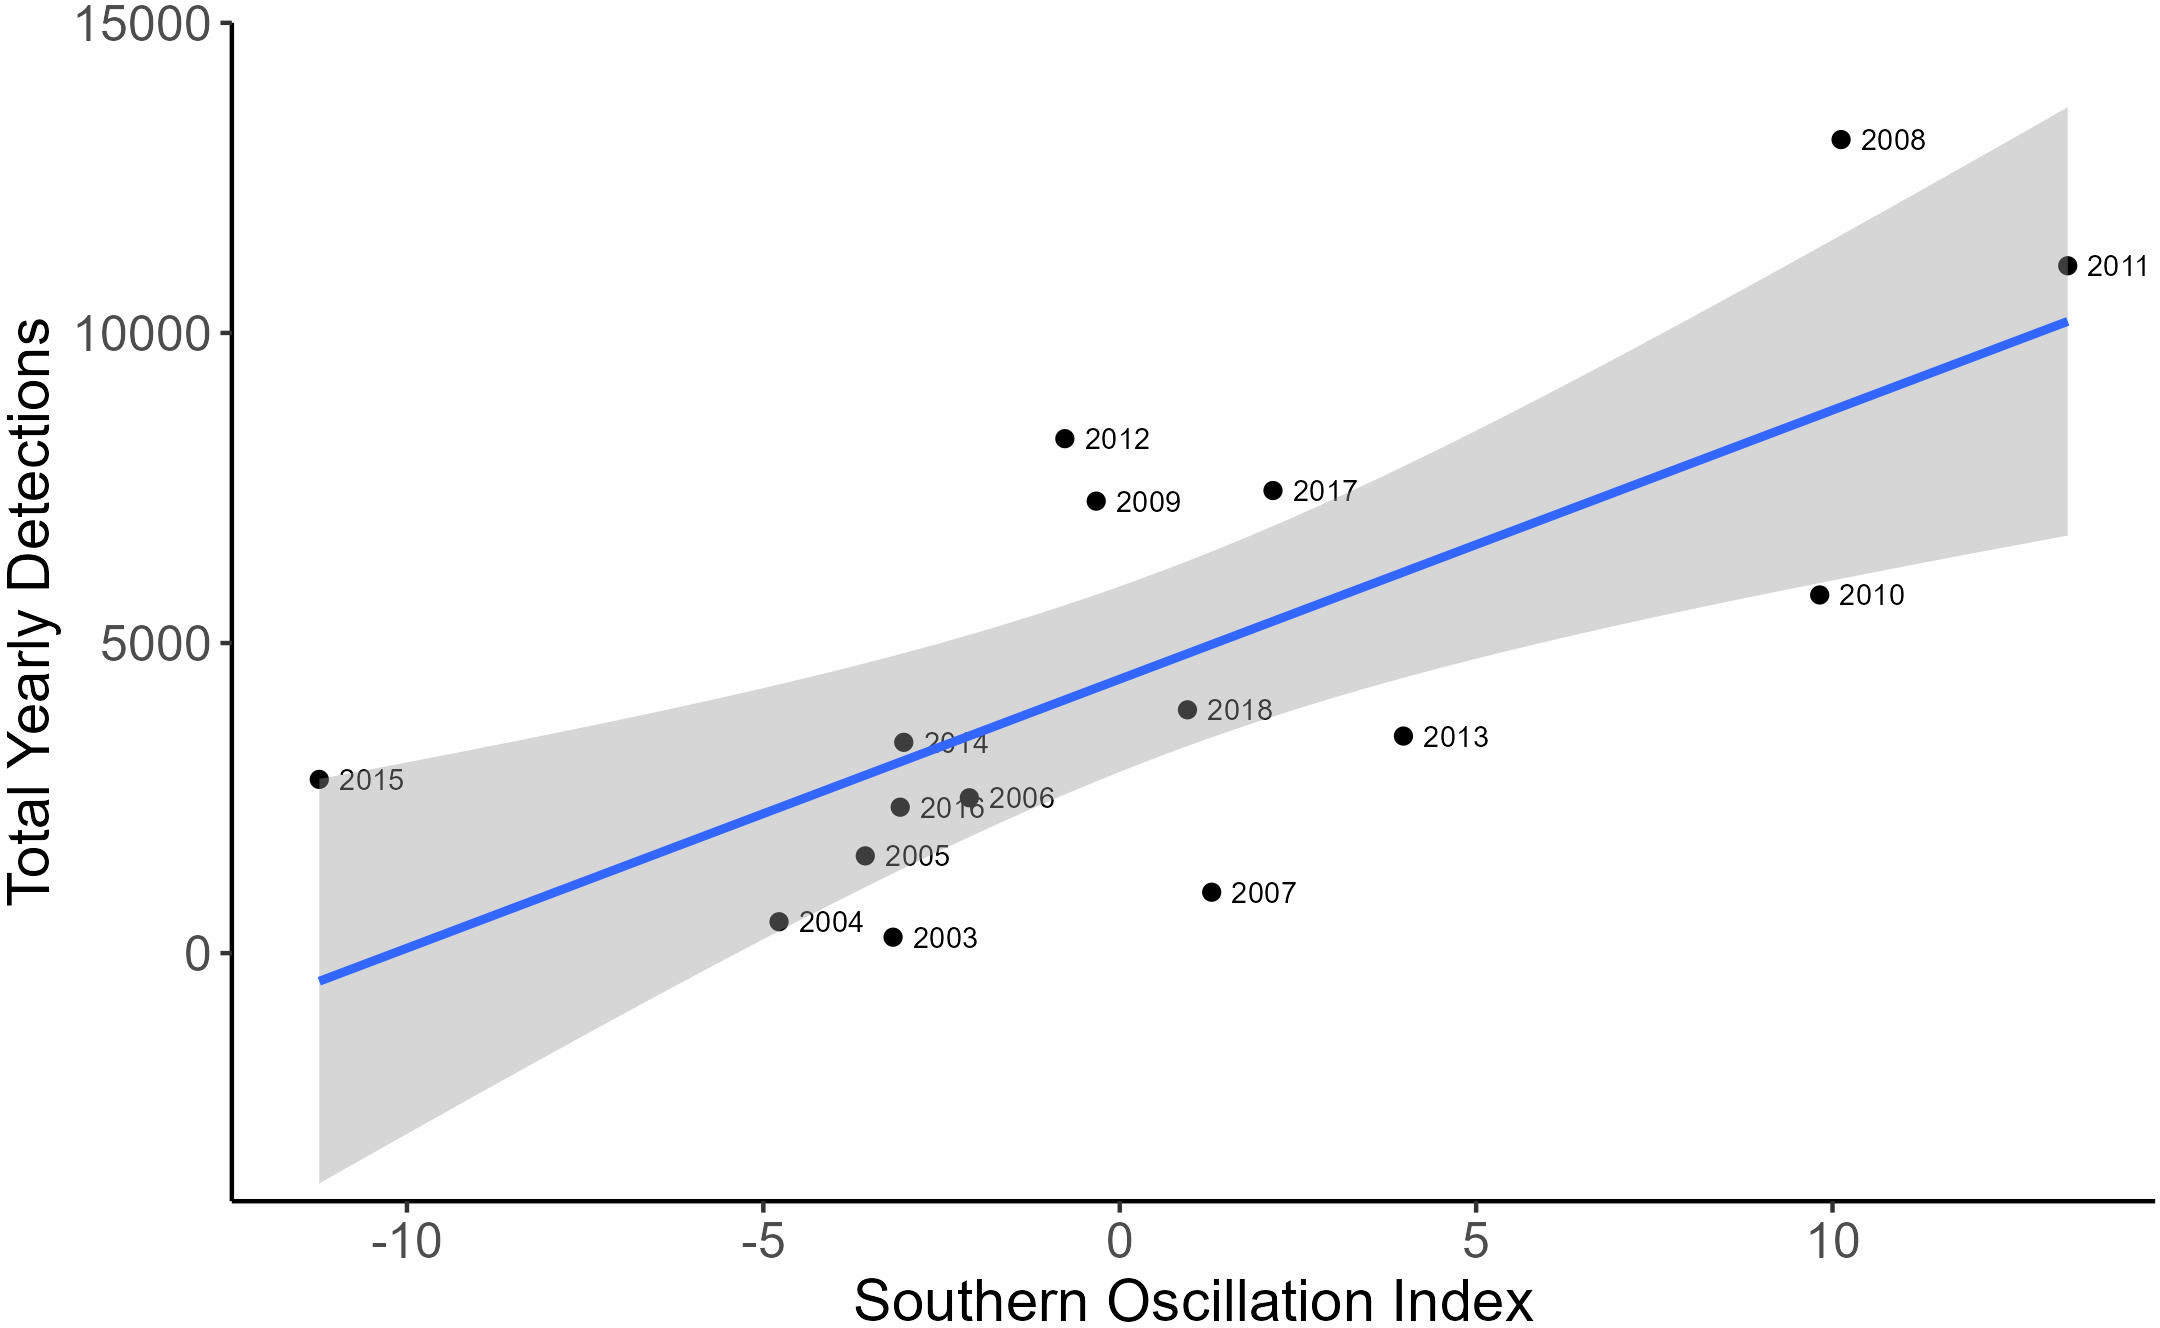
Figure 5 A scatterplot showing the correlation between the total yearly EIO pygmy blue whale call detections and yearly average southern oscillation index. The blue line represents line of best fit and the grey shaded area is estimated 95% confidence interval.
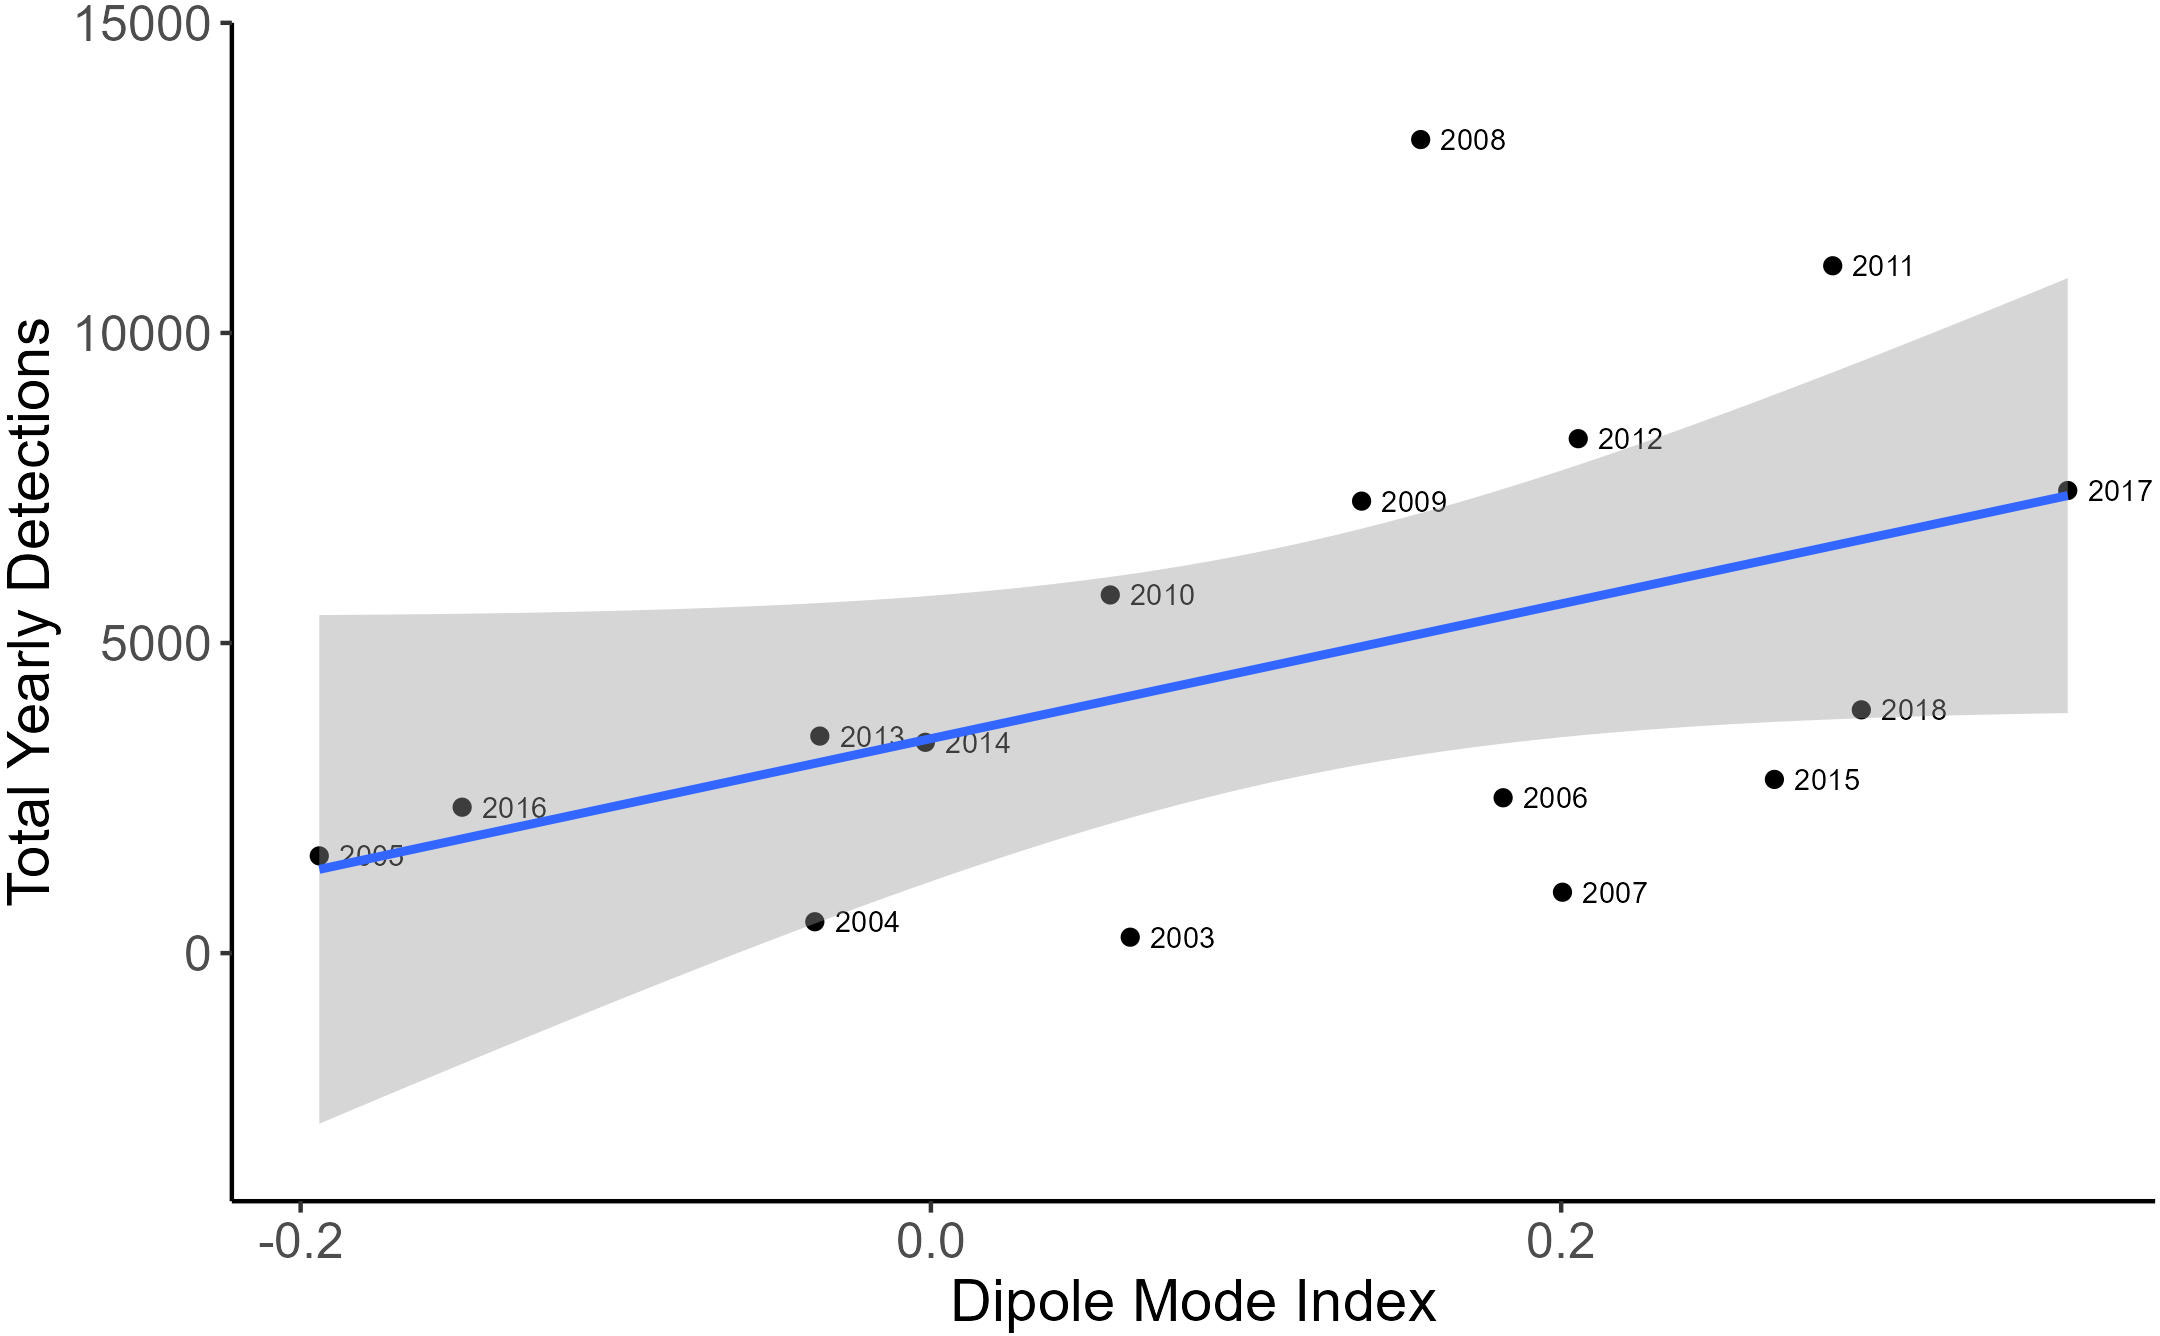
Figure 6 A scatterplot showing the correlation between the total yearly EIO pygmy blue whale call detections and yearly average dipole mode index. The blue line represents line of best fit and the grey shaded area is estimated 95% confidence interval.
Monthly models
The time series analyses accounted for possible autocorrelation with observations through time due to seasonality and possible population increase. The univariate models identified SOI as the best explanatory variable (Table 1). The multivariate model with the best fit included the variables SOI, SSH, SSC.HP, and SSC.BU (AIC = 1558.8, Table 2), with SST dropped from the final model. The next best model contained SSH, SSC.HP and SSC.BU (AIC = 1561.2, Table 2). Under the principle of parsimony, the second model with three explanatory terms would be the better model as the difference in AIC is only 2.4. Based on the second model SSH (Figure 7A, Coefficient estimate = 0.08, SE = 0.05) and SSC.BU (Figure 7B, Coefficient estimate = 1.15, SE = 1.0) were positively correlated with monthly whale call detections, while SSC.HP (Figure 7C, Coefficient estimate = -10.4, SE = 5.2) was negatively correlated with monthly whale call detections.
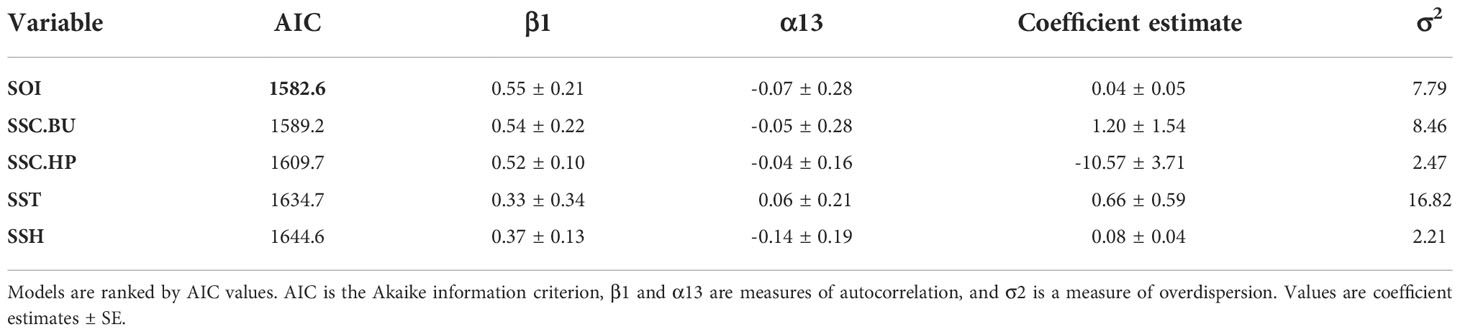
Table 1 Univariate models obtained from the monthly time series analysis with whale call count data.
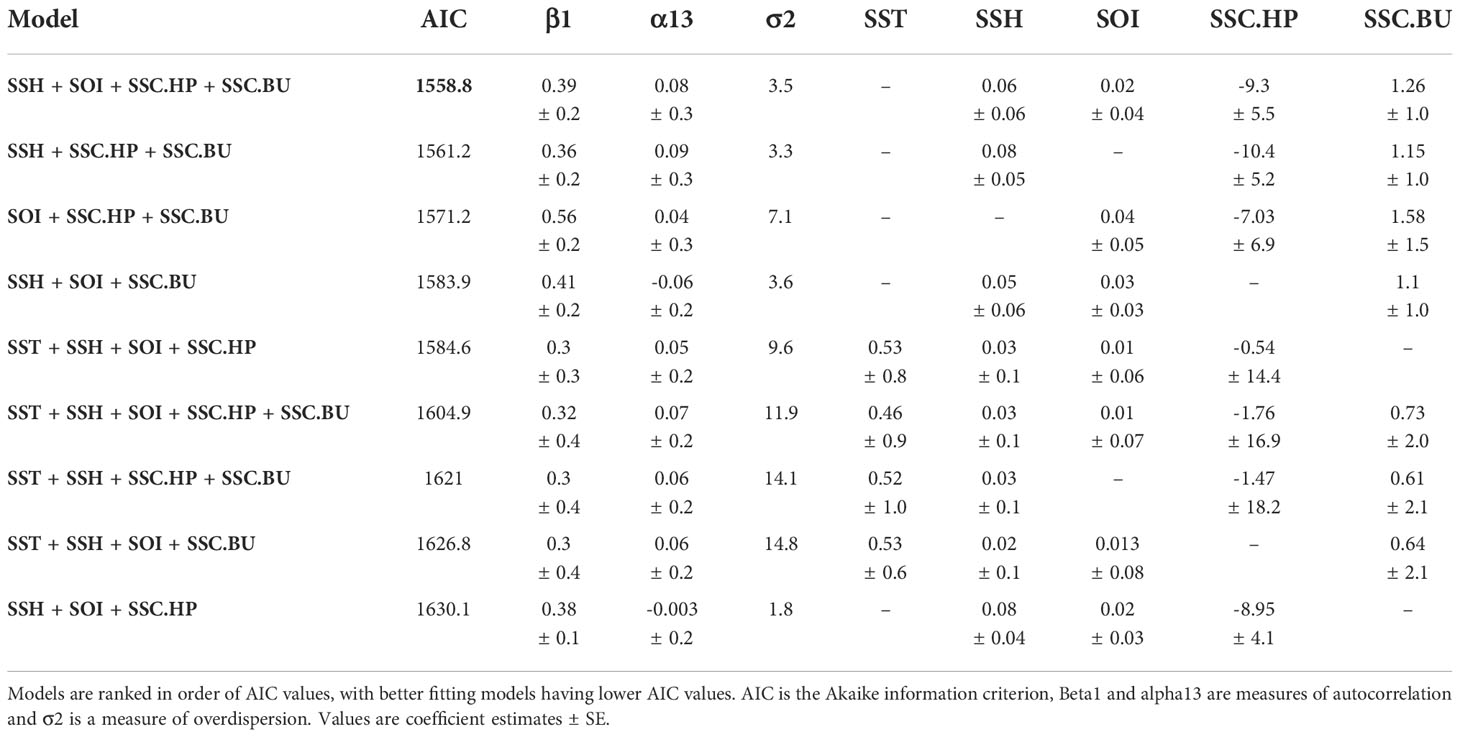
Table 2 Multivariate model selection with all variables and whale call detection counts as the dependent variable using a count time series analysis.
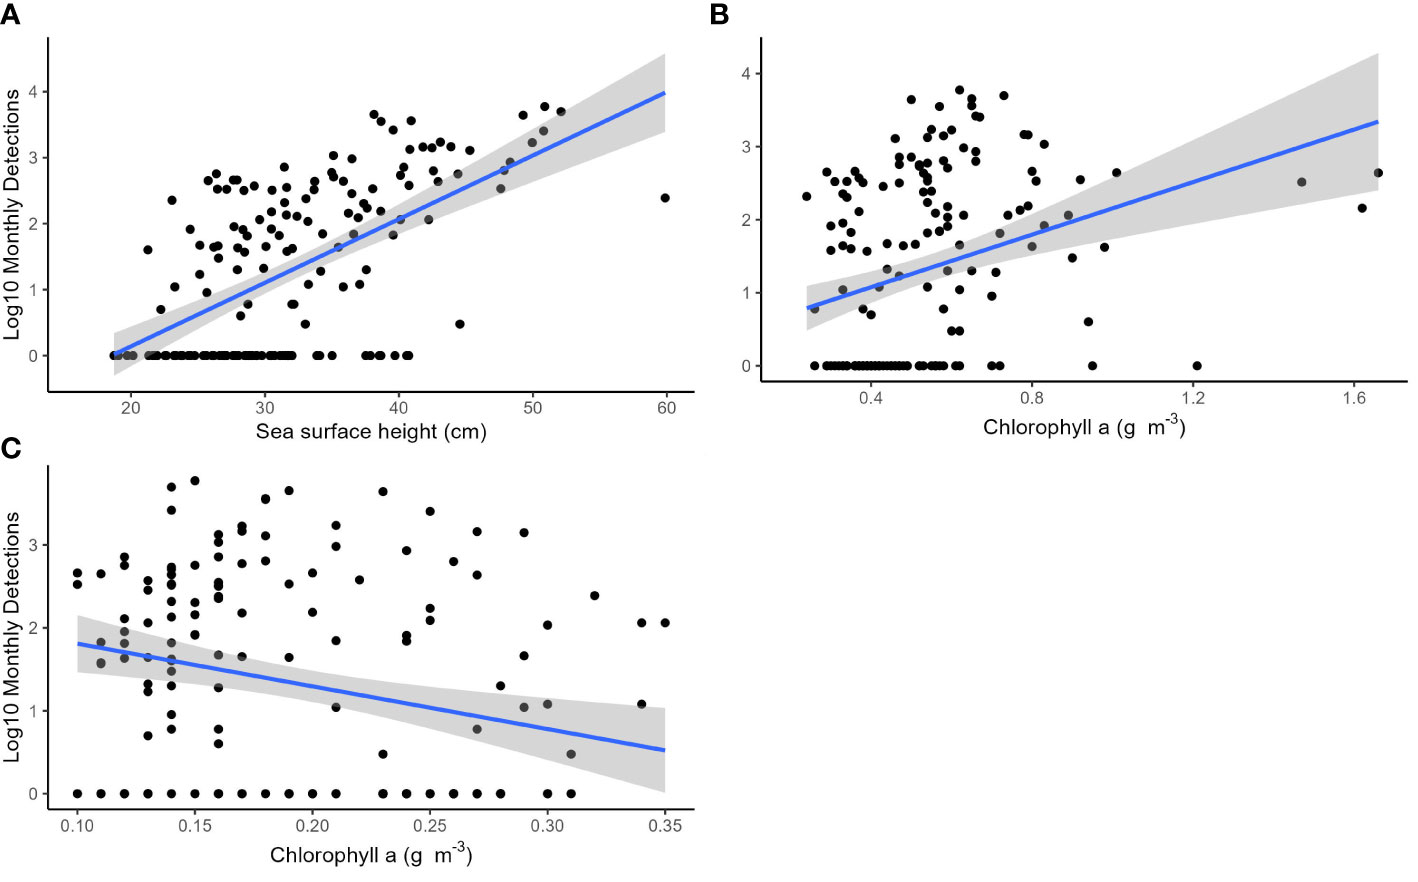
Figure 7 Scatterplots showing the correlation between the log10 monthly EIO pygmy blue whale call detections and (A) monthly average sea surface height at the Cape Leeuwin, (B) chlorophyll a measured at the Bonney Upwelling and (C) chlorophyll a measured at the Cape Leeuwin hydrophone. All environmental variables were averaged across a 1° x 1° latitude and longitude grid. The blue lines represent the lines of best fit and the grey shaded areas are estimated 95% confidence intervals.
Discussion
ENSO events were correlated with, and so likely had influence on, the number of EIO pygmy blue whale calls detected in the southeast Indian Ocean. The IOD was also correlated with the total number of yearly pygmy blue whale detections. Increased numbers of detected whale calls between 2008 and 2012 coincided with La Niña events over multiple consecutive years, with the highest number of calls detected in 2011 during the strongest La Niña event. The 2010/2011 La Niña, one of the strongest on record, was associated with unprecedented warming and strengthening of the Leeuwin Current (Feng et al., 2013). If we use the number of whale calls as a proxy for the number of migrating whales, the greater number of whale calls detected suggests that more whales migrate past the west coast of Australia during La Niña years, as our study area represents a corridor through which whales move between feeding areas and low-latitude breeding grounds. We propose that the tenfold increase in the number of blue whale calls detected from 2007 to 2008 and sustained through to 2012 is due to more whales migrating during this period. The increase in the number of whale calls detected after 2008 suggests that the whales change their behaviour, responding quickly to shifts in climatic conditions. The IOD is also correlated with blue whale call detections, but the relationship is not as strong as ENSO. There was no lag observed between the timing of increased whale call detections and the onset of the sustained La Niña conditions which commenced in 2008. Although the EIO population is believed to be recovering (McCauley et al., 2018), the increased number of call detections is likely not due to an increase in EIO blue whale population numbers, as a shift of this magnitude over such a short period is unrealistic. Rather, it likely represents a higher proportion of the whale population migrating past Cape Leeuwin.
La Niña and El Niño conditions likely affect ocean productivity and food availability within the southern Indian Ocean feeding grounds of EIO pygmy blue whales as it affects other oceanic regions (Wang and Fiedler, 2006; Messié and Chavez, 2012). Therefore, we speculate that there are at least two possible explanations for the change in the number of blue whale calls detected during La Niña years. The first is that more whales underwent the yearly migration from the Great Australian Bight past Cape Leeuwin during highly productive La Niña years, while fewer whales migrated during years of lower productivity. Monthly chlorophyll-a concentrations at the important GSACUS foraging location of the Bonney Upwelling were seasonal, which reflected the seasonal call detections of EIO whale calls at Cape Leeuwin. Chlorophyll-a concentrations at the hydrophone location were also seasonal, but out of sync with the number of whale call detections, explaining the observed negative relationship. Sea surface height at the hydrophone was also higher during La Niña conditions due to the strengthening of the Leeuwin Current. The variability in chlorophyll-a suggests that changes in food availability affect blue whale migratory behaviour. Firstly, the blue whales likely use partial migration strategies (Širović et al., 2004; Širović et al., 2009; Thomisch et al., 2016), typical of other migratory species (Chapman et al., 2011), so that only a proportion of the population migrates each year. Moving away from productive feeding grounds where krill are in high densities can be a risky strategy, as blue whales require large amounts of food to sustain their large body size and high energetic requirements (Goldbogen et al., 2011). The great distances that blue whales travel during migration are assumed to be energetically demanding. Therefore, individuals that are not in good body condition may skip migration altogether. In this case, the larger number of whale call detections suggests that a higher proportion of whales may have developed better body condition and underwent migration during La Niña years.
A second possible explanation is that a higher proportion of whales foraged within the GSACUS and subtropical convergence regions south of Australia during La Niña years, while during lower productivity years they foraged in areas away from Australia. Alternatively, EIO pygmy blue whales that typically feed in other regions within the Indian Ocean (Samaran et al., 2010; Samaran et al., 2013) may shift to feed in the Great Australian Bight in years when there are strong, sustained La Niña conditions, resulting in more whales migrating past the Cape Leeuwin hydrophone. Conditions within the Indian Ocean in La Niña years may make the GSACUS in the eastern Great Australian Bight a more favourable feeding site. Conversely, when conditions are not favourable and productivity is low, the whales may move to feed in other areas of the Indian Ocean (as far west as Amsterdam Island) and would therefore not be detected as they no longer pass by Cape Leeuwin during their northbound migration. A recent study of EIO pygmy blue whales in the central Indian Ocean showed an increase in the number of call detections from 2012 to 2016 near Amsterdam Island (Torterotot et al., 2020). This complements our results, where the number of call detections decreased after 2012 following the period of sustained La Niña conditions. This suggests that a higher number of EIO pygmy blue whales may have moved away from the Great Australian Bight towards the central Indian Ocean after 2012, potentially because of ENSO driven environmental conditions and altered prey availability. Further studies are needed to determine whether the whales detected in the central Indian Ocean are from the same population as those found in the GSACUS.
The monthly covariates that were examined had varied degrees of seasonality which to an extent was correlated with the seasonality of EIO pygmy blue whale call detections. SST had the most regular and predictable seasonality. SST and SSH peaked in autumn and were lowest in early spring. These patterns reflected the seasonal dynamics of the Leeuwin Current (Feng et al., 2009). During La Niña years, the Leeuwin Current experiences warming, and the southward flow strengthens (Feng et al., 2013). This too is reflected in the SST and SSH measured off Cape Leeuwin, where the annual peak temperature and height are elevated during La Niña years. Despite SSH and SST being influenced by La Niña conditions, models containing SST did not perform very well. A possible reason for SST not being a good predictor could be due to its highly predictable seasonality which does not correlate well with the less seasonally predictable blue whale calls. SSH is unlikely to directly influence blue whale movement patterns but may have an indirect relationship. SSH at Cape Leeuwin is largely driven by the strength of the Leeuwin Current, but SSH can also be influenced by upwelling and eddies which can change the availability of nutrients. Chlorophyll was also seasonal in nature, albeit not as regularly so as SST. Overall, chlorophyll levels at the Bonney Upwelling exceeded the levels measured at Cape Leeuwin. This supports the idea that feeding was more likely to occur along the Bonney coast then it was to occur at Cape Leeuwin. Furthermore, chlorophyll at Cape Leeuwin peaked during winter when the whales were further north, while chlorophyll peaked during summer at the Bonney Upwelling which is when the whales would be feeding. We used chlorophyll as a proxy for productivity, however it may not necessarily translate to krill availability or abundance. Satellite-measured chlorophyll also only reflects what is on the surface, so in-situ measurements at other depths could improve our models. The Bonney coast is not the only known feeding aggregation area within the GSACUS. Pygmy blue whales have also been observed feeding in the subtropical convergence zone (Garcia-Rojas et al., 2018). However, the subtropical convergence covers a large area and is highly variable in terms of upwelling and productivity, therefore analysis using the subtropical convergence was too broad and out of the scope for this study.
There are limitations in using acoustics to infer population level changes in migration patterns, as it can be difficult to differentiate whether calls come from multiple vocalising whales or a single, highly vocal individual. In addition, only singing individuals (i.e., males) are represented, as non-singing whales cannot be detected (Croll et al., 2002; Oleson et al., 2007). This means that the sampling could be biased towards male individuals and may not reflect the behaviour of female and non-vocalising whales. The conservative detector with a high detection threshold that we used meant that a substantial proportion of calling animals were missed. This was intentional, since we took a conservative approach for this study and aimed to capture whales closer to the hydrophone, rather than detecting faint calls from individuals much further away. To identify if there were changes in whale behaviour through time, our sampling design sampled in a standardised, continuous fashion, using a conservative acoustic detector that would be less influenced by changes in ambient sea noise. Whales were also only sampled as they migrate past the Cape Leeuwin hydrophone site, decreasing the likelihood of resampling the same animals over extended periods which would increase if we had also sampled within a feeding or breeding site. Additionally, it is also possible for individual whales to migrate further offshore and be out of range of the hydrophone. However, studies using satellite telemetry to track pygmy blue whales have shown that tagged individuals migrated close to the Cape Leeuwin hydrophone (Double et al., 2014; Möller et al., 2020).
ENSO events are predicted to become more intense under further climate change (Cai et al., 2014). The feeding success of baleen whales is dependent on synchronisation with planktonic production, which often occurs in pulses (Edwards and Richardson, 2004). Marine plankton has shown varied responses to climate change at different levels, leading to either a temporal or spatial mismatch between different trophic levels and their functional groups (Edwards and Richardson, 2004). Small animals with short life cycles and large population sizes will probably adapt to the longer growing seasons and be able to persist. However larger animals with longer life cycles and smaller population sizes are more likely to experience population decline (Bradshaw and Holzapfel, 2006). Extreme climatic events are predicted to disrupt phenotypic plasticity in marine birds (Lescroël et al., 2014), which means that the adaptability and resilience of other marine vertebrates should be called into question. Rates of observed shifts in the distribution and phenology (timing) of marine species are comparable to, or greater than, those for terrestrial systems (Poloczanska et al., 2013). The recovery of endangered whale populations would be influenced by their ability to adapt to these environmental changes.
This study of 16 years of whale acoustic presence, though covering a small subset of time in comparison to climate modelling studies, suggests that large-scale changes in environmental variability due to ENSO are potentially influencing the migration behaviour of blue whales. This period contained only two La Niña events and further sampling of additional La Niña events would provide a clearer picture of the impacts of ENSO events on whale migration. Our study highlights the importance of capitalising on archived, calibrated, long-term acoustic data (such as the CTBTO data) to examine the influence of periodic climatic signals such as ENSO in addition to long-term warming trends on whale migratory behaviour.
Data availability statement
The raw data supporting the conclusions of this article will be made available upon request by the authors, without undue reservation.
Ethics statement
Ethical review and approval was not required for the animal study because acoustic data was obtained passively with no direct impact on the animals.
Author contributions
Both authors conceived and designed the project, revised, and approved final manuscript. GT conducted blue whale acoustic analysis, statistical analysis and wrote the first draft of the manuscript. All authors contributed to the article and approved the submitted version.
Funding
GT was funded by an Australian Government Research Training Program Scholarship. Additional funding was also provided by the Winifred Violet Scott Estate Charitable Trust.
Acknowledgments
We thank Gordana Popovic for providing advice on the statistical analysis. We also thank members of the Mammal Lab for their comments on the manuscript. We greatly appreciate the comments provided by the reviewers. Their feedback has greatly improved the manuscript. Data was made available via a vDEC contract with the CTBTO. The findings and conclusion in this manuscript are those of the authors and do not necessarily represent the views of the CTBTO.
Conflict of interest
The authors declare that the research was conducted in the absence of any commercial or financial relationships that could be construed as a potential conflict of interest.
Publisher’s note
All claims expressed in this article are solely those of the authors and do not necessarily represent those of their affiliated organizations, or those of the publisher, the editors and the reviewers. Any product that may be evaluated in this article, or claim that may be made by its manufacturer, is not guaranteed or endorsed by the publisher.
References
Atkinson A., Siegel V., Pakhomov E., Rothery P. (2004). Long-term decline in krill stock and increase in salps within the Southern Ocean. Nature 432 (7013), 100–103. doi: 10.1038/nature02996
Auer S. K., Martin T. E. (2013). Climate change has indirect effects on resource use and overlap among coexisting bird species with negative consequences for their reproductive success. Global Change Biol. 19 (2), 411–419. doi: 10.1111/gcb.12062
Balcazar N. E., Tripovich J. S., Klinck H., Nieukirk S. L., Mellinger D. K., Dziak R. P., et al. (2015). Calls reveal population structure of blue whales across the southeast Indian ocean and the southwest pacific ocean. J. Mammalogy 96 (6), 1184–1193. doi: 10.1093/jmammal/gyv126
Boyd I. (1996). Individual variation in the duration of pregnancy and birth date in Antarctic fur seals: The role of environment, age, and sex of fetus. J. Mammalogy 77 (1), 124–133. doi: 10.2307/1382714
Bradshaw W. E., Holzapfel C. M. (2006). Evolutionary response to rapid climate change. Science 312 (5779), 1477–1478. doi: 10.1126/science.1127000
Braithwaite J. E., Meeuwig J. J., Letessier T. B., Jenner K. C. S., Brierley A. S. (2015). From sea ice to blubber: Linking whale condition to krill abundance using historical whaling records. Polar Biol. 38 (8), 1195–1202. doi: 10.1007/s00300-015-1685-0
Branch T. A., Stafford K. M., Palacios D. M., Allison C., Bannister J. L., Burton C. L. K., et al. (2007). Past and present distribution, densities and movements of blue whales Balaenoptera musculus in the southern hemisphere and northern Indian ocean. Mammal Rev. 37 (2), 116–175. doi: 10.1111/j.1365-2907.2007.00106.x
Brodie P. F. (1975). Cetacean energetics, an overview of intraspecific size variation. Ecology 56 (1), 152–161. doi: 10.2307/1935307
Burrows M. T., Schoeman D. S., Buckley L. B., Moore P., Poloczanska E. S., Brander K. M., et al. (2011). The pace of shifting climate in marine and terrestrial ecosystems. Science 334 (6056), 652–655. doi: 10.1126/science.1210288
Cai W., Borlace S., Lengaigne M., van Rensch P., Collins M., Vecchi G., et al. (2014). Increasing frequency of extreme El Niño events due to greenhouse warming. Nat. Climate Change 4 (2), 111–116. doi: 10.1038/nclimate2100
Chapman B. B., Brönmark C., Nilsson J.-Å., Hansson L.-A. (2011). The ecology and evolution of partial migration. Oikos 120 (12), 1764–1775. doi: 10.1111/j.1600-0706.2011.20131.x
Croll D. A., Clark C. W., Acevedo A., Tershy B., Flores S., Gedamke J., et al. (2002). Only male fin whales sing loud songs. Nature 417 (6891), 809–809. doi: 10.1038/417809a
Double M. C., Andrews-Goff V., Jenner K. C. S., Jenner M.-N., Laverick S. M., Branch T. A., et al. (2014). Migratory movements of pygmy blue whales (Balaenoptera musculus brevicauda) between Australia and Indonesia as revealed by satellite telemetry. PLoS One 9 (4), e93578. doi: 10.1371/journal.pone.0093578
Edwards M., Richardson A. J. (2004). Impact of climate change on marine pelagic phenology and trophic mismatch. Nature 430 (7002), 881–884. doi: 10.1038/nature02808
Feng M., McPhaden M. J., Xie S.-P., Hafner J. (2013). La niña forces unprecedented leeuwin current warming in 2011. Sci. Rep. 3 (1), 1–9. doi: 10.1038/srep01277
Feng M., Waite A. M., Thompson P. A. (2009). Climate variability and ocean production in the leeuwin current system off the west coast of Western Australia. J. R. Soc. Western Aust. 92, 67.
Garcia-Rojas M. I., Jenner K. C. S., Gill P. C., Jenner M. N. M., Sutton A. L., McCauley R. D. (2018). Environmental evidence for a pygmy blue whale aggregation area in the subtropical convergence zone south of Australia. Mar. Mammal Sci. 34 (4), 901–923. doi: 10.1111/mms.12494
Gill P. C. (2002). A blue whale (Balaenoptera musculus) feeding ground in a southern Australian coastal upwelling zone. J. Cetacean Res. Manage. 4 (2), 179–184. doi: 10.3354/meps08914
Gill P. C., Morrice M. G., Page B., Pirzl R., Levings A. H., Coyne M. (2011). Blue whale habitat selection and within-season distribution in a regional upwelling system off southern Australia. Mar. Ecol. Prog. Ser. 421, 243–263. doi: 10.3354/meps08914
Goldbogen J., Calambokidis J., Oleson E., Potvin J., Pyenson N. D., Schorr G., et al. (2011). Mechanics, hydrodynamics and energetics of blue whale lunge feeding: efficiency dependence on krill density. J. Exp. Biol. 214 (1), 131–146. doi: 10.1242/jeb.048157
Jolliffe C. D., McCauley R. D., Gavrilov A. N., Jenner K. C. S., Jenner M. N. M., Duncan A. J. (2019). Song variation of the south Eastern Indian ocean pygmy blue whale population in the Perth canyon, Western Australia. PLoS One 14 (1), e0208619. doi: 10.1371/journal.pone.0208619
Kämpf J. (2010). On preconditioning of coastal upwelling in the eastern great Australian bight. J. Geophysical Research: Oceans 115 (C12). doi: 10.1029/2010JC006294
Kroeker K. J., Kordas R. L., Crim R., Hendriks I. E., Ramajo L., Singh G. S., et al. (2013). Impacts of ocean acidification on marine organisms: quantifying sensitivities and interaction with warming. Global Change Biol. 19 (6), 1884–1896. doi: 10.1111/gcb.12179
Learmonth J. A., MacLeod C. D., Santos M. B., Pierce G. J., Crick H., Robinson R. (2006). Potential effects of climate change on marine mammals. Oceanography Mar. Biol. 44, 431. doi: 10.1201/9781420006391.ch8
Lescroël A., Ballard G., Grémillet D., Authier M., Ainley D. G. (2014). Antarctic Climate change: Extreme events disrupt plastic phenotypic response in adélie penguins. PLoS One 9 (1), e85291. doi: 10.1371/journal.pone.0085291
Liboschik T., Fokianos K., Fried R. (2017). Tscount: An R package for analysis of count time series following generalized linear models. J. Stat. Software 82 (5), 1–51. doi: 10.18637/jss.v082.i05
Lockyer C. (1986). Body fat condition in northeast Atlantic fin whales, Balaenoptera physalus, and its relationship with reproduction and food resource. Can. J. Fisheries Aquat. Sci. 43 (1), 142–147. doi: 10.1139/f86-015
Magera A. M., Flemming J. E. M., Kaschner K., Christensen L. B., Lotze H. K. (2013). Recovery trends in marine mammal populations. PLoS One 8 (10), e77908. doi: 10.1371/journal.pone.0077908
McCauley R. D., Gavrilov A. N., Jolliffe C. D., Ward R., Gill P. C. (2018). Pygmy blue and Antarctic blue whale presence, distribution and population parameters in southern Australia based on passive acoustics. Deep Sea Res. Part II: Topical Stud. Oceanography 157, 154–168. doi: 10.1016/j.dsr2.2018.09.006
McCauley R., Jenner C. (2010). Migratory patterns and estimated population size of pygmy blue whales (Balaenoptera musculus brevicauda) traversing the Western Australian coast based on passive acoustics (No. IWC SC/62/SH26). International Whaling Commission.
McDonald M. A., Mesnick S. L., Hildebrand J. A. (2006). Biogeographic characterization of blue whale song worldwide: using song to identify populations. J. Cetacean Res. Manage. 8 (1), 55–65.
McPhaden M. J., Zebiak S. E., Glantz M. H. (2006). ENSO as an integrating concept in earth science. Science 314 (5806), 1740–1745. doi: 10.1126/science.1132588
Mellinger D. K., Nieukirk S. L., Heimlich S. L. (2018). Ishmael 3.0 User Guide. Available online at: http://www.bioacoustics.us/ishmael.html.
Messié M., Chavez F. P. (2012). A global analysis of ENSO synchrony: The oceans' biological response to physical forcing. J. Geophysical Research: Oceans 117 (C9). doi: 10.1029/2012JC007938
Möller L. M., Attard C. R., Bilgmann K., Andrews-Goff V., Jonsen I., Paton D., et al. (2020). Movements and behaviour of blue whales satellite tagged in an Australian upwelling system. Sci. Rep. 10 (1), 1–19. doi: 10.1038/s41598-020-78143-2
Molnár P. K., Derocher A. E., Thiemann G. W., Lewis M. A. (2010). Predicting survival, reproduction and abundance of polar bears under climate change. Biol. Conserv. 143 (7), 1612–1622. doi: 10.1016/j.biocon.2010.04.004
Montes-Hugo M., Doney S. C., Ducklow H. W., Fraser W., Martinson D., Stam- merjohn S. E., et al. (2009). Recent changes in phytoplankton communities associated with rapid regional climate change along the western Antarctic peninsula. Science 323 (5920), 1470–1473. doi: 10.1126/science.1164533
Mulvaney R., Abram N. J., Hindmarsh R. C., Arrowsmith C., Fleet L., Triest J., et al. (2012). Recent Antarctic peninsula warming relative to Holocene climate and ice-shelf history. Nature 489 (7414), 141–144. doi: 10.1038/nature11391
Oleson E. M., Calambokidis J., Burgess W. C., McDonald M. A., LeDuc C. A., Hildebrand J. A. (2007). Behavioral context of call production by eastern north pacific blue whales. Mar. Ecol. Prog. Ser. 330, 269–284. doi: 10.3354/meps330269
Parmesan C. (2006). Ecological and evolutionary responses to recent climate change. Annu. Rev. Ecology Evolution Systematics 37, 637–669. doi: 10.1146/annurev.ecolsys.37.091305.110100
Poloczanska E. S., Brown C. J., Sydeman W. J., Kiessling W., Schoeman D. S., Moore P. J., et al. (2013). Global imprint of climate change on marine life. Nat. Climate Change 3 (10), 919–925. doi: 10.1038/nclimate1958
Post E., Bhatt U. S., Bitz C. M., Brodie J. F., Fulton T. L., Hebblewhite M., et al. (2013). Ecological consequences of sea-ice decline. Science 341 (6145), 519–524. doi: 10.1126/science.1235225
Post E., Forchhammer M. C. (2008). Climate change reduces reproductive success of an arctic herbivore through trophic mismatch. Philos. Trans. R. Soc. B: Biol. Sci. 363 (1501), 2367–2373. doi: 10.1098/rstb.2007.2207
R Core Team (2020). R: A language and environment for statistical computing (Vienna, Austria: R Foundation for Statistical Computing). Available at: https://www.R-project.org/.
Read A. J., Gaskin D. E. (1990). Changes in growth and reproduction of harbour porpoises, phocoena phocoena, from the bay of fundy. Can. J. Fisheries Aquat. Sci. 47 (11), 2158–2163. doi: 10.1139/f90-240
Rosenzweig C., Karoly D., Vicarelli M., Neofotis P., Wu Q., Casassa G., et al. (2008). Attributing physical and biological impacts to anthropogenic climate change. Nature 453 (7193), 353–357. doi: 10.1038/nature06937
Saenko O. A., Fyfe J. C., England M. H. (2005). On the response of the oceanic wind-driven circulation to atmospheric CO2 increase. Climate Dynamics 25 (4), 415–426. doi: 10.1007/s00382-005-0032-5
Samaran F., Adam O., Guinet C. (2010). Discovery of a mid-latitude sympatric area for two southern hemisphere blue whale subspecies. Endangered Species Res. 12 (2), 157–165. doi: 10.3354/esr00302
Samaran F., Stafford K. M., Branch T. A., Gedamke J., Royer J.-Y., Dziak R. P., et al. (2013). Seasonal and geographic variation of southern blue whale subspecies in the Indian ocean. PLoS One 8 (8), e71561. doi: 10.1371/annotation/01e9ce55-8fc3-4eda-964d-755ad7e70e72
Širović A., Hildebrand J. A., Wiggins S. M., McDonald M. A., Moore S. E., Thiele D. (2004). Seasonality of blue and fin whale calls and the influence of sea ice in the Western Antarctic peninsula. Deep Sea Res. Part II: Topical Stud. Oceanography 51 (17-19), 2327–2344. doi: 10.1016/j.dsr2.2004.08.005
Širović A., Hildebrand J. A., Wiggins S. M., Thiele D. (2009). Blue and fin whale acoustic presence around Antarctica during 2003 and 2004. Mar. Mammal Sci. 25 (1), 125–136. doi: 10.1111/j.1748-7692.2008.00239.x
Stuart-Smith R. D., Edgar G. J., Barrett N. S., Kininmonth S. J., Bates A. E. (2015). Thermal biases and vulnerability to warming in the world’s marine fauna. Nature 528 (7580), 88–92. doi: 10.1038/nature16144
Thomisch K., Boebel O., Clark C. W., Hagen W., Spiesecke S., Zitterbart D. P., et al. (2016). Spatio-temporal patterns in acoustic presence and distribution of Antarctic blue whales Balaenoptera musculus intermedia in the weddell Sea. Endangered Species Res. 30, 239–253. doi: 10.3354/esr00739
Thums M., Ferreira L. C., Jenner C., Jenner M., Harris D., Davenport A., et al. (2022). Pygmy blue whale movement, distribution and important areas in the Eastern Indian ocean. Global Ecol. Conserv. 35, e02054. doi: 10.1016/j.gecco.2022.e02054
Torterotot M., Samaran F., Stafford K. M., Royer J.-Y. (2020). Distribution of blue whale populations in the southern Indian ocean based on a decade of acoustic monitoring. Deep Sea Res. Part II: Topical Stud. Oceanography 179, 104874. doi: 10.1016/j.dsr2.2020.104874
Tripovich J. S., Klinck H., Nieukirk S. L., Adams T., Mellinger D. K., Balcazar N. E., et al. (2015). Temporal segregation of the Australian and Antarctic blue whale call types (Balaenoptera musculus spp.). J. Mammalogy 96 (3), 603–610. doi: 10.1093/jmammal/gyv065
Truong G., Rogers T. L. (2021). Seasonal occurrence of sympatric blue whale subspecies: the Chilean and southeast Indian ocean pygmy blue whales with the Antarctic blue whale. Front. Mar. Sci. 8. doi: 10.3389/fmars.2021.671145
Turney C. S., Fogwill C. J., Palmer J. G., van Sebille E., Thomas Z., McGlone M., et al. (2017). Tropical forcing of increased southern ocean climate variability revealed by a 140-year subantarctic temperature reconstruction. Climate Past 13 (3), 231–248. doi: 10.5194/cp-13-231-2017
Walther G.-R., Post E., Convey P., Menzel A., Parmesan C., Beebee T. J. C., et al. (2002). Ecological responses to recent climate change. Nature 416, 389. doi: 10.1038/416389a
Wang C., Fiedler P. C. (2006). ENSO variability and the eastern tropical pacific: A review. Prog. oceanography 69 (2-4), 239–266. doi: 10.1016/j.pocean.2006.03.004
Ward T. M., McLeay L. J., Dimmlich W. F., Rogers P. J., McClatchie S., Matthews R., et al. (2006). Pelagic ecology of a northern boundary current system: Effects of upwelling on the production and distribution of sardine (Sardinops sagax), anchovy (Engraulis australis) and southern bluefin tuna (Thunnus maccoyii) in the great Australian bight. Fisheries Oceanography 15 (3), 191–207. doi: 10.1111/j.1365-2419.2006.00353.x
Whitehead H. (1996). Variation in the feeding success of sperm whales: Temporal scale, spatial scale and relationship to migrations. J. Anim. Ecol. 65 (4), 429–438. doi: 10.2307/5778
Wijffels S., Roemmich D., Monselesan D., Church J., Gilson J. (2016). Ocean temperatures chronicle the ongoing warming of earth. Nat. Climate Change 6 (2), 116–118. doi: 10.1038/nclimate2924
Wiley D. N., Clapham P. J. (1993). Does maternal condition affect the sex ratio of offspring in humpback whales? Anim. Behav. 46 (2), 321–324. doi: 10.1006/anbe.1993.1193
Wu L., Cai W., Zhang L., Nakamura H., Timmermann A., Joyce T., et al. (2012). Enhanced warming over the global subtropical western boundary currents. Nat. Climate Change 2 (3), 161–166. doi: 10.1038/nclimate1353
Keywords: pygmy blue whales, passive acoustic monitoring (PAM), El Niño southern oscillation, chlorophyll-a, long-term data, environmental drivers, La Niña, Indian Ocean
Citation: Truong G and Rogers TL (2023) La Niña conditions influence interannual call detections of pygmy blue whales in the eastern Indian Ocean. Front. Mar. Sci. 9:850162. doi: 10.3389/fmars.2022.850162
Received: 07 January 2022; Accepted: 23 November 2022;
Published: 20 March 2023.
Edited by:
Olaf Meynecke, Griffith Sciences, Griffith University, AustraliaReviewed by:
John P. Ryan, Monterey Bay Aquarium Research Institute (MBARI), United StatesRobert McCauley, Curtin University, Australia
Michele Thums, Australian Institute of Marine Science (AIMS), Australia
Copyright © 2023 Truong and Rogers. This is an open-access article distributed under the terms of the Creative Commons Attribution License (CC BY). The use, distribution or reproduction in other forums is permitted, provided the original author(s) and the copyright owner(s) are credited and that the original publication in this journal is cited, in accordance with accepted academic practice. No use, distribution or reproduction is permitted which does not comply with these terms.
*Correspondence: Gary Truong, g.truong@unsw.edu.au
†ORCID: Gary Truong, orcid.org/0000-0001-5308-8745
Tracy L. Rogers, orcid.org/0000-0002-7141-4177