Spatial Analysis for Mariculture Site Selection: A Case Study of Kukup Aquaculture Zones in the Peninsula of Malaysia
 Wei-Kang Chor1
  Teng-Yun Lai2 Melissa Mary Mathews3 Tony Chiffings3 Chi-Wei Cheng3 Victor Charlie Andin1
  Kok-Song Lai4
  Jiun-Yan Loh2*
- 1Marine Programme Conservation Department, World Wide Fund for Nature (WWF, Malaysia), Petaling Jaya, Malaysia
- 2Centre of Research for Advanced Aquaculture (CORAA), UCSI University, Kuala Lumpur, Malaysia
- 3DHI Water & Environment (M) Sdn. Bhd, Kota Kinabalu, Malaysia
- 4Health Sciences Division, Abu Dhabi Women’s College, Higher College of Technology, Abu Dhabi, United Arab Emirates
Marine aquaculture sites at Kukup Strait in the peninsula of Malaysia are experiencing a decline in water quality in the last five years, resulting in high mortality rates (50 - 80%), seasonal massive fish mortalities and poor profitability. Currently, Kukup farmers are involved in intensive aquaculture within the existing aquaculture zone. This study explores the sustainability of a modern mariculture method, where fish farms are relocated to deeper waters with higher flushing rates, and high-density polyethylene (HDPE) are used to improve water quality. Several site selection criteria are utilised in identifying the proposed aquaculture industrial zone: 1) bathymetry depth (operational requirement: 10 m to 30 m), 2) located within the Kukup Port Limit, 3) does not interfere with the Kukup ferry navigation route, and 4) distance from Kukup mainland. Site feasibility analysis, including hydrodynamics, meteorology, water quality, sediment quality and macrobenthos assessment, was conducted to compare the proposed and existing aquaculture sites. It was found that the water quality at the existing site contained higher concentrations of fecal coliform and nutrients and salinity fluctuations. Tropical finfish can survive under these conditions with poorer fish health and higher fish mortality. Apart from that, the flushing capacity is higher in the proposed site, indicating the capacity to handle moderate-intensity aquaculture. Moderate-intensity aquaculture using HDPE cages could be profitable for the local fish farmers. Therefore, it is suggested that other locations within Kukup Straits with deeper waters (> 25 m) with possibly improved water quality and the ability for intensive aquaculture production should be explored for a larger depth and economics of scale.
1 Introduction
Kukup is a small fish-farming community consisting of two water villages (Kukup Laut and Ayer Masin) located at the start of Malacca Straits in Pontian District, Johor (Lai, 2014). The two villages initially developed in the sheltered waters of Kukup Strait, approximately 500 m offshore at the close point between the mainland and Kukup Island. However, urban growth has led to the halving of these villages. Since the establishment of water villages in the 1860s, the locals have profited from fishing and staked fish farms (kelong) in Kukup Strait. In the late 1970s, the fish farming activities were upgraded to the floating cage system, thus increasing production and contributing to the small-scale marine aquaculture (mariculture) industry in Malaysia (Hassan, 2010; Barau and Stringer, 2015; Michel and Zahler, 2015).
Fish farming at Kukup has grown in response to the rising demand for fresh seafood from the rapidly expanding neighbouring cities like Johor and Singapore. What began as a fishing village of only eight farms in 1984 (Lai, 2014) has grown into a town with an estimated population of 1400, with approximately 79 fish farmers and 8,000 cages. The aquaculture species found in Kukup Strait include groupers (Epinephelus sp.), snappers (Lutjanus sp.), trevallies (Gnathanodon sp.), pompano (Trachinotus sp.) and Asian sea bass (Lates calcarifer), which are sold mainly fresh at the Singaporean markets, about an hour by boat down the Malacca Straits to the south (Ismail et al., 2018). Furthermore, the flourishing tourism industry in Kukup since the 1980s has attracted local and international tourists from countries like Singapore. Nevertheless, the Kukup aquaculture community continue to face challenges in profiting solely from farming activities; thus, most of them have diversified their portfolio by venturing into the tourism industry, such as operating homestays and seafood restaurants (Hampton, 2010).
Throughout the years, Kukup fish farmers constantly experienced economic losses due to the seasonal disease outbreak associated with microbial infections due to declining water quality (Jaafar et al., 2014). Moreover, Manan et al. (2011) reported hydrocarbon pollution resulting from oil leakage by tourist boats and boat repair activities in Kukup waters. Apart from that, the high density of fish cages is a potential source of “auto pollution” caused by the accumulation of effluent from the two water villages, adjacent agricultural development in the hinterland from constructed drains to avoid flooding, and natural drainage from rivers and streams. In addition, earlier studies suggested that oil and grease, fecal coliforms (Escherichia coli), and heavy metals (As, Cu and Hg) levels have exceeded the recommended limit by Malaysia Marine Water Quality Criteria and Standard (MMWQS) for mariculture activities (Mohamed et al., 2015; Fadzil et al., 2017).
Several solutions can be considered to improve the deteriorating water quality and the consequent disease impacts on fish farm productivity. The World Wildlife Fund (WWF), in partnership with Kukup Fish Farmer Association, Malaysian Fish Farmers Association of Malaysia (MFFAM), UCSI university and Iskandar Regional Development Authority (IRDA) recommended fish farmers explore other potential farming sites south of Kukup Island (unpublished data). The newly proposed aquaculture development site is a 50 ha (500 m x 1 km) area, roughly 3.8 km from the Kukup Straits and 1.3 km from the Kukup Port Limit (Figure 1). Originally, the proposed aquaculture site was 200 ha, however, it was narrowed to 50 ha based on these selection criteria: (i) higher water depth (> 10m, as shown in Figure 3) with better turnover, (ii) short travelling distance from Kukup town, and (iii) enclosed within the port limit to avoid obstructing the shipping lane (Figure 1). WWF and MFFAM’s proposed aquaculture development site is a preliminary assessment. The outcomes of this study will be submitted and discussed with the Department of Fisheries and local government authorities to assist with the state and federal Aquaculture Industrial Zone (AIZ) planning. The recently suggested aquaculture site sits on the edge of the main transit lane for international shipping through the Singapore – Melaka Straits and is immediate to the north of the Johor and Singapore outer port areas. Furthermore, the area is located within the Kukup Port Limit, Sector 6 of the Straits of Malacca and Singapore (SOMS) Vessel Traffic Information System (VTIS) and the Traffic Separation Scheme and Deepwater Route. Malacca Straits Sector 6 is narrow and act as an entry point to the Port of Tanjung Pelepas (PTP) and Singapore Straits, thus, subjected to heavy international shipping pressures. The Malaysian Marine Department governs the Kukup Port.
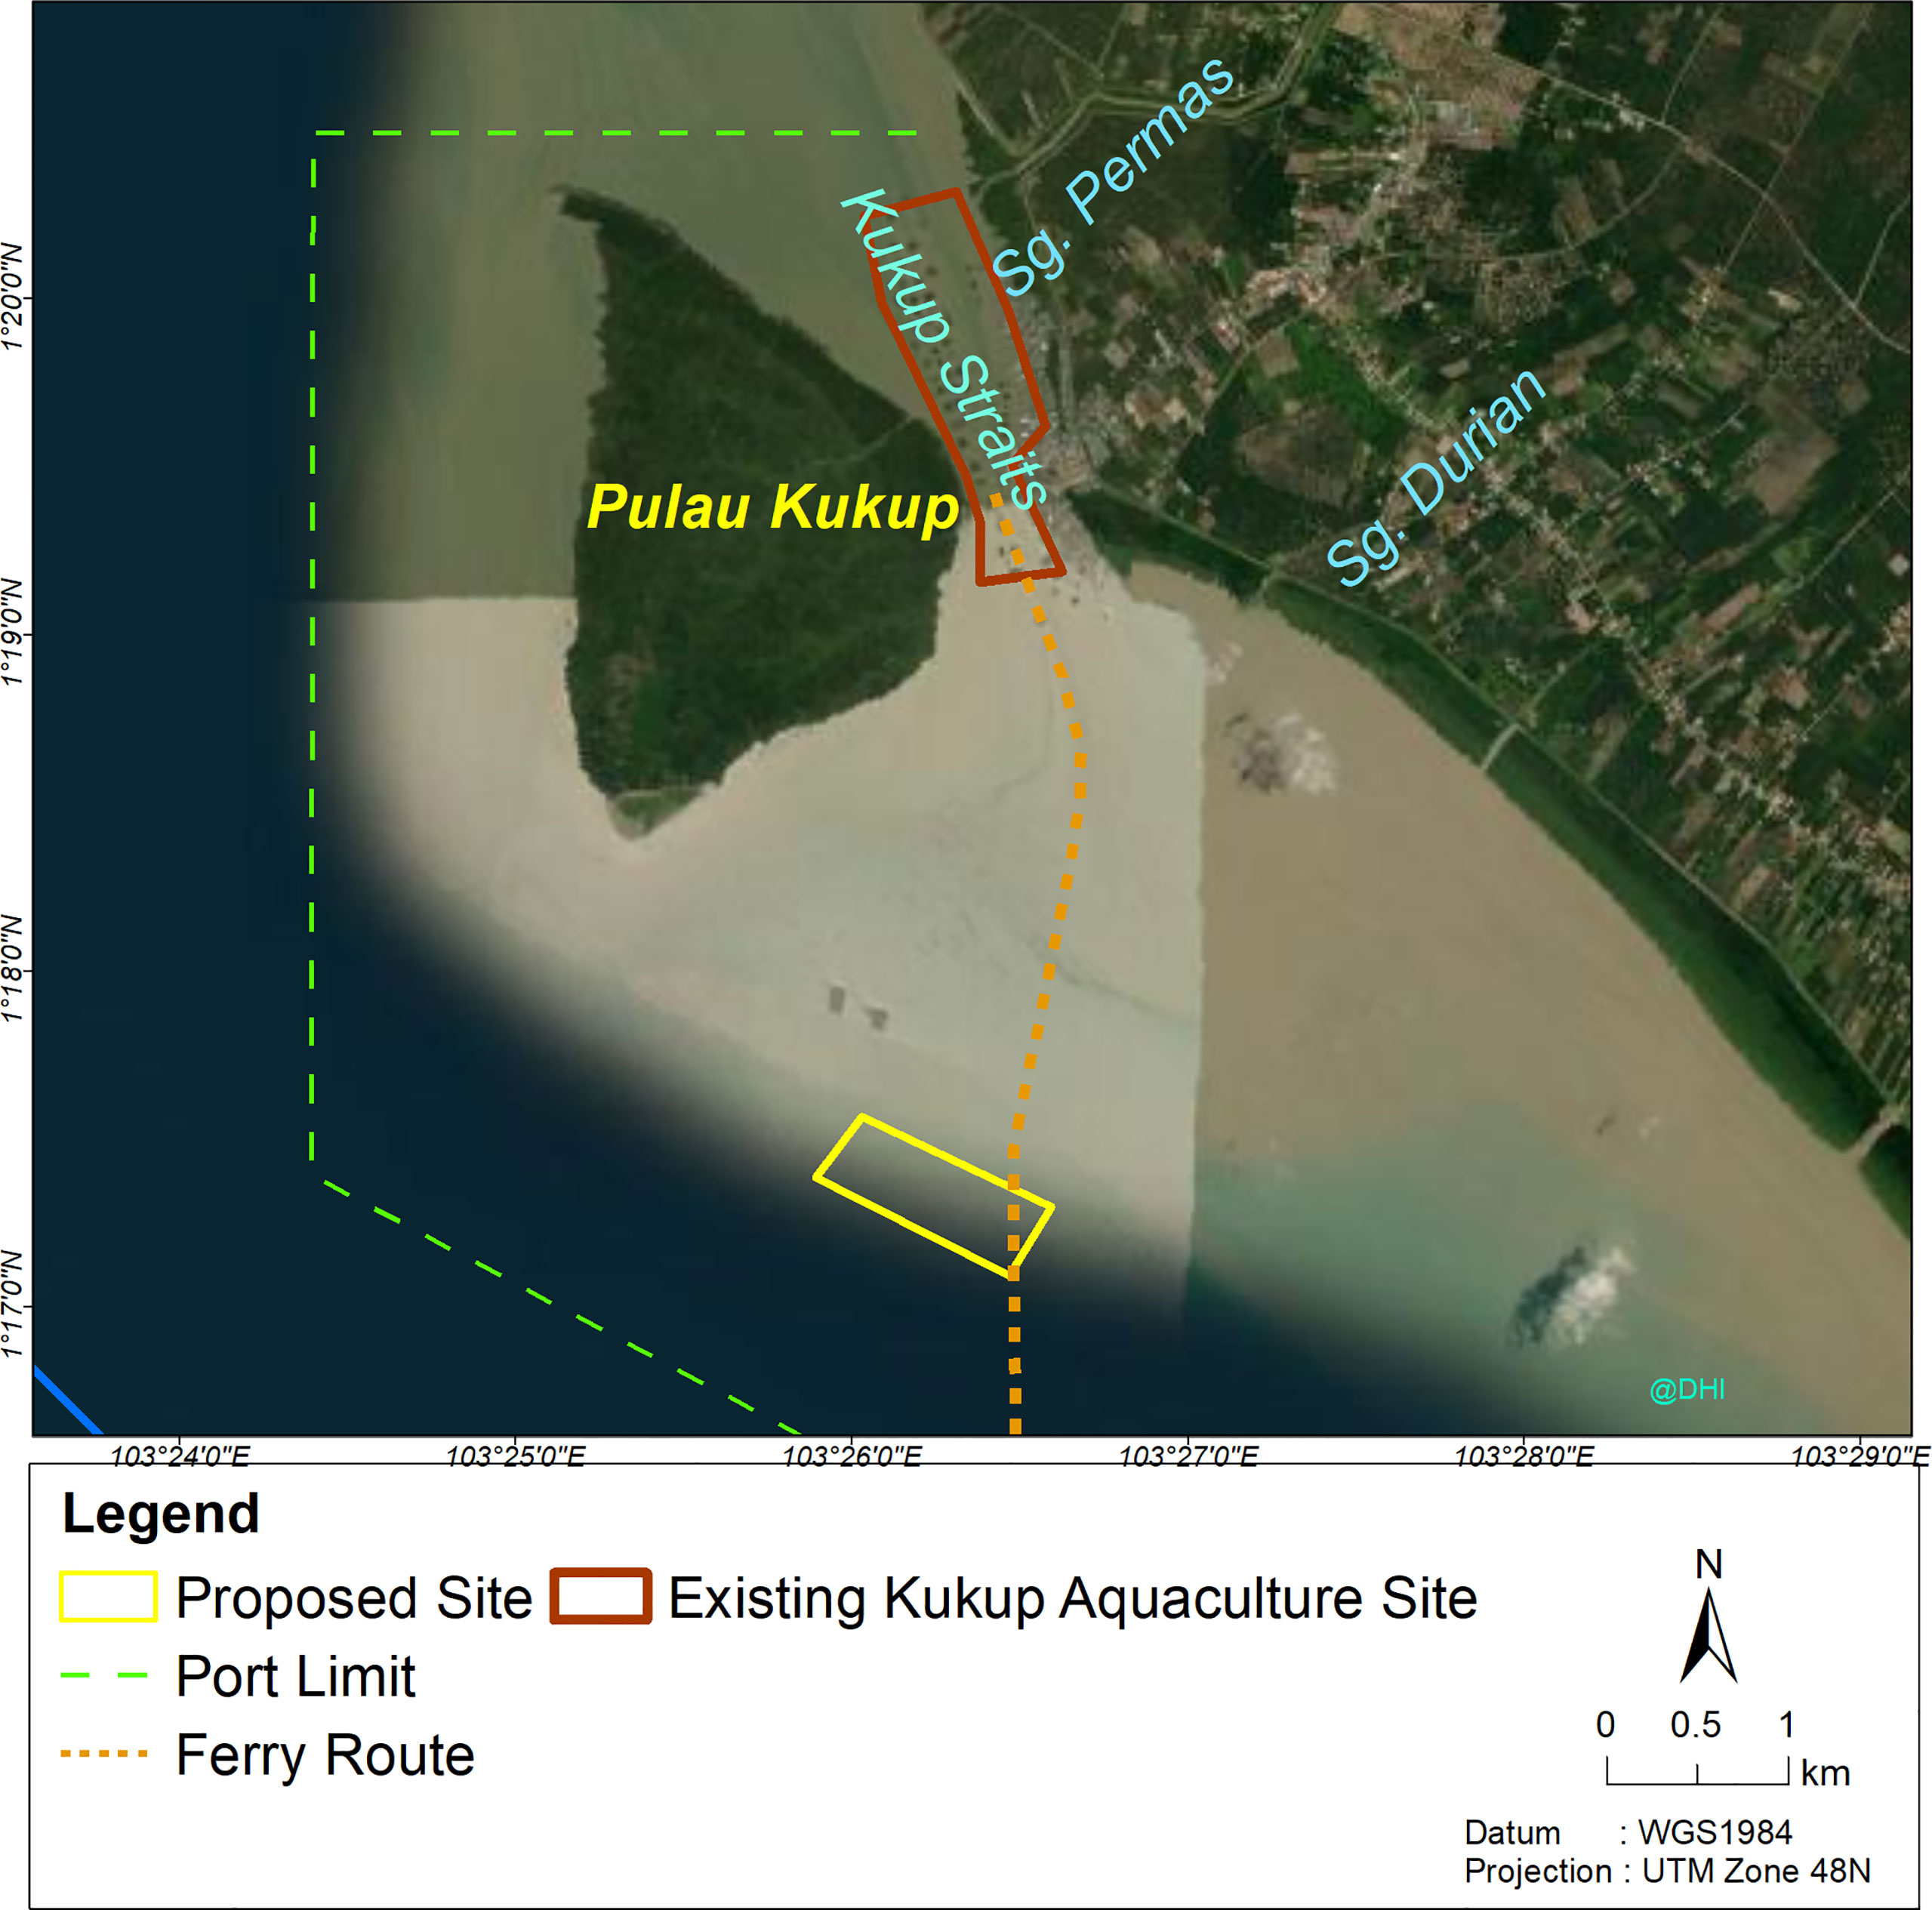
Figure 1 Satellite image of existing Kukup aquaculture site and new proposed site.
When selecting a new aquaculture site, conducting a technical assessment to ensure future business profitability is critical. One of the main criteria of the site evaluation is water quality. Therefore, this study aims to analyse the suitability of a new aquaculture site for sea cage farming offshore of Kukup within the Magellan Strait by assessing several key criteria: 1) hydrodynamic and meteorological conditions, 2) marine water quality, and 3) marine sediment quality of existing aquaculture site and the proposed site. In addition, several key factors are evaluated in this study, including bathymetry, wind, currents, waves, water temperature, pH, salinity, dissolved oxygen, turbidity, ammoniacal nitrogen, particles size distribution, redox potential, total organic carbon, hydrocarbons, heavy metals and benthic biodiversity (Szuster and Albasri, 2010; Radiarta et al., 2011; Leung et al., 2015; De Novaes Vianna and Bonetti Filho, 2018; Divu et al., 2021). The hydrodynamics and meteorology conditions (bathymetry, wind, currents and waves) are crucial in selecting a new aquaculture location (Radiarta et al., 2011; Gimpel et al., 2015; Mayerle et al., 2020). A better knowledge of the factors listed above can help in determining the physical impacts on the new infrastructure, structural integrity, cost, operating conditions and the associated costs for supporting infrastructure (vessel size, capital and operational costs). Additionally, higher energy environments like those anticipated further offshore offer potentially improved water quality due to high flushing rates enhanced operational conditions, and, most importantly, greater distances from land-based pollution sources.
2 Materials and Methods
2.1 Hydrodynamics and Meteorological Conditions
Bathymetry or seabed contour levels of the study areas were sourced from the navigation chart MAL5129 published in April 2008. Bathymetry levels were referenced to Chart Datum (CD), and areas with positive values or higher than 0 m CD were interpreted as the inter-tidal areas within a certain distance from the coastline. Wind data were obtained from a global high-resolution weather model along with meteorological and oceanographic information, sourced from the National Center for Environmental Prediction, USA (NCEP) (Saha et al., 2014). The spatial and temporal extent of currents and waves at the proposed site were derived using results from two-dimensional (2D) numerical models, namely, the MIKE 21 Hydrodynamic (HD) and Spectral Wave (SW) model (Uddin et al., 2014).
The Climate Forecast System Reanalysis (CFSR) wind forcing is applied in this assessment. It is a third-generation reanalysis product from a global, high resolution, coupled atmosphere-ocean-land surface-sea ice modelling system, sourced from the National Centers for Environmental Prediction (NCEP), USA. The data from 2010 to 2019 are supplied in one-hour intervals, at the height of 10 m above mean sea level. The spatial resolution of the CFSR was set in the order of 0.20° by 0.20°. Typical northeast (NE) monsoon, southwest (SW) monsoon and inter-monsoon current flow conditions of the study area were predicted using the MIKE 21 HD FM (flexible mesh) hydrodynamic model. Simulation periods were selected as February (NE monsoon), April (inter-monsoon) and July (SW monsoon) 2017 and each simulation includes 28 days for spring-neap tidal cycle. The model applied boundary conditions driven by a large regional domain, including seasonal variations and CFSR spatial wind maps as the key wind forcing. The ship wakes analysis and simulations for various vessels, sailing routes, and potential ship wakes generated are sourced from DHI in-house assessments (unpublished data).
2.2 Sampling Site Description
A field expedition was conducted on 9th August 2020 to sample ambient water at eight stations, while marine sediment was collected at seven sites from the 17th to 18th August 2020 at the locations shown in Figure 2. Ammoniacal nitrogen and nitrate were measured at seven sampling sites in 2013 and 2019. The coordinates of the water quality (WQ, D & F) sampling stations and marine sediment sampling site (P) are presented in Table 1.
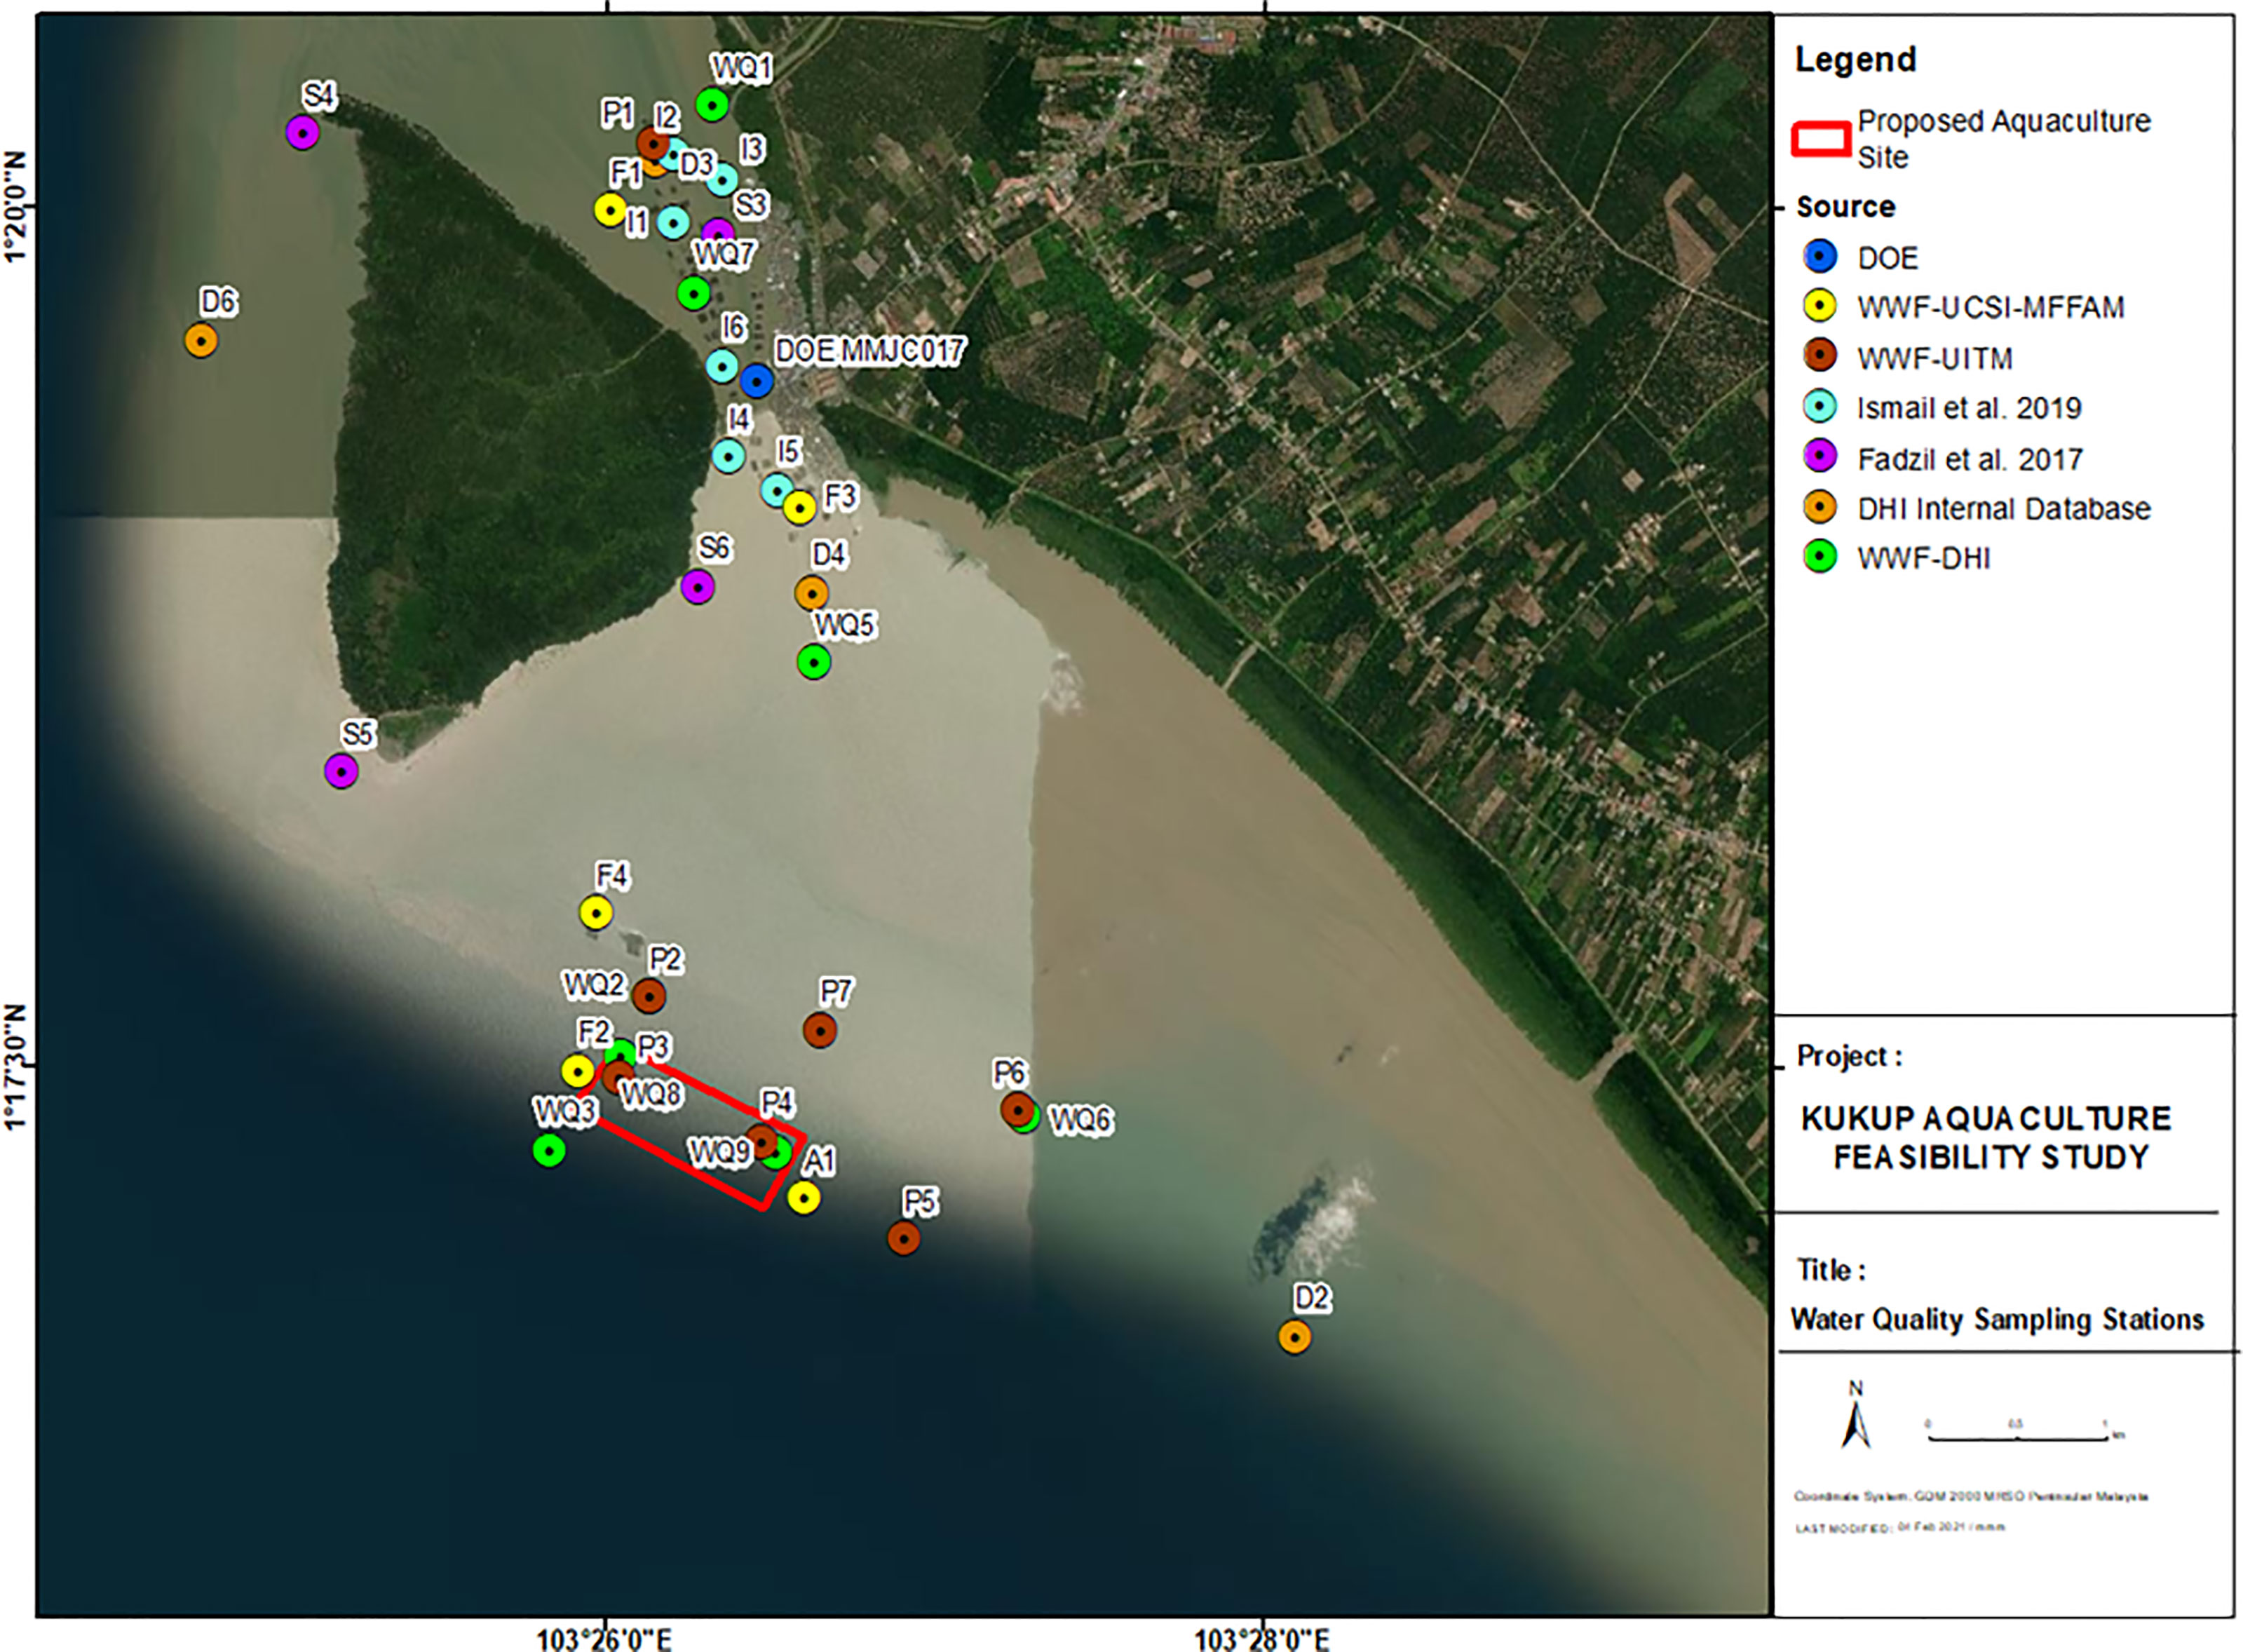
Figure 2 Water quality and marine sediments sampling stations from the respective sources within the existing Kukup aquaculture site, new proposed aquaculture site and surrounding waters.
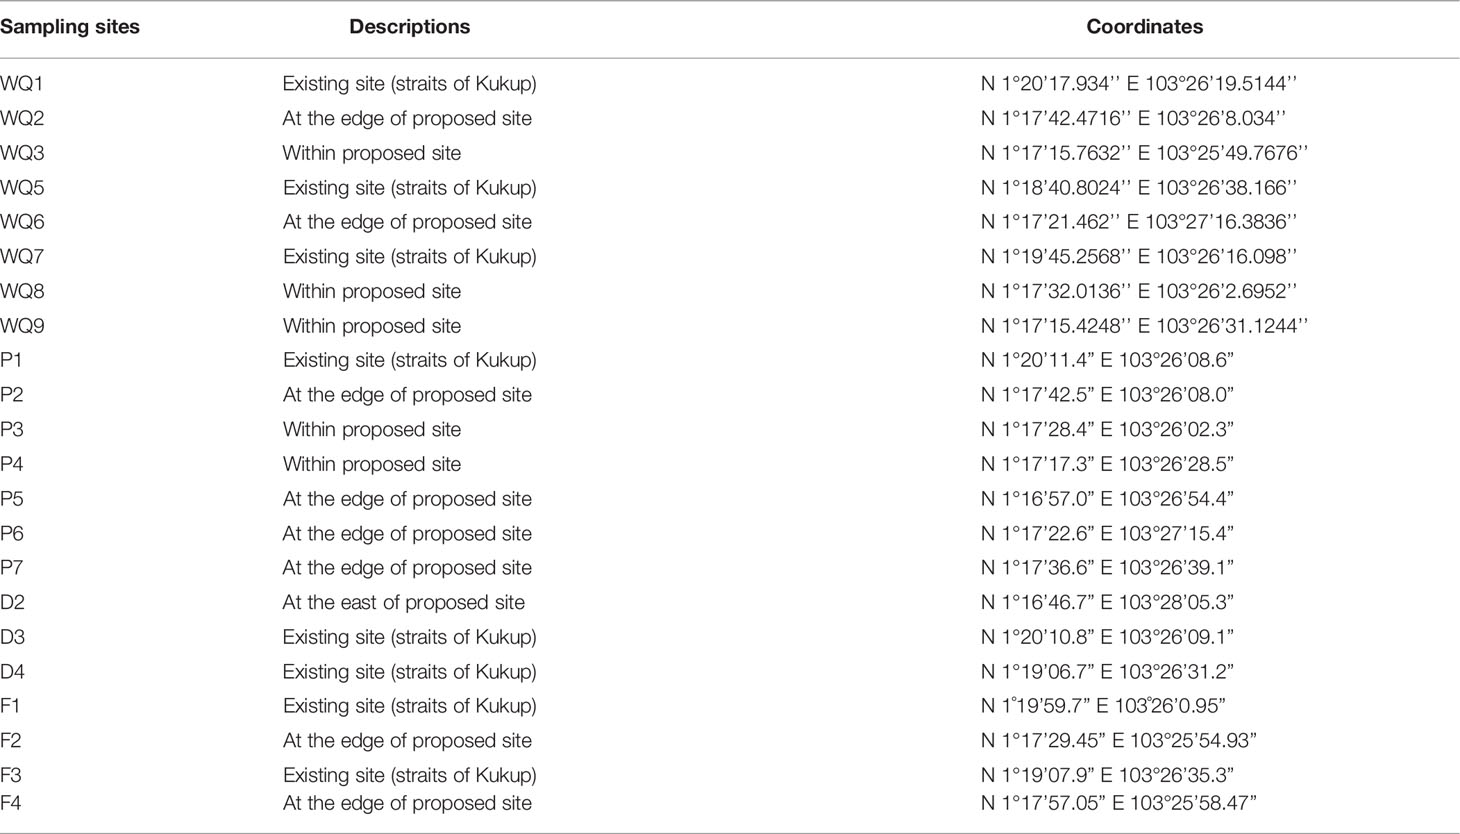
Table 1 Coordinates of 16 sampling sites for water quality and marine sediments assessment in degrees-minutes-seconds (DMS).
2.3 Water Quality Assessment
In situ parameters were measured using an Aqua TROLL® 600 multiparameter sonde (In-situ Inc., USA) at each water quality sampling station (WQ1 - WQ9), and a YSI in situ multiparameter (ProQuatro, USA) was used in seven water sampling sites (P1 – P7) to quantify the water mass properties including temperature, salinity, pH, turbidity, dissolved oxygen (DO). Meanwhile, the physicochemical parameters such as the redox potential (Eh) were measured using Oxidation Reduction Potential (ORP) meter (HM Digital ORP-200, Culver City, USA) following methods of Praveena and Aris (2013). Turbidity was not sampled in WQ1, -5, -6, and -7, due to equipment error. pH was not sampled at WQ6, and dissolved oxygen (DO) was not sampled at WQ2 due to the unstable sea conditions. Ammoniacal nitrogen and nitrate at D-2, -3 and -4 were sourced from DHI’s internal database (unpublished data), while F-1, -2 and -3 were measured using Horiba compact meters (LAQUAtwin, Japan).
2.4 Extraction of Seabed Sediment
Macrobenthos sampling was conducted at seven sites (P-1, -2, -3, -4, -5, -6, and -7) from 17th to 18th August 2020 by Universiti Teknologi MARA (UiTM) A&A Laboratory. Before the sampling process was conducted, the site coordinates were obtained using a Global Positioning System (GPS) application, while the water depth was recorded using a portable echo sounder (SM5, Laylin Associates, Unionville, VA). Then, samples for the quantitative determination of the chemical composition and macrobenthos were initiated using the sampling device known as a Petite Ponar Grabber (Wildco®, Yulee, FL), with a sampling area of 152 x 152 mm (6 x 6”) (Wang et al., 2013). The water depth of sampling sites ranged from 2.3 m to 24.6 m. One sub-sample was extracted for chemical composition analysis, while sampling was done in triplicates (P1 - P7) to estimate the macrobenthos diversity. The weight of each sample is around 1 kg, and the extracted sediments were deposited in resealable plastic bags and preserved with 500 ml of 8% formalin. Then, the samples were transported to the laboratory in a sealed cooling box with ice packs for further analysis.
2.5 Marine Sediment Evaluation
2.5.1 Particle Size Distribution (PSD)
The particle size distribution was analyzed following the United States Department of Agriculture-Natural Resources Conservation Service (USDA-NRCS) Soil Taxonomy (United States Department of Agriculture-Natural Resources Conservation Service (USDA-NRCS), 2018). First, approximately 20 g of air-dried sediment sample was filtered using a 2.0 mm sieve, weighed and recorded. Next, 30% hydrogen peroxide (H2O2) was added to the sample to remove organic matter and dispersing reagent. After that, 4% sodium hexametaphosphate was added to prevent the flocculation of sediment particles. The treated sample was then transferred to a 1 L measuring cylinder, and distilled water was added to make a total volume of 1 L.
The sample in the measuring cylinder was mixed vigorously with a plunger for 30 s. Then, clay and silt pipetted out after 46 s at a depth of 20 cm. A soil sedimentation chart was used to determine the time required to pipette out the clay and silt samples. Later, the weight of an empty beaker was recorded (W1) before pipetting the sample to be oven-dried overnight at 105°C. The sample was weighed and recorded (W2) the next day. In addition, the sample temperature was measured, and the depth for the second pipetting procedure was determined using the soil settling chart. After that, the empty beaker was weighed (W3), and the pipetted clay was placed in the beaker. The beaker was oven-dried overnight at 105°C and weighed (W4). A total of 200 ml of sample was kept while the remaining sample was discarded. Then, the collected sample was transferred into a weighed 1 L beaker (W5) and added with distilled water. The settling process was repeated several times until the sample solution became clear. Next, the sample solution was poured into the sink until 50-mL of the sample was left. The collected sample was oven-dried overnight at 105°C and weighed (W6). Lastly, the final percentage of silt, clay and sand were calculated, and the types of sediments were determined using the USDA soil texture pyramid and the following formulas (United States Department of Agriculture-Natural Resources Conservation Service (USDA-NRCS), 2018).
2.5.2 Total Organic Carbon (TOC)
The total organic carbon (TOC) measures the organic matter content via the Walkley and Black Titration method (Walkley and Black, 1934). First, the sample was dried at 35°C and filtered using a 0.15 mm mesh sieve. A total of 0.5 g sample was weighed and transferred to a 500 mL conical flask, and 10 mL of 0.1667 M potassium dichromate solution (K2Cr2O7) was added to the sample. Then, 20 mL of concentrated sulphuric acid was cautiously added to the sample and swirled for 30 s, followed by 200 mL deionised water after the sample had cooled to room temperature. The sample was allowed to sit for 30 min before the suspension was filtered. Next, three to four drops of ferroin indicator were added to the filtrate. Finally, the excess dichromate was titrated using 0.5 M standard ferrous ammonium sulphate solution (FAS). The colour change at the endpoint was observed from blue-green to a reddish hue. Total organic carbon is calculated using the following formula (Walkley and Black, 1934):
Where, B = blank titre (mL), A = sample titre (mL) and Ma = concentration of FAS
2.5.3 Oil and Grease
The oil and grease (OG) content in sediment was analysed according to the American Public Health Association (APHA et al., 1912) -5520B (partition gravimetric) method (Baird et al., 2017). First, a wet sludge sample was taken from a 1 L wide mouth glass bottle, and 1 mL concentrated hydrochloric acid (1:1 HCL) per 80 g sample was added and acidified to pH 2.0 or lower. Approximately 20 ± 0.5 g of the acidified sample was weighed (W1) and placed into a beaker. Then, 25 g of magnesium sulphate monohydrate (MgSO4.H2O) was added to dry the sample. After the sample had solidified (15 to 30 min), the sample was ground into powder form using a porcelain mortar. A total of 100 mL n-hexane was added, and the sample was transferred to a separator funnel. The sample was shaken vigorously for 2 min to achieve layer separation. Next, the solvent layer was drained through a funnel containing a filter paper (Whatman No 40). Then, the extracts were filtered and combined into the same distilling flask. Later, the solvent from the flask was distilled in a water bath at 85°C for 15 min, cooled in a desiccator for at least 30 min and weighed (W2). Finally, the extracted oil and grease were calculated using the following formula (APHA et al., 1912):
Where W2 = final weight and W1 = initial weight.
2.5.4 Polynuclear Aromatic Hydrocarbon and Total Petroleum Hydrocarbon
Polynuclear aromatic hydrocarbon (PAH) and total petroleum hydrocarbon (TPH) of the marine sediment were extracted using the United States Environmental Protection Agency Soxhlet Extraction (USEPA) method 3540 (Solid) (Guerin, 1999). Before the drying process, the water layer in the sediment sample was decanted and discarded. In addition, foreign objects such as sticks, leaves, and rocks were removed, and the sample was mixed thoroughly. A total of 10 g sample was weighed and placed into a tared crucible and subjected to drying overnight at 105°C. The dried sample was weighed after cooling to room temperature. The dry weight (%) was calculated using the following formula (Guerin, 1999):
A total of 10 g of solid sample with 10 g of anhydrous sodium sulphate were blended and placed in an extraction thimble. Then, 1 ml of surrogate standard spiking solution and matrix spiking standard were added to the selected samples. Next, a 300 mL extraction solvent (Acetone/Hexane at 1:1) was added to a 500 ml round bottom flask containing two cleaning chips. The flask was attached to the Soxhlet extractor, and the samples were extracted for 16 h at 4 - 6 cycles/h. Then, the extracted samples were allowed to cool. A Kuderna-Danish (K-D) concentrator was assembled by attaching a 10 mL concentrator tube to a 500 ml evaporation flask. The solvent vapour-recovery glassware (condenser and collection device) was attached to the Snyder column of the K-D apparatus following the manufacturer’s instructions. The extract was dried by passing it through a drying column containing about 10 cm of anhydrous sodium sulphate, and the dried extract was later collected. The concentrator flask and sodium sulphate column were washed with 100 to 125 ml extraction solvent to complete the quantitative transfer. Subsequently, two clean boiling chips were added to the flask, and a three-ball Synder column was attached. Methylene chloride (1 ml) was added to the top of the Synder column. The K-D apparatus was placed on a hot water bath, and the temperature was set to 15 – 20°C above the solvent boiling point. The concentrator tube was partially immersed in hot water, and the entire lower rounded surface of the flask was bathed with hot vapour. The vertical position was adjusted to complete the concentration within 10 - 20 min. In the end, the K-D apparatus was removed from the water bath when the clear liquid reached 1 and later drained and cooled for at least 10 min.
The PAH determination was done according to the USEPA 8100 method using the gas chromatography (GC) solvent flush technique. At the same time, compounds in the GC effluents were detected by the Flame Ionisation Detector (FID) (Agilent 7890A gas chromatography, Agilent Technologies, USA) (Adeniji et al., 2018). The column used for the analysis was a 30 m x 0.32 mm I.D. (inner diameter) SE-54 fused silica capillary column. The PAH separation via gas chromatography was as follows: oven temperature program was 40 °C held for 1 min, then increased at 15 °C min-1 and 150 °C for 10 min. Meanwhile, the injector and detector temperature were 250 °C. The injection volume was 1 µL in the splitless mode, keeping the split valve closed for 1 min. Finally, the PAH was quantified using Agilent ChemStation software (HPLADD01.EXE ver. 4.03.016).
The determination of sample TPH via the separation method was conducted using the total petroleum hydrocarbon USEPA 8015D since the technique provides gas chromatographic conditions for detecting certain non-halogenated volatile and semi-volatile organic compounds (Cortes et al., 2012). The column was a 30 m x 0.32 mm I.D. SE-54 fused silica capillary column. Gas chromatographic conditions used for separating TPH was set at 40 °C for 2 min, then increased to 10 °C for 1 min and 300 °C for 10 min. The injector and detector temperature were set at 250 °C. The injection volume was 1 µL in the splitless mode, keeping the split valve closed for 1 min. Lastly, the TPH was quantified using the Agilent ChemStation software.
2.5.5 Heavy Metals
Heavy metals composition was measured using the USEPA method 1311 toxicity characteristic leaching procedure (TCLP) (US Environmental Protection Agency, 1992). Two different buffered acidic leaching extraction fluids were utilised for this procedure depending on the pH value of the sediment samples. As described in TCLP, extraction fluid 1 (± pH 4.93) was used for sediment samples with a pH < 5, while extraction fluid 2 (± pH 2.88) was used for sediment samples with a pH of > 5. First, extraction fluid 1 was prepared by adding 5.7 mL glacial acetic acid (CH3CH2OOH) to 500 mL reagent water. Then, 64.3 mL 1 N sodium hydroxide (NaOH) was added to the mixture and diluted with reagent water to a volume of 1 L. Meanwhile, extraction fluid 2 was prepared by diluting 5.7 mL of glacial acetic acid was diluted with reagent water to a volume of 1 L. The final pH of Solution 1 and 2 were 4.93 and 2.88, respectively. All reagents used in the TCLP test were made from ACS (American Chemical Society) reagent grade.
Extracts or portions of extracts for metallic analysis were acidified with nitric acid to a pH of < 2. An aliquot of 2 g of each sample and 40 mL extraction reagent was transferred into 100 mL plastic vessels and rotated for 18 h in a horizontal shaking mixer with a speed of 30 ± 2 rpm. The room temperature was maintained at 23 ± 2°C throughout the extraction process. After 18 h, the fluid in each vessel was separated from the solid phase by vacuum-filtration through 0.8 µm borosilicate glass fibre filter paper. Both primary and secondary extract fluids were used. The concentrations of heavy metals in extracts produced by TCLP were determined using flame atomic absorption spectrometry (FAAS) (Sun et al., 2006).
2.6 Benthic Biodiversity Analysis
Benthic biodiversity analysis was conducted according to Musale and Desai (2011). First, the sediment samples were sieved (mesh size: 0.25 mm) to separate the benthic organisms from the sediment and organisms before they were identified under the microscope (OMAX™ stereomicroscope, USA) at 10 – 40 × magnification. Next, the organisms were classified into taxonomic categories to the family level using six identification keys (Day, 1968; Sterrer, 1986; Blake, 1994; Miner, 2006; Eleftheriou and Moore, 2013; Gill, 2019). Then, these organisms were filtered from the sediment and placed on a white tray filled with water for the sorting process. Next, the organisms were stained with 200 mg/L rose bengal to achieve a light pink and preserved in formalin for more than 24 h to facilitate detritus sorting (Schönfeld et al., 2013). Finally, the number of taxa (S), total number of individuals (N), diversity index (H’), dominance index (D), richness index (DMg) and evenness index (J’) were calculated using the following formula: Shannon-wiener index (H’) (Shannon and Weaver, 1949), Dominance index (D) (Simpson, 1949), Margalef’s richness index (DMg) (Margalef, 1958), and Pielou’s evenness index (J’) (Pielou, 1966).
2.7 Statistical Analysis
Water quality data at different sampling sites were subjected to normality and homogeneity-of-variance tests, and analysed using the Kruskal Wallis non-parametric one-way ANOVA to compare each sample, while a difference in means was determined using Dunn’s multiple comparisons post hoc test with Bonferroni adjustment to obtain significance difference of water quality parameters among sampling sites. In all cases, the significant difference is denoted when p < 0.05. The statistical analyses were conducted using the IBM Statistical Package for the Social Sciences (SPSS) software version 20.
3 Results
3.1 Hydrodynamics and Meteorology Conditions
The bathymetry map shows that the proposed site has a depth between -10 and -20 m CD, with deeper contours toward the offshore. The proposed aquaculture site (in green) is located within the Kukup Port Limit (grey dash) (Figure 1). The data obtained from the navigation chart is useful to provide a preliminary estimate of the proposed area. The Kukup Strait is a narrow channel between Kukup Island and the mainland, where the existing aquaculture site is located. The depth of the approaching entrances of the strait is around -2 m CD with a particularly deep spot about -23 m CD at the narrowest part of the strait, resulting from the high-speed current that led to scouring.
A wind speed and direction time series from 2010 to 2019 (10 years) at a location within the proposed aquaculture study area were obtained from the CFSR database (103°26’3.52”E, 1°17’26.03”N) (Figure 3A). Meanwhile, the wind rose generated from the 10-year time series is presented in Figure 3B. The predominant wind directions were from the northeast (NE) and southeast (SE), and the highest predicted wind speed during the extraction period is 9.5 m/s. The ship density plot, Kukup Port Limit and the marine traffic separation scheme are shown in Figure 1.
Figure 3 Hydrodynamic, meteorological conditions and ship density plot of the study area: (A) extraction point of wind time series, and (B) wind speed.
The current flow at the proposed site is predominantly toward the northwest (NW) and SE, which are aligned with the mainland coastline. Generally, the current flows towards 300°N during ebb tide and 120°N during flood tide. The current speed increases as the tide move onshore to offshore into deeper waters. The mean and maximum currents calculated throughout the 28 days for each monsoon are shown in Figure 4A and Figure 4B, respectively. The predicted mean current speed at the new site are between 0.3 - 0.4 m/s (in deeper waters), while the maximum current speed ranges between 0.7 - 1.1 m/s. Nevertheless, it was noted that the values represent typical conditions and do not include extreme conditions that the latter will be required forinfrastructure design purposes.
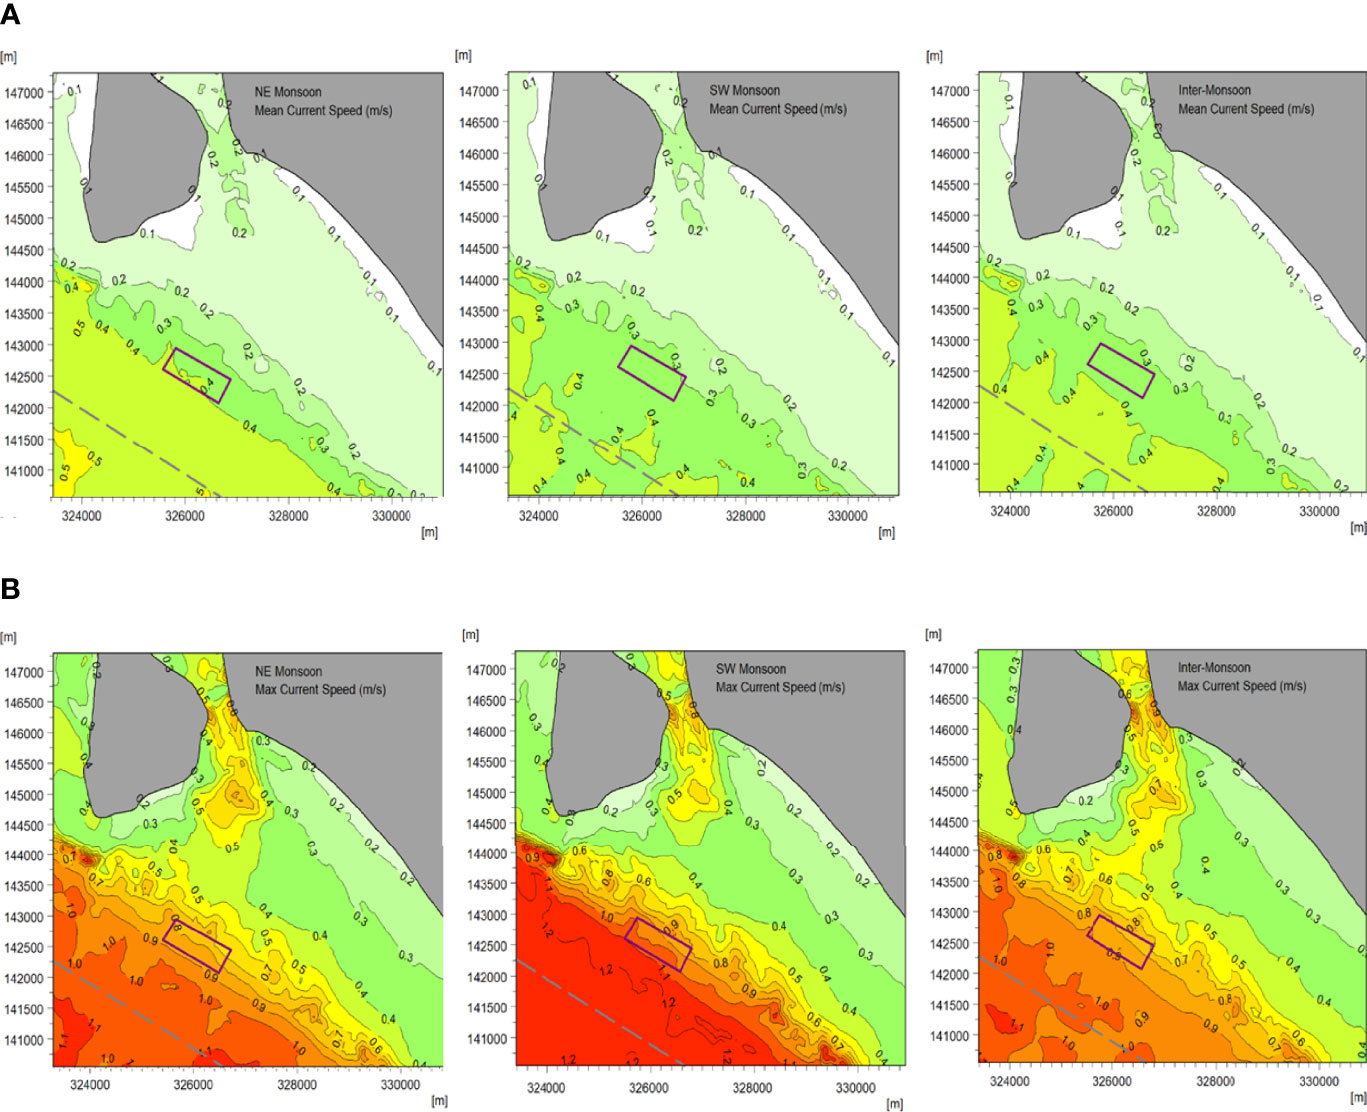
Figure 4 Mean (A) and maximum (B) current speeds calculated from 28-day simulation results of a typical NE monsoon (left), SW monsoon (middle), and inter-monsoon (right).
The wave conditions at the new site are primarily wind-generated waves. Wind waves, also known as wind sea, is induced by immediate local wind blowing on the water surface. These waves are of a high frequency (2 – 7 s) and can present as short steep seas that rise quickly with increased wind speed. In contrast, swell waves are generated from remote weather systems with a longer frequency and are hardly affected by local winds. The significant wave heights and peak wave periods at the study area are less than 0.6 m and 4 s, respectively. Meanwhile, the highest significant wave heights are expected to be < 3.0 m.
3.2 Water Quality
The water temperature of the existing aquaculture site ranged from 29.3 to 30.2°C. This narrow range is considered typical of coastal waters, reflecting the tropical climate in Malaysia. Furthermore, the pH value ranged between 6.7 and 7.8, while the salinity ranged from 23.6 to 29.9 psu. The recorded DO values were between 5.5 and 6.0 mg/L (Table 2). The data collected between 2013 and 2019 demonstrated that ammoniacal nitrogen concentrations ranged between 3 and 179 µg/L, exceeding the MMWQS Class 2 limit of 50 µg/L. Similarly, nitrate concentrations were also high, with a maximum concentration of 383 µg/L.
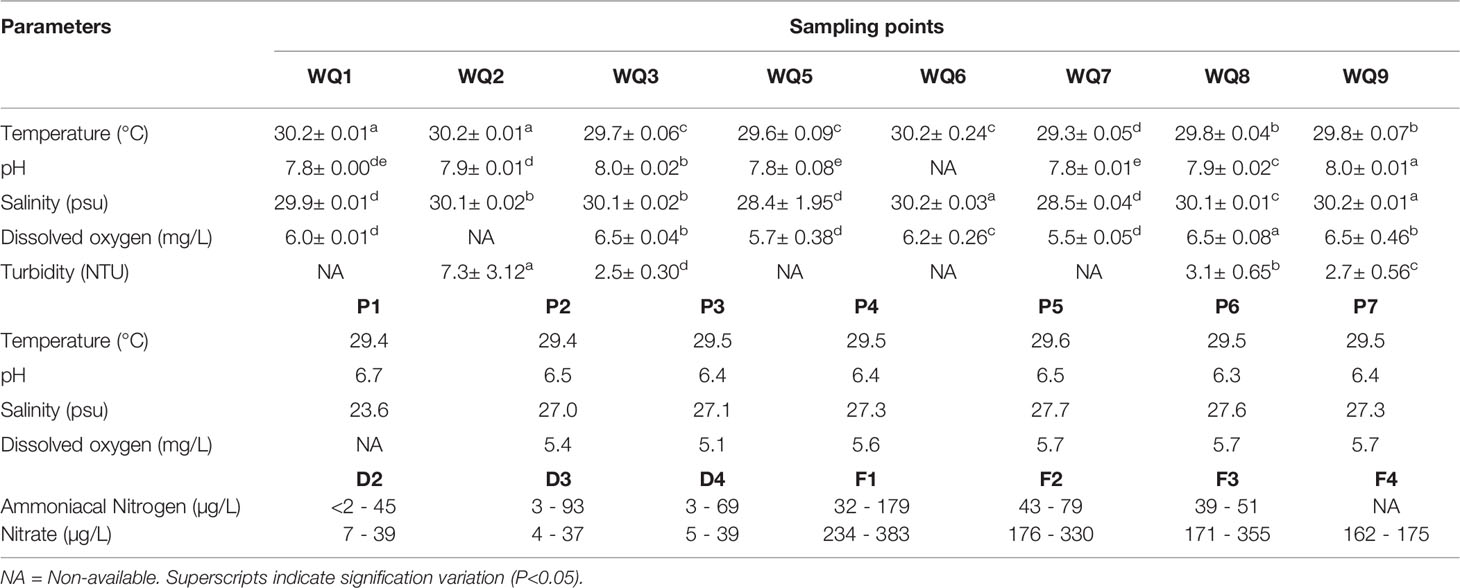
Table 2 Physio-chemical properties of water sampling sites (existing and proposed site) at Kukup Strait, Johor, Malaysia.
The water temperature at the proposed site ranged between 29.4 and 30.2°C. The pH value ranged between 6.3 and 8.0, whereas the salinity was between 27.0 and 30.2 psu. The recorded DO ranged from 5.1 to 6.5 mg/L, while the turbidity ranged between 2.5 and 7.3 NTU (Table 2). Meanwhile, the ammoniacal nitrogen ranged between 2 - 79 µg/L, slightly exceeding MMWQS Class 2. Apart from that, ammoniacal nitrogen concentrations were much lower compared to the existing Kukup aquaculture site. However, the maximum nitrate concentration (330 µg/L) was approximately five times higher than the MMWQS Class 2 limit of 60 µg/L.
3.3 Marine Sediments and Macrobenthos Diversity
At the existing aquaculture site, the marine sediment is categorised as silt, which consists of a high percentage of silt (95.13%) with low percentages of clay (0.49%) and sand (4.38%) (Figure 5A). The lowest redox potential was recorded at P1 (-196 mV); the shallowest sampling site (2.3 m). However, the TOC recorded was 1.9%, indicating that the sediment at P1 was not organically enriched. In contrast, the sediment structure at all sediment sampling sites is consistent. The metals recorded in this study were consisting of copper, nickel, lead, zinc, iron and manganese (Table 3)). Meanwhile, the hydrocarbons, cadmium, mercury, vanadium and barium levels were lower than the respective limit of detection (LOD), thus considered undetected in the sediments at the existing aquaculture site (Table 3). In terms of macrobenthos diversity, the number of Lumbrineridae polychaetes sampled at P1 was the highest compared to other sampling sites. The Shannon-wiener diversity index (H) recorded at P1 was 1.75 ± 0.15, while the number of individuals (N) was 12.67 ± 3.09. The evenness index (J’) and richness index (DMg) of macrobenthos at the existing aquaculture site were 0.92 ± 0.03 and 2.13 ± 0.38, respectively (Table 4; Figure 5B).
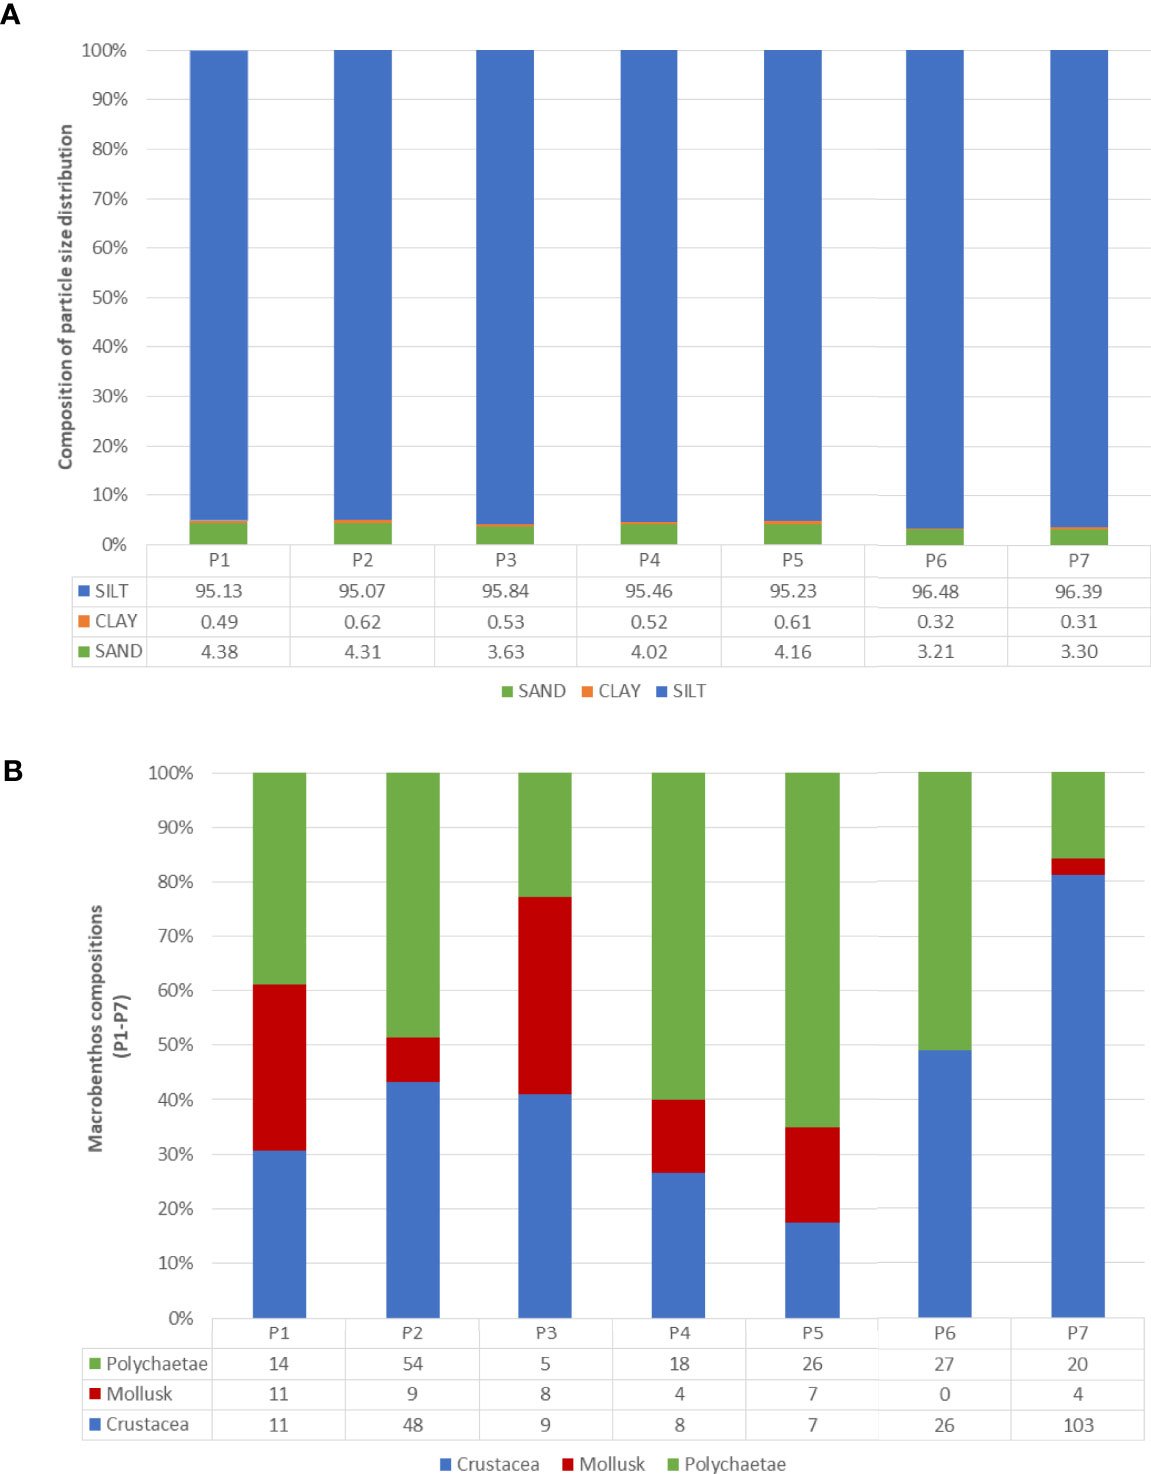
Figure 5 Composition of (A) particle size distribution, (B) polychaetae, mollusk and crustacean (P1-P7).

Table 3 Physical properties of marine sediment sampling sites (existing site and proposed site) at straits of Kukup Straits, Johor, Malaysia.
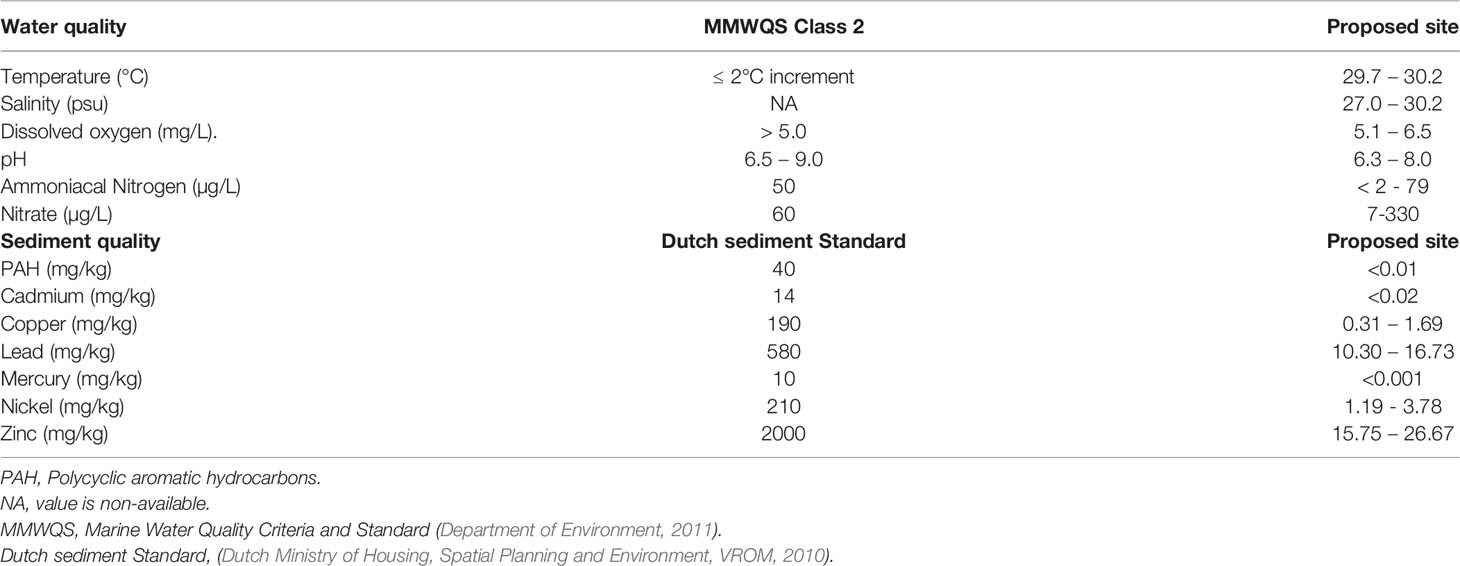
Table 4 Comparison of present data with MMWQA class 2 limit and dutch sediment standards target value and intervention value.
Marine sediments at the proposed site are categorised as silt sediment with a high percentage of silt (95.07 – 96.48%), low percentage of clay (0.31 – 0.62%) and sand (3.21 – 4.31%) (Figure 5A). The redox potential recorded at the proposed site was between -138 to -135 mV. The result analysis clearly showed the absence of hydrocarbons, cadmium, mercury and vanadium at all sampling points in this study (Table 3). Meanwhile, copper, nickel, lead, zinc, iron and manganese are detected at all sampling points (Table 3). Barium was detected at four sampling points of the new proposed site, namely, P-4, -5, -6, and -7 (Table 3). The lowest concentration of total metals was detected at P2 (835.17 mg/kg), which consists of copper (0.47 mg/kg), nickel (2.49 mg/kg), lead (10.30 mg/kg), zinc (18.93 mg/kg), iron (688.99 mg/kg) and manganese (113.99 mg/kg). Macrobenthos in the proposed site and surrounding vicinity had the highest evenness index (J’) was recorded at P5 (0.93 ± 0.02), while the greatest macrobenthos abundance (N) was recorded in station P7 with a mean density of 1884 ± 1220 (127 ind./m2), followed by station P2 at 1623 ± 856 (111 ind./m2) and the lowest mean density was recorded at station P3 with 318 ± 74 (22 ind./m2) (Table 5). The lowest evenness index (J’) was recorded in P7 at 0.54 ± 0.23. However, the highest Shannon-wiener (H’) and richness indices (DMg) were recorded at the proposed site (P2). No sensitive environment species such as corals were present within the sediment samples (Table 5).
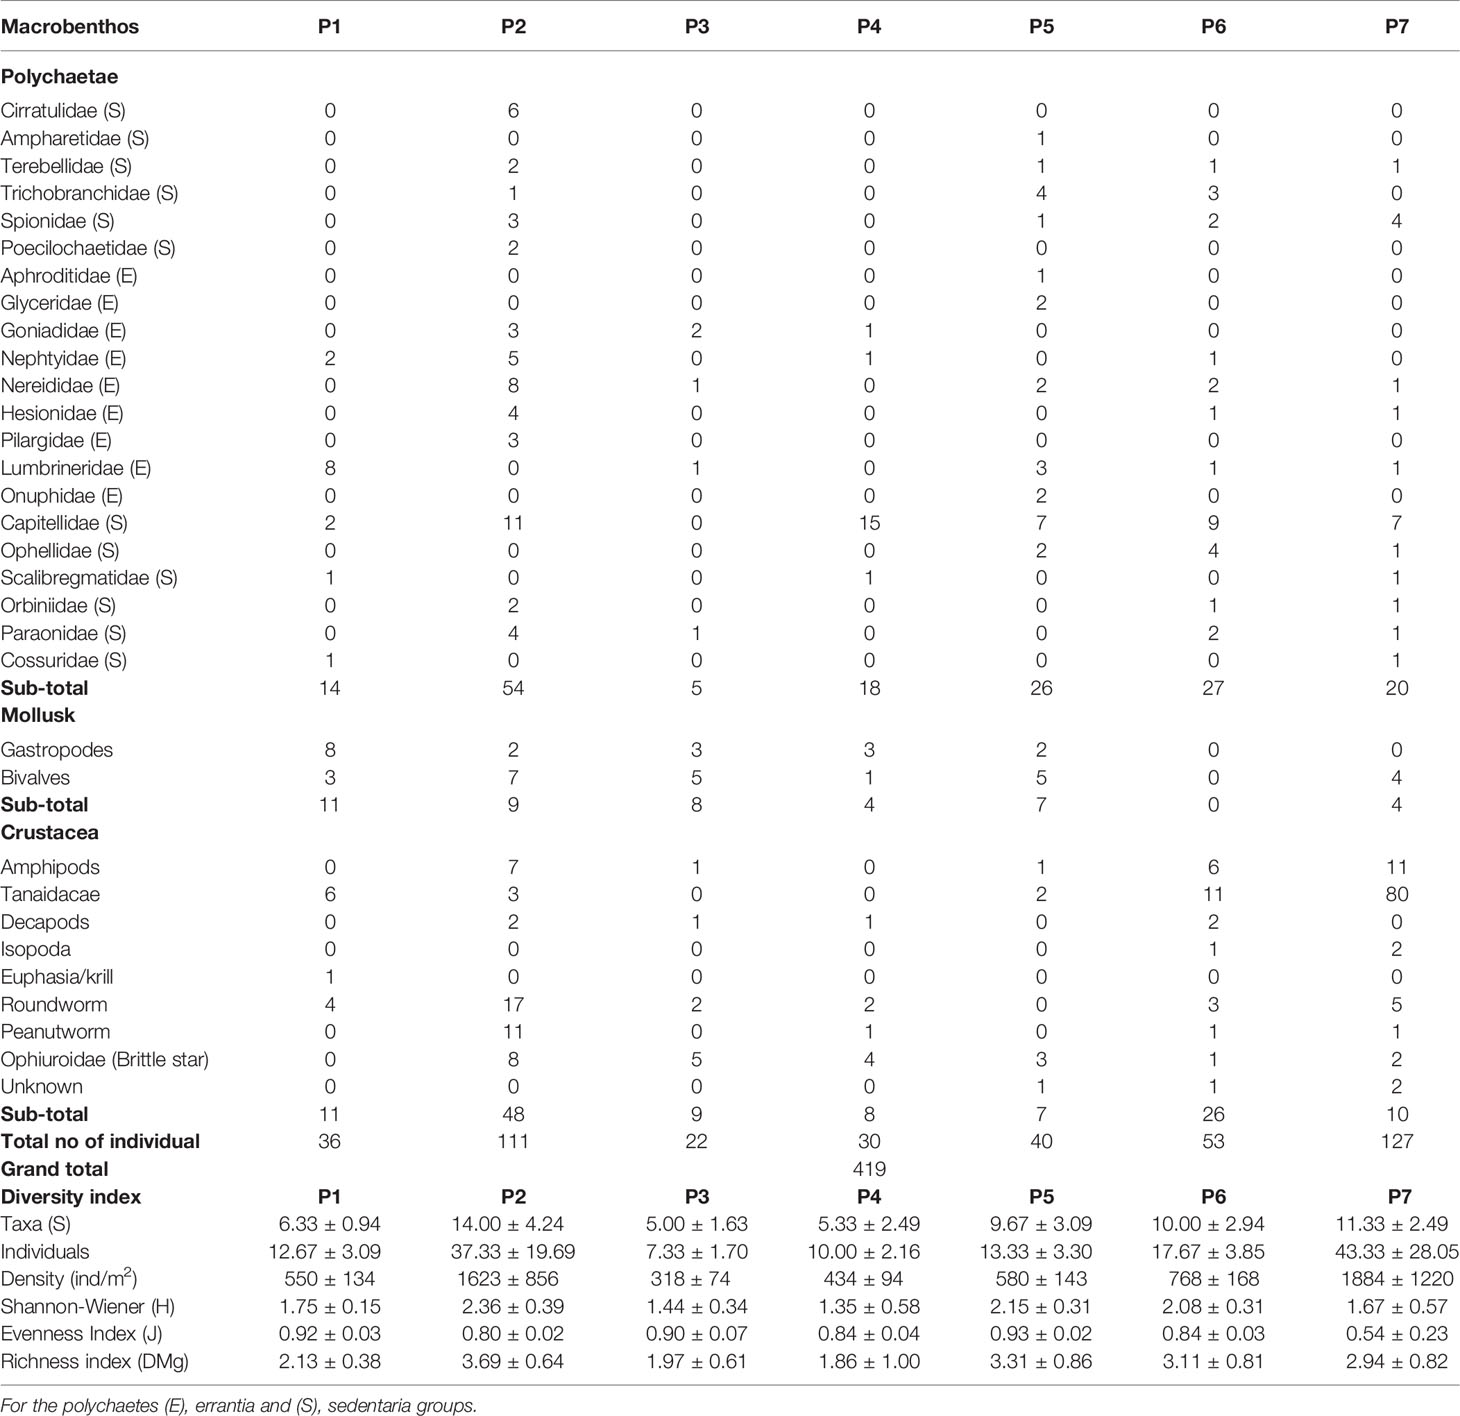
Table 5 Summary of the biological parameters of the macrobenthos communities: mean number of taxa, individuals and Shannon Diversity Index.
4 Discussion
4.1 Hydrodynamics and Meteorology Conditions
Bathymetry or seabed contour should be considered during site selection because floating cages must be placed where the water is deep enough to maximise water exchange and ensure that cage bottoms do not come in contact with seabed substrates at low tide (Shih, 2017). As a rule of thumb, the operational depth of the fishnet should be one-third of the water column depth, preventing net abrasion on the seabed. The new proposed site is expected to support deep cages of 5 to 8 m based on the bathymetry map. Apart from that, the bathymetry of the new proposed site (around 10 to 20 m) is highly suitable for offshore mariculture, and it is economical to install the mooring system (Zikra et al., 2020). The dispersion of farm waste materials is limited if the site is too shallow (< 1 m), and the build-up of waste materials directly beneath cages is inevitable. Re-suspension of deposited materials in shallow sites will reduce visibility, thus, inducing stress in the fish and lower oxygen concentration in the cage. Moreover, large floating particles such as sediment slurries are abrasive to fish gills, eventually leading to secondary infection of the gill lamellae and increasing their susceptibility to diseases (Wong et al., 2013). However, deep sites with good currents will carry additional installation and infrastructure costs.
During the NE monsoon (usually in November to March), the average wind speed of the west coast of Peninsular Malaysia is around 2.57 – 5.14 m/s, reaching up to 12.86 m/sfor short periods. Conversely, the southwest (SW) monsoon (May-September) bring about intense solar heating, leading to high temperature over the Asian landmass as hot air expands and rises upward, creating a semi-permanent low-pressure area. Typically, the wind speed is 5.14 m/s but could reach up to 7.72 – 10.28 m/s in northern parts of the west coast (Binti Sa’adin et al., 2016). In the transition period between the monsoons, commonly known as the inter-monsoon (April and October), the winds are often mild and omnidirectional. However, the CFSR data are unlikely to fully resolve the Sumatra squalls (a phenomenon for high intensity, short duration winds in the region) with wind speeds reaching up to 30 m/s. The Sumatra Squall is characterised by intense, local, gusty surface winds, usually accompanied by heavy rain over Peninsular Malaysia that lasts for 1 to 2 h, occurring in June, July and August. In this study, meteorological results indicate that the average wind speed in the study area is maintained at the Beaufort wind scale of ≤ 5, where the is wind speed = 8 – 11 m/s, maximum wave height = 2.5 m/s. The exposed farming equipment is influenced by wind due to the increased abrasion between the net and its supporting structures. In addition, the wind may also damage the bird net protection and affect the stability of their supports.
Furthermore, operators are susceptible to accidents in rough weather conditions while moving on the vessel deck or net cage. Moreover, strong wind and high waves will increase the likelihood of fish escaping through structural damage or holes in the net (Yang et al., 2020). On the other hand, swell waves around the proposed site are expected to be minimal due to the relatively short fetch because of wind direction and low wind strengths (Abankwa et al., 2015). The ships reported in Sector 6 are government vessels, tug, ferry, fishing vessels, general cargo, tanker vessels, VLCC, bulk carrier, container vessel, and RoRo. A plot of ship density is shown in Figure 3C that reflects the movement of some 100 000 ship passages annually. Based on the previous assessment, the predicted maximum wake waves height generated by high-speed ferry transit at an average speed of 10.28 m/s from and to Kukup will generate wakes of up to 0.6 m and induce large waves of up to 1.0 m at the proposed site. Ship wakes are formed downstream of a moving object such as ships or vessels and can contribute to the small period waves at the proposed aquaculture site, although this needs further documentation.
While the coastal currents are vital in driving the transport and dispersal of substances such as nutrients, pollutants, and sediments in the water, a significant net transport is more significant to the magnitude of the net current (Geyer et al., 2004). In general, the net current in the Malacca Straits tends to move towards the northern part of the Straits and is particularly strong during the NE monsoon and weaker in the SW monsoon and inter-monsoon. Ships wake due to heavy marine traffic in the marine traffic separation scheme, and ferries from the Kukup Port also generate waves (Figure 3). Water currents affect the load distribution and motion of offshore net cages. Apart from that, waves are the dominant factor causing structural failure of offshore net cages. Nonetheless, a slightly higher sea current speed (~20 cm s−1) is considered beneficial for the welfare of farmed fish and the farm environment. On the other hand, higher current speeds (> 1.5 body lengths s−1) can adversely affect fish health, farming equipment and operations (Oppedal et al., 2011; Xu and Qin, 2020; Hvas et al., 2021). Currents act as additional drag force on the mooring system and simultaneously apply wave force on the anchor components. High current speeds will wash out the feed from the cages before fully- consumed, thus, increasing feed use and lowering the feed conversion ratio (FCR). The current force could be reduced by increasing the mooring lines at the cage centre and positioning the short side of the grid against the incoming current (Purnawanti et al., 2018). Overall, the degree of wind exposures, current speeds, water depths, wave heights and wave periods of the new proposed site is within the HDPE cages limit with a life span of around 15 – 20 years.
4.2 Water Quality
The existing aquaculture site in Kukup Straits showed the lowest salinity recorded in this study (P1) at 23.6 psu. Sampling sites (WQ7 and P1) are located adjacent to the mouth of the Permas river; thus, lower salinity is expected at these sites. Even though the turbidity at the existing site was not measured in the present study, the National Coastal Erosion Study in 2015 reported a high coastal erosion rate (18.32 m/year) at the western and southern shores of Kukup Island (DID, 2015). In addition, Philipose et al. (2012) reported that weight gain of sea bass (Lates calcarifer) - one of the fish species cultured in Kukup Straits, is optimal when the ambient water temperature is 32.5°C. The low DO values in this site indicated the high biochemical oxygen demand (BOD) of cultured fish in the aquaculture farms and the bacterial nitrification processes of fish faeces. Healthy fish require high DO, and the recommended threshold is > 5 mg/L as per MMWQS Class 2 Fisheries in mariculture. Factors contributing to ammoniacal nitrogen and nitrate peaks are nutrient runoffs from agriculture activities upstream of the rivers, nutrient waste from aquaculture faeces and feed, and sewage and resuspension of surface sediments into the water column that increases the decomposition rate. These factors increase the risk of phytoplankton blooms and potentially ammonia poisoning of the fish.
The temperature at the existing aquaculture site does not vary significantly compared to the study by Isa et al. (2020), where the temperature of the Malacca Straits ranged between 28 and 30°C. Isa et al. (2020) suggested that the temperature is lowest during NE monsoon and highest during SW monsoon. Besides, Bermudes et al. (2010) reported that the ideal temperature for rearing seabass (L. calcarifer) for the maximum growth and feed intake is within the range of 29.1 - 34.9°C, while the optimal feed efficiency is achieved between 26.2 - 34.9°C. At station WQ5, DO fluctuations were found between 3.5 - 4.0 m. Similarly, salinity fluctuation was evident at 3.5 - 4.0 m compared to the surface water, contributed by the influx of river water and resulting turbulence during the water mixing activity.
The DO concentrations recorded at the proposed site exceeded the 5 mg/L MMWQS Class 2 limits. The positive finding might result from the increased exposure to the ocean, higher current velocities and distance from aquaculture site (Johansson et al., 2007). However, abiotic factors such as high water temperature and salinity also affect the liberation of an oxygen molecule from water; hence, the reduced DO concentration (Jack et al., 2009). Asian seabass is a hardy fish that can tolerate 0 to 56 ppt salinity (Food and Agriculture Organization (FAO), 2017), and thus, highly suitable to be reared at the proposed site. Additionally, pompano can tolerate a wide range of salinity (10 ppt to 15 ppt salinity) (Pathak et al., 2019), and is suitable for culture at the proposed site. The overall test temperatures applied across the different life stages of the aquaculture groupers (Serranidae) ranged from 13°C to 35°C, with a mean optimum rearing temperature of 26°C (Das et al., 2021), thus, ideal to be cultured at the proposed site. Ammoniacal nitrogen concentrations were much lower compared to the existing Kukup aquaculture site. However, the F2 station located close to the boundary of the proposed site recorded high ammoniacal nitrogen concentration, exceeding the MMWQS Class 2 limits. Meanwhile, the nitrate concentrations were high at stations F2 and F4. The high nutrient load could lead to eutrophication and, subsequently, phytoplankton blooms.
4.3 Marine Sediments and Macrobenthos Diversity
Silt sediment is categorised as lithogenous sediment derived from continental rock erosion. Shaari et al. (2017) reported that the seafloor around Kukup Island consists mainly of quartz and kaolinite in sediments, while the highest oxide element in sediments is silicon dioxide (SiO2). The redox potential of marine systems is a measure of electrochemical potential or electron availability within the systems. Electrons are essential to all inorganic and organic chemical reactions. Redox potential measurements allow rapid characterisation of the degree of reduction and predict various compound stability that regulates nutrients and metal availability in soil and sediment (Eggleton and Thomas, 2004; Pereira et al., 2004). Wong and Yang (1997) found that high redox potential and low pH are associated with chemical equilibrium disruption and the release of heavy metals from marine sediments. Negative Eh values are characteristic of bottom deposits rich in organic matter and consist mainly of fine sediments. Reimers et al. (2013) suggested that the reducing condition is generally caused by decomposable organic matter, bacteria and allied microorganisms. The lowest redox potential value was recorded at the existing aquaculture site, indicating that such conditions are maintained by certain organic compounds, ferrous iron, reduced manganese, hydrogen sulphide, and other inorganic constituents of sediments.
TOC was remarkably high (9.63%) at P7, which may be contributed by the proximity to the shipping lane and estuarine area prone to anthropogenic pollution from the mainland (sewage, surface runoff, heavy sedimentation). Generally, organic carbon represents < 5% of marine sediment even when the PSD findings of fine silt/clay particles are high. Martinez-Garcia et al. (2015) suggested that the organic carbon found in muddy sediment with polychaete and fecal pellets could account for ≥ 30% of the sediment dry weight. Organically enriched sediment is an aerobic environment that does not facilitate nitrification and phosphate release from the iron-bound pool. Unfortunately, phosphate concentration in the water column was not measured. The anaerobic environment of benthic sediment promotes the sulphate reduction process, which leads to a high concentration of dissolved sulphide in the sediment (Holmer et al., 2003). Sulphate depletion is the main factor contributing to microbial methanogenesis. The accumulation of sulphides and methane are harmful to benthic macrofauna. Naturally, muddy sediment has higher organic matter and sulphate reduction rates than sandy sediment (Martinez-Garcia et al., 2015). In this study, decomposable organic matter content may result from debris and waste from existing aquaculture sites adjacent to sampling stations. Organic matter characteristics may be seasonal in quantity and quality (Gremare et al., 1997). No hydrocarbons were detected (< 0.01 mg/kg) at all sampling points, although the new proposed site is in the vicinity of the shipping lane. Hydrocarbons are introduced into the surface water of the marine environment from surface runoff and erosion, effluent discharge, debris of virgin polystyrene, and biological sources. Despite the association of hydrophobic compounds with particles, the deposition in the underlying sediments is variable (Liu et al., 2012; Rochman et al., 2013). At the global scale, the storage of organic matter as TOC mirrors the distribution pattern of phytoplankton biomass (Seiter et al., 2004). However, diverse biogeochemical and sediment processes can modify such patterns at the regional level (Zabel et al., 1998).
The quantity and nature of the deposited organic matter are intimately related to the environmental conditions of deposition, depending on multiple factors, many of which are interdependent. The three main factors include 1) supply of organic matter in the overlying water, 2) the rate of decomposition of the organic substances in water or after accumulation in the sediments, and 3) water movement where the materials are deposited (Wakeham and Canuel, 2006). The supply of organic matter in typical marine deposits is primarily influenced by the growth of the phytoplankton in the water, sunlight exposure and mineral nutrients. Water movement or circulation influences the supply of nutrients, while organic matter decomposition is regulated by several factors, mainly oxygen supply. The oxygen supply is determined by the decomposition of organic matter and water circulation. In addition, horizontal advection and compound selective degradation can affect the distribution and composition of the settling particles. Therefore, the material deposited at the sediment-water interface is not a good representation of hydrocarbon transported through the water column.
Copper, nickel, lead, zinc, iron and manganese are detected at all sampling points. The trace elements potentially originated from wastewater discharge or soil erosion (Hosono et al., 2011). Furthermore, studies have suggested that heavy metals could be derived from fish food at existing aquaculture sites (Liang et al., 2016). Moreover, earlier studies found that the source of heavy metals could leach from the fish food at existing aquaculture sites (Kundu et al., 2017; Sabbir et al., 2018). Meanwhile, Hayat et al. (2017) suggested that 10 mg/kg of heavy metals such as lead, silver, chromium, copper, cobalt, nickel and zinc can significantly affect L. calcarifer’s kidney by inhibiting cholinesterases (ChE) activity at various percentages. Apart from that, heavy metals weaken their immune system and induce pathological changes. The consumption of finfish polluted by heavy metals can adversely affect human health (Kumar et al., 2021). As the heavy metals become more concentrated in the environment, these elements enter the biogeochemical cycle, leading to toxicity.
The polychaete fauna of the study area is dominated by sedentaria and errantia orders commonly found in the tropical Indo-Malayan sub-region of the Indo-West-Pacific province (Shin, 1982). The Shannon diversity index (H’) values of the study site were relatively high, indicating well distribution of macrobenthos fauna. Nonetheless, these values were higher than those reported by Quek and Chua (1990) for Sungei Buloh and Chung and Goh (1990) in Tekong Island. A high variation in the evenness index (J’) value was evident, ranging from 0.54 ± 0.23 at P7 to 0.93 ± 0.02 at P5. A good distribution of organisms in a pristine environment would typically have a score of ≥ 0.9 (Sokołowski et al., 2012). The evenness index (J’) values were relatively high, stipulating that the macrobenthos were equally distributed throughout the habitats except for P7. Meanwhile, studies in Tg. Pulai has reported the abundance of macrobenthos mean density, ranging between 320 ± 114 (range: 126 - 535) ind./m2 during the NE monsoon and 267 ± 247 (range: 56-1,343) ind./m2 during the SW monsoon (DHI Water and Environment, 2013). Capitellids are regular inhabitants of the soft marine sediments found in all sampling sites except P3. They are among the many keystone species essential in the energy budgets due to their feeding habits and abundance (García-Garza and De León-González, 2011). In addition, they are benthic burrowers and feed on organic matter adhering to sediments and are regarded as non-selective deposit feeders (Dean, 2001). Microscopic images of bivalve, capitellid, hesionid, peanut worm, scalibregmatid are shown in Figure 6.
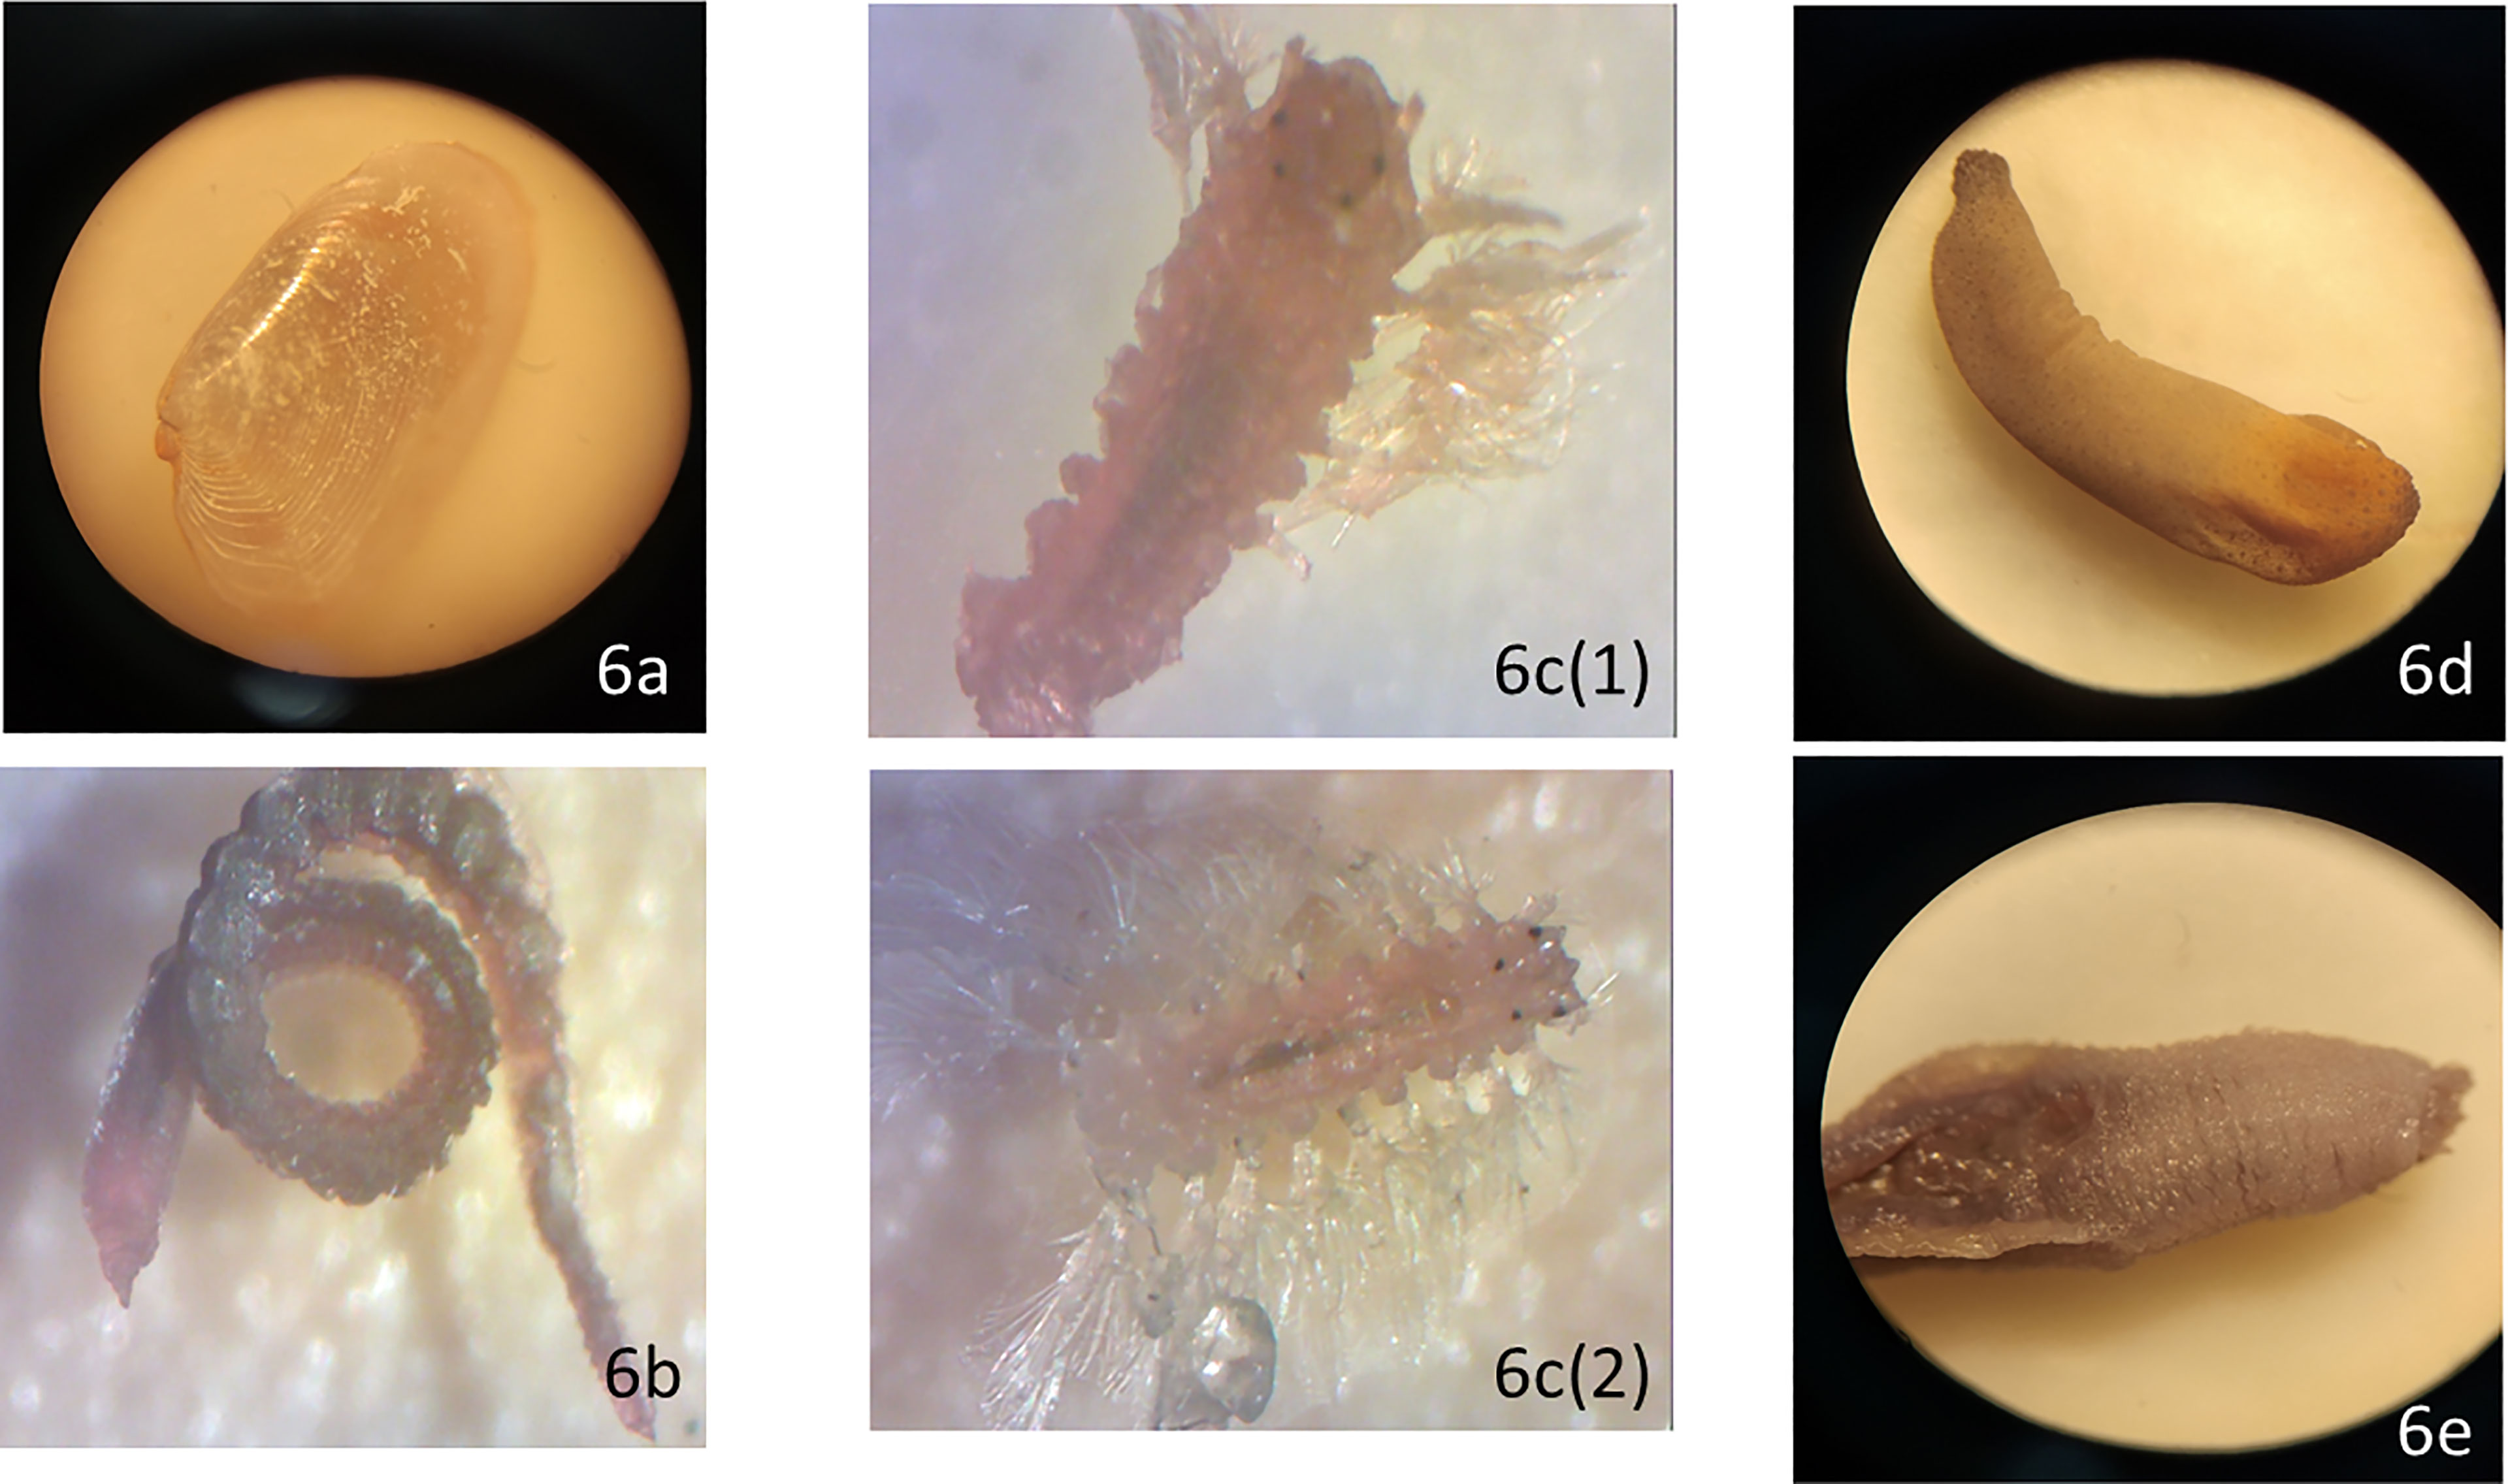
Figure 6 Microscopic images of macrobenthos: (A) bivalve, (B) capitellid, (C) hesionid, (D) peanut worm, and (E) scalibregmatid.
Capitellids are distributed from the intertidal zone to the deep sea and are often dominant components of the infaunal community, especially in organically enriched sediments. Therefore, they act as pollution indicators of man-induced, organically enriched areas such as organic-rich sediments and benthic habitats defaunated by artificial disasters such as oil spills, red tide blooms and tropical storms (Sivadas et al., 2010; Washburn et al., 2016; Hilliard, 2020). However, polychaete under the Lumbrineridae family is commonly found within the organically enriched sediment and sediment with a low degree of metal contamination (D'Alessandro et al., 2014). Similarly, Spionids are opportunistic surface deposit feeders and thrive in organically enriched sediments. Water with a heavy suspended sediment load could be significantly filtered when it passes over dense populations of spionid polychaetes. Spionids accumulate particles from water column and sediment as part of their tubes or in interstices between the tubes (Taghon et al., 1980). Studies have suggested that smaller particles collected by spionids are consumed while bigger particles are utilised as building materials for their tubes (Frithsen and Doering, 1986). The ecological role of spionids is to remove particles from the water during the high particle flux, which is an active sedimentation process in coastal ecosystems (Blake et al., 2020). Gillet et al. (2012) suggested that Nereididae is a significant link in benthic food webs and through sediment reworking by bioturbation activity. Nereidae also enhances the oxygen transport into sediments through irrigation and increases the surface area of oxygenated sediments through the burrow construction. Overall, the water quality data of all sampling sites are within the MMWQS Class 2 Fisheries and mariculture threshold limits. Similarly, the sediment hydrocarbons and heavy metals composition values are within the intervention value compared to the Dutch Intervention values for aquatic sediment (Dutch Ministry of Housing, Spatial Planning and Environment, VROM, 2010).
5 Conclusion
Water quality at the existing aquaculture site is subjected to higher concentrations of nutrient loading and salinity fluctuations. Aquaculture tropical finfish will still grow in these conditions but with poorer fish health and higher mortality. Due to lower flushing rates and high nutrient measurements, the existing site should move toward moderate to low-intensity farming instead of the current high-intensity farming to maintain optimal fish health. The spatial analysis indicates that the water quality during the normal hydrodynamic and meteorological conditions at the proposed aquaculture site has potential for aquaculture operations. Furthermore, the flushing capacity is higher in the proposed site, indicating the capacity to handle moderate-intensity aquaculture. It is recommended that additional data, especially on nutrient cycling, water quality model, and carrying capacity evaluation, be collected to determine the optimal stocking density for mariculture to ensure sustainable aquaculture production. Moreover, further studies with longer duration are highly recommended to understand periodic monsoonal variations, storms, and algal blooms to prevent operational failures and economic losses. Given the low flushing rates and high nutrient loading from river mouths, relocating the existing fish farms offshore with moderate to low-intensity farming is recommended. Alternatively, the proposed aquaculture site could also be established into deeper waters. Intensive aquaculture could have had significant social and economic impacts via chemicals, waste deposition, and fish stock migration. Thus, it is crucial to engage wider community stakeholders for the rigorous application of cost-benefit analysis. Finally, the critical understanding of the social and ecosystem services must be integrated into the new aquaculture industrial development value chains.
Data Availability Statement
The raw data supporting the conclusions of this article will be made available by the authors, without undue reservation.
Author Contributions
W-KC, T-YL, and J-YL wrote the manuscript. MM, TC, C-WC, and VA conceptualized the flow and technical aspects of the manuscript. K-SL and J-YL contributed specialized sections. All authors have read and agreed to the published version of the manuscript.
Funding
This work was supported by WWF Singapore and Malaysia (Grant No.: MA021123911INTL) and a WWF-Conservation Partnership Scheme (CPS) (Grant No. CPS-FAS-2021/001), and partly financed by UCSI University Research Excellence & Innovation Grant (Grant No.: REIG-FAS-2020/067).
Conflict of Interest
The authors declare that the research was conducted in the absence of any commercial or financial relationships that could be construed as a potential conflict of interest.
Publisher’s Note
All claims expressed in this article are solely those of the authors and do not necessarily represent those of their affiliated organizations, or those of the publisher, the editors and the reviewers. Any product that may be evaluated in this article, or claim that may be made by its manufacturer, is not guaranteed or endorsed by the publisher.
Acknowledgments
The authors would like to thank the Department of Fisheries Johor, Iskandar Regional Development Authority, Marine Fish Farmers Association of Malaysia, Mr Lim Hong Peng and other fish farmers from Kukup for their support in completing this research.
References
Abankwa N. O., Johnston S. J., Scott M., Cox S. J. (2015). “Ship Motion Measurement Using an Inertial Measurement Unit” in 2015 IEEE 2nd World Forum on Internet of Things (WF-IoT), Conference paper. Milan, Italy.
Adeniji A. O., Okoh O. O., Okoh A. I. (2018). Analytical Methods for Polycyclic Aromatic Hydrocarbons and Their Global Trend of Distribution in Water and Sediment: A Review. Recent Insights Petroleu. Sci. Eng. 10, 393–420. doi: 10.5772/intechopen.71163
APHA, American Public Health Association, American Water Works Association, Water Pollution Control Federation, & Water Environment Federation (1912). Standard Methods for the Examination of Water and Wastewater Vol. Vol. 2) (Washington DC: American Public Health Association).
Baird R. B., Eaton A. D., Rice E. W., Bridgewater L. (2017). Standard Methods for the Examination of Water and Wastewater Vol. 23 (Washington, DC: American Public Health Association).
Barau A. S., Stringer L. C. (2015). Access to and Allocation of Ecosystem Services in Malaysia's Pulau Kukup Ramsar Site. Ecosyst. Serv. 16, 167–173. doi: 10.1016/j.ecoser.2015.10.021
Bermudes M., Glencross B. D., Austen K., Hawkins W. (2010). Effect of High Water Temperatures on Nutrient and Energy Retention in Barramundi (Lates Calcarifer). Aquaculture 306, 160–166. doi: 10.1016/j.aquaculture.2010.05.031
Binti Sa’adin S. L., Kaewunruen S., Jaroszweski D. (2016). Risks of Climate Change With Respect to the Singapore-Malaysia High Speed Rail System. Climate 4 (4), 65. doi: 10.3390/cli4040065
Blake J. A. (1994). “Family Phyllodocidae. Taxonomic Atlas of the Benthic Fauna of the Santa Maria Basin and Western Santa Barbara Channel,” in Oligochaeta and Polychaeta: Phyllodocida (Phyllodocidae to Paralacydoniidae), vol. 4. (Santa Barbara, California: Santa Barbara Museum of Natural History), 115–186.
Blake J., Maciolek N., Meißner K. (2020). “7.4 Sedentaria: Sabellida/Spionida,” in Volume 2 Pleistoannelida, Sedentaria II: Band 2: Pleistoannelida, Sedentaria Ii. Eds. Purschke G., Westheide W., Böggemann M. (Berlin, Boston: De Gruyter), 1–103.
Chung D. S., Goh B. P. (1990). A Survey of the Soft-Bottom Benthic Fauna of Pulau Tekong. Coast. Livin. Resour. Singap. (Singapore: Department of Zoology, National University of Singapore), 53–62.
Cortes J. E., Suspes A., Roa S., Gonzá Lez C., Castro H. E. (2012). Total Petroleum Hydrocarbons by Gas Chromatography in Colombian Waters and Soils. Am. J. Environ. Sci. 8 (4), 396. doi: 10.3844/ajessp.2012.396.402
D'Alessandro M., Cosentino A., Giacobbe S., Andaloro F., Romeo T. (2014). Description of a New Species of Abyssoninoe (Polychaeta: Lumbrineridae) From North-East Sicily (Central Mediterranean Sea). J. Mar. Biol. Assoc. Unite. Kingd. 94 (4), 747–752. doi: 10.1017/S0025315414000095
Das S. K., Xiang T. W., Noor N. M., De M., Mazumder S. K., Goutham-Bharathi M. P. (2021). Temperature Physiology in Grouper (Epinephelinae: Serranidae) Aquaculture: A Brief Review. Aquacult. Rep. 20, 100682. doi: 10.1016/j.aqrep.2021.100682
Day J. H. (1968). A Monograph on the Polychaeta of Southern Africa Part 1, Errantia: Part 2, Sedentaria Published by the Trustees of the British Museum (Natural History), London 1967 Publication No. 656. Pp. Viii+ 878. Price£ 15. J. Mar. Biol. Assoc. Unite. Kingd. 48 (3), 836–836.
Dean H. K. (2001). Capitellidae (Annelida: Polychaeta) from the Pacific Coast of Costa Rica. Rev Biol Trop 49: 69–84
De Novaes Vianna L. F., Bonetti Filho J. (2018). Spatial Analysis for Site Selection in Marine Aquaculture: An Ecosystem Approach Applied to Baía Sul, Santa Catarina, Brazil. Aquaculture 489, 162–174. doi: 10.1016/j.aquaculture.2017.12.039
Department of Environment (2011) Malaysia Marine Water Quality Criteria and Standard. Available at: https://www.doe.gov.my/portalv1/wp-content/uploads/2019/04/BOOKLET-BI.pdf (Accessed 1 October 2021).
DHI Water and Environment (2013). Tanjung Piai Reclamation DEIA (Johor), Kota Kinabalu: DHI Water and Environment (Malaysia).
DID (2015). National Coastal Erosion Study (NCES2015) Report Vol. 2015 (Kuala Lumpur, Malaysia: Department of Drainage and Irrigation), 467.
Divu D. N., Mojjada S. K., Pokkathappada A. A., Sukhdhane K., Menon M., Mojjada R. K., et al. (2021). Decision-Making Framework for Identifying Best Suitable Mariculture Sites Along North East Coast of Arabian Sea, India: A Preliminary GIS-MCE Based Modelling Approach. J. Cleane. Prod. 284, 124760. doi: 10.1016/j.jclepro.2020.124760
Dutch Ministry of Housing, Spatial Planning and Environment, VROM (2010) Intervention and Target Values-Soil Quality Standards. Available at: https://sednet.org/download/guidance_document_for_sediment_assessment.pdf.
Eggleton J., Thomas K. V. (2004). A Review of Factors Affecting the Release and Bioavailability of Contaminants During Sediment Disturbance Events. Environ. Int. 30 (7), 973–980. doi: 10.1016/j.envint.2004.03.001
Eleftheriou A., Moore D. C. (2013). Macrofauna Techniques. Methods Stud. Mar. Benth., 175–251. doi: 10.1002/9781118542392.ch5
Fadzil M. F., Yun P. S., Razal A. R., Chee P. S., Suratman S., Dagang N. S., et al (2017). Oil and Grease and Total Petroleum Hydrocarbons in the Waters of Ramsar Gazetted Mangrove Area, Johor. J Sustain Sci Manag 12(1), 30–39.
Food and Agriculture Organization (FAO) (2017) Fishstat Plus Version 2.30. FAO Fisheries Department, Fishery Information, Data and Statistics Unit. Available at: http://www.fao.org./fi/statist/FISOFT/FISHPLUS (Accessed 28 March 2022).
Frithsen J. B., Doering P. H. (1986). Active Enhancement of Particle Removal From the Water Column by Tentaculate Benthic Polychaetes. Ophelia 25 (3), 169–182. doi: 10.1080/00785326.1986.10429748
García-Garza M. E., De León-González J. A. (2011). Review of the Capitellidae (Annelida, Polychaeta) From the Eastern Tropical Pacific Region, With Notes on Selected Species. ZooKeys 151), 17–52. doi: 10.3897/zookeys.151.1964
Geyer W. R., Hill P. S., Kineke G. C. (2004). The Transport, Transformation and Dispersal of Sediment by Buoyant Coastal Flows. Continent. Shelf. Res. 24 (7-8), 927–949. doi: 10.1016/j.csr.2004.02.006
Gill K. (2019). Identification Guide to Freshwater Macroinvertebrates (Stroud Water Research Center).
Gillet P., Mouloud M., Mouneyrac C., Simo P., Gilbert F. (2012). Preliminary Data on the Bioturbation Activity of Hediste Diversicolor (Polychaeta, Nereididae) From the Loire Estuary, France. Open Mar. Biol. J. 6, 53. doi: 10.2174/1874450801206010053
Gimpel A., Stelzenmüller V., Grote B., Buck B. H., Floeter J., Núñez-Riboni I., et al. (2015). A GIS Modelling Framework to Evaluate Marine Spatial Planning Scenarios: Co-Location of Offshore Wind Farms and Aquaculture in the German EEZ. Mar. Policy 55, 102–115. doi: 10.1016/j.marpol.2015.01.012
Gremare A., Amouroux J. M., Charles F., Dinet A., Riaux-Gobin C., Baudart J., et al. (1997). Temporal Changes in the Biochemical Composition and Nutritional Value of the Particulate Organic Matter Available to Surface Deposit-Feeders: A Two-Year Study. Mar. Ecol. Prog. Ser. 150, 195–206. doi: 10.3354/meps150195
Guerin T. (1999). The Extraction of Aged Polycyclic Aromatic Hydrocarbon (PAH) Residues From a Clay Soil Using Sonication and a Soxhlet Procedure: A Comparative Study. J. Environ. Monitor. 1 (1), 63–67. doi: 10.1039/a807307d
Hampton M. P. (2010). Enclaves and Ethnic Ties: The Local Impacts of Singaporean Cross-Border Tourism in Malaysia and Indonesia. Singap. J. Trop. Geograph. 31 (2), 239–253. doi: 10.1111/j.1467-9493.2010.00393.x
Hassan A. S. (2010). Fishing Villages: Resemblance to the Pre-Colonial City Landscape at the Straits of Malacca in Peninsular Malaysia. Arab. World Geograph. 13 (2), 93–107. doi: 10.5555/arwg.13.2.02567244g400867u
Hayat N. M., Ahmad S. A., Shamaan N. A., Sabullah M. K., Shukor M. Y. A., Syed M. A., et al. (2017). Characterisation of Cholinesterase From Kidney Tissue of Asian Seabass (Lates Calcarifer) and its Inhibition in Presence of Metal Ions. J. Environ. Biol. 38 (3), 383. doi: 10.22438/jeb/38/3/MRN-987
Hilliard J. L. (2020). The Evolution and Ecology of Capitella (Annelida, Capitellidae) in the Gulf of Mexico (Doctoral Dissertation), Texas: Texas A&M University.
Holmer M., Duarte C. M., Heilskov A., Olesen B., Terrados J. (2003). Biogeochemical Conditions in Sediments Enriched by Organic Matter From Net-Pen Fish Farms in the Bolinao Area, Philippines. Mar. Poll. Bull. 46 (11), 1470–1479. doi: 10.1016/S0025-326X(03)00281-9
Hosono T., Su C. C., Delinom R., Umezawa Y., Toyota T., Kaneko S., et al. (2011). Decline in Heavy Metal Contamination in Marine Sediments in Jakarta Bay, Indonesia Due to Increasing Environmental Regulations. Estua. Coast. Shelf. Sci. 92 (2), 297–306. doi: 10.1016/j.ecss.2011.01.010
Hvas M., Folkedal O., Oppedal F. (2021). Fish Welfare in Offshore Salmon Aquaculture. Rev. Aquacult. 13, 836–852. doi: 10.1111/raq.12501
Isa N. S., Akhir M. F., Khalil I., Kok P. H., Roseli N. H. (2020). Seasonal Characteristics of the Sea Surface Temperature and Sea Surface Currents of the Strait of Malacca and Andaman Sea. J. Sustain. Sci. Manage. 15 (4), 66–77. doi: 10.46754/jssm.2020.06.007
Ismail N. A. H., Wee S. Y., Aris A. Z. (2018). Bisphenol A and Alkylphenols Concentrations in Selected Mariculture Fish Species From Pulau Kukup, Johor, Malaysia. Mar. Poll. Bull. 127, 536–540. doi: 10.1016/j.marpolbul.2017.12.043
Jaafar S. A., Latif M. T., Chian C. W., Han W. S., Abd Wahid N. B., Razak I. S., et al. (2014). Surfactants in the Sea-Surface Microlayer and Atmospheric Aerosol Around the Southern Region of Peninsular Malaysia. Mar. Poll. Bull. 84 (1-2), 35–43. doi: 10.1016/j.marpolbul.2014.05.047
Jack J. P., Abdsalam A. T., Khalifa N. S. (2009). Assessment of Dissolved Oxygen in Coastal Waters of Benghazi, Libya. J. Black. Sea/Mediterr. Environ. 15 (3), 135–56.
Johansson D., Juell J. E., Oppedal F., Stiansen J. E., Ruohonen K. (2007). The Influence of the Pycnocline and Cage Resistance on Current Flow, Oxygen Flux and Swimming Behaviour of Atlantic Salmon (Salmo Salar L.) in Production Cages. Aquaculture 265 (1-4), 271–287. doi: 10.1016/j.aquaculture.2006.12.047
Kumar P., Sivaperumal P., Manigandan V., Rajaram R., Hussain M. (2021). Assessment of Potential Human Health Risk Due to Heavy Metal Contamination in Edible Finfish and Shellfish Collected Around Ennore Coast, India. Environ. Sci. Poll. Res. 28 (7), 8151–8167. doi: 10.1007/s11356-020-10764-6
Kundu G. K., Alauddin M., Akter M. S., Khan M. S., Islam M. M., Mondal G., et al. (2017). Metal Contamination of Commercial Fish Feed and Quality Aspects of Farmed Tilapia (Oreochromis Niloticus) in Bangladesh. Biores. Communicat.-(BRC) 3 (1), 345–353.
Lai J. Y.. (2014). Spatial Development of Kukup Water Settlement in Adapting Coastal Environment. [Master’s thesis, National Cheng Kung University] Available at: http://repository.ncku.edu.tw/retrieve/188600/5010217001-000002.pdf
Leung H. M., Leung S. K. S., Au C. K., Cheung K. C., Wong Y. K., Leung A. O. W., et al. (2015). Comparative Assessment of Water Quality Parameters of Mariculture for Fish Production in Hong Kong Waters. Mar. Poll. Bull. 94 (1-2), 318–322. doi: 10.1016/j.marpolbul.2015.01.028
Liang P., Wu S. C., Zhang J., Cao Y., Yu S., Wong M. H. (2016). The Effects of Mariculture on Heavy Metal Distribution in Sediments and Cultured Fish Around the Pearl River Delta Region, South China. Chemosphere 148, 171–177. doi: 10.1016/j.chemosphere.2015.10.110
Liu L. Y., Wang J. Z., Wei G. L., Guan Y. F., Zeng E. Y. (2012). Polycyclic Aromatic Hydrocarbons (PAHs) in Continental Shelf Sediment of China: Implications for Anthropogenic Influences on Coastal Marine Environment. Environ. Poll. 167, 155–162. doi: 10.1016/j.envpol.2012.03.038
Manan N., Raza M., Yuh Y. S., Theng L. W., Zakaria M. P. (2011). Distribution of Petroleum Hydrocarbons in Aquaculture Fish From Selected Locations in the Straits of Malacca, Malaysia. World Appl. Sci. J. 14, 14–21.
Marine Environment Protection Committee (2017)Identification and Protection of Special Areas and PSSAs. In: Protection of Pulau Kukup (Kukup Island) and Tanjung Piai (Cape Piai) (Accessed 05 October 2021).
Martinez-Garcia E., Carlsson M. S., Sanchez-Jerez P., Sánchez-Lizaso J. L., Sanz-Lazaro C., Holmer M. (2015). Effect of Sediment Grain Size and Bioturbation on Decomposition of Organic Matter From Aquaculture. Biogeochemistry 125 (1), 133–148. doi: 10.1007/s10533-015-0119-y
Mayerle R., Niederndorfer K. R., Jaramillo J. M. F., Runte K. H. (2020). Hydrodynamic Method for Estimating Production Carrying Capacity of Coastal Finfish Cage Aquaculture in Southeast Asia. Aquacult. Eng. 88, 102038. doi: 10.1016/j.aquaeng.2019.102038
Michel S., Zahler A.-K. (2015). Cultivated Sea – Fishing and Aquaculture in the Metropolitan Region (Zurich: ETH Zurich).
Miner G. (2006). Standard Methods for the Examination of Water and Wastewater. Am. Water Work. Assoc. J. 98 (1), 130.
Mohamed K. N., May M. S. Y., Zainuddin N. (2015). Water Quality Assessment of Marine Park Islands in Johor, Malaysia. Bulletin of Environmental Science and Management 3 (2), 19–27.
Musale A. S., Desai D. V. (2011). Distribution and Abundance of Macrobenthic Polychaetes Along the South Indian Coast. Environ. Monitor. Assess. 178 (1), 423–436. doi: 10.1007/s10661-010-1701-3
Oppedal F., Dempster T., Stien L. H. (2011). Environmental Drivers of Atlantic Salmon Behaviour in Sea-Cages: A Review. Aquaculture 311 (1-4), 1–18. doi: 10.1016/j.aquaculture.2010.11.020
Pathak S. M., Lakra S. W., Reddy A. K., Chadha N. K., Tiwari V. K., Srivastava P. P. (2019). Growth and Survival of Silver Pompano Trachinotus Blochii (Lacepede 1801) at Different Salinities in Inland Saline Ground Water. Indian J. Anim. Sci. 89 (5), 581–587.
Pereira P. M., Black K. D., McLusky D. S., Nickell T. D. (2004). Recovery of Sediments After Cessation of Marine Fish Farm Production. Aquaculture 235 (1-4), 315–330. doi: 10.1016/j.aquaculture.2003.12.023
Philipose K. K., Sharma S. R., Loka J., Damodaran D., Rao G. S., Vaidya N. G., et al. (2012). Observations on Variations in Physico-Chemical Water Parameters of Marine Fish Cage Farm Off Karwar. Indian J. Fish. 59 (1), 83–88.
Pielou E. C. (1966). The Measurement of Diversity in Different Types of Biological Collections. J. Theor. Biol. 13, 131–144. doi: 10.1016/0022-5193(66)90013-0
Praveena S. M., Aris A. Z. (2013). A Baseline Study of Tropical Coastal Water Quality in Port Dickson, Strait of Malacca, Malaysia. Mar. Poll. Bull. 67 (1-2), 196–199. doi: 10.1016/j.marpolbul.2012.11.037
Purnawanti Y., Syahroni N., Mulyadi Y. (2018). “Analysis of Static Structural of Ocean FARMITS Offshore Cage Due to Environmental Load,” in MATEC Web of Conferences, 177 (EDP Sciences), 01023).
Quek S. T., Chua C. Y. Y. (1990). A Study of the Benthic Soft-Bottom and Pelagic Communities of Sungei Buloh. Coast. Livin. Resour. Singap., 1–8.
Radiarta I. N., Albasri H., Sudradjat A. (2011). Geographic Information System-Based Modeling and Analysis for Site Selection of Green Mussel, Perna Viridis, Mariculture in Lada Bay, Pandeglang, Banten Province. Indon. Aquacult. J. 6 (1), 83–90. doi: 10.15578/iaj.6.1.2011.83-90
Reimers C. E., Alleau Y., Bauer J. E., Delaney J., Girguis P. R., Schrader P. S., et al. (2013). Redox Effects on the Microbial Degradation of Refractory Organic Matter in Marine Sediments. Geochim. Cosmochim. Acta 121, 582–598. doi: 10.1016/j.gca.2013.08.004
Rochman C. M., Manzano C., Hentschel B. T., Simonich S. L. M., Hoh E. (2013). Polystyrene Plastic: A Source and Sink for Polycyclic Aromatic Hydrocarbons in the Marine Environment. Environ. Sci. Technol. 47 (24), 13976–13984. doi: 10.1021/es403605f
Sabbir W., Rahman M. Z., Halder T., Khan M. N., Ray S. (2018). Assessment of Heavy Metal Contamination in Fish Feed Available in Three Districts of South Western Region of Bangladesh. Int. J. Fish. Aquat. Stud. 6, 100–104.
Saha S., Moorthi S., Wu X., Wang J., Nadiga S., Tripp P., et al. (2014). The NCEP Climate Forecast System Version 2 J. Clim. 27 (6), 2185–2208. doi: 10.1175/JCLI-D-12-00823.1
Schönfeld J., Golikova E., Korsun S., Spezzaferri S. (2013). The Helgoland Experiment–assessing the Influence of Methodologies on Recent Benthic Foraminiferal Assemblage Composition. J. Micropalaeontol. 32 (2), 161–182. doi: 10.1144/jmpaleo2012-022
Seiter K., Hensen C., Schröter J., Zabel M. (2004). Organic Carbon Content in Surface Sediments—Defining Regional Provinces. Deep. Sea. Res. Part I.: Oceanogr. Res. Paper. 51 (12), 2001–2026. doi: 10.1016/j.dsr.2004.06.014
Shaari H., Shazili N. A. M., Abdullah L. I., Abdullah N. A., Husain M. L., Tahir N. M. (2017). Geochemistry and Clay Minerals of Surface Sediments of Southwestern Johor, Malaysia. Malays. J. Analytic. Sci. 21, 312–322. doi: 10.17576/mjas-2017-2102-06
Shannon C. E., Weaver W. (1949). The Mathematical Theory of Communication. vol. 1949. (Urbana: University of Illinois Press), 125p.
Shin P. K. S. (1982). “Some Polychaetous Annelids From Hong Kong Waters,” in Proceedings of the first international marine biological workshop: the marine flora and fauna of Hong Kong and Southern China, Hong Kong. 161–172.
Sivadas S., Ingole B., Nanajkar M. (2010). Benthic Polychaetes as Good Indicators of Anthropogenic Impact. Indian J. Mar. Sci. 39 (2), 201–211.
Sokołowski A., Wołowicz M., Asmus H., Asmus R., Carlier A., Gasiunaité Z., et al. (2012). Is Benthic Food Web Structure Related to Diversity of Marine Macrobenthic Communities? Estua. Coast. Shelf. Sci. 108, 76–86. doi: 10.1016/j.ecss.2011.11.011
Sterrer W. (1986). Marine Fauna and Flora of Bermuda. A Systematic Guide to the Identification of Marine Organisms. New York: Wiley-Interscience.
Sun Y., Xie Z., Li J., Xu J., Chen Z., Naidu R. (2006). Assessment of Toxicity of Heavy Metal Contaminated Soils by the Toxicity Characteristic Leaching Procedure. Environ. Geochem. Health 28 (1-2), 73–78. doi: 10.1007/s10653-005-9014-0
Szuster W. B., Albasri H. (2010). Site Selection for Grouper Mariculture in Indonesia. Int. J. Fish. Aquacult. 2 (3), 87–92.
Taghon G. L., Nowell A. R., Jumars P. A. (1980). Induction of Suspension Feeding in Spionid Polychaetes by High Particulate Fluxes. Science 210 (4469), 562–564. doi: 10.1126/science.210.4469.562
Uddin M., Alam J. B., Khan Z. H., Hasan G. J., Rahman T. (2014). Two Dimensional Hydrodynamic Modelling of Northern Bay of Bengal Coastal Waters. Comput. Wat. Energ. Environ. Eng. 3, 140–51. doi: 10.4236/cweee.2014.34015
United States Department of Agriculture-Natural Resources Conservation Service (USDA-NRCS) (2018) National Soil Survey Handbook, Title 430-VI (Washington, D.C: United States Department of Agriculture-Natural Resources Conservation Service). Available at: http://www.nrcs.usda.gov/wps/portal/nrcs/detail/soils/ref/?cid=nrcs142p2_054242 (Accessed 22 October 2021).
US Environmental Protection Agency (1992). Method 1311, in Toxicity Characteristic Leaching Procedure, Washington, DC; US Environmental Protection Agency vol. 1311. , 1 – 35.
Wakeham S. G., Canuel E. A. (2006). Degradation and Preservation of Organic Matter in Marine Sediments. Mar. Organ. Matter.: Biomarke. Isotope. DNA, 295–321. doi: 10.1007/698_2_009
Walkley A., Black I. A. (1934). An Examination of the Degtjareff Method for Determining Soil Organic Matter, and a Proposed Modification of the Chromic Acid Titration Method. Soil Sci. 37 (1), 29–38. doi: 10.1097/00010694-193401000-00003
Wang B., Waters A. L., Sims J. W., Fullmer A., Ellison S., Hamann M. T. (2013). Complex Marine Natural Products as Potential Epigenetic and Production Regulators of Antibiotics From a Marine Pseudomonas Aeruginosa. Microbial. Ecol. 65 (4), 1068–1075. doi: 10.1007/s00248-013-0213-4
Washburn T., Rhodes A. C., Montagna P. A. (2016). Benthic Taxa as Potential Indicators of a Deep-Sea Oil Spill. Ecol. Indic. 71, 587–597. doi: 10.1016/j.ecolind.2016.07.045
Wong C. K., Pak I. A. P., Jiang Liu X. (2013). Gill Damage to Juvenile Orange-Spotted Grouper E Pinephelus Coioides (H Amilton 1822) Following Exposure to Suspended Sediments. Aquacult. Res. 44 (11), 1685–1695. doi: 10.1111/j.1365-2109.2012.03173.x
Wong J. W. C., Yang C. L. (1997). The Effect of pH and Redox Potential on the Release of Nutrients and Heavy Metals From a Contaminated Marine Sediment. Toxicolog. Environ. Chem. 62 (1-4), 1–10. doi: 10.1080/02772249709358493
Xu Z., Qin H. (2020). Fluid-Structure Interactions of Cage Based Aquaculture: From Structures to Organisms. Ocean. Eng. 217, 107961. doi: 10.1016/j.oceaneng.2020.107961
Yang X., Ramezani R., Utne I. B., Mosleh A., Lader P. F. (2020). Operational Limits for Aquaculture Operations From a Risk and Safety Perspective. Reliabil. Eng. Syst. Saf. 204, 107208. doi: 10.1016/j.ress.2020.107208
Zabel M., Dahmke A., Schulz H. D. (1998). Regional Distribution of Diffusive Phosphate and Silicate Fluxes Through the Sediment–Water Interface: The Eastern South Atlantic. Deep. Sea. Res. Part I.: Oceanogr. Res. Paper. 45 (2-3), 277–300. doi: 10.1016/S0967-0637(97)00073-3
Keywords: aquaculture, Kukup Island, macrobenthos diversity, site selection, water quality
Citation: Chor W-K, Lai T-Y, Mathews MM, Chiffings T, Cheng C-W, Andin VC, Lai K-S and Loh J-Y (2022) Spatial Analysis for Mariculture Site Selection: A Case Study of Kukup Aquaculture Zones in the Peninsula of Malaysia. Front. Mar. Sci. 9:888662. doi: 10.3389/fmars.2022.888662
Received: 03 March 2022; Accepted: 20 April 2022;
Published: 20 May 2022.
Edited by:
Sebastian Villasante, University of Santiago de Compostela, SpainReviewed by:
Nor Azman Kasan, University of Malaysia Terengganu, MalaysiaJ.German Rodriguez, Technological Center Expert in Marine and Food Innovation (AZTI), Spain
Copyright © 2022 Chor, Lai, Mathews, Chiffings, Cheng, Andin, Lai and Loh. This is an open-access article distributed under the terms of the Creative Commons Attribution License (CC BY). The use, distribution or reproduction in other forums is permitted, provided the original author(s) and the copyright owner(s) are credited and that the original publication in this journal is cited, in accordance with accepted academic practice. No use, distribution or reproduction is permitted which does not comply with these terms.
*Correspondence: Jiun-Yan Loh, loh.jiun.yan@gmail.com; lohjy@ucsiuniversity.edu.my