Membrane lipid sensitivity to ocean warming and acidification poses a severe threat to Arctic pteropods
 Silke Lischka
 Michael J. Greenacre
 Ulf Riebesell
 Martin Graeve
- 1GEOMAR Helmholtz Centre for Ocean Research Kiel, Biological Oceanography, Kiel, Germany
- 2Departament d’Economia i Empresa, Universitat Pompeu Fabra and Barcelona School of Management, Barcelona, Spain
- 3Alfred Wegener Institute Helmholtz Centre for Polar and Marine Science, Ecological Chemistry, Bremerhaven, Germany
Ocean warming and acidification will be most pronounced in the Arctic. Both phenomena severely threaten thecosome pteropods (holoplanktonic marine gastropods) by reducing their survival (warming) and causing the dissolution of their aragonitic shell (acidification). Lipids, particularly phospholipids, play a major role in veligers and juveniles of the polar thecosome pteropod Limacina helicina comprising more than two-thirds of their total lipids. Membrane lipids (phospholipids) are important for the temperature acclimation of ectotherms. Hence, we experimentally investigated ocean warming and acidification effects on total lipids, lipid classes, and fatty acids of Arctic early-stage L. helicina. The temperature and pCO2 treatments chosen resembled Representative Concentration Pathway model scenarios for this century. We found a massive decrease in total lipids at elevated temperatures and at the highest CO2 concentration (1,100 μatm) of the in situ temperature. Clearly, temperature was the overriding factor. Total lipids were reduced by 47%–70%, mainly caused by a reduction of phospholipids by up to 60%. Further, based on pHT development in the incubation water of pteropods during the experiment, some evidence exists for metabolic downregulation in pteropods at high factor levels of temperature and pCO2. Consequently, the cell differentiation and energy balance of early-stage larvae were probably severely compromised. Comparison of our experimental with ‘wild’ organisms suggests phospholipid reduction to values clearly outside natural variability. Based on the well-known significance of phospholipids for membranogenesis, early development, and reproduction, negative warming effects on such a basal metabolic function may be a much more immediate threat for pteropods than so far anticipated shell dissolution effects due to acidification.
Introduction
Ocean warming (OW) and ocean acidification (OA), both in isolation and in combination, impact marine life in various ways, ranging from cellular- and physiological- to population-, community-, and ecosystem-level responses (Harvey et al., 2013; Kroeker et al., 2013; Hammill et al., 2018; Riebesell et al., 2018). Ocean warming and acidification (OWA) is caused by rising atmospheric CO2 concentrations resulting from fossil burning and land use changes since the beginning of industrialization (Sabine et al., 2004). Because the Arctic responds more rapidly to global warming and because of the high solubility of CO2 in cold waters, expected physical and chemical changes in seawater are particularly pronounced in polar regions (Doney, 2010; Spielhagen et al., 2011; Bopp et al., 2013; Rhein et al., 2013). Depending on the Representative Concentration Pathway (RCP) model scenario, projected ocean surface temperature and pH changes in the European Arctic vary between +1°C and +4°C, and between −0.1 and −0.45 pH units at the end of the century relative to the nineties of the last century. Concomitantly, aragonite undersaturation (Ωar<1) in the surface Arctic Ocean may have reached its maximum before 2050 (Bopp et al., 2013).
The tolerance of organisms to environmental variability and change is determined by physiological performance (Doney et al., 2012), whereas optimal physiological performance in terms of fitness and survival is defined by species-specific thermal windows (Pörtner, 2002). Among the major types of biomolecules, lipids are of utmost physiological importance, for example as membrane components (Lee et al., 1970; Hagen and Auel, 2001; Kattner et al., 2007). Temperature acclimation of ectotherms includes rapid modification of membrane lipids to a higher average amount of unsaturated phospholipid fatty acids to maintain adequate physical functioning of membranes at lower environmental temperatures (Farkas and Nevenzel, 1981; Chapelle, 1986). The effects of temperature acclimation can be amplified by elevated pCO2 through narrowing thermal tolerance windows (Pörtner, 2008; Hofmann and Todgham, 2010). Consequently, living under future OWA conditions may alter the lipid metabolism of marine ectotherms. Polar ectotherms, that possess a narrower thermal tolerance window than temperate and tropical ectotherms, may be particularly affected (Pörtner, 2002).
A few studies so far have examined combined OWA effects on the lipid composition of marine metazoa. In some experiments that showed effects on either lipid class or fatty acid compositions, temperature was the overriding factor (Rivest and Hofmann, 2015; Valles-Regino et al., 2015; Garzke et al., 2016), while OWA had no effects on the lipids of corals except for one species (out of four) where elevated pCO2 induced higher lipid concentrations (Schoepf et al., 2013). Moreover, pronounced genetic changes in response to OA in genes for lipid metabolism have been demonstrated (Pespeni et al., 2013).
Thecosome pteropods, marine holoplanktonic gastropods with aragonite shells, are highly sensitive to OWA, responding with reduced growth, calcification, development, and survival as well as with shell dissolution (Comeau et al., 2009; Lischka et al., 2011; Bednaršek et al., 2012; Manno et al., 2012; Bednaršek et al., 2019). The effects on metabolic rates vary with the developmental stage (Comeau et al., 2010; Lischka and Riebesell, 2017). Early life stages are particularly sensitive to OA and this sensitivity is further amplified with exposure duration and the concurrent impact of OW (Bednaršek et al., 2019). Hence, they have been suggested as candidate indicator species for the combined effects of OA and OW (Bednaršek et al., 2016).
Specifically, at higher latitudes, pteropods can dominate zooplankton communities, at times contributing more than 20% of zooplankton biomass in Arctic waters (Gannefors et al., 2005; Blachowiak-Samolyk et al., 2008; Mackas and Galbraith, 2012). They are important members of the epipelagic food web both as consumers and prey (Gilmer and Harbison, 1991; Levasseur et al., 1994; Falk-Petersen et al., 2001; Hunt et al., 2008; Karnovsky et al., 2008; Renaud et al., 2012). Limacina helicina (Phipps 1774) is also a regular member of the meso-/macrozooplankton community in Kongsfjord (Spitsbergen), usually constituting <1%–11% in terms of abundance (Hop et al., 2002; Walkusz et al., 2009; Lischka and Hagen, 2016; Hop et al., 2019), and in summer, occasionally dominating the macrozooplankton with up to 47% (Wesławski et al., 2000). Its natural temperature range extends from −4°C to 4°C and occasionally up to 7°C (van der Spoel, 1967). Lipids play a crucial role in the development and life cycle of L. helicina (Gannefors et al., 2005) and can make pteropods highly nutritive prey (Boissonnot et al., 2019).
To investigate whether and, if so, how the lipid metabolism of Arctic pteropods is impacted by OWA, we subjected early offspring of Arctic L. helicina at the transition from the veliger to the juvenile stage to elevated temperature and pCO2 conditions projected to occur within this century (Bopp et al., 2013; Rhein et al., 2013) for seven days. During this time of active development and growth of larvae, lipids, in particular phospholipids, are of exceptional importance (63%–88% of total lipids in juveniles and veligers) (Gannefors et al., 2005). Hence, any harmful impact of OWA on lipid metabolism would directly transfer to population and food web dynamics and may accompany more evident response signs such as shell dissolution (Bednaršek et al., 2019). Based on the physicochemical nature of lipids, we hypothesized a pronounced decrease, particularly of the polyunsaturated fatty acid and phospholipid compositions, primarily due to temperature.
Materials and methods
Sampling of pteropods
On 21 August 2013, early-stage Limacina spp. (Pteropoda, Thecosomata) were collected in the deepest part of Kongsfjord (northwest Spitsbergen) integrated from 300 m using a plankton net (100 μm mesh size, 0.2 m2 mouth opening, 1 L cod end) onboard R/V Teisten. Onboard, freshly collected samples were stored in 5 L containers filled to the top with ambient seawater to accommodate the live zooplankton until further processing in the Kings Bay Marine Laboratory (Ny Ålesund). To characterize abiotic parameters of the natural habitat of the pteropods, temperature and salinity were recorded with a STD/CTD model SD-204 (SAIV A/S, Bergen, Norway), and water samples for the determination of the in situ carbonate system [pHT, total alkalinity (AT), inorganic nutrients] were taken with a Niskin bottle from 50 m depth. Back in the lab, early-stage pteropods (veliger larvae, early juveniles) were immediately picked up from the zooplankton samples using a pipette and placed in 2 L beakers filled with seawater provided in the lab at a mean in situ temperature (3.5°C , see below) allowing for a 24 h acclimation phase of the pteropods before the experiment was set up on the next day (22 August). Seawater from Kongsfjord was pumped from 80 m depth to the Marine Laboratory via 20 μm filters, thus leaving particles <20 μm as food for incubated pteropods. The CO2 partial pressure at 50 m depth of pteropod collection was 258 μatm on 23 August.
Temperature and pCO2 perturbation experiment
For perturbation experiments, present and future carbonate chemistry conditions were simulated by bubbling the seawater provided in the Marine Laboratory with CO2 using Wösthoff gas mixing pumps (Wösthoff, Germany). Target values for the three CO2 treatments were 400 μatm (target value = ambient CO2), 750 μatm (target value = medium CO2), and 1,100 μatm (target value = high CO2). According to the RCP 8.5 scenario (Rhein et al., 2013), CO2 levels refer to the present day, years 2080, and >2100. CO2 levels were established in storage containers placed in two temperature-controlled rooms adjusted to two different temperature levels (3.5°C and 5.5°C). The 400 μatm treatment seawater was bubbled with ambient compressed air from the same outlet used for the production of the gas mixtures. 3.5°C was chosen as the in situ temperature and corresponds to the mean temperature averaged over the 300 m depth range where pteropods were collected from (= in situ T). The elevated temperature level of 5.5°C was chosen according to a projected 2°C increase for the Arctic Ocean in the upper 100–200 m (= high T) (Steinacher et al., 2009).
For the pteropod incubation experiment, six replicates were set up for each of the six treatment combinations. Before pipetting 200 early-stage juvenile Limacina spp. in each of the 300 ml glass dishes (one dish = one experimental unit = one replicate), 10 ml of the seawater provided in the laboratory was pipetted into the dishes to accommodate pteropods until the dishes were filled with the experimental seawater and covered with a glass lid. The whole procedure was performed in a crushed-ice bath to keep pteropods at an approximate in situ temperature during the experiment preparation. This procedure was performed in the temperature-controlled rooms where the prepared seawater was stored. Before filling the dishes with the experimental seawater, the manipulated seawater was sampled for carbonate system parameters [total alkalinity (AT), nutrients] and pH on the total scale (pHT), which was measured directly (see next section). AT samples were poisoned with 10 μl HgCl2 and stored in a fridge for subsequent analysis in the home laboratory. Nutrient samples were immediately frozen (−20°C) (Dickson et al., 2007). The experiment started on 22 August.
The glass lids used did not close the dishes airtight, thus did not prevent gas exchange with the ambient air, but head-space was equally minimal. For this reason, and also to assure that oxygen concentrations in the dishes did not fall below critical saturation levels of oxygen partial pressure for marine mollusks due to respiration of the incubated pteropods (Childress and Seibel, 1998; Maas et al., 2011), the experimental seawater was changed on 24, 26, 27, and 28 August. Following this approach concurrently included a generally accepted metabolic acclimation phase of pteropods of 24 h (e.g., Comeau et al., 2010; Maas et al., 2012; Seibel et al., 2012) and minimized the impact of pH fluctuations by providing continuously fresh target conditions. Before each water exchange, the pH in each dish and in the fresh manipulated seawater was measured and water samples for the determination of the carbonate system (AT, nutrients) were taken from the storage containers before the dishes were refilled with the fresh manipulated seawater (note: in order to keep the duration of water exchanges at a minimum and also to reduce the risk of losing pteropods (see below), no AT and nutrient samples were taken from the water in the dishes). The experiment was terminated after 7 days (on 29 August). Before the juvenile pteropods were retrieved from the dishes, the pH was measured in the dishes and water samples for the determination of the carbonate system were taken (AT, nutrients). Subsequently, specimens were collected from the dishes, and inspected for survival/mortality under a stereomicroscope (Lischka et al., 2011). All dead and live pteropods were counted. The number of pteropods recovered from the replicate dishes at the end of the experiment did not match the number initially incubated. This was most likely due to the loss of some individuals during seawater exchange. Therefore, we show mortality as the percentage of dead organisms of the total number of recovered individuals (see Supplementary Figure S1 online). Live pteropods were then carefully transferred into sample vials and stored at −80°C for later lipid analyses (total lipids, lipid class, and fatty acid compositions) in the home laboratory.
Carbonate chemistry analysis
pH measurements were done with a pH Mobile 826 pH meter (Metrohm, Germany). pH on the total scale (pHT) was calculated from voltage readings (Dickson et al., 2007). The precision was within 1.1 mV units. As standard, certified reference material (CRM) with a known pH calculated from known AT and CT (A. Dickson, Scripps Institution of Oceanography, La Jolla, California) was used.
A potentiometric titration device (Titrando 808, Metrohm) was used to determine total alkalinity (AT) (Bradshaw et al., 1981) calculated from the Gran function (Dickson et al., 2003). The same CRM used for pH measurements was used for AT determination. Specifically, precision (max. difference between two duplicate measurements) was within 4.9 μmol kg−1 and accuracy was between 6.7 and 13.5 μmol kg−1 (differences between measured CRM and target CRM values, depending on prepared solutions and temperatures, etc.). The remaining carbonate system parameters were calculated from measured AT and pHT with the free software CO2SYS (Pierrot and Wallace, 2006) using the constants from Mehrbach et al. (1973) refitted by Dickson and Millero (1987). Dissolved inorganic nutrient concentrations (PO43−, (SiOH)4) were analyzed with an autosampler (XY2 autosampler, SEAL Analytical) and a continuous flow analyzer (QuAAtro AutoAnalyzer, SEAL Analytical), respectively (Mullin and Riley, 1955; Murphy and Riley, 1962). The correction of all colorimetric methods was with the refractive index method (Coverly et al., 2012). Salinity was measured using a WTW 340i conductivity meter.
Lipid class and fatty acid analysis
Total lipids were extracted three times with 3 ml of dichloromethane:methanol (2:1, v/v) from pooled (per replicate), lyophilized (24 h) and homogenized individuals using a Potter homogenizer (Sartorius, Göttingen, Germany) (Folch et al., 1957). The solvent was washed with 2 ml of 0.88% KCl solution before the mixture was centrifuged at low speed (2,000 rpm). The lipid-containing organic phase was separated and evaporated under nitrogen. The lipid extract was re-dissolved in dichloromethane and taken for analysis. All extracts were kept at −20°C for further analysis. The lipid classes were separated and identified on a monolithic silica column (Chromolith®Performance-Si) using high performance liquid chromatography (HPLC, LaChromElite HPLC system) with an evaporative light scattering detector (ELSD) (Graeve and Janssen, 2009). A gradient program with a combination of three solvent mixtures was used: Eluent A consisted of isooctane:ethylacetate (99.8:0.2, v/v), eluent B was a mixture of acetone and ethyl acetate (2:1, v/v) containing acetic acid (0.02% (v/v)) and eluent C 2-propanol–water (85:15, v/v) (with acetic acid and ethanolamine, each 0.05% (v/v)). The total lipid content was calculated using the sum of the neutral and polar lipids.
For the gas–liquid chromatographic analyses of the fatty acids and alcohols, aliquots of the total lipid extract were taken. Methyl esters of fatty acids were prepared by transesterification under a nitrogen atmosphere with 3% concentrated sulfuric acid in methanol for 4 h at −80°C. The resulting fatty acid methyl esters and fatty alcohols were extracted with hexane and their composition determined using a Hewlett Packard 6890 gas liquid chromatograph on a 30 m wall-coated capillary column (i.d. 0.25 mm; film thickness: 0.25 μm; liquid phase DB-FFAP) using temperature programming (Kattner and Fricke, 1986). Fatty acids and fatty alcohols were quantified with an internal tricosanoic acid methylester standard (FAME, Sigma-Aldrich, USA) and identified by comparing the retention time with those of known standard mixtures.
Raw effect sizes
For assessing the impact of an effect, effect sizes are more critical than the significance of p-values because effect sizes quantify the difference between two response values measured at two different treatment levels. P-values strongly depend on the underlying assumptions and the number of observations (Greenland et al., 2016) and are often not helpful to evaluate the importance of their associated effects (Di Stefano, 2014). Placing the focus on effect sizes rather than p-values raises greater awareness of the metrics used and how they relate to the natural state (Claridge-Chang and Assam, 2016). For example, a significant p-value determined by a response measure between two groups must not necessarily mean an effect large enough to be ecologically important on the species or population level. Therefore, we calculated effect sizes for mortality, lipid classes, dominant fatty acids, fatty acid classes (SFA, saturated fatty acid; MUFA, monounsaturated fatty acid; PUFA, polyunsaturated fatty acid), and total lipids based on the raw mean difference (D) to characterize the relevance of possible temperature and pCO2 effects between the different treatment levels (Table 1). In contrast to common standardized effect size measures such as Cohen’s d, raw effect sizes have the advantage of being in the units of the response variable and, thus, are more intuitive to interpret (Borenstein et al., 2009; Di Stefano, 2014). We calculated effect sizes for all possible combinations (contrasts) of factor levels and always subtracted the higher level response from the lower level response (Supplementary Tables S2, S3 online). Hence, positive effect sizes indicate that the response (percent contribution or amount of mortality, total lipid, a lipid class or fatty acid) at the lower factor level was larger, while negative effect sizes indicate that the higher factor level response was larger. Raw effect sizes are given together with their 95% confidence intervals. Statistics and plots were done with “R” using the packages nlme, lattice, ggplot, and effsize (R Core Team, 2014).
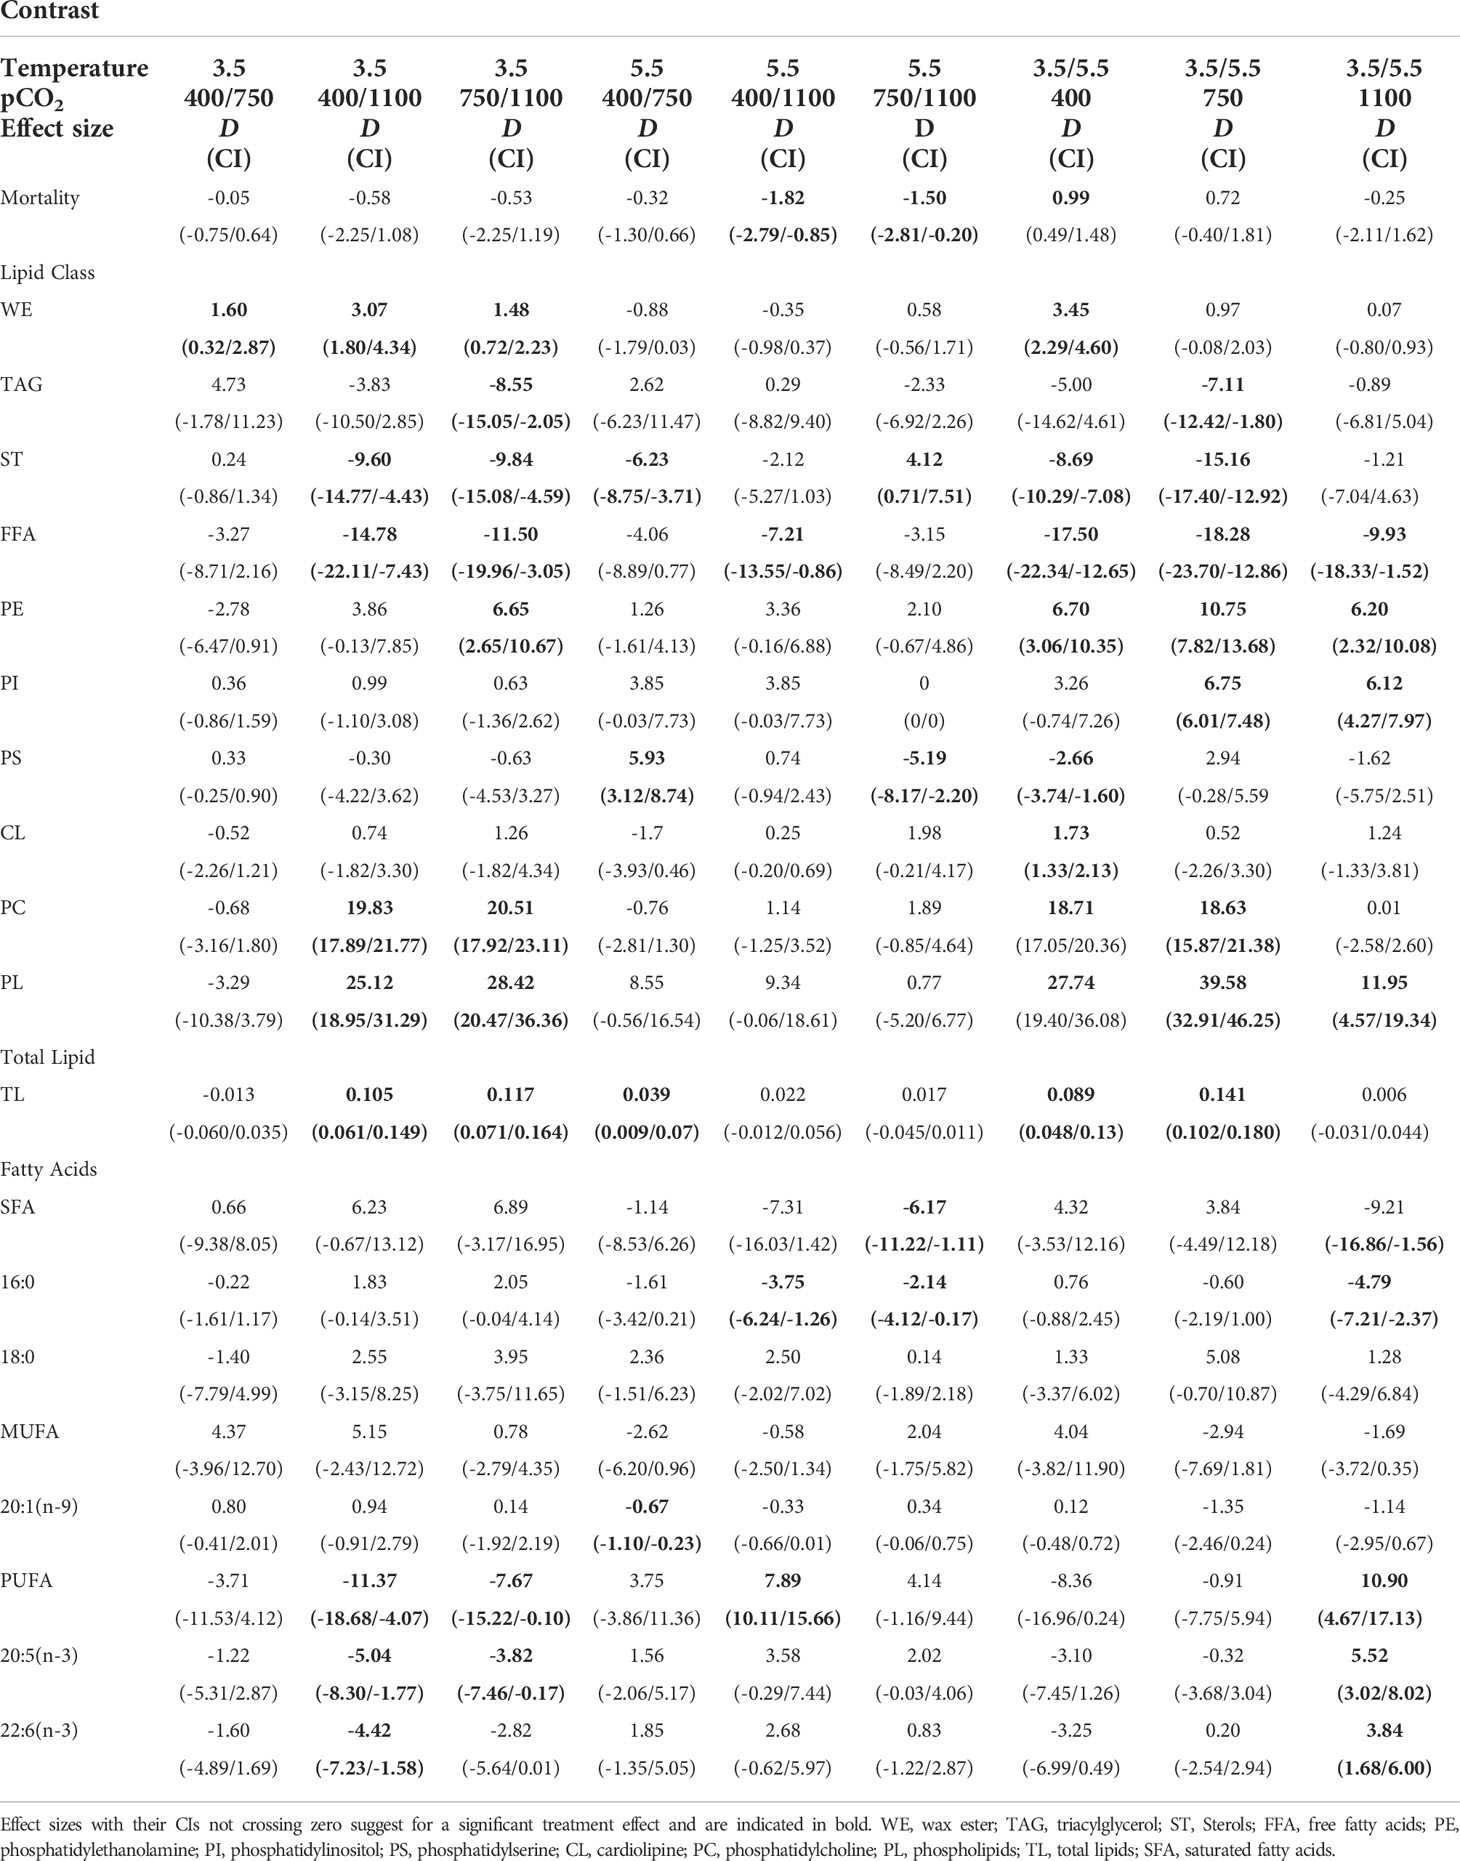
Table 1 Raw mean difference D with 95% confidence intervals (CI) in parentheses caused by the two factors (temperature [°C], pCO2 [μatm]) at the different treatment levels on survival of pteropods (% mortality), on the %-contribution of each lipid class, on total lipids [μg ind−1], and on the %-contribution of saturated fatty acids (SFA), monounsaturated fatty acids (MUFA), polyunsaturated fatty acids (PUFA) and of dominant fatty acids (mean contribution >5% of total lipids).
The raw effect size D was estimated from two contrasting group means (m1, m2):
For the calculation of the 95% confidence intervals, the pooled standard error (se) was estimated from the standard deviation (sd1, 2) and the number of replicates (n1, 2) of both groups:
The lower and upper boundaries of the 95% confidence intervals were then calculated for small samples based on the t-distribution (https://www.cyclismo.org/tutorial/R/confidence.html) as follows:
ANOVA statistics
Additionally to raw effect sizes, the effect of temperature and pCO2 on lipid class contributions, contributions of major fatty acids, and fatty acid classes (SFA, MUFA, PUFA) were determined by a linear model applied to a two-way ANOVA. Before the test, all percentage data were arcsin transformed. In case of resulting variance heterogeneity, a generalized least square approach (GLS with restricted maximum likelihood method, REML) was applied with the varIdent function on one or both of the factor(s) to stabilize the variance structure of the residuals to apply a two-way ANOVA afterward (Table 2). α significance level was 0.05. The homoscedasticity and normality of the residuals were inspected graphically (Zuur et al., 2007). All statistics and plots were done with “R” using the packages nlme, lattice, and ggplot2 (R Core Team, 2014).
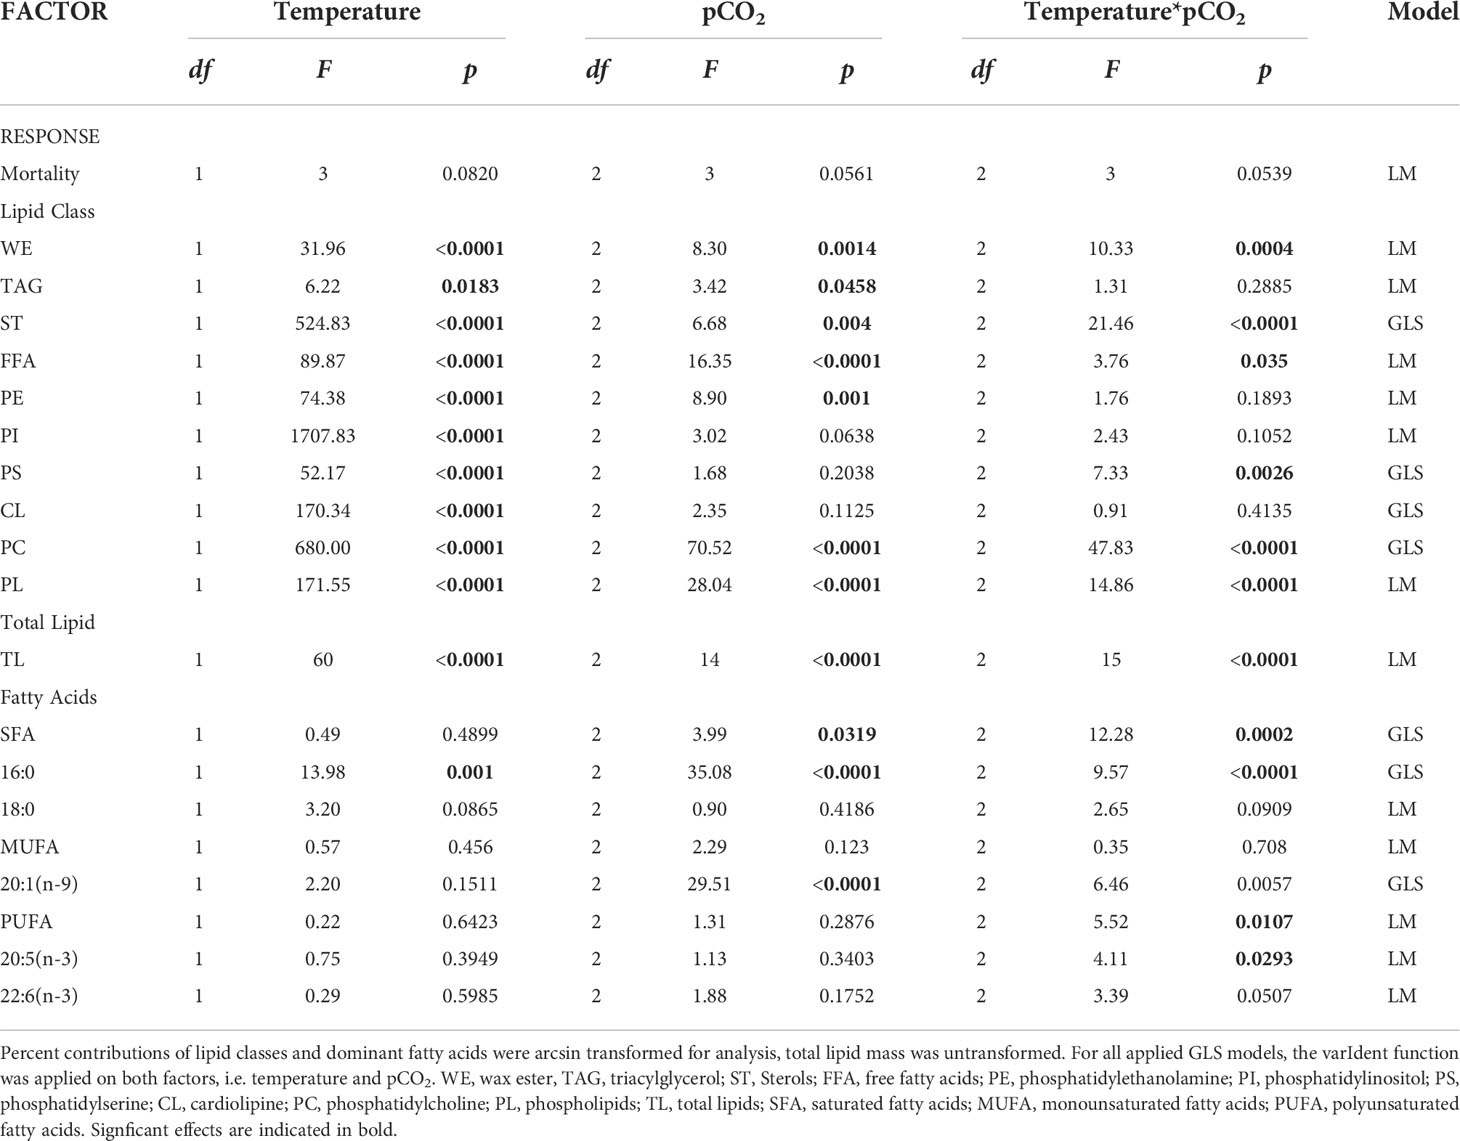
Table 2 Summary of two-way ANOVA statistics and applied model for each response variable (LM, linear model; GLS, Generalized Least Squares).
Multivariate statistics
Co-correspondence analysis (CoCA) (ter Braak, 2004; Greenacre, 2016) was used to relate the fatty acid and lipid class compositions to a joint analysis. In addition, CoCA has previously been used to relate benthos and fish community compositions in the Barents Sea (Johannesen et al., 2017). The results of CoCA are two co-varying ordinations, one of the fatty acids and the other of the lipid classes. Each of the two tables, the fatty acid composition and the lipid class composition, could be analyzed separately by correspondence analysis, each identifying the principal dimensions of the respective table, but that would ignore the fact that there is a relationship between the two. The “co-” of co-correspondence analysis focuses on that relationship and identifies dimensions that explain the covariation (= linear relationships) between the two tables, i.e., it identifies the dimensions common to the two tables. The biplots resulting from multivariate analysis show the main features of the relationships between the variables (in this case, the lipid classes, respectively, the fatty acids) and the samples (in this case, the experimental units according to the two treatment factors, temperature and pCO2 level). In our ordinations, the contribution biplot scaling was used (Greenacre, 2013), where the more outlying variables (fatty acids or lipid classes) are those that contribute most to the solution and thus to the co-variation. Labels of the variables with contributions of less than the average are de-emphasized to make the ordinations more legible. Added to each ordination biplot are the three standardized environmental variables: pCO2, pH, and Ωar. These supplementary variables have not been used in determining the solution but are added as biplot vectors afterwards, using as coordinates their regression coefficients on the two axes of the respective ordinations (Greenacre, 2016).
Comparison with “wild” pteropods
To evaluate whether the treatment effects found are large enough to be important for the pteropod population, we followed an approach suggested by Di Stefano (2014). This approach contrasts the magnitude of estimated treatment effect sizes and their associated errors (confidence intervals) with an effect size specified as being important in an ecological context a priori. In our study, phospholipids were the dominant lipid class in early-stage pteropods, and they showed the strongest response to temperature and CO2. To evaluate whether the observed changes in phospholipids are of ecological importance, we calculated the effect sizes between the phospholipid contribution found in pteropods from our experiment and published data of L. helicina from Kongsfjord by Gannefors et al. (2005). These authors report phospholipid contributions of between 88% (SD 8.8, SD = standard deviation) in veliger larvae collected in September and 62% (SD 9.5) in juveniles collected in May. The most conservative approach to judging the outcome of such a comparison was to assume the lowest average phospholipid contribution (62%) to be the minimum required amount to assure normal performance of L. helicina. Thus, we contrasted the %-contribution of phospholipids determined in our experiment at the different factor-level combinations each separately with the 62% of juveniles and, moreover, the 88% mean phospholipids described for veligers (Gannefors et al., 2005):
with:
* Dfield comparison = Difference (raw effect size) between % phospholipid at each factor level combination of present experiment and % phospholipid of juveniles/veligers of Gannefors et al. (2005)
* meanpresent study = mean % phospholipids at each factor level combination of present study
* meanGannefors = mean % phospholipids of juveniles (62%) and veligers (88%), respectively, of Gannefors et al. (2005)
The 95% confidence intervals for Dfield comparison were estimated like above using the standard deviation given in Gannefors et al. (2005) for juveniles and veligers.
Finally, calculated effect sizes not larger than one standard deviation reported for the in situ phospholipid values of juveniles and veligers by Gannefors (i.e., SD 9.5 and SD 8.8; so-called ‘1-SD-line’ in Figure 8) were defined as sustainable, whereas effect sizes larger than one negative SD were defined as unsustainable for the pteropod population.
Results
Carbonate system in the experimental treatments
Carbonate chemistry analysis indicated clear distinctions among treatments also with respect to the saturation states of aragonite (Ωar). At the start of the experiment, for both temperature treatments, Ωar was oversaturated at ambient CO2 (1.66, 1.86), it was close to the saturation threshold at medium CO2 (1.18, 1.35), and under-saturated at high CO2 (0.85, 0.97) (Supplementary Table S1 online). Accordingly, initial pH values in the experimental dishes (black dots in Figure 7) were well separated between the three pCO2 treatment levels, i.e., decreasing from the ambient to the high pCO2 level.
Lipids
Total lipids and lipid class composition
Total lipids ranged between 0.06 μg ind−1 and 0.20 μg ind−1 in all treatment combinations and constituted an average of 0.19 μg ind−1 in the control treatment (in situ T/ambient CO2) (see Supplementary Table S2 online). Phospholipids were the predominant lipid class of juvenile pteropods in all treatments and at all factor levels, contributing between 26% and 66% of total lipids (Figure 1, see Supplementary Table S2 online). Free fatty acids (FFAs, 12%–36%) and triacylglycerols (TAGs, 9%–19%) were the second and third most important lipid classes. Sterols (STs) contributed on average 8%–23% to total lipids, wax esters (WEs) played a minor role (0%–3%) (Figure 2).
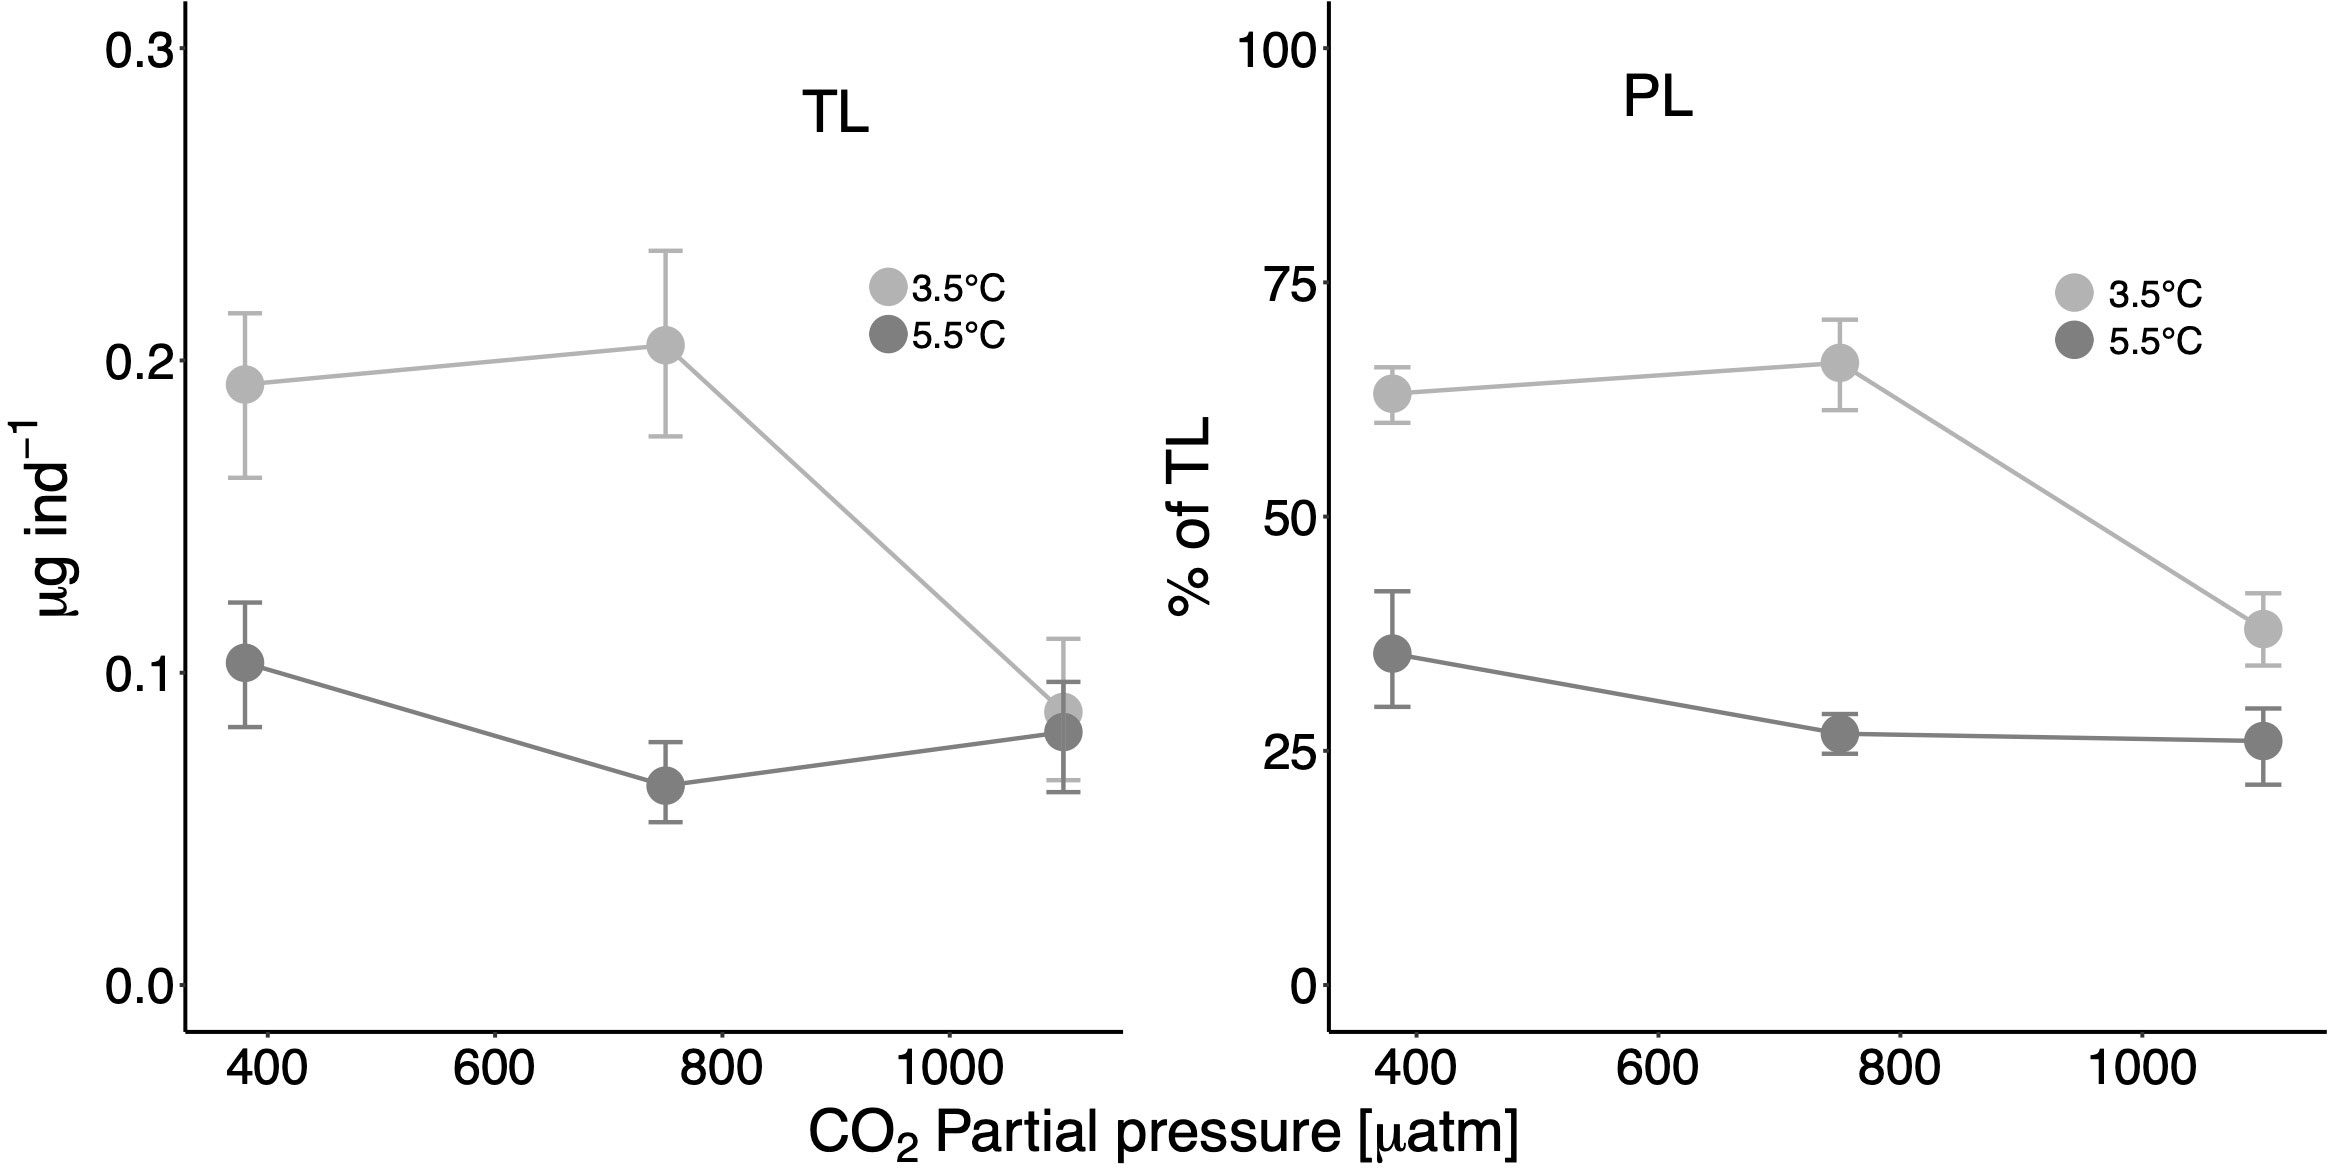
Figure 1 Total lipid (TL) mass (μg ind−1) and percent contribution of phospholipids (PL = %PC + %PE + %PI + %PS + %CL) on TL at the different treatment and factor levels. Error bars depict 95% confidence intervals.
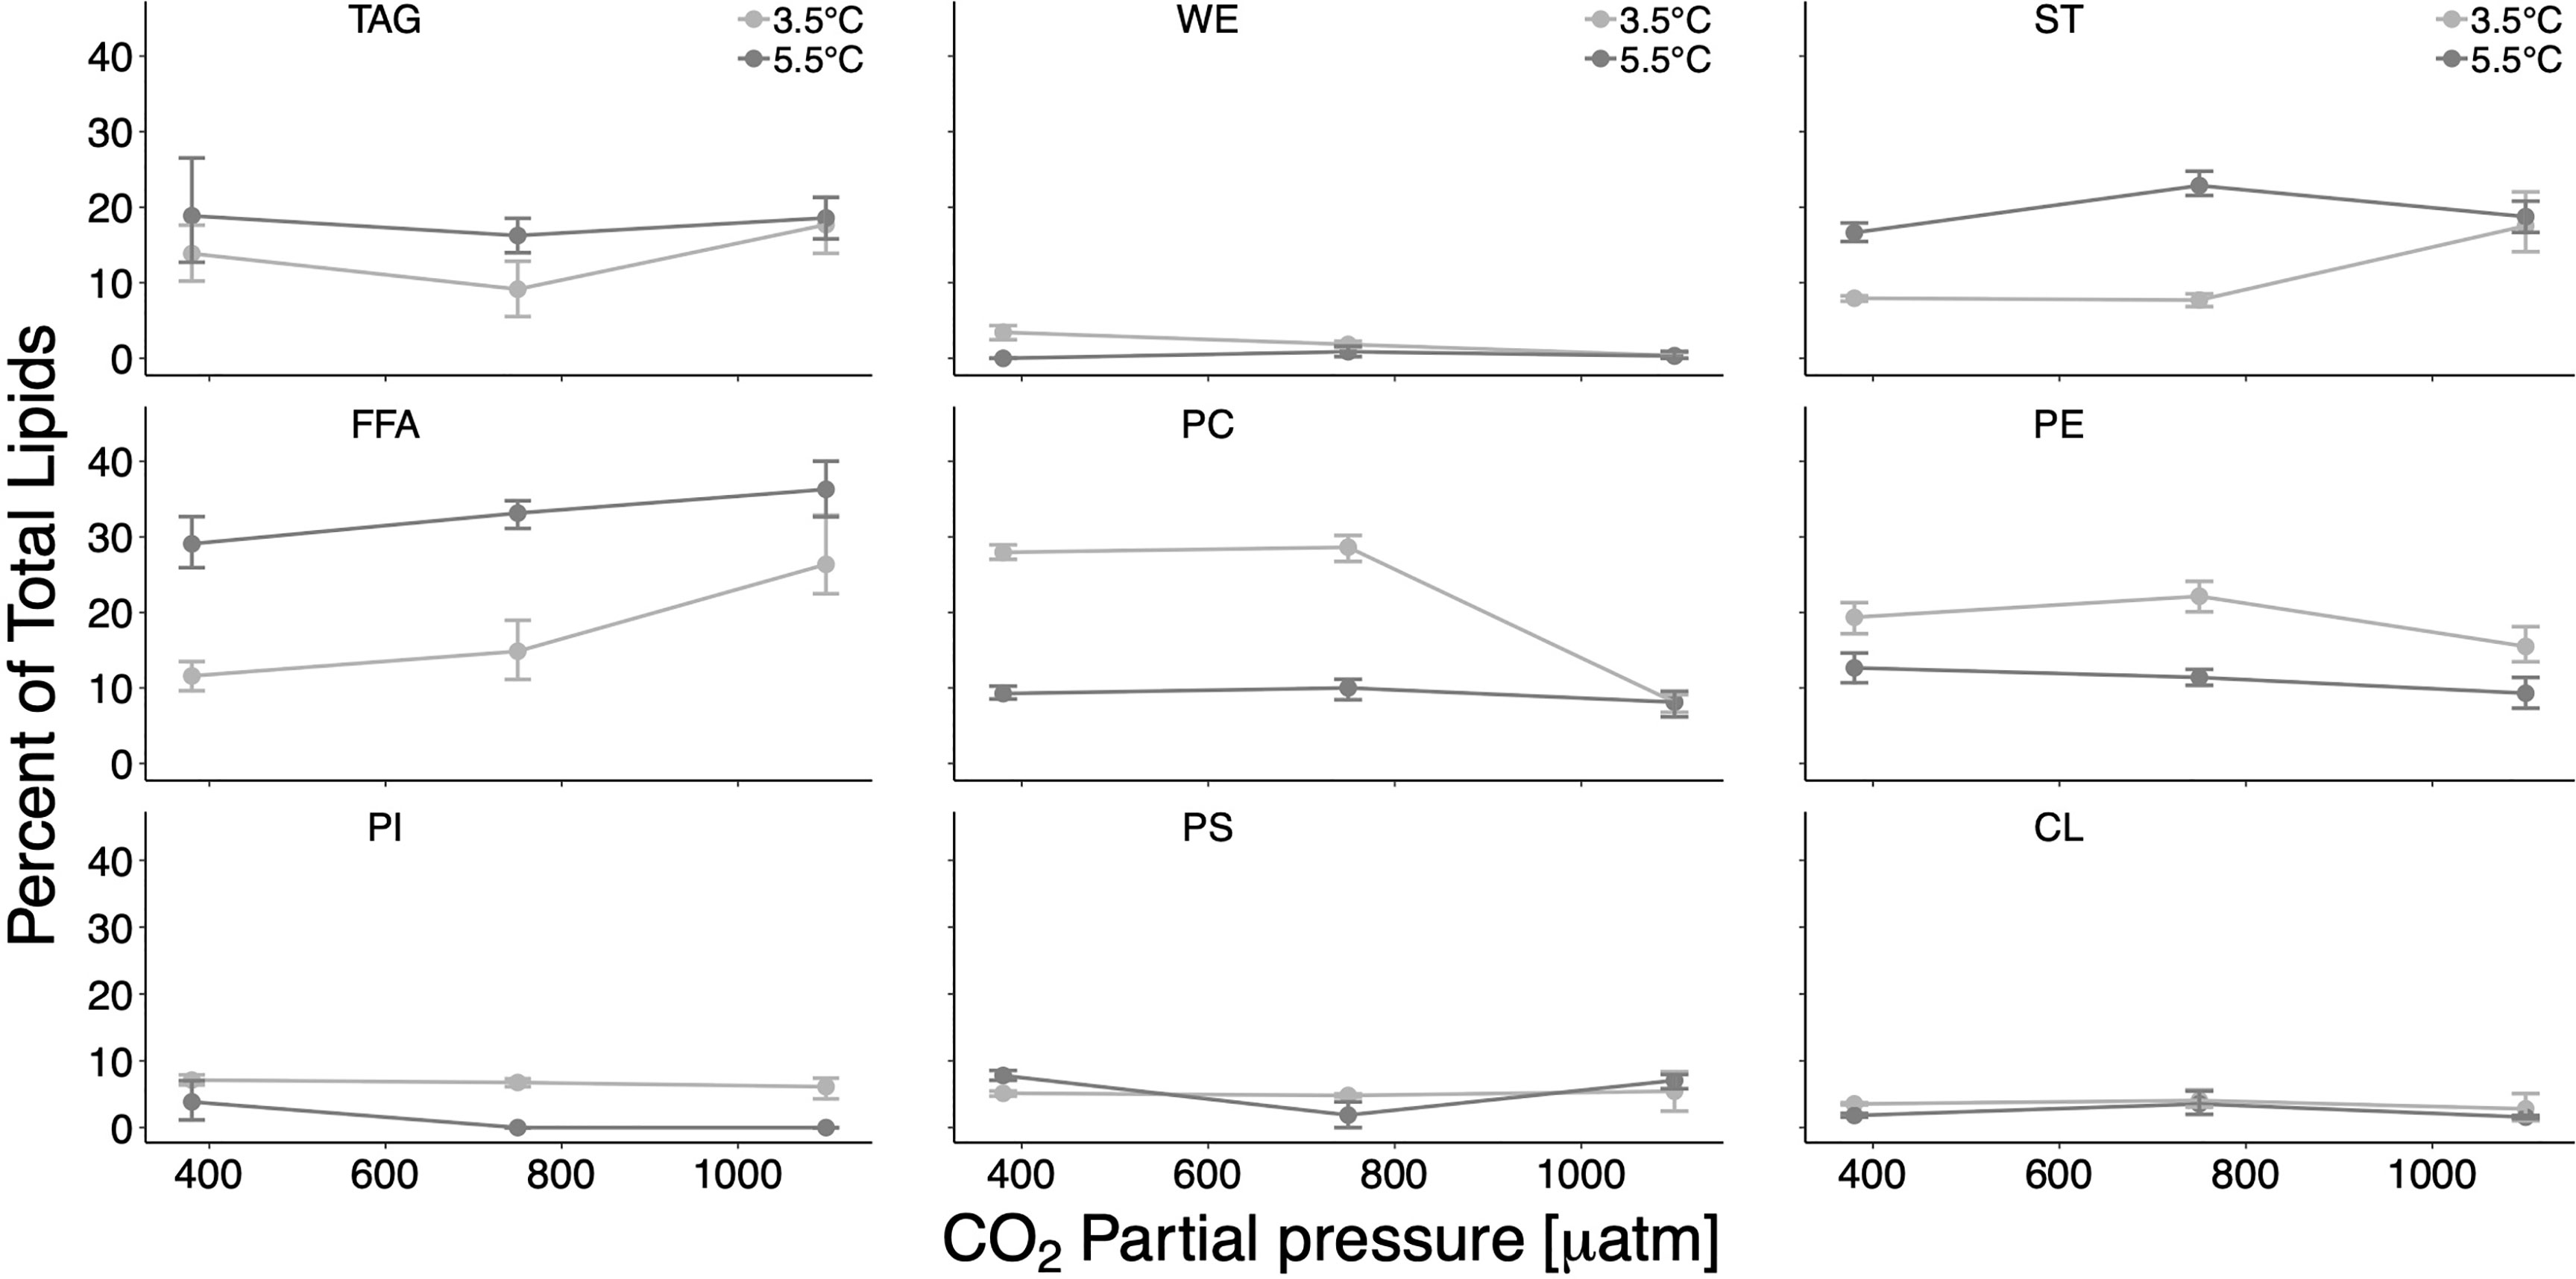
Figure 2 Percent contribution of each lipid class on the total lipid content (total lipids) per individual. TAG, triacylglycerol; WE, wax ester; ST, sterols; FFA, free fatty acids; PC, phosphatidylcholine; PE, phosphatidylethanolamine; PI, phosphatidylinositol; PS, phosphatidylserine; CL, cardiolipine. Error bars depict 95% confidence intervals.
Treatment effects on total lipids and lipid classes
Based on calculated effect sizes, increased temperature induced clear negative effects on the amount of total lipids at ambient CO2 and medium CO2 (effect sizes between 3.5°C and 5.5°C: 0.089 and 0.141 μg ind−1, respectively) (Table 1 and Figure 1). Moreover, at the high CO2 level, total lipids were drastically reduced at 3.5°C (effect size up to 0.117 μg), indicating a strong CO2 effect at in situ T.
The proportion of phospholipids (= the sum of phosphatidylcholine (PC) + phosphatidylethanolamine (PE) + phosphatidylinositol (PI) + phosphatidylserine (PS) + cardiolipine (CL)) was significantly (i.e., clearly separated CIs) lower at high T with a maximum effect size of 40% between the two temperatures at medium CO2. The factor CO2 initiated distinct effects with CIs separate from zero only at in situ T (25%–28%). The loss of phospholipids was largely compensated by a concomitant increase in FFAs and STs with higher factor levels (see further below).
Among phospholipids, effect sizes (partly 18%) were largest for PC: proportions were generally higher at in situ T and a CO2 impact was only visible at in situ T (Figure 2). PE, PI, PS, and CL revealed effect sizes of up to <11% in response to the factor levels. CIs are quite narrow for all phospholipids, suggesting consistent responses.
Proportions of FFAs at all CO2 levels were higher at the higher T level (effect sizes of 10%–18%). TAGs and STs occurred in higher proportions at high T, except for the high CO2 level, where proportions were very similar at both temperatures. The largest temperature and CO2 effects for TAGs and STs ranged between 7% and 15%. WEs had minor contributions at all factor levels, and the effect sizes ranged between 3.5% and ≤1.6%.
Generally, based on two-way ANOVA, temperature was the overriding factor shaping the total lipid and lipid class composition of early-stage pteropods exposed to OWA conditions (FT>FCO2, p-values usually <0.0001, Table 2). An additional significant CO2 effect was determined in the case of TAGs and PEs, and significant synergistic effects in the case of WEs, STs, FFAs, PSs, PCs, PLs, and TLs, which were highly significant in the case of Sts, PCs, PLs, and TLs (p<0.0001).
Fatty acid composition
The dominant fatty acids (defined as mean percent contribution to total lipid amount >5% across treatments and all factor levels) were the SFAs 16:0 and 18:0, the MUFA 20:1(n−9), and the PUFAs 20:5(n−3) and 22:6(n−3) (The (n–x) notation indicates the position of the first double bond from the terminal methyl group of a fatty acid, i.e., in the case of (n−3), the first double bond is three C-atoms away from the terminal methyl group) (Figures 3–5, and Supplementary Table S3 online). The sum of SFAs varied between 28.5% and 38%. The share of MUFAs was between 19.4% and 14.2%. The sum of PUFAs had the highest contributions at all factor levels, varying between 46% and 57.3% at in situ T, and between 46.4% and 54.3% at high T.
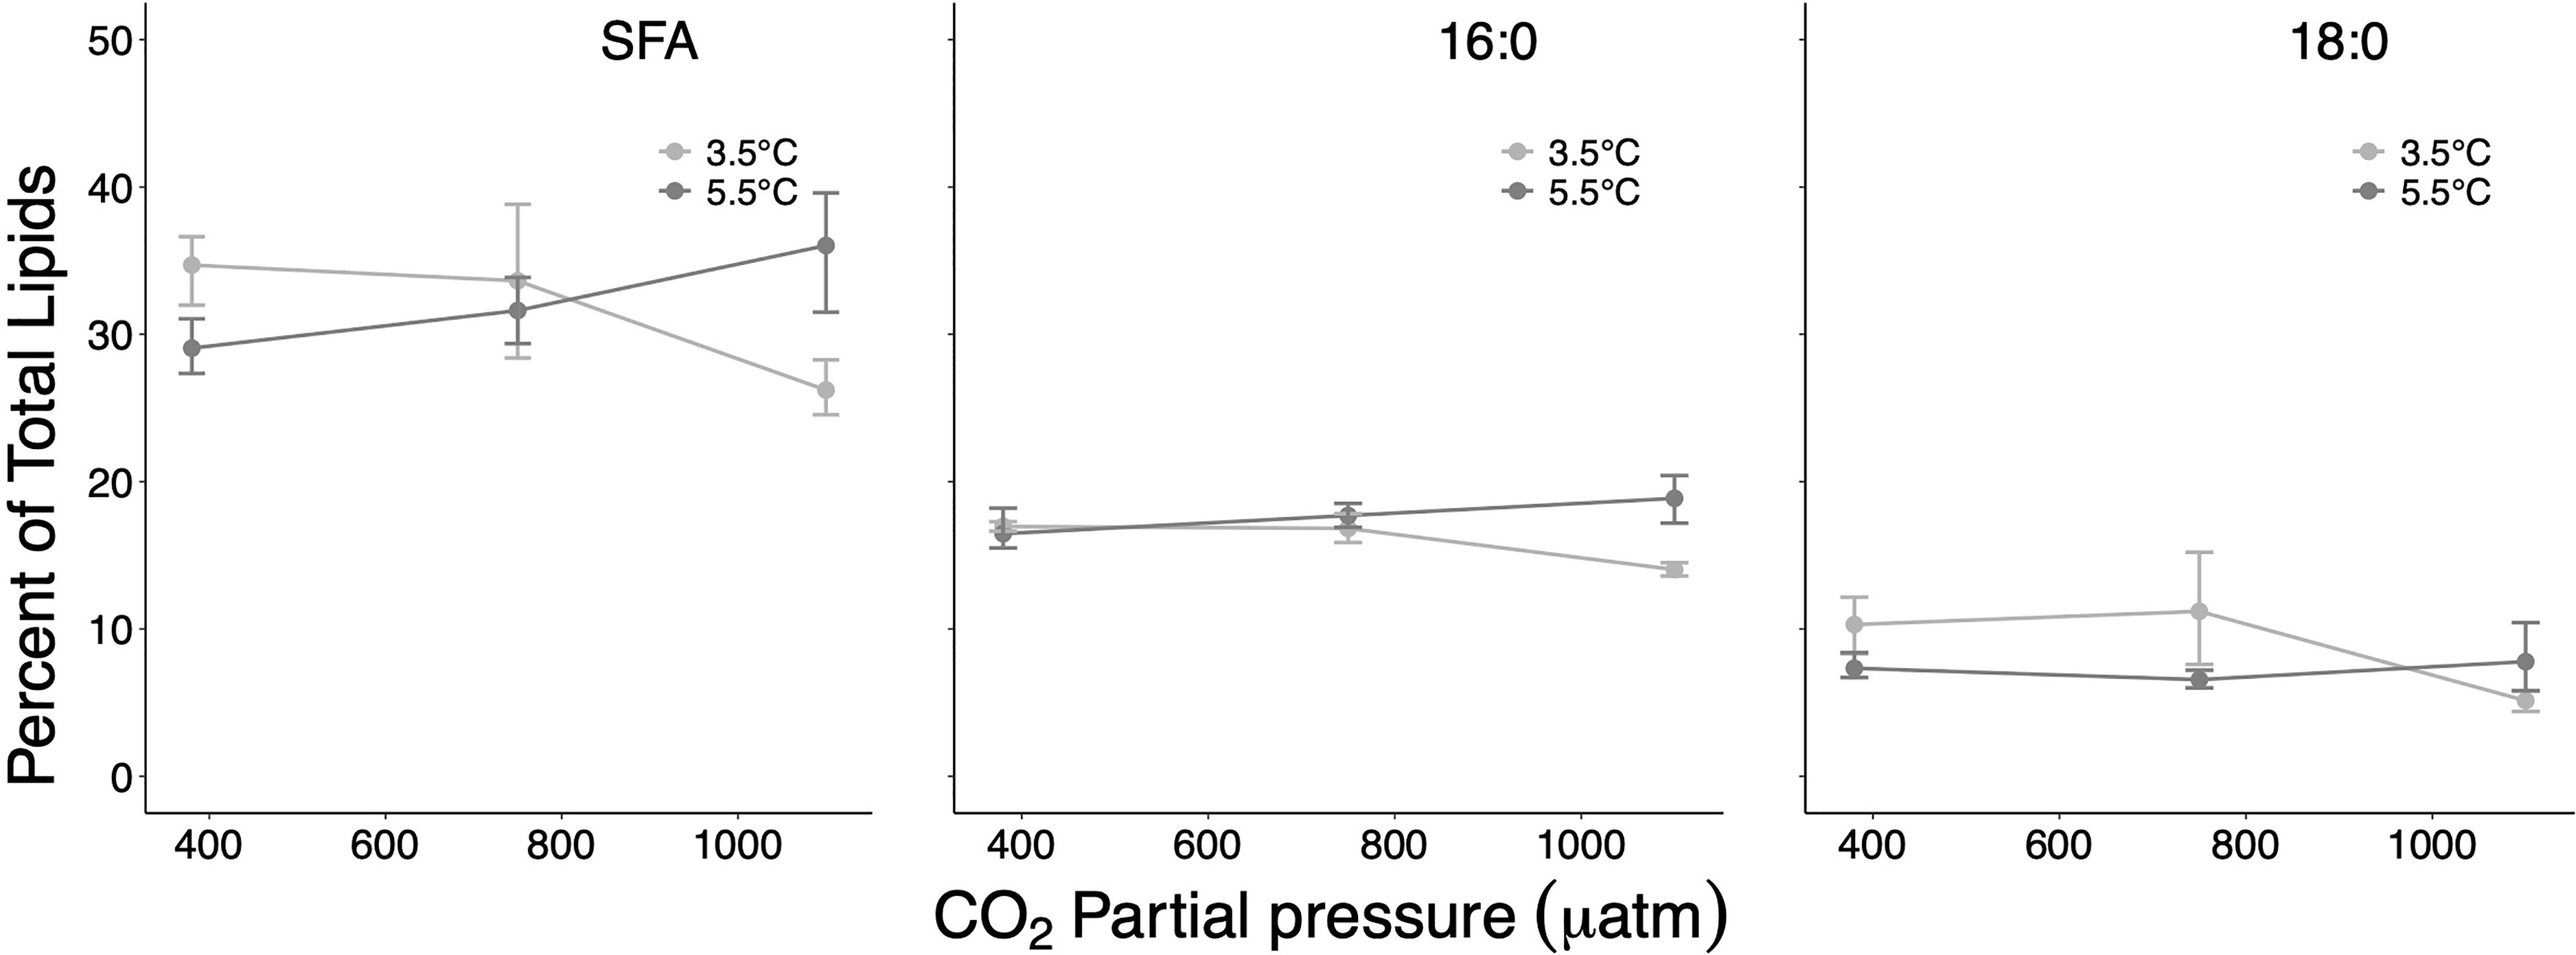
Figure 3 Percent contribution of the sum of saturated fatty acids (SFA) and of the two dominating SFAs 16:0 and 18:0 on total lipids at the different treatment and factor levels. Error bars depict 95% confidence intervals.
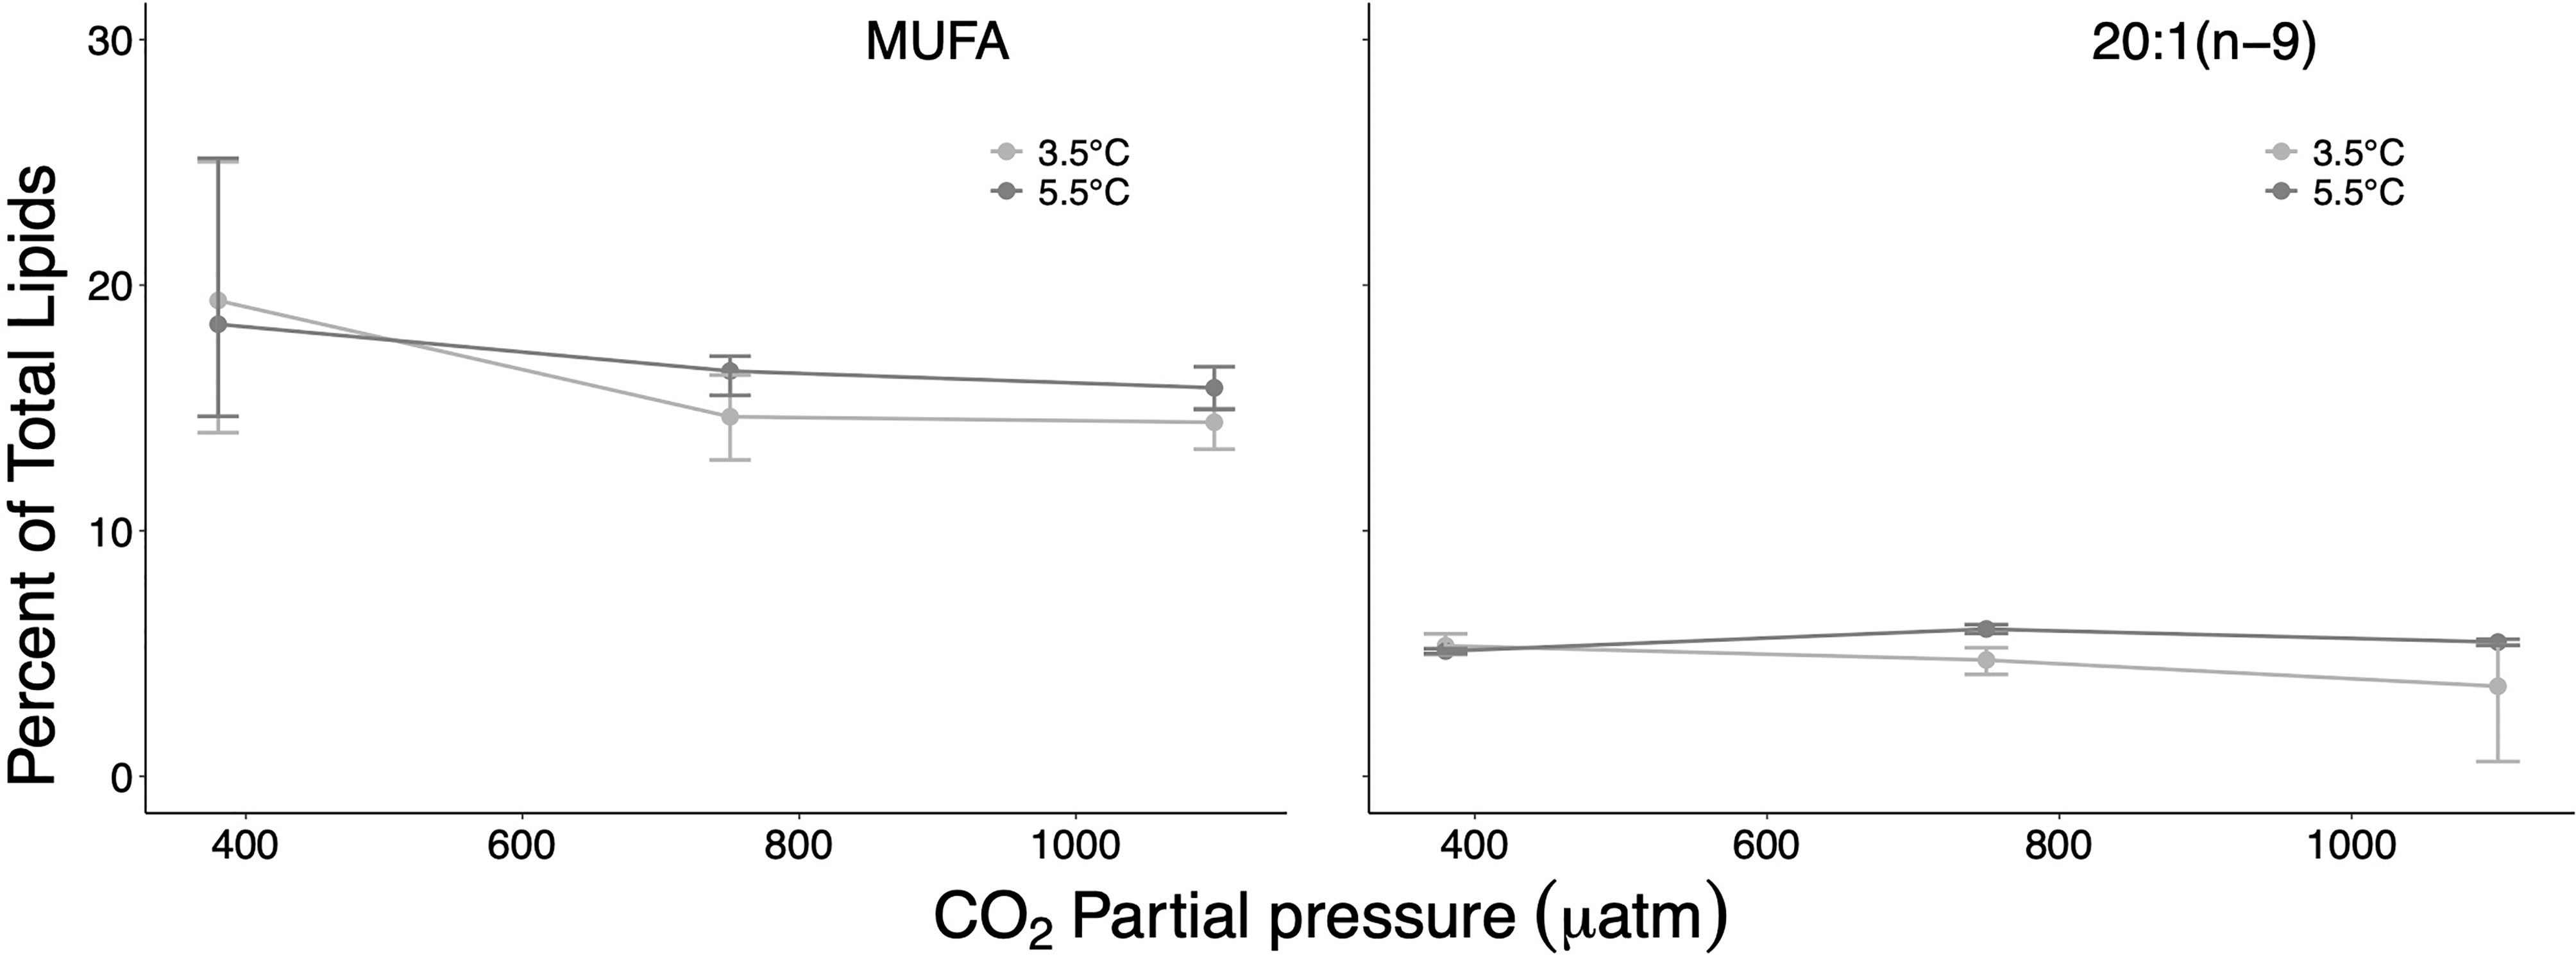
Figure 4 Percent contribution of monounsaturated fatty acids (MUFA), and of the dominating MUFA 20:1(n−9) on total lipids at the different treatment and factor levels. Error bars depict 95% confidence intervals.
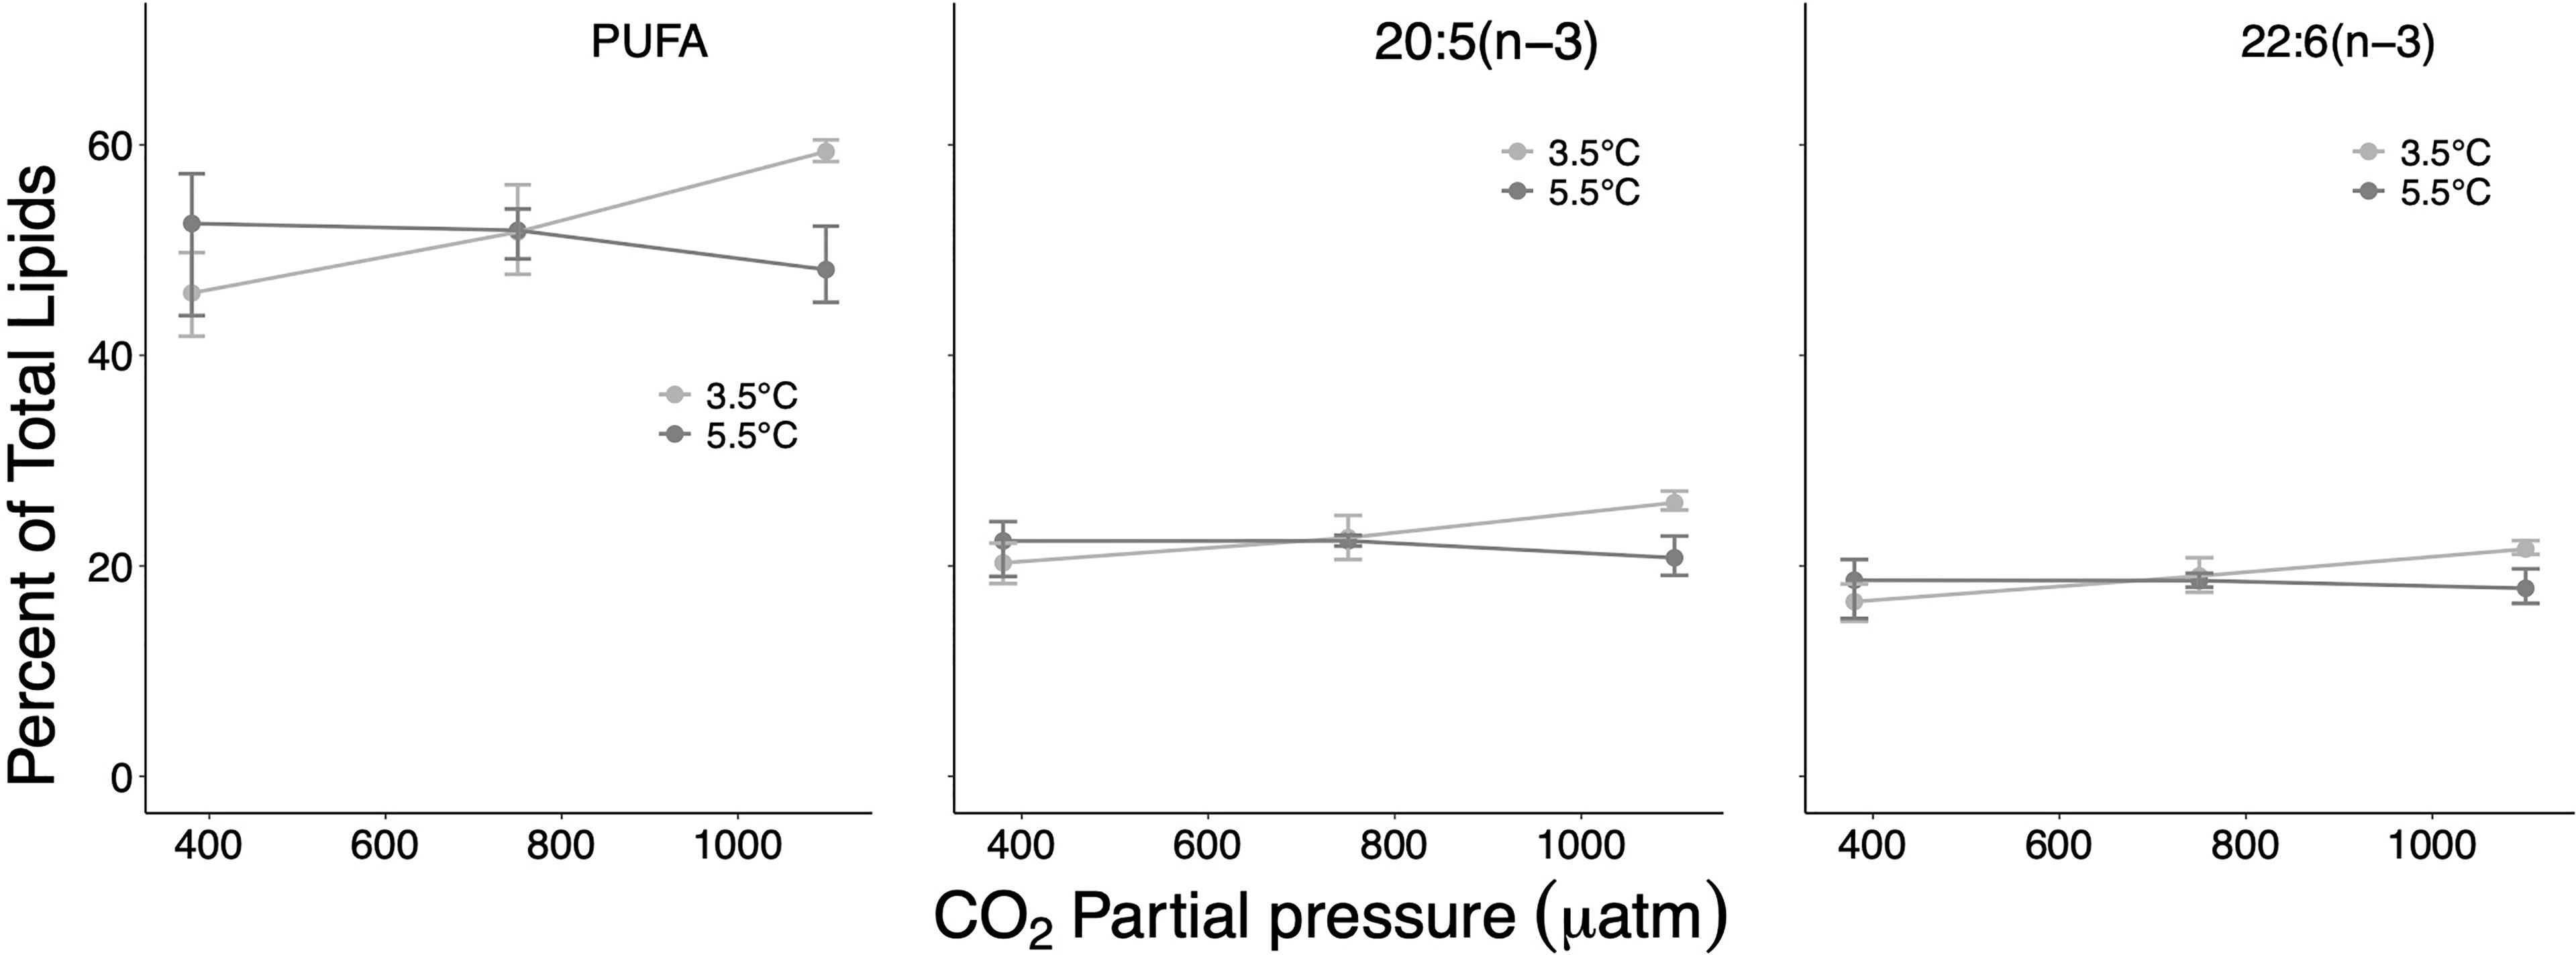
Figure 5 Percent contribution of polyunsaturated fatty acids (PUFA) and of the two dominating PUFAs 20:5(n-3) and 22:6(n-3) on total lipids at the different treatment and factor levels. Error bars depict 95% confidence intervals.
Treatment effects on fatty acids
Among the dominant fatty acids, the largest effect sizes associated with well-separated CIs were determined for the SFA 16:0 and the PUFA 20:5(n−3) (effect sizes of 4.8% and 5.5%, respectively) for the temperature contrast at high CO2 (Table 1 and Figures 3, 5). The PUFA 22:6(n−3) was also distinctly affected, first along the CO2 gradient (effect size 4.4% between ambient/high CO2) and second largest by temperature at high CO2 (effect size 3.8%). The MUFA 20:1(n−9) showed only for the ambient/medium CO2 contrast at high T a distinct but small difference with non-overlapping CIs (0.34%) (Figure 4).
SFAs and PUFAs showed pronounced interactive effects along the temperature/CO2 gradient with partly clearly separated CIs but opposite effect directions and particularly pronounced effects at high T/high CO2 (effect sizes up to >9% for SFA, and up to >11% for PUFA) (Table 1). In the case of MUFAs, all CIs of identified effect sizes overlapped, suggesting a non-consistent response nature.
Consistently with effect sizes, two-way ANOVA confirmed significant synergistic effects for SFA ( p = 0.0002), 16:0 ( p<0.0001), PUFA ( p = 0.0107), and 20:5(n−3) ( p = 0.0293), at which for 20:1(n−9) a significant pCO2 effect was determined ( = 29.51, p<0.0001).
Multivariate analysis
The joint analysis of the fatty acid and lipid class compositions using co-correspondence analysis (CoCA) is shown in the two ordination plots of Figure 6. The CoCA identifies the most important common axes in the two compositions that maximize the co-variation between the samples in the fatty acid and lipid class spaces. The fatty acids and lipid classes that contribute to these common axes are thus identified as strongly associated.
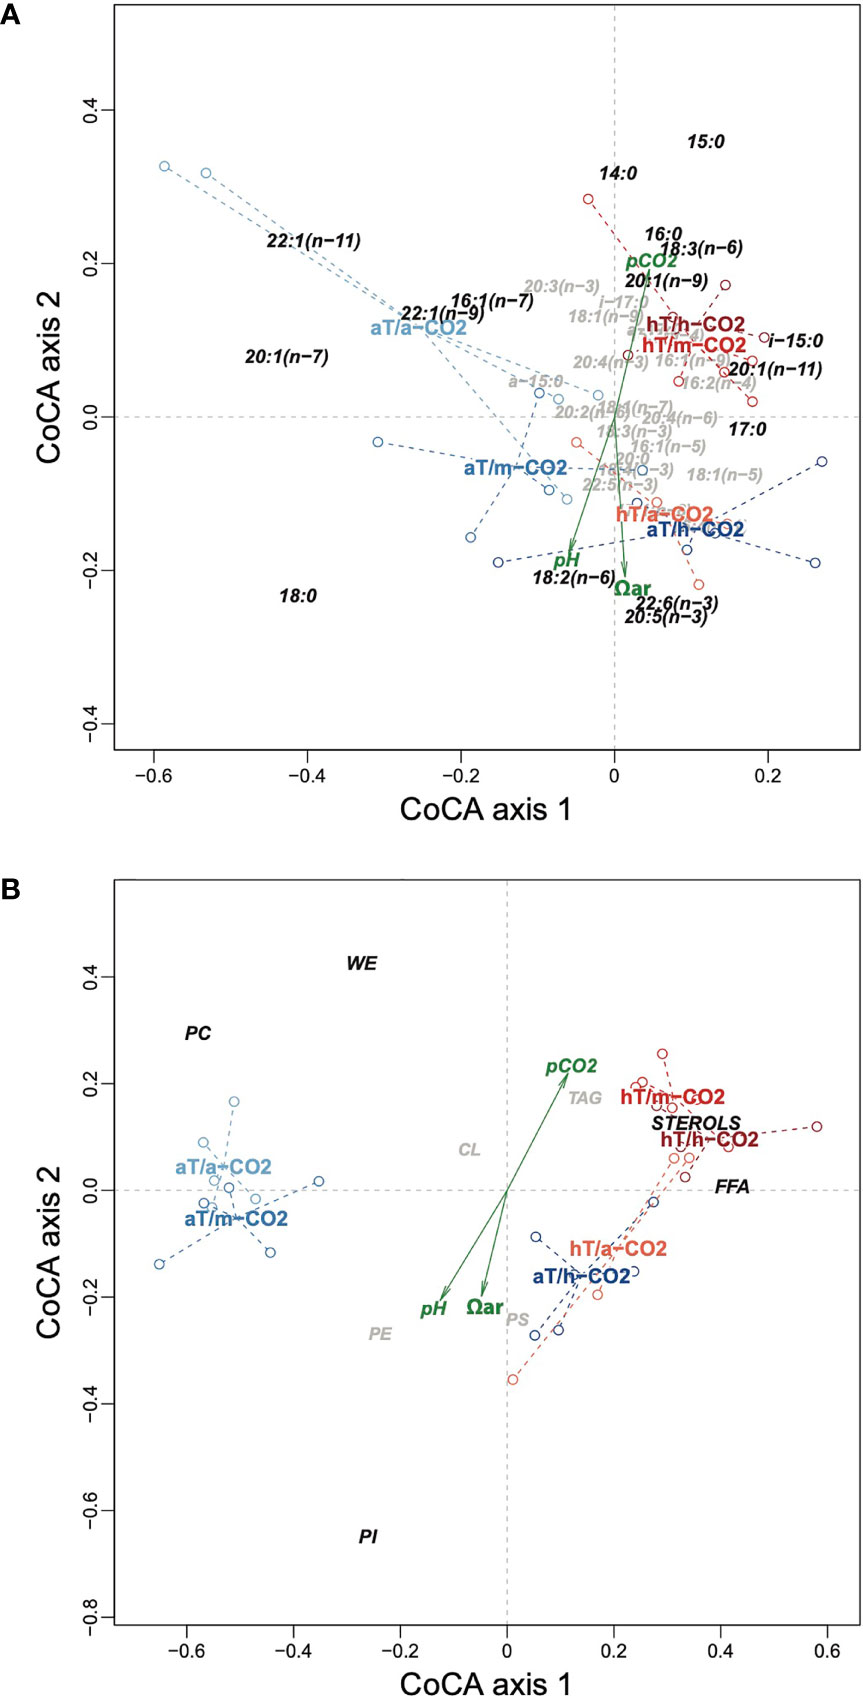
Figure 6 Co-correspondence analysis of fatty acid and lipid class compositions, showing (A) the fatty acids and (B) the lipid classes. In each case the variables that contribute more than average to the solution (i.e., the main drivers) are shown in dark italic and those less than average in light, smaller italic. Sample points are shown as empty circles connected by dashed lines to their respective group means, which are labeled. aT, ambient (= in situ) temperature; hT, high temperature; a-CO2, ambient CO2; m-CO2, medium CO2; h-CO2, high CO2.
These two common dimensions are highly significant (p<0.001 and p = 0.009, respectively, using a permutation test with 999 permutations). The first dimension generally contrasts the CO2 treatment levels at in situ T, with fatty acids such as 22:1(n−11) and 20:1(n−7) being higher than average in the low CO2 group (Figure 6A), as well as lipid classes PC and WE (Figure 6B). The second dimension contrasts the CO2 levels at high T, with fatty acids such as 14:0, 15:0, and 16:0 higher in the low CO2 treatment compared to 18:0, 18:2(n−6), 22:6(n−3), and 20:5(n−3) higher than average in the high CO2 treatment (Figure 6A), as well as the lipid class PI (Figure 6B).
The three supplementary variables added to each ordination are significantly correlated with the second dimension (p<0.05 in all cases), showing they are relevant to the contrast in CO2 levels in the high T treatment group.
Thus, the results clearly show the differences between the treatment groups and which fatty acids are responsible for those differences. pCO2 contrasts both the low (in situ) temperature treatment group as well as the higher temperature group, but involving different fatty acids.
pHT development in the experimental dishes
The experimental dishes were not covered gas-tight and had minimal head space (see Materials and methods). Thus, pH development in the dishes was presumably driven by a physical and a biological process both occurring simultaneously: gas exchange with the outside air (CO2-outgassing, increasing the pH), and respiration of incubated pteropods (CO2-production, decreasing the pH). In total, net pH development was determined by the process dominating at a time (Figure 7). Although we cannot completely constrain CO2-/pH-development, considering CO2-outgassing is identical for all dishes within each treatment, suggests that the respiration of pteropods determined pHT development under control conditions (in situ T, high T/ambient CO2). At a medium CO2 level, after some initial outgassing, pteropods seemed to upregulate respiration rates first at both temperatures. Strikingly, though, on the last experiment day at high T, pteropods decreased respiration (note: mortality of pteropods was equally low in both treatments; see Supplementary Figure S2 online), thus they presumably downregulated their metabolism. Relatively strong outgassing characterized the first four experiment days at the high CO2 levels. Later, in in situ T respiration dominated, suggesting for metabolic upregulation in pteropods. At the high T treatment, outgassing seemed to dominate almost consistently throughout the experiment. Only on 27 and 28 August, outgassing was almost balanced for only a short time period probably due to upregulated respiration of pteropods. The subsequent pH increase points to metabolic downregulation (shutdown?) toward experiment termination. Generally, the incidence of metabolic upregulation is particularly striking since we switched from every other day to everyday water exchange after four days of incubation, i.e., less time for the genesis of respiratory CO2 to dominate over CO2-outgassing and determine net pH development.
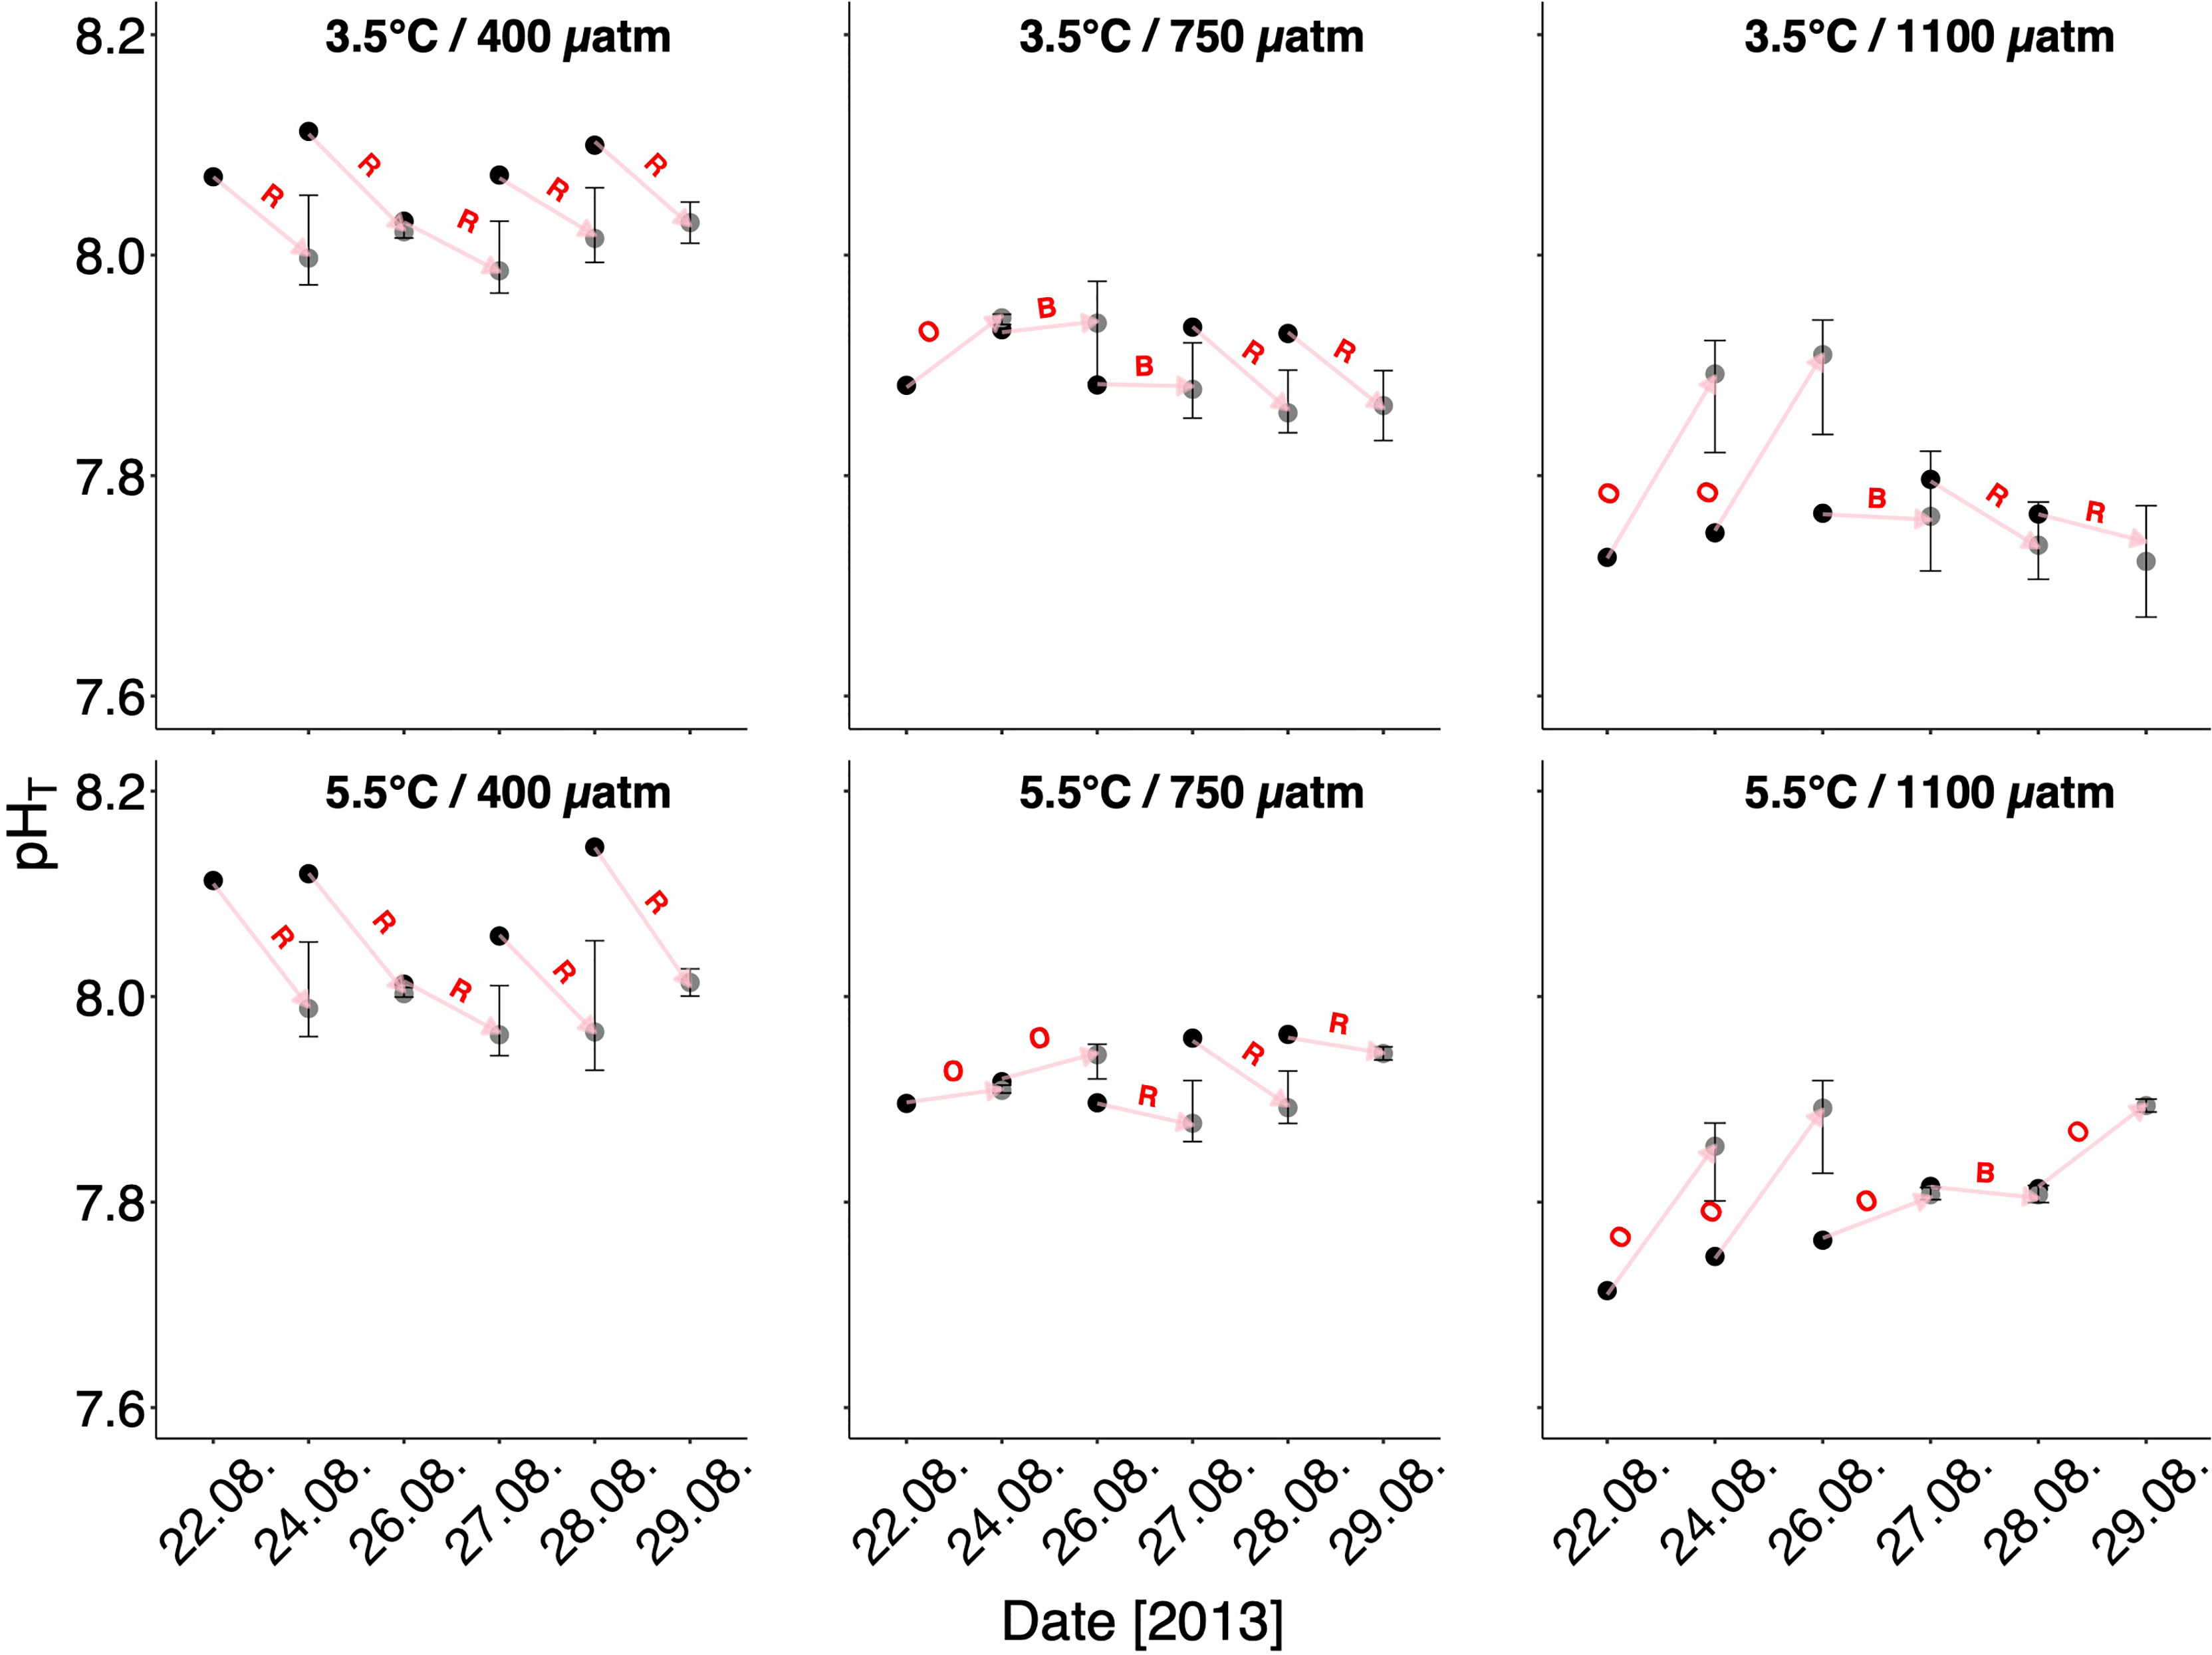
Figure 7 pHT of the CO2-manipulated seawater in the storage containers (black dots) and development of mean pHT in the single dishes (experimental units) measured prior each water exchange and at the experiment termination (gray dots). Error bars are confidence intervals. Arrows connect the pHT development of the fresh manipulated seawater to the corresponding pHT in the dishes prior each water exchange. Letters indicate the dominant process that determined the pH to increase or decrease between each water exchange, respectively. R, respiration; O, outgassing; B, balance between respiration and outgassing.
Although our experimental design does not allow us to fully support these assumptions, the described pH-development well resembles oxygen consumption rate patterns in response to very similar OWA conditions reported in a previous study (Lischka and Riebesell, 2017): At elevated temperatures and high CO2, oxygen consumption rates decreased, at which at high T and medium CO2 respiration rates increased (= hormesis type response), supporting the reliability of the variable metabolic response direction determined of the pteropods in this study through the pH-development.
Contrast of phospholipids of experimental and in situ (‘wild’) organisms
Raw effect sizes between phospholipid contents of our experimental organisms and phospholipids measured directly on ‘wild’ veliger and juvenile L. helicina by Gannefors and co-authors (Gannefors et al., 2005) are shown in Figure 8. At in situ T, effect sizes calculated between experimental and wild juveniles did not deviate much from zero at ambient CO2 and medium CO2 (0.7%; 4%), whereas CIs of mean effect sizes calculated for veliger larvae (−24.6%; −21.3%) were clearly separate from zero but not from the 1-SD-line. At the highest pCO2 treatment, phospholipid content of both stages was significantly reduced compared to that measured in wild individuals, with the effect sizes being larger in veligers (−49.7%) than in juveniles (−24.4%), and CIs of both stages to the left of the 1-SD-line. This pCO2 effect disappeared at the high T treatment, where all calculated contrasts deviated from the 1-SD-line and mean effect size increased compared to in situ T for both stages. Moreover, contrasts between veligers (effect sizes: −52.3% to −61.7%) were clearly larger than those of juveniles (effect sizes: −27% to −36.4%).
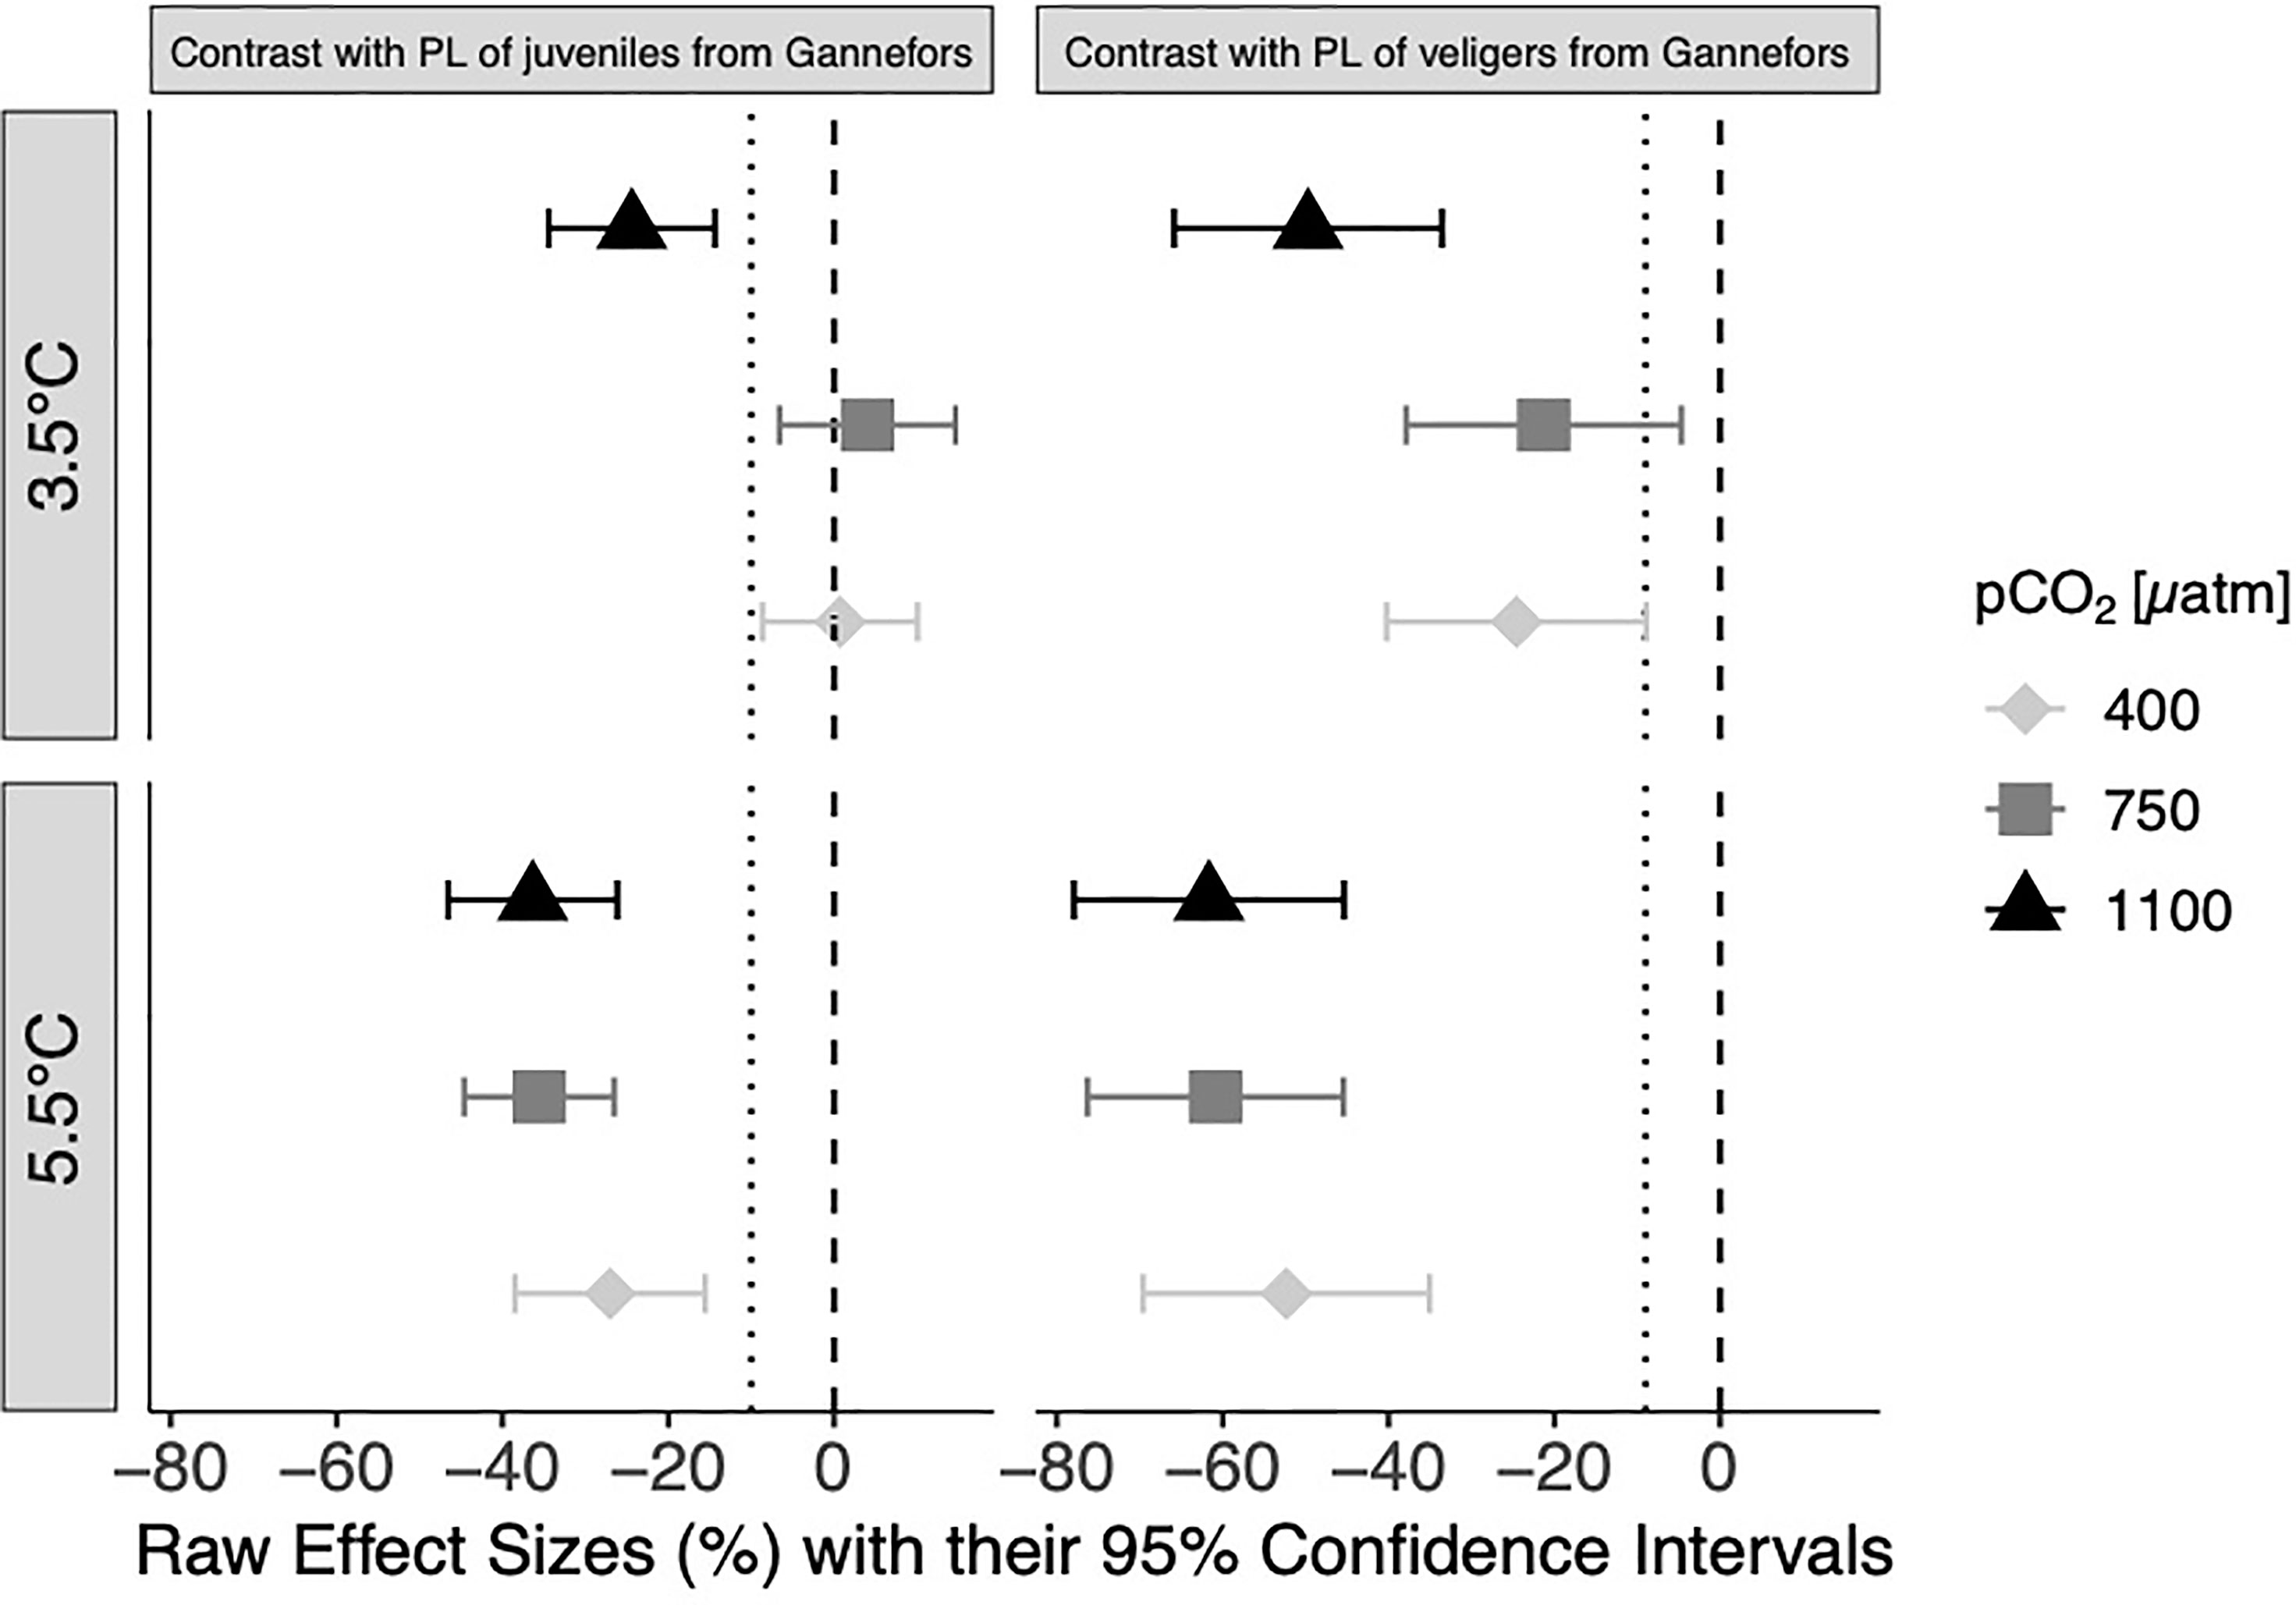
Figure 8 Mean differences D (raw effect sizes) and their 95% confidence intervals of percent contribution of phospholipids (PL) between Limacina helicina in the experimental treatments and of juvenile and respectively veligers of L. helicina collected in Kongsfjord in 2001 by Gannefors and co-workers. The dotted line in each subplot indicates −1 standard deviation (‘1-SD-line’) of the mean phospholipid portion of the in situ juveniles (SD 10) and veligers (SD 9) (Gannefors et al., 2005). Deviation larger than −1 SD is considered an unsustainable ecological effect.
Mortality
Mortality of pteropods was very low, thus we assume that stress experienced by pteropods was negligible (see Supplementary Figure S1 online). At in situ T, effect sizes (raw mean differences) were −1.82% and −1.50% between ambient/high CO2 and medium/high CO2, respectively. Their confidence intervals (CIs) did not cross zero. The effect size of the temperature contrast (3.5°C/5.5°C) at ambient CO2 was 0.99% with also distinct separate CIs. All other pairwise comparisons revealed effect sizes of <1%, and CIs overlapped the zero line (Table 1). Overall, no significant factor effects were determined by ANOVA statistics (Table 2).
Discussion
At the experiment termination, lipids, and in particular phospholipids, of our early-stage experimental organisms incubated under control conditions (in situ T/ambient CO2) resemble at large those measured of veliger larvae and juveniles from Kongsfjord in situ (Gannefors et al., 2005). Thus, cultivation caused no major modification to lipid metabolism over the seven-day experiment, which is further supported by the fact that total lipid mass and phospholipids at control conditions did not differ from in situ T/medium CO2. Slight differences can most likely be attributed to some differences in the developmental stage of our individuals compared to Gannefors et al. Beyond that, lipid class and fatty acid composition are in the range of what is currently known for members of the genus Limacina in both polar regions (Phleger et al., 1997; Kattner et al., 1998; Falk-Petersen et al., 2001).
Our results show a massive decrease in the total lipid amount by 47%–70% of early-stage L. helicina under future OW scenarios that will be further amplified by increasing levels of seawater pCO2 projected at the end of the century due to OA. The higher sensitivity of lipid metabolism to temperature than CO2 changes is in accordance with previous results shown for planula larvae of the coral Pocillopora damicornis (Rivest and Hofmann, 2015). Temperature-/pCO2-induced modifications of the lipid metabolism were mainly due to a reduction of the major phospholipid classes PC and PE that showed almost identical response curves as total lipids and a concomitant increase of FFAs with higher factor levels. Phospholipids are particularly vulnerable to temperature increases (Farkas and JC, 1981; Chapelle, 1986). The massive decrease in total lipids and phospholipids is probably due to increased lipid catabolism to fuel higher metabolic costs at higher temperatures (Monaghan et al., 2009). Moreover, oxidative lipid degradation due to increased lipid peroxidation toxicity at elevated pCO2 levels (Zenebe et al., 2007; Murphy, 2008) might have been a contributing factor. Because lipid peroxidation is an autocatalytic self-propagating process, it can induce great damage, particularly to phospholipids (Hulbert et al., 2006).
Stress adaptation and tolerance imperatively require energy balance, i.e., energy gain from the environment must be sufficient to cover metabolic loss and allow for allocation to somatic growth and reproduction (Sokolova et al., 2012). PC is a major component of lipovitellin that is part of the egg yolk. Its content is important for the survival of many zooplankton embryos and early larvae and is used for energy and membranes (Lee et al., 2006). During this actively growing life phase of our incubated pteropods, a large portion of phospholipids is surely associated with membrane buildup. Beyond that, part of the large phospholipid content present in pteropod eggs (Gannefors et al., 2005) may still be available as lipovitellin and used to cover increased energetic demands at high T as well as at high CO2 of the in situ T treatment. Increased proportions of FFAs at high T and varying proportions of SFAs, MUFAs, and PUFAs further foster the notion of enhanced catabolic and compensatory processes to maintain cellular and metabolic functioning (Kattner et al., 2007). Also, investigation of gene expression patterns of adult Limacina retroversa from the Gulf of Maine in response to elevated CO2 revealed that lipid catabolic processes become substantially influenced after 14 days of exposure (Maas et al., 2018).
The pH-development in the incubation dishes could point to increased energetic demands of pteropods at all elevated factor levels. In particular, the strong decrease in total lipids and phospholipids at in situ T/high CO2 would support this idea. Further, the membrane fatty acid composition is not only essential for membrane functionality but also impacts on metabolic rate (Hulbert et al., 2007; Monaghan et al., 2009). The pH-development, corresponding to the assumed metabolic upregulation of pteropods, also indicates some smaller scale physiological constraints at in situ T/medium CO2, which, however, were not (yet?) reflected in the lipid development. It is possible that, in this case, pteropods could cover moderately increased metabolic costs from food particles <20 μm available in the incubation water by ciliary feeding (Howes et al., 2014; Boissonnot et al., 2019). In contrast, a strong metabolic shut-down or collapse of pteropods may have occurred at high T/high CO2 after a short period of metabolic upregulation. This could mean pteropods initially tried to withstand or counteract CO2 stress at high T, but finally failed, possibly because remaining lipids were already too depleted or degraded. The metabolic shutdown under the most severe low pH and Ω ar conditions is also expected for L. helicina under thermal and upwelling-related OA stress in the California Current System (Bednaršek et al., 2018). Such interpretation of our results further corresponds to an increasing impact of CO2 inducing complex changes on the respiration of L. retroversa with severity and duration of exposure (Maas et al., 2018) as well as with hormesis-type response of oxygen consumption rates under OWA reported by Lischka and Riebesell (2017) for L. helicina. However, as outlined in the previous section, this interpretation comes with some reservation.
In principle, lipid biosynthesis is highly susceptible to oxidative stress (Monaghan et al., 2009). Temperature is a highly potent factor to induce the production of reactive oxygen species that via lipid peroxidation initiates among others significant oxidative degradations to lipids (Zenebe et al., 2007; Murphy, 2008). Phospholipids are important membrane components, serve cell differentiation and have high PUFA proportions (Kattner et al., 2007). PUFAs are much more susceptible to lipid peroxidation than SFAs and MUFAs (Hulbert et al., 2007). Low pH and Ωar can also result in elevated oxidative stress (Sokolova et al., 2012). Thus, oxidative stress may at least partly have contributed to the large total lipid and phospholipid decrease at high T compared to in situ T and the amplification of this effect at elevated pCO2 as revealed in our study. Further, our results may support conclusions on lipid metabolism drawn indirectly from measured lipid peroxidation activities (positively correlated with low Ωar, low pH, and high pCO2) of L. helicina in the California Current System exposed to multiple abiotic stressors during an El Niño event coupled with upwelling-related OA (Bednaršek et al., 2018). But this can only remain speculative as we have not measured antioxidant capacity and/or lipid peroxidation.
Considering the massive lipid reduction (47%–70% of total lipids, up to 60% of phospholipids) and the assumed metabolic shutdown together with the natural temperature range of L. helicina from −4°C to 4°C (van der Spoel, 1967), a 2°C temperature increase may have pushed this species close to its possible thermal tolerance limits or even beyond critical temperature. Moreover, as suggested from the sudden and drastic change of lipid class composition at in situ T/high CO2, pCO2 scenarios expected for this century may narrow the natural thermal tolerance window also at in situ temperature (Pörtner, 2002).
The effect sizes identified on the fatty acids were generally smaller than those identified on the lipid classes. This can be explained by the independent response behavior of lipid classes and fatty acids; i.e., the number of lipid classes as a whole (which are composed of different fatty acids) is more strongly affected than their individual constituting fatty acids. As long as the relative change in a lipid class is accompanied by the same relative change of all its constituting fatty acids (meaning a 50% change in a lipid class and a 50% change of all its fatty acids), no fatty acid signal would be detected. A change in the fatty acid composition is revealed only if the response of the individual fatty acids to the stressors varies from that of the lipid class as a whole.
Based on ANOVA statistics, temperature and pCO2 synergistically affected PUFAs and the PUFA 20:5(n−3), with higher contributions in total lipids at in situ T/high CO2 than at high T/high CO2. Also, for 22:6(n−3) confidence intervals were clearly separated between these treatment levels. Apparently, at the high pCO2 level of the in situ temperature treatment, proper membrane physical functionality (fluidity) could only be assured by increased metabolic production of phospholipid PUFAs. The (n−3) and (n−6) PUFAs are essential fatty acids and constitute most of Limacina’s PUFAs (between 63% and 88% of total lipids in juveniles and veligers, respectively, (Gannefors et al., 2005), and present study). They are not entirely synthesized by heterotrophic organisms but need to be incorporated with food. Thus, if a large/additional number of PUFAs are lost/required, they can only be substituted if a specific food (diatoms, flagellates) is available (Graeve et al., 1994; Lee et al., 2006). Additionally, L. helicina has relatively low lipid turnover rates (Boissonnot et al., 2019). The vast majority of pteropod populations in Kongsford overwinter as juveniles with ceased growth and reduced metabolism, most likely fueled by continuous lower level feeding and possibly by internal lipid reserves (TAGs) (Gannefors et al., 2005; Lischka and Riebesell, 2012; Lischka and Riebesell, 2017). Ultimately, developmental delay and decreased fitness would result in a lower chance of survival of individual pteropods and thus a reduced overwintering population that forms the seed for reproduction next summer.
As mentioned above, lipid class and fatty acid compositions measured for our early-stage pteropods incubated under control conditions (in situ T/ambient CO2) resembled those measured for juveniles and veliger larvae from Kongsfjord in situ well (mean phospholipid of our early juveniles: 63%, of the Gannefors juveniles: 62%, and of Gannefors veligers: 88%), indicating that cultivation had no major effect, thus overall justifying our comparison, though we cannot completely rule out the possible existence of some physiological differences between experimental and in situ organisms (e.g., with respect to background temperature, food availability, energetic status). However, in further support of our comparison is the fact that the effect sizes estimated for the comparison with the Gannefors juveniles did not deviate from zero at in situ T/ambient CO2 and even at in situ T/medium CO2. But at high CO2 of the in situ T treatment as well as at all pCO2 levels of the high T treatment, effect sizes calculated between phospholipid proportions of our experimental organisms and in situ organisms from Kongsfjord (Gannefors et al., 2005) show a clear discrepancy of more than one standard deviation from that of in situ organisms. That is, the phospholipid content of early-stage pteropods exposed to temperature and pCO2 stress was reduced to levels clearly outside the natural variability (with a reduction of up to 62% in veligers and up to 37% in juveniles). Based on the low lipid turnover rates of L. helicina (Boissonnot et al., 2019), the prominent role of phospholipids in biomembranes, for reproduction and early development (Kattner et al., 2007), we suppose phospholipid proportions clearly outside the natural range may entail unsustainable populations and ecological drawbacks.
Stress response depends on species, habitat, individual adaptation, etc. (Seibel et al., 2007; Comeau et al., 2010; Lischka et al., 2011; Maas et al., 2012; Seibel et al., 2012; Lischka and Riebesell, 2017). Sensitivity of lipid metabolism to OA and OWA stress in other marine organisms indicates that results scale from the apparent ability of functional (positive) adaptation to the point of harmful effect. For example, total lipid content and fatty acid composition of adult Antarctic krill were unaffected under exposure to future pCO2 levels (up to 2,000 μatm), while only extreme pCO2 levels elicited changes (Ericson et al., 2019). The total lipid of Australian whelk was significantly reduced by temperature but not pCO2 (Valles-Regino et al., 2015). Purple sea urchin early larvae collected in the upwelling region of the California coast did not exhibit differences in lipid usage rates (total lipids, TAGs, phospholipids, STs) when exposed to varying pCO2 conditions (Matson et al., 2012), whereas elevated pCO2 (856 μatm) reduced total lipids and phospholipids of larval oysters by 13%–39% (Gibbs et al., 2021). None of these examples approximates the extent of OWA effects induced in lipids of early-stage pteropods. Three major reasons may account for the high sensitivity: i) Early larval stages are particularly vulnerable to OA stress, at which most of the mentioned published studies exposed older developmental stages to experimental conditions; ii) we applied two stressors, at which the referred studies were single-stressor (OA) experiments; and iii) in the case of Matson et al. (2012), experimental organisms were naturally adapted to the highly variable carbonate chemistry conditions in upwelling regions. Nonetheless, our study emphasizes that Arctic early-stage pteropods must be ranked at the right end of a corresponding response scale (i.e., higher risk of harmful effect) and underlines their particular vulnerability to OWA.
Further, under RCP 8.5, much of the Arctic Ocean is projected to become undersaturated with respect to aragonite by 2040 (Ciais et al., 2013), whereas the sea surface temperature of the Arctic Ocean may rise by up to 4°C by 2090–2099 (Bopp et al., 2013). Thus, widespread shell dissolution due to OA (Lischka et al., 2011; Bednaršek et al., 2012; Bednaršek et al., 2019) may occur earlier than massive OW effects on the lipid metabolism of Arctic pteropod populations. As basic modules for cell growth and differentiation, lipids serve multiple vital functions at the molecular level. Consequently, negative OW effects on lipid metabolism may carry over to calcification processes at the cellular level and diminish the ability of pteropods to counteract dissolution. Therefore, given the short experimental duration and magnitude of initiated effects on pteropod lipid dynamics, detected alterations in lipid metabolism may pose a much more immediate and momentous threat to the fitness of pteropods, and hence population development, than anticipated so far of shell dissolution effects (Lischka et al., 2011; Bednaršek et al., 2012; Bednaršek et al., 2019).
Conclusion
The massive lipid changes in response to OWA observed in our study were most likely due to increased lipid catabolism, and may have been co-triggered by increased lipid peroxidation toxicity. As a consequence, both would lead to severe energetic imbalance and constraints, thus decreasing stress tolerance and fitness (Sokolova et al., 2012). Finally, negative OWA effects on lipids could directly translate into population and ecosystem-level effects due to developmental delay (Thabet et al., 2015) or failure depending on the emerging mismatch with food availability in high-Arctic regions the longer development time is prolonged toward autumn/winter (Gannefors et al., 2005; Lischka and Riebesell, 2012). In consequence, Arctic Limacina populations would diminish and elicit manifold changes in zooplankton community structure, food-web interactions as well as carbon transport (Lalli and Gilmer, 1989; Bathmann et al., 1991; Hunt et al., 2008). As OWA is primarily a surface phenomenon, sooner or later epipelagic pteropods will be confronted with the anticipated future temperature and pCO2 changes because they must effectively feed in the surface layer. Accordingly, in Kongsfjord, most of the summer population is found in the upper 50 m (Gluchowska et al., 2016). Avoiding such adverse conditions in deeper layers could only come at the cost of effective feeding, contributing to (further) energetic imbalance. However, as the projected temperature increase of water masses occurs only gradually, likewise, we would expect in situ changes in the lipid metabolism of pteropods to occur gradually/continuously.
Data availability statement
Data are available via the PANGAEA data repository at https://doi.org/10.1594/PANGAEA.936072.
Author contributions
SL conceived and performed experiments. SL, MG, and MJG analyzed the results. SL wrote the paper with contributions of MG, MJG, and UR. All authors listed have made a substantial, direct, and intellectual contribution to the work and approved it for publication.
Funding
This project was funded by the German Federal Ministry of Education and Research (BMBF) in the framework of the coordinated project BIOACID–Biological Impacts of Ocean Acidification, phase 2 (FKZ 03F06550).
Acknowledgments
We thank the AWIPEV station and the Kings Bay Marine Laboratory in Ny Ålesund for technical and logistical support. Sincere thanks go to Dieter Janssen for supporting field and experimental work and performing lipid class analyses, Mandy Kiel for laboratory assistance, and Mario Esposito for performing nutrient analyses.
Conflict of interest
The authors declare that the research was conducted in the absence of any commercial or financial relationships that could be construed as a potential conflict of interest.
Publisher’s note
All claims expressed in this article are solely those of the authors and do not necessarily represent those of their affiliated organizations, or those of the publisher, the editors and the reviewers. Any product that may be evaluated in this article, or claim that may be made by its manufacturer, is not guaranteed or endorsed by the publisher.
Supplementary material
The Supplementary Material for this article can be found online at: https://www.frontiersin.org/articles/10.3389/fmars.2022.920163/full#supplementary-material
References
Bathmann U. V., Noji T., von Bodungen B. (1991). Sedimentation of pteropods in the Norwegian Sea in autumn. Deep-Sea. Res. 38, 1341–1360. doi: 10.1016/0198-0149(91)90031-A
Bednaršek N., Feely R. A., Beck M. W., Glippa O., Kanerva M., Engström-Öst J. (2018). El Niño-related thermal stress coupled with upwelling-related ocean acidification negatively impacts cellular to population-level responses in pteropods along the California current system with implications for increased bioenergetic costs. Front. Mar. Sci. 5. doi: 10.3389/fmars.2018.00486
Bednaršek N., Feely R. A., Howes E. L., Hunt B. P. V., Kessouri F., León P., et al. (2019). Systematic review and meta-analysis toward synthesis of thresholds of ocean acidification impacts on calcifying pteropods and interactions with warming. Front. Mar. Sci. 6. doi: 10.3389/fmars.2019.00227
Bednaršek N., Harvey C. J., Kaplan I. C., Feely R. A., Možina J. (2016). Pteropods on the edge: Cumulative effects of ocean acidification, warming, and deoxygenation. Prog. Oceanogr. 145, 1–24. doi: 10.1016/j.pocean.2016.04.002
Bednaršek N., Tarling G. A., Bakker D. C., Fielding S., Jones E. M., Venables H. J., et al. (2012). Extensive dissolution of live pteropods in the Southern Ocean. Nat. Geosci. 5, 881–885. doi: 10.1038/ngeo1635
Blachowiak-Samolyk K., Søreide J. E., Kwasniewski S., Sundfjord A., Hop H., Falk-Petersen S., et al. (2008). Hydrodynamic control of mesozooplankton abundance and biomass in northern Svalbard waters (79–81°N). Deep. Sea. Res. Part II: Topical. Stud. Oceanogr. 55, 2210–2224. doi: 10.1016/j.dsr2.2008.05.018
Boissonnot L., Niehoff B., Ehrenfels B., Søreide J., Hagen W., Graeve M. (2019). Lipid and fatty acid turnover of the pteropods Limacina helicina, L. retroversa and Clione limacina from Svalbard waters. Mar. Ecol. Prog. Ser. 609, 133–149. doi: 10.3354/meps12837
Bopp L., Resplandy L., Orr J., Doney S., Dunne J., Gehlen M., et al. (2013). Multiple stressors of ocean ecosystems in the 21st century: projections with cmip5 models. Biogeosciences 10, 6225–6245. doi: 10.5194/bg-10-6225-2013
Borenstein M., Hedges L., Higgins J., Rothstein H. (2009). “Introduction to meta-analysis,” in Effect sizes based on means (John Wiley and Sons Ltd), Hoboken, New Jersey, United States. 21–32.
Bradshaw A., Brewer P., Shafer D., Williams R. (1981). Measurements of total carbon dioxide and alkalinity by potentiometric titration in the geosecs program. Earth Planet. Sci. Lett. 55, 99–115. doi: 10.1016/0012-821X(81)90090-X
Chapelle S. (1986). Aspects of phospholipid metabolism in crustaceans as related to changes in environmental temperatures and salinities. Comp. Biochem. Physiol. Part B: Comparatvie. Biochem. 84, 423–439. doi: 10.1016/0305-0491(86)90102-1
Childress J., Seibel B. (1998). Life at stable low oxygen levels: adaptations of animals to oceanic oxygen minimum layers. J. Exp. Biol. 201, 1223–1232. doi: 10.1242/jeb.201.8.1223
Ciais P., Sabine C., Bala G., Bopp L., Brovkin V., Canadell J., et al. (2013). “Carbon and other biogeochemical cycles,” in Climate change 2013 - the physical science basis. contribution of working group I to the fifth assessment report of the intergovernmental panel on climate change. Eds. Stocker T. F., Qin D, Plattner G.-K., Tignor M., Allen S. K., Boschung J., Nauels A., Xia Y., Bex V., Midgley P. M. (Cambridge, United Kingdom and New York, NY, USA: Cambridge University Press), 465–570. doi: 10.1017/CBO9781107415324.015
Claridge-Chang A., Assam P. (2016). Estimation statistics should replace significance testing. Nat. Methods 13, 108–109. doi: 10.1038/nmeth.3729
Comeau S., Gorsky G., Jeffree R., Teyssie J., Gattuso J.-P. (2009). Impact of ocean acidification on a key Arctic pelagic mollusc. Biogeosciences 6, 1877–1882. doi: 10.5194/bg-6-1877-2009
Comeau S., Jeffree R., Teyssie J. L., Gattuso J. P. (2010). Response of the Arctic pteropod Limacina helicina to projected future environmental conditions. PloS One 5, e11362. doi: 10.1371/journal.pone.0011362
Coverly S., Kérouel R., Aminot A. (2012). A re-examination of matrix effects in the segmented-flow analysis of nutrients in sea and estuarine water. Analytica. Chimica. Acta 712, 94–100. doi: 10.1016/j.aca.2011.11.008
Dickson A., Afghan J., Anderson G. (2003). Reference materials for oceanic CO2 analysis: a method for the certification of total alkalinity. Mar. Chem. 80, 185–197. doi: 10.1016/S0304-4203(02)00133-0
Dickson A., Millero F. (1987). A comparison of the equilibrium constants for the dissociation of carbonic acid in seawater media. Deep-Sea. Res. Sidney, BC, Canada 34, 1733–1743. doi: 10.1016/0198-0149(87)90021-5
Dickson A., Sabine C., Christian J. (2007). Guide to the best practices for ocean CO2 measurements Vol. 33 (Sidney, BC, Canada: PICES Special Publication), 191.
Di Stefano J. (2014). A confidence interval approach to data analysis. For. Ecol. Manag. 187, 173–183. doi: 10.1016/S0378-1127(03)00331-1
Doney S. (2010). The growing human footprint on coastal and open-ocean biogeochemistry. Science 328, 1512–1516. doi: 10.1126/science.1185198
Doney S. C., Ruckelshaus M., Emmett Duffy J., Barry J. P., Chan F., English C. A., et al. (2012). Climate change impacts on marine ecosystems. Annu. Rev. Mar. Sci. 4, 11–37. doi: 10.1146/annurev-marine-041911-111611
Ericson J. A., Hellessey N., Kawaguchi S., Nichols P. D., Nicol S., Hoem N., et al. (2019). Near-future ocean acidification does not alter the lipid content and fatty acid composition of adult Antarctic krill. Sci. Rep. 9, 12375. doi: 10.1038/s41598-019-48665-5
Falk-Petersen S., Sargent J. R., Kwasniewski S., Gulliksen B., Millar R. M. (2001). Lipids and fatty acids in Clione limacina and Limacina helicina in Svalbard waters and the Arctic ocean: trophic implications. Polar Biol. 24, 163–170. doi: 10.1007/s003000000190
Farkas T., Nevenzel J.C. (1981). Temperature acclimation in the crayfish: Effects on phospholipid fatty acids. Lipids 16, 341–346. doi: 10.1007/BF02534959
Folch J., Lees M. B., Stanley G. (1957). A simple method for the isolation and purification of total lipids from animal tissues. J. Biol. Chem. 226 1, 497–509. doi: 10.1016/S0021-9258(18)64849-5
Gannefors C., Böer M., Kattner G., Graeve G., Eiane K., Gulliksen B., et al. (2005). The Arctic sea butterfly Limacina helicina: lipids and life strategy. Mar. Biol. 147, 169–177. doi: 10.1007/s00227-004-1544-y
Garzke J., Hansen T., Ismar S. M. H., Sommer U. (2016). Combined effects of ocean warming and acidification on copepod abundance, body size and fatty acid content. PloS One 11, e0155952. doi: 10.1371/journal.pone.0155952
Gibbs M. C., Parker L. M., Scanes E., Byrne M., O’Connor W. A., Ross P. M. (2021). Energetic lipid responses of larval oysters to ocean acidification. Mar. pollut. Bull. 168, 112441. doi: 10.1016/j.marpolbul.2021.112441
Gilmer R., Harbison G. (1991). Diet of Limacina helicina (Gastropoda: Thecosomata) in Arctic waters in midsummer. Mar. Ecol. Prog. Ser. 77, 125–134. doi: 10.3354/meps077125
Gluchowska M., Kwasniewski S., Prominska A., Olszewska A., Goszczko I., Falk-Petersen S., et al. (2016). Zooplankton in Svalbard fjords on the Atlantic–Arctic boundary. Polar Biol. 39, 1785–1802. doi: 10.1007/s00300-016-1991-1
Graeve M., Hagen W., Kattner G. (1994). Herbivorous or omnivorous? On the significance of lipid compositions as trophic markers in Antarctic copepods. Deep. Sea. Res. Part I: Oceanogr. Res. Papers. 41, 915–924. doi: 10.1016/0967-0637(94)90083-3
Graeve M., Janssen D. (2009). Improved separation and quantification of neutral and polar lipid classes by HPLC–ELSD using a monolithic silica phase: Application to exceptional marine lipids. J. Chromatogr. B 877, 1815–1819. doi: 10.1016/j.jchromb.2009.05.004
Greenacre M. (2013). Contribution biplots. J. Comput. Graphic. Stat 22, 107–122. doi: 10.1080/10618600.2012.702494
Greenacre M. (2016). Correspondence analysis in practice. 3rd Edition (Boca Raton, Florida: Chapman and Hall / CRC Press).
Greenland S., Senn S., Rothman K., Carlin J., Poole C., Goodman S., et al. (2016). Statistical tests, p values, confidence intervals, and power: a guide to misinterpretations. Eur. J. Epidemiol. 31, 337. doi: 10.1007/s10654-016-0149-3
Hagen W., Auel H. (2001). Seasonal adaptations and the role of lipids in oceanic zooplankton. Zoology 104, 313–326. doi: 10.1078/0944-2006-00037
Hammill E., Johnson E., Atwood T. B., Harianto J., Hinchliffe C., Calosi P., et al. (2018). Ocean acidification alters zooplankton communities and increases top-down pressure of a cubozoan predator. Global Change Biol. 24, e128–e138. doi: 10.1111/gcb.13849
Harvey B. P., Gwynn-Jones D., Moore P. J. (2013). Meta-analysis reveals complex marine biological responses to the interactive effects of ocean acidification and warming. Ecol. Evol. 3, 1016–1030. doi: 10.1002/ece3.516
Hofmann G. E., Todgham A. E. (2010). Living in the now: Physiological mechanisms to tolerate a rapidly changing environment. Annu. Rev. Physiol. 72, 127–145. doi: 10.1146/annurev-physiol-021909-135900
Hop H., Pearson T., Hegseth E. N., Kovacs K. M., Wiencke C., Kwasniewski S., et al. (2002). The marine ecosystem of Kongsfjorden, Svalbard. Polar Res. 21, 167–208. doi: 10.1111/j.1751-8369.2002.tb00073.x
Hop H., Wold A., Vihtakari M., Daase M., Kwasniewski S., Gluchowska M., et al. (2019). Zooplankton in Kongsfjorden, (1996–2016) in relation to climate change (Cham: Springer International Publishing), 229–300. doi: 10.1007/978-3-319-46425-1_7
Howes E. L., Bednaršek N., Büdenbender J., Comeau S., Doubleday A., Gallager S. M., et al. (2014). Sink and swim: a status review of thecosome pteropod culture techniques. J. Plankton Res. 36, 299–315. doi: 10.1093/plankt/fbu002
Hulbert A. J., Faulks S. C., Buffenstein R. (2006). Oxidation-resistant membrane phospholipids can explain longevity differences among the longest-living rodents and similarly-sized mice. Journ. Gerontol. Ser. A: Biol. Sci. Med. Sci. 61, 1009–1018. doi: 10.1093/gerona/61.10.1009
Hulbert A. J., Pamplona R., Buffenstein R., Buttemer W. A. (2007). Life and death: Metabolic rate, membrane composition, and life span of animals. Physiol. Rev. 87, 1175–1213. doi: 10.1152/physrev.00047.2006
Hunt B., Pakhomov E., Hosie G., Siegel V., Ward P., Bernard K. (2008). Pteropods in Southern Ocean ecosystems. Prog. Oceanogr. 78, 193–221. doi: 10.1016/j.pocean.2008.06.001
Johannesen E., Jørgensen L., Fossheim M., Primicerio R., Greenacre M., Ljubin P., et al. (2017). Large-Scale patterns in community structure of benthos and fish in the barents Sea. Polar Biol. 40, 237–246. doi: 10.1007/s00300-016-1946-6
Karnovsky N., Hobson K., Iverson S., Hunt G. (2008). Seasonal changes in diets of seabirds in the north water polynya: a multiple-indicator approach. Mar. Ecol. Prog. Ser. 357, 291–299. doi: 10.3354/meps07295
Kattner G., Fricke H. S. (1986). Simple gas-liquid chromatographic method for the simultaneous determination of fatty acids and alcohols in wax esters of marine organisms. J. Chromatogr. A 361, 263–268. doi: 10.1016/S0021-9673(01)86914-4
Kattner G., Hagen W., Graeve M., Albers C. (1998). Exceptional lipids and fatty acids in the pteropod Clione limacina (gastropoda) from both polar oceans. Mar. Chem. 61, 219–228. doi: 10.1016/S0304-4203(98)00013-9
Kattner G., Hagen W., Lee R., Campbell R., Deibel D., Falk-Peterson S., et al. (2007). Perspectives on marine zooplankton lipids. Can. J. fish. Aquat. Sci. 64, 1628–1639. doi: 10.1139/f07-122
Kroeker K. J., Kordas R. L., Crim R., Hendriks I. E., Ramajo L., Singh G. S., et al. (2013). Impacts of ocean acidification on marine organisms: quantifying sensitivities and interaction with warming. Global Change Biol. 19, 1884–1896. doi: 10.1111/gcb.12179
Lalli C. M., Gilmer R. W. (1989). Pelagic snails: the biology of holoplanktonic gastropod molluscs (Stanford, California: Stanford University Press).
Lee R., Hagen W., Kattner G. (2006). Lipid storage in marine zooplankton. Mar. Ecol. Prog. Ser. 307, 273–306. doi: 10.3354/meps307273
Lee R. F., Nevenzel J. C., Paffenhöfer G.-A., Benson A. A. (1970). The metabolism of wax esters and other lipids by the marine copepod, Calanus helgolandicus. J. Lipid Res. 11, 237–240. doi: 10.1016/S0022-2275(20)42989-X
Levasseur M., Keller M. D., Bonneau E., D’Amours D., Bellows W. K. (1994). Oceanographic basis of a DMS-related Atlantic cod (Gadus morhua) fishery problem: Blackberry feed. Can. J. Fish. Aquat. Sci. 51, 881–889. doi: 10.1139/f94-087
Lischka S., Büdenbender J., Boxhammer T., Riebesell U. (2011). Impact of ocean acidification and elevated temperatures on early juveniles of the polar shelled pteropod Limacina helicina: mortality, shell degradation, and shell growth. Biogeosciences 8, 919–932. doi: 10.5194/bg-8-919-2011
Lischka S., Hagen W. (2016). Seasonal dynamics of mesozooplankton in the Arctic Kongsfjord (Svalbard) during year-round observations from August 1998 to July 1999. Polar Biol. 39, 1859–1878. doi: 10.1007/s00300-016-2005-z
Lischka S., Riebesell U. (2012). Synergistic effects of ocean acidification and warming on overwintering pteropods in the Arctic. Global Change Biol. 18, 3517–3528. doi: 10.1111/gcb.12020
Lischka S., Riebesell U. (2017). Metabolic response of Arctic pteropods to ocean acidification and warming during the polar night/twilight phase in Kongsfjord (Spitsbergen). Polar Biol. 40, 1211–1227. doi: 10.1007/s00300-016-2044-5
Maas A., Elder L., Dierssen H., Seibel B. (2011). Metabolic response of Antarctic pteropods (mollusca: Gastropoda) to food depriviation and regional productivity. Mar. Ecol. Prog. Ser. 441, 129–139. doi: 10.3354/meps09358
Maas A. E., Lawson G. L., Bergan A. J., Tarrant A. M. (2018). Exposure to CO2 influences metabolism, calcification and gene expression of the thecosome pteropod Limacina retroversa. J. Exp. Biol. 221, 1–13. doi: 10.1242/jeb.164400
Maas A. E., Wishner K. F., Seibel B. A. (2012). The metabolic response of pteropods to acidification reflects natural CO2-exposure in oxygen minimum zones. Biogeosciences 9, 747–757. doi: 10.5194/bg-9-747-2012
Mackas D. L., Galbraith M. D. (2012). Pteropod time-series from the NE pacific. ICES. J. Mar. Sci. 69, 448–459. doi: 10.1093/icesjms/fsr1632
Manno C., Morata N., Primicerio R. (2012). Limacina retroversa’s response to combined effects of ocean acidification and sea water freshening. Estuarine Coast. Shelf. Sci. 113, 163–171. doi: 10.1016/j.ecss.2012.07.019
Matson P. G., Yu P. C., Sewell M. A., Hofmann G. E. (2012). Development under elevated pCO2 conditions does not affect lipid utilization and protein content in early life-history stages of the purple Sea urchin, Strongylocentrotus purpuratus. Biol. Bull. 223, 312–327. doi: 10.1086/BBLv223n3p312
Mehrbach C., Culberson C., Hawley J., Pytkowicz R. (1973). Measurement of the apparent dissociation constants of carbonic acid in seawater at atmospheric pressure. Limnol. Oceanogr. 18, 897–907. doi: 10.4319/lo.1973.18.6.0897
Monaghan P., Metcalfe N. B., Torres R. (2009). Oxidative stress as a mediator of life history trade-offs: mechanisms, measurements and interpretation. Ecol. Lett. 12, 75–92. doi: 10.1111/j.1461-0248.2008.01258.x
Mullin J., Riley J. (1955). The colorimetric determination of silicate with special reference to sea and natural waters. Analytica. Chimica. Acta 12, 162–176. doi: 10.1016/S0003-2670(00)87825-3MullinRiley1955
Murphy M. P. (2008). How mitochondria produce reactive oxygen species. Biochem. J. 417, 1–13. doi: 10.1042/BJ20081386
Murphy J., Riley J. (1962). A modified single solution method for the determination of phosphate in natural waters. Analytica. Chimica. Acta 27, 31–36. doi: 10.1016/S0003-2670(00)88444-5
Pespeni M. H., Sanford E., Gaylord B., Hill T. M., Hosfelt J. D., Jaris H. K., et al. (2013). Evolutionary change during experimental ocean acidification. Proc. Natl. Acad. Sci. 110, 6937–6942. doi: 10.1073/pnas.1220673110 Pespeni2013
Phleger C. F., Nichols P. D., Virtue P. (1997). Lipids and buoyancy in Southern Ocean pteropods. Lipids 32, 1093–1100. doi: 10.1007/s11745-997-0141-x
Pierrot D., Wallace D. (2006). MS excel program developed for CO2 system calculations (ORNL/CDIAC-105 (Oak Ridge, Tennessee, Carbon Dioxide Infromation Analysis Center, Oak Ridge National Laboratory, US Department of Energy).
Pörtner H. O. (2002). Climate variations and the physiological basis of temperature dependent biogeography: systemic to molecular hierarchy of thermal tolerance in animals. Comp. Biochem. Physiol. A 132, 739–761. doi: 10.1016/S1095-6433(02)00045-4
Pörtner H. (2008). Ecosystem effects of ocean acidification in times of ocean warming: a physiologist’s view. Mar. Ecol. Prog. Ser. 373, 203–217. doi: 10.3354/meps07768
R Core Team (2014). R: A language and environment for statistical computing (Vienna, Austria: R Foundation for Statistical Computing), ISBN: ISBN 3-900051-07-0.
Renaud P. E., Berge J., Varpe Ø., Lønne O. J., Nahrgang J., Ottesen C., et al. (2012). Is the poleward expansion by Atlantic cod and haddock threatening native polar cod, Boreogadus saida? Polar Biol. 35, 401–412. doi: 10.1007/s00300-011-1085-z
Rhein M., Rintoul R., Aoki S., Campos E., Chambers D., Feely R., et al. (2013). “Climate change 2013: The physical science basis,” in Contribution of working group I to the fifth assessment report of the intergovernmental panel on climate change (Cambridge, United Kingdom and New York, NY, USA: Cambridge University Press), 255–297.
Riebesell U., Aberle-Malzahn N., Achterberg E. P., Algueró-Muñiz M., Alvarez-Fernandez S., Arístegui J., et al. (2018). Toxic algal bloom induced by ocean acidification disrupts the pelagic food web. Nat. Climate Change 8, 1082–1086. doi: 10.1038/s41558-018-0344-1
Rivest E. B., Hofmann G. E. (2015). Effects of temperature and pCO2 on lipid use and biological parameters of planulae of Pocillopora damicornis. J. Exp. Mar. Biol. Ecol. 473, 43–52. doi: 10.1016/j.jembe.2015.07.015
Sabine C., Feely R., Gruber N., Key R., Lee K., Bullister J., et al. (2004). The oceanic sink for anthropogenic CO2. Science 305, 367–371. doi: 10.1126/science.1097403
Schoepf V., Grottoli A. G., Warner M. E., Cai W.-J., Melman T. F., Hoadley K. D., et al. (2013). Coral energy reserves and calcification in a high-CO2 world at two temperatures. PloS One 8, e75049. doi: 10.1371/journal.pone.0075049
Seibel B. A., Dymowska A., Rosenthal J. (2007). Metabolic temperature compensation and coevolution of locomotory performance in pteropod molluscs. Integr. Comp. Biol. 47, 880–891. doi: 10.1093/icb/icm089
Seibel B. A., Maas A. E., Dierssen H. M. (2012). Energetic plasticity underlies a variable response to ocean acidification in the pteropod, Limacina helicina antarctica . PloS One 7, 1–6. doi: 10.1371/journal.pone.0030464
Sokolova I. M., Frederich M., Bagwe R., Lannig G., Sukhotin A. A. (2012). Energy homeostasis as an integrative tool for assessing limits of environmental stress tolerance in aquatic invertebrates. Mar. Environ. Res. 79, 1–15. doi: 10.1016/j.marenvres.2012.04.003
Spielhagen R. F., Werner K., Sørensen S. A., Zamelczyk K., Kandiano E., Budeus G., et al. (2011). Enhanced modern heat transfer to the Arctic by warm Atlantic water. Science 331, 450–453. doi: 10.1126/science.1197397
Steinacher M., Joos F., Frölicher T., Plattner G., Doney S. (2009). Imminent ocean acidification projected with the NCAR global coupled carbon cycle-climate model. Biogeosciences 6, 515–533. doi: 10.5194/bg-6-515-2009
ter Braak C. J. (2004). Co-Correspondence analysis: a new ordination method to relate two community compositions. Ecology 85, 834–846. doi: 10.1890/03-0021
Thabet A. A., Maas A. E., Lawson G. L., Tarrant A. M. (2015). Life cycle and early development of the thecosomatous pteropod Limacina retroversa in the Gulf of Maine, including the effect of elevated CO2 levels. Mar. Biol. 162, 2235–2249. doi: 10.1007/s00227-015-2754-1
Valles-Regino R., Tate R., Kelaher B., Savins D., Dowell A., Benkendorff K. (2015). Ocean warming and CO2-induced acidification impact the lipid content of a marine predatory gastropod. Mar. Drugs 13, 6019–6037. doi: 10.3390/md13106019
van der Spoel S. (1967). Euthecosomata a group with remarkable developmental stages (Gastropoda, pteropoda) (Amsterdam: Zoological Museum), 375 pp.
Walkusz W., Kwasniewski S., Petersen S. F., Hop H., Tverberg V., Wieczorek P., et al. (2009). Seasonal and spatial changes in the zooplankton community of Kongsfjorden, Svalbard. Polar Res. 28, 254–281. doi: 10.1111/j.1751-8369.2009.00107.x
Wesławski J. M., Pedersen G., Petersen S. F., Poraziński K. (2000). Entrapment of macroplankton in an Arctic fjord basin, Kongsfjorden, Svalbard. Oceanologia 42, 57–69.
Zenebe W. J., Nazarewicz R. R., Parihar M. S., Ghafourifar P. (2007). Hypoxia/Reoxygenation of isolated rat heart mitochondria causes cytochrome c release and oxidative stress; evidence for involvement of mitochondrial nitric oxide synthase. J. Mol. Cell. Cardiol. 43, 411–419. doi: 10.1016/j.yjmcc.2007.05.019
Keywords: ocean warming, ocean acidification, arctic, pteropods, lipids
Citation: Lischka S, Greenacre MJ, Riebesell U and Graeve M (2022) Membrane lipid sensitivity to ocean warming and acidification poses a severe threat to Arctic pteropods. Front. Mar. Sci. 9:920163. doi: 10.3389/fmars.2022.920163
Received: 14 April 2022; Accepted: 27 June 2022;
Published: 11 August 2022.
Edited by:
Brian P. V. Hunt, University of British Columbia, CanadaReviewed by:
Omera Matoo, University of Nebraska-Lincoln, United StatesRamadoss Dineshram, Council of Scientific and Industrial Research (CSIR), India
Nina Bednarsek, National Institute of Biology(NIB), Slovenia
Copyright © 2022 Lischka, Greenacre, Riebesell and Graeve. This is an open-access article distributed under the terms of the Creative Commons Attribution License (CC BY). The use, distribution or reproduction in other forums is permitted, provided the original author(s) and the copyright owner(s) are credited and that the original publication in this journal is cited, in accordance with accepted academic practice. No use, distribution or reproduction is permitted which does not comply with these terms.
*Correspondence: Silke Lischka, slischka@geomar.de