Length-Weight Relationships and Otolith-Based Growth Curves for Brushtooth Lizardfish off Taiwan With Observations of Region and Aging–Material Effects on Global Growth Estimates
 Shui-Kai Chang
 Yuan-Tian Chou2†
  Simon D. Hoyle
- 1Graduate Institute of Marine Affairs, National Sun Yat-sen University, Kaohsiung, Taiwan
- 2Eastern Marine Biology Research Center, Fisheries Research Institute, Council of Agriculture (COA), Taitung, Taiwan
- 3National Institute of Water and Atmospheric Research (NIWA), Port Nelson, New Zealand
Establishing appropriate aging procedures and growth models are two important steps for estimating reliable growth curves and in developing proper stock assessments. Lizardfishes have a strong influence on the structures of epibenthic communities and are important to the trawl fisheries of many coastal countries. For brushtooth lizardfish, Saurida undosquamis, the major species in the lizardfish catches of Taiwan, three issues were investigated. First, we used generalized additive models to explore factors (e.g., sex, data source, season) affecting the length-weight relationship (LWR), and to estimate suitable parameters. Second, we identified suitable procedures for otolith preparation (sagittal or transverse sections), validated the periodicity of ring increments using marginal increment analysis (MIA) with discussions of the appropriateness of the analysis, and determined the “best-fit” growth model via multi-model inference. Lastly, we compared growth estimates from this study with those published globally and developed an overview of global variation and the main associated variables through hierarchical cluster analysis and random forest modeling. Results suggested the following. (1) A suitable LWR for the stock was BW = 6.269 × 10⁻³ · FL3.144 for females and BW = 6.439 × 10⁻³ · FL3.144 for males. The allometric coefficient varied among samples and data sources and through the season. (2) Aging precision may be higher using transverse sections rather than sagittal sections. MIA indicates that otolith ring marks are formed annually during the active spawning season at the end of winter and the beginning of spring (from February). The Von Bertalanffy Growth Model was selected and the parameters (L∞, K, and t0) were: 46.4 cm, 0.12 year-1, and -2.12 year for sex-combined; 38.6 cm, 0.15 year-1, -2.06 year for males; and, 42.0 cm, 0.16 year-1, -1.53 year for females. (3) Globally, 86 sets of growth parameters were compiled from the literature. Region and aging material were the most important sources of variation in global estimates, which indicates the importance of using reliable aging material.
Introduction
Length-weight relationships (LWRs) are commonly used to infer weight from length for fish samples because direct weight measurement can be time-consuming in the field (Sinovcic et al., 2004). Additionally, LWR can also provide important information about variations in condition and fitness in a marine habitat and, together with other data, the growth, mortality, and unit-stock separation (Froese, 2006; King, 2007; Mehanna and Farouk, 2021). This relationship can change seasonally and between years, and may be affected by many factors (De Giosa et al., 2014; Jisr et al., 2018), which may have implications for the determination of a representative LWR.
Identifying appropriate aging procedures and growth models are two important steps in the process of estimating reliable growth curves and in developing proper stock assessments for designing management plans for the fish resource (Maunder and Piner, 2015; Maunder et al., 2016; Chang et al., 2022). The first step is to provide reliable age data as the basis for estimates of growth parameters, as well as mortality rate and productivity (Dos Santos et al., 2017). The second step is, by fitting the age and body length data to various potential growth models (such as the von Bertalanffy growth model, VBGM (von Bertalanffy, 1938)) and selecting the one that best fits the data, to quantitatively describe fish growth and provide a growth curve suitable for stock assessment. Inappropriate or unreliable determination of either ages or the growth curve can lead to inaccurate perceptions of population condition, recruitment, and the level of fishing mortality, and consequently affect the reliability of scientific advice on stock status (Campana, 2001; Eero et al., 2015; Maunder and Piner, 2015; Hüssy et al., 2016).
Several hard structures form periodic growth increments and can be used for age determination in fish, including scales, otoliths, vertebrae, and fin rays. These calcified structures, and the length frequency data, can all be used as “aging materials”, however, they may provide quite different results (e.g., Chang and Maunder, 2012). Among them, otoliths have been used widely for aging many species (Secor et al., 1995) and have been shown to be more reliable than other structures, though with the need of sacrifice fish (Hining et al., 2000; Parr et al., 2018).
One of the essential issues in using hard structures for aging is validation of the age from the ring increments. Campana (2001) summarized and critically appraised nine age validation methods: in brief, these include mark-recapture methods by releasing either known-age fish or chemically-tagged fish; captive rearing of known-age or chemically-marked fish in the laboratory/outdoors; comparison with date estimates from bomb radiocarbon analysis, radiochemical dating analysis, or natural date-specific markers; modal length progression analysis; and marginal increment (MI) analysis. These methods are not applicable to all species. Low recapture rates, high costs, or data sampling limitations, for example, are major constraints for validation (Campana, 2001; Fisheries and Oceans Canada, 2019; The Campana lab, 2022); and thus, most studies choose the one or two methods that are most applicable (e.g., Iglesias et al., 1997; Carbonara et al., 2018; Kastelle et al., 2020; Chang et al., 2022). Among them, MI analysis is one of the most popular methods due to its moderate sampling requests and low cost (Lessa et al., 2006), although there are some considerations to make the interpretations objective and rigorous, such as randomized sampling and objective interpretation (to be discussed later) (Campana, 2001).
A further issue in using hard structures is the choice of preparation method. Otoliths can be examined for growth increments whole (unprepared) or in section, and there are also alternative methods for sectioning. The choice is important because it can affect the ability to observe growth increments. Hining et al. (2000) found that using whole otoliths may underestimate rainbow trout ages, due to overlooking one or both of the first two annuli due to calcium deposition on the proximal surface (sulcus). This is common for older, slow-growing fish (Chilton and Beamish, 1982). In general, the time for preparing sagittal sections (grinding down the distal surface of the otolith to the midline) is about 10% of that required for preparing transverse sections (a cross section of the otolith taken though the dorsal to ventral surfaces) (Sakai et al., 2009).
Growth curves are obtained by fitting age and length data with a growth model to estimate parameters. Standard VBGM is the most widely-used model for fishes (Flinn and Midway, 2021) but not necessarily the most appropriate in each case due to the ontogenetic changes in growth rates varying by species (Roff, 1980; Maunder et al., 2016). Other commonly used alternatives include the Gompertz model (Gompertz, 1825), the logistic model (Ricker, 1975), and the Richards model (Richards, 1959). The multi-model inference approach (MMIA) (e.g., Katsanevakis, 2006; Katsanevakis and Maravelias, 2008) is a useful way to select the most representative growth model from a suite of candidates for the species studied (e.g., Williams et al., 2012; Carbonara et al., 2020; Chang et al., 2022).
Brushtooth lizardfish, Saurida undosquamis, can be found from Australian waters to the northwestern Pacific Ocean and north-eastern Indian Ocean (Froese and Pauly, 2021). It has also been observed in the region of eastern and western India and in the Mediterranean Sea (see citations in Supplementary Table 1). Lizardfish are voracious predators of small fish and crustaceans and have a strong influence on the structure of epibenthic communities because of their predatory role (Sweatman, 1984; Lemberget et al., 2009). They also are important commercial fish to many coastal countries, e.g., Japan, China, Korea, and Thailand. Lizardfishes are one of the main target species of commercial trawl fisheries off Taiwan, on the coastal shelf on muddy and sandy bottoms; however, Taiwanese landings have decreased by about 30% in recent years (Agency Fisheries, 2021). Brushtooth lizardfish is the main species in lizardfish catches (Lee et al., 1986), therefore, the decreasing landings, with no decline in fishing effort, have concerned the fishery sector. Key biological information, such as growth parameters, is thus important to better understand the stock status.
This study was carried out for three purposes. The first two were (1) to explore factors affecting the LWR using generalized additive models and then to estimate a suitable LWR for stock assessment; (2) to provide otolith-based growth curves for the species by identifying a suitable procedure for otolith preparation (sagittal sections or transverse sections), validating the periodicity of ring increments using MI analysis, and determining the “best-fit” growth model by applying MMIA to the abovementioned four candidate models. Age and growth of the brushtooth lizardfish have been studied in Taiwan and other regions (mainly in the northern hemisphere, Table 1 and Supplementary Table 1) using various aging materials (e.g., otolith, scale, vertebra, length frequency data). Compiling and comparing the global estimates will provide an overview of the variability among estimates and may help to identify factors causing the variation. Therefore, the third purpose was (3) to compile growth estimates from this study and those published globally, draw an overview of the variation of global estimates through hierarchical cluster analysis (HCA) of logged growth parameters, and use random forest analysis to identify the variables associated with the variation.
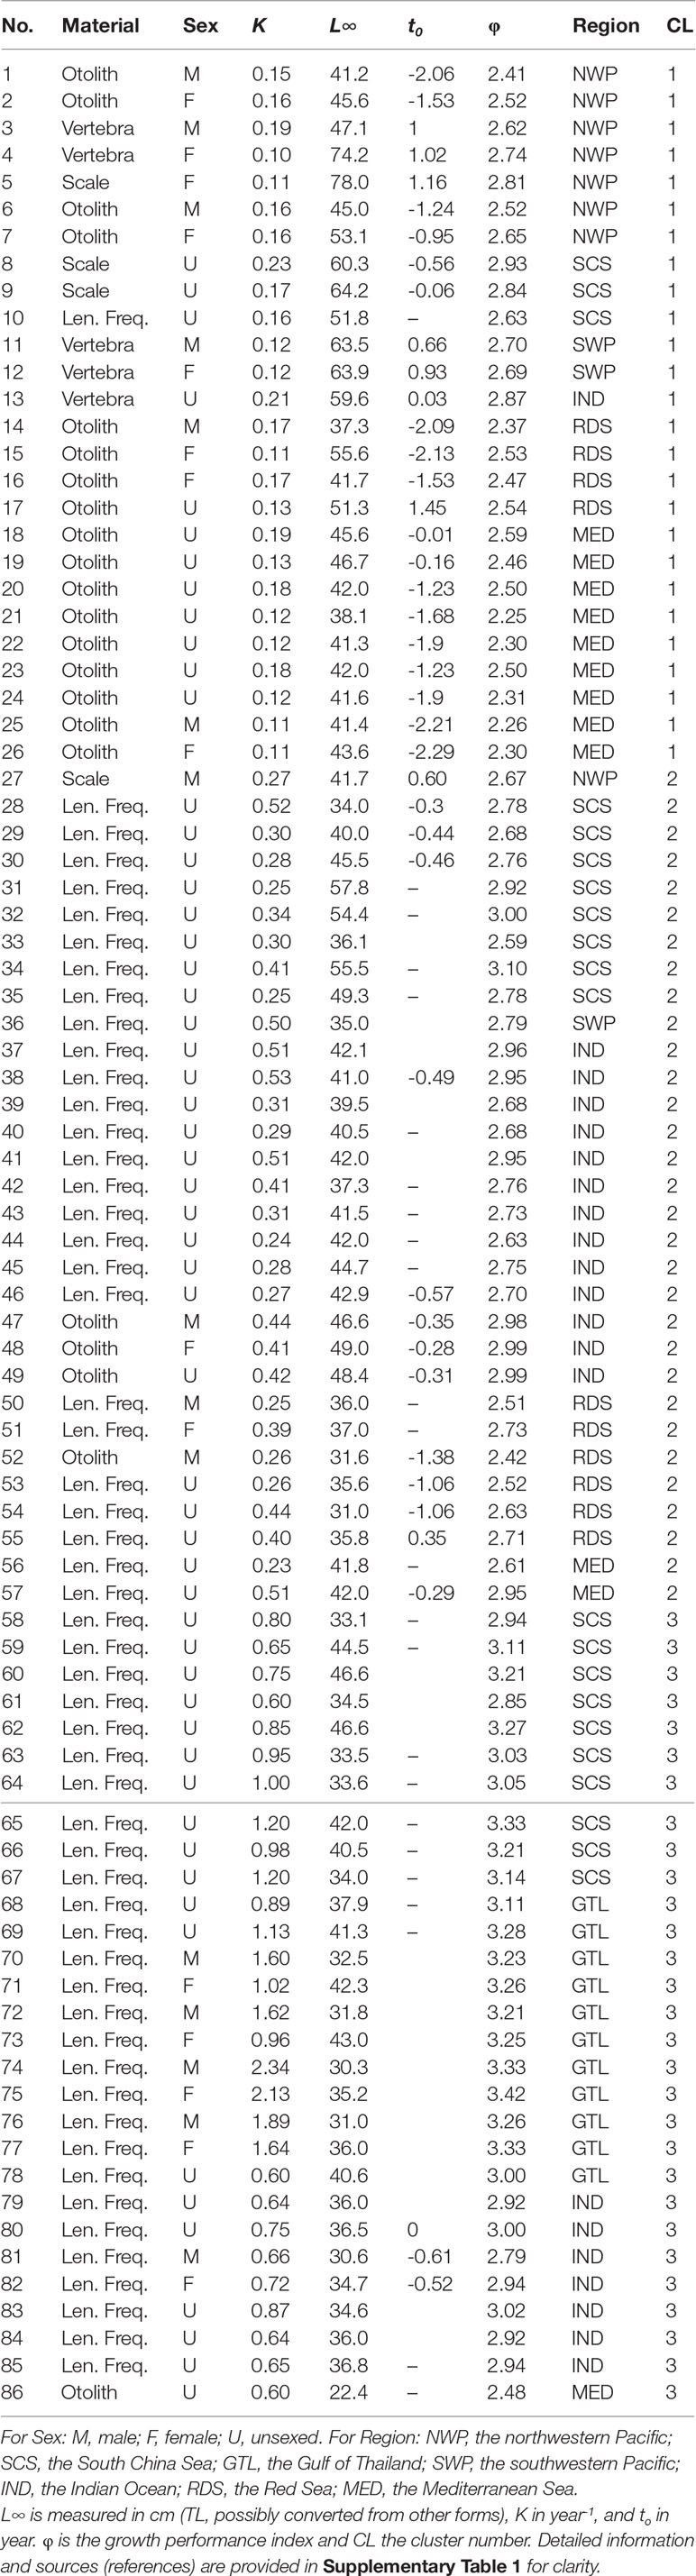
Table 1 Global estimates of von Bertalanffy growth parameters of brushtooth lizardfish from the literature. L∞ is measured in cm (TL, possibly converted from other forms), K in year-1, and to in year. ɸ is the growth performance index and CL the cluster number. Detailed information and sources (references) are provided in Supplementary Table 1 for clarity.
Materials and Methods
Sample Collections and Length-Weight Relationship (LWR) Estimation
Fish samples used in this study were randomly collected from landings at the Zihquan and Tungkang fish markets that were caught by the trawlers fishing in the vicinity of Taiwan Bank (Figure 1), from March 2011 to June 2012. To reduce the effect of size-specific high-grading (FAO, 2017), samples of smaller fish were also collected from trawl surveys conducted by the Fisheries Research Institute. In total 1127 fish samples were available for LWR estimation (Table 2 and Supplementary Table 2) and 804 of them were used for the aging study. Species identification followed the taxonomy of Yoneda et al. (2002) and Inoue and Nakabo (2006).
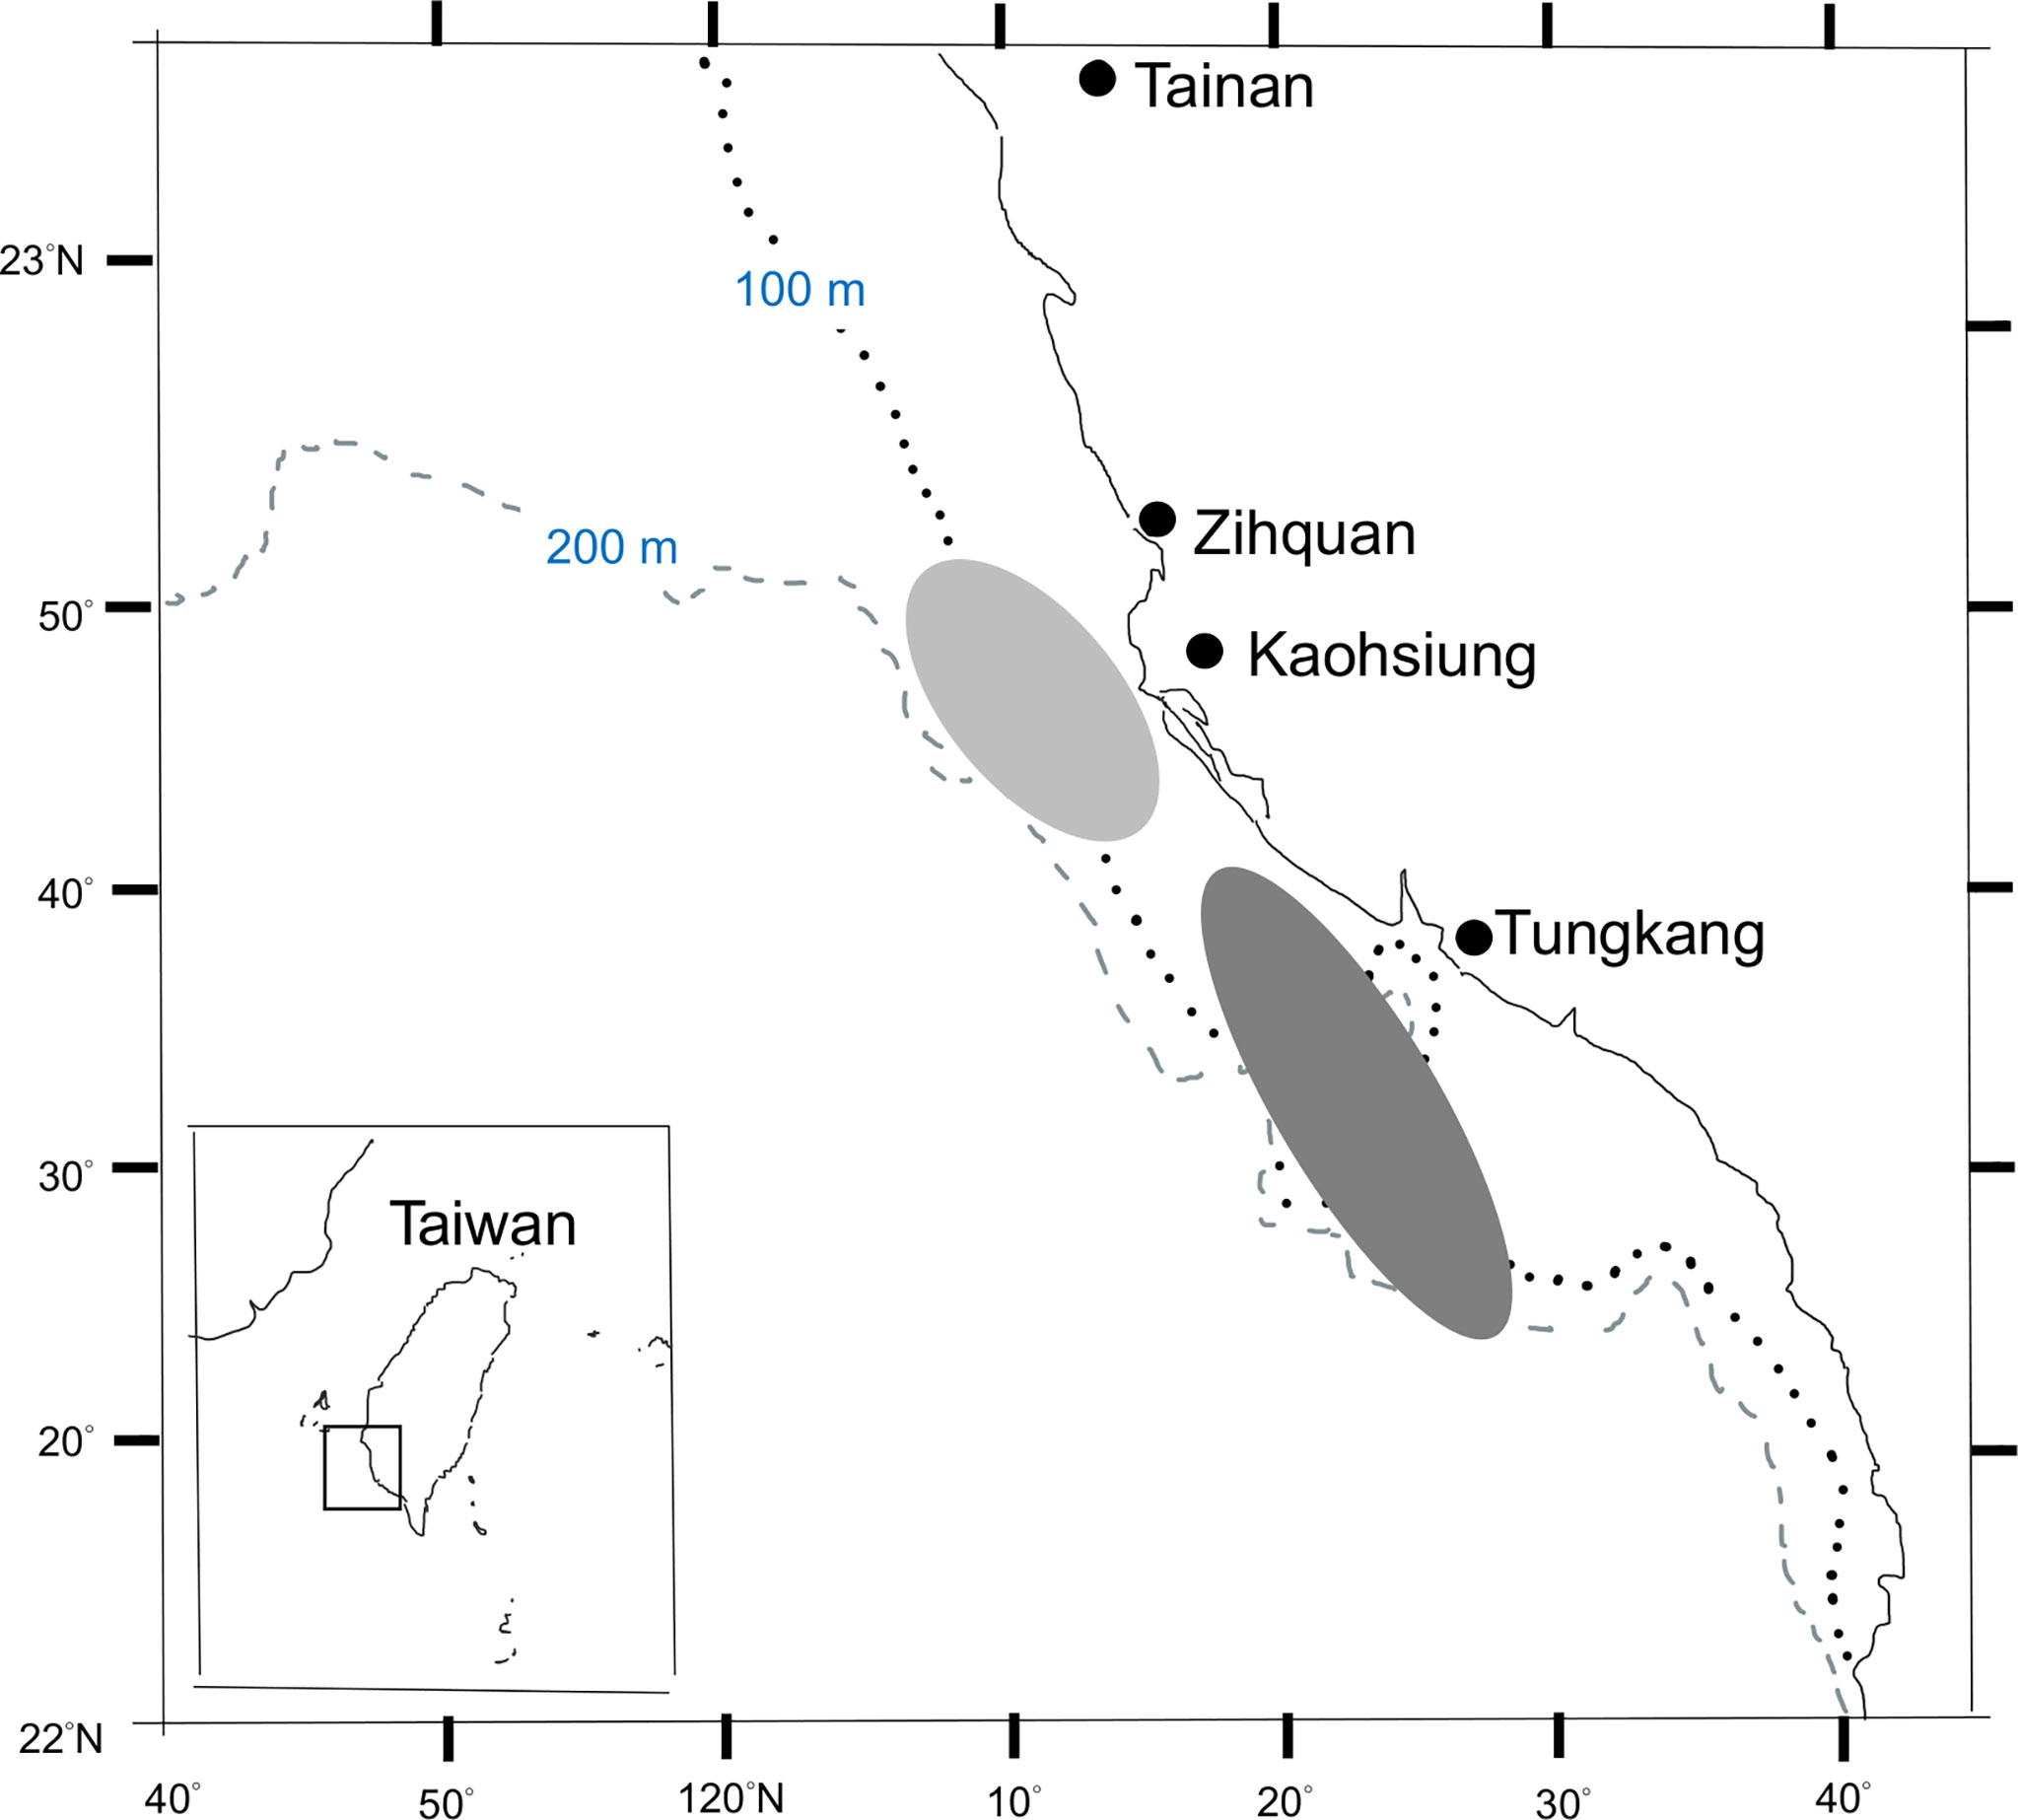
Figure 1 Major fishing area of brushtooth lizardfish from the trawlers based in Zihquan (light shaded area) and Tungkang fishing ports (dark shaded area).
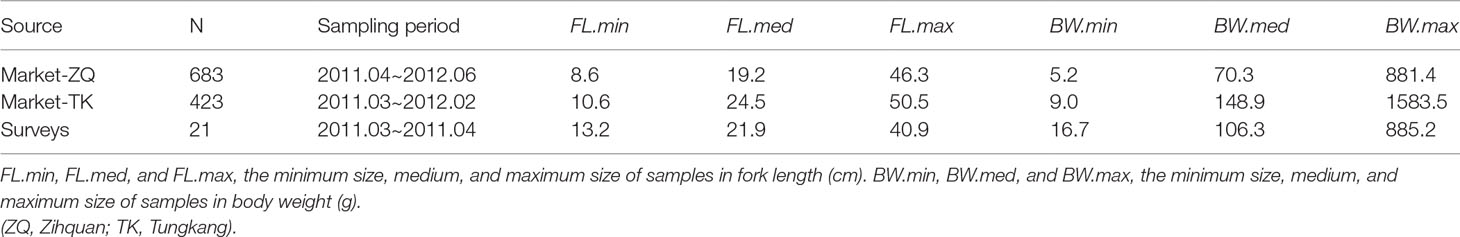
Table 2 Information on brushtooth lizardfish samples collected by different sources. (ZQ: Zihquan; TK: Tungkang).
Fish were measured to the nearest millimeter in fork length (FL) and to the nearest 0.1 g in body weight (BW). Sex was determined by macroscopic examination of the gonads. Samples attached with information of sampling date and sources (market or trawl survey). Two variables were created for the analysis: “source-date” combined information of sampling date and data source, and “year-fraction” identified the sampling day of the year.
The LWR was estimated from the sample data in two stages. First, patterns in the relationship between log(BW) and log(FL) were explored using a generalized additive model (GAM) implemented with the R package mgcv (Wood and Wood, 2020). Standard methods assume this relationship to be linear, but nonlinearity in the relationship was permitted by fitting the log(FL) relationship with a spline. Other possible effects on the length-weight relationship were explored by offering the model sex, source, and year as factors potentially interacting with length, and the year-fraction as a cyclic cubic spline. Codependence within samples was allowed for by fitting a random effect to allow the source-date to affect the intercept. Models were fitted in R version 4.1.2 using GAMs from the mgcv package. Restricted maximum likelihood (REML) was used for optimization and smoothness selection. Initially model selection for parametric terms (factors) was based on the Akaike Information Criterion (AIC) from models fitted using GCV.cp, but this gave the same results as using REML. Smoothed terms were selected using shrinkage (Marra and Wood, 2011). The risk of overfitting was reduced by using gamma=1.4 (Wood, 2006).
Final analyses to provide a general length-weight relationship for stock assessment modeling were carried out assuming a power function of the form BW=a× FLb, where a is the coefficient of the power function and b is the allometric coefficient. Allowance was made for differences between sexes. Parameters a and b were estimated with a linear regression of log(BW) against log(FL), using a generalized additive model implemented with the mgcv package. Overdispersion caused by obtaining multiple samples from the same trawls was adjusted for by including a random effect for source-date. For comparison, the common form of the length-weight relationship was calculated by fitting log(BW) as a function of log(FL) using a linear model, without allowing for overdispersion or covariate effects.
Otolith Process and Age Determination
Otoliths (sagittae, lapilli, and asterisci) were removed, cleaned, and washed with distilled water for age analysis. After examination of the three pairs of otoliths, sagittal otoliths were chosen as the optimal hard structure for age determination since they contained more obvious marking patterns. Lapilli, asterisci, and scales were also examined; however, these structures either showed irregular outer margins or the marks were vague, making the age difficult to determine.
To identify a suitable procedure for otolith preparation, a subset of 35 fish was randomly selected by size. One of the two sagittal otoliths was prepared in transverse section and the other in sagittal section (Supplementary Figure 1). The sagittal sections were prepared by embedding the whole sagitta otolith, adhered on a glass slide, and then polishing with sandpaper (1200 to 4000 grit) until the core became visible (Sakai et al., 2009). The transverse sections were prepared by embedding otoliths in epoxy resin, heating them to 60°C for 90 minutes, and then sectioning them transversely with an IsoMetTM low speed saw (approximately 500μm thick). The otoliths were examined using a microscope with transmitted light. Accreted otolith material were translucent during periods of fast growth and opaque during slow growth, which is different from observations under a dissecting microscope with reflected light (Karlson et al., 2013). Rings, consisting of broad translucent zones alternating with narrow opaque zones, were observed on the surfaces of sagittal sections and transverse sections. Frontal sections (longitudinal sections, a cross section taken from posterior to anterior) were also examined but were abandoned for further study because ring marks were difficult to discern clearly. The location of the first ring mark was verified by examining daily increments on otoliths of five small fish (<180 mm).
To determine the age of each fish, the date of birth was assumed to be January 1, which approximately corresponds to the peak spawning period (Wu et al., 2014), and the number of opaque zones observed were assigned as the age in years. Fish sampled from the first half of the year were aged by counting all the opaque annuli, including the edge, if opaque. Fish sampled from the second half of the year were aged by ignoring an opaque edge if present.
To define the most suitable form of section for age determination, each otolith was aged twice by the same reader with at least 24 hours between reads, and the index of average percentage error (IAPE) (Beamish and Fournier, 1981) was calculated as follows:
where N is the number of fish aged for this purpose (35 fish), n is the number of times each fish was aged, Xij is the ring count from the ith reading of the jth fish, and Xj is the average estimated age of the jth fish. The section with the smallest IAPE was selected as the approach for the whole aging study.
Additional modeling was used to determine whether the difference in IAPE could have occurred by chance. Reader errors were assumed to be sampled from a binomial distribution and the probability of reader error was modeled with a generalized additive model implemented in the R package mgcv, with covariates fish length and otolith sections type.
MI analysis was used to validate the period of ring mark formation. Monthly subsamples of 10 otoliths were selected from the complete set of samples (n=160). Selection was random, but efforts were made to limit the size range to restrict samples’ age groups (Campana, 2001). Otoliths were prepared using transverse sections and randomized before examination without date information attached. MI was calculated by the following equation:
Where R is the radius from the centrum to the outer, rn the distance between the centrum and the outer margin of the last band and rn-1 the distance between the focus and the outer margin of the penultimate band, in mm. One-way analysis of variance (ANOVA) was used to compare differences of means of the marginal increment widths amongst sampling months, followed by a two-tail Tukey honestly significant difference test (HSD) to trace the significance of the trend of monthly changes.
Growth Parameters Estimation
Four of the most-used growth models in fisheries were fitted, including three three-parameter models (VBGM, Gompertz, and Logistic), and a four-parameter model (Richards model).
Von Bertalanffy model:
Gompertz model:
Logistic model:
Richards model:
where Lt is the fork length (cm) at age t (years), L∞ the mean asymptotic length, K the relative growth rate, and t0 the theoretical age at which L = 0 cm for VBGM and the age at the inflection point for the rest. p is a dimensionless parameter of Richards model.
The four candidate models were fitted to length-at-age data (combined and sex-specific) constructed from age readings of the complete sample set based on transverse sections, using non-linear least squares in R (R-Development Core Team, 2021). The small-sample bias-corrected form (AICc) of the AIC (Akaike Information Criterion) was used for model selection (Akaike, 1973) and was calculated using R package AICcmodavg (Mazerolle, 2020).
where RSS is the residual sum of squares, k the number of parameters in the model, and n the number of observations. The model with the smallest AIC value (AICc,min) was selected as the ‘best’ among the models tested. AIC differences deltaAIC = AICc,min – AICc,i were computed over all candidate models i. The Akaike weight, wi, of each model was then calculated using these differences to quantify the plausibility, which is considered as the weight of evidence in favor of model i being the best of the available set of models (Burnham and Anderson, 2002; Katsanevakis and Maravelias, 2008).
Classification of Global Estimates
Global estimates of growth parameters of brushtooth lizardfish were collected from the literature, including grey literature such as project reports, and from FishBase (Froese and Pauly, 2021). Some literature was unavailable; the estimates were then adopted from published papers without further verification. Altogether 86 sets of estimates were compiled (Table 1); one from the Mediterranean coast of Israel was omitted given the lack of estimates from the original paper. Estimates of K were all in year-1; estimates of L∞ were in cm in either standard length (SL), fork length (FL), total length (TL), or unknown (NA) (see Supplementary Table 1). Most of the L∞ were in TL, thus the remaining estimates were converted to TL using the following formulae, or assumed to be TL in the case of NA.
TL = 1.0830FL + 0.0686 (r² = 0.98, for female) (YediEr et al., 2020)
TL = 1.0467FL + 0.8137 (r² = 0.99, male) (YediEr et al., 2020)
TL = 1.0614FL + 0.5151 (r² = 0.99, sex-combined) (YediEr et al., 2020)
TL = 1.1700SL + 0.1440 (r2 = 0.996) (Froese and Pauly, 2021)
All growth parameters in the literature used the VBGM (Table 1), estimated using two categories of method: one used hard parts of fish as aging materials, including otoliths, scales, and vertebrae; the other used length frequency data (LFD). The studied regions included the Indian Ocean (IND), the Red Sea (RDS), the Mediterranean Sea (MED), and the western Pacific Ocean, included the northwestern Pacific (NWP, e.g., waters off Taiwan and Japan), the southwestern Pacific (SWP, e.g., Australian waters), the South China Sea (SCS), and the Gulf of Thailand (GTL). Altogether seven regions were defined (Table 1 and Supplementary Table 1). Most of the cases were without sex-specific information (U).
The growth performance index, φ = 2log(L∞) + log(K), proposed by Pauly and Munro (Pauly and Munro, 1984), has been applied widely to compare growth parameters of different studies (Sparre and Venema, 1992; Chang and Maunder, 2012; Chang et al., 2013). Two variables of the index log(L∞) and -log(K) were used to identify clusters of growth estimates from the global summary using hierarchical cluster analysis (HCA) (Boehmke and Greenwell, 2019). Data were prepared as a Minkowski distance matrix, and clustered using Ward’s method (Ward, 1963). The number of clusters was decided by the “elbow method” (Kassambara, 2017).
Growth performance may vary by several variables (Schwenke and Buckel, 2008; Chang et al., 2013). Only three variables were available from all literature that could be used to explore the variation of growth performance. These were the estimation material used, the sex of fish and the region (Table 1). This study used Gini importance (or mean decrease in impurity) computed from the random forest algorithm (Menze et al., 2009; Martinez-Taboada and Redondo, 2020) to identify which variables are more relevant and important to the growth performance index.
Results
Samples and Length-Weight Relationship (LWR)
The samples used for LWR estimation ranged in length from 8.6 to 50.5 cm FL. Size differences between sexes were identified (ANCOVA, p<0.05). Males ranged from 10.6 to 43.2 cm FL and females from 8.6 to 50.5 cm FL. Females were on average slightly longer than males in fork length but with similar modal body weight (Figure 2).
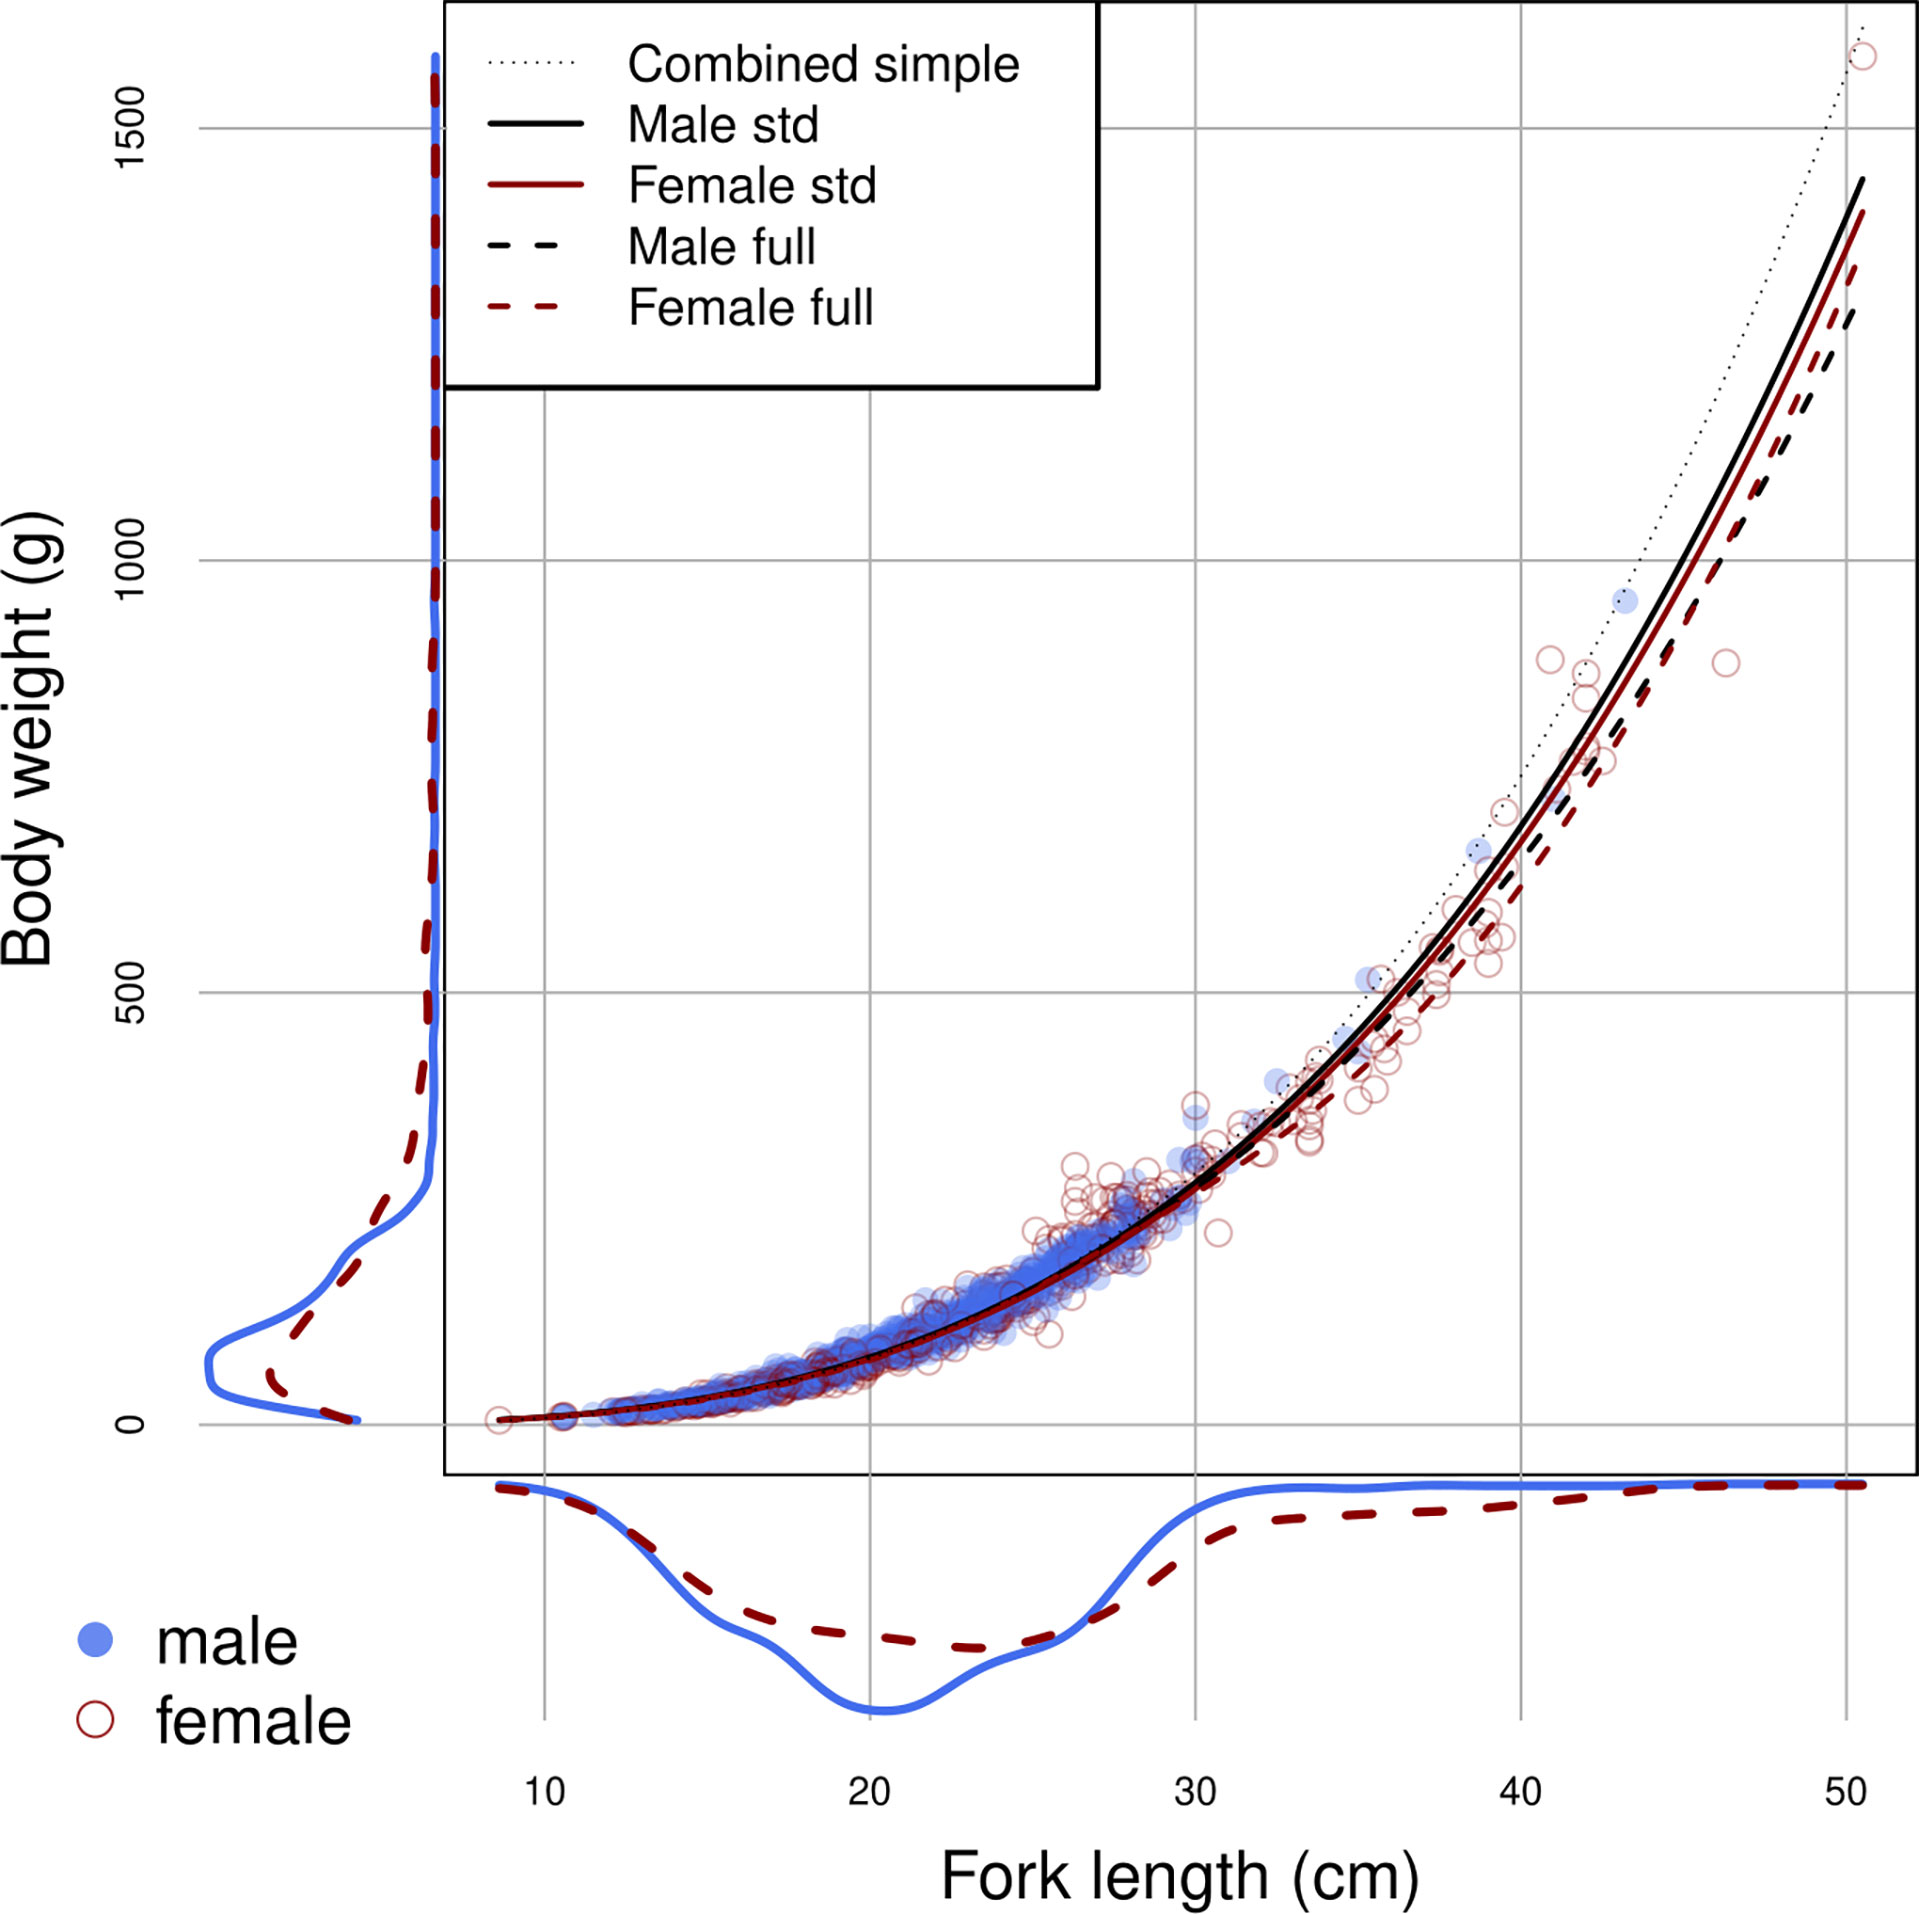
Figure 2 Size distributions in length and weight, and the estimated relationships by sex using the full model (dotted lines) and the standard model (unbroken lines), for brushtooth lizardfish off Taiwan. Lines are based on the means of the source effects and source-date random effects.
A GAM was used to explore factors affecting log(BW). The model assumed a Gaussian distribution, which was a relatively good fit to the data. A significance table for factors and smooth terms of the best model selected based on AIC is shown in Table 3. The random effect for source-date substantially improved model fit, with the Gaussian quantiles suggesting close to a normal distribution with minor overdispersion (Figure 3). The allometric coefficient varied systematically between sources with the best condition in fish from market-TK and the worst from the survey. There was a seasonal trend in fish condition, which was lowest in the second quarter of the year and highest in last quarter.
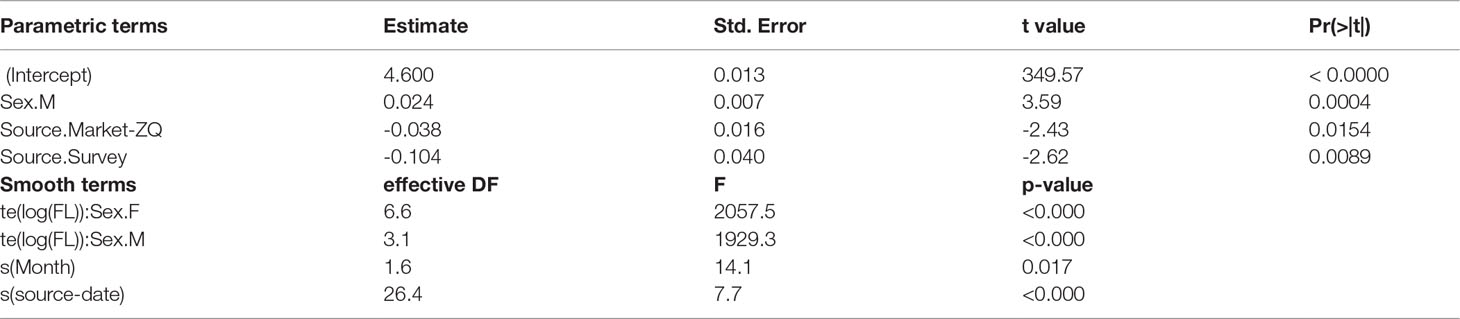
Table 3 Significance table for factor (top table) and smooth (bottom table) terms in the best length-weight relationship model: log(BW) ~ te(log(FL), k = 30, by = sex) + sex + s(year-fraction, bs = “cc”) + source + s(source-date, bs = “re”).
Figure 3 Factors affecting the relationship between log(length) and log(weight), including the month (top left), the source of the samples (top right), and a random effect for source-date (bottom left).
Log (FL) was the most important factor affecting log(BW), with the relationships close to linear for males and more variable for females. Female weight at length increased relative to males above the length at which 50% of the population is mature (19.6 cm) (Wu et al., 2014) then declined after peaking at about 27 cm, with females above 30 cm slightly slimmer (in worse condition) on average (Figure 4). Males were slightly heavier at almost all lengths than females. R2 for the full model was 0.9864.
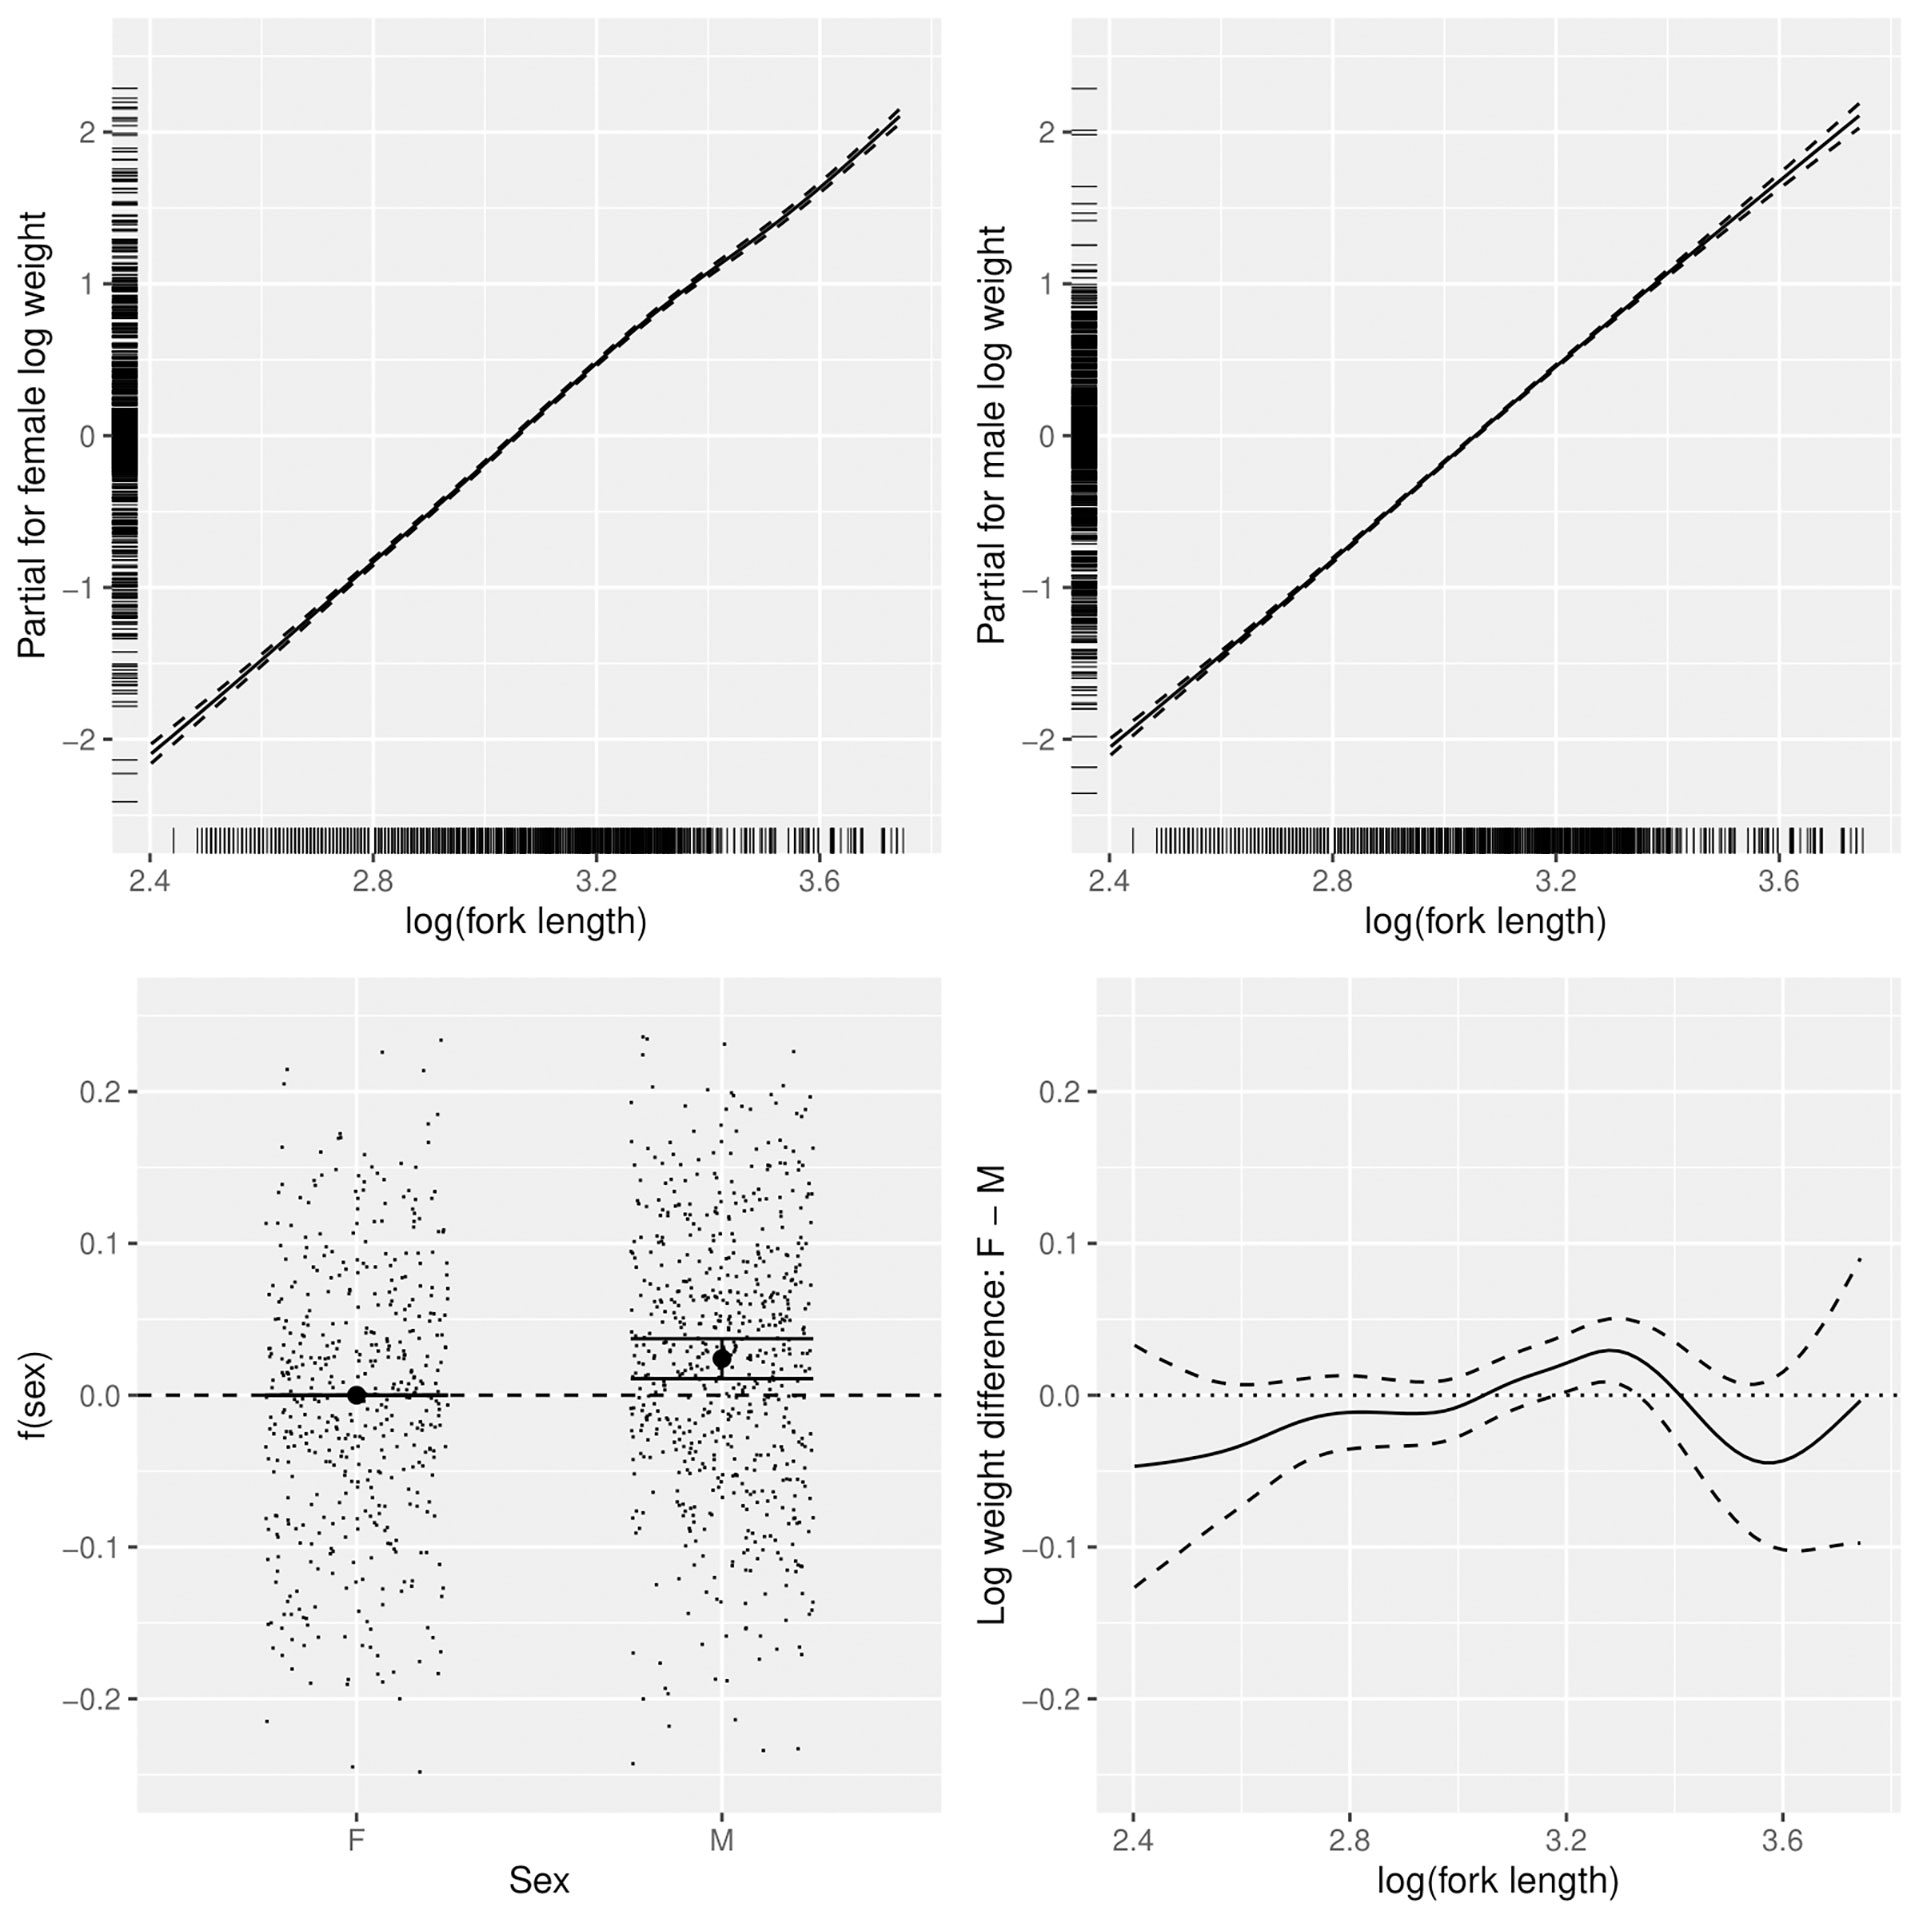
Figure 4 Sex-dependent patterns in the relationship between log(fork length) and log(weight) of lizardfish, including trends for females (top left) and males (top right), mean differences between females and males (bottom left) and length-dependent differences (bottom right).
For the simpler standard form of the length-weight relationship, a generalized linear model of log(BW) against log(FL), sex and interaction of log(FL) and sex, suggested no significant interaction between sexes in the LWR (p>0.05), but a difference between sexes (p = 0.000) with males averaging 3% heavier at the same length. Therefore, the LWR for females was estimated as BW = 6.269 × 10⁻³ · FL3.144, and for males was BW = 6.439 × 10⁻³ · FL3.144, with R2 = 0.9861. For a combined LWR, the average of a = 6.354 × 10⁻³ could be used. The allometric coefficient b was higher than 3, indicating that shape changes with growth.
For comparison with estimates from other stocks, the common form of the length-weight relationship, calculated by fitting log(BW) as a function of log(FL) with a simple linear model, was estimated as BW = 4.01 x 10⁻³ FL3.29.
Comparison Between Aging Procedures
Frontal sections showed very vague images of ring increments in our experimental review, therefore in this study we decided to use transverse section for further comparison with sagittal section in determination of the ages of fish. Consistent with this, the IAPE of the transverse sections (1.08%) was less than for sagittal sections (3.34%), indicating that the precision of age determination using transverse sections may be higher than sagittal sections. Results from the GAM indicated support for including the terms length (deltaAIC = 12.3, p < 0.01) and sectioning method (deltaAIC = 2.45, p = 0.05), indicating that sample sizes were sufficiently high for a valid comparison, with significantly lower error rates when using transverse sections.
Marginal Increment (MI) Analysis
To validate the period of ring mark formation, the mean marginal increment (MI) expressed as a percentage of the distance with the standard error was calculated by month. There was a significant difference in the value of MI among months (p<0.05) (Figure 5), and a drastic decline of MI was observed from January to February. The MIs increased steadily from February to reach the highest level (>95%) between November and January of the following year. These results suggest that ring marks are formed once near the end of winter (February) and the beginning of spring and could be considered to form annually.
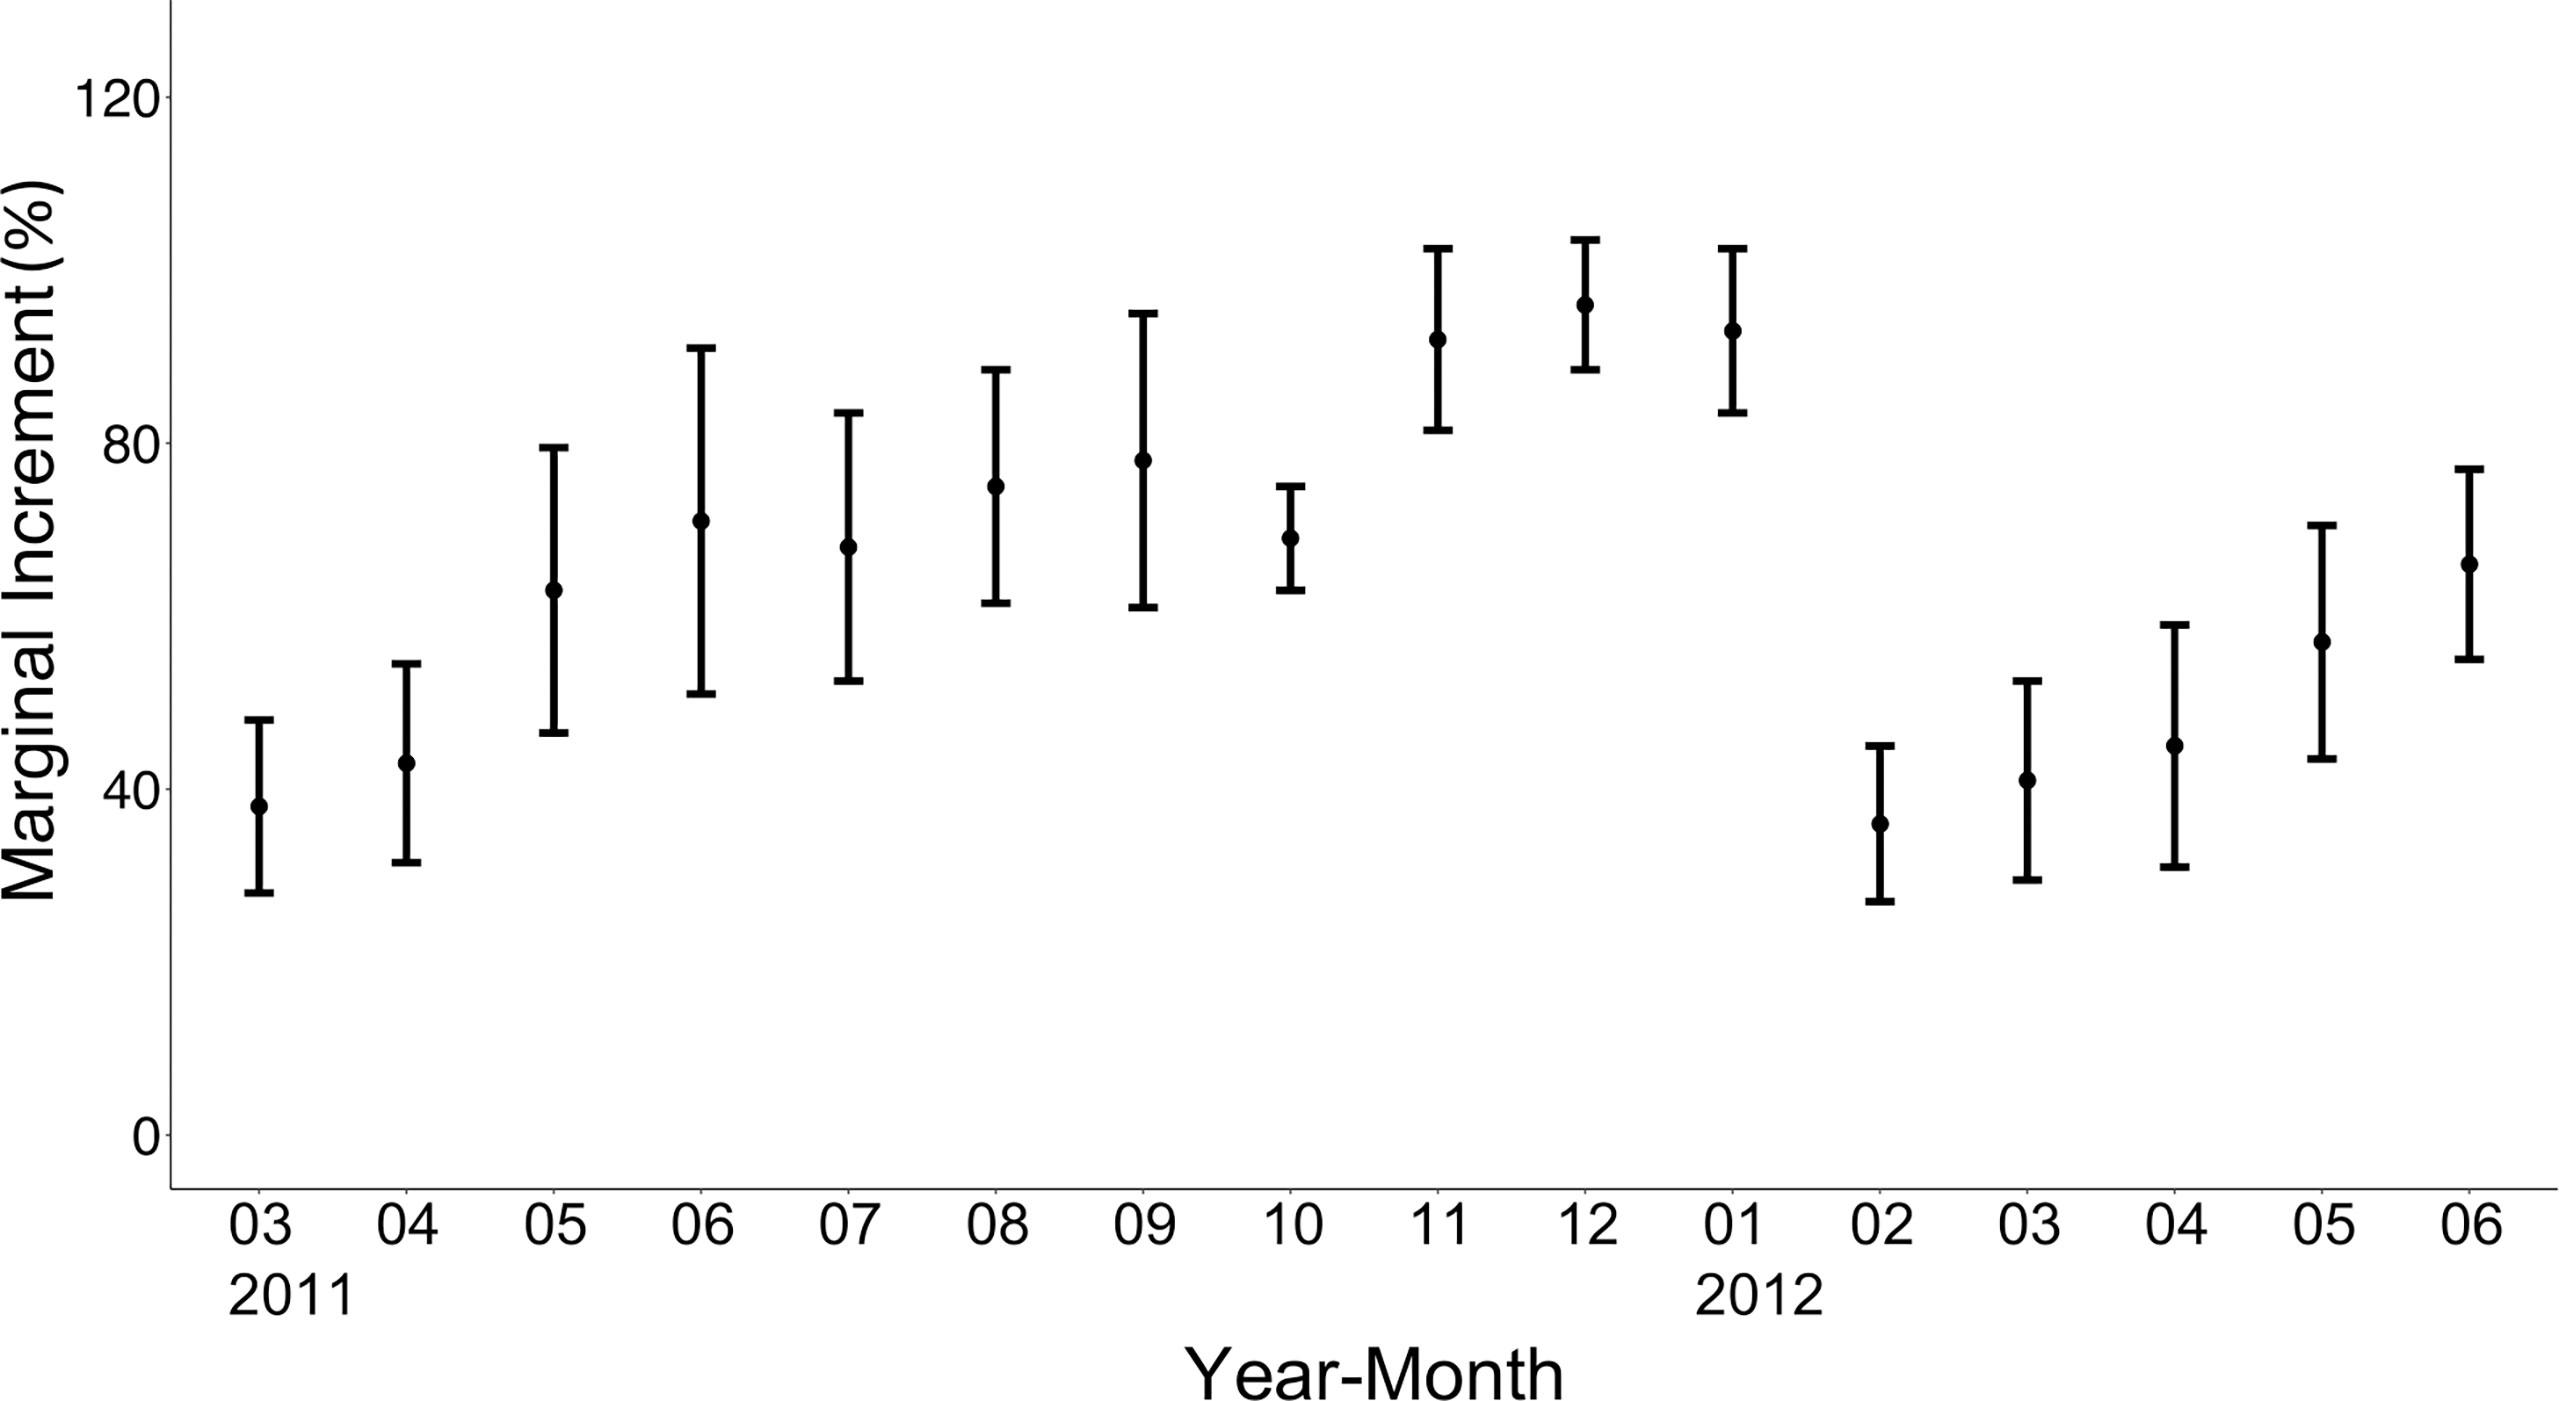
Figure 5 Monthly changes in the marginal increment of the otoliths of brushtooth lizardfish. Vertical bars indicate standard error.
Estimation of Growth Parameters
A total of 804 individuals with fork lengths (FL) ranging from 8.6 to 41.6 cm were examined using transverse sections. Males ranged from 8.6 to 38.7 cm FL (mean = 20.27 ± 4.49 cm, n = 450) and females from 10.5 to 41.6 cm FL (mean = 22.03 ± 6.02 cm, n = 354). In the otoliths extracted from both sexes the number of recognizable winter rings varied between 1 and 8. Most samples collected from commercial fish markets were estimated to be 2–3 years old, with those from targeted sampling of smaller fish 1–2 years old. Growth models fit to the length-at-age data (Figure 6 and Table 4) suggested that the VBGM was the best model with AICc differences for other models > 2 (indicating substantial support as the best model) (Katsanevakis and Maravelias, 2008) and Akaike weight w (the expected weight of evidence in favor of the model being the best among the four models) 97% for the sex-combined case. The growth parameters of VBGM (L∞, K, and t0) were: 46.4 cm, 0.12 year-1, and -2.12 year for sex-combined; 38.6 cm, 0.15 year-1, -2.06 year for male; and, 42.0 cm, 0.16 year-1, -1.53 year for female. Females grew faster and larger than males (Figure 7).
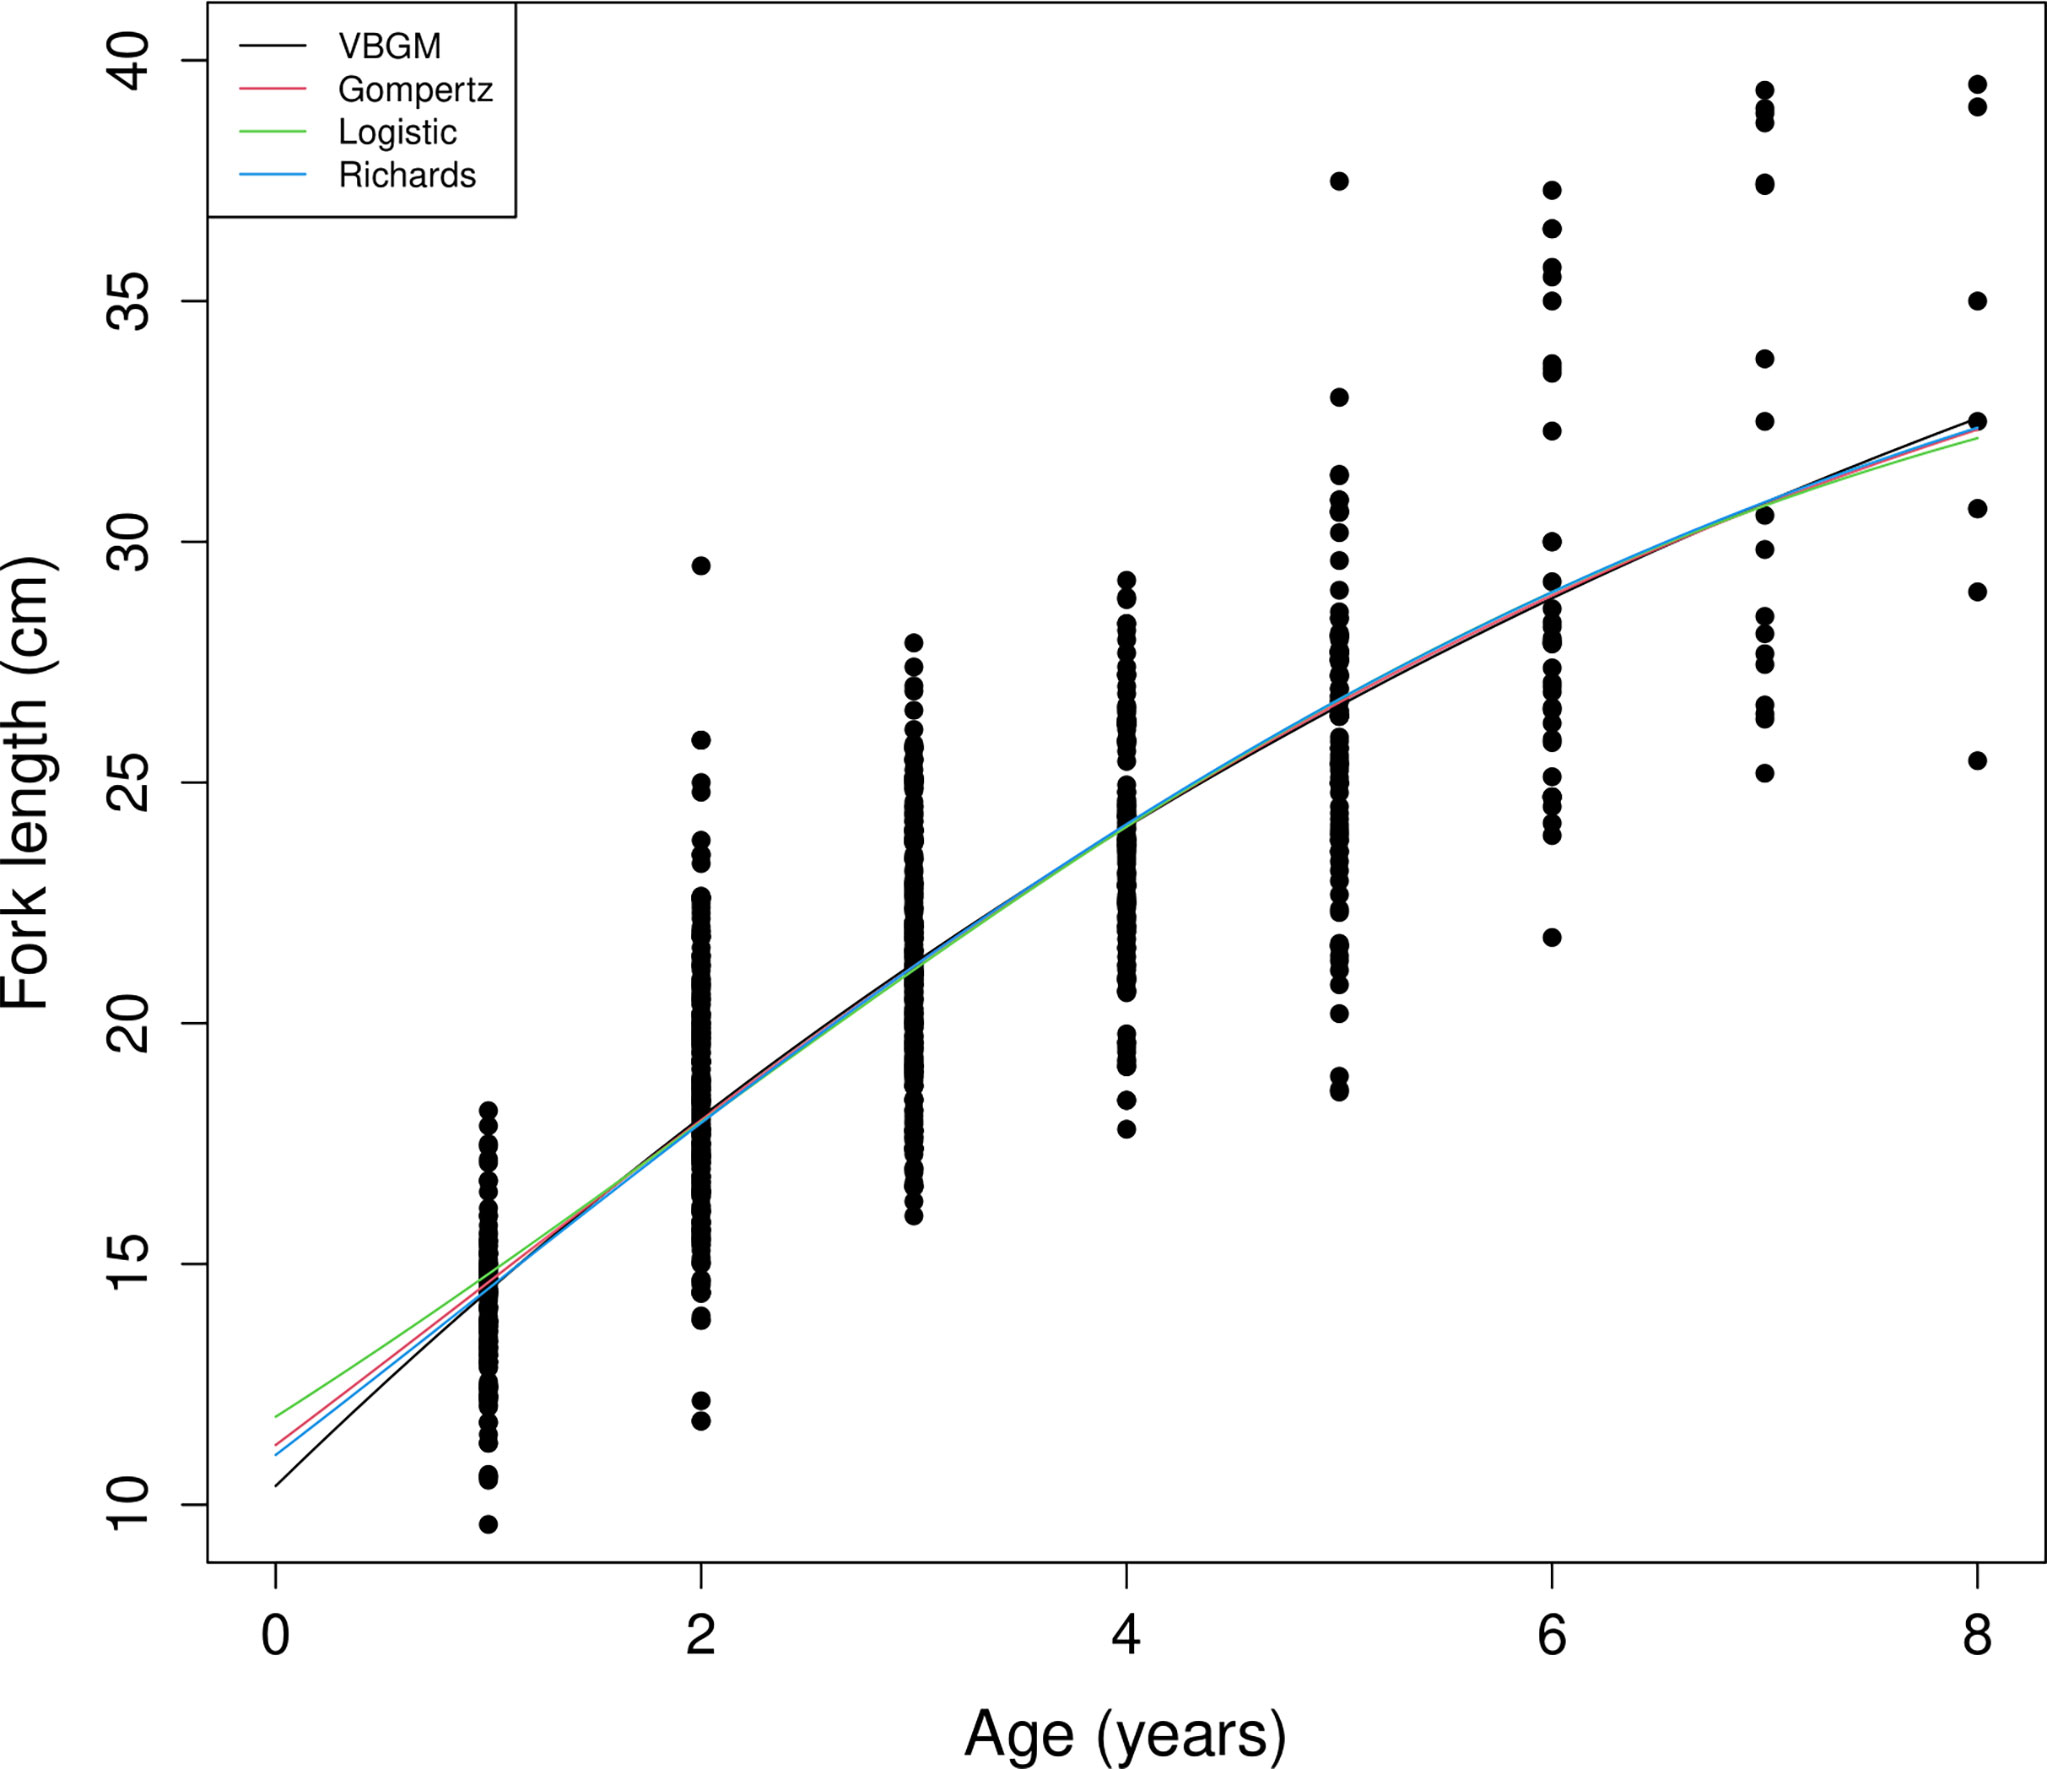
Figure 6 Age and length of sex-combined data and fitted growth curves of the four growth models for brushtooth lizardfish off Taiwan.
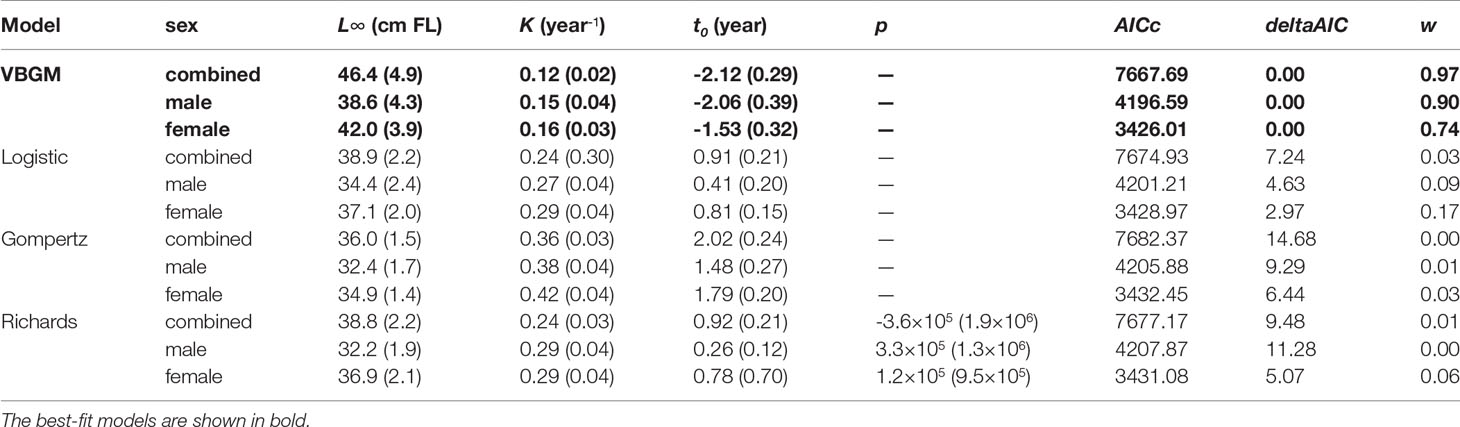
Table 4 Parameter estimates (± standard error) from four candidate growth models, by sex, for the brushtooth lizardfish off Taiwan. The best-fit models are shown in bold.
Figure 7 Growth curves of von Bertalanffy growth model (VBGM), by sex, for brushtooth lizardfish off Taiwan.
Classification of Global Estimates
The 86 estimates in Table 1 were based on four types of estimation material (two categories) and from seven regions. The scree plot generated by the elbow method (Supplementary Figure 2) suggested that three was optimal number of clusters. The cluster number based on the classification is shown in the last column of Table 1. Except in one case (record 10), all the (n=25) estimates in Cluster 1 used hard parts of the fish (otolith, vertebra, and scale) as aging materials. The remaining Clusters 2 and 3 used LFD for estimating growth parameters; Cluster 2 had lower K than Cluster 3 (0.23–0.53 year-1 and 0.6–2.34 year-1, respectively) but higher average L∞ (40.47 cm and 36.04 cm, respectively).
For Cluster 1, the only set of estimates using LFD (record 10) was from an internal project report in Vietnam (Table 1), which was the only one record from the country available from the literature at present. For Cluster 2, among the 31 sets of estimates in the cluster, only five sets used hard part of fish. Record 27 was based on back-calculated length by scale with Lee’s phenomenon and had unusually resulted in the highest record of L∞ among global estimates for female (72 cm FL) and much lower estimate for male (39 cm FL) (records 5 and 27) (Lee and Yeh, 1989). Records 47–49 used otoliths as the aging material and were the only published estimates on the species from the Arabian Sea of Oman. Record 52 also used otoliths. Further exploration might be worthwhile of the possible reasons for these records being classified into Cluster 2 in which most records used LFD for growth parameter estimation. In Cluster 3, the only set of estimates using otoliths (record 86) was from Turkey and cited from Gokce et al. (2007) who considered that the original estimates of very low L∞ and the maximum age were unrealistic and were probably due to a lack of large fish in the samples.
The variable importance plot based on mean decrease in Gini coefficient (Supplementary Figure 3) suggested that, of the three variables available, region (2.211) and aging material (1.744) were the most important. Although the sex variable (0.345) was relatively unimportant in this dataset, this is probably because few records contained sex information.
Excluding records (5, 27) 10 (16, 53) and 86 that warrant further investigation, the average growth performance index (φ) of global estimates were plotted by study location. The average φ tended to be higher in Southeast Asia, followed by those in the coast of the Arabian Sea (Figure 8). Boxplots of φ by region also suggested differences among regions (Figure 9): values from the Gulf of Thailand and the South China Sea were higher than elsewhere.
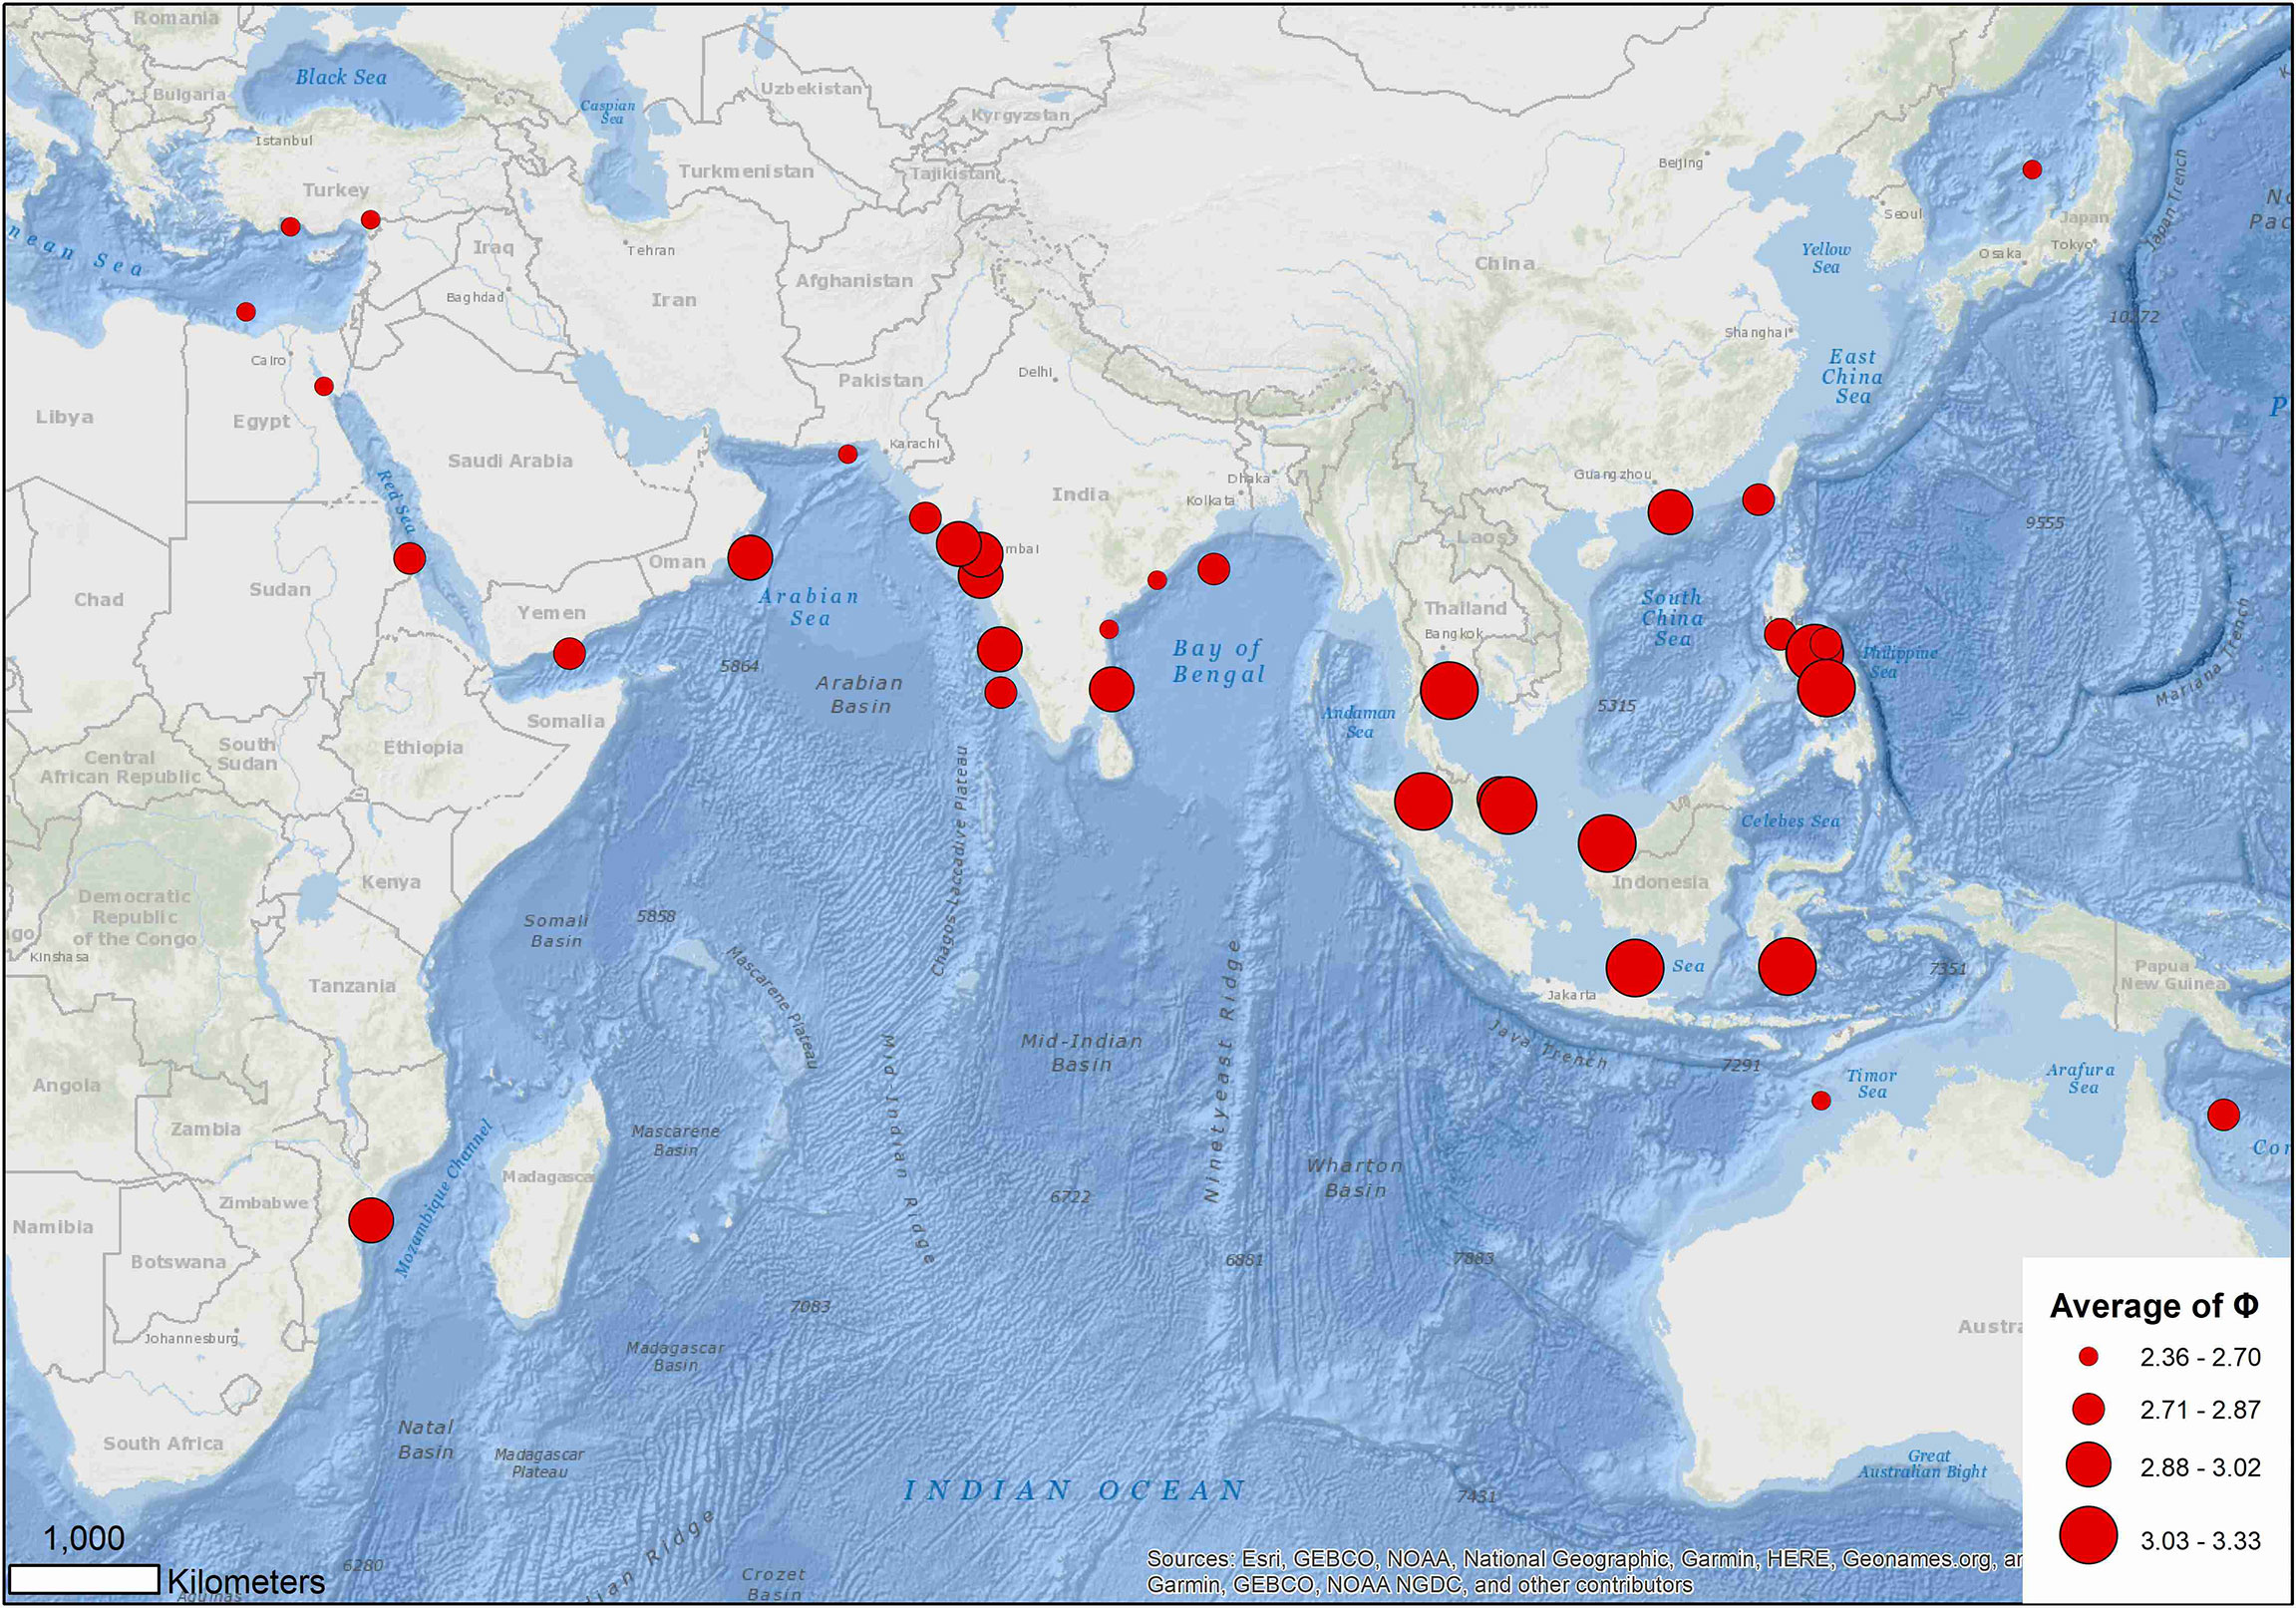
Figure 8 Distribution of average growth performance index (φ) of global growth parameter estimates for brushtooth lizardfish.
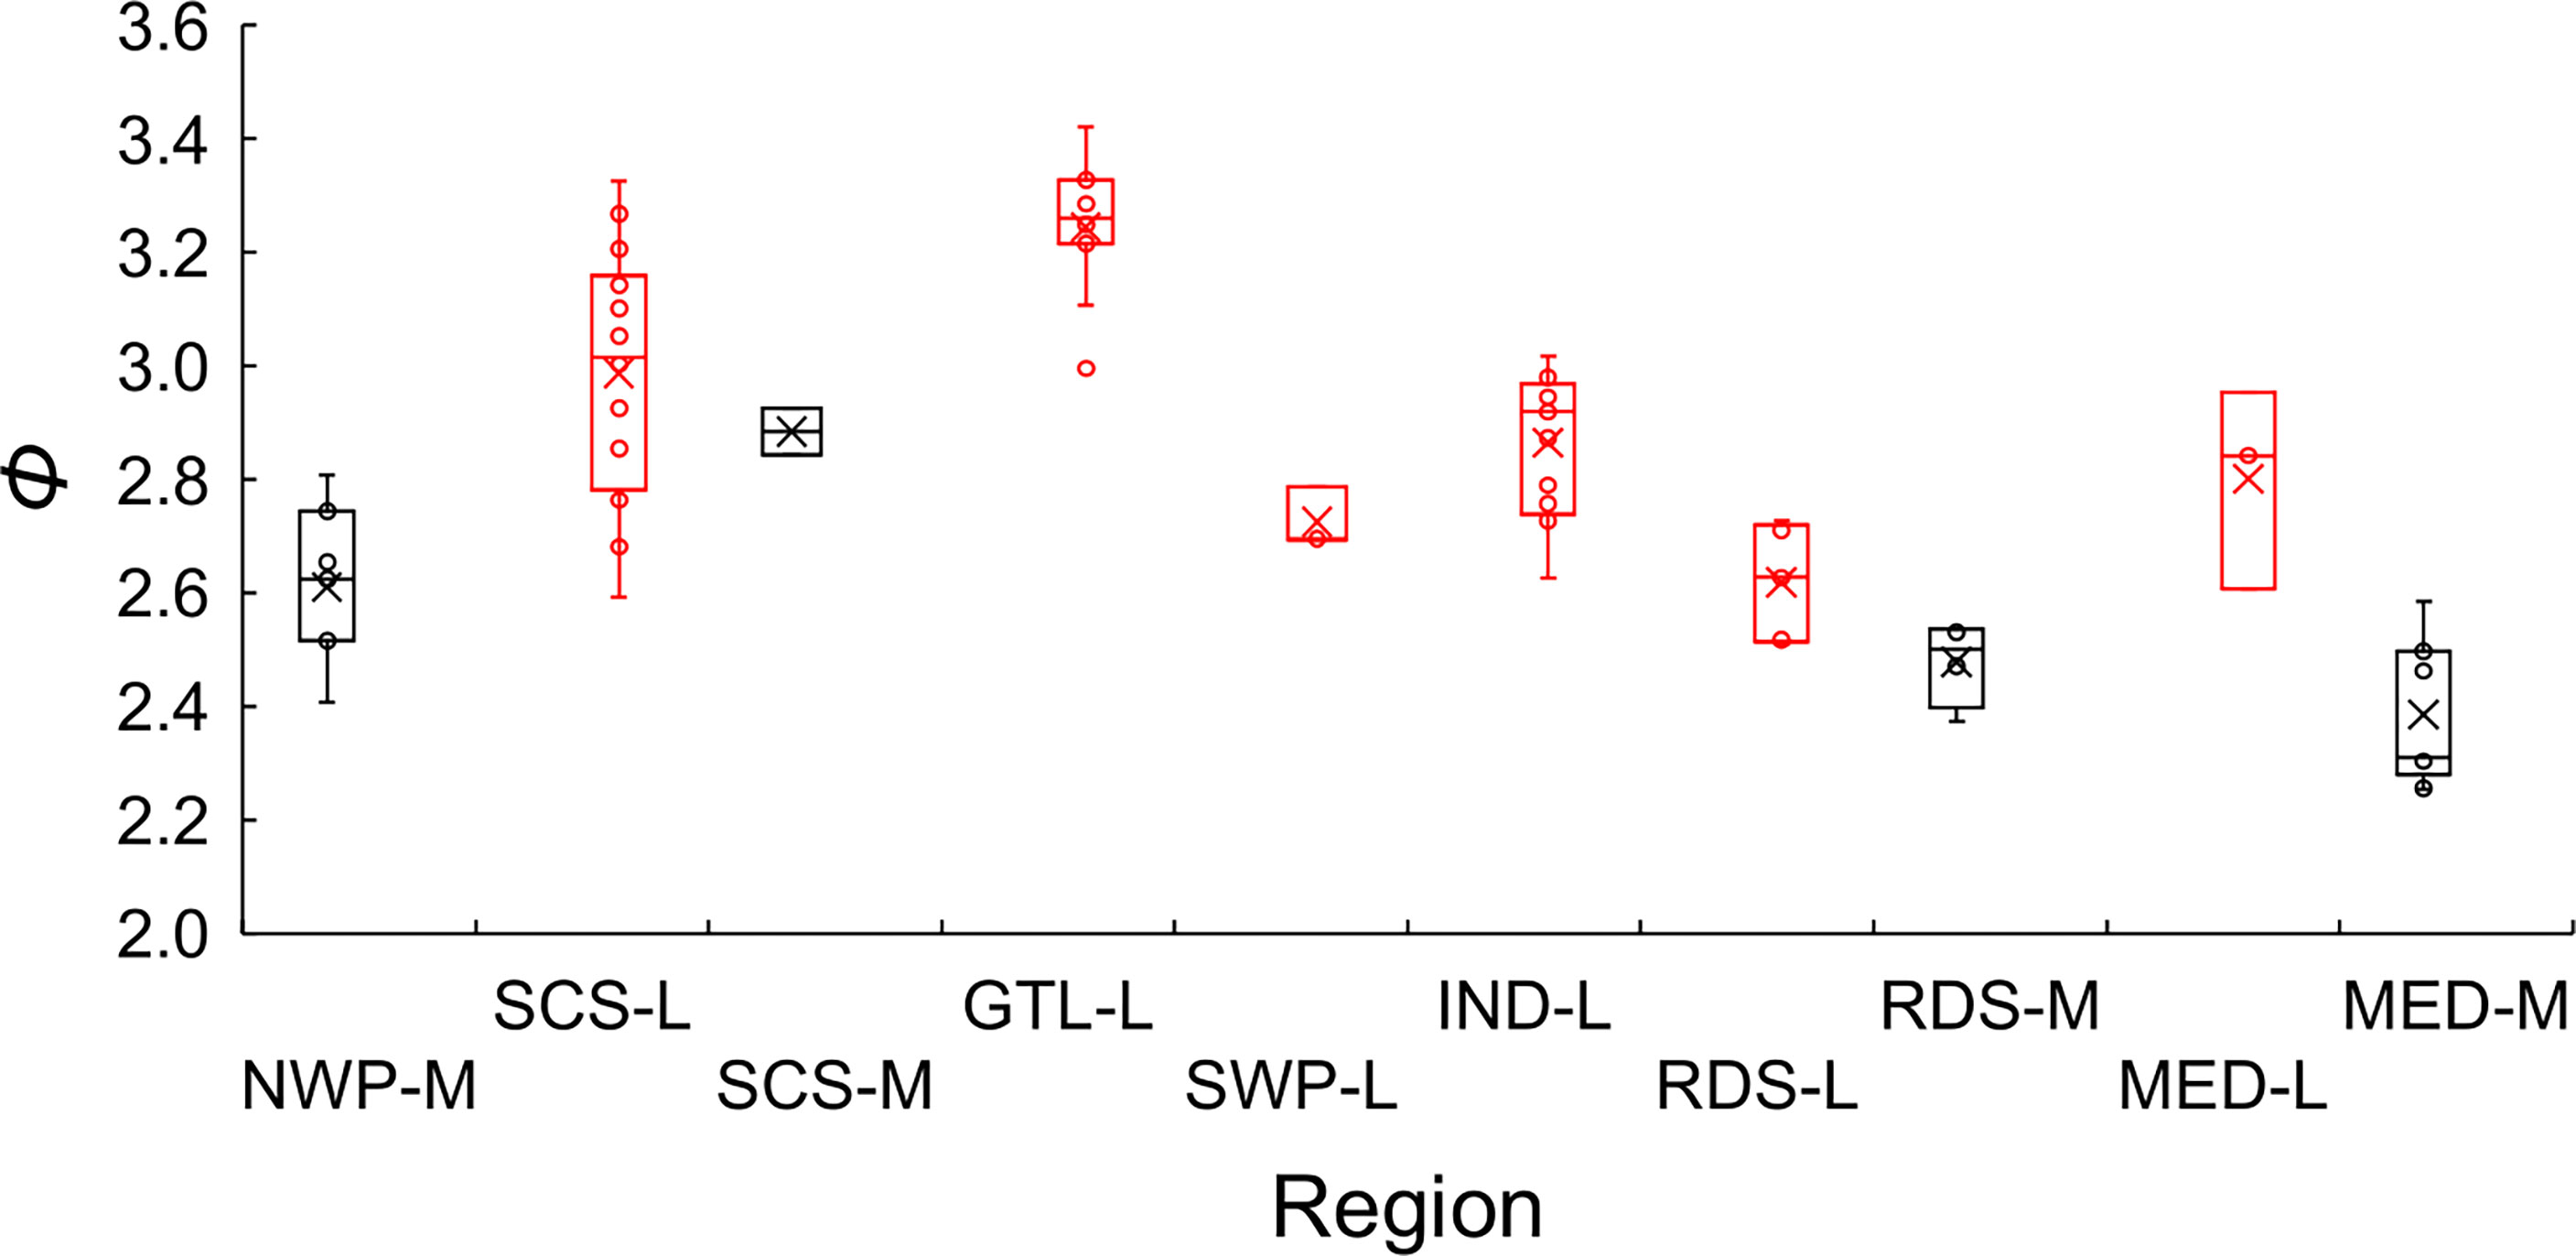
Figure 9 Boxplots of the growth performance index (φ) of global growth parameter estimates for brushtooth lizardfish. NWP stands for the northwestern Pacific, SCS the South China Sea, GTL the Gulf of Thailand, SWP the southwestern Pacific, IND the Indian Ocean, RDS the Red Sea, and MED the Mediterranean Sea. The suffix of M indicates that the hard parts of fish was used as aging material (in black), and L indicates the length frequency data was used (in red). Cross signs in the plot indicate the average.
Figure 9 also shows the statistics of φ by aging materials used, i.e., hard parts of fish and LFD. Estimates of φ from hard parts were lower than those from LFD. This result and the classification result both supported the observation that the estimation material affected estimates of growth performance (Table 2).
Discussion
Length–Weight Relationships
Length-weight relationships (LWRs) can be applied in gonadal developmental studies, feed rate, and maturity condition (Fafioye and Oluajo, 2005) and are commonly used in fisheries science to obtain quantitative biomass measurements to determine the status of fish stocks (Hilborn and Walters, 1992; Morato et al., 2001). In stock assessments they are used for converting between parameters and data in units of estimates in weight, and those measured in length and number. Most age-structured assessments (e.g., Stock Synthesis, Methot and Wetzel, 2013) use number and length in their internal calculations, requiring a length-weight relationship when converting catches in weight into numbers, or stock size in numbers into biomass.
Length-weight relationships differ among fish species depending on the inherited body shape and physiological factors (e.g., spawning), may change seasonally and spatially, and can provide information about the general condition and fitness of the fish in a marine habitat (Schneider et al., 2000; De Giosa et al., 2014; Jisr et al., 2018). The allometric coefficient (b) in this study showed that the growth of weight relative to length was greater than 3 (b = 3.145), suggesting positive allometric growth, i.e., the shape of the fish changes to become less elongated as they grow. The summary table provided in El-Etreby et al. (2013) on previous allometric coefficient estimates shows that in only one of the 12 studies the b was smaller than 3. So, positive allometric growth may be a feature of the species’ ontogeny. Yan et al. (2011) and Hou et al. (2014) commented that this likely results from special features of lizardfishes such as the fact that they feed mainly on fish (98.8%) and continue feeding even during the spawning season, which maintains good nutritional condition. The only case with b<3 was from a study in Turkey which was based on samples only in the fishing season (September to April).
However, estimating a length-weight relationship is not always as simple as it may appear. We found random effects for sample ID to be highly significant in the model, indicating covariation in fish condition within samples. This is likely to cause bias in analyses that do not account for it – indeed, the common equation for LWR estimation diverged significantly from our best estimates. In addition to sampling issues, other factors affect the value of b, such as growth phase, sampling season, degree of stomach fullness, gonad maturity, size range, health, general fish condition and preservation techniques (Tesch, 1971). The slope of the relationship between log(FL) and log(BW) is analogous to the power term b in the standard model. In the full analysis we found some variation in this slope, and differences between males and females. There were also differences between sexes and data sources in the intercept term, which is analogous to the parameter a in the standard model.
These results support the potential of length-weight data to be informative about patterns in the biology and ecology of species. Variation in length-weight relationships by factors such as sex, size, season, and development state has been observed for many species (Froese, 2006). Investigating variation with size requires alternatives to linear models. For example, Finucci et al. (2019) identified change points in length-weight relationships for deep-sea chondrichthyans and linked them to biological factors such as the onset of maturity, ontogenetic diet shifts, and the sizes at which juveniles change habitat. Sestelo and Roca-Pardiñas (2011) used non-parametric smoothers to characterize the length-weight relationship of Pollicipes pollicipes, improving the fit to the data. The GAM models used here can be particularly useful for exploring such data since they have the flexibility to simultaneously account for multiple effects, such as nonlinear smoothers for length and season, categorical effects for sex and source, and random effects to account for sampling structure.
In additional analyses we also found statistically significant slope differences between sources, particularly when survey data were included. These differences did not affect support for including the other parameters but may reflect spatial and temporal variation in length-weight relationships. There is also potential for LWR to vary on longer time scales, and for seasonality to vary spatially and among different size classes. It may be useful to take such variation into account when developing representative LWRs for stock assessment.
Aging Methodology
Otoliths have been used widely for aging many species and have often been shown to be more reliable than other structures (Secor et al., 1995; Hining et al., 2000). However, valid and reliable aging techniques are needed to obtain accurate information from otoliths. In this study we have examined two methodological issues that can lead to aging errors.
The first issue regarded which section to use. Three factors are usually considered when making this decision: the ease of preparing otolith sections, the ease of discriminating increments, and the precision and accuracy of otolith increment counts (Thorrold and Hare, 2002). This study has examined the aging precision of sagittal and transverse sections based on the IAPE and by modeling the probability of reader error. Both sagittal and transverse sections showed distinct annuli, but transverse otolith sections (IAPE = 1.08%) were generally more definite and provided more precise and consistent age estimates (deltaAIC = 2.45, p = 0.05) than those of sagittal sections (IAPE = 3.34%). Previous studies (e.g., Hining et al., 2000; Sakai et al., 2009) have recognized the potential of sagittal sectioning as a more efficient alternative to transverse sectioning because sagittal surfaces were much easier and less costly to prepare. However, Hining et al. (2000) also commented that sagittal sections may underestimate rainbow trout ages due to natural calcium deposition on the sulcus. Atsuchi et al. (2004) found that age estimates from sagittal sections of Paralichthys olivaceus were the same as from transverse sectioning until age 4 years in males and 5 years in females, whereas sagittal sections provided younger age estimates than transverse sections for older age fish when growth slowed. Similarly, our comparison of sagittal and transverse sections showed little difference in either the number of opaque zones or in reading precision before age 4; however, when including older fish samples, readings from both sagittal and transverse sections were more difficult and less reliable, with more errors found with the sagittal sections. Based on comments from the studies cited and the experience of this study, we recommend using transverse sections for age determination, even though they require more time and effort to prepare.
The second methodological issue considered is validation of the periodicity of increment formation. In this study, the periodicity was examined by MI analysis. MI analysis can provide misleading results and Campana (2001) proposed a four stage protocol to make MI analysis valid for age validation: in brief, examine randomized samples, examine two complete cycles, interpret objectively, and restrict to a few age groups at a time. In our study the otolith samples were completely randomized before MI examination without date information attached. The majority of the otoliths (83%) were from age 2–3 fish. The purpose of having at least two complete cycles data is to see whether the interpretation is consistent among years and unambiguous. This study has 16 months data (about one and half sampling cycle), and the annual cycle starting from February or March could be clearly and objectively identified from the MI plot (Figure 5). Therefore, the MI analysis was considered valid for age validation purpose, but it would be useful to extend the analysis with additional months of data. Edge analysis (or marginal analysis) is also a useful age corroboration method and only requires recording the otolith margin type, thus is quite cheap both in terms of equipment and time. The analysis is considered as a complementary method to MI analysis in that edge analysis is a qualitative approach and MI analysis is a quantitative approach (Carbonara et al., 2018). In this regard, additional comparison with edge analysis for verification in the future is recommended (Basilone et al., 2020).
Many other methods can be used for age validation (Campana, 2001), but not all are applicable to the studied species. Most such methods have concerns of high cost, significant risk of failure (e.g., not able to recover enough marked otoliths), or technical infeasibility for a species of moderate commercial value. Modal length progression analysis is an alternative method, but the method involves some assumptions: one spawning period per year, fast growth with age-specific length modes easily discernible, non-overlapping length modes, and without size-selective immigration or emigration to the sampling area (Campana, 2001). Brushtooth lizardfish have one prolonged spawning season (Wu et al., 2014; Mali et al., 2017). Migration has also been reported for a similar species S. elongate whose nursery ground was in a shallow bay but a few adults were caught in the region (Sakai et al., 2009). Thus, the potential for systematic errors could not be avoided for LFD and could affect its representativeness of the true size distribution (Heery and Berkson, 2009).
The MI analysis in this study suggests that rings form annually between the end of winter and the beginning of spring, which is the spawning season for the species in Taiwan: active spawning occurs from February to April (Wu et al., 2014) – the lowest MI period in Figure 5. Ring marks for similar lizardfish (S. elongata) from the Tsushima/Korea Strait have also been found to form once a year during winter months (Sakai et al., 2009) where it was assumed that such seasonal growth cycles may be related to water temperature: the otolith translucent zone was formed during the season when water temperature was cold, and vice versa for the opaque zone. (Their study used reflected light to observe the otolith and so the slow growth accreted otolith material are translucent.) However, in areas where the differences in water temperature are small among seasons, rings may be generated by factors other than water temperature. For example, Budnichenko and Nor (1978) believed that for S. undosquamis and S. tumbil in the Arabian Sea, marks were mainly formed due to physiological changes related to reproduction. Such causes can lead to under-estimation of age if immature fish do not form rings. In addition to these, many other factors have been suggested in the literature, such as food availability (see discussions in Morales-Nin, 2000). Additional studies combining field and laboratory experiments are needed to understand the factors associated with otolith ring formation for lizardfish.
Growth Parameter Estimation
One of the main purposes of deriving growth models from length-at-age data is to estimate growth curves for stock assessment. Among the various growth models, VBGM has been the most widely used. However, “the VBGM, when used for inference, without being the best model could cause biased point estimation and false evaluation of precision of growth parameters” (Katsanevakis, 2006). Fitting more than one model to the data and then using a suitable criterion for model selection are increasingly suggested and practiced (Katsanevakis and Maravelias, 2008). Four models were computed in this study and the results indicate that only VBGM has substantial support from the data with, for the sex-combined case, AICc differences < 2 and Akaike weight w = 97%, suggesting VBGM is the best model for brushtooth lizardfish. This meets the suggestion by Burnham and Anderson (2002) that the best model should have w value greater than 80%. The maximum fish collected from this area was about 50 cm FL. From the relationship of maximum length and asymptotic length that developed based on 551 estimates from FishBase database (Froese and Binohlan, 2000), the estimated L∞ was about 49 cm. Which suggested the estimate of this study (46.4 cm) was biologically more reasonable than the other models in Table 4 whose estimates were all smaller than 40 cm.
Fitting of the sex-specific data also supported VBGM. The VBGMs of male and female fish were significantly different (ANCOVA, p<0.01); females have a higher K and L∞ than males. The conclusion that females grow to a larger body length was consistent with all studies in Table 1, but the conclusion about K was not. Half of the studies in Table 1 showed the male had a higher K (e.g., records 16, 37, 44, 45) while the others found that the females could grow faster or at the same rate. The reason for such differences is unknown, but it could be owing to differences in habitat or aging materials. Similar phenomena were also found in other Saurida spp (Yoneda et al., 2002; Sakai et al., 2009).
Variations in Global Estimates
A wide range of growth parameters was noted from global studies on the growth of brushtooth lizardfish, with L∞ and K varying in the ranges of 22.4–68.5 cm and 0.1–2.34 year-1, respectively. This variation could be contributed to by many factors including study design (sample size, fish size, sampling period), variability in the age-determination process (aging material, preparation method, reader bias), and environmental factors (geographical difference in food availability, temperature, or exploitation level) (Kimura and Lyons, 1991; Chang and Maunder, 2012; Wang et al., 2020; Hsu et al., 2021). Due to limited data availability, only three factors (variables) could be drawn from the 86 estimates for the classification analysis: aging material used, sex of fish and region.
Region appeared to play the most important role in the variation of growth performance with highest Gini coefficient (Figure 8 and Supplementary Figure S3). The variation could likely be explained by geographic variability, and availability and competition for food (Wright et al., 1989; Yoneda et al., 2002; Cicek et al., 2006; Kadharsha et al., 2014). The growth performance index φ of stocks in the SCS and Gulf of Thailand were higher than other regions (mean = 3.07, versus 2.68 for other regions). Growth performance indices in the coastal Arabian Sea were also high, which might be due to the monsoon and upwelling in the region replenishing nutrients and causing a plankton bloom, thereby providing a favorable reproductive regime for pelagic fishes (Ghosh et al., 2014).
Aging material was also an important cause of variation in φ of global estimates (Supplementary Figure 3), as has been demonstrated in previous studies for other species (Chang and Maunder, 2012; Chang et al., 2022). The classification approach statistically separated the studies into different groups associated with the aging materials used (Cluster 1 against Clusters 2 and 3). In general, Cluster 1 contains studies using hard structure as aging material and Clusters 2 and 3 using LFD; while the growth rates of Cluster 2 are smaller than those of Cluster 3. The φ was generally smaller for the studies using hard structure as aging materials than those using LFD, which could be demonstrated in Figure 9 for the studies in the same region (i.e., SCS-M versus SCS-L, RDS-M versus RDS-L, and MED-M versus MED-L). There were a few exceptions to this general observation for each cluster, but they do not invalidate the general point that, if the validated otolith-based estimates are reliable, the differences appear to indicate a tendency for bias by LFD-based methods.
Many kinds of aging material were used in the global estimates. LFD is commonly used to estimate growth parameters for the species (Table 1), which takes advantage of the data type most often available (length), and which can provide good growth rate estimates for fast-growing fish (Quinn and Deriso, 1999; Heery and Berkson, 2009). However, to make the method valid for growth estimation, the assumptions mentioned by Campana (2001) (see Section 4.2) should be considered and reviewed, otherwise the quality of estimation might be of concern (Heery and Berkson, 2009). Scales were also used (Table 1) but may be unreliable. The percentage agreement between scales and vertebrae decreases when aging older fish, and it has been suggested that the scale is less dependable for aging lizardfish (Lee et al., 1986). In our study we also tested and found that scales from different parts of fish showed different patterns of ring marks. Such difficulties in age determination using scales have been observed in other Saurida spp (Tatara, 1953; Hamada, 1986; Yoneda et al., 2002). Vertebrae have also been used in aging lizardfish (Table 1), but generally do not reveal clear concentric ring marks, such as the case from the northwestern Bay of Bengal (Rao, 1984).
Sagittae are generally considered the most suitable hard structure for age determination of fish (Beamish and McFarlane, 1983; Baker and Timmons, 1991; Lowerre-Barbieri et al., 1994; Yoneda et al., 2002). This study shows that the polished transverse section of otolith of brushtooth lizardfish provides a relatively low disagreement rate and recommends that the polished thin sections of otoliths are a dependable material with which to age the species.
Data Availability Statement
The original contributions presented in the study are included in the article/Supplementary Material. Further inquiries can be directed to the corresponding author.
Ethics Statement
Ethical review and approval was not required for the animal study because the samples were collected from fish market.
Author Contributions
S-KC: conceptualization, funding acquisition, data analyses design, manuscript writing and review; Y-TC: data collection, otoliths process and reading, manuscript writing and review; SH: LWR analyses design and computations, manuscript review and editing. All authors contributed to the article and approved the submitted version.
Funding
This research was partially funded by the Ministry of Science and Technology of Taiwan, grant number NSC 101-2611-M-110-013, and partially by the Fisheries Agency, COA of Taiwan, grant number 101AS-11.2.1-FA-F1(2). The open access publication fee for this article is supported by the Ministry of Science and Technology of Taiwan.
Conflict of Interest
The authors declare that the research was conducted in the absence of any commercial or financial relationships that could be construed as a potential conflict of interest.
Publisher’s Note
All claims expressed in this article are solely those of the authors and do not necessarily represent those of their affiliated organizations, or those of the publisher, the editors and the reviewers. Any product that may be evaluated in this article, or claim that may be made by its manufacturer, is not guaranteed or endorsed by the publisher.
Acknowledgments
Part of the results in the paper was from the master thesis of the coauthor Yuan-Tian Chou. We appreciate very much the supports and contributions from Drs. Hsin-Ming Yeh, Lung-Ching Wu, and Jinn-Shing Weng of the Fisheries Research Institute, COA, as well as the efforts of statistical analyses and literature compilation from Bing-Jing Lu and Donna Ross Saycon. Constructive comments from Dr. Richard Saunders and the three reviewers are also much appreciated.
Supplementary Material
The Supplementary Material for this article can be found online at: https://www.frontiersin.org/articles/10.3389/fmars.2022.921594/full#supplementary-material
Supplementary Figure 1 | Sample image of transverse and sagittal sections of otolith.
Supplementary Figure 2 | Scree plot (within-clusters sum of squares) of the hierarchical clustering analysis.
Supplementary Figure 3 | Variable importance plot using the mean decrease in Gini coefficient.
Supplementary Table 1 | Global estimates of growth parameters of brushtooth lizardfish from the literature. Lengths are in the unit of cm, K in year-1, and to in year.
Supplementary Table 2 | Length (cm, FL) and body weight (g), by sex, of brushtooth lizardfish samples off southwestern Taiwan.
References
Agency Fisheries (2021). Fisheries Statistical Yearbook - Taiwan, Kinmen and Matsu Are (Taipei: Fisheries Agency, Council of Agriculture).
Akaike H. (1973). “Information Theory and an Extension of the Maximum Likelihood Principle,” in 2nd International Symposium on Information Theory, Tsahkadsor, Armenia, USSR, September 2-8, 1971, vol. I . Eds. Kotz S., Johnson N. L., Petrov B. N., Csáki F. (Tsahkadsor, Armenia, USSR: Budapest: Akadémiai Kiadó, 267–281.
Atsuchi S., Masuda Y., Akamo H., Iori K. (2004). Age and Growth of Japanese Flounder Paralichthys Olivaceus From the Coastal Waters Around Kagoshima Prefecture, Japan, Using Transverse Sections of Otoliths. Nippon. Suisan. Gakkaishi. 70, 714–721. doi: 10.2331/suisan.70.714
Baker T. T., Timmons L. S. (1991). Precision of Ages Estimated From Five Bony Structures of Arctic Char (Salvelinus Alpinus) From the Wood River System, Alaska. Can. J. Fish. Aquat. Sci. 48, 1007–1014. doi: 10.1139/f91-118
Basilone G., Barra M., Ferreri R., Mangano S., Pulizzi M., Giacalone G., et al. (2020). First Annulus Formation in the European Anchovy; a Two-Stage Approach for Robust Validation. Sci. Rep. 10, 1079. doi: 10.1038/s41598-020-58174-5
Beamish R., Fournier D. (1981). A Method for Comparing the Precision of a Set of Age Determinations. Can. J. Fish. Aquat. Sci. 38, 982–983. doi: 10.1139/F81-132
Beamish R. J., McFarlane G. A. (1983). The Forgotten Requirement for Age Validation in Fisheries Biology. Trans. Am. Fish. Soc 112, 735–743. doi: 10.1577/1548-8659(1983)112<735:TFRFAV>2.0.CO;2
Boehmke B., Greenwell B. M. (2019) Hands-On Machine Learning With R (Chapman and Hall/CRC). Available at: https://bradleyboehmke.github.io/HOML/ (Accessed June 5, 2021).
Budnichenko V., Nor L. (1978). Some Features of the Growth of Saurida Undosquamis and Saurida Tumbil (Pisces Synodontidae) in the Arabian Sea. J Ichthyol. 18, 750–755. Available at: https://www.sid.ir/en/Journal/ViewPaper.aspx?ID=190730
Burnham K. P., Anderson D. R. (2002). Model Selection and Multimodel Inference: A Practical Information-Theoretic Approach. 2nd ed (New York: Springer-Verlag). doi: 10.1007/b97636
Campana S. E. (2001). Accuracy, Precision and Quality Control in Age Determination, Including a Review of the Use and Abuse of Age Validation Methods. J. Fish Biol. 59, 197–242. doi: 10.1111/j.1095-8649.2001.tb00127.x
Carbonara P., Bellodi A., Palmisano M., Mulas A., Porcu C., Zupa W., et al. (2020). Growth and Age Validation of the Thornback Ray (Raja Clavata Linnaeus 1758) in the South Adriatic Sea (Central Mediterranean). Front. Mar. Sci. 7. doi: 10.3389/fmars.2020.586094
Carbonara P., Intini S., Kolitari J., Joksimović A., Milone N., Lembo G., et al. (2018). A Holistic Approach to the Age Validation of Mullus Barbatus L 1758 in the Southern Adriatic Sea (Central Mediterranean). Sci. Rep. 8, 13219. doi: 10.1038/s41598-018-30872-1
Chang S.-K., DiNardo G., Farley J., Brodziak J., Yuan Z.-L. (2013). Possible Stock Structure of Dolphinfish (Coryphaena Hippurus) in Taiwan Coastal Waters and Globally Based on Reviews of Growth Parameters. Fish. Res. 147, 127–136. doi: 10.1016/j.fishres.2013.05.003
Chang S.-K., Maunder M. N. (2012). Aging Material Matters in the Estimation of Von Bertalanffy Growth Parameters for Dolphinfish (Coryphaena Hippurus). Fish. Res. 119–120, 147–153. doi: 10.1016/j.fishres.2012.01.008
Chang S.-K., Yuan T.-L., Hoyle S. D., Farley J. H., Shiao J.-C. (2022). Growth Parameters and Spawning Season Estimation of Four Important Flyingfishes in the Kuroshio Current Off Taiwan and Implications From Comparisons With Global Studies. Front. Mar. Sci. 8, 1930. doi: 10.3389/fmars.2021.747382
Chilton D. E., Beamish R. J. (1982). Age Determination Methods for Fishes Studied by the Groundfish Program at the Pacific Biological Station (Ottawa: Department of Fisheries and Oceans).
Cicek E., Avsar D., Yeldan H., Ozutok M. (2006). Length–weight Relationships for 31 Teleost Fishes Caught by Bottom Trawl Net in the Babadillimani Bight (Northeastern Mediterranean). J. Appl. Ichthyol. 22, 290–292. doi: 10.1111/j.1439-0426.2006.00755.x
De Giosa M., Czerniejewski P., Rybczyk A. (2014). Seasonal Changes in Condition Factor and Weight-Length Relationship of Invasive Carassius Gibelio (Bloch 1782) From Leszczynskie Lakeland, Poland. Adv. Zool. 2014, 678763. doi: 10.1155/2014/678763
Dos Santos N. C. L., de Santana H. S., Ortega J. C. G., Dias R. M., Stegmann L. F., da Silva Araujo I. M., et al. (2017). Environmental Filters Predict the Trait Composition of Fish Communities in Reservoir Cascades. Hydrobiologia 802, 245–253. doi: 10.1007/s10750-017-3274-4
Eero M., Hjelm J., Behrens J., Buchmann K., Cardinale M., Casini M., et al. (2015). Eastern Baltic Cod in Distress: Biological Changes and Challenges for Stock Assessment. ICES J. Mar. Sci. 72, 2180–2186. doi: 10.1093/icesjms/fsv109
El-Etreby S. G., El-Ganainy A. A., Saber M. A., El-Alwany M. A., El-Bokhty A. A. (2013). Age, Growth and Reproduction of the Lizard Fish Saurida Undosquamis From the Gulf of Suez, Red Sea, Egypt. Egypt. J. Aquat. Biol. Fish. 17, 25–34. doi: 10.12816/0011059
Fafioye O. O., Oluajo O. A. (2005). Length-Weight Relationships of Five Fish Species in Epe Lagoon, Nigeria. Afr. J. Biotechnol. 4, 749–751. doi: 10.4314/ajb.v4i7.15177
FAO (2017). CWP Handbook of Fishery Statistical Standards. Section B: Catch and Landings. CWP Data Collection (Rome: FAO Fisheries and Aquaculture Department).
Finucci B., Dunn M. R., Arnold R. (2019). Using Length–Mass Relationships to Estimate Life History: An Application to Deep-Sea Fishes. Can. J. Fish. Aquat. Sci. 76, 723–739. doi: 10.1139/cjfas-2018-0017
Fisheries and Oceans Canada (2019) Bomb Radiocarbon Otolith Ageing. Available at: https://www.dfo-mpo.gc.ca/science/species-especes/otoliths/scientists/bomb-eng.html (Accessed February 21, 2022).
Flinn S. A., Midway S. R. (2021). Trends in Growth Modeling in Fisheries Science. Fishes 6, 1. doi: 10.3390/fishes6010001
Froese R. (2006). Cube Law, Condition Factor and Weight–Length Relationships: History, Meta-Analysis and Recommendations. J. Appl. Ichthyol. 22, 241–253. doi: 10.1111/j.1439-0426.2006.00805.x
Froese R., Binohlan C. (2000). Empirical Relationships to Estimate Asymptotic Length, Length at First Maturity and Length at Maximum Yield Per Recruit in Fishes, With a Simple Method to Evaluate Length Frequency Data. J. Fish Biol. 56, 758–773. doi: 10.1111/j.1095-8649.2000.tb00870.x
Froese R., Pauly D. (Eds.) (2021). Fishbase (world wide web electronic publication). Available at: www.fishbase.org.
Ghosh S., Rao M., Rohit P., Rammohan K., Maheswarudu G. (2014). Reproductive Biology, Trophodynamics and Stock Structure of Ribbonfish Trichiurus Lepturus From Northern Arabian Sea and Northern Bay of Bengal. Indian J. Geo-Mar. Sci. 43, 755–771. Available at: http://nopr.niscair.res.in/bitstream/123456789/28762/4/IJMS%2043%285%29%20755-771.pdf
Gokce G., Sangun L., Ozbilgin H., Bilecenoglu M. (2007). Growth and Mortality of the Brushtooth lizardfishes (Saurida Undosquamis) in Iskenderun Bay (Eastern Mediterranean Sea) Using Length Frequency Analysis. J. Appl. Ichthyol., 23, 697–699. doi: 10.1111/j.1439-0426.2007.00910.x
Gompertz B. (1825). On the Nature of the Function Expressive of the Law of Human Mortality, and on a New Mode of Determining the Value of Life Contingencies. Philos. Trans. R Soc. Lond. 115, 513–583. doi: 10.1098/rstl.1825.0026
Hamada R. (1986). Age and Growth of the Lizard fish, Saurida Wanieso (Shindo and Yamada), in the East China Sea. Bull. Seikai. Reg. Fish. Res. Lab. 63, 49–59.doi: 10.1016/S0165-7836(01)00285-5
Heery E. C., Berkson J. (2009). Systematic Errors in Length Frequency Data and Their Effect on Age-Structured Stock Assessment Models and Management. Trans. Am. Fish. Soc 138, 218–232. doi: 10.1577/t07-226.1
Hilborn R., Walters C. J. (1992). Quantitative Fisheries Stock Assessment: Choice, Dynamics and Uncertainty (New York: Chapman and Hall).
Hining K., West J., Kulp M., Neubauer A. (2000). Validation of Scales and Otoliths for Estimating Age of Rainbow Trout From Southern Appalachian Streams. North Am. J. Fish. Manage. 20, 978–985. doi: 10.1577/1548-8675(2000)020<0978:VOSAOF>2.0.CO;2
Hou G., Liu J.-D., Feng B., Yan Y.-R., Lu H.-S. (2014). Applying Multi-Model Inference to Estimate Growth Parameters of Greater Lizard Fish Saurida tumbil in Beibu Gulf, South China Sea. Chin. J. Appl. Ecol. 25, 843–849. doi: 10.13287/j.1001-9332.2013.0010
Hsu J., Chang Y.-J., Kitakado T., Kai M., Li B., Hashimoto M., et al. (2021). Evaluating the Spatiotemporal Dynamics of Pacific Saury in the Northwestern Pacific Ocean by Using a Geostatistical Modelling Approach. Fish. Res. 235, 105821. doi: 10.1016/j.fishres.2020.105821
Hüssy K., Radtke K., Plikshs M., Oeberst R., Baranova T., Krumme U., et al. (2016). Challenging ICES Age Estimation Protocols: Lessons Learned From the Eastern Baltic Cod Stock. ICES J. Mar. Sci. 73, 2138–2149. doi: 10.1093/icesjms/fsw107
Iglesias M., Brothers E. B., Morales-Nin B. (1997). Validation of Daily Increment Deposition in Otoliths. Age and Growth Determination of Aphia Minuta (Pisces: Gobiidae) From the Northwest Mediterranean. Mar. Biol. 129, 279–287. doi: 10.1007/s002270050168
Inoue T., Nakabo T. (2006). The Saurida Undosquamis Group (Aulopiformes: Synodontidae), With Description of a New Species From Southern Japan. Ichthyol. Res. 53, 379–397. doi: 10.1007/s10228-006-0358-y
Jisr N., Younes G., Sukhn C., El-Dakdouki M. H. (2018). Length-Weight Relationships and Relative Condition Factor of Fish Inhabiting the Marine Area of the Eastern Mediterranean City, Tripoli-Lebanon. Egypt. J. Aquat. Res. 44, 299–305. doi: 10.1016/j.ejar.2018.11.004
Kadharsha K., Mohanchander P., Lyla P. S., Khan s. A. (2014). Age and Growth of Brushtooth Lizard Fish Saurida Undosquamis (Richardson 1848) Occurring in Parangipettai Southeast Coast of India. Indian J. Geo-Mar. Sci. IJMS 43, 1799–1803. doi: 10.3923/pjbs.2013.1479.1487
Karlson S., Michalsen K., Folkvord A. (2013). Age Determination of Atlantic Halibut (Hippoglossus Hippoglossus L.) Along the Coast of Norway: Status and Improvements. ICES J. Mar. Sci. 70, 50–55. doi: 10.1093/icesjms/fss174
Kassambara A. (2017). Practical Guide to Cluster Analysis in R: Unsupervised Machine Learning. Edition 1 (Marseille, France: STHDA-Statistical Tools for High-Throughput Data Analysis).
Kastelle C., Helser T., TenBrink T., Hutchinson C., Goetz B., Gburski C., et al. (2020). Age Validation of Four Rockfishes (Genera Sebastes and Sebastolobus) With Bomb-Produced Radiocarbon. Mar. Freshw. Res. 71, 1355–1366. doi: 10.1071/MF19280
Katsanevakis S. (2006). Modelling Fish Growth: Model Selection, Multi-Model Inference and Model Selection Uncertainty. Fish. Res. 81, 229–235. doi: 10.1016/J.FISHRES.2006.07.002
Katsanevakis S., Maravelias C. D. (2008). Modelling Fish Growth: Multi-Model Inference as a Better Alternative to a Priori Using Von Bertalanffy Equation. Fish Fish. 9, 178–187. doi: 10.1111/j.1467-2979.2008.00279.x
Kimura D. K., Lyons J. J. (1991). Between-Reader Bias and Variability in the Age-Determination Process. Fish. Bull. 89, 53–60.
King M. (2007). Fisheries Biology, Assessment and Management. 2nd ed (Oxford: Blackwell Publishing).
Lee Y.-C., Yeh S.-Y. (1989). Age Determination by Using Scale Ring-Reading for the Lizard Fish, Saurida Undosquamis, From the Southern Taiwan Strait. Acta Oceanogr. Taiwanica 23, 63–73. doi: 10.29822/JFST.199703.0008
Lee Y.-C., Yeh S.-Y., Liu H.-C. (1986). Age and Growth of Lizard Fish, Saurida Undosquamis, in the Southern Part of the Taiwan Strait. Acta Oceanogr. Taiwanica 17, 105–118. doi: 10.1007/s00338-009-0489-5
Lemberget T., McCormick M., Wilson D. (2009). Environmental Influences on the Replenishment of Lizardfish (Family Synodontidae) in Caribbean Panama. Coral. Reefs. 28, 737–750. doi: 10.1007/s00338-009-0489-5
Lessa R., Santana F. M., Duarte-Neto P. (2006). A Critical Appraisal of Marginal Increment Analysis for Assessing Temporal Periodicity in Band Formation Among Tropical Sharks. Environ. Biol. Fishes. 77, 309–315. doi: 10.1007/s10641-006-9111-7
Lowerre-Barbieri S. K., Chittenden M. E. Jr., Jones C. M. (1994). A Comparison of a Validated Otolith Method to Age Weakfish, Cynoscion Regalis, With the Traditional Scale Method. Fish. Bull. 92, 555–568.
Mali K. S., Kumar M., Farejiya M., Rama Rao K., Bhargava A. (2017). Reproductive Biology of Saurida Tumbil (Bloch 1795) and Saurida Undosquamis (Richardson 1848) Inhabiting North West Coast of India. Int. J. Pure. Appl. Biosci. 5, 957–964. doi: 10.18782/2320-7051.6080
Marra G., Wood S. N. (2011). Practical Variable Selection for Generalized Additive Models. Comput. Stat. Data Anal. 55, 2372–2387. doi: 10.1016/j.csda.2011.02.004
Martinez-Taboada F., Redondo J. I. (2020). The SIESTA (SEAAV Integrated Evaluation Sedation Tool for Anaesthesia) Project: Initial Development of a Multifactorial Sedation Assessment Tool for Dogs. PLos One 15, e0230799. doi: 10.1371/journal.pone.0230799
Maunder M. N., Crone P. R., Punt A. E., Valero J. L., Semmens B. X. (2016). Growth: Theory, Estimation, and Application in Fishery Stock Assessment Models. Fish. Res. 180, 1–3. doi: 10.1016/j.fishres.2016.03.005
Maunder M. N., Piner K. R. (2015). Contemporary Fisheries Stock Assessment: Many Issues Still Remain. ICES J. Mar. Sci. 72, 7–18. doi: 10.1093/icesjms/fsu015
Mazerolle M. J.. (2020). AICcmodavg: Model Selection and Multimodel Inference Based on (Q)AIC(c). R Package Version 1. 8–32. Available at: https://cran.r-project.org/package=AICcmodavg.
Mehanna S. F., Farouk A. E. (2021). Length-Weight Relationship of 60 Fish Species From the Eastern Mediterranean Sea, Egypt (Gfcm-Gsa 26). Front. Mar. Sci. 8. doi: 10.3389/fmars.2021.625422
Menze B. H., Kelm B. M., Masuch R., Himmerlreich U., Bachert P., Petrich W., et al. (2009). A Comparison of Random Forest and Its Gini importance with Standard Chemometric Methods for the Feature Selection and Classification of Spectral Data. BMC Bioinformatics 10 (1) 213. doi: 10.1186/1471-2105-10-213
Methot R. D. Jr, Wetzel C. R. (2013). Stock Synthesis: A Biological and Statistical Framework for Fish Stock Assessment and Fishery Management. Fish. Res. 142, 86–99. doi: 10.1016/j.fishres.2012.10.012
Morales-Nin B. (2000). Review of the Growth Regulation Processes of Otolith Daily Increment Formation. Fish. Res. 46, 53–67. doi: 10.1016/S0165-7836(00)00133-8
Morato T., Afonso P., Lourinho P., Barreiros J. P., Santos R. S., Nash R. (2001). Length–weight Relationships for 21 Coastal Fish Species of the Azores, North-Eastern Atlantic. Fish. Res. 50, 297–302.
Parr R. T., Bringolf R. B., Jennings C. A. (2018). Efficacy of Otoliths and First Dorsal Spines for Preliminary Age and Growth Determination in Atlantic Tripletails. Mar. Coast. Fish. 10, 71–79. doi: 10.1002/mcf2.10008
Pauly D., Munro J. L. (1984). Once More on the Comparison of Growth in Fish and Invertebrates. Fishbyte 2, 21.
Rao K. V. (1984). Age and Growth of Lizardfishes (Saurida Spp.) From the Northwestern Bay of Bengal. Indian J. Fish. 31, 19–30.
R-Development Core Team (2021). R: A Language and Environment for Statistical Computing (Vienna, Austria: R Foundation for Statistical Computing).
Richards F. J. (1959). A Flexible Growth Function for Empirical Use. J. Exp. Bot. 10, 290–301. doi: 10.1093/jxb/10.2.290
Ricker W. E. (1975). Computation and Interpretation of Biological Statistics of Fish Populations. Bull. Fish. Res. Board. Can. 191, 1–382. doi: 10.1086/409405
Roff D. A. (1980). A Motion for the Retirement of the Von Bertalanffy Function. Can. J. Fish. Aquat. Sci. 37, 127–129. doi: 10.1139/f80-016
Sakai T., Yoneda M., Shiraishi T., Tokimura M., Horikawa H., Matsuyama M. (2009). Age and Growth of the Lizardfish Saurida Elongata From the Tsushima/Korea Strait. Fish. Sci. 75, 895–902. doi: 10.1007/s12562-009-0108-y
Schneider J. C., Laarman P. W., Gowing H. (2000). “Length-Weight Relationships. Chapter 17,” in Manual of Fisheries Survey Methods II: With Periodic Updates, Michigan Department of Natural Resources, vol. 25) . Ed. Schneider J. C.(Ann Arbor: Fisheries Special Report), 1–18.
Schwenke K. L., Buckel J. A. (2008). Age, Growth, and Reproduction of Dolphinfish (Coryphaena Hippurus) Caught Off the Coast of North Carolina. Fish. Bull. 106, 82–92. doi: 10.2307/1442132
Secor D. H., Dean J. M., Campana S. E. (1995). Recent Developments in Fish Otolith Research. The Belle W. Baruch Library in Marine Science No. 19. Colombia: University of South Carolina.
Sestelo M., Roca-Pardiñas J. (2011). A New Approach to Estimation of the Length—Weight Relationship of Pollicipes Pollicipes (Gmelin 1789) on the Atlantic Coast of Galicia (Northwest Spain): Some Aspects of its Biology and Management. J. Shellfish. Res. 30, 939–948. doi: 10.2983/035.030.0336
Sinovcic G., Franičević M., Zorica B., Čikeš-Keč V. (2004). Length–weight and Length–Length Relationships for 10 Pelagic Fish Species From the Adriatic Sea (Croatia). J. Appl. Ichthyol. 20, 156–158. doi: 10.1046/j.1439-0426.2003.00519.x
Sparre P., Venema S. C. (1992). Introduction to Tropical Fish Stock Assessment. Part. 1. Manual (Rome: FAO). FAO Fish. Tech. Paper No. 306.1, Rev. 1.
Sweatman H. P. A. (1984). A Field Study of the Predatory Behavior and Feeding Rate of a Piscivorous Coral Reef Fish, the Lizardfish Synodus Englemani. Copeia 1984, 187–194. doi: 10.2307/1445051
Tatara K. (1953). Fisheries Biology of Saurida Spp. In the Kii Channel. III. Bull. Nankai. Reg. Fish. Res. Lab. 4, 48–60.
Tesch F. W. (1971) Age and growth. In Ricker W.E. (ed.) Methods for Assessment of Fish Production in Fresh Waters. Oxford: Blackwell Scientific Publications, pp. 99–130.
The Campana lab (2022)Age Validation. Available at: https://uni.hi.is/scampana?s=age+validation&x=0&y=0.
Thorrold S. R., Hare J. A. (2002). ““Otolith Applications in Reef Fish Ecology,”,” in Coral Reef Fishes: Dynamics and Diversity in a Complex Ecosystem. Ed. Sale P. F. (San Diego, CA: Academic Press), 243–264.
Wang J.-Y., Kuo T.-C., Hsieh C. (2020). Causal Effects of Population Dynamics and Environmental Changes on Spatial Variability of Marine Fishes. Nat. Commun. 11, 2635. doi: 10.1038/s41467-020-16456-6
Ward J. H. (1963). Hierarchical Grouping to Optimize an Objective Function. J. Am. Stat. Assoc. 58, 236–244. doi: 10.1080/01621459.1963.10500845
Williams A. J., Farley J. H., Hoyle S. D., Davies C. R., Nicol s. J. (2012). Spatial and Sex-Specific Variation in Growth of Albacore Tuna (Thunnus Alalunga) Across the South Pacific Ocean. PLos One 7, e39318. doi: 10.1371/journal.pone.0039318
Wood S. N. (2006). Generalized Additive Models: An Introduction with R. Boca Raton, Florida: Chapman and Hall/CRC.
Wood S., Wood M. (2020). Mixed GAM Computation Vehicle with Automatic Smoothness Estimation (Package ‘mgcv’). R package version 1. 8–32. Available at: https://cran.uib.no/web/packages/mgcv/mgcv.pdf.
Wright P., Willoughby N., Edwards A. (1989). Growth, Size and Age Composition of Stolephorus heterolobus in North Central Java. in Tuna Bait Fish in the Indo-Pacific Region. ACIAR Proceedings. 30, 141–146.
Wu C.-C., Huang J.-Z., Weng J.-S., Wu L.-J. (2014). Reproductive Biology of the Brushtooth Lizardfish, Saurida Undosquamis, in the Waters Off Southwestern Taiwan. J. Taiwan Fish. Res. 22, 23–41.
Yan Y.-R., Wang T.-T., Hou G., Lu H.-S., Jin X.-S. (2011). Feeding Habits and Monthly and Ontogenetic Diet Shifts of the Greater Lizardfish Saurida Tumbil in the Beibu Gulf of the South China Sea. J. Fish. China 34, 1089–1098. doi: 10.3724/SP.J.1231.2010.06877
YediEr S., Kontas S., Bostanci D. (2020). Length-Length and Length-Weight Relationships of Lessepsian Saurida Undosquamis from the Iskenderun Bay (Eastern Mediterranean, Turkey). J. Inst. Sci. Technol. 616–623. doi: 10.21597/jist.551092
Keywords: transverse section, marginal increment analysis, growth performance index, aging material, multi-model inference approach, aging precision
Citation: Chang S-K, Chou Y-T and Hoyle SD (2022) Length-Weight Relationships and Otolith-Based Growth Curves for Brushtooth Lizardfish off Taiwan With Observations of Region and Aging–Material Effects on Global Growth Estimates. Front. Mar. Sci. 9:921594. doi: 10.3389/fmars.2022.921594
Received: 16 April 2022; Accepted: 30 May 2022;
Published: 07 July 2022.
Edited by:
Gualtiero Basilone, National Research Council (CNR), ItalyReviewed by:
Andrea Bellodi, University of Cagliari, ItalyRosalia Ferreri, National Research Council (CNR), Italy
Pierluigi Carbonara, COISPA Tecnologia & Ricerca, Italy
Copyright © 2022 Chang, Chou and Hoyle. This is an open-access article distributed under the terms of the Creative Commons Attribution License (CC BY). The use, distribution or reproduction in other forums is permitted, provided the original author(s) and the copyright owner(s) are credited and that the original publication in this journal is cited, in accordance with accepted academic practice. No use, distribution or reproduction is permitted which does not comply with these terms.
*Correspondence: Shui-Kai Chang, skchang@faculty.nsysu.edu.tw
†These authors share first authorship