A Lagrangian model-based physical connectivity atlas of the Red Sea coral reefs
 Yixin Wang
 Dionysios E. Raitsos
 George Krokos
 Peng Zhan
 Ibrahim Hoteit
- 1Department of Earth Science and Engineering, King Abdullah University of Science and Technology (KAUST), Thuwal, Saudi Arabia
- 2Department of Biology, National and Kapodistrian University of Athens, Athens, Greece
- 3Institute of Oceanography, Hellenic Centre for Marine Research, Anavyssos, Greece
- 4Department of Ocean Science and Engineering, Southern University of Science and Technology, Shenzhen, China
- 5Southern Marine Science and Engineering Guandong Laboratory, Guangzhou, China
Connectivity, the exchange of individuals and genes among geographically separated marine populations, plays a key role in coral reef biodiversity and resilience. The Red Sea is a semi-enclosed basin with dynamic circulation and abundant coral reefs, making it a natural laboratory for coral reef connectivity research. Previous studies broadly investigated Red Sea connectivity, but were spatially restricted to regional or sparsely-distributed reef sites. Here, using hydrodynamic and particle tracking models, a high-resolution circulation-driven physical connectivity atlas covering every Red Sea coral reef, including seasonality, was simulated and further validated against available in-situ genetic datasets. The simulation was conducted without incorporating larval traits to isolate and quantify the connectivity contributed by circulation. Our validation experiment suggests the importance of circulation in shaping the genetic structure of Red Sea reef species, supporting the Isolation By Circulation (IBC) theory in the Red Sea seascape genetics. The simulated atlas reveals that reefs in the northern Red Sea are better sources and destinations than those in the southern basin, regardless of season. The east-west connections between the southern reefs are identified to be weak. Complex circulation dynamics drive a regional-specific seasonality, e.g., the Farasan Islands reefs are better sources during summer while the nearby Bab-Al-Mandeb strait reefs are better sources during winter. The west-coast reefs are generally winter-intensified sources whereas the east-coast reefs are generally summer-intensified sources. The revealed seasonality of physical connectivity is important for larval dispersal processes as reef species may spawn in different seasons. This physical connectivity atlas provides a reference for designing marine conservation strategies from a circulation perspective and easy-to-access physical connectivity datasets for the future Red Sea seascape genetic studies.
Introduction
Coral reefs, known as therainforests of the sea, are essential habitats for nearly one third of known marine species (Reaka, 2005) and represent valuable economic assets through the provision of tourism and fisheries (Moberg and Folke, 1999). Connectivity, the exchange of individuals and genes among geographically separated marine populations (Cowen and Sponaugle, 2009), is important for the resilience of coral reef ecosystems and for the design of marine protected areas (MPAs) (Almany et al., 2009; Jones et al., 2009). As the exchange of genes is crucial in determining the spatial genetic structure (i.e., the genetic differentiation among subpopulations) of marine species, genetic approaches that infer gene flow based on the genetic structure have been employed to investigate connectivity (Hedgecock et al., 2007). The exchange of individuals between populations inhabiting distant coral reefs can occur through dispersal processes, primarily during the pelagic larval stage (Cowen and Sponaugle, 2009). Though influenced by larval traits such as pelagic larval duration (PLD), the dispersal processes substantially depend on local oceanographic circulation, especially for planktonic larvae with limited swimming ability (Cowen and Sponaugle, 2009; see Appendix 1 for a discussion of the factors that impact dispersal processes). Thus, both biophysical connectivity approaches which simulate larval dispersal processes of concerned species based on larval traits and circulation, and physical connectivity approaches which simulate dispersal processes of non-specific species based on only circulation without incorporating larval traits, have recently become popular for investigating connectivity and for seascape genetic studies (Treml et al., 2008; White et al., 2010). In particular, physical connectivity illustrates the ability of circulation in transporting larvae, meanwhile excluding the potential impacts introduced by the features of larvae species in order to isolate and quantify the contribution of circulation to connectivity (Appendix 2 provides further information about physical connectivity).
Landscape genetics combines landscape ecology and population genetics to understand how landscape features — such as geographical and environmental features — influence gene flow and shape the spatial genetic structure of terrestrial species (Manel et al., 2003). Similarly, seascape genetics (derived from landscape genetics) aim to elucidate how seascape features — including geographic distance, oceanographic features (such as circulation) and environmental features (such as temperature) — shape the spatial genetic structure of marine species (Selkoe et al., 2008; Selkoe et al., 2010; Riginos and Liggins, 2013). In landscape genetics, the classic Isolation By Distance (IBD) model, which hypothesizes that genetic differentiation between separated populations increases with their geographic distance, has been successfully used to explain the spatial genetic structure of some terrestrial species (Manel et al., 2003). However, the classic IBD model may be inadequate for seascape genetic studies of marine species, as the dispersal of marine larvae is strongly dependent on physical circulation. Thus, an Isolation By Circulation (IBC) model has been included to examine the role of circulation in shaping the spatial genetic structure of marine species (White et al., 2010; Alberto et al., 2011). Through investigation of physical connectivity, circulation distance (i.e., a metric of how extensively local circulation favours the connections between populations) can be derived to examine the IBC theory.
The Red Sea is a narrow, elongated and semi-enclosed basin located between ~13°N and ~30°N (Figure 1), with a length of ~2000 km and a maximum width of ~355 km (Hoteit et al., 2021). The basin includes the Gulf of Suez and Gulf of Aqaba at the northern end, and connects with the Gulf of Aden through the narrow (~25 km wide) Bab-Al-Mandeb (BAM) strait at the southern end (Carvalho et al., 2019). Despite its semi-enclosed nature and limited water exchange with nearby oceans, the Red Sea exhibits a dynamic circulation with marked seasonality driven by the prevailing winds and strong air-sea buoyancy fluxes (Yao et al., 2014b; Yao et al., 2014a; Zhan et al., 2014; Sofianos and Johns, 2015). Even though it represents less than 0.02% of the world’s ocean volume (Charette and Smith, 2010; Edwards, 1987), the Red Sea accommodates ~3.8% of the world’s coral reefs (Rasul et al., 2015). Almost the entire coastline of the Red Sea is occupied by coral reefs (Figure 1A), and those of the northern Red Sea, including the Gulf of Aqaba, have been recognized as an important refuge under severe global coral bleaching (Fine et al., 2013; Osman et al., 2018; Kleinhaus et al., 2020). The semi-enclosed nature of the basin, with dynamic circulation and abundant coral reefs (Yao et al., 2014b; Yao et al., 2014a; Zhan et al., 2014; Rasul et al., 2015; Sofianos and Johns, 2015; Zhan et al., 2016), make the Red Sea an ideal natural laboratory for coral reef physical connectivity studies.
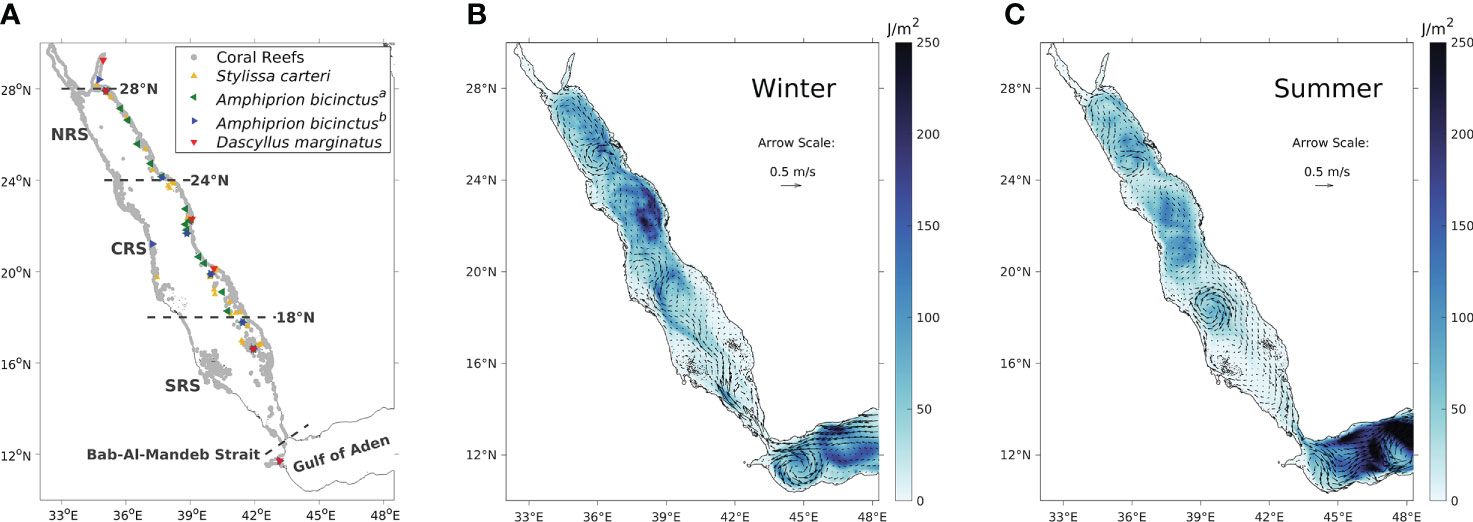
Figure 1 (A) Geographic distribution of the Red Sea coral reefs (grey points) and the sampling sites for the four genetic datasets of the reef sponge S. carteri and the reef fish A. bicinctusa, A. bicinctusb and D. marginatus. Note that the datasets for Amphiprion bicinctus were obtained from two studies with different sampling sites, and are denoted a and b, respectively. (B) Winter surface currents averaged over the 14 years from 2002 to 2015 (indicated by the arrows) and winter surface eddy kinetic energy (indicated by the colours) which reflects the intensity of eddy activities (Zhan et al., 2016). (C) is the same as (B) but showing summer features instead. January and July were chosen to represent the winter and summer seasons, respectively,to maintain consistency with Figure 4.
Understanding circulation features is important when investigating physical connectivity. The main water exchange between the global ocean and the Red Sea occurs through the BAM strait and the nearby Gulf of Aden, which consists of annual average inflow in the upper layer and outflow in the lower layer (Patzert, 1974). Under the regime of the Indian monsoon, this water exchange exhibits a monsoon-related seasonal reversal pattern (Yao et al., 2014b; Yao et al., 2014a). During winter, the water exchange is characterized by surface intrusion of relatively fresh Gulf of Aden surface water in the upper ~90 m and deep outflow of highly saline Red Sea water in the lower layer (Yao et al., 2014a; Sofianos and Johns, 2015). During summer, the water exchange reverses into a more complex three-layer pattern, with fresh intrusion of Gulf of Aden intermediate water in the intermediate layer sandwiched between saline outflows of Red Sea water in the surface and deep layers (Yao et al., 2014b; Sofianos and Johns, 2015). Previous studies revealed that the influx of the nutrient-rich Gulf of Aden water mass plays an important ecological role in the productivity of the southern Red Sea, such as regulating phytoplankton blooms and providing nutrients to local coral reefs (Raitsos et al., 2013; Churchill et al., 2014; Triantafyllou et al., 2014; Raitsos et al., 2015; Dreano et al., 2016).
Within the basin, the annual average general circulation of the Red Sea is characterized by two vertical overturning cells in the upper and lower basins, respectively (Sofianos and Johns, 2015; Yao and Hoteit, 2018). The vast majority of coral reefs live within the upper cell (above ~150−250 m), which consists of annual average northward flow at the surface and southward flow at intermediate depths (Yao et al., 2014b; Yao et al., 2014a; Sofianos and Johns, 2015). The upper cell is also characterized by distinct seasonality and strong mesoscale eddy activities (Zhan et al., 2014; Zhan et al., 2016; Zhan et al., 2018; Zhan et al., 2019), which drive complex local circulation patterns and substantially impact physical connectivity (Raitsos et al., 2017; Wang et al., 2019). Based on circulation features, the Red Sea basin (excluding the two gulfs at the northern end) can be broadly divided into the southern Red Sea (SRS, north of the BAM strait up to approximately 18°N), the central Red Sea (CRS, approximately 18°N-24°N) and the northern Red Sea (NRS, approximately 24°N-28°N; Figure 1A). During winter (Figure 1B), surface intrusion from the Gulf of Aden intensifies along the western boundary at the southern end of the SRS and shifts toward the centre of the SRS as it propagates northward (Yao et al., 2014a). This surface northward flow then transits toward the eastern side due to the meandering currents and vigorous eddies in the CRS and changes into an eastern boundary current in the NRS, forming a cyclonic gyre north of 24°N and centred between 26°N and 27°N (Sofianos and Johns, 2003; Yao et al., 2014a; Zhai et al., 2015). In the intermediate layer of the Red Sea, there is a southward flow consisting of the high-salinity water formed during the sinking process in the NRS (Yao et al., 2014a; Papadopoulos et al., 2015; Yao and Hoteit, 2018). Meanwhile, eddies across the entire Red Sea basin intensify during winter, particularly in the CRS (Zhan et al., 2014; Zhan et al., 2016). During summer (Figure 1C), the intermediate intrusion from the Gulf of Aden propagates northward up to ~19°N-22°N (Sofianos and Johns, 2007; Churchill et al., 2014; Yao et al., 2014b). At the surface, the cyclonic gyre in the NRS weakens during summer (Yao et al., 2014b). A southward eastern boundary current driven by north-westerly winds flows from the CRS to the SRS, splits at the southern end of the basin and partly returns as a northward western boundary current (Sofianos and Johns, 2003; Sofianos and Johns, 2007; Yao et al., 2014b). The general eddy activity in the Red Sea is also weaker during summer (Zhan et al., 2016); yet an intense semi-permanent anti-cyclonic eddy centred at ~18.5°N spins up during summer in response to the lateral Tokar wind jets (Zhai and Bower, 2013; Zhan et al., 2018).
Previous connectivity studies in the Red Sea have widely employed genetic approaches (Berumen et al., 2013). Genetic homogeneity was identified in the northern Red Sea in various reef species, such as fishes, bivalves and sponges; in contrast, the southern Red Sea exhibits a distinct genetic structure in comparison with the northern basin, suggesting a genetic break at latitudes around 20°N (Shefer et al., 2004; Froukh and Kochzius, 2007; Nanninga et al., 2014; Giles et al., 2015; Robitzch et al., 2015; Saenz-Agudelo et al., 2015). The sampling sites of these genetic studies were relatively restricted in spatial coverage, and were mostly located along the east coast of the Red Sea (Figure 1A). A few studies have also employed biophysical and physical connectivity approaches in the Red Sea (Nanninga et al., 2015; Raitsos et al., 2017; Wang et al., 2019). Nanninga et al. (2015) successfully simulated a reef-scale (c. 0.7 km2) larval dispersal process and suggested limited local retention for a reef fish species. Raitsos et al. (2017) investigated physical connectivity based on 60 sparsely-distributed sites along the entire Red Sea coast, which expanded the spatial domain to the west coast and revealed that the southern Red Sea is not physically well-connected with the northern basin. Wang et al. (2019) further revealed that the southern Red Sea is physically more connected with the Indian Ocean than with the northern basin. Overall, studies using both genetic and physical connectivity approaches have broadly investigated the connectivity of the Red Sea coral reefs. However, these studies were based on either regional or sparsely-distributed reef sites, and did not consider the spatial distribution of coral reef complexes throughout the entire Red Sea. In addition, even though the Red Sea circulation is characterized by distinct seasonality, the seasonality of physical connectivity remains poorly documented (except Wang et al., 2019 which mainly focused on the southern basin).
Previous seascape genetic studies in the Red Sea have investigated the IBD theory for several marine species (e.g., Shefer et al., 2004; Froukh and Kochzius, 2007; Robitzch et al., 2015). The Red Sea exhibits remarkable south–north environmental gradients for parameters such as temperature and chlorophyll (Berumen et al., 2019c). Thus, in addition to the IBD model, an Isolation By Environment (IBE, i.e., environmental difference impacts genetic structure) model has also been included to further explain the genetic structure of some Red Sea species (e.g., Nanninga et al., 2014; Giles et al., 2015; Saenz-Agudelo et al., 2015). Due to the difficulties of acquiring physical connectivity datasets that provide circulation information, seascape genetic studies in the Red Sea are mostly restricted to the IBD and IBE theories. More recently, Raitsos et al. (2017) revealed that circulation formulates pathways for gene flow and shapes the genetic structure of a reef fish species (Raitsos et al., 2017), suggesting the necessity of including IBC theory in assessments of Red Sea seascape genetics. Despite this, a physical connectivity atlas based on all the Red Sea coral reefs that provides circulation information to investigate the IBC theory is yet to be reported.
This study aims to provide a comprehensive, high-resolution physical connectivity atlas, including its seasonality, covering all Red Sea coral reefs. Specifically, based on the validated outputs of a long-term, high-resolution, 3D regional hydrodynamic model simulation, a particle tracking model was utilized to investigate physical connectivity throughout the Red Sea coral reefs and assess its seasonal variability. Targeting a non-species-specific physical connectivity atlas, larval traits were not incorporated in the simulations in order to identify and assess the role of ocean circulation in larval dispersal processes. Additionally, in order to examine the influence of circulation on shaping the genetic structure of different marine species, a statistical analysis was performed based on the physical connectivity and genetic datasets (available from published literature) to obtain a deeper understanding of Red Sea seascape genetics. The comprehensive physical connectivity atlas of the Red Sea coral reefs enables the identification of potential connectivity hotspots for marine conservation from the ocean circulation perspective and provides easy-to-access physical connectivity datasets for future Red Sea seascape genetic research.
Methods
Section 1: Modelling physical connectivity
To describe the physical connectivity of the Red Sea coral reefs, a Lagrangian particle tracking model was implemented to simulate the dispersal process of passive particles released from the coral reefs over the entire Red Sea based on the outputs of a 3D hydrodynamic model. A long-term (13 years, 2002-2014), high-resolution (0.01°/~1 km) physical connectivity atlas of the Red Sea coral reefs was then generated.
The hydrodynamics of the Red Sea, including the Gulf of Suez, the Gulf of Aqaba in the north and part of the Gulf of Aden, were simulated using the Massachusetts Institute of Technology general circulation model (MITgcm) (Marshall et al., 1997) configured in the domain between 30°E-50°E and 10°N-30°N (Krokos et al., 2021), with a horizontal resolution of 0.01° (~1 km) and 50 vertical layers with thicknesses varying between 4 m at the surface and 300 m near the bottom. The model was forced by a downscaled regional atmospheric reanalysis covering the Red Sea and the neighbouring regions with spatial resolution of ~5 km (Viswanadhapalli et al., 2017; Sanikommu et al., 2020; Hoteit et al., 2021). The open boundary conditions were obtained from the monthly global GLORYS2V4 reanalysis product provided by the Copernicus Marine Environment Monitoring Service (CMEMS; http://marine.copernicus.eu). The model successfully reproduced the Red Sea circulation dynamics from the basin-scale overturning circulation to mesoscale eddy activities, as well as the seasonal variability of the volumes and 3D structure of water exchange at the BAM strait (Yao et al., 2014b; Yao et al., 2014a; Zhan et al., 2014; Zhan et al., 2015; Xie et al., 2019). The model outputs have been extensively validated (Yao et al., 2014b; Yao et al., 2014a; Hoteit et al., 2021; Krokos et al., 2021) and used in many studies to force a 3D ecosystem model (Triantafyllou et al., 2014), a larval dispersal model (Nanninga et al., 2015), a physical connectivity model (Wang et al., 2019) and lagoon-scale studies (Doshi et al., 2019; Zhan et al., 2021). In this study, the daily averaged outputs of 3D horizontal and vertical velocities between 2002 and 2015 were used to allow 360-day particle tracking simulations over the period 2002-2014.
The coral reef distribution dataset for the Red Sea was acquired from the UNEP World Conservation Monitoring Centre (UNEP-WCMC; http://data.unep-wcmc.org/datasets/1). The dataset was provided as records of coral reef geographic locations, therefore the data were further gridded into a 0.01° mesh (to match the hydrodynamic model), generating ~15,000 coral reef sites in the Red Sea (Figure S1A). Specifically, each oceanic grid on the high-resolution hydrodynamic model mesh was defined as a coral reef site if any documented coral reef geographic location in the UNEP-WCMC dataset was situated within the same grid (Figure S1A).
Lagrangian particle tracking was performed using the Connectivity Modelling System (CMS), developed by Paris et al. (2013). Particles were released from the centre of all Red Sea coral reef sites at a depth of 2 m (i.e., central depth of the hydrodynamic model surface layer). During the 13-year study period (2002-2014), particles were released on a daily basis and integrated for 30 days (for the physical connectivity atlas) and 360 days (for the circulation distance), with the location of each particle recorded daily. Over 5×10⁶ particles were released annually, yielding a total of ~7×10⁷ particles over the whole experimental period. The particles were treated as neutrally buoyant and passively drifted with local currents without autonomous movement such as vertical migration or horizontal swimming. Appendix 1 provides further details.
Section 2: Measuring physical connectivity
A connectivity matrix is a distance matrix whose elements contain information on the level of connectivity between two coral reef sites (Mitarai et al., 2009). It is the standard approach to investigate connectivity between marine subpopulations (Mitarai et al., 2009). Specifically, a coefficient Cij in the connectivity matrix is the probability of a particle released from the source site i reaching the destination site j within the simulation time t (e.g., Figure S1B). However, given the high-resolution simulation and the large number of ~15,000 coral reef sites, it is difficult to extract meaningful information from such a complex matrix (Figure S1B). Thus, additional metrics were introduced to depict the physical connectivity in a simpler way. Hence, source (destination) strength and influencing (influenced) strength were utilized as metrics to evaluate the physical connectivity of each coral reef site in the Red Sea, which quantify the ability of each reef site to be a good source (sink) of Lagrangian particles. Then, a hierarchical clustering method (Johnson, 1967) was applied to identify the coral reefs that are relatively highly physically connected with each other. These connectivity metrics and the clustering method enabled us to comprehensively quantify and depict the physical connectivity features of the Red Sea coral reefs. More details are as follows.
The source strength of a certain reef site i is defined as an array of size equal to the total number, N, of coral reef sites in the Red Sea (here, N = ~15,000), where site i is the source site from which particles are released from. An element SSj in the source strength array of site i is calculated as the possibility of particles released from site i reaching site j within the simulation time t (here, t = 30 days and j = 1,2,3,…,N can be any coral reef site in the Red Sea). In contrast, the destination strength of a reef site j is also defined as an array of size equal to N, whereas site j is the destination site the particles will reach. An element DSi in the destination strength array of site j is calculated as the possibility of particles released from site i reaching site j within the simulation time t (here, i=1,2,3,…,N can be any coral reef site in the Red Sea). Essentially, the source strength of site i is the column i extracted from the connectivity matrix; correspondingly, the destination strength of site j is the row j extracted from the connectivity matrix (refer to Figure S1B for the connectivity matrix). The mapped source strength or destination strength of a certain reef region outlines the Red Sea reefs connected with that specific reef region, with the values indicating the level of connectivity.
Unlike the source (destination) strength, which depicts the physical connectivity of a specific reef region in a site-to-site manner, the metric influencing (influenced) strength is a numerical quantity (instead of an array) that directly evaluates the physical connectivity of a certain reef site. The influencing strength of a reef site i is defined as the number of coral reef sites that particles released from site i will ever reach during the simulation time t, expressed as a percentage of the total number of coral reef sites in the Red Sea (see relevant discussion in Supplementary Material). The climatology of influencing strength was obtained by averaging the values over the 13 experimental years. In contrast, the influenced strength of a reef site j is defined as the number of coral reef sites whose particles will ever reach site j during the simulation time t, expressed as a percentage of the total number of coral reef sites in the Red Sea. The climatology of influenced strength was also obtained by averaging the values over the 13 experimental years. Essentially, the influencing strength of site i is the percentage of non-zero values in column i from the connectivity matrix; correspondingly, the influenced strength of site j is the percentage of non-zero values in row j from the connectivity matrix (refer to Figure S1B for the connectivity matrix; zero values indicate no connections). The mapped influencing strength or influenced strength reveals the ability of each reef site to impact or be impacted by other coral reefs in the entire Red Sea.
In order to capture the basin-scale physical connectivity features, a sensing diameter of 25 km was applied as the criterion to decide whether a particle reaches the coral reef site or not. The choice of 25 km was a compromise in order to overcome the simulation limitations in transporting particles towards reef sites with shallow bathymetry. In addition, the influencing/influenced strengths for each reef site were averaged over the nearby sites within a 25 km diameter to obtain a smooth influencing/influenced strengths atlas (see Appendix 3 for more information about the application of sensing and smoothing diameters).
Agglomerative hierarchical clustering was performed based on the connectivity matrix of all coral reef sites in the Red Sea with a 30-day simulation time. Agglomerative hierarchical clustering is abottom up clustering approach, in which each object starts as its own cluster and moves up the hierarchy by merging pairs of clusters (Sasirekha and Baby, 2013). Specifically, each reef site was considered as one cluster in the initial stage. Next, the clusters were merged step-by-step using UPGMA (unweighted pair group method with arithmetic mean) to eventually form one cluster containing all reef sites. In addition, since higher Cij values in the connectivity matrix (ranging from 0 to 1) indicate a higher level of connectivity, the elements in the connectivity matrix were replaced with (1- Cij) to obtain a dissimilarity matrix, which is ultimately used for clustering.
Section 3: Validating physical connectivity
For seascape genetics, in addition to the IBD model, an IBC model has been included to account for the role of circulation in shaping the genetic structure of marine species (e.g., White et al., 2010; Alberto et al., 2011; Raitsos et al., 2017). Consistency between the genetic structure and circulation feature would support the IBC theory for Red Sea reef species, and validate the physical connectivity atlas of the Red Sea coral reefs.
Published genetic population datasets were utilized for the reef sponge Stylissa carteri (Giles et al., 2015), the anemonefish Amphiprion bicinctus a and b (respectively from Nanninga et al., 2014 and Saenz-Agudelo et al., 2015), and the damselfish Dascyllus marginatus (Robitzch, 2017). Since the genetic datasets for the anemonefish were based on the same species at different sampling sites (Figure 1A), these datasets were denoted as A. bicinctusa and A. bicinctusb, respectively. The four studies used Wright’s Fst (i.e., standardized variance in allele frequencies among populations; Wright, 1931; Manel et al., 2003; Hedgecock et al., 2007) to measure genetic differentiation and describe the spatial genetic structure of the respective species. Linearized Fst (i.e., Fst/[1-Fst]) between sampling sites was calculated in this study as the genetic distance (Rousset, 1997) to test the IBD and IBC theories.
The corresponding circulation distance between two genetic sampling sites was calculated as the Mean Connection Time (MCT), defined as the average time required for a particle released from one sampling site to reach another sampling site and vice versa. Specifically, the MCTij and MCTji between the genetic sampling sites i and j were averaged to acquire a single MCT value. In contrast to the probabilities used in the connectivity matrix, which are negatively related with the genetic distances, MCTs correlate positively with genetic distances and have been commonly used as a circulation distance in previous studies (Alberto et al., 2011; Watson et al., 2011; Raitsos et al., 2017). A simulation time of 360 days provides a meaningful circulation distance under the large spatial scale of the Red Sea (see Appendix 1 – PLD for more information). The nearest 70 gridded reef sites were selected as representative of each genetic sampling site to avoid any misconnection between two sampling sites and to obtain viable circulation distances (see Figure S2 for more information).
To investigate the IBD and IBC theories, Generalized Additive Models (GAMs) were applied to examine the relationship between genetic distance, geographic distance, and circulation distance. Essentially, GAMs find the best fit composed of weighted additive basis functions such as x, x2, x3 (Hastie and Tibshirani, 1987). All three input variables in GAMs measure the distance between the genetic sampling sites: the genetic distance is the linearized Fst; the geographic distance is spatial Euclidian distance; the circulation distance is the MCT. The corresponding distance matrices of all three variables based on the four groups of genetic datasets are provided in Figure S3.
Results
Section 1: Isolation by circulation for the Red Sea coral reef species
To validate the physical connectivity atlas, we examined the IBD and IBC theories and revealed that the atlas-derived circulation distance is an important factor in structuring the population genetics of Red Sea coral reef species (Figure 2). Specifically, the IBC model exhibits an overall better fit (i.e., higher R-value) than the IBD model in most cases (expect for A. bicinctusb; Figures 2A, B, D), indicating that the circulation distance is potentially a more important predictor of genetic distance than the geographic distance. A combination of IBD and IBC further improved the fit compared with the single models in most cases (except for D. marginatus, whose small sample size could be insufficient for bi-variate analysis; Figure 2). In particular, a considerable increase in the R-value from 0.24 (IBD; p<0.001) to 0.34 (IBC; p<0.001) was observed for the reef sponge S. carteri, with a further notable increase to 0.61 (p<0.001) in the combined model (Figure 2).
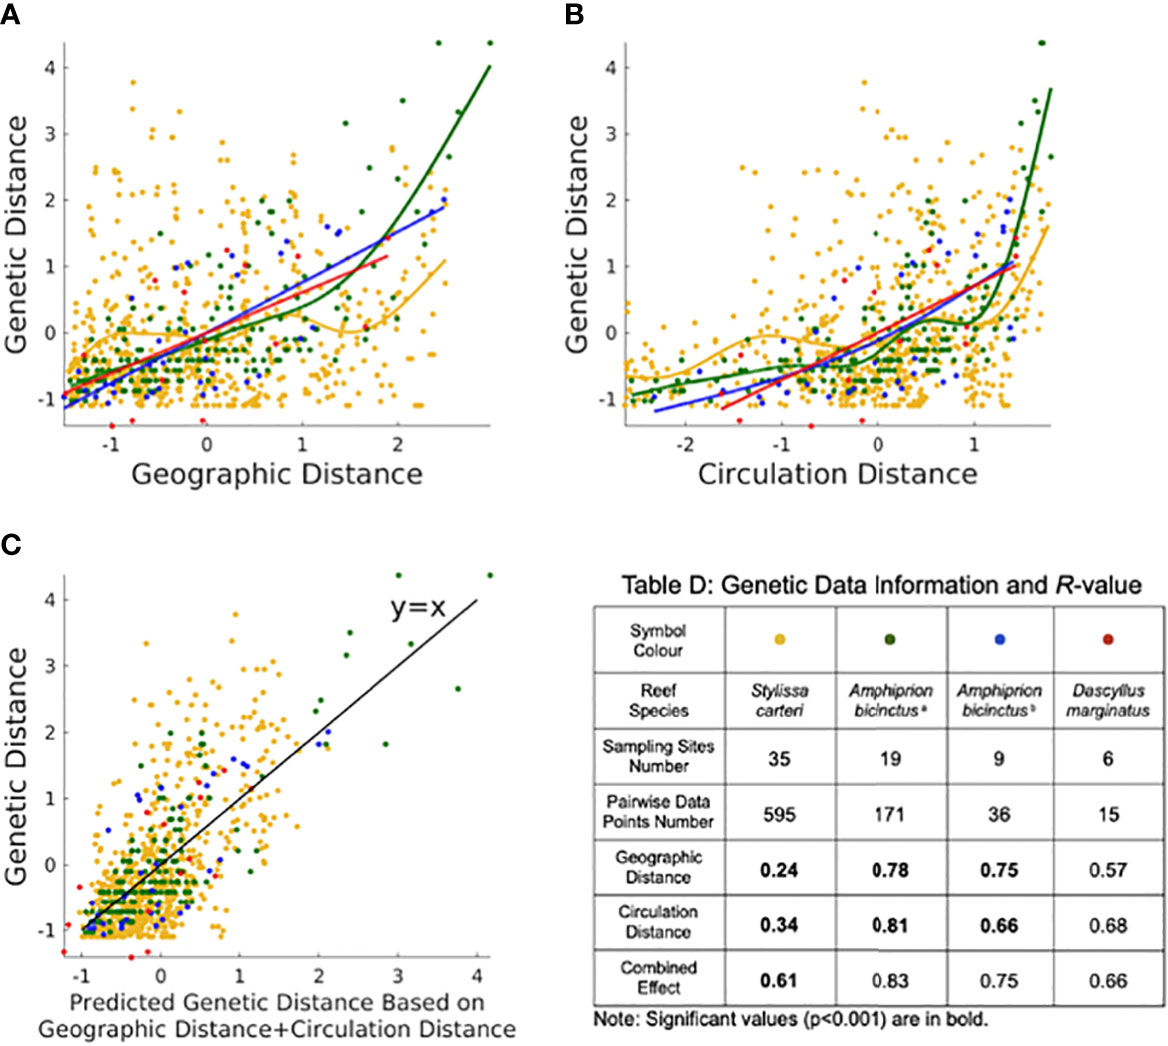
Figure 2 Statistical analysis using the Generalized Additive Model (GAM) for the (A) IBD theory, (B) IBC theory and (C) combined IBD with IBC. Legends for (A–C) are listed in Table (D) Genetic Data Information and R-value. The table provides information on the R values (R^2 is the coefficient of determination) for the four datasets of the reef sponge S. carteri and the reef fish A. bicinctusa, A. bicinctusb and D. marginatus. Data were standardized to a mean of zero and a standard deviation of one. Note that the black line in (C) is y = x.
Overall, our investigation of IBD and IBC theories suggested that circulation distance is potentially a relevant factor to explain the genetic structure of the Red Sea reef species. Thus, a physical connectivity atlas that provides circulation distance information may provide a robust dataset to investigate seascape genetics and a reference for the design of marine conservation strategies in the Red Sea.
Section 2: Annual physical connectivity atlas of the Red Sea coral reefs
To depict the overall physical connectivity structure of the Red Sea coral reefs, we first present the influencing strength (Figure 3A) and influenced strength (Figure 3D) based on particles released daily throughout the year from coral reef sites throughout the Red Sea with a 30-day simulation time. Briefly, a higher value of influencing strength indicates the reef site is a better source for the entire Red Sea reefs (Figure 3A), while a higher value of influenced strength indicates the reef site is a better destination (Figure 3D). In general, both influencing strength and influenced strength suggest south-to-north increasing patterns, except for the two gulfs at the northern end (Figures 3A, D). The highest values are located in the vicinity of 24°N for influencing strength (Figure 3A) and the vicinity of 25.5°N for influenced strength (Figure 3D). In the southern Red Sea, minor increases in influencing strength are observed on the west coast of the BAM strait and some offshore reef sites located in the centre of the SRS (Figure 3A). The convex-shape coastline areas (e.g., the Yanbu region in Figure 3A) in the CRS and NRS generally exhibit higher values for both metrics than nearby concave-shape coastline areas.
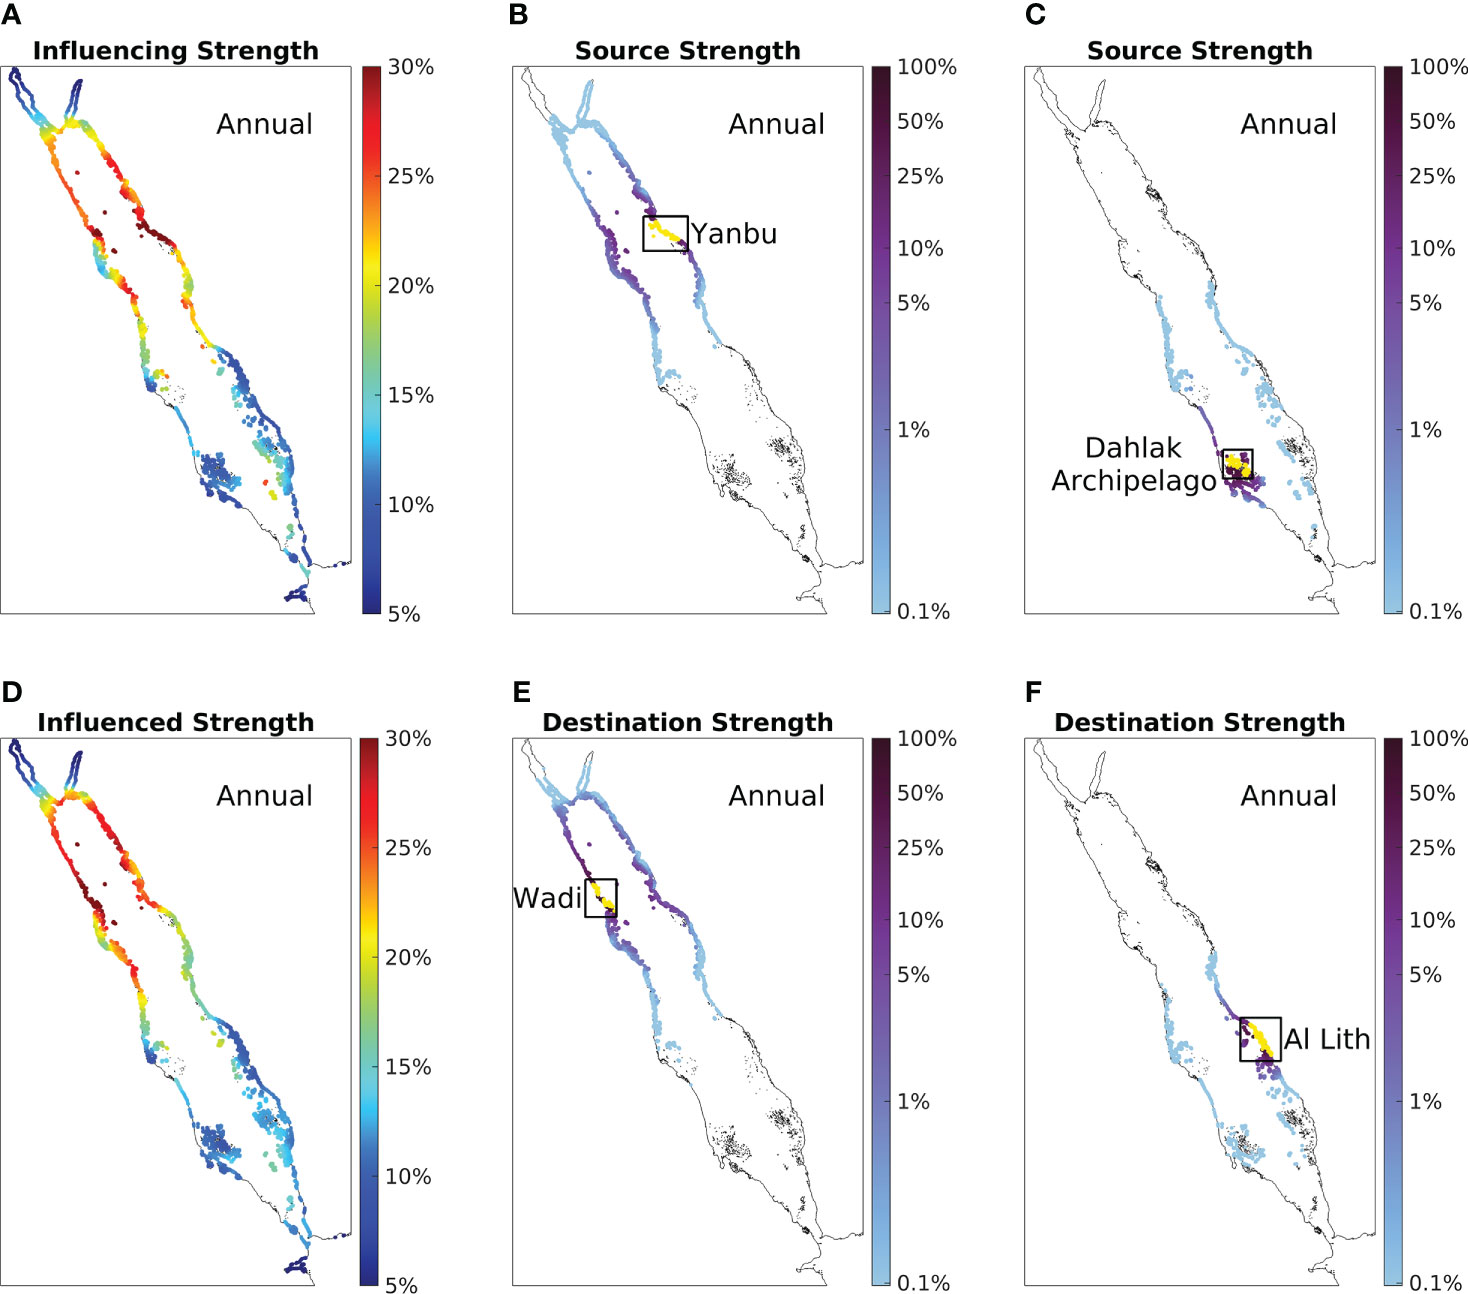
Figure 3 The annual physical connectivity atlas of the Red Sea coral reefs. Both (A) annual influencing strength and (D) annual influenced strength are calculated based on the 30-day simulation time and averaged over 13 simulation years. Colours indicate the percentage of connected coral reefs, where a higher value implies that the reef site is a better source (in A) or destination (in D) for all Red Sea reefs. We highlighted a high-value area and a low-value area in both (A, D) as four case studies shown in (B, C, E, F). (B) Annual source strength of the high-influencing-strength-value area Yanbu. (C) Annual source strength of the low-influencing-strength-value area Dahlak. Colours indicate the level of connection, where higher values imply that particles released from Yanbu/Dahlak (marked in yellow) are more likely to reach the reef sites within the 30-day simulation time (blank sites indicate no connections). (E) Annual destination strength of the high-influenced-strength-value area Wadi. (F) Annual destination strength of the low-influenced-strength-value area Al Lith. In contrast, colours also indicate the level of connection, yet higher values imply that particles released from the reef sites are more likely to reach Wadi/Al Lith (marked in yellow). Note the logarithmic scale of the colorbar.
To further investigate the differences between the strong-influencing areas and weak-influencing areas revealed by the influencing strength atlas (i.e., Figure 3A), we present the source strength of Yanbu (strong-influencing area; located in the NRS) and the Dahlak Archipelago (weak-influencing area; located in the SRS) as case studies in Figures 3B, C, respectively. Source strength characterizes all the reef sites that are connected with the selected area (marked in yellow), with higher values indicating that the selected area is a better source. Yanbu exhibits connections with all of the reefs in the central and northern parts of the basin, and in particular some substantial connections with reefs across the basin on the west coast (within the 30-day simulation period; Figure 3B). Compared with Yanbu, the Dahlak Archipelago exhibits relatively weaker connectivity, with the majority of connections occurring with nearby reefs, and a lack of connections with the cross-basin east-coast reefs (Figure 3C). These differences eventually make Yanbu a better source than the Dahlak Archipelago (Figure 3A).
Similarly, to further investigate the differences between the strongly- and weakly-influenced areas revealed in the influenced strength atlas (i.e., Figure 3D), the destination strength of Wadi (strongly-influenced area; located in the NRS) and Al Lith (weakly-influenced area; located in the SRS) are presented as case studies in Figures 3E, F, respectively. In contrast to source strength, a higher value of destination strength indicates the selected area (marked in yellow) is a better destination. Wadi exhibits a large spatial coverage of connected reefs and strong east-west connections (Figure 3E). Compared with Wadi, Al Lith not only has weak connections with the cross-basin west-coast reefs, but is also weakly connected with reefs on the east coast (Figure 3F), eventually making Wadi a better destination than Al Lith (Figure 3D).
Overall, the south-to-north increasing patterns of both influencing strength and influenced strength underline a more dynamic physical connectivity in the northern and central parts of the basin compared with the southern Red Sea. The northern and central coral reefs exhibit more frequent east-west exchanges and are connected with larger numbers of reef sites, and thus have the potential to be better sources and destinations for all Red Sea coral reefs.
Section 3: Seasonal physical connectivity atlas of the Red Sea coral reefs
As the circulation in the Red Sea exhibits strong seasonality, the seasonal patterns in the physical connectivity of the Red Sea coral reefs were further investigated (Figure 4). The winter and summer influencing (influenced) strength are presented in Figures 4A, B (Figures 4D, E), respectively. For both metrics, the general south-to-north increasing patterns observed in the annual results persists regardless of the seasons (Figures 4A, B, D, E), except for an obvious increase in influenced strength near the BAM strait during summer (Figure 4E).
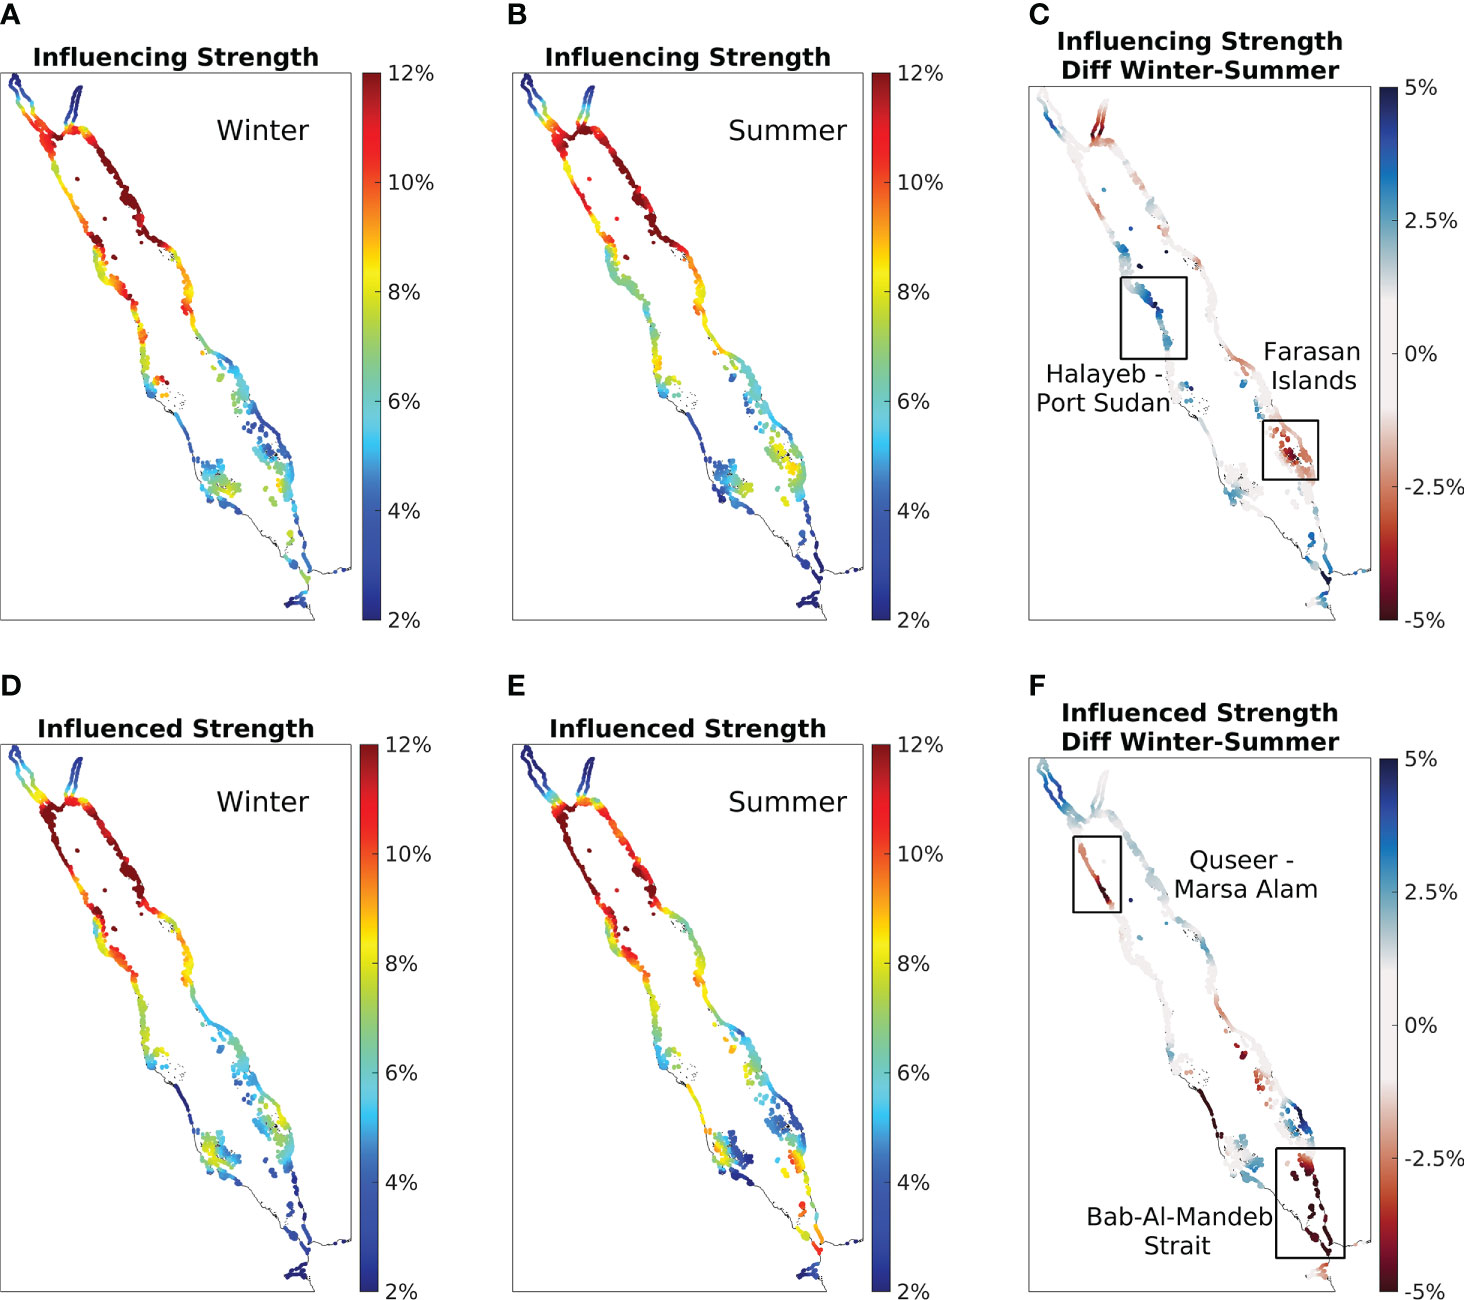
Figure 4 The seasonal physical connectivity atlas of the Red Sea coral reefs. (A) Winter influencing strength is calculated based on simulations conducted during winter with particles being released in January and tracked for 30 days. Similar to the annual analysis, the value is the average over 13 Januarys during the 13 simulation years. (B) Same as (A), except for particles being released in July to represent summer. Colours indicate the percentage of connected coral reefs, where a higher value implies that the reef site is a better source (in A and B) or destination (in D and E) for the all Red Sea reefs. (C) Differences between winter and summer of influencing strength, with a positive value indicating a higher influencing strength during winter. Panel (D–F) are the same as panel (A–C), but showing influenced strength instead. January and July were chosen to represent the winter and summer seasons, respectively, as the maximum differences were observed during these months (see Figure S6 for the monthly influencing strength and influenced strength from January to December).
To highlight the areas with intense seasonality, the differences between winter and summer are also presented, where a positive value indicates the reef site is a better source/destination during winter than summer (Figures 4C, F). Both metrics suggest regional-specific patterns, characterized by patchy positive-value and negative-value regions all over the basin (Figures 4C, F). For influencing strength, the predominant pattern of positive values on the west coast and negative values on the east coast indicates that the reefs on the west coast tend to become better sources during winter than summer and, in contrast, reefs on the east coast tend to become better sources during summer (Figure 4C). However, for influenced strength, the pattern of seasonality appears to be more random (Figure 4F). In addition, two regions for each metric (Figures 4C, F) were selected and are presented as case studies in the following two subsections.
Subsection 1: Case studies of the seasonality of influencing strength
To further examine the seasonality of influencing strength, the seasonal source strength of the reefs in the Farasan Islands (located on the east coast of the SRS; Figures 5A, B) and the coastline between Halayeb and Port Sudan (located on the west coast of the CRS; Figures 5C, D) are presented as case studies.
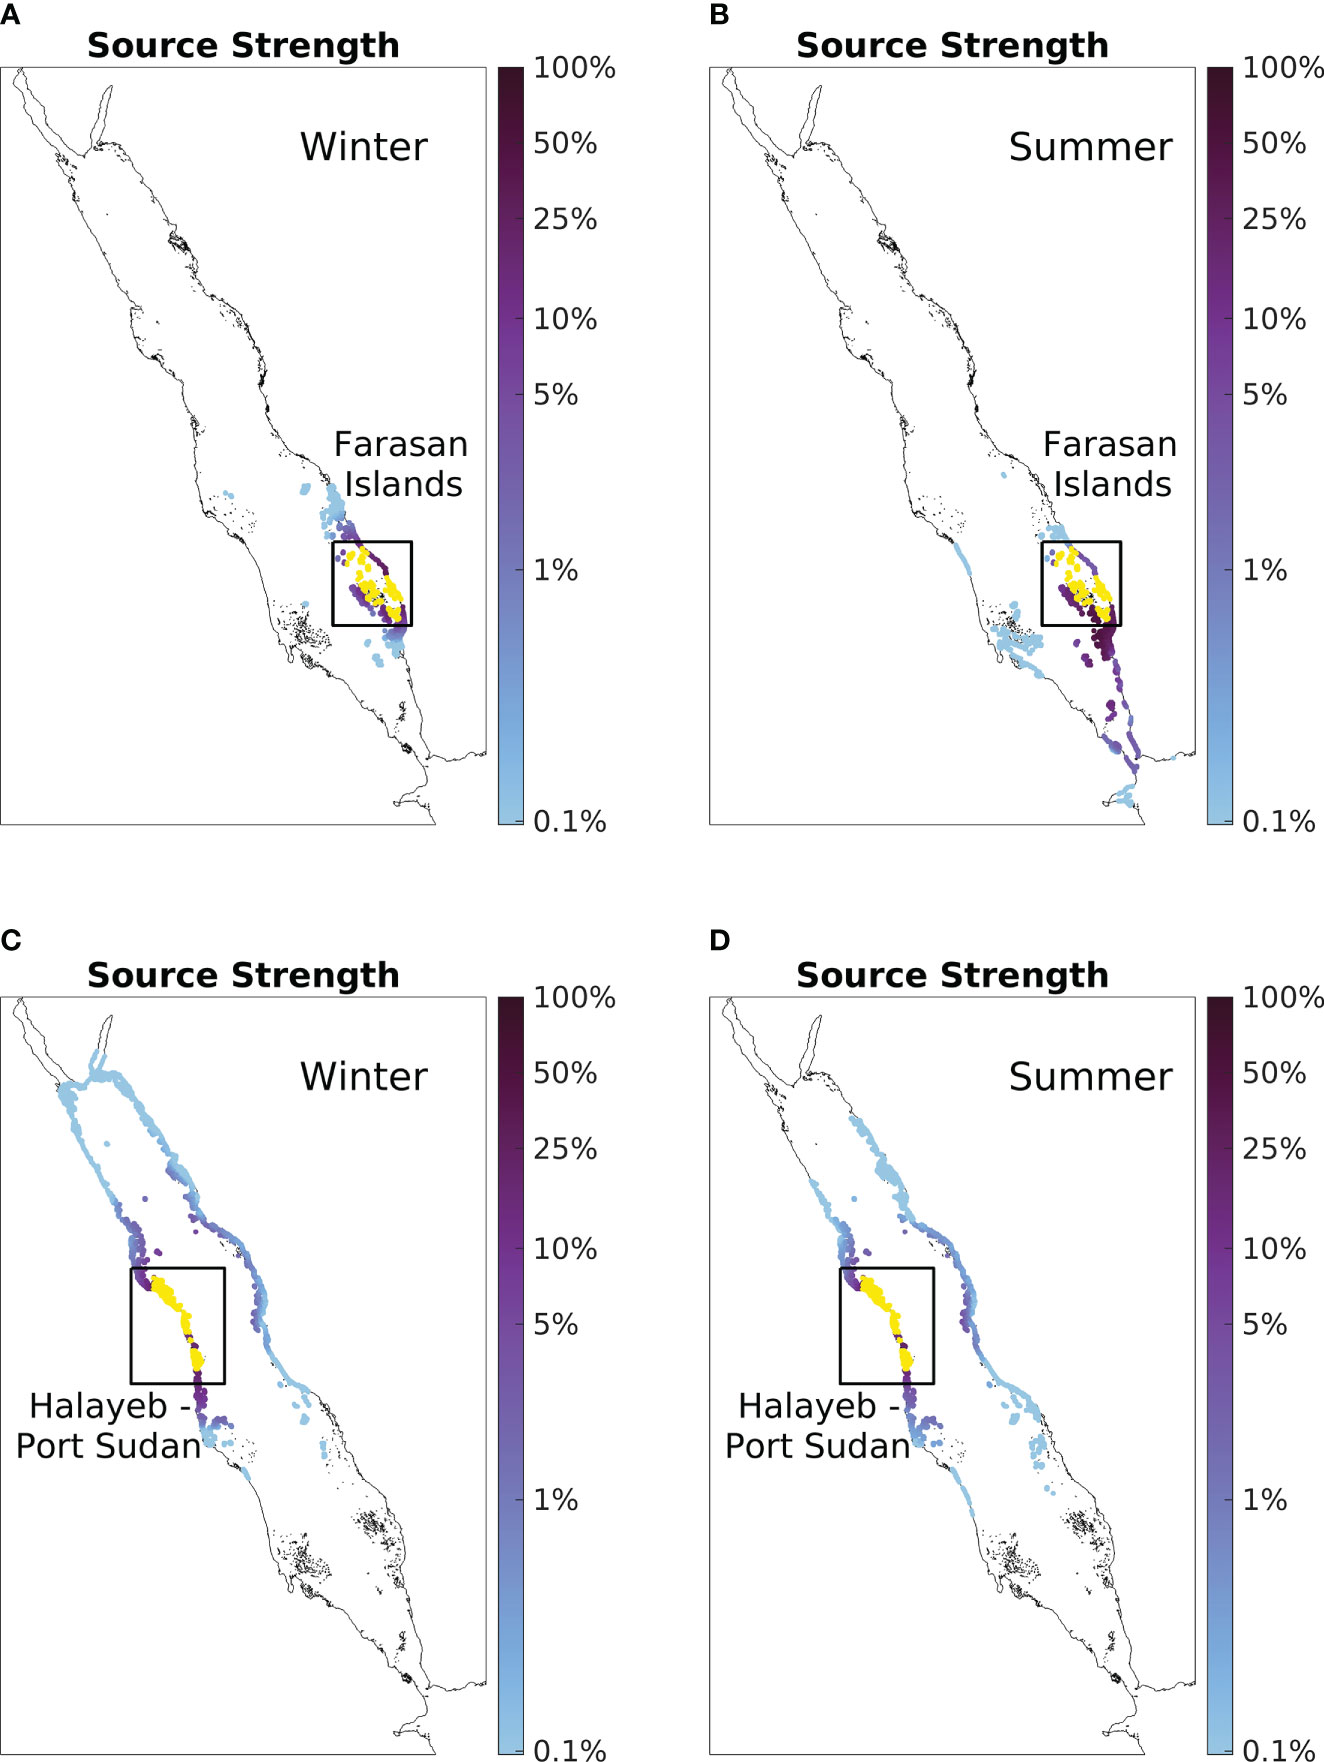
Figure 5 Case studies of influencing strength seasonality. (A) Winter source strength of Farasan Island. Values are calculated based on simulations conducted during winter with particles being released in January and tracked for 30 days. (B) Summer source strength of Farasan Island with particles being released during summer (in July). Panel (C, D) are the same as Panel (A, B), but for the coastline between Halayeb and Port Sudan instead. Note the logarithmic scale of the colorbar.
Reefs in the Farasan Islands are revealed to be better sources during summer than winter (Figure 4C). Here, the Farasan Islands exhibit a larger spatial coverage of connected reefs and higher source strength values with nearby reefs during summer (Figures 5A, B). During winter, particles released from the Farasan Islands tend to remain within the nearby regions, with a small migration towards the north, barely reaching the Dahlak Archipelago. This limited northward migration in winter further is further reduced during summer, despite substantial enhancement in the southward transport. In addition, particles released from the Farasan Islands in summer reach most reefs in the Dahlak Archipelago and further propagate northward towards the west-coast reefs.
In contrast to the reefs in the Farasan Islands, the reefs along the coastline between Halayeb and Port Sudan are better sources during winter (Figure 4C). Here, the coastline between Halayeb and Port Sudan exhibits approximately equivalent source strength values with nearby reefs during both seasons, but considerably larger spatial coverage of connected reefs during winter (Figures 5C, D). Particles released from the coastline between Halayeb and Port Sudan in both seasons can travel meridionally and zonally across the basin. However, only particles released in winter can reach the far end of the northern Red Sea, with some even reaching the Gulf of Aqaba within the 30-day simulation period. On the other hand, particles released during summer exhibit a slightly stronger ability to travel southward, but such southward expansion does not compensate for the northward contraction during summer.
Subsection 2: Case studies of the seasonality of influenced strength
Similarly, to further examine the seasonality of influenced strength, the seasonal destination strength of the reefs in the BAM strait (located at the southern end of the SRS; Figures 6A, B) and the coastline between Quseer and Marsa Alam (located along the west coast of the NRS; Figures 6C, D) are presented as case studies.
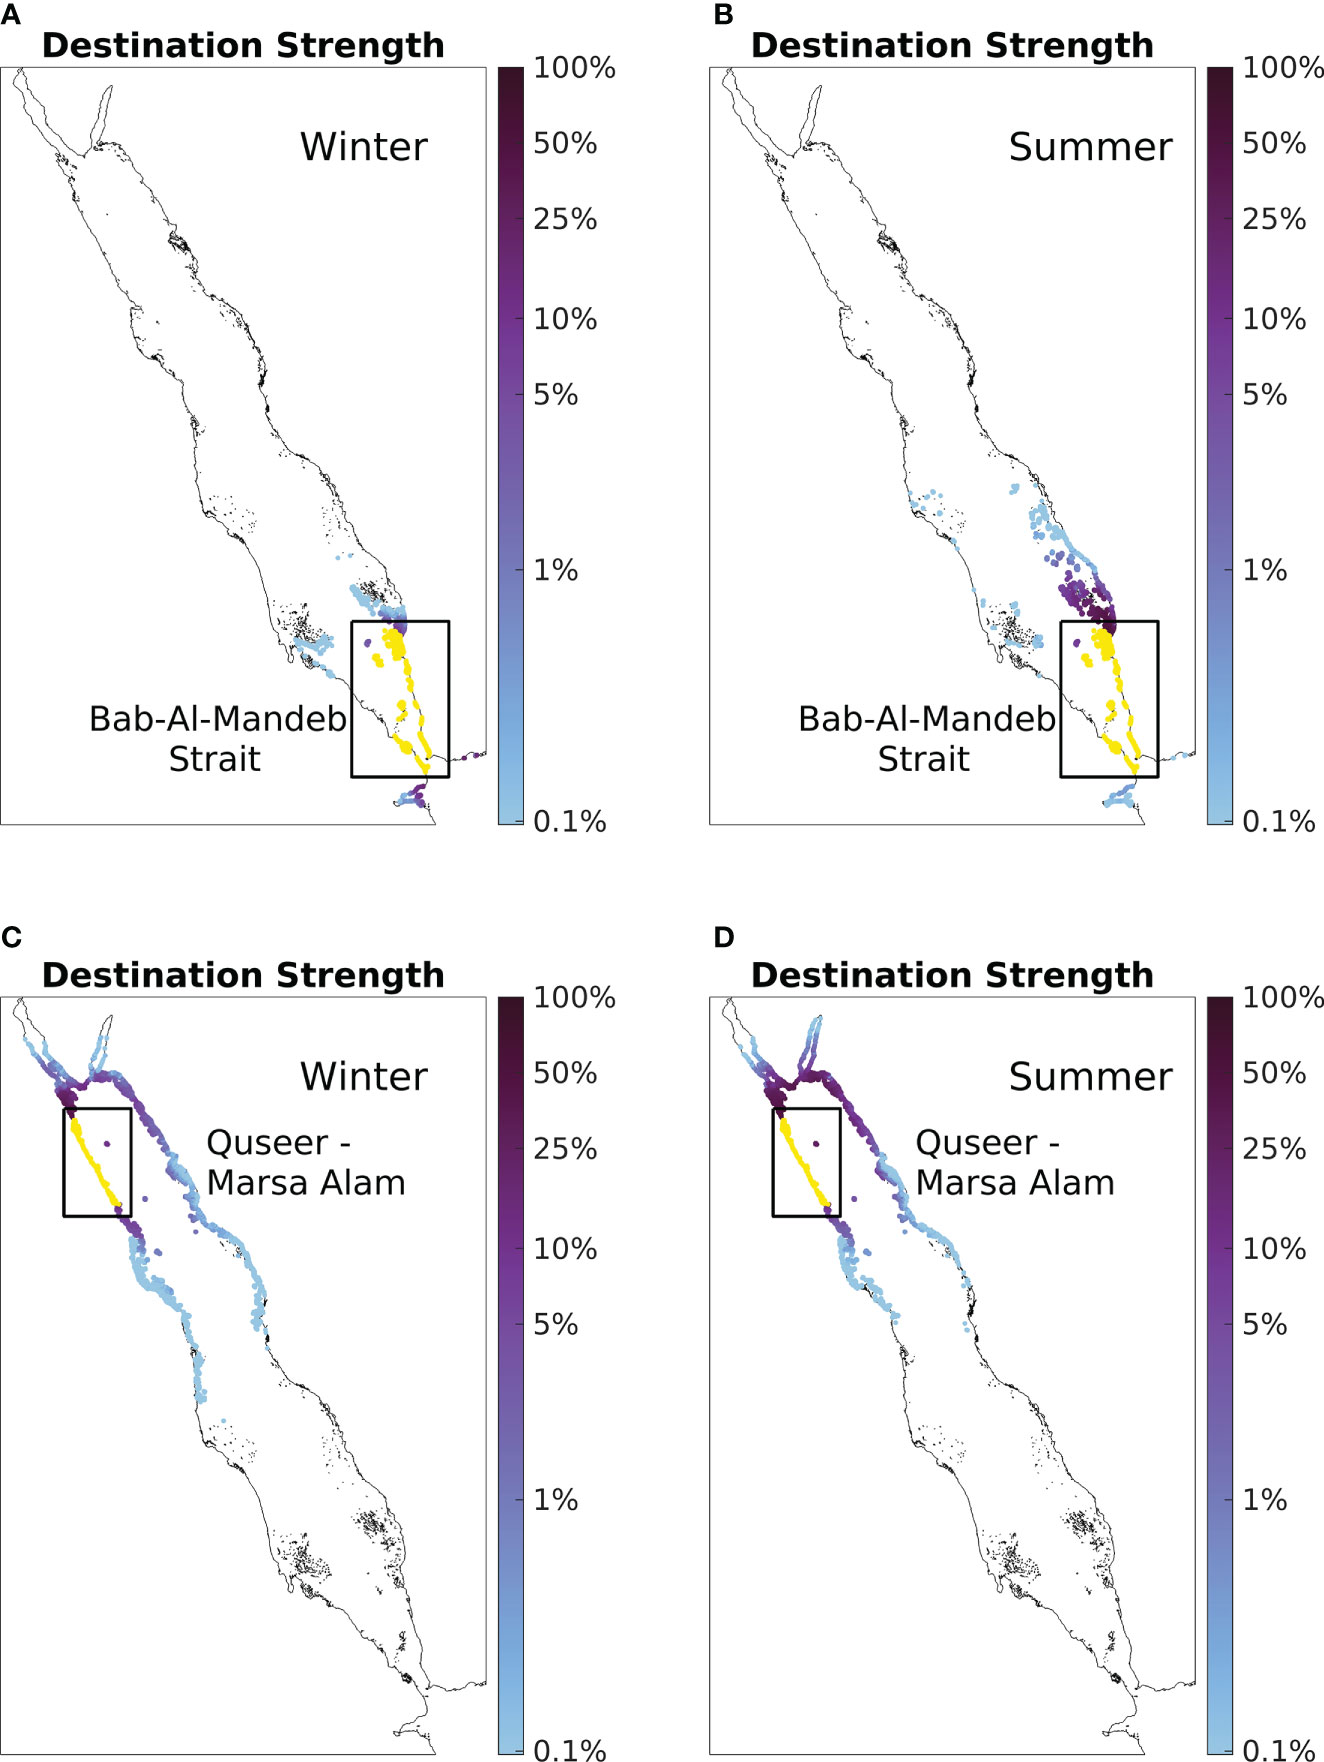
Figure 6 Case studies of influenced strength seasonality. (A) Winter destination strength of the BAM strait. Values are calculated based on simulations conducted during winter with particles being released in January and tracked for 30 days. (B) Summer destination strength of the BAM strait with particles being released during summer (in July). Panel (C, D) are the same as panel (A, B), but for the coastline between Quseer and Marsa Alam instead. Note the logarithmic scale of the colorbar.
Reefs in the BAM strait are revealed to be better destinations during summer (Figure 4F). Here, the BAM strait exhibits a larger spatial coverage of connected reefs and higher destination strength values with the nearby reefs during summer (Figures 6A, B). During winter, only particles released from Djibouti, the southern Farasan Islands, and the southern Dahlak Archipelago reach the strait. However, during summer, particles released from as far as the central Red Sea can be transported to the strait; in addition, a considerable proportion of particles released from the southern Farasan Islands reach the strait area. It is worth noting that the destination strength value for the Djibouti area (located at the west end of the Gulf of Aden) decreases during summer.
Reefs along the coastline between Quseer and Marsa Alam are also revealed to be better destinations during summer (Figure 4F). Here, the coastline between Quseer and Marsa Alam exhibits a smaller spatial coverage of connected reefs, but evidently higher source strength values with the nearby reefs and the reefs located on the east coast of the NRS during summer. During winter, particles from a larger number of reef sites in the CRS can be transported to the Quseer-Marsa Alam coastline. However, during summer, particles released from the east coast of the NRS and northern end of the basin exhibit a significantly higher tendency to travel toward the Quseer-Marsa Alam coastline.
Overall, the physical connectivity of the Red Sea coral reefs exhibits seasonal variations with regional-specific patterns. Even though the general south-to-north increasing patterns observed for both annual influencing strength and annual influenced strength persist during both winter and summer, some irregularly distributed regions show notable seasonality (Figure 4). The Red Sea influencing strength is characterized by a predominant pattern of a winter-intensified west coast and a summer-intensified east coast (Figure 4C). However, the influenced strength exhibits a more random pattern in the basin (Figure 4F). The four case studies (Figures 5 and 6) further explained the patterns revealed in Figure 4, with each case characterized by its unique features.
Section 4: Clustering based on physical connectivity
To identify the reef sites that are closely connected with each other, we applied a hierarchical clustering algorithm and selected the clustering number K = 4 as the most representative to depict the general basin-scale patterns of closely linked Red Sea reefs (Figure 7). Briefly, reefs indicated in the same colours are closely connected, whereas reefs of different colours are relatively less connected. The dendrograms display the clustering levels and describe the process of how Red Sea coral reefs were divided into four clusters according to their physical connectivity features. The height of each U-shaped line in the dendrograms indicates the physical connectivity distance (i.e., the dissimilarity) between two clusters, with a higher line indicating a less-connected relationship.
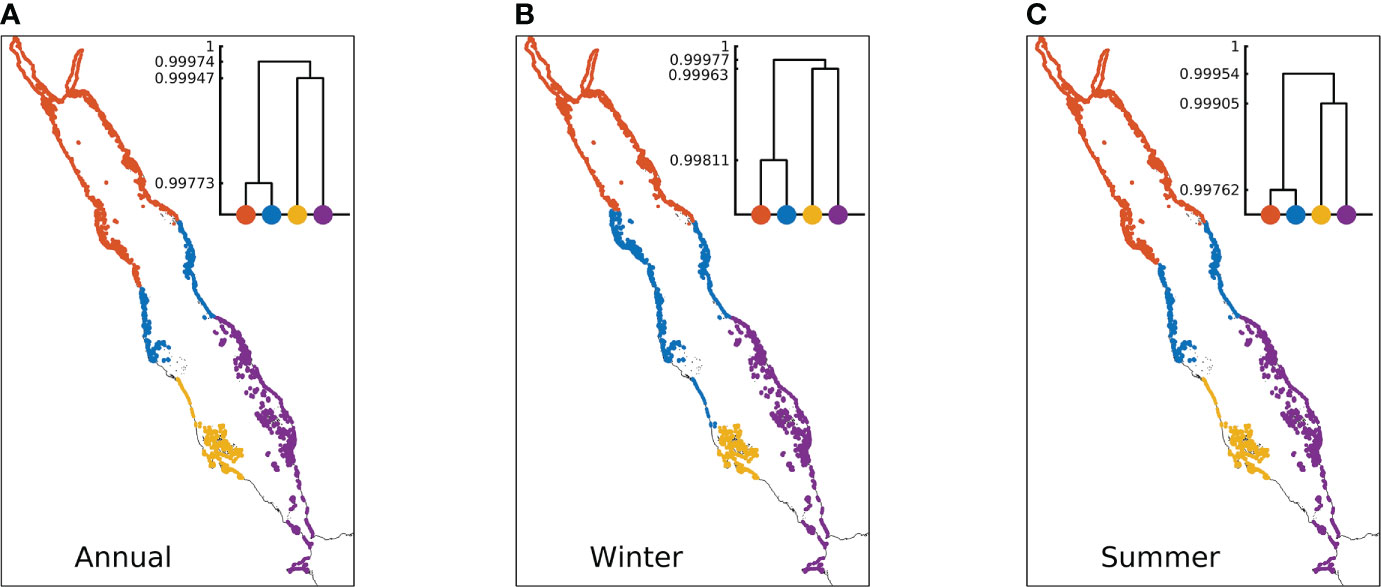
Figure 7 Clustering results for Red Sea coral reefs based on the connectivity matrix of simulations conducted during (A) the entire year, (B) winter and (C) summer. Each cluster is marked with a single colour. The representative clustering number K = 4 is selected as the cut-off threshold to depict the general basin-scale patterns. The dendrograms demonstrate the hierarchical clustering: the height of each U-shaped line that connects the data points indicates the dissimilarity between the two clusters, with a higher line indicating a less connected relationship.
The annual clustering results suggest that the basin can be divided into the northern basin, central basin, western southern Red Sea, and eastern southern Red Sea (Figure 7A). The corresponding dendrogram shows first-level separation between the southern Red Sea (yellow and purple) and the northern and central parts of the basin (orange and blue), second-level separation between the west (yellow) and east (purple) coasts of the southern Red Sea, and third-level separation between the northern basin (orange) and the central basin (blue). These results suggest that the coral reefs in the southern Red Sea (yellow and purple) and the coral reefs in the northern and central parts of the basin (orange and blue) are the least connected; the connectivity between the reefs on the west (yellow) and east (purple) coasts of the southern Red Sea is weaker than the connectivity between the reefs in the northern (orange) and central (blue) parts of the basin. The latter implies a weaker east-west connection in the southern Red Sea, in contrast to the central and northern parts of the basin where the west and east coasts are well connected.
The seasonal clustering results exhibited similar patterns to the annual results (Figure 7). Compared with summer, the central basin cluster (blue) on the east coast extends towards both the north and south during winter (Figures 7B, C). The decreased height of all U-shaped lines (i.e., decreased dissimilarity) in summer revealed that the meridional exchange along the basin becomes more frequent and the weak connection between the east and west coasts of the southern Red Sea is enhanced during this season (Figures 7B, C).
Overall, the clustering results revealed a noticeable south-north separation in the Red Sea coral reefs, followed by a weaker east-west separation between the southern reefs. The results also unravelled a marked seasonality, characterized by a spatial extension of the central-basin cluster, a less frequent meridional exchange along the basin, and a stronger east-west separation between the southern reefs during winter.
Discussion
This study provides a comprehensive, high-resolution physical connectivity atlas of the Red Sea coral reefs, which highlights three major aspects. Firstly, there is a persistent pattern of south-to-north increasing physical connectivity: the central and northern parts of the basin consistently exhibit stronger influencing/influenced strengths than the southern Red Sea regardless of the season, indicating that the central and northern coral reefs are both better sources and destinations throughout the year. Secondly, there is a regional-specific pattern of seasonality in physical connectivity, with some regional reefs exhibiting pronounced seasonality irregularly distributed throughout the basin. For example, the summer-intensified influencing strength of the Farasan Islands indicates local reefs are a better source during summer than winter. Generally, the Red Sea influencing strength is characterized by a predominant pattern of a winter-intensified west coast and a summer-intensified east coast; however, the influenced strength exhibits a more random pattern in the basin. Thirdly, the Red Sea coral reefs exhibit a noticeable south-north separation followed by a relatively weaker east-west separation between the southern reefs. As the physical connectivity is driven by circulation, a comprehensive understanding of the Red Sea general circulation is key to explain the identified physical connectivity features.
The identified south-to-north increasing pattern of physical connectivity (Figure 3) could be related to the pronounced mesoscale eddy activity in the central and northern Red Sea and a less dynamic circulation in the southern basin. The Red Sea upper overturning cell is important for the meridional transport revealed by our results, with particles released from all over the Red Sea carried both northward and southward along the basin. However, for the SRS reefs where bathymetry is shallow, such as the Farasan Islands and the Dahlak Archipelago, the local circulation is relatively weak and particles released from these reefs exhibit limited meridional transport (e.g., Figure S4-1) compared with those released from the northern and central reefs (e.g., Figure S4-2), contributing to the south-to-north increasing pattern of physical connectivity. Moreover, the strong mesoscale eddy activity in the central-northern basin results in a more rapid east-west eddy-induced transport (e.g., Figure S4-1 and S4-2) and eventually contributes to the south-to-north increasing pattern. In particular, some convex-shape coastline areas (e.g., the Yanbu region in Figure 3A) are more likely to be exposed to local eddies, thus transport of the particles released at these sites is facilitated by the eddies (Figure S4-2) in comparison with concave-shape areas such as the Ar Rayis (Figure S4-3), making the former areas better sources.
Previous research has revealed an isolation of the southern basin and homogeneity in the central and northern Red Sea (e.g. Nanninga et al., 2014; Giles et al., 2015; Saenz-Agudelo et al., 2015; Roberts et al., 2016; Raitsos et al., 2017; Wang et al., 2019). Our clustering results have also identified a noticeable basin-scale south-north separation in the whole Red Sea, followed by a relatively weaker east-west separation between the southern reefs (Figure 7A). Even though the upper overturning cell facilitates the meridional transport along the basin, particles released in the southern reefs still cannot reach the northern end within the 30-day simulation period and vice versa, resulting in the noticeable south-north separation of the Red Sea coral reefs. Meanwhile, in the southern Red Sea, the relatively weaker eddy activity compared with the central and northern parts of the basin results in a limited water exchange between the west and east coasts, eventually leading to the east-west separation between the southern reefs.
As the Red Sea circulation is characterized by a significant seasonality, this study further examined and revealed a regional-specific seasonality in the Red Sea physical connectivity (Figure 4). The circulation mechanisms behind the features demonstrated in our four case studies differ and are discussed here in a sequence from south to north.
1) Reefs in the BAM strait are better destinations during summer (Figures 6A, B). During winter, the surface circulation in the SRS experiences a northward intrusion from the Gulf of Aden (Yao et al., 2014a; Sofianos and Johns, 2015), which seems to carry slightly more particles from Djibouti through the BAM strait in winter. This intruded water considerably restrains the southward transport of particles from the SRS reefs, such as the Farasan Islands and the Dahlak Archipelago. During summer, the surface circulation in the SRS reverses into a southward outflow that is intensified along the eastern boundary before exiting through the BAM strait (Sofianos and Johns, 2003; Sofianos and Johns, 2007; Yao et al., 2014b). This substantially increases the transport of particles from the Farasan Islands southward to the strait, making the strait area a better destination during summer.
2) Reefs in the Farasan Islands are better sources during summer (Figures 5A, B). During winter, the surface northward intrusion intensifies along the western boundary at the southern end of the basin and then shifts toward the centre of the SRS (Yao et al., 2014a). The circulation in the SRS east coast is generally weak, especially around the shallow Farasan Islands, which restricts the spread of particles released in this area (e.g., Figure S4-4). In contrast, during summer, the surface southward outflow intensifies along the eastern boundary, substantially increasing the transport of particles from the Farasan Islands into the BAM strait. This southward outflow splits at the southern end of the basin and partly returns as a northward western boundary current (Sofianos and Johns, 2003; Sofianos and Johns, 2007; Yao et al., 2014b), further connecting the Farasan Islands with the Dahlak Archipelago and making the Farasan Islands better sources during summer.
3) Reefs along the central coastline between Halayeb and Port Sudan are better sources during winter (Figures 5C, D). During winter, particles released from this area are influenced by marked local eddy activity (Zhan et al., 2014; Zhan et al., 2016), with some particles travelling up to the northern end of the basin following the intense cyclonic gyre north of 24°N (Sofianos and Johns, 2003; Yao et al., 2014a; Zhai et al., 2015; e.g., Figure S4-5). During summer, the surface outflow slightly facilitates the southward transport of particles from this coastline area. Meanwhile, eddy activity weakens (Zhan et al., 2014), which significantly limits the northward transport of the particles, making this area a better destination during winter.
4) Reefs along the northern coastline between Quseer and Marsa Alam are better destinations during summer (Figures 6C, D). During winter, deep water formation occurs with significant sinking processes in the NRS (Yao et al., 2014a; Papadopoulos et al., 2015; Yao and Hoteit, 2018). Therefore, only a small portion of the particles released along the east coast of the northern basin remains on the surface and eventually reaches the west coast following the cyclonic gyre north of 24°N (e.g., Figure S4-6). During summer, with the cessation of the sinking process, this cyclonic gyre — even though weaker — steadily transports water masses from east to west (e.g., Figure S4-7), making this area a better destination during summer.
The clustering results also exhibit a circulation-driven seasonality, characterized by a winter extension of the central-basin cluster (blue) and a summer mitigation of the east-west separation between the southern reefs (Figures 7B, C). During winter, the extension of the central-basin cluster is potentially associated with the winter-intensified eddy activity, which could facilitate the spreading of particles released from the central Red Sea reefs. This pattern could also be interpreted as a summer extension of the western-SRS cluster (yellow). Indeed, during summer, the northward western boundary current in the SRS (i.e., the return flow) transports particles from the Dahlak Archipelago to the north, potentially leading to the summer northward extension of the western-SRS cluster. In addition, even though the Red Sea eddies are generally weaker during summer, an intense anti-cyclonic eddy centred at ~18.5°N develops in response to the Tokar wind jets (Zhai and Bower, 2013; Zhan et al., 2018), which enhances the water exchange between the east and west coasts. This eventually mitigates the east-west separation between the southern reefs, as indicated by the smaller U-shape line height between the western-SRS cluster and the eastern-SRS cluster (purple) during summer.
The generated physical connectivity atlas of the Red Sea coral reefs provides a reference for identifying potential connectivity hotspots from the circulation perspective and, therefore, essential supporting information for designing MPAs (Kleinhaus et al., 2020; Gajdzik et al., 2021). Reefs with a high influencing strength are potentially important sources and could be considered as effective conservation areas; reefs with a high influenced strength are potentially important sinks and could be considered as prospective refuges. For example, the reefs in Yanbu area (located on the east coast of the NRS) are potentially important sources for the whole central and northern parts of the basin, especially for the nearby reefs and those across the basin on the west coast. The seasonality of the physical connectivity atlas also provides insights for establishing species-specific conservation efforts, as the spawning season of reef organisms differs among species. For instance, winter physical connectivity features could be more informative for reef fish species Amphiprion bicinctus, which was reported to spawn during January (Nanninga et al., 2015); meanwhile, for scleractinian coral (i.e., reef-building coral) species Montipora efflorescens, which was reported to spawn during June and July (Bouwmeester et al., 2015), a physical connectivity atlas for the summer season could be more useful. On the other hand, the clustering results will help to identify the coral reefs that are highly connected with specific regions, which is especially useful when establishing conservation strategies for reefs of concern. For instance, reefs in the Dahlak Archipelago (located on the west coast of the SRS) are relatively highly connected with the nearby reefs on the west coast of the southern basin, rather than with the reefs on the east coast, implying a priority of west-coast reefs when establishing conservation strategies for reefs in the Dahlak Archipelago. For the concerned regions (such as the Dahlak Archipelago), increasing cluster number K can further refine the spatial scales of the clusters.
The physical connectivity atlas also provides easy-to-access datasets for future seascape genetic research in the Red Sea. As larval dispersal processes are strongly dependent on physical circulation, the IBC theory should be an important aspect of seascape genetics. However, due to the difficulties of acquiring physical connectivity datasets that provide circulation information needed for IBC analysis, previous seascape genetic studies in the Red Sea were mainly restricted to the IBD and IBE theories. Here, based on four published genetic datasets, our study examined the IBC theory in the Red Sea and found physical circulation to be an important factor in shaping the genetic structure of Red Sea reef species. We aim to provide a physical connectivity dataset (upon request) based on the corals reefs of the entire Red Sea to assist the future investigation of Red Sea seascape genetics.
Conclusion
A comprehensive physical connectivity atlas exclusively examining the impacts of circulation on larval dispersal processes is essential for Red Sea connectivity research. This study analysed hydrodynamic and particle tracking simulations to generate a high-resolution physical connectivity atlas of the Red Sea coral reefs. Statistical analysis based on published genetic datasets and physical connectivity suggested that circulation is important in shaping the genetic structure of Red Sea reef species. Overall, the physical connectivity atlas identified a south-to-north increasing pattern of physical connectivity in the Red Sea coral reefs, which could be a result of weak circulation (including weak mesoscale eddy activity) in the shallow southern basin coral reefs. A noticeable south-north separation was also identified in the Red Sea, which is consistent with the previous researches that revealed isolation of the southern basin and homogeneity in the central and northern parts of the basin (e.g., Nanninga et al., 2014; Giles et al., 2015; Saenz-Agudelo et al., 2015; Roberts et al., 2016; Raitsos et al., 2017; Wang et al., 2019). In addition to this basin-scale south-north separation, the results also revealed a relatively weaker east-west separation between the southern Red Sea coral reefs, potentially related to the limited east-west exchange due to the weaker local eddy activity compared with the northern and central parts of the basin. We further inspected and revealed evident regional-specific seasonality in physical connectivity associated with the remarkable seasonality of the Red Sea circulation, with the seasonal connectivity of each region determined by the local complex seasonal circulation features. As the Red Sea reef species spawn during different seasons, their genetic structure and larval dispersal might be affected by the revealed physical connectivity seasonality. This physical connectivity atlas based on the coral reefs throughout the Red Sea could provide a reference for designing marine conservation strategies from the circulation perspective and easy-to-access physical connectivity datasets for future Red Sea seascape genetic studies.
Data availability statement
The raw data supporting the conclusions of this article will be made available by the authors, without undue reservation.
Author contributions
YW: Conceptualization, Methodology, Investigation, Analysis, Validation, Visualization, Software, Writing - original draft. DR: Conceptualization, Investigation, Analysis, Writing - review and editing. GK: Analysis, Writing - review and editing. PZ: Analysis, Writing - review and editing. IH: Conceptualization, Analysis, Supervision, Writing - review and editing. All authors contributed to the article and approved the submitted version.
Funding
This research was supported by the Office of Sponsor Research (OSR) at King Abdullah University of Science and Technology (KAUST), Saudi Arabia under the Virtual Red Sea Initiative (grant no. REP/1/3268- 01-01) and by the Saudi Aramco Marine Environment Research Centre at KAUST.
Acknowledgments
We gratefully acknowledge Lily Genevier for her help in acquiring coral reef distribution datasets, and Andrea H. Devlin for her help in editing this text. We thank the reviewers and editor for their constructive comments. All model runs were conducted on the KAUST Supercomputing Laboratory (Shaheen).
Conflict of interest
The authors declare that the research was conducted in the absence of any commercial or financial relationships that could be construed as a potential conflict of interest
Publisher’s note
All claims expressed in this article are solely those of the authors and do not necessarily represent those of their affiliated organizations, or those of the publisher, the editors and the reviewers. Any product that may be evaluated in this article, or claim that may be made by its manufacturer, is not guaranteed or endorsed by the publisher.
Supplementary material
The Supplementary Material for this article can be found online at: https://www.frontiersin.org/articles/10.3389/fmars.2022.925491/full#supplementary-material
References
Alberto F., Raimondi P. T., Reed D. C., Watson J. R., Siegel D. A., Mitarai S., et al. (2011). Isolation by oceanographic distance explains genetic structure for macrocystis pyrifera in the Santa Barbara channel. Mol. Ecol. 20, 2543–2554. doi: 10.1111/j.1365-294X.2011.05117.x
Almany G. R., Connolly S. R., Heath D. D., Hogan J. D., Jones G. P., McCook L. J., et al. (2009). Connectivity, biodiversity conservation and the design of marine reserve networks for coral reefs. Coral Reefs 28, 339–351. doi: 10.1007/s00338-009-0484-x
Berenshtein I., Paris C. B., Gildor H., Fredj E., Amitai Y., Lapidot O., et al. (2018). Auto-correlated directional swimming can enhance settlement success and connectivity in fish larvae. J. Theor. Biol. 439, 76–85. doi: 10.1016/j.jtbi.2017.11.009
Berumen M. L., Arrigoni R., Bouwmeester J., Terraneo T. I., Benzoni F. (2019a). “Corals of the Red Sea,” in Coral reefs of the Red Sea coral reefs of the world. Eds. Voolstra C. R., Berumen M. L. (Cham: Springer International Publishing), 123–155. doi: 10.1007/978-3-030-05802-9_7
Berumen M. L., Hoey A. S., Bass W. H., Bouwmeester J., Catania D., Cochran J. E. M., et al. (2013). The status of coral reef ecology research in the Red Sea. Coral Reefs 32, 737–748. doi: 10.1007/s00338-013-1055-8
Berumen M. L., Roberts M. B., Sinclair-Taylor T. H., DiBattista J. D., Saenz-Agudelo P., Isari S., et al. (2019b). “Fishes and connectivity of Red Sea coral reefs,” in Coral reefs of the Red Sea coral reefs of the world. Eds. Voolstra C. R., Berumen M. L. (Cham: Springer International Publishing), 157–179. doi: 10.1007/978-3-030-05802-9_8
Berumen M. L., Voolstra C. R., Daffonchio D., Agusti S., Aranda M., Irigoien X., et al. (2019c). “The Red Sea: Environmental gradients shape a natural laboratory in a nascent ocean,” in Coral reefs of the Red Sea coral reefs of the world. Eds. Voolstra C. R., Berumen M. L. (Cham: Springer International Publishing), 1–10. doi: 10.1007/978-3-030-05802-9_1
Bouwmeester J., Baird A. H., Chen C. J., Guest J. R., Vicentuan K. C., Berumen M. L. (2015). Multi-species spawning synchrony within scleractinian coral assemblages in the Red Sea. Coral Reefs 34, 65–77. doi: 10.1007/s00338-014-1214-6
Bradford R. W., Griffin D., Bruce B. D. (2015). Estimating the duration of the pelagic phyllosoma phase of the southern rock lobster, jasus edwardsii (Hutton). Mar. Freshw. Res. 66, 213–219. doi: 10.1071/MF14065
Bruckner A. W., Dempsey A. C. (2015). “The status, threats, and resilience of reef-building corals of the Saudi Arabian Red Sea” in The Red Sea: The formation, morphology, oceanography and environment of a young ocean basin. Eds. Rasul N. M. A., Stewart I. C. F. (Berlin, Heidelberg: Springer), 471–486. doi: 10.1007/978-3-662-45201-1_27
Carvalho S., Kürten B., Krokos G., Hoteit I., Ellis J. (2019). “Chapter 3 - the Red Sea,” in World seas: an environmental evaluation, 2nd ed. Ed. Sheppard C. (Academic Press, Cambridge, Massachusetts), 49–74. doi: 10.1016/B978-0-08-100853-9.00004-X
Charette M., Smith W. (2010). The volume of earth’s ocean. Oceanog. 23, 112–114. doi: 10.5670/oceanog.2010.51
Churchill J. H., Bower A. S., McCorkle D. C., Abualnaja Y. (2014). The transport of nutrient-rich Indian ocean water through the Red Sea and into coastal reef systems. J. Mar. Res. 72, 165–181. doi: 10.1357/002224014814901994
Cowen R. K., Gawarkiewicz G., Pineda J., Thorrold S. R., Werner F. E. (2007). Population connectivity in marine systems: An overview. Oceanography 20, 14–21. doi: 10.5670/oceanog.2007.26
Cowen R. K., Lwiza K. M. M., Sponaugle S., Paris C. B. (2000). Connectivity of marine populations: Open or closed? Science 287, 857–859. doi: 10.1126/science.287.5454.857
Cowen R. K., Paris C. B., Srinivasan A. (2006). Scaling of connectivity in marine populations. Science 311, 522–527. doi: 10.1126/science.1122039
Cowen R. K., Sponaugle S. (2009). Larval dispersal and marine population connectivity. Annu. Rev. Mar. Sci. 1, 443–466. doi: 10.1146/annurev.marine.010908.163757
Doshi M., Kulkarni C. S., Ali W. H., Gupta A., Lermusiaux P. F. J., Zhan P., et al. (2019). “Flow maps and coherent sets for characterizing residence times and connectivity in lagoons and coral reefs: The case of the Red Sea,” in Oceans 2019 Mts/Ieee Seattle, 1–8. doi: 10.23919/OCEANS40490.2019.8962643
Dreano D., Raitsos D. E., Gittings J., Krokos G., Hoteit I. (2016). The gulf of Aden intermediate water intrusion regulates the southern Red Sea summer phytoplankton blooms. PloS One 11, 1–20. doi: 10.1371/journal.pone.0168440
Edwards A. J. (1987). “CHAPTER 3 - Climate and Oceanography” in Red Sea. Eds. Edwards A.J., Head S.M. (Amsterdam, Pergamon), 45–69. doi: 10.1016/B978-0-08-028873-4.50008-6
Faillettaz R., Paris C. B., Irisson J.-O. (2018). Larval fish swimming behavior alters dispersal patterns from marine protected areas in the north-Western Mediterranean Sea. Front. Mar. Sci. 5. doi: 10.3389/fmars.2018.00097
Fine M., Gildor H., Genin A. (2013). A coral reef refuge in the Red Sea. Global Change Biol. 19, 3640–3647. doi: 10.1111/gcb.12356
Fisher R., Bellwood D. R., Job S. D. (2000). Development of swimming abilities in reef fish larvae. Mar. Ecol. Prog. Ser. 202, 163–173. doi: 10.3354/meps202163
Fisher R., Leis J. M., Clark D. L., Wilson S. K. (2005). Critical swimming speeds of late-stage coral reef fish larvae: variation within species, among species and between locations. Mar. Biol. 147, 1201–1212. doi: 10.1007/s00227-005-0001-x
Froukh T., Kochzius M. (2007). Genetic population structure of the endemic fourline wrasse (Larabicus quadrilineatus) suggests limited larval dispersal distances in the Red Sea. Mol. Ecol. 16, 1359–1367. doi: 10.1111/j.1365-294X.2007.03236.x
Frys C., Saint-Amand A., Le Hénaff M., FigueiRedo J., Kuba A., Walker B., et al. (2020). Fine-scale coral connectivity pathways in the Florida reef tract: Implications for conservation and restoration. Front. Mar. Sci. 7. doi: 10.3389/fmars.2020.00312
Gajdzik L., Green A. L., Cochran J. E. M., Hardenstine R. S., Tanabe L. K., Berumen M. L. (2021). Using species connectivity to achieve coordinated large-scale marine conservation efforts in the Red Sea. Mar. pollut. Bull. 166, 112244. doi: 10.1016/j.marpolbul.2021.112244
Gennip S. J., Popova E. E., Yool A., Pecl G. T., Hobday A. J., Sorte C. J. B. (2017). Going with the flow: the role of ocean circulation in global marine ecosystems under a changing climate. Global Change Biol. 23, 2602–2617. doi: 10.1111/gcb.13586
Giles E. C., Saenz-Agudelo P., Hussey N. E., Ravasi T., Berumen M. L. (2015). Exploring seascape genetics and kinship in the reef sponge Stylissa carteri in the Red Sea. Ecol. Evol. 5, 2487–2502. doi: 10.1002/ece3.1511
Graham E. M., Baird A. H., Connolly S. R. (2008). Survival dynamics of scleractinian coral larvae and implications for dispersal. Coral Reefs 27, 529–539. doi: 10.1007/s00338-008-0361-z
Hastie T. J., Tibshirani R. J. (1987). Generalized Additive Models: Some Applications. J. Am. Stat. Assoc. 82, 371–386. doi: 10.1080/01621459.1987.10478440
Hedgecock D., Barber P. H., Edmands S. (2007). Genetic approaches to measuring connectivity. Oceanography 20, 70–79. doi: 10.5670/oceanog.2007.30
Hoteit I., Abualnaja Y., Afzal S., Ait-El-Fquih B., Akylas T., Antony C., et al. (2021). Towards an end-to-End analysis and pRediction system for weather, climate, and marine applications in the Red Sea. Bull. Am. Meteorolog Soc. 102, e99–e122. doi: 10.1175/BAMS-D-19-0005.1
Johnson S. C. (1967). Hierarchical clustering schemes. Psychometrika 32, 241–254. doi: 10.1007/BF02289588
Jones G. P., Almany G. R., Russ G. R., Sale P. F., Steneck R. S., van Oppen M. J. H., et al. (2009). Larval retention and connectivity among populations of corals and reef fishes: history, advances and challenges. Coral Reefs 28, 307–325. doi: 10.1007/s00338-009-0469-9
Kingsford M. J., Leis J. M., Shanks A., Lindeman K. C., Morgan S. G., Pineda J. (2002). Sensory environments, larval abilities and local self-recruitment. Bull. Mar. Sci. 70, 309–340.
Kleinhaus K., Al-Sawalmih A., Barshis D. J., Genin A., Grace L. N., Hoegh-Guldberg O., et al. (2020). Science, diplomacy, and the Red sea’s unique coral reef: It’s time for action. Front. Mar. Sci. 7. doi: 10.3389/fmars.2020.00090
Krokos G., Cerovečki I., Papadopoulos V. P., Hendershott M. C., Hoteit I. (2021). Processes governing the seasonal evolution of mixed layers in the Red Sea. J. Geophysic Research: Oceans 127, e2021JC017369. doi: 10.1029/2021JC017369
Leis J. M. (2007). Behaviour as input for modelling dispersal of fish larvae: behaviour, biogeography, hydrodynamics, ontogeny, physiology and phylogeny meet hydrography. Mar. Ecol. Prog. Ser. 347, 185–193. doi: 10.3354/meps06977
Manel S., Schwartz M. K., Luikart G., Taberlet P. (2003). Landscape genetics: combining landscape ecology and population genetics. Trends Ecol. Evol. 18, 189–197. doi: 10.1016/S0169-5347(03)00008-9
Marshall J., Hill C., Perelman L., Adcroft A. (1997). Hydrostatic, quasi-hydrostatic, and nonhydrostatic ocean modeling. J. Geophysic Research: Oceans 102, 5733–5752. doi: 10.1029/96JC02776
May R. C. (1974). “Larval mortality in marine fishes and the critical period concept,” in The early life history of fish. Ed. Blaxter J. H. S. (Berlin, Heidelberg: Springer), 3–19. doi: 10.1007/978-3-642-65852-5_1
McGurk M. (1986). Natural mortality of marine pelagic fish eggs and larvae: role of spatial patchiness. Mar. Ecol. Prog. Ser. 34, 227–242. doi: 10.3354/meps034227
Mitarai S., Siegel D. A., Watson J. R., Dong C., McWilliams J. C. (2009). Quantifying connectivity in the coastal ocean with application to the southern California bight. J. Geophysic Research: Oceans 114, 1–21. doi: 10.1029/2008JC005166
Moberg F., Folke C. (1999). Ecological goods and services of coral reef ecosystems. Ecol. Economics 29, 215–233. doi: 10.1016/S0921-8009(99)00009-9
Morgan Steven G. (1995). “Life and death in the plankton: larval mortality and adaptation,” in Ecology of marine invertebrate larvae, Ed. McEdward L. (Boca Raton, Florida: CRC Press), 279–322
Nanninga G. B., Saenz-Agudelo P., Manica A., Berumen M. L. (2014). Environmental gradients pRedict the genetic population structure of a coral reef fish in the Red Sea. Mol. Ecol. 23, 591–602. doi: 10.1111/mec.12623
Nanninga G. B., Saenz-Agudelo P., Zhan P., Hoteit I., Berumen M. L. (2015). Not finding nemo: limited reef-scale retention in a coral reef fish. Coral Reefs 34, 383–392. doi: 10.1007/s00338-015-1266-2
Osman E. O., Smith D. J., Ziegler M., Kürten B., Conrad C., El-Haddad K. M., et al. (2018). Thermal refugia against coral bleaching throughout the northern Red Sea. Global Change Biol. 24, e474–e484. doi: 10.1111/gcb.13895
Papadopoulos V. P., Zhan P., Sofianos S. S., Raitsos D. E., Qurban M., Abualnaja Y., et al. (2015). Factors governing the deep ventilation of the Red Sea. J. Geophysic Research: Oceans 120, 7493–7505. doi: 10.1002/2015JC010996
Paris C. B., Chérubin L. M., Cowen R. K. (2007). Surfing, spinning, or diving from reef to reef: effects on population connectivity. Mar. Ecol. Prog. Ser. 347, 285–300. doi: 10.3354/meps06985
Paris C. B., Helgers J., van Sebille E., Srinivasan A. (2013). Connectivity modeling system: A probabilistic modeling tool for the multi-scale tracking of biotic and abiotic variability in the ocean. Environ. Model. Software 42, 47–54. doi: 10.1016/j.envsoft.2012.12.006
Patzert W. C. (1974). Wind-induced reversal in Red Sea circulation. Deep Sea Res. Oceanog Abstracts 21, 109–121. doi: 10.1016/0011-7471(74)90068-0
Planes S., Jones G. P., Thorrold S. R. (2009). Larval dispersal connects fish populations in a network of marine protected areas. PNAS 106, 5693–5697. doi: 10.1073/pnas.0808007106
Raitsos D. E., Brewin R. J. W., Zhan P., Dreano D., Pradhan Y., Nanninga G. B., et al. (2017). Sensing coral reef connectivity pathways from space. Sci. Rep. 7, 1–10. doi: 10.1038/s41598-017-08729-w
Raitsos D. E., Pradhan Y., Brewin R. J. W., Stenchikov G., Hoteit I. (2013). Remote sensing the phytoplankton seasonal succession of the Red Sea. PloS One 8, e64909. doi: 10.1371/journal.pone.0064909
Raitsos D. E., Yi X., Platt T., Racault M.-F., Brewin R. J. W., Pradhan Y., et al. (2015). Monsoon oscillations regulate fertility of the Red Sea. Geophysic Res. Lett. 42, 855–862. doi: 10.1002/2014GL062882
Rasul N. M. A., Stewart I. C. F., Nawab Z. A. (2015). “Introduction to the Red Sea: Its origin, structure, and environment,” in The Red Sea: The formation, morphology, oceanography and environment of a young ocean basin springer earth system sciences. Eds. Rasul N. M. A., Stewart I. C. F. (Berlin, Heidelberg: Springer), 1–28. doi: 10.1007/978-3-662-45201-1_1
Reaka M. (2005). “Biodiversity of Caribbean coral reefs”. in Caribbean Marine Biodiversity Eds. Miloslavich P, Klein E. (Lancaster, PA: Des Tech Publishers) 259–276.
Riginos C., Liggins L. (2013). Seascape genetics: Populations, individuals, and genes marooned and adrift. Geogr. Compass 7, 197–216. doi: 10.1111/gec3.12032
Roberts M. B., Jones G. P., McCormick M. I., Munday P. L., Neale S., Thorrold S., et al. (2016). Homogeneity of coral reef communities across 8 degrees of latitude in the Saudi Arabian Red Sea. Mar. pollut. Bull. 105, 558–565. doi: 10.1016/j.marpolbul.2015.11.024
Robitzch V. (2017). The assessment of current biogeographic patterns of coral reef fishes in the Red Sea by incorporating their evolutionary and ecological background. [Doctoral dissertation]. [Thuwal]: King Abdullah University of Science and Technology.
Robitzch V., Banguera-Hinestroza E., Sawall Y., Al-Sofyani A. (2015). And voolstra, c Absence of genetic differentiation in the coral pocillopora verrucosa along environmental gradients of the Saudi Arabian Red Sea. R. Front. Mar. Sci. 2, 1–10. doi: 10.3389/fmars.2015.00005
Rousset F. (1997). Genetic differentiation and estimation of gene flow from f-statistics under isolation by distance. Genetics 145, 1219–1228. doi: 10.1093/genetics/145.4.1219
Saenz-Agudelo P., Dibattista J. D., Piatek M. J., Gaither M. R., Harrison H. B., Nanninga G. B., et al. (2015). Seascape genetics along environmental gradients in the Arabian peninsula: insights from ddRAD sequencing of anemonefishes. Mol. Ecol. 24, 6241–6255. doi: 10.1111/mec.13471
Sanikommu S., Toye H., Zhan P., Langodan S., Krokos G., Knio O., et al. (2020). Impact of atmospheric and model physics perturbations on a high-resolution ensemble data assimilation system of the Red Sea. J. Geophysic Research: Oceans 125, e2019JC015611. doi: 10.1029/2019JC015611
Sasirekha K., Baby P. (2013). Agglomerative hierarchical clustering algorithm- a review. Int. J. Sci. Res. Publications 3, 3. doi: 10.1016/j.ins.2020.12.056
Selkoe K. A., Henzler C. M., Gaines S. D. (2008). Seascape genetics and the spatial ecology of marine populations. Fish Fisheries 9, 363–377. doi: 10.1111/j.1467-2979.2008.00300.x
Selkoe K. A., Watson J. R., White C., Horin T. B., Iacchei M., Mitarai S., et al. (2010). Taking the chaos out of genetic patchiness: seascape genetics reveals ecological and oceanographic drivers of genetic patterns in three temperate reef species. Mol. Ecol. 19, 3708–3726. doi: 10.1111/j.1365-294X.2010.04658.x
Shanks A. L. (2009). Pelagic larval duration and dispersal distance revisited. Biol. Bull. 216, 373–385. doi: 10.1086/BBLv216n3p373
Shefer S., Abelson A., Mokady O., Geffen E. (2004). Red to Mediterranean Sea bioinvasion: natural drift through the Suez canal, or anthropogenic transport? Mol. Ecol. 13, 2333–2343. doi: 10.1111/j.1365-294X.2004.02227.x
Sofianos S. S., Johns W. E. (2003). An oceanic general circulation model (OGCM) investigation of the Red Sea circulation: 2. three-dimensional circulation in the Red Sea. J. Geophysic Research: Oceans 108, 1–15. doi: 10.1029/2001JC001185
Sofianos S. S., Johns W. E. (2007). Observations of the summer Red Sea circulation. J. Geophysic Research: Oceans 112, 1–20. doi: 10.1029/2006JC003886
Sofianos S., Johns W. E. (2015). “Water mass formation, overturning circulation, and the exchange of the Red Sea with the adjacent basins,” in The Red Sea: The formation, morphology, oceanography and environment of a young ocean basin springer earth system sciences. Eds. Rasul N. M. A., Stewart I. C. F. (Berlin, Heidelberg: Springer), 343–353. doi: 10.1007/978-3-662-45201-1_20
Staaterman E., Paris C. B., Helgers J. (2012). Orientation behavior in fish larvae: A missing piece to hjort’s critical period hypothesis. J. Theor. Biol. 304, 188–196. doi: 10.1016/j.jtbi.2012.03.016
Szmant A., Meadows M. G. (2006). Developmental changes in coral larval buoyancy and vertical swimming behavior: Implications for dispersal and connectivity. Proc. 10th Int. Coral Reef Symp 1, 431–437.
Treml E. A., Halpin P. N., Urban D. L., Pratson L. F. (2008). Modeling population connectivity by ocean currents, a graph-theoretic approach for marine conservation. Landscape Ecol. 23, 19–36. doi: 10.1007/s10980-007-9138-y
Treml E. A., Roberts J. J., Chao Y., Halpin P. N., Possingham H. P., Riginos C. (2012). Reproductive output and duration of the pelagic larval stage determine seascape-wide connectivity of marine populations. Integr. Comp. Biol. 52, 525–537. doi: 10.1093/icb/ics101
Triantafyllou G., Yao F., Petihakis G., Tsiaras K. P., Raitsos D. E., Hoteit I. (2014). Exploring the Red Sea seasonal ecosystem functioning using a three-dimensional biophysical model. J. Geophysic Research: Oceans 119, 1791–1811. doi: 10.1002/2013JC009641
Tsikliras A. C., Antonopoulou E., Stergiou K. I. (2010). Spawning period of Mediterranean marine fishes. Rev. Fish Biol. Fisheries 20, 499–538. doi: 10.1007/s11160-010-9158-6
Villarino E., Watson J. R., Jönsson B., Gasol J. M., Salazar G., Acinas S. G., et al. (2018). Large-Scale ocean connectivity and planktonic body size. Nat. Commun. 9, 142. doi: 10.1038/s41467-017-02535-8
Viswanadhapalli Y., Dasari H. P., Langodan S., Challa V. S., Hoteit I. (2017). Climatic features of the Red Sea from a regional assimilative model. Int. J. Climatol 37, 2563–2581. doi: 10.1002/joc.4865
Wang Y., Raitsos D. E., Krokos G., Gittings J. A., Zhan P., Hoteit I. (2019). Physical connectivity simulations reveal dynamic linkages between coral reefs in the southern Red Sea and the Indian ocean. Sci. Rep. 9, 16598. doi: 10.1038/s41598-019-53126-0
Watson J. R., Hays C. G., Raimondi P. T., Mitarai S., Dong C., McWilliams J. C., et al. (2011). Currents connecting communities: nearshore community similarity and ocean circulation. Ecology 92, 1193–1200. doi: 10.1890/10-1436.1
White C., Selkoe K. A., Watson J., Siegel D. A., Zacherl D. C., Toonen R. J. (2010). Ocean currents help explain population genetic structure. Proc. R. Soc. B: Biol. Sci. 277, 1685–1694. doi: 10.1098/rspb.2009.2214
Wolanski E., Kingsford M. J. (2014). Oceanographic and behavioural assumptions in models of the fate of coral and coral reef fish larvae. J. R. Soc. Interface 11, 20140209. doi: 10.1098/rsif.2014.0209
Wright S. (1931). Evolution in mendelian populations. Genetics 16, 97–159. doi: 10.1093/genetics/16.2.97
Xie J., Krokos G., Sofianos S., Hoteit I. (2019). Interannual variability of the exchange flow through the strait of bab-al-Mandeb. J. Geophysic Research: Oceans 124, 1988–2009. doi: 10.1029/2018JC014478
Yao F., Hoteit I. (2018). Rapid Red Sea deep water renewals caused by volcanic eruptions and the north Atlantic oscillation. Sci. Adv. 4, eaar5637. doi: 10.1126/sciadv.aar5637
Yao F., Hoteit I., Pratt L. J., Bower A. S., Köhl A., Gopalakrishnan G., et al. (2014a). Seasonal overturning circulation in the Red Sea: 2. winter circulation. J. Geophysic Research: Oceans 119, 2263–2289. doi: 10.1002/2013JC009331
Yao F., Hoteit I., Pratt L. J., Bower A. S., Zhai P., Köhl A., et al. (2014b). Seasonal overturning circulation in the Red Sea: 1. model validation and summer circulation. J. Geophysic Research: Oceans 119, 2238–2262. doi: 10.1002/2013JC009004
Zhai P., Bower A. (2013). The response of the Red Sea to a strong wind jet near the tokar gap in summer. J. Geophysic Research: Oceans 118, 421–434. doi: 10.1029/2012JC008444
Zhai P., Pratt L. J., Bower A. (2015). On the crossover of boundary currents in an idealized model of the Red Sea. J. Phys. Oceanogr. 45, 1410–1425. doi: 10.1175/JPO-D-14-0192.1
Zhan P., Gopalakrishnan G., Subramanian A. C., Guo D., Hoteit I. (2018). Sensitivity studies of the Red Sea eddies using adjoint method. J. Geophysic Research: Oceans 123, 8329–8345. doi: 10.1029/2018JC014531
Zhan P., Krokos G., Guo D., Hoteit I. (2019). Three-dimensional signature of the Red Sea eddies and eddy-induced transport. Geophysic Res. Lett. 46, 2167–2177. doi: 10.1029/2018GL081387
Zhan P., Krokos G., Langodan S., Guo D., Dasari H., Papadopoulos V. P., et al. (2021). Coastal circulation and water transport properties of the Red Sea project lagoon. Ocean Model. 161, 101791. doi: 10.1016/j.ocemod.2021.101791
Zhan P., Subramanian A. C., Yao F., Hoteit I. (2014). Eddies in the Red Sea: A statistical and dynamical study. J. Geophysic Research: Oceans 119, 3909–3925. doi: 10.1002/2013JC009563
Zhan P., Subramanian A. C., Yao F., Kartadikaria A. R., Guo D., Hoteit I. (2016). The eddy kinetic energy budget in the Red Sea. J. Geophysic Research: Oceans 121, 4732–4747. doi: 10.1002/2015JC011589
Zhan P., Yao F., Kartadikaria A.R., Viswanadhapalli Y., Gopalakrishnan G., Hoteit I. (2015). Far-Field Ocean Conditions and Concentrate Discharges Modeling Along the Saudi Coast of the Red Sea. Intakes and Outfalls for Seawater Reverse-Osmosis Desalination Facilities Environmental Science and Engineering. Eds. Missimer T.M., Jones B., Maliva R.G. (Cham: Springer International Publishing) 501–520. doi: 10.1007/978-3-319-13203-7_21
Appendices:
Appendix 1 Factors that impact dispersal
Connectivity, the exchange of individuals, primarily occurs through the dispersal processes of marine organisms (Cowen and Sponaugle, 2009). Such processes may happen during the juvenile and adult stages — when the individuals could exhibit remarkable oriented swimming abilities; but mostly during the pelagic larval stage — when larvae exhibit limited swimming ability and drift with the local currents (Cowen and Sponaugle, 2009; Planes et al., 2009). Thus, this study considers larval dispersal, i.e., the spread of larvae from natal reef sites to settlement reef sites, as an important factor in the individual exchange between distant coral reefs to establish connectivity, and neglects the dispersal of active juveniles or adults.
The larval dispersal processes substantially depend on physical circulation, as planktonic larvae — especially during the early larval stage — drift passively with the local currents (Cowen and Sponaugle, 2009; Villarino et al., 2018). In addition, the larval dispersal processes are also impacted by biological larval traits, such as the spawning period, pelagic larval duration (PLD), mortality and autonomous larval movement (Paris et al., 2007; Cowen and Sponaugle, 2009; Frys et al., 2020). These biological larval traits differ significantly among marine species. In summary:
a. Spawning period: the onset and duration of larvae production (Cowen and Sponaugle, 2009). Some species are all-year-round spawners and spawn throughout the year; other species are seasonal spawners and only spawn during a few months of the year (Tsikliras et al., 2010). As the oceanographic circulation usually exhibits various levels of seasonal variability, the timing of the spawning period will affect the final larval dispersal due to the seasonal variation in the ambient currents. As a non-species-specific study, virtual particles were released throughout the year to cover all potential spawning period scenarios.
b. PLD: the length of time that larvae remain in the ocean before settlement (Cowen and Sponaugle, 2009). PLD varies from minutes to months (Shanks, 2009), with extremes of over one year (Cowen et al., 2007; Bradford et al., 2015). Through the control of the time that larvae spend on drifting, PLD will influence the dispersal distance (Shanks, 2009) and the spatial scale of connectivity (Cowen et al., 2006; Treml et al., 2012). Since most coral reef species have a PLD shorter than 30 days, the 30-day simulation time was chosen as a reasonable representative period to investigate physical connectivity and better reflect the information needed to design MPAs (Cowen et al., 2006). However, as the genetic structure of marine populations does not form from a single larval dispersal of one generation, but is the long-term result after multiple generations, a longer simulation time of 360 days was more suitable for extracting the circulation distance used in the seascape genetic study. In addition, since two geographically distant coral reef sites in the Red Sea will not exhibit any connection within the short simulation time of 30 days, a long simulation time of 360 days enabled us to obtain robust and meaningful circulation distances between distant genetic sampling reef sites. Moreover, the simulation period of 360 days also covers the PLDs of most reef species (Gennip et al., 2017), thus extending our physical connectivity coverage to a larger range of marine species.
c. Mortality: loss of larvae due to starvation, predation, etc. (May, 1974). Mortality rates differ widely between species (McGurk, 1986; Morgan Steven, 1995), with a typical value of 18% per day (Cowen et al., 2000). Mortality also influences (usually reduces) the spatial scale of connectivity by reducing the number of larvae that survive the larval stage. Thus, implementation of mortality is important for species-specific biophysical connectivity modelling (Cowen et al., 2000; Leis, 2007). The mortality rate also varies during the larval stage (e.g., mortality rates increase with larval age) and in a species-dependent manner (Graham et al., 2008), which hampers the realization of mortality in species-specific connectivity modelling. In order to investigate physical connectivity, mortality was not accounted for in our simulations to obtain the maximum amount of information available from each virtual particle.
d. Autonomous larval movement: also termed larval behaviours, is the capacity of larvae to move spontaneously. The autonomous larval movement of marine species exhibits evident disparities: the larvae of some species have limited autonomous moving abilities during their whole PLD, such as some hard corals (Wolanski and Kingsford, 2014); the larvae of some other species develop remarkable swimming ability at a later larval stage, such as some reef fishes (Fisher et al., 2000; Staaterman et al., 2012; Berenshtein et al., 2018; Faillettaz et al., 2018). The most dominant larval behaviours that impact the dispersal processes are vertical migration and horizontal swimming (Leis, 2007). Vertical migration alters the circulation regime surrounding the larvae and eventually influence the dispersal trajectories, as oceanographic circulation varies rapidly with depth (Fisher et al., 2000; Fisher et al., 2005). Horizontal swimming allows larvae to swim in an oriented way (e.g., some fish larvae in the open ocean will navigate toward settlement reefs using their sensory capabilities; Staaterman et al., 2012), sometimes even against the ambient current, and eventually change the dispersal paths (Fisher et al., 2000; Fisher et al., 2005; Leis, 2007). Thus, autonomous larval movement should be considered in species-specific biophysical modelling to accurately simulate the dispersal process (Staaterman et al., 2012; Berenshtein et al., 2018; Faillettaz et al., 2018). Here, to investigate circulation-driven physical connectivity, particles were defined as neutrally buoyant (except for the design of releasing particles at the surface depth to imitate the positive buoyancy feature at the larvae spawning stage; Szmant and Meadows, 2006) and passive without autonomous moving ability (except for the coast-avoiding function that will re-insert particles stranded on land back into the ocean to ensure the continuation of the simulation and obtain maximum information from each particle). It is worth noting that a sensing diameter of 25 km was utilized as the criterion for particles to be regarded as reaching a certain reef site, which could be considered as a simulation of oriented swimming towards potential settlement reefs. The spatial scale of the orientation ranges largely from centimetres to tens of kilometres (Kingsford et al., 2002; Staaterman et al., 2012), and our choice of 25 km as the sensing diameter represents a broad spatial scale of orientation.
Overall, as the aforementioned biological larval traits considerably influence the dispersal processes through different mechanisms, they should be applied carefully in the species-specific biophysical connectivity modelling. However, since our study only focuses on the physical connectivity, we either followed a reasonable choice (such as for spawning period and PLD) or left the larval traits unaccounted for (such as for mortality and autonomous movement) in our simulation settings.
Biophysical connectivity modelling incorporating larval traits of important reef species is the natural next step for investigating Red Sea model-based connectivity. However, identifying the important reef species and the corresponding larval traits could be challenging. Coral genera such as Porites, Pocillopora and Acropora were reported to be the common scleractinian corals in the Red Sea, yet, their abundances may differ from south to north, and from inshore to offshore (Berumen et al., 2019a). In addition, larval traits of only a few coral species in the Red Sea have been reported and they also differ from each other - even for those belonging to the same genus (e.g., Bouwmeester et al., 2015 reported different spawning periods for species in the same genus) - which could hamper the simulations of these larval traits. Similarly, for the reef fish residing in the Red Sea coral reefs, the larval traits are also not clear for most of the species (Berumen et al., 2019b). In particular, scleractinian coral Porites lutea (though its larval traits are still not clear in the Red Sea) was reported to be the most abundant coral along the Saudi Arabian coastline and thus is a reasonable choice to investigate first (Bruckner and Dempsey, 2015).
Appendix 2 Defining physical connectivity
The termphysical connectivity refers to the exchange of individuals among marine populations that is only driven by the oceanographic circulation. Thus, physical connectivity only concerns the process of larvae that spawned at a certain source (coral reef) site passively drifting with the local currents and settling at a certain destination site. In general, connectivity is not solely determined by larval dispersal, but is also impacted by the processes of post-settlement survival and the reproduction of settled new migrants (Hedgecock et al., 2007; Cowen and Sponaugle, 2009). Here, physical connectivity only focuses on the process of larval dispersal, without considering post-settlement survival or reproduction; the larvae were also defined as passively drifting with currents without exhibiting swimming abilities during the entire dispersal process (see section Appendix 1 for a discussion on the factors that impact dispersal) to investigate the connectivity driven only by the circulation dynamics.
Appendix 3 Application of sensing diameter and smoothing diameter
In order to capture the basin-scale physical connectivity features, a sensing diameter of 25 km was implemented. Due to the shallow bathymetry of most coral reef sites in the Red Sea, particles with active trajectories may be retained at deeper depths without actually reaching the coral reef site grid, even though they come very close to the reef site. Thus, with a short sensing diameter such as 1 km (i.e., length of a reef site grid), the results will be dominated by the inner-connectivity between reefs that are spatially close to each other, instead of the larger basin-scale outward-connectivity that this study principally aimed to investigate. For instance, reefs in the Dahlak Archipelago would be identified as hotspots if 1 km sensing diameter was used, because the proximity and closed nature of the local reef complexes result in strong inner-connections; however, this study is concerned with the outward-connections between the Dahlak Archipelago and regions such as CRS, which would not be successfully captured with 1 km sensing diameter due to the noise of inner-connections. By choosing a sensing diameter of 25 km, we aimed to eliminate the noise of inner-connectivity while focusing on the targeted question of a broad basin-scale physical connectivity atlas.
In addition, a smoothing diameter of 25 km was also applied to our influencing/influenced strengths atlas. Since some particles released from the inshore reef sites may be trapped within the shallow water due to weak local circulation (e.g., Figure S5 indicates trapped particles with short travel distance released from the inshore sites along the northern Red Sea east coast), the influencing/influenced strengths atlas will be characterized by a gradient along the shelf (i.e., lower values at inshore and higher values at offshore). As such an along-shelf (i.e., inshore-offshore) gradient is not within the scope of this study, a smoothing diameter of 25 km is applied to the influencing/influenced strengths atlas to eliminate the noise of along-shelf variation and focus on the basin-scale features.
Keywords: Red Sea, circulation-driven physical connectivity, Connectivity Modelling, Lagrangian particle tracking, connectivity atlas, marine conservation, seascape genetics, Isolation By Circulation
Citation: Wang Y, Raitsos DE, Krokos G, Zhan P and Hoteit I (2022) A Lagrangian model-based physical connectivity atlas of the Red Sea coral reefs. Front. Mar. Sci. 9:925491. doi: 10.3389/fmars.2022.925491
Received: 21 April 2022; Accepted: 12 October 2022;
Published: 28 October 2022.
Edited by:
Nina Yasuda, The University of Tokyo, JapanReviewed by:
Miguel Angel Ahumada-Sempoal, University of the Sea, MexicoEmmanuel Hanert, Université Catholique de Louvain, Belgium
Copyright © 2022 Wang, Raitsos, Krokos, Zhan and Hoteit. This is an open-access article distributed under the terms of the Creative Commons Attribution License (CC BY). The use, distribution or reproduction in other forums is permitted, provided the original author(s) and the copyright owner(s) are credited and that the original publication in this journal is cited, in accordance with accepted academic practice. No use, distribution or reproduction is permitted which does not comply with these terms.
*Correspondence: Ibrahim Hoteit, ibrahim.hoteit@kaust.edu.sa