Linkages Between Optical and Molecular Signatures of Dissolved Organic Matter Along the Yangtze River Estuary-to-East China Sea Continuum
 Xingnian Sun1
  Penghui Li
 Yuping Zhou
 Chen He
 Yuntao Wang
 Quan Shi
 Ding He
- 1Shenzhen Marine Environment Monitoring Center, State Oceanic Administration of China, Shenzhen, China
- 2School of Marine Sciences, Sun Yat-Sen University, Zhuhai, China
- 3Southern Marine Science and Engineering Guangdong Laboratory (Zhuhai), Zhuhai, China
- 4School of Earth Science, Zhejiang University, Hangzhou, China
- 5School of Environmental and Municipal Engineering, Qingdao University of Technology, Qingdao, China
- 6State Key Laboratory of Heavy Oil Processing, China University of Petroleum, Beijing, China
- 7State Key Laboratory of Estuarine and Coastal Research, East China Normal University, Shanghai, China
- 8State Key Laboratory of Satellite Ocean Environment Dynamics, Second Institute of Oceanography, Ministry of Natural Resources, Hangzhou, China
- 9Department of Ocean Science and Hong Kong Branch of the Southern Marine Science and Engineering Guangdong Laboratory (Guangzhou), The Hong Kong University of Science and Technology, Hong Kong, Hong Kong SAR, China
Changes in the molecular composition of dissolved organic matter (DOM) and its light-absorbing component (CDOM) along the river–coastal ocean continuum are crucial for better understanding the source and fate of DOM in coastal oceans. Both optical (absorbance and fluorescence) techniques and ultrahigh-resolution mass spectrometry have been widely used to trace DOM cycling. However, to the best of our knowledge, the linkage between these two techniques is rarely investigated along the river–coastal ocean continuum. In this regard, bulk characterization, optical techniques, and ultrahigh-resolution mass spectrometry [Fourier transform ion cyclotron resonance mass spectrometer (FT-ICR MS)] were applied to determine the DOM chemistry along a spatial transect from the Yangtze River Estuary (YRE) to the East China Sea. The results showed that DOM in the YRE was mainly controlled by the mixing of freshwater and seawater. Besides terrestrial input, multiple sources (tributary input from the Huangpu River, wastewater input, and sediment resuspension and subsequent release at the turbidity maximum zone) have been identified. In addition, the linkages between CDOM and thousands of formulas were developed based on Spearman’s rank correlations between optical parameters and FT-ICR MS peaks. The linkages showed that the molecular groups associated with the optical parameters generally agreed with conventional biogeochemical interpretations. Nevertheless, each technique has its unique advantage and weakness in interpreting DOM composition. Therefore, the combination of the untargeted FT-ICR MS approach and optical techniques could be valuable for studying the DOM sources and transformation in large river estuarine systems.
Introduction
Estuaries are the major channels transferring dissolved organic matter (DOM) from land to the coastal ocean, playing a crucial role in biogeochemical element cycling (Li et al., 2015). The transport of DOM from estuaries to coastal oceans represents a fundamental component of the global biogeochemical cycle (Bianchi, 2011; Cao et al., 2018), which has gained increasing attention (Hedges et al., 1997; Benner, 2004). DOM provides an essential source of energy and nutrients, and affects nutrient cycles, oxygen levels, and microbial communities in aquatic environments (Findlay and Sinsabaugh, 2003). The extent of these influences relies not only on the abundance but also on the sources and chemical composition of DOM (Hansell and Carlson, 2015). Primary sources of DOM in estuaries and coastal oceans include terrestrial plants, soils, sediment resuspension, microbes, and marine phytoplankton (Li et al., 2015; Canuel and Hardison, 2016). Moreover, anthropogenic activities such as urban and industrial runoff (wastewater discharges) can further complexify the DOM abundance, chemical composition, and bioavailability, especially in densely populated estuaries (Spencer et al., 2007; He et al., 2020).
In the estuarine zone, the salinity, ion strength, and oxidation–reduction potential changed sharply, which affected the transformation, adsorption, desorption, and sedimentation of organic matter (OM) (Canuel et al., 2012). Although the physical mixing of freshwater and marine water is usually one of the dominant processes affecting the DOM distribution and transformations, other processes have been noted to play important roles, including removal processes such as photochemical and biological degradation, and adsorption to particles, and addition processes such as in situ production and sediment resuspension (Li et al., 2015). All these removal and addition processes highly affect DOM composition and sources. In this context, assessing the DOM composition and source would be the first step to understand its transformation in estuaries. The carbon isotopic composition is a well-established tool for differentiating DOM sources, with marine DOM having higher δ13C values than terrestrial DOM (Hedges et al., 1997; Lalonde et al., 2014). The UV–Vis absorbance and fluorescence spectroscopy were widely used in characterizing the chromophoric DOM (CDOM), an optically active fraction of DOM, and thus infer the overall DOM source and its biogeochemical cycling (Coble, 2007; Li and Hur, 2017). Moreover, excitation–emission matrix coupled with parallel factor analysis (EEM-PARAFAC) was applied in combination with δ13C to further constrain the DOM sources (Osburn and Stedmon, 2011; Cawley et al., 2012; Ya et al., 2015). Both conservative and non-conservative mixing behaviors of various fluorescent components have been observed spatially from the freshwater to seawater regions (Stedmon and Markager, 2005; Yang et al., 2013; Li et al., 2015), suggesting complex factors controlling the DOM dynamics in estuaries.
Although stable carbon isotopes and optical techniques are helpful in elucidating spatial and temporal variations in DOM sources, they cannot provide the molecular composition of DOM, which is an important determinant of DOM lability and fate (Hansell and Carlson, 2015; Mostovaya et al., 2017). Ultrahigh-resolution mass spectrometry [e.g., Fourier transform ion cyclotron resonance mass spectrometer (FT-ICR MS)] is introduced to investigate the molecular composition of DOM (Kujawinski et al., 2004; Koch and Dittmar, 2006), and has shown promising applications in various aquatic environments (Nebbioso and Piccolo, 2013; Minor et al., 2014). FT-ICR MS has aided in identifying DOM transformation processes from terrestrial to marine biomes (Sleighter and Hatcher, 2008; Medeiros et al., 2015; Seidel et al., 2015). In addition, the linkage between optical and molecular properties of DOM in natural aquatic systems is a subject with rising interest in the aquatic biogeochemistry field (Osburn and Bianchi, 2016). For instance, the combination of optical properties and FT-ICR MS has been applied recently to a few natural systems, such as a boreal river, a subtropical wetland, and the Mediterranean Sea, in order to further understand the chemical composition and transformation of DOM (Stubbins et al., 2014; Wagner et al., 2015; Martínez-Pérez et al., 2017). These studies have recognized that chemical composition at the molecular level is closely associated with many optical indices (e.g., absorbance, relative abundance of fluorescent components) (Stubbins et al., 2014; Kellerman et al., 2015). However, previous studies usually focused on freshwater or marine water systems (Stubbins et al., 2014; Martínez-Pérez et al., 2017). It remains unclear whether many previously reported relationships are still applicable to a typical large estuary–coastal ocean transect (Martínez-Pérez et al., 2017).
The Yangtze (Changjiang) River is the longest river in China and the third-largest river in the world. The average discharge is about 9.03×10¹¹ m3 per year, consisting of more than 80% of the total freshwater discharged into the East China Sea (Yu et al., 2011). The Yangtze River estuary (YRE) is located at the subtropical zone. The east part of YRE is affected by Kuroshio water and upwelling. The western side is affected by Qiantang River, while Taiwan Warm Current also affects this area, making YRE one of the most complex continental shelf coastal areas (Zhang et al., 2007). Previous studies primarily focused on the spatiotemporal variations of DOM in the YRE using optical techniques and high-resolution mass spectrometry and identified both conservative and non-conservative behaviors (Sun et al., 2014; Li et al., 2015; Chen et al., 2016; Zhu et al., 2018; Zhou et al., 2021). Li et al. (2015) suggested that the turbidity maximum zone (TMZ) played a key role in affecting the optical properties of surface water DOM. However, there exist multiple DOM sources, such as tributary input, wastewater discharge, and nearby salt marsh in the YRE, which could result in the complex dynamics of DOM (Li et al., 2015; Chen et al., 2016). Previous studies mostly focused on the bulk [e.g., dissolved organic carbon (DOC)] and optical properties of DOM (Gan et al., 2016; Song et al., 2017), presenting limited information on DOM molecular composition. Although an increasing number of studies have explored the molecular composition of DOM in estuarine environments such as a river to ocean transect at the lower Chesapeake Bay (Sleighter and Hatcher, 2008), the Amazon River to the West Atlantic Ocean (Seidel et al., 2015), and the Delaware Estuary (Osterholz et al., 2016), only two molecular-level studies have been performed in the YRE (Zhou et al., 2021; Zhou et al., 2022). However, the linkages between optical and molecular composition of DOM are still not explored, limiting our understanding of the organic matter sources and transformation across this typical large estuary and oceanic continuum. Therefore, combining bulk, optical, and molecular approaches, this study aims to (i) determine the molecular diversity of DOM in the YRE and East China Sea and its major controlling factors, and (ii) identify the linkages of the isotopic and optical properties with the molecular composition along this typical large river to coastal ocean continuum system.
Materials and Methods
Study Area and Sampling Strategy
The study area included the entire YRE and part of the East China Sea (Figure 1). During the 2017 summer cruise, water samples were collected from YE1 to YE18 Surface water (1.5 m below surface) samples were collected at all stations, while samples at middle and bottom depths were collected at some stations. This collecting strategy allowed us to obtain 38 samples in total (Zhou et al., 2021). All water samples were collected by Nalgene bottles [cleaned with acidified ultrapure water (pH = 2) and ultrapure water]. Bottles were rinsed with sample water before sampling. In situ water temperature, salinity, turbidity, and dissolved oxygen concentration were obtained from conductivity–temperature–depth (CTD) equipment (SBE-25 plus, Sea-Bird, USA) on board. Water samples were immediately filtered with precombusted 0.7-μm glass fiber filters (Whatman GF/F) and 0.22-μm membrane filters (Millipore) subsequently to remove particles, algal aggregates, and most bacteria. The filtrates were then stored at −20°C in the dark before further analysis.
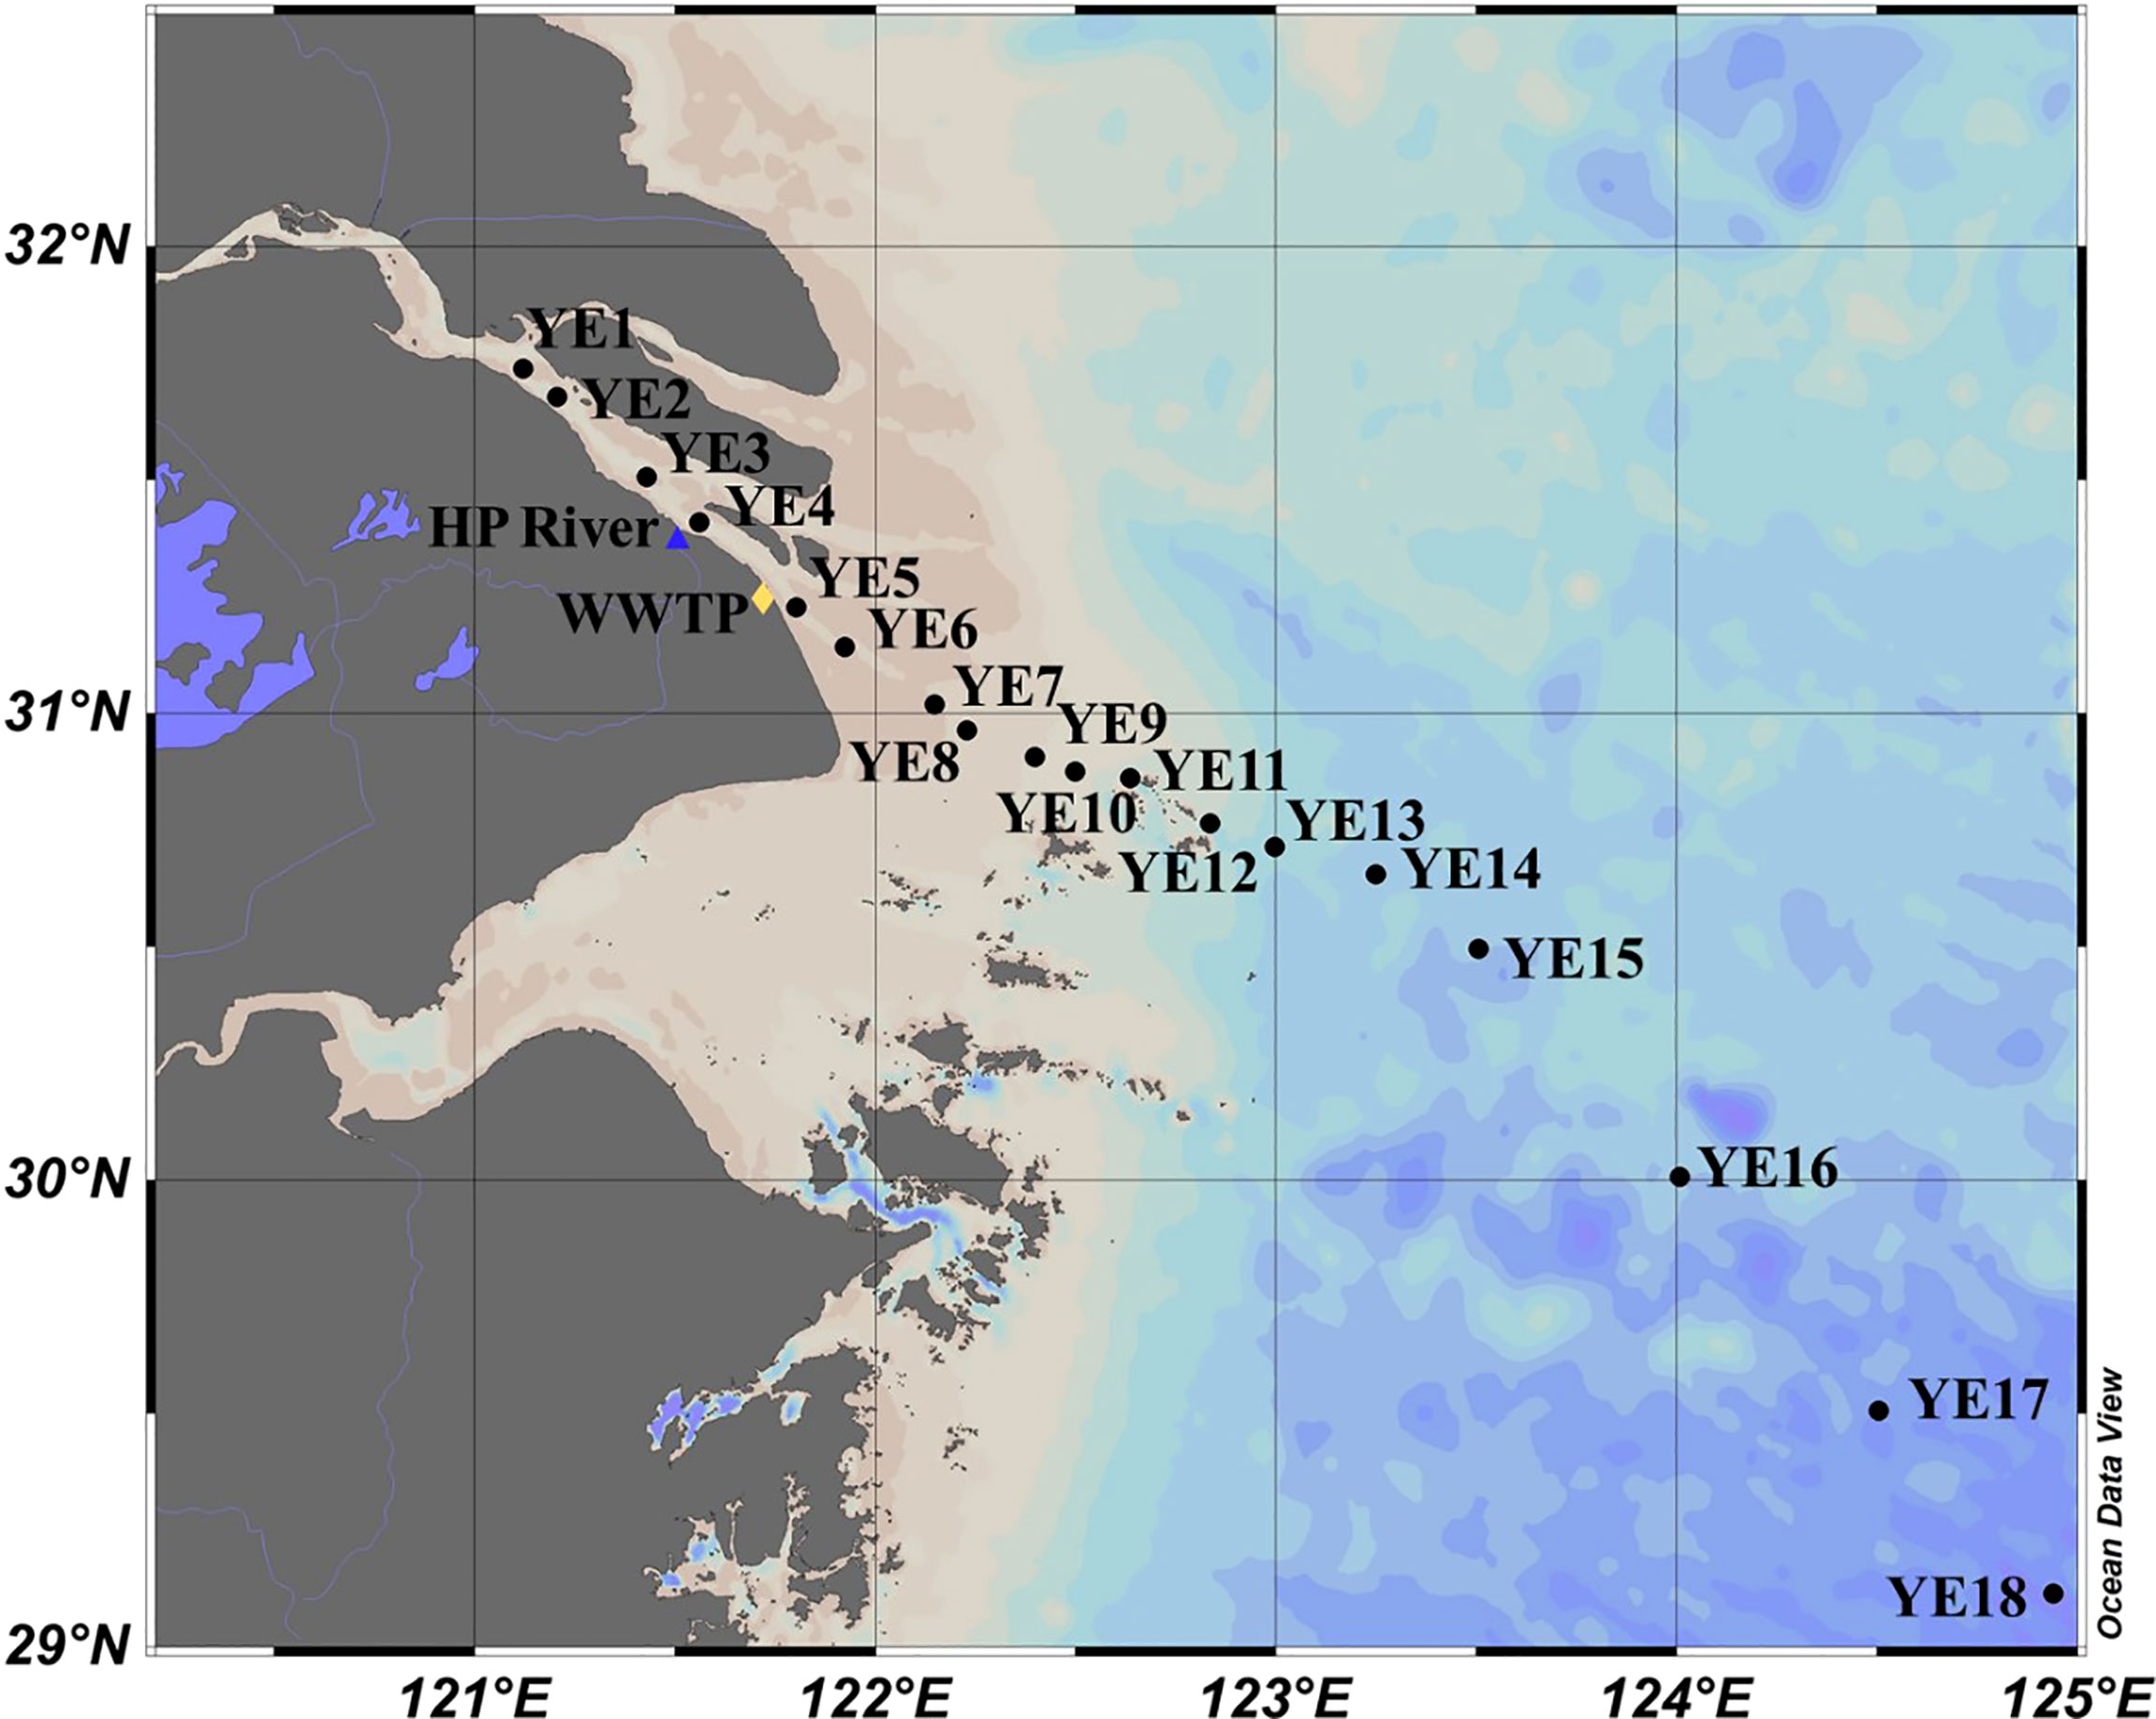
Figure 1 Sampling stations in the Yangtze Estuary and East China Sea. The confluence of the Huangpu River (HP) and the Yangtze River is marked with a blue triangle, and the location of Bailonggang wastewater treatment plant (WWTP) is marked with a yellow diamond.
Nutrients and DOC Measurements
Concentrations of nutrients (NO3-, NO2-, NH4+, PO43-, and SiO32-) were measured by UV–Vis microplate spectroscopy (Multiscan Spectrum, Thermo Scientific) following a modified method by Grasshoff et al. (2009). The dissolved inorganic nitrogen (DIN) concentration is the total of NH4+, NO2-, and NO3-, and is reported as µM. DOC concentrations were measured as non-purgeable organic carbon (NPOC) on a Shimadzu TOC-L instrument by high-temperature catalytic oxidation (Huguet et al., 2009). Standard solutions of DOC were prepared by dissolving potassium hydrogen phthalate into ultrapure water and used as DOC references. In addition, international reference low-carbon water and deep seawater (provided by Prof. D. Hansell at the University of Miami, USA) are measured as additional control to calibrate the instrument, with variation coefficient less than 5%.
Absorbance and Fluorescence Measurements
The UV–Vis absorbance and fluorescence spectral measurements were performed on an Aqualog (Horiba, Japan) absorbance–fluorescence spectrometer with 1-cm path length quartz cuvettes. Milli-Q water was used as a reference. The absorption coefficient was converted from absorbance, by multiplying the conversion factor 2.303 and dividing by the path length. In this study, the absorption coefficient at 254 nm (a254) was taken as a quantitative measure of CDOM (Li and Hur, 2017). Excitation emission–matrices (EEMs) of fluorescence spectra were generated following the settings described by Wang et al. (2019). The fluorescence intensity was divided by the area of the Raman peak and thus reported in Raman units (RU). Various commonly used compositionally based absorbance and fluorescence optical indices were calculated following the equations as previously described (Table S1). Specifically, the specific ultraviolet absorbance at 254 nm [SUVA254 (L mg C-1 m−1)] was positively associated with aromatic content, with a higher number indicating greater aromatic content (Weishaar et al., 2003). The slope ratio (SR) was calculated based on Helms et al. (2008) to assess the average molecular weight of DOM. Fluorescence index (FI) indicates the relative contribution of terrestrial and microbial sources (Mcknight et al., 2001; Cory et al., 2010); humification index (HIX) indicates the humic substance content or the extent of humification (Ohno, 2002), which has been shown to increase with the increasing degree of DOM aromaticity. Both the biological index (BIX) and freshness index (FrI) are calculated to indicate autotrophic productivity and the proportion of recently produced DOM (Parlanti et al., 2000; Huguet et al., 2009; Wilson and Xenopoulos, 2009). In addition, all EEMs were subjected to parallel factor analysis (PARAFAC) using the DOMFluor toolbox (Stedmon and Bro, 2008), following the procedures described in previous studies in the YRE (Li et al., 2015).
Stable Carbon Isotope Measurements of SPE-DOM
DOM was extracted from 1 L of water using solid-phase extraction (SPE) with cartridges filled with a styrene divinyl benzene polymer (Agilent Bond Elut PPL, 500 mg, 6 ml), as described by Dittmar et al. (2008). The stable carbon isotope ratios (δ13C) of SPE-DOM were measured in duplicates on an isotope ratio-monitoring mass spectrometer (Finnigan MAT 253, Thermal Scientific, USA) and were reported in δ notation relative to the Vienna Pee Dee Belemnite. Precision and accuracy were within 0.2‰, and procedural blanks did not yield detectable amounts of contamination (Zhou et al., 2021).
Molecular Composition of SPE-DOM Revealed by FT-ICR MS
A 9.4-T electrospray ionization Bruker Apex FT-ICR MS at the State Key Laboratory of Heavy Oil Processing, China University of Petroleum-Beijing, was used to precisely characterize the molecular composition of SPE-DOM using negative electrospray ionization mode. The procedure followed a previous study by He et al. (2020). Relative peak intensities were calculated based on the summed intensities of all assigned peaks in each sample to assess DOM composition semi-quantitatively. The elements (C, H, O, N, and S), formulas (CHO, CHON, CHOS, and CHONS), and others [the ratio of hydrogen to carbon (H/C), the ratio of oxygen to carbon (O/C), double bond equivalent (DBE), and aromaticity index (AImod)] were obtained based on the magnitude-weighted calculation to the analysis of DOM composition (Koch and Dittmar, 2006; Koch and Dittmar, 2016). Assigned molecular formulas were categorized into different compound groups (Martínez-Pérez et al., 2017; Li et al., 2019): sugars (1.6 < H/C < 2.0, 0.7 < O/C < 1.0, and N = 0), peptides (1.5 < H/C < 2.0, O/C < 0.9, and N > 0), highly aromatic compounds with aliphatic side chains such as polyphenols (0.50 < AImod < 0.66), condensed combustion-derived dissolved black carbon (BC, AImod ≥ 0.66), highly unsaturated compounds (HU, AImod < 0.50, H/C < 1.5, and O/C < 0.9), unsaturated aliphatic compounds (UA, 1.5 < H/C ≤ 2, O/C < 0.9, and N = 0), and carboxyl-rich alicyclic molecules (CRAM, 0.3 < DBE/C < 0.68, 0.2 < DBE/H < 0.95, and 0.77<DBE/O<1.75). The molecular lability index (MLBL, the relative abundance of molecular formulas with H/C ≥ 1.5) was calculated to evaluate the overall lability of DOM (D’andrilli et al., 2015). The degradation index (IDEG) was calculated to indicate the degradation state of the DOM (Flerus et al., 2012). The relative intensity of t-peaks (RAterr) and the ratio of terrestrial peaks to marine peaks (Iterr) were calculated to trace the terrestrial DOM along the transect (Medeiros et al., 2016).
Statistical Analyses
The relative abundance (%) of each PARAFAC component was calculated by dividing the PARAFAC component intensity by the sum of all components’ fluorescence intensities within a sample. Pearson correlations were conducted among isotopic, optic, and molecular parameters using MATLAB. Pairwise Spearman’s rank correlations were obtained between optical indices and normalized mass peak intensities (Wagner et al., 2015). In this study, correlations were considered significant at the 99% confidence level (p < 0.01).
Results
Hydrography Background
The surface water salinity ranged from 0.2 to 35.5 and showed an increasing trend seaward (Figure S1). Based on previous studies (Li et al., 2015; Zhou et al., 2021) and the turbidity measured in this study, the turbidity maximum zone is mainly confirmed to be located at YE5 to YE11 during this sampling event (Figure S1), although this zone is also dynamically fluctuated depending on the river discharge and tidal effects (Li et al., 2015).
DOC and Bulk Physicochemical Background
The DIN (the sum of NO3-, NO2-, and NH4+), PO43-, and SiO32- concentrations all showed decreasing trends with increasing salinity, suggesting the dilution of freshwater from the Yangtze River with high nutrient concentrations by seawater with low nutrient concentrations (Figure S1). The NO3- is the dominant DIN form, and it also showed the highest concentration at the TMZ (YE6). Similarly, both NH4+ and NO2- showed the highest concentrations at YE7, located at the TMZ. The concentrations of SiO32- ranged from 0.5 to 129.6 µM, and they negatively correlated with salinity. The highest concentrations of SiO32- were also observed at YE5 and YE6. The primary source of SiO32- was from the weathering of rocks, suggesting the dilution of SiO32- with marine water.
The DOC concentrations were from 62.9 to 123.3 µM, 68.0 to 93.4 µM, and 60.0 to 114.7 µM in the surface, middle, and bottom water layers, respectively (Figure S1). In general, a negative correlation (p < 0.01) between concentrations of DOC and salinity was observed.
Spatial Variations of Stable Carbon Isotopic Composition of SPE-DOM
The δ13C values ranged from −28.0‰ to −23.4‰, −26.3‰ to −23.5‰, and −28.2‰ to −23.2‰ for the surface, middle, and bottom samples, respectively (Figure S2). The δ13C values of terrestrial and marine DOM usually ranged from −28‰ to −25‰, and from −22‰ to −19‰, respectively (Raymond and Bauer, 2001; Osburn and Stedmon, 2011). Therefore, the δ13C values obtained in this study indicated the mixing of OM from both terrestrial and marine inputs. There is a positive correlation (p < 0.01) between δ13C and salinity.
Optical Properties: UV–Vis Absorbance and Fluorescence
The CDOM absorption coefficient a254 was from 1.15 to 8.98 m−1; the SUVA254 ranged from 0.59 to 3.32 L mg−1 m−1. Both a254 and SUVA254 decreased with increasing salinity (Figure S2) and showed negative correlations with salinity (R2 = 0.94 for a254 and R2 = 0.80 for SUVA254, both p < 0.01). The slope ratios (SR) were from 0.95 to 5.37, 1.09 to 5.53, and 0.83 to 5.30, in surface, middle, and bottom layer samples, respectively. SR showed a sharp increase in high-salinity area, suggesting decreasing averaged molecular weight of CDOM with increasing salinity (Helms et al., 2008).
HIX ranged from 0.24 to 0.74, 0.24 to 0.65, and 0.30 to 0.72 from the surface, middle, and bottom layers, respectively. BIX ranged from 0.89 to 1.40, 0.99 to 1.28, and 0.89 to 1.36 for the surface, middle, and bottom layers, respectively (Figure S2).
Four fluorescent components were identified by PARAFAC, including two humic-like components (C2 and C3), one tyrosine-like component (C1), and one tryptophan-like component (C4) (Figure 2). Further comparisons with previous studies using the OpenFluor database (Table S2) revealed that C1 is associated with free and protein-bound amino acids, which are usually ascribed to autochthonous DOM (Coble, 1996; Cory and Mcknight, 2005). C4 had a fluorescence signal similar to the tyrosine-like signal (Stedmon et al., 2011). C2 represents terrestrial humic-like fluorescence in high nutrient and wastewater impacted environments, while C3 represents microbial humic-like fluorescence (Murphy et al., 2011).
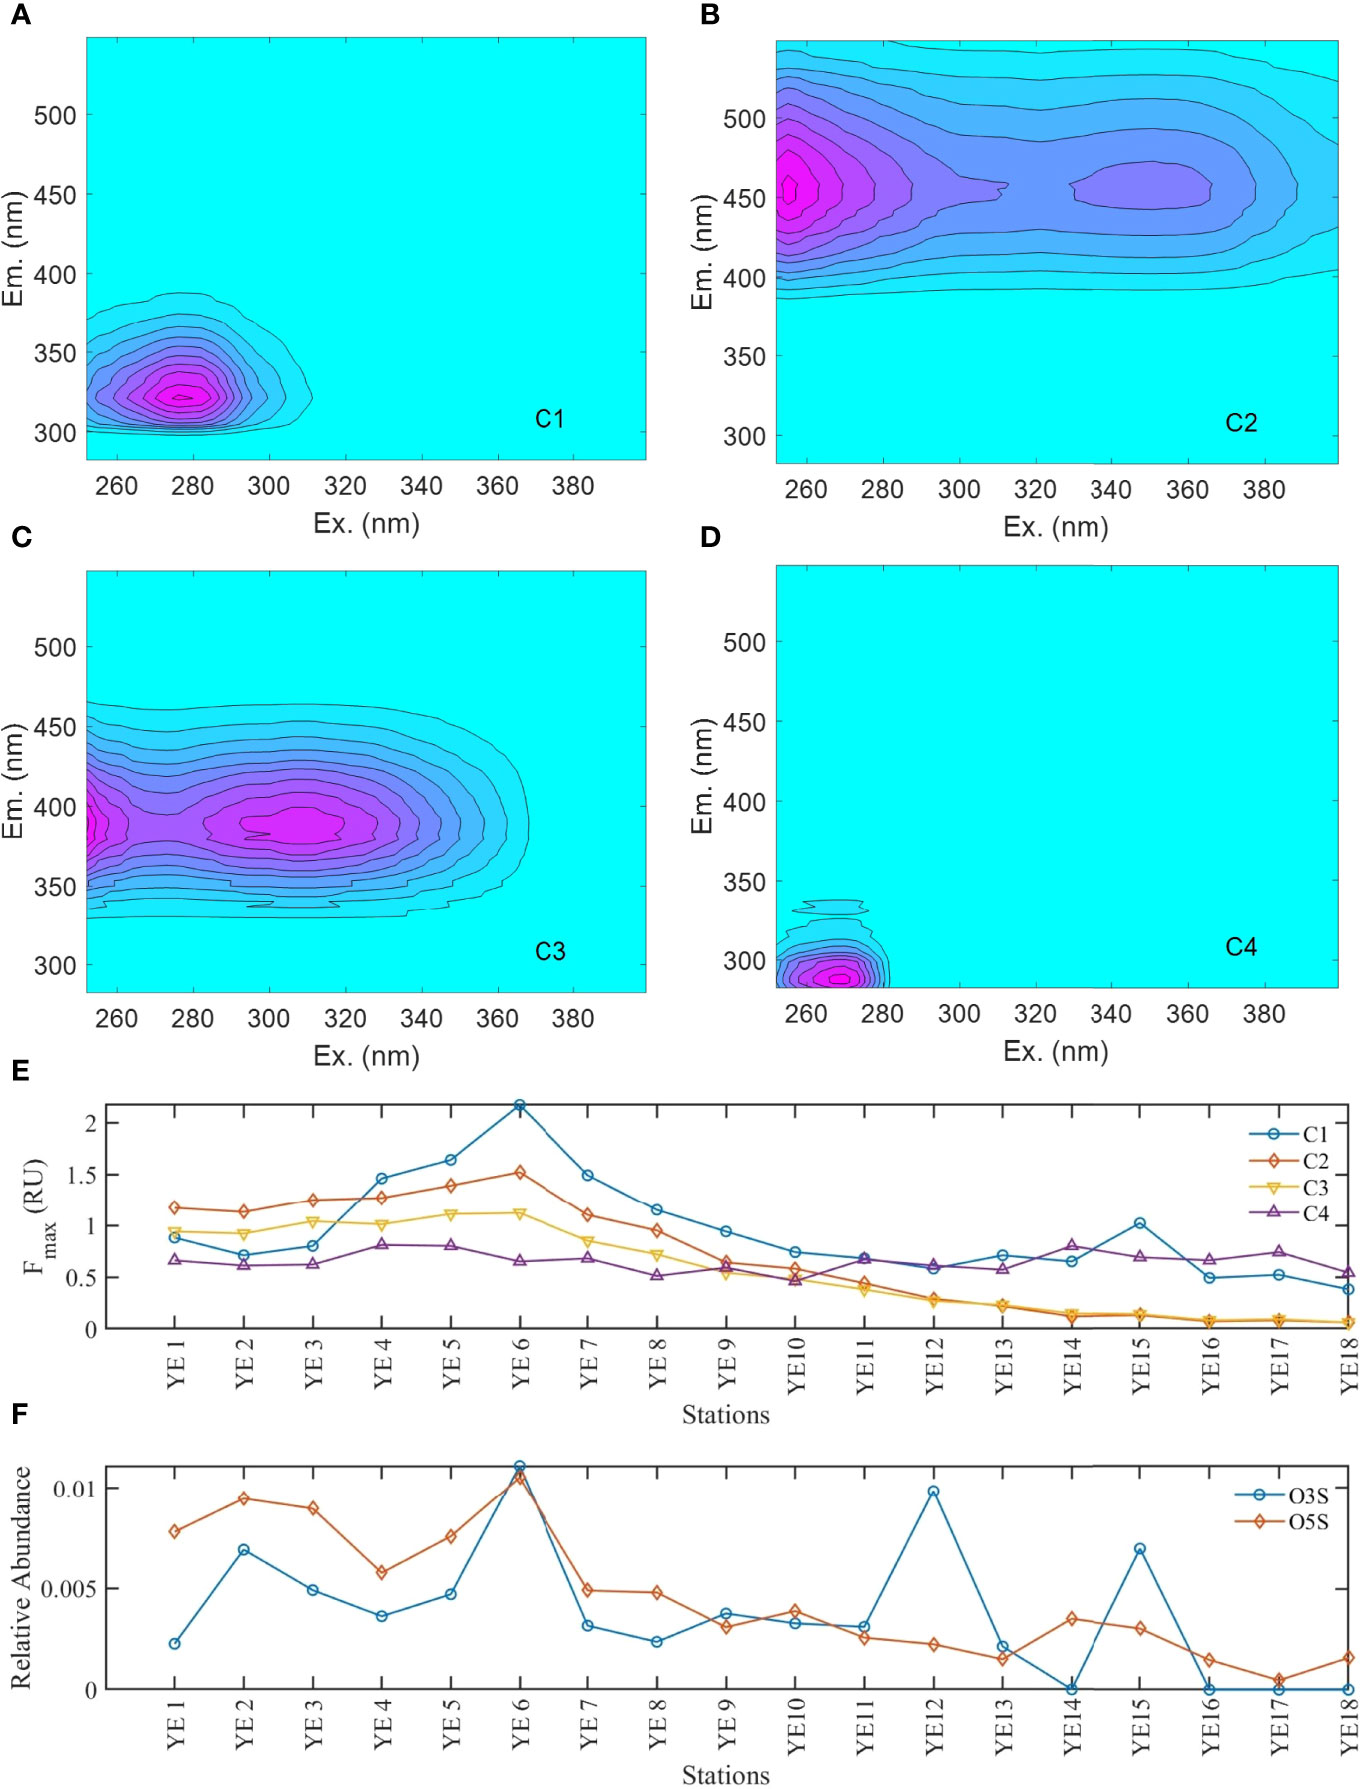
Figure 2 Fluorescence spectra of four PARAFAC components (A–D), Fmax of four PARAFAC components (E), relative abundance of O3S and O5S formulas (F), and the ratios of relative abundance of O3S and O5S formulas to other organic sulfurs (G) along the Yangtze Estuary transect.
The fluorescence intensities of C2 and C3 were closely correlated (R2 = 0.99, p < 0.001), suggesting that they could be derived from a similar source and controlled by similar factors (Stedmon and Markager, 2005). They both negatively correlated with salinity (p < 0.001). In contrast, although both C1 and C4 belong to protein-like components, they showed distinct behaviors (Figure 2). The absolute intensity of C1 showed a weak negative correlation with salinity (R2 = 0.52, p < 0.01), whereas no correlation was observed between the salinity and fluorescence intensity of C4. The relative percentages of C2 and C3 both showed negative correlations with salinity. There was no significant correlation between the salinity and relative percentage of C1, whereas a significant positive correlation was observed between the salinity and relative percentage of C4.
Molecular Compositions
The FT-ICR MS technique applied here allowed for the assignment of 7,398 unique molecular formulas in the mass range of 210–730 Da in the 38 DOM samples of the Yangtze River to East China Sea continuum (Table 1), providing a fingerprint to assess its sources and alterations (Stubbins et al., 2010). Although only 1,117 common molecular formulas were present in all samples, they account for >50% of the intensity in each sample.
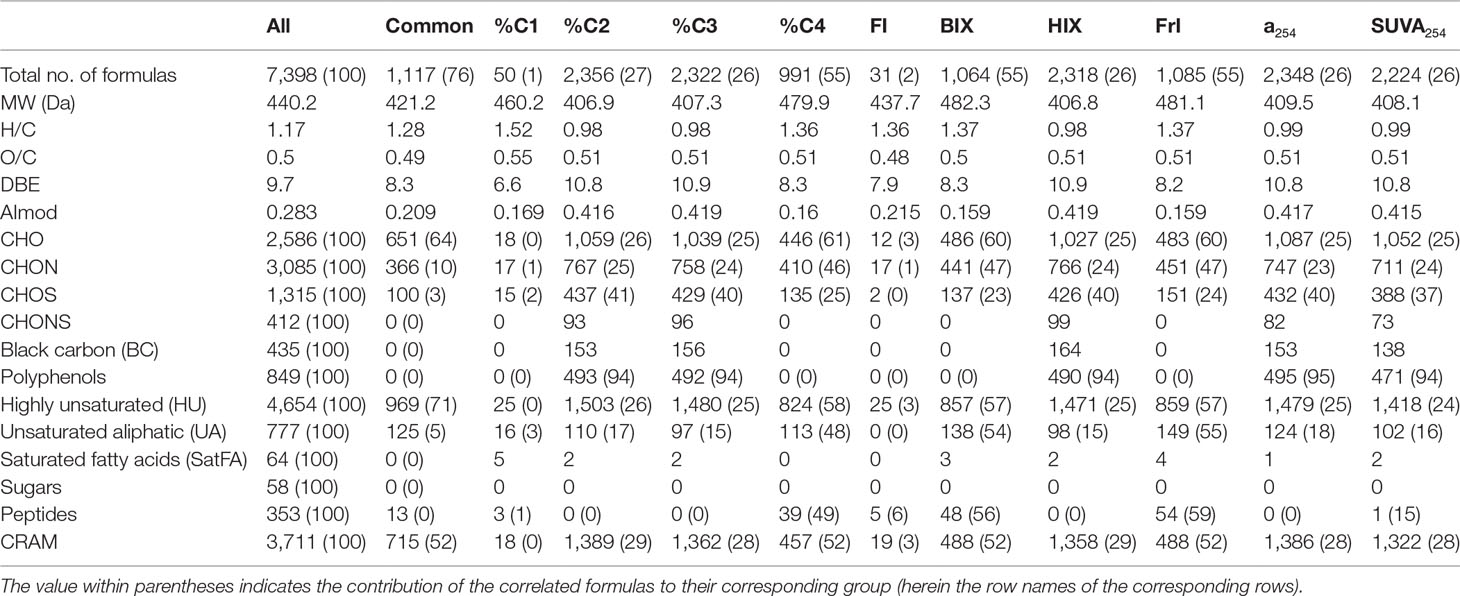
Table 1 Number, average molecular mass, molecular properties, heteroatom, and formula grouping of molecular formulas that correlated positively (r > 0, p < 0.01) with optical indices (absorption coefficient, relative abundance of PARAFAC components, SUVA254, FI, BIX, HIX, and FrI).
Most molecular parameters such as AImod, DBE, black carbon, and polyphenols showed negative correlations with salinity (p < 0.01). In contrast, H atom number, H/C, and HU showed positive correlations with salinity (p < 0.01). The lowest AImod values and highest H/C were observed at the surface layer of YE16-YE18.
Discussion
Evaluations of DOM Sources Combining Isotopic, Optical, and Molecular Signatures
The YRE has multiple DOM sources, including allochthonous (terrestrial) DOM from riverine discharge and autochthonous DOM from local primary production. The DOC concentration and CDOM abundance (a254 and four PARAFAC components) all showed negative correlations with salinity, indicating that DOM in the estuary is mainly controlled by terrestrial input and the physical dilution of freshwater DOM by seawater (Yang et al., 2013; Li et al., 2015; Medeiros et al., 2015), which has been described and discussed in a previous study (Zhou et al., 2021). The increasing δ13C indicated the decreasing contribution of terrestrial DOM with increasing salinity in the YRE (Fichot and Benner, 2012; Li et al., 2021). Humic-like C2 and C3 have also been reported as terrestrial-derived organic matter (Li et al., 2015). In this study, the significant negative Pearson correlations between δ13C and C2% (R2 = 0.86, p < 0.01) and C3% (R2 = 0.84, p < 0.01) further confirm the terrestrial signature of C2 and C3 components. Although naturally terrestrial input has been suggested as the primary source of DOM at the YRE, the sharp increase of protein-like C1 from YE3 to YE6 (Figure 2) indicated that the anthropogenic DOM could also introduce a significant portion of DOM. A previous study showed that there is high abundance of protein-like components in the Huangpu River, which flows into the Yangtze River between YE3 and YE4 (Dong et al., 2014). In addition, protein-like fluorescence components were found to be enriched in domestic wastewater (Yin et al., 2020), and one large wastewater treatment plant with a wastewater loading of 2.8 million m3/d is located nearby YE6. Therefore, the increase of C1 could be possibly attributed to the inputs of the Huangpu River (YE3 station) and the domestic wastewater treatment plant (YE6 station). Moreover, the relative abundance of surfactant-like O3S and O5S formulas and the ratios of their abundance to the relative abundance of other organic sulfur (Other OS: CHOS + CHONS, except O3S and O5S) increased sharply from YE4 to YE6. The O3S formulas are likely associated with linear alkylbenzene sulfonates (LAS), which is widely used in detergents and existed commonly in domestic sewage (Gong et al., 2022). The O5S formulas could be possible degradation products of LAS, and both O3S and O5S formulas have been found to be enriched in domestic sewage (Gonsior et al., 2011; Melendez-Perez et al., 2016). Therefore, the wastewater inputs could be supported by the sharp increase in the relative abundance of surfactant-like O3S and O5S formulas from YE4 to YE6 (Ye et al., 2019) (Figure 2).
Besides tributary and wastewater input, sediment resuspension and subsequent release located at the TMZ could be another source of DOM in the YRE (Yang et al., 2013; Li et al., 2015). In this study, the highest PARAFAC components were found at the TMZ, which could be easily attributed to the sediment resuspension (Li et al., 2015). However, the wastewater input is also located nearby the TMZ, resulting in the complexity of DOM sources in this region. To elucidate the DOM source in this region, further detailed analysis was conducted (Figure 2). Protein-like components (C1 and C4) increased sharply at YE4, while C1 and humic-like C2 showed large increase (~10%) at YE6, suggesting that there must be other DOM sources at YE6 besides anthropogenic inputs. Compared to C2, C3 remained relatively stable from YE5 to YE6 with the decrease of average C3:C2 from 0.81 at YE1–YE5 to 0.75 at YE6–YE8. One previous study showed that sediment-extracted organic matter is rich in humic-like components (similar to C2 in this study) at the TMZ of YRE (Han et al., 2021). Therefore, this increase of C2 at YE6 could be partly attributed to the sediment resuspension and subsequent dissolution or desorption.
Linkages Between Optical and Molecular Signatures of DOM
Both optical methods and FT-ICR MS were widely used to characterize DOM in natural ecosystems, demonstrating their potential in studying the source, bioavailability, and terrestrial signature of DOM (Fellman et al., 2008; D’andrilli et al., 2015; Medeiros et al., 2016; Zhang et al., 2018). In our study, various significant correlations were observed between optical and molecular parameters (Figure 3). For example, humic-like components (C2 and C3) and their relative abundance (%C2 and %C3) were positively correlated with DBE, AImod, RAterr, and Iterr. Accordingly, a254, SUVA254, and HIX behaved similarly to humic-like components, thus correlating similarly with molecular parameters. Contrastingly, protein-like components C1 and C4 showed distinctive correlations with molecular parameters. For arbitrary abundance, C1 exhibited similar correlations with molecular parameters as humic-like C2 and C3 due to their significant positive correlations (C1 vs C2: R2 = 0.64, p < 0.01; C1 vs C3: R2 = 0.62, p < 0.01), while there was none for C4. However, when shifted to relative abundance, %C4 correlated with various molecular parameters, while none was for %C1. Therefore, the calculation (arbitrary or relative) of PARAFAC components should be carefully checked when discussing the correlations between PARAFAC components and molecular parameters.
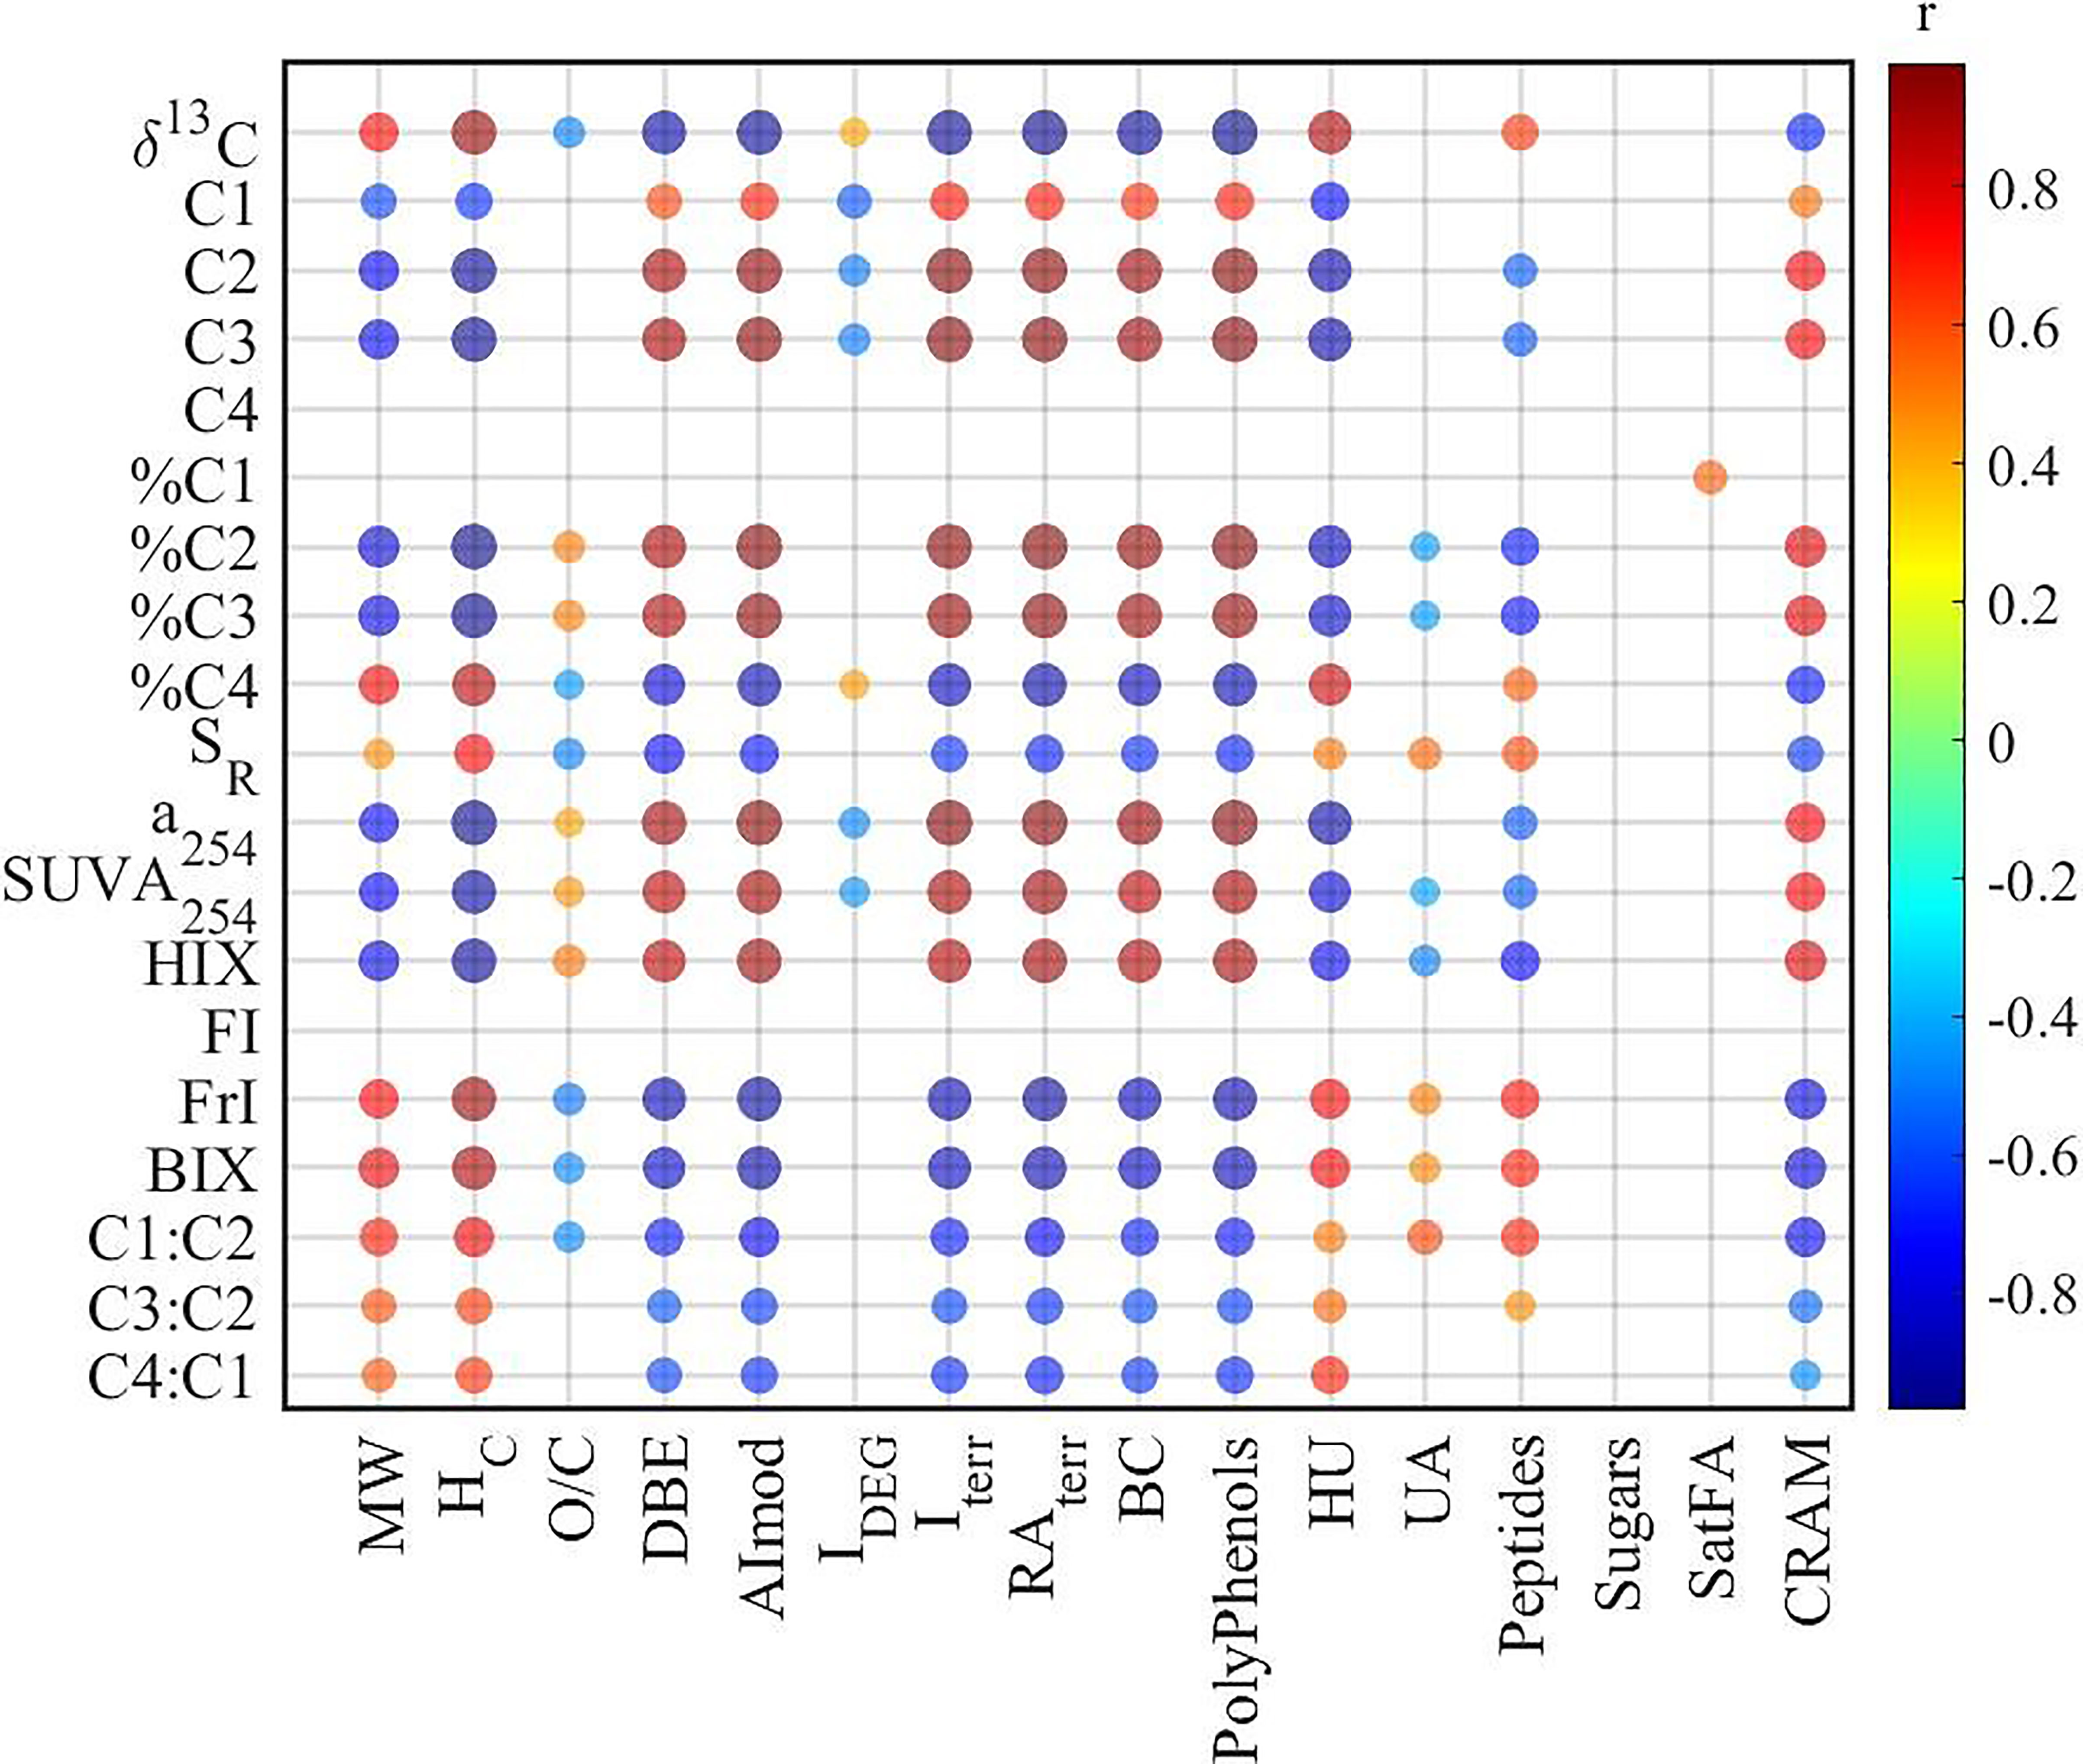
Figure 3 Correlations (Pearson) among different isotopic and optical parameters.
The associations between optical and molecular parameters would facilitate the understanding of DOM composition. For example, the significant positive correlations between AImod and humic-like components (either arbitrary C2 and C3, or relative C2% and C3%) (Figure 3) suggested that humic-like components were associated with aromatic compounds, in agreement with previous studies observed in boreal waters and subtropical coastal wetlands (Stubbins et al., 2014; Wagner et al., 2015). Meanwhile, both HIX and SUVA254 correlated positively with AImod and DBE, indicating that aromaticity derived from both optical methods and high-resolution mass spectrometry were consistent with each other, which has been widely reported in previous studies (Maizel and Remucal, 2017; Kellerman et al., 2018).
A significant positive correlation was identified between SR from UV–Vis absorbance and averaged MW of molecular formulas detected by FT-ICR MS (Figure 3), in contrast with the inverse relationship between DOM weight-average MW and SR for size-fractionated Suwannee River natural OM (Helms et al., 2008). This inconsistency could be partly attributed to the different methods utilized (Wünsch et al., 2018; Li et al., 2019). The MW utilized for the development of SR has been characterized based on gel permeation chromatography (GPC), ranging from 1,000 to 4,000 Da (Helms et al., 2008). However, in this study, the MW was obtained from FT-ICR MS with a range of 200 to ~800 Da. Moreover, both UV–Vis absorbance spectroscopy and FT-ICR MS only characterize the specific fraction of DOM. The absorbance spectroscopy focuses on the light-absorbing fraction of DOM, while FT-ICR MS mainly characterizes the PPL-adsorbed and negatively ionized fraction. Therefore, the methods should be clearly stated, and the bias should be acknowledged when discussing the MW of DOM in aquatic ecosystems. In addition, one previous study demonstrated that the molecular formulas positively correlated with SR had lower MW compared to their negatively correlated counterparts in coastal wetlands (Wagner et al., 2015), which is contradictory to our results in YRE, suggesting that the relationship between molecular formulas and SR could vary with different ecosystems.
To further elucidate the linkages between optical indices and molecular composition of DOM, Spearman correlations have been conducted between optical indices and the relative abundance of all assigned formulas (Table 1 and Figure 4). The results showed that most optical indices (except %C1 and FI) correlated well with the relative abundance of assigned formulas. On the other hand, molecular formulas associated with humic-like (%C2 and %C3) and protein-like (%C4) components showed significant differences in their composition. However, molecular formulas associated with %C2 and %C3 exhibited low MW, low bio-lability (low H/C), and high aromaticity (high DBE and AImod), while %C4 exhibited high MW, high bio-lability, and low aromaticity. This contrasts with previous studies in which the humic-like fluorescent components are usually associated with high-MW compounds, and protein-like components are commonly related to low-MW compounds (Stubbins et al., 2014; Wagner et al., 2015; Martínez-Pérez et al., 2017). In addition, this is contradictory to the results that recalcitrant deep-ocean enriched formulas exhibited higher MW than surface-enriched formulas (Li et al., 2019). However, the humic-like components have been regarded as biologically recalcitrant (Zhang et al., 2018), and thus should be of low MW according to the size reactivity continuum (SRC) model (Benner and Amon, 2015). Based on the SRC model, the MW of the labile fraction (C4) of DOM should be higher than their corresponding recalcitrant fraction (C2 and C3) (Benner and Amon, 2015), consistent with our results. Moreover, relatively lower MW was identified for molecular formulas positively correlated with humic-like components (C420, C460, and C510) than protein-like components (C310) (Wünsch et al., 2018). These inconsistencies suggest the importance of local calibration of correlations between optical and molecular parameters to further understand DOM cycling in a specific ecosystem.
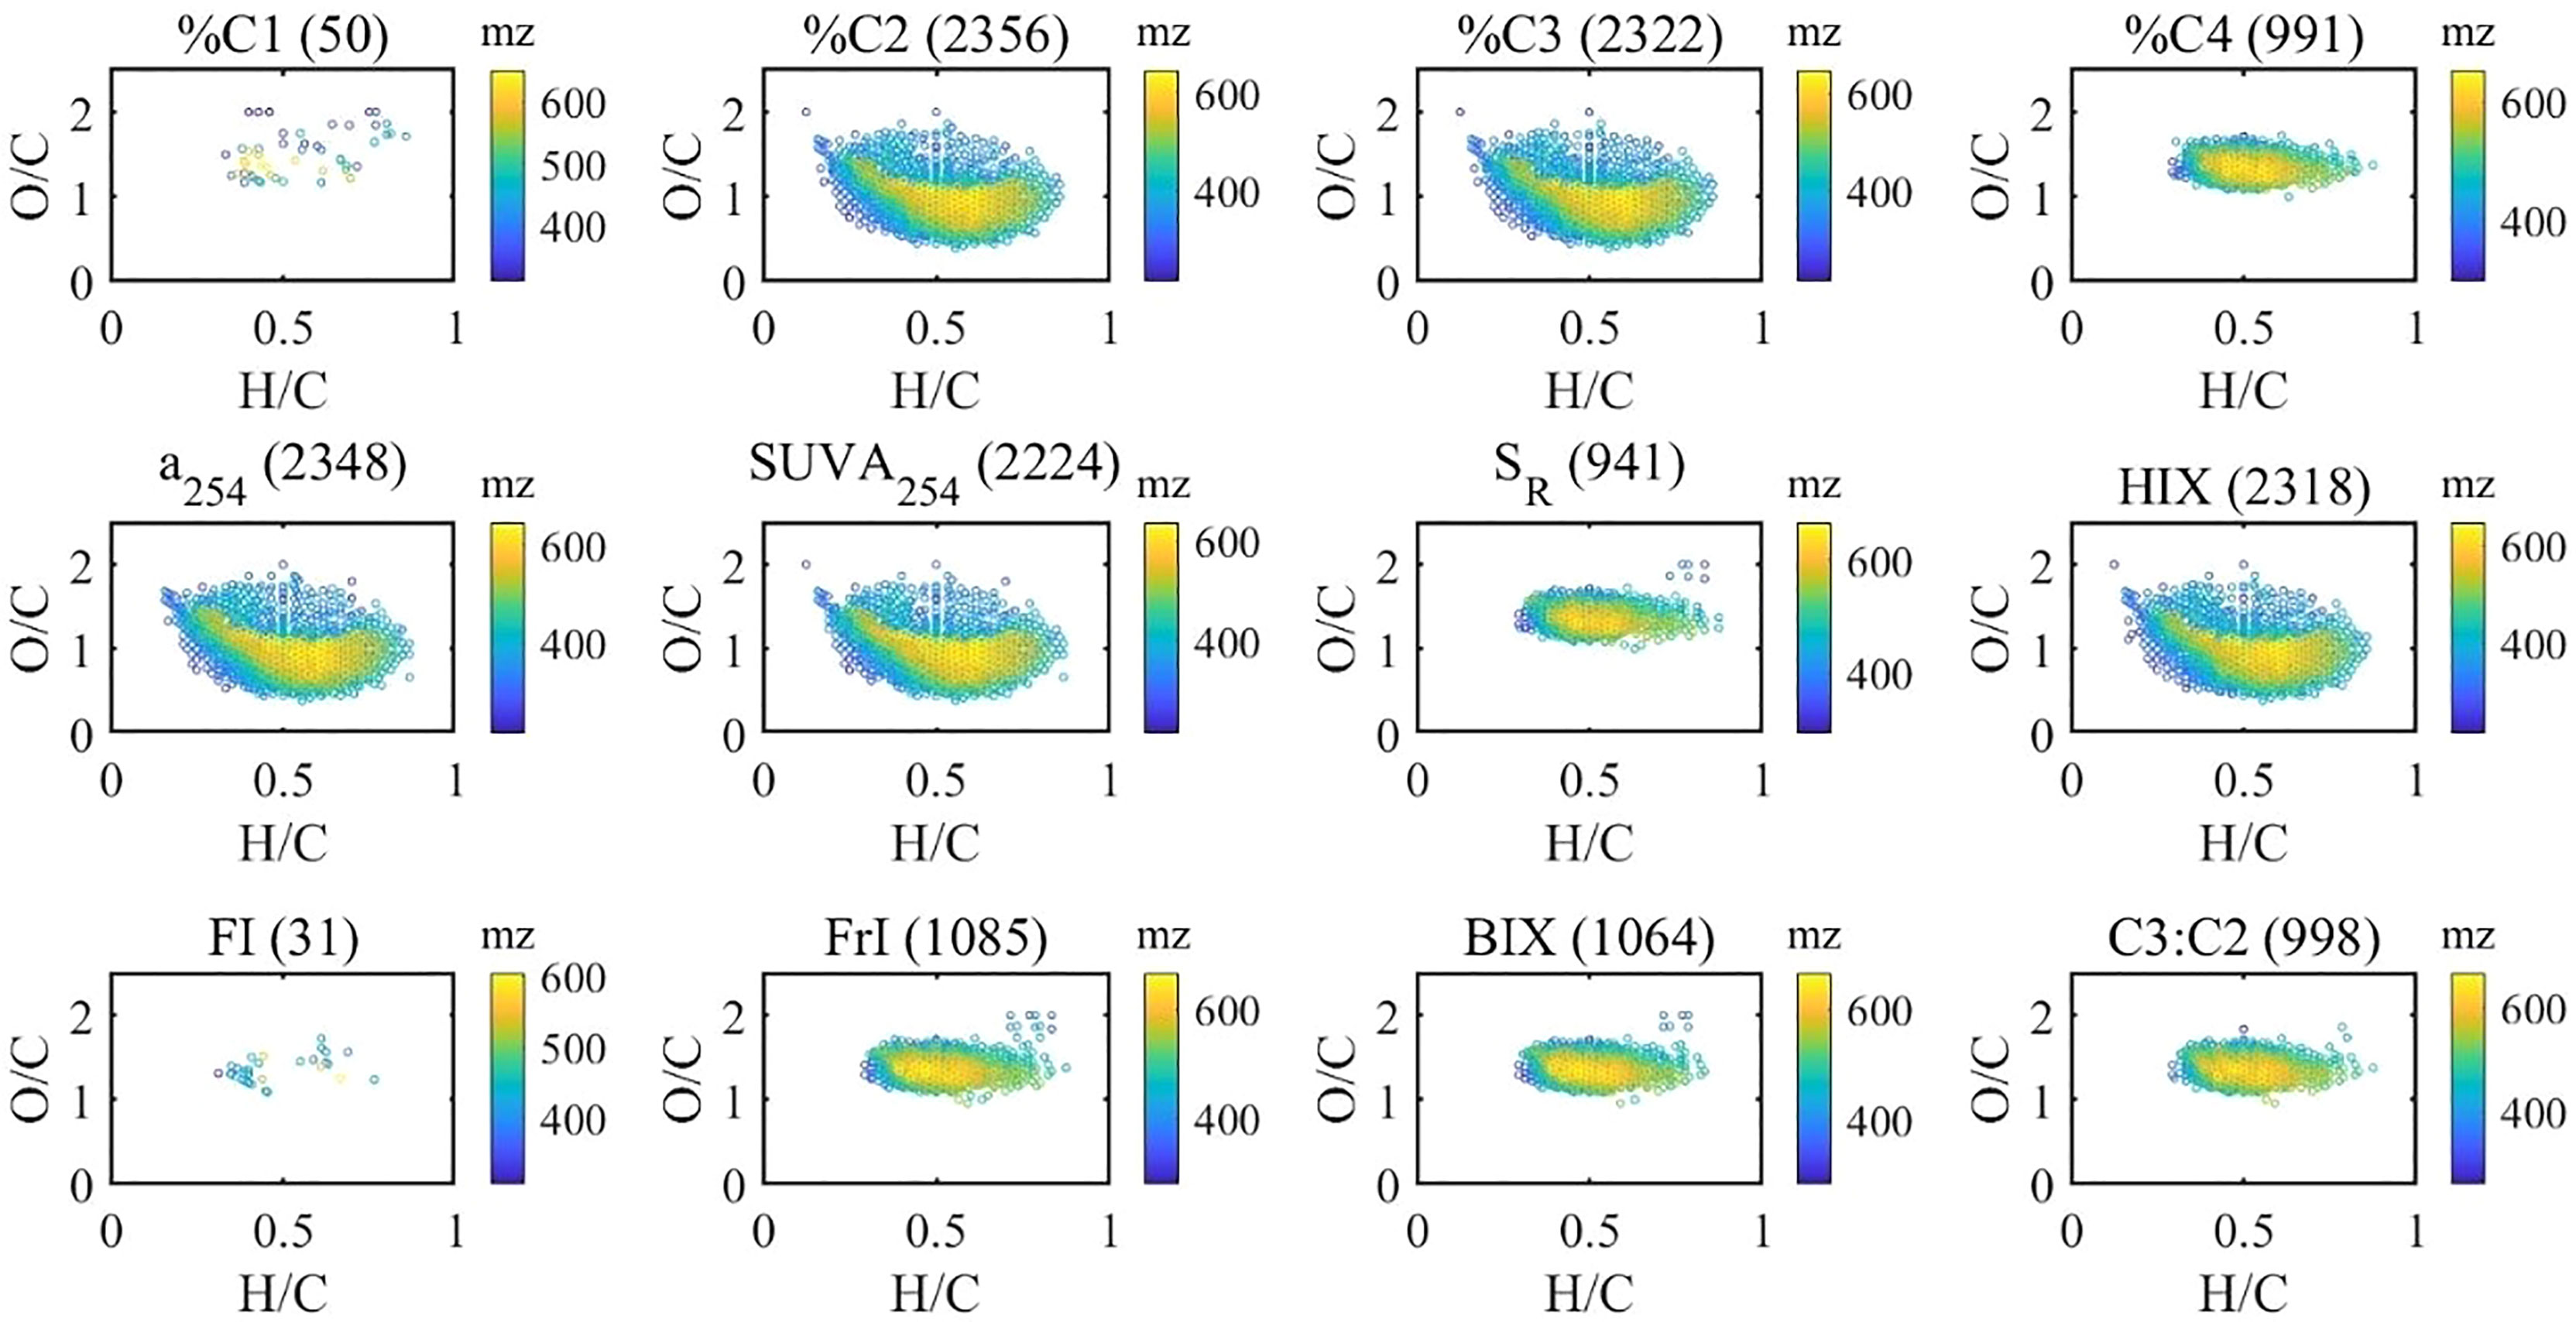
Figure 4 Van Krevelen distributions of molecular formulas positively correlated (Spearman) with optical indices (the numbers in brackets indicate the number of correlated molecular formulas).
Furthermore, the contribution of associated formulas to their class has been calculated (Table 1). There were 127 black carbon-like formulas and 553 polyphenol formulas associated with %C2, contributing 66% and 94% of black carbon and polyphenol peak intensities. This indicated that humic-like components could be an effective proxy for black carbon and polyphenol in aquatic ecosystems (Stubbins et al., 2014). There were also 1,459 HU and 1,374 CRAM formulas associated with %C2, representing 23% and 25% of the relative abundance of each group of formulas. With a significant correlation with %C2, %C3 formulas shared a large fraction with %C2 (Figure 5). Contrastingly, %C4 formulas showed good representativeness of HU (58% of relative abundance), CRAM (52%), peptides (49%), and UA (48%) though %C4 correlated with less HU and CRAM formulas than %C2 and %C3. This suggests that we must check both the number and the relative abundance of the associated formulas when optical indices and molecular formulas are correlated, which is not emphasized in previous studies (Wagner et al., 2015). Interestingly, the formulas positively correlated with C3:C2 showed remarkable similarity with %C4 formulas. This indicated that the ratio of different humic-like components could be a valuable indicator of DOM molecular composition. Similarly, a254, SUVA254, and HIX shared a large fraction (>90%) of formulas with %C2 and %C3 formulas. BIX and freshness index shared a large fraction of formulas with %C4. However, FI, used to assess relative inputs from microbial vs. terrestrial precursor OM (Mcknight et al., 2001), only correlates with 31 formulas of 2.4% by intensity.
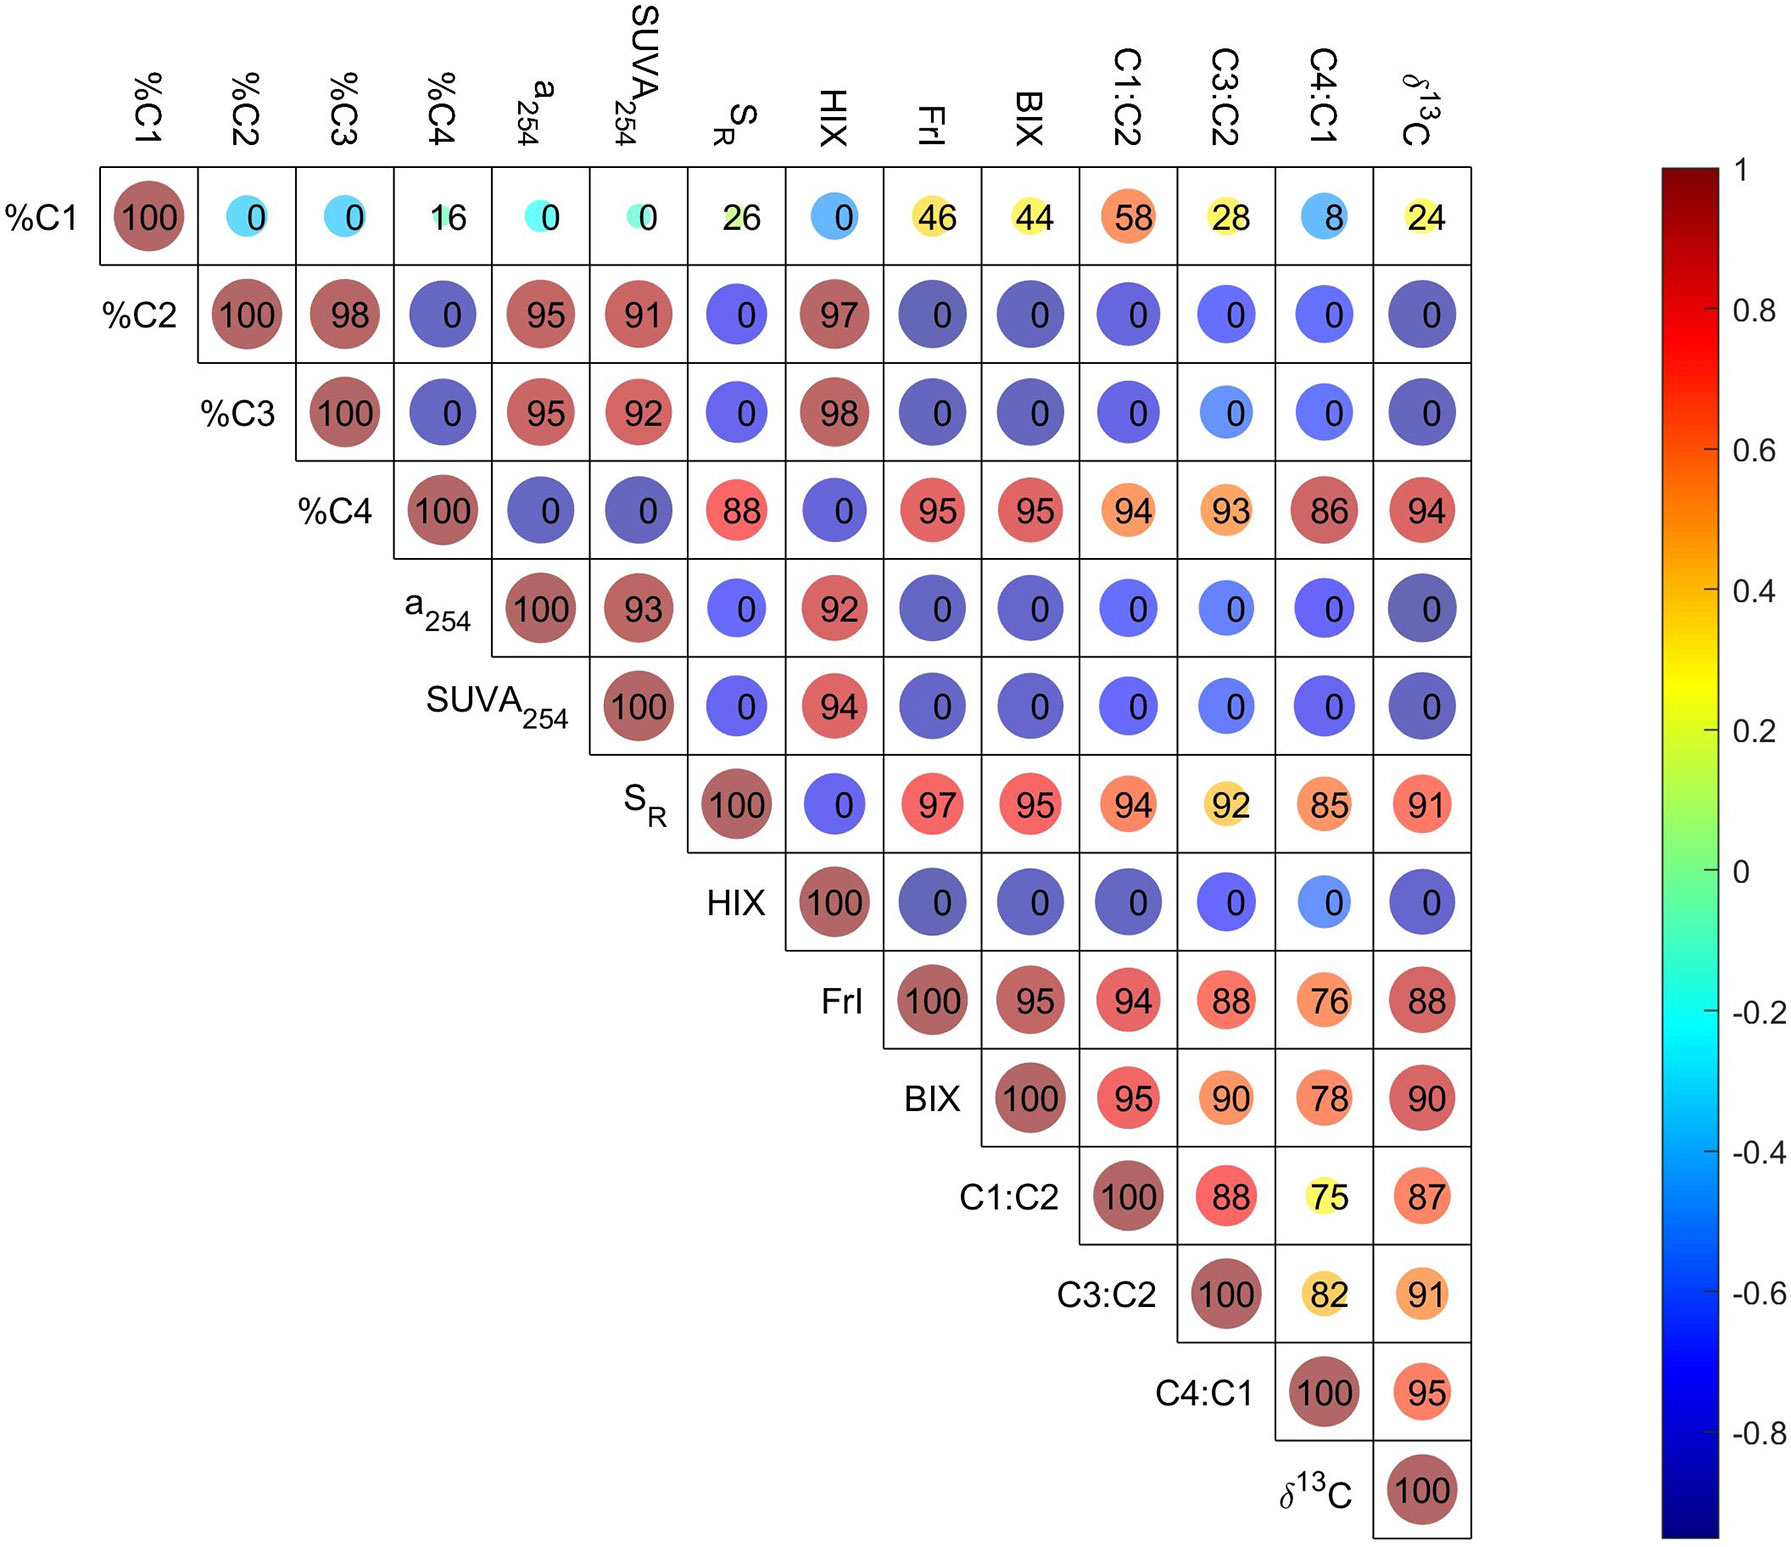
Figure 5 Correlations (Pearson) among isotopic parameters and optical indices, and the similarities of their positively correlated (Spearman) formulas. The size and color of the circle are related to the correlation coefficient. The number in the circle indicates the similarity of correlated molecular formulas associated with the corresponding two parameters; 100 means the formulas associated with these two parameters are the same, and 0 means there is no common formula.
All these correlations indicate the strong linkages between optical indices and molecular parameters. Furthermore, these inconsistencies stated above further suggest the complementary characteristics of optical and molecular techniques in large estuaries with complex DOM sources, or the limitation of Spearman’s rank correlation to elucidate the associations between optical and molecular techniques in this study (Wünsch et al., 2018).
Conclusions
In this study, the composition of DOM along the Yangtze River to East China Sea continuum was analyzed by a suite of complementary techniques, including the bulk, optical techniques, and FT-ICR MS to further understand DOM cycling. The DOM abundance (DOC, a254, and four PARAFAC components) decreased with increasing salinity, suggesting that DOM in the YRE is mainly controlled by mixing between freshwater and seawater. Moreover, multiple DOM sources (tributary input from the Huangpu River, wastewater input and sediment resuspension, and subsequent release at the TMZ) have been identified in the YRE.
In addition, various correlations have been found between optical indices and molecular parameters derived from FT-ICR MS. Humic-like components (C2 and C3), HIX, and SUVA254 all showed significant positive correlations with AImod and DBE, indicating consistency between optical and molecular methods. Contrastingly, the molecular weight derived from absorbance spectroscopy and FT-ICR MS showed inconsistency, which could be attributed to the specific selectivity of both methods. Finally, Spearman correlations between optical indices and the relative abundance of identified molecular formulas have been conducted. The results demonstrate that optical indices could be an effective tool to elucidate the molecular composition of DOM. For example, formulas associated with humic-like components could contribute more than 90% to polyphenols derived from FT-ICR MS. However, FI, an index to differentiate terrestrial and microbial sources of DOM, correlated with only a few formulas and contributed a little by peak intensity. Taken together, the association between optical indices and molecular composition further suggests the complementary characteristics for both techniques and the necessity of using multiple approaches in this complex estuarine system, providing the foundation for further understanding the carbon cycling in the large river estuaries and coastal oceans.
Data Availability Statement
The original contributions presented in the study are included in the article/Supplementary Material. Further inquiries can be directed to the corresponding authors.
Author Contributions
DH contributed to the design of the study. All authors performed the experiment. PL, XS, and DH analyzed the data. PL, XS, and DH prepared the manuscript. All authors contributed to the revision.
Funding
This work was supported by the National Science Foundation of China (41973070 and 41906031), Guangdong Basic and Applied Basic Research Foundation (2020A1515110194), Science and Technology Program of Guangzhou (202102021142), the open fund of State Key Laboratory of Satellite Ocean Environment Dynamics, Second Institute of Oceanography, MNR (No. QNHX1912), the Hong Kong Branch of Southern Marine Science and Engineering Guangdong Laboratory (Guangzhou) (SMSEGL20SC01), and funding support from the Center for Ocean Research in Hong Kong and Macau (CORE).
Conflict of Interest
The authors declare that the research was conducted in the absence of any commercial or financial relationships that could be construed as a potential conflict of interest.
Publisher’s Note
All claims expressed in this article are solely those of the authors and do not necessarily represent those of their affiliated organizations, or those of the publisher, the editors and the reviewers. Any product that may be evaluated in this article, or claim that may be made by its manufacturer, is not guaranteed or endorsed by the publisher.
Acknowledgments
We acknowledge the “YES” cruise for the sampling.
Supplementary Material
The Supplementary Material for this article can be found online at: https://www.frontiersin.org/articles/10.3389/fmars.2022.933561/full#supplementary-material
References
Benner R. (2004). What Happens to Terrestrial Organic Matter in the Ocean? Mar. Chem. 92, 307–310. doi: 10.1016/S0146-6380(97)00066-1
Benner R., Amon R. M. W. (2015). The Size-Reactivity Continuum of Major Bioelements in the Ocean. Annu. Rev. Mar. Sci. 7, 185–205. doi: 10.1146/annurev-marine-010213-135126
Bianchi T. S. (2011). The Role of Terrestrially Derived Organic Carbon in the Coastal Ocean: A Changing Paradigm and the Priming Effect. Proc. Natl. Acad. Sci. United States America 108, 19473–19481. doi: 10.1073/pnas.1017982108
Canuel E. A., Cammer S. S., Mcintosh H. A., Pondell C. R. (2012). Climate Change Impacts on the Organic Carbon Cycle at the Land-Ocean Interface. Annu. Rev. Earth Planetary Sci. 40, 685–711. doi: 10.1146/annurev-earth-042711-105511
Canuel E. A., Hardison A. K. (2016). Sources, Ages, and Alteration of Organic Matter in Estuaries. Annu. Rev. Mar. Sci. 8, 409–434. doi: 10.1146/annurev-marine-122414-034058
Cao X., Aiken G. R., Butler K. D., Huntington T. G., Balch W. M., Mao J., et al. (2018). Evidence for Major Input of Riverine Organic Matter Into the Ocean. Organic Geochem. 116, 62–76. doi: 10.1016/j.orggeochem.2017.11.001
Cawley K. M., Ding Y., Fourqurean J., Jaffé R. (2012). Characterising the Sources and Fate of Dissolved Organic Matter in Shark Bay, Australia: A Preliminary Study Using Optical Properties and Stable Carbon Isotopes. Mar. Freshw. Res. 63, 1098–1107. doi: 10.1071/MF12028
Chen Y., Yang G.-P., Liu L., Zhang P.-Y., Leng W.-S. (2016). Sources, Behaviors and Degradation of Dissolved Organic Matter in the East China Sea. J. Mar. Syst. 155, 84–97. doi: 10.1016/j.jmarsys.2015.11.005
Coble P. G. (1996). Characterization of Marine and Terrestrial DOM in Seawater Using Excitation Emission Matrix Spectroscopy. Mar. Chem. 51, 325–346. doi: 10.1016/0304-4203(95)00062-3
Coble P. G. (2007). Marine Optical Biogeochemistry: The Chemistry of Ocean Color. Chem. Rev. 107, 402–418. doi: 10.1021/cr050350+
Cory R. M., Mcknight D. M. (2005). Fluorescence Spectroscopy Reveals Ubiquitous Presence of Oxidized and Reduced Quinones in Dissolved Organic Matter. Environ. Sci. Technol. 39, 8142–8149. doi: 10.1021/es0506962
Cory R. M., Miller M. P., Mcknight D. M., Guerard J. J., Miller P. L. (2010). Effect of Instrument-Specific Response on the Analysis of Fulvic Acid Fluorescence Spectra. Limnol. Oceanogr.: Methods. 8, 67–78. doi: 10.4319/lom.2010.8.67
D’andrilli J., Cooper W. T., Foreman C. M., Marshall A. G. (2015). An Ultrahigh-Resolution Mass Spectrometry Index to Estimate Natural Organic Matter Lability. Rapid Commun. Mass Spectrom. 29, 2385–2401. doi: 10.1002/rcm.7400
Dittmar T., Koch B., Hertkorn N., Kattner G. (2008). A Simple and Efficient Method for the Solid-Phase Extraction of Dissolved Organic Matter (SPE-DOM) From Seawater. Limnol. Oceanogr.: Methods 6, 230–235. doi: 10.4319/lom.2008.6.230
Dong Q., Li P., Huang Q., Abdelhafez A. A., Chen L. (2014). Occurrence, Polarity and Bioavailability of Dissolved Organic Matter in the Huangpu River, China. J. Environ. Sci. 26, 1843–1850. doi: 10.1016/j.jes.2014.06.020
Fellman J.B., D’amore D.V., Hood E., Boone R.D. (2008). Fluorescence characteristics and biodegradability of dissolved organic matter in forest and wetland soils from coastal temperate watersheds in southeast Alaska. Biogeochemistry 88, 169–184.
Fichot C. G., Benner R. (2012). The Spectral Slope Coefficient of Chromophoric Dissolved Organic Matter (S275-295) as a Tracer of Terrigenous Dissolved Organic Carbon in River-Influenced Ocean Margins. Limnol. Oceanogr. 57, 1453–1466. doi: 10.4319/lo.2012.57.5.1453
Findlay S. E., Sinsabaugh R. L. (2003). Aquatic Ecosystems: Interactivity of Dissolved Organic Matter (Burlington: Academic Press).
Flerus R., Lechtenfeld O. J., Koch B. P., Mccallister S. L., Schmitt-Kopplin P., Benner R., et al. (2012). A Molecular Perspective on the Ageing of Marine Dissolved Organic Matter. Biogeosciences 9, 1935–1955. doi: 10.5194/bg-9-1935-2012
Gan S., Wu Y., Zhang J. (2016). Bioavailability of Dissolved Organic Carbon Linked With the Regional Carbon Cycle in the East China Sea. Deep Sea Res. Part II: Topical Stud. Oceanogr. 124, 19–28. doi: 10.1016/j.dsr2.2015.06.024
Grasshoff K., Kremling K., Ehrhardt M. (2009). Methods of Seawater AnalysisWeinheim; New York; Chichester; Brisbane; Singapore; Toronto: ( John Wiley & Sons).
Gonsior M., Zwartjes M., Cooper W.J., Song W., Ishida K.P., Tseng L.Y.. (2011). Molecular characterization of effluent organic matter identified by ultrahigh resolution mass spectrometry. Water Research 45, 2943–2953.
Gong C., Jiao R., Yan W., Yu Q., Li Q., Zhang P. (2022). Enhanced chemodiversity, distinctive molecular signature and diurnal dynamics of dissolved organic matter in streams of two headwater catchments, Southeastern China. Water Research, 118052.
Hansell D. A., Carlson C. A. (2015). Biogeochemistry of Marine Dissolved Organic Matter (Amsterdam Boston: Academic Press).
Han L., Wang Y., Xu Y., Wang Y., Zheng Y., Wu J. (2021). Water- and Base-Extractable Organic Matter in Sediments From Lower Yangtze River–Estuary–East China Sea Continuum: Insight Into Accumulation of Organic Carbon in the River-Dominated Margin. Front. Mar. Sci. 8. doi: 10.3389/fmars.2021.617241
Hedges J. I., Keil R. G., Benner R. (1997). What Happens to Terrestrial Organic Matter in the Ocean? Organic Geochem. 27, 195–212. doi: 10.1016/S0146-6380(97)00066-1
Helms J. R., Stubbins A., Ritchie J. D., Minor E. C., Kieber D. J., Mopper K. (2008). Absorption Spectral Slopes and Slope Ratios as Indicators of Molecular Weight, Source, and Photobleaching of Chromophoric Dissolved Organic Matter. Limnol. Oceanogr. 53, 955–969. doi: 10.4319/lo.2008.53.3.0955
He C., Pan Q., Li P., Xie W., He D., Zhang C., et al. (2020). Molecular Composition and Spatial Distribution of Dissolved Organic Matter (DOM) in the Pearl River Estuary, China. Environ. Chem. 17, 240–251. doi: 10.1071/EN19051
Huguet A., Vacher L., Relexans S., Saubusse S., Froidefond J. M., Parlanti E. (2009). Properties of Fluorescent Dissolved Organic Matter in the Gironde Estuary. Organic Geochem. 40, 706–719. doi: 10.1016/j.orggeochem.2009.03.002
Kellerman A. M., Guillemette F., Podgorski D. C., Aiken G. R., Butler K. D., Spencer R. G. M. (2018). Unifying Concepts Linking Dissolved Organic Matter Composition to Persistence in Aquatic Ecosystems. Environ. Sci. Technol. 52, 2538–2548. doi: 10.1021/acs.est.7b05513
Kellerman A. M., Kothawala D. N., Dittmar T., Tranvik L. J. (2015). Persistence of Dissolved Organic Matter in Lakes Related to its Molecular Characteristics. Nat. Geosci. 8, 454–457. doi: 10.1038/ngeo2440
Koch B. P., Dittmar T. (2006). From Mass to Structure: An Aromaticity Index for High-Resolution Mass Data of Natural Organic Matter. Rapid Commun. Mass Spectrom. 20, 926–932. doi: 10.1002/rcm.2386
Koch B. P., Dittmar T. (2016). From Mass to Structure: An Aromaticity Index for High-Resolution Mass Data of Natural Organic Matter. Rapid Commun. Mass Spectrom. 30, 250–250. doi: 10.1002/rcm.7433
Kujawinski E. B., Del Vecchio R., Blough N. V., Klein G. C., Marshall A. G. (2004). Probing Molecular-Level Transformations of Dissolved Organic Matter: Insights on Photochemical Degradation and Protozoan Modification of DOM From Electrospray Ionization Fourier Transform Ion Cyclotron Resonance Mass Spectrometry. Mar. Chem. 92, 23–37. doi: 10.1016/j.marchem.2004.06.038
Lalonde K., Vähätalo A. V., Gélinas Y. (2014). Revisiting the Disappearance of Terrestrial Dissolved Organic Matter in the Ocean: A δ13c Study. Biogeosciences 10, 17117–17144. doi: 10.5194/bg-11-3707-2014
Li P., Chen L., Zhang W., Huang Q. (2015). Spatiotemporal Distribution, Sources, and Photobleaching Imprint of Dissolved Organic Matter in the Yangtze Estuary and Its Adjacent Sea Using Fluorescence and Parallel Factor Analysis. PLos One 10. doi: 10.1371/journal.pone.0130852
Li P., Hur J. (2017). Utilization of UV-Vis Spectroscopy and Related Data Analyses for Dissolved Organic Matter (DOM) Studies: A Review. Crit. Rev. Environ. Sci. Technol. 47, 131–154. doi: 10.1080/10643389.2017.1309186
Li P., Tao J., Lin J., He C., Shi Q., Li X., et al. (2019). Stratification of Dissolved Organic Matter in the Upper 2000 M Water Column at the Mariana Trench. Sci. Total Environ. 668, 1222–1231. doi: 10.1016/j.scitotenv.2019.03.094
Li P., Zhao C., Liu K., Xiao X., Wang Y., Wang Y., et al. (2021). Anthropogenic Influences on Dissolved Organic Matter in Three Coastal Bays, North China. Front. Earth Sci. 9. doi: 10.3389/feart.2021.697758
Maizel A. C., Remucal C. K. (2017). Molecular Composition and Photochemical Reactivity of Size-Fractionated Dissolved Organic Matter. Environ. Sci. Technol. 51, 2113–2123. doi: 10.1021/acs.est.6b05140
Martínez-Pérez A. M., Nieto-Cid M., Osterholz H., Catalá T. S., Reche I., Dittmar T., et al. (2017). Linking Optical and Molecular Signatures of Dissolved Organic Matter in the Mediterranean Sea. Sci. Rep. 73436. doi: 10.1038/s41598-017-03735-4
Mcknight D. M., Boyer E. W., Westerhoff P. K., Doran P. T., Kulbe T., Andersen D. T. (2001). Spectrofluorometric Characterization of Dissolved Organic Matter for Indication of Precursor Organic Material and Aromaticity. Limnol. Oceanogr. 46, 38–48. doi: 10.4319/lo.2001.46.1.0038
Medeiros P. M., Seidel M., Niggemann J., Spencer R. G. M., Hernes P. J., Yager P. L., et al. (2016). A Novel Molecular Approach for Tracing Terrigenous Dissolved Organic Matter Into the Deep Ocean. Global Biogeochemical Cycles 30, 689–699. doi: 10.1002/2015GB005320
Medeiros P. M., Seidel M., Ward N. D., Carpenter E. J., Gomes H. R., Niggemann J., et al. (2015). Fate of the Amazon River Dissolved Organic Matter in the Tropical Atlantic Ocean. Global Biogeochemical Cycles 29, 677–690. doi: 10.1002/2015GB005115
Melendez-Perez J.J., Martínez-Mejía M.J., Awan A.T., Fadini P.S., Mozeto A.A., Eberlin M.N. (2016). Characterization and comparison of riverine, lacustrine, marine and estuarine dissolved organic matter by ultra-high resolution and accuracy Fourier transform mass spectrometry. Organic Geochemistry 101, 99–107.
Minor E. C., Swenson M. M., Mattson B. M., Oyler A. R. (2014). Structural Characterization of Dissolved Organic Matter: A Review of Current Techniques for Isolation and Analysis. Environ. Science-Processes Impacts 16, 2064–2079. doi: 10.1039/C4EM00062E
Mostovaya A., Hawkes J. A., Dittmar T., Tranvik L. J. (2017). Molecular Determinants of Dissolved Organic Matter Reactivity in Lake Water. Front. Earth Sci. 5. doi: 10.3389/feart.2017.00106
Murphy K. R., Hambly A., Singh S., Henderson R. K., Baker A., Stuetz R., et al. (2011). Organic Matter Fluorescence in Municipal Water Recycling Schemes: Toward a Unified PARAFAC Model. Environ. Sci. Technol. 45, 2909–2916. doi: 10.1021/es103015e
Nebbioso A., Piccolo A. (2013). Molecular Characterization of Dissolved Organic Matter (DOM): A Critical Review. Analytical Bioanal Chem. 405, 109–124. doi: 10.1007/s00216-012-6363-2
Ohno T. (2002). Fluorescence Inner-Filtering Correction for Determining the Humification Index of Dissolved Organic Matter. Environ. Sci. Technol. 36, 742–746. doi: 10.1021/es0155276
Osburn C., Bianchi T. (2016). Linking Optical and Chemical Properties of Dissolved Organic Matter in Natural Waters. Front. Mar. Sci. 3. doi: 10.3389/fmars.2016.00223
Osburn C. L., Stedmon C. A. (2011). Linking the Chemical and Optical Properties of Dissolved Organic Matter in the Baltic–North Sea Transition Zone to Differentiate Three Allochthonous Inputs. Mar. Chem. 126, 281–294. doi: 10.1016/j.marchem.2011.06.007
Osterholz H., Kirchman D. L., Niggemann J., Dittmar T. (2016). Environmental Drivers of Dissolved Organic Matter Molecular Composition in the Delaware Estuary. Front. Earth Sci. 4. doi: 10.3389/feart.2016.00095
Parlanti E., Worz K., Geoffroy L., Lamotte M. (2000). Dissolved Organic Matter Fluorescence Spectroscopy as a Tool to Estimate Biological Activity in a Coastal Zone Submitted to Anthropogenic Inputs. Organic Geochem. 31, 1765–1781. doi: 10.1016/S0146-6380(00)00124-8
Raymond P. A., Bauer J. E. (2001). Use of 14C and 13C Natural Abundances for Evaluating Riverine, Estuarine, and Coastal DOC and POC Sources and Cycling: A Review and Synthesis. Organic Geochem. 32, 469–485. doi: 10.1016/S0146-6380(00)00190-X
Seidel M., Yager P. L., Ward N. D., Carpenter E. J., Gomes H. R., Krusche A. V., et al. (2015). Molecular-Level Changes of Dissolved Organic Matter Along the Amazon River-To-Ocean Continuum. Mar. Chem. 177, Part 2, 218–231. doi: 10.1016/j.marchem.2015.06.019
Sleighter R. L., Hatcher P. G. (2008). Molecular Characterization of Dissolved Organic Matter (DOM) Along a River to Ocean Transect of the Lower Chesapeake Bay by Ultrahigh Resolution Electrospray Ionization Fourier Transform Ion Cyclotron Resonance Mass Spectrometry. Mar. Chem. 110, 140–152. doi: 10.1016/j.marchem.2008.04.008
Song G., Li Y., Hu S., Li G., Zhao R., Sun X., et al. (2017). Photobleaching of Chromophoric Dissolved Organic Matter (CDOM) in the Yangtze River Estuary: Kinetics and Effects of Temperature, Ph, and Salinity. Environ. Science: Processes Impacts 19, 861–873. doi: 10.1039/C6EM00682E
Spencer R. G. M., Baker A., Ahad J. M. E., Cowie G. L., Ganeshram R., Upstill-Goddard R. C., et al. (2007). Discriminatory Classification of Natural and Anthropogenic Waters in Two U.K. Estuaries. Sci. Total Environ. 373, 305–323. doi: 10.1016/j.scitotenv.2006.10.052
Stedmon C. A., Bro R. (2008). Characterizing Dissolved Organic Matter Fluorescence With Parallel Factor Analysis: A Tutorial. Limnol. Oceanography-Methods 6, 572–579. doi: 10.4319/lom.2008.6.572
Stedmon C. A., Markager S. (2005). Resolving the Variability in Dissolved Organic Matter Fluorescence in a Temperate Estuary and its Catchment Using PARAFAC Analysis. Limnol. Oceanogr. 50, 686–697. doi: 10.4319/lo.2005.50.2.0686
Stedmon C. A., Seredyńska-Sobecka B., Boe-Hansen R., Le Tallec N., Waul C. K., Arvin E. (2011). A Potential Approach for Monitoring Drinking Water Quality From Groundwater Systems Using Organic Matter Fluorescence as an Early Warning for Contamination Events. Water Res. 45, 6030–6038. doi: 10.1016/j.watres.2011.08.066
Stubbins A., Lapierre J. F., Berggren M., Prairie Y. T., Dittmar T., Del Giorgio P. A. (2014). What’s in an EEM? Molecular Signatures Associated With Dissolved Organic Fluorescence in Boreal Canada. Environ. Sci. Technol. 48, 10598–10606. doi: 10.1021/es502086e
Stubbins A., Spencer R. G. M., Chen H., Hatcher P. G., Mopper K., Hernes P. J., et al. (2010). Illuminated Darkness: Molecular Signatures of Congo River Dissolved Organic Matter and its Photochemical Alteration as Revealed by Ultrahigh Precision Mass Spectrometry. Limnol. Oceanogr. 55, 1467–1477. doi: 10.4319/lo.2010.55.4.1467
Sun Q. Y., Wang C., Wang P. F., Hou J., Ao Y. H. (2014). Absorption and Fluorescence Characteristics of Chromophoric Dissolved Organic Matter in the Yangtze Estuary. Environ. Sci. pollut. Res. 21, 3460–3473. doi: 10.1007/s11356-013-2287-4
Wagner S., Jaffe R., Cawley K., Dittmar T., Stubbins A. (2015). Associations Between the Molecular and Optical Properties of Dissolved Organic Matter in the Florida Everglades, a Model Coastal Wetland System. Front. Chem. 3, 66. doi: 10.3389/fchem.2015.00066
Wang K., Pang Y., He C., Li P., Xiao S., Sun Y., et al. (2019). Optical and Molecular Signatures of Dissolved Organic Matter in Xiangxi Bay and Mainstream of Three Gorges Reservoir, China: Spatial Variations and Environmental Implications. Sci. Total Environ. 657, 1274–1284. doi: 10.1016/j.scitotenv.2018.12.117
Weishaar J. L., Aiken G. R., Bergamaschi B. A., Fram M. S., Fujii R., Mopper K. (2003). Evaluation of Specific Ultraviolet Absorbance as an Indicator of the Chemical Composition and Reactivity of Dissolved Organic Carbon. Environ. Sci. Technol. 37, 4702–4708. doi: 10.1021/es030360x
Wilson H. F., Xenopoulos M. A. (2009). Effects of Agricultural Land Use on the Composition of Fluvial Dissolved Organic Matter. Nat. Geosci. 2, 37–41. doi: 10.1038/ngeo391
Wünsch U. J., Acar E., Koch B. P., Murphy K. R., Schmitt-Kopplin P., Stedmon C. A. (2018). The Molecular Fingerprint of Fluorescent Natural Organic Matter Offers Insight Into Biogeochemical Sources and Diagenetic State. Analytical Chem. 90, 14188–14197. doi: 10.1021/acs.analchem.8b02863
Ya C., Anderson W., Jaffé R. (2015). Assessing Dissolved Organic Matter Dynamics and Source Strengths in a Subtropical Estuary: Application of Stable Carbon Isotopes and Optical Properties. Continental Shelf Res. 92, 98–107. doi: 10.1016/j.csr.2014.10.005
Yang L. Y., Guo W. D., Hong H. S., Wang G. Z. (2013). Non-Conservative Behaviors of Chromophoric Dissolved Organic Matter in a Turbid Estuary: Roles of Multiple Biogeochemical Processes. Estuar. Coast. Shelf Sci. 133, 285–292. doi: 10.1016/j.ecss.2013.09.007
Ye Q., Zhang Z.-T., Liu Y.-C., Wang Y.-H., Zhang S., He C., et al. (2019). Spectroscopic and Molecular-Level Characteristics of Dissolved Organic Matter in a Highly Polluted Urban River in South China. ACS Earth Space Chem. 3, 2033–2044. doi: 10.1021/acsearthspacechem.9b00151
Yin H., Wang Y., Yang Y., Huang J., Xu Z. (2020). Tryptophan-like fluorescence as a fingerprint of dry-weather misconnections into storm drainage system. ENVIRONMENTAL SCIENCES EUROPE 32.
Yu H., Wu Y., Zhang J., Deng B., Zhu Z. (2011). Impact of Extreme Drought and the Three Gorges Dam on Transport of Particulate Terrestrial Organic Carbon in the Changjiang (Yangtze) River. J. Geophys. Research: Earth Surface 116. doi: 10.1029/2011JF002012
Zhang C., Dang H., Azam F., Benner R., Legendre L., Passow U., et al. (2018). Evolving Paradigms in Biological Carbon Cycling in the Ocean. Natl. Sci. Rev. 5, 481–499. doi: 10.1093/nsr/nwy074
Zhang J., Liu S. M., Ren J. L., Wu Y., Zhang G. L. (2007). Nutrient Gradients From the Eutrophic Changjiang (Yangtze River) Estuary to the Oligotrophic Kuroshio Waters and Re-Evaluation of Budgets for the East China Sea Shelf. Prog. Oceanogr. 74, 449–478. doi: 10.1016/j.pocean.2007.04.019
Zhou Y., He D., He C., Li P., Fan D., Wang A., et al. (2021). Spatial Changes in Molecular Composition of Dissolved Organic Matter in the Yangtze River Estuary: Implications for the Seaward Transport of Estuarine DOM. Sci. Total Environ. 143531. doi: 10.1016/j.scitotenv.2020.143531
Zhou Y., Zhao C., He C., Li P., Wang Y., Pang Y., et al. (2022). Characterization of Dissolved Organic Matter Processing Between Surface Sediment Porewater and Overlying Bottom Water in the Yangtze River Estuary. Water Res. 118260. doi: 10.1016/j.watres.2022.118260
Keywords: Yangtze River Estuary, East China Sea, dissolved organic matter (DOM), optical properties, molecular composition
Citation: Sun X, Li P, Zhou Y, He C, Cao F, Wang Y, Shi Q and He D (2022) Linkages Between Optical and Molecular Signatures of Dissolved Organic Matter Along the Yangtze River Estuary-to-East China Sea Continuum. Front. Mar. Sci. 9:933561. doi: 10.3389/fmars.2022.933561
Received: 01 May 2022; Accepted: 15 June 2022;
Published: 15 July 2022.
Edited by:
Meilin Wu, South China Sea Institute of Oceanology (CAS), ChinaCopyright © 2022 Sun, Li, Zhou, He, Cao, Wang, Shi and He. This is an open-access article distributed under the terms of the Creative Commons Attribution License (CC BY). The use, distribution or reproduction in other forums is permitted, provided the original author(s) and the copyright owner(s) are credited and that the original publication in this journal is cited, in accordance with accepted academic practice. No use, distribution or reproduction is permitted which does not comply with these terms.
*Correspondence: Ding He, dinghe@ust.hk; Penghui Li, liph8@mail.sysu.edu.cn