A Multivariable Empirical Algorithm for Estimating Particulate Organic Carbon Concentration in Marine Environments From Optical Backscattering and Chlorophyll-a Measurements
 Daniel Koestner
 Dariusz Stramski
 Rick A. Reynolds
- 1Remote Sensing Division, US Naval Research Laboratory, Washington, DC, United States
- 2Department of Physics and Technology, University of Bergen, Bergen, Norway
- 3Marine Physical Laboratory, Scripps Institution of Oceanography, University of California San Diego, La Jolla, CA, United States
Accurate estimates of the oceanic particulate organic carbon concentration (POC) from optical measurements have remained challenging because interactions between light and natural assemblages of marine particles are complex, depending on particle concentration, composition, and size distribution. In particular, the applicability of a single relationship between POC and the spectral particulate backscattering coefficient bbp(λ) across diverse oceanic environments is subject to high uncertainties because of the variable nature of particulate assemblages. These relationships have nevertheless been widely used to estimate oceanic POC using, for example, in situ measurements of bbp from Biogeochemical (BGC)-Argo floats. Despite these challenges, such an in situbased approach to estimate POC remains scientifically attractive in view of the expanding global-scale observations with the BGC-Argo array of profiling floats equipped with optical sensors. In the current study, we describe an improved empirical approach to estimate POC which takes advantage of simultaneous measurements of bbp and chlorophyll-a fluorescence to better account for the effects of variable particle composition on the relationship between POC and bbp. We formulated multivariable regression models using a dataset of field measurements of POC, bbp, and chlorophyll-a concentration (Chla), including surface and subsurface water samples from the Atlantic, Pacific, Arctic, and Southern Oceans. The analysis of this dataset of diverse seawater samples demonstrates that the use of bbp and an additional independent variable related to particle composition involving both bbp and Chla leads to notable improvements in POC estimations compared with a typical univariate regression model based on bbp alone. These multivariable algorithms are expected to be particularly useful for estimating POC with measurements from autonomous BGC-Argo floats operating in diverse oceanic environments. We demonstrate example results from the multivariable algorithm applied to depth-resolved vertical measurements from BGC-Argo floats surveying the Labrador Sea.
Introduction
Particulate organic carbon in the ocean is associated with non-living organic detrital material, heterotrophic organisms, and phytoplankton. The mass concentration of particulate organic carbon (POC) is typically defined operationally as the mass of organic carbon which is collected on glass fiber filters per unit volume of seawater filtered (Parsons et al., 1984; Kharbush et al., 2020; IOCCG Protocol Series, 2021). Particulate organic carbon in the ocean plays an important role in regulating the global carbon cycle as it includes roughly 50 Pg C y-1 related to primary production in the euphotic zone, about 5–12 Pg C of which is exported to the underlying twilight zone (Middelburg, 2019). Generally speaking, contemporary ocean carbon models struggle to resolve deep ocean particulate carbon, some of which is expected to undergo burial and serve as a long-term sink for atmospheric carbon dioxide (Boyd and Trull, 2007; Siegel et al., 2014; Buesseler et al., 2020; Brewin et al., 2021). As a result of this uncertainty, the estimated range of carbon sequestration by sinking POC is between approximately 5 and 12 Pg C y-1 (Boyd and Trull, 2007; Siegel et al., 2014; DeVries and Weber, 2017), or between about 50% and over 100% of global anthropogenic emissions of carbon dioxide in 2021 (Friedlingstein et al., 2022). A major limiting factor on the development of a better quantitative understanding of biological carbon sequestration by the global ocean is the limited number of observations of the vertical distribution of POC (Siegel et al., 2016).
Traditional measurements of POC throughout the global ocean rely on discrete water sampling which has significant limitations in terms of the spatial and temporal coverage of observation. The estimation of POC from optical measurements, conducted either remotely from above the ocean or in situ, has the potential to fill this gap in understanding of the global distribution of POC (Stramski et al., 1999; Stramski et al., 2008; Cetinić et al., 2012; Biogeochemical-Argo Planning Group, 2016; Poteau et al., 2017; Stramski et al., 2022). Unfortunately, accurate estimates of POC from optical measurements with current approaches have fundamental limitations. POC can be estimated from chlorophyll-a concentration which, in turn, can be derived from optical measurements (e.g., Legendre and Michaud, 1999; Stramska and Stramski, 2005); however, this approach is limited by the assumption that phytoplankton and co-varying materials are the dominant contributor to variability in POC and the POC / Chla ratio is sufficiently robust. This assumption may be acceptable for many surface waters of the open ocean, but is generally not valid across diverse environments including coastal waters and ocean layers below the euphotic zone. Furthermore, the relationship between POC and Chla is highly sensitive to variations in phytoplankton community composition and physiological growth conditions leading to large variations in the carbon-to-chlorophyll ratio among marine environments (e.g., Stramski et al., 2008; Sathyendranath et al., 2009). Single-component models based on regression analysis between POC and the spectral particulate backscattering coefficient bbp(λ) (where λ is light wavelength in vacuum and the subscript “p” denotes scattering by particles) have also shown usefulness of bbp(λ) as a proxy for POC in surface waters in different oceanic basins (Stramski et al., 1999; Loisel et al., 2001; Stramska and Stramski, 2005; Stramski et al., 2008; Allison et al., 2010; Johnson et al., 2017) and to depths of 600 m in the North Atlantic (Cetinić et al., 2012). Unfortunately, the coefficients of these predictive models can also vary considerably between datasets owing to significant variations in particulate matter characteristics across diverse water bodies, for example during bloom conditions (e.g., Stramski et al., 1999), in coastal and nearshore waters where terrestrial material is likely present (e.g., Reynolds et al., 2016; Koestner et al., 2021), or where particulate inorganic carbon is relatively abundant (e.g., Balch et al., 2010). Similar single-component models based on the particulate spectral beam attenuation coefficient cp(λ) and POC can also be useful for specific oceanic conditions (e.g., Bishop, 1999; Stramska and Stramski, 2005; Gardner et al., 2006; Stramski et al., 2008; Neukermans et al., 2012; Rasse et al., 2017; Koestner et al., 2021). Nevertheless, the scope of the current study is focused on optical backscattering primarily because of its routine use on underwater autonomous vehicles.
The particulate volume scattering function βp(ψ, λ) of particles suspended in seawater describes the scattered intensity at light wavelength λ as a function of scattering angle ψ per unit incident irradiance per unit volume of a small sample of seawater interacting with a collimated beam of light. Again, the subscript “p” denotes scattering by only particles following the removal of contributions of molecular water and dissolved salts. For the sake of brevity, we will generally omit the arguments λ and ψ unless specifically required. The particulate backscattering coefficient bbp is defined as the integration of βp in all backwards angles, although experimental estimates of bbp often rely on measurements at one or a few scattering angles and various assumptions regarding the angular shape of βp. βp, and by extension bbp, of a natural assemblage of particles is to first order a function of particle concentration and to higher order dependent upon the composition, size distribution, and shapes of the particles within the assemblage. First order principles can be observed in the generally strong correlation between bbp and the concentration of suspended particulate matter (e.g., Downing et al., 1981; Boss et al., 2009; Neukermans et al., 2012; Reynolds et al., 2016; Koestner et al., 2021). Because all suspended particles do not contribute to POC uniformly, the influence of particle assemblage composition on seawater optical properties such as bbp is therefore an important factor when considering the development of reliable algorithms for estimating POC from optical measurements in variable environments across the global ocean (Stramski et al., 2004).
The quantification of particle composition solely from in situ optical measurements that are easily obtainable on autonomous vehicles has yet to be fully developed. Some promising approaches have been identified (Twardowski et al., 2001; Boss et al., 2004; Boss et al., 2009; Neukermans et al., 2012; Cetinić et al., 2015; Koestner et al., 2021); however, to our knowledge none have been utilized directly in the formulation of algorithms to estimate POC. For the purposes of the current study, we focus on the optical proxy for bulk composition which is related to the chlorophyll-specific particulate backscattering coefficient (i.e., bbp/Chla). This proxy generally describes the relative contributions of chlorophyll-a containing particles (e.g., phytoplankton) vs. all particles contributing to backscattering and has also been suggested to exhibit some sensitivity to phytoplankton community composition under certain oceanic conditions (Cetinić et al., 2015; Barbieux et al., 2018). This proxy has the advantage of being easily obtainable from chlorophyll-a fluorescence and backscattering sensors available on many autonomous platforms, such as the global network of Biogeochemical (BGC)-Argo floats (Biogeochemical-Argo Planning Group, 2016; Claustre et al., 2020).
In the current study we seek to compare multivariable regression models with the more commonly utilized univariate backscattering-based models for the estimation of POC. We propose a multivariable algorithm for estimating POC using concurrent bbp and Chla measurements based on a multiple linear regression analysis. In this multi-component model, one component is considered a measure of total particle concentration while the additional components are used to adjust estimations of POC based on a measure of bulk particle composition. The univariate and multivariable models are parameterized utilizing a selection of contrasting surface and subsurface natural seawater samples representing coastal and offshore waters which vary in terms of particulate composition, ranging from inorganic- to organic-dominated, including mainly organic assemblages dominated by phytoplankton as well as non-phytoplankton particles. Using an independent dataset, we show that multivariable models are superior for estimations of POC compared with a univariate model of POC vs. bbp. Finally, the models are specifically formulated for application with BGC-Argo floats and, as a demonstration, are applied to data acquired with BGC-Argo floats for the assessment of variability in depth-integrated POC in the region of the Labrador Sea from May 2013 until December 2015.
Methods
Samples
The dataset used for algorithm development and validation consisted of over 400 surface and subsurface samples from 264 discrete locations in the Arctic, Atlantic, Pacific, and Southern Oceans (Figure 1). Assembly of this dataset was limited by the need for concurrent measurements of POC, chlorophyll-a concentration, and spectral backscattering coefficient. The final data were collated from samples obtained during 13 research cruises that span tropical to high-latitude regions as well as coastal to open ocean environments (Table 1), thus encompassing a wide range of oceanic particle assemblages and seawater bio-optical properties. Details of the individual research cruises and sampling protocols are described in earlier publications (Reynolds et al., 2001; Stramski et al., 2008; Allison et al., 2010; Reynolds et al., 2016; Koestner et al., 2021), and surface water samples from many stations included in the current study were recently utilized in the development of global remote sensing algorithms for estimating POC from different satellite ocean color missions (Stramski et al., 2022). Of the 427 samples, 118 were collected at depths greater than 25 m (Figure 1).
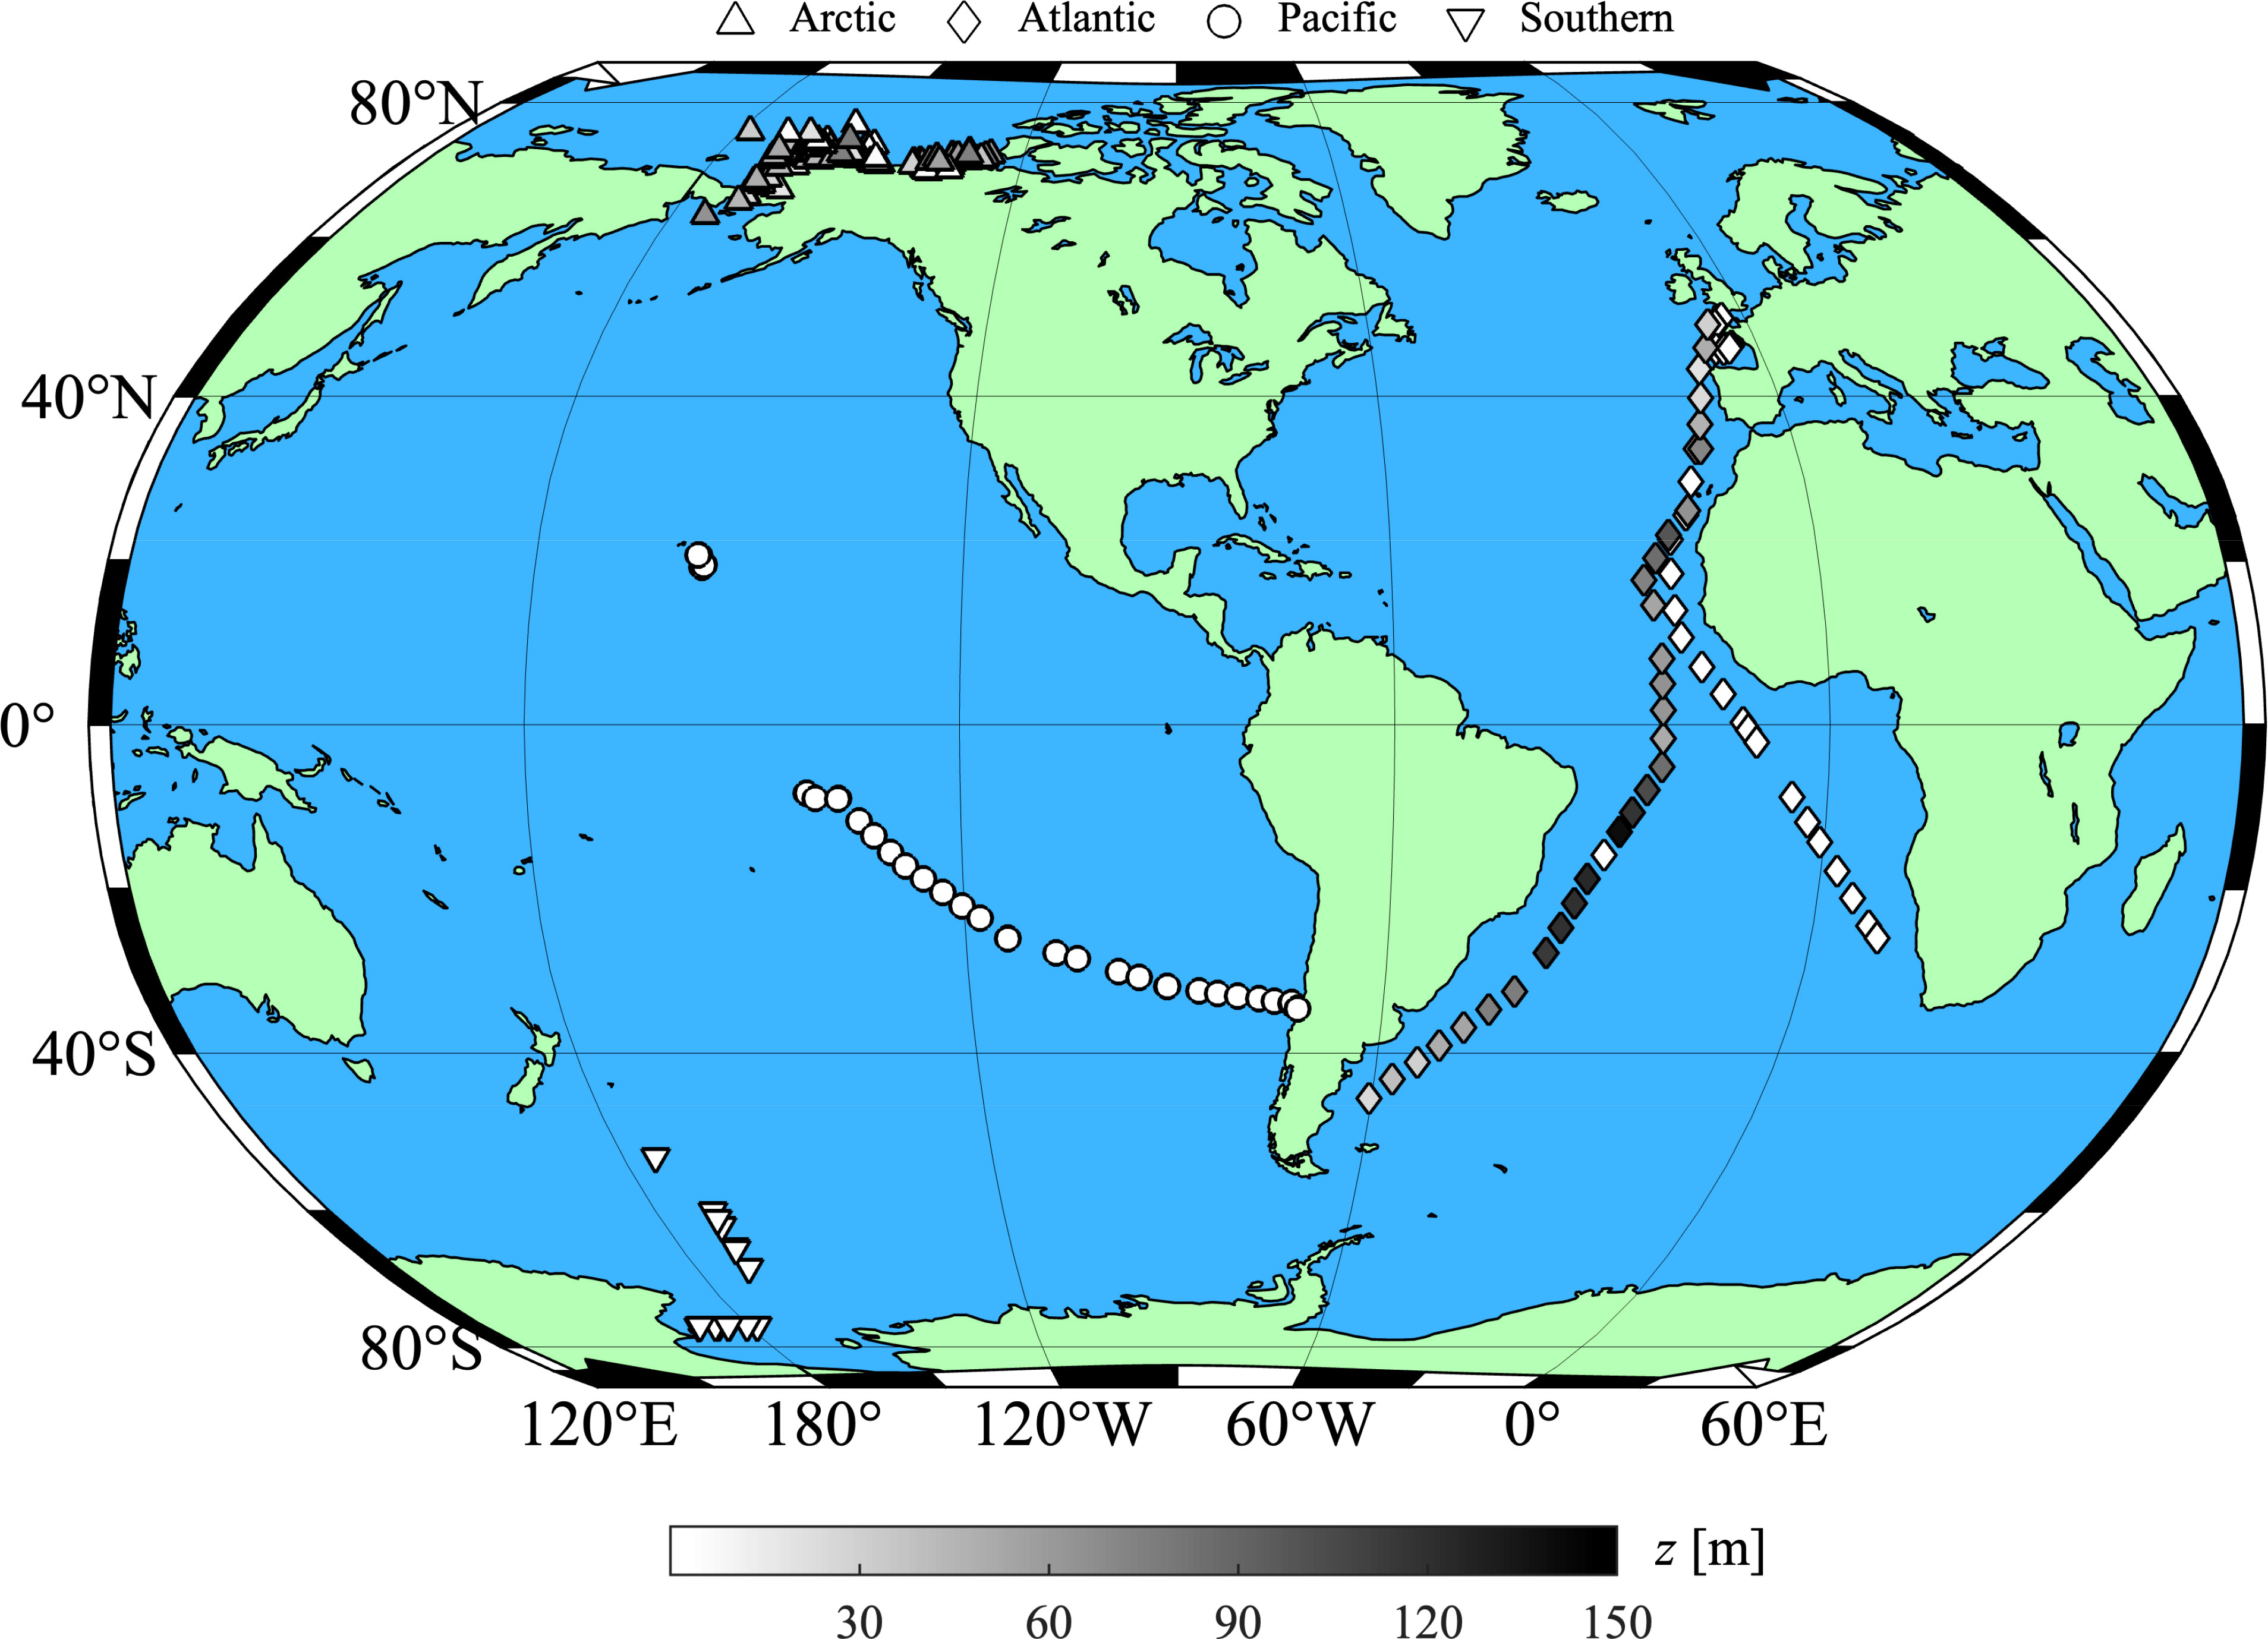
Figure 1 Location of 264 stations in major oceanic basins where samples were collected, with grayscale indicating depth of any additional subsurface sampling. Note surface water was collected at all stations.
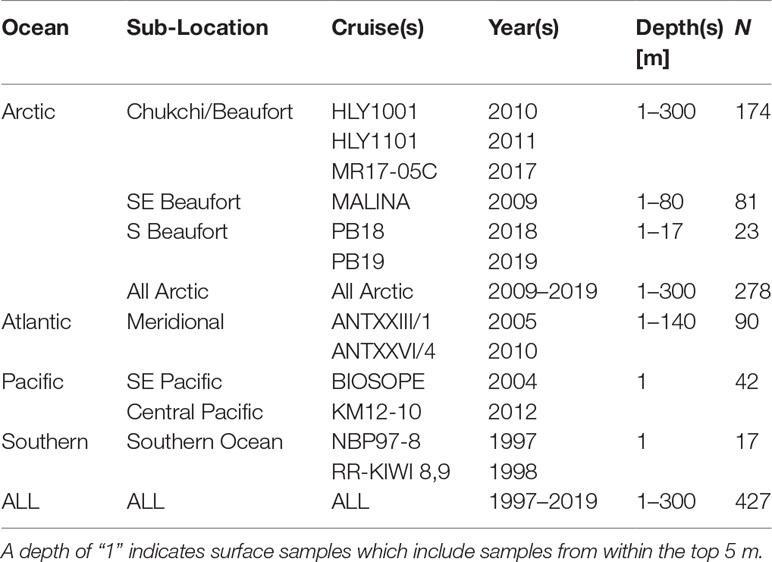
Table 1 Summary of samples.
Particulate Assemblage Characterization
All samples in the current study have been characterized in terms of mass concentration of particulate organic carbon (POC) and total chlorophyll-a (Chla) obtained through filtration of water samples through 25 mm diameter Whatman glass fiber filters (GF/F). Sample volumes were filtered at low vacuum (<120 mm Hg) using pre-combusted filters for the determination of POC following standard methodology (Parsons et al., 1984; Intergovernmental Oceanographic Commission, 1994). Nearly all samples included high-performance liquid chromatography (HPLC) analysis for the determination of Chla. Only few data from coastal Alaskan waters (denoted as PB18 and PB19 in Table 1) utilized in situ fluorometric measurements with an ECO-Triplet instrument (Sea-Bird Scientific) and appropriate corrections were made (Roesler et al., 2017).
When available, additional ancillary measurements were used to provide further characterization of the seawater particulate assemblage. The concentration of dried suspended particulate matter (SPM) was measured following standard methodology using pre-rinsed and pre-combusted 25 mm diameter GF/F filters (van der Linde, 1998). The spectral absorption coefficient of particles, ap(λ) [m−1], was determined using the spectrophotometric filter-pad technique for particulate material collected on 25 mm diameter GF/F filters (IOCCG Protocol Series, 2018). Sample filters were either analyzed onboard or immediately frozen in liquid nitrogen for transport to the laboratory. Absorption measurements were typically made in the spectral range 300–850 nm with 1 nm interval using a UV/VIS spectrophotometer, and depending upon the cruise were measured using either the filter transmittance (T) method or with the inside sphere (IS) method in which the filter was placed inside an integrating sphere (Stramski et al., 2015). Following the measurement of ap(λ), sample filters were treated with methanol and remeasured to determine the spectral absorption coefficient of non-algal particles, ad(λ). The spectral absorption coefficient of phytoplankton was then calculated as the difference aph(λ) = ap(λ) − ad(λ).
The compositional aspects of particulate matter were quantified using three proxies: POC/SPM, aph(410)/ap(410), and Chla/bbp. The ratio POC/SPM is a measure based on the mass analysis of particles collected on GF/F filters and generally describes the relative proportions of organic vs. inorganic matter regardless of the nature of the organic matter (e.g., living or non-living). The second proxy, aph(410)/ap(410), indicates the contribution of phytoplankton to total particulate absorption at a light wavelength of 410 nm and provides insight into the relative amount of phytoplankton vs. non-algal particles within the particulate assemblage. We have chosen to report this parameter at a wavelength of 410 nm where both particulate categories exhibit significant absorption but away from the peak of phytoplankton absorption around 440 nm. The third proxy, ς = Chla/bbp, is the inverse of the chlorophyll-a specific particulate backscattering coefficient which is retrievable from in situ measurements with chlorophyll-a fluorescence and backscattering sensors, and serves as a general compositional indicator of the contributions of phytoplankton vs. non-phytoplankton particles.
Spectral Backscattering Measurements
More detailed information regarding the processing applied to all light scattering data can be found in Reynolds et al. (2016). In brief, spectral backscattering at a scattering angle of approximately 140° from incident light direction was measured in situ with HydroScat-6 and a-βeta sensors (HOBI Labs, Inc.). These measurements typically consisted of 6–11 wavelengths from about 400 to 850 nm depending on the research cruise. Vertical profile data were filtered and averaged into 0.5 or 1 m bins for comparison with data of POC and Chla obtained from discrete water samples. To derive bbp from measurements of β(140°) obtained within each spectral band, the contribution of theoretical pure seawater was removed, a factor of 1.13 was applied, and corrections were made for attenuation losses to and from the sample volume. The spectral bbp data was fit using an ordinary least squares linear regression of log10(bbp) vs. log10(λ) to obtain bbp at λ = 550 nm and 700 nm. Data at λ = 442 nm and 671 nm were not included in this fitting routine due to potential effects of anomalous dispersion related to light absorption by phytoplankton pigments (Morel and Bricaud, 1981).
POC Algorithm Development
The assembled dataset was randomly split into algorithm development and validation datasets which were approximately 60% and 40% in size, respectively. The range of data included in each dataset was approximately the same (depicted in Figure 2 and Table 2). With the exception of two example contrasting samples in both datasets, the algorithm development dataset was used exclusively for determining model coefficients while the validation dataset was used for independent comparison of model-predicted and observed POC. Several regression-model formulations to estimate POC were evaluated and generally referred to as Models A and B, where Model A is a univariate model and Model B is a multivariable model. The general form of Model A was a robust ordinary least squares regression of POC vs. bbp and is generally representative of more common approaches utilized to estimate POC from in situ optical measurements of backscattering. Various data transforms were evaluated. Specifically, we considered a linear model with untransformed data, an exponential model with loge-transformed bbp data, and a power model with log10-transformed bbp and POC data.
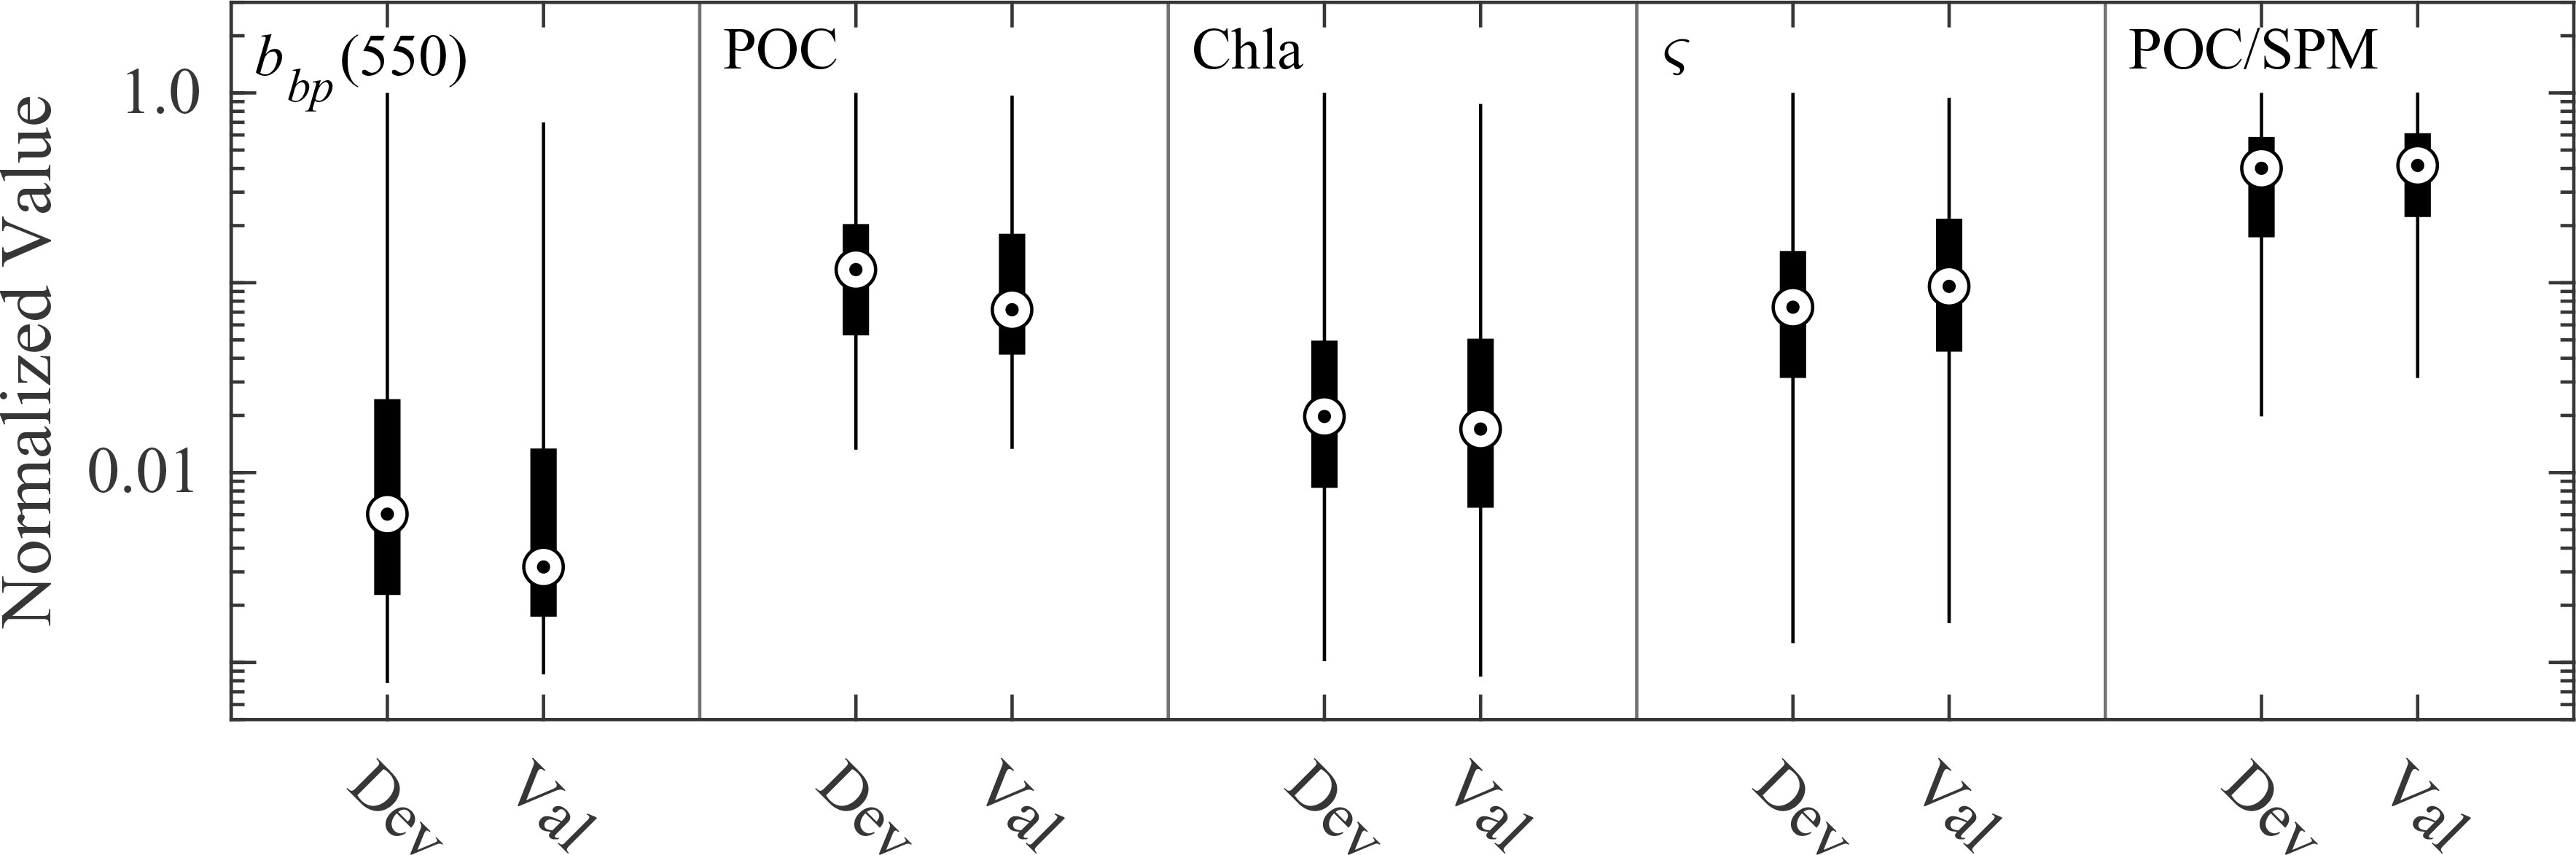
Figure 2 Normalized non-parametric box plots of five variables in development (Dev) and validation (Val) datasets. The features of each box plot represent (from bottom to top) lower limit, 25th percentile, 50th percentile, 75th percentile, and upper limit. Data have been normalized by maximum value of each metric from the development dataset. Maximum values are 0.34 m-1, 816 mg m-3, 16.6 mg m-3, 1988 mg m-2, and 0.69 for bbp(550), POC, Chla, ς, and POC/SPM, respectively.
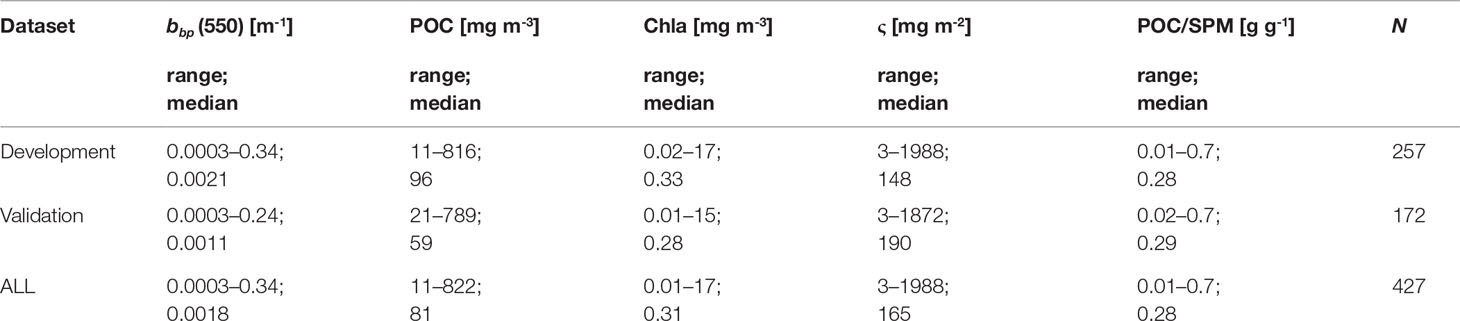
Table 2 Summary of datasets.
The general form of Model B was an additive multiple linear regression equation: POC = k1 + k2bbp + k3ς. k1, k2, and k3 are model coefficients and bbp and ς are measured variables. In this model, the second term (i.e., k2bbp) can be assumed to be a measure of total particle concentration, without information about composition. This relationship is generally robust in terms of estimating total mass of suspended particulate matter, SPM, over a wide range of environmental conditions (Downing et al., 1981; Boss et al., 2009; Neukermans et al., 2012; Reynolds et al., 2016; Koestner et al., 2021). The third term (i.e., k3ς) relates to some additional adjustment pertaining to a measure of bulk particulate composition, ς = Chla/bbp, which is the inverse of Chla-specific bbp. Additional formulations were also tested which included an interaction term ς × bbp and log10-transformed data. Best-fit coefficients were determined with MATLAB’s “regress” function and using a robust fitting bisquare weighting function (tuning constant = 4.685). A bias correction function was included to improve Model B estimations for low POC where Model B tended to overestimate POC. The bias correction function was determined with a Model-II linear regression (the reduced major axis method) of measured vs. modeled POC only when modeled POC was less than 45 mg m-3 and using the algorithm-development dataset. Model-II regressions can be particularly useful when both independent and dependent variables include uncertainties (Ricker, 1973; Sokal and Rohlf, 1995). The bias function is POC = ε1POC* − ε2, where ε1 and ε2 are best-fit coefficients and superscript * indicates initial Model B output. This correction was only applied if POC* was less than a certain threshold (POCmin) to avoid undesirable influence on modeled POC greater than about 35 mg m-3. We chose not to include a bias correction for Model A because this type of correction has not been typically utilized in existing univariate models to estimate POC from optical measurements of backscattering, while the multivariable Model B represents a novel approach.
Regression models were evaluated using various statistical approaches to quantify and visualize uncertainty with metrics derived from the validation dataset. Assessment metrics include root-mean-square deviation (RMSD), median absolute percent difference (MdAPD), median symmetric accuracy (MdSA), and median ratio (MdR) (Table 3). Coefficients of the Model-II linear regression of model-predicted vs. observed (measured) POC are considered as an additional measure of algorithm performance and residual plots are also presented for further visual analysis of performance.
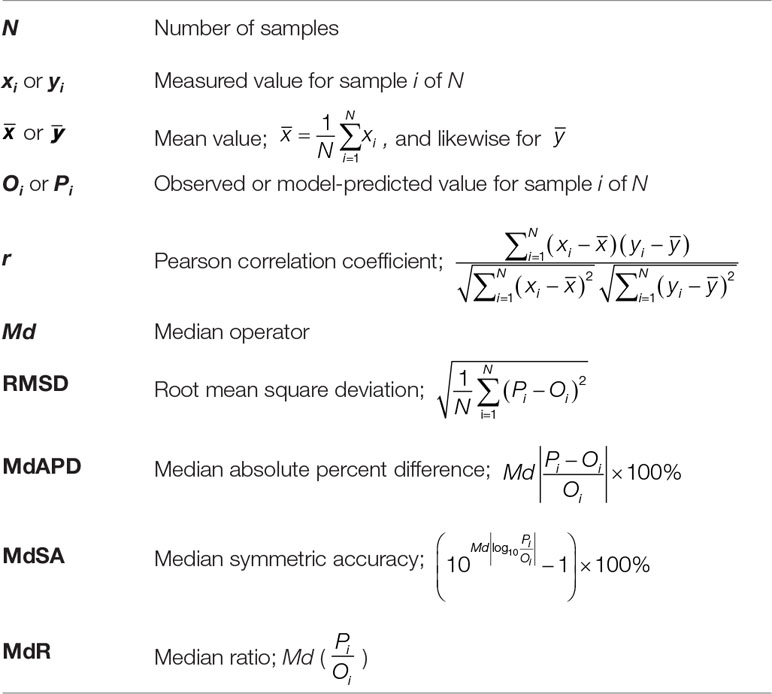
Table 3 Model-assessment variables.
Biogeochemical-Argo Data
BGC-Argo data utilized in the current study originated from a publicly available database published in Sea Scientific Open Data Edition (SEANOE) by Barbieux et al. (2017). Specifically, 861 vertical profiles of quality controlled BGC-Argo data from 6 floats deployed in the Labrador Sea were utilized which included concurrent measurements of depth-resolved bbp at 700 nm and chlorophyll-a fluorescence down to about 1 km. Additional measurements of photosynthetically available radiation (PAR), water temperature, and salinity were also included. Various quality control and processing efforts are described in detail in Organelli et al. (2017).
For the purposes of the current study, positive spikes were not removed from bbp and Chla data; therefore, the potential impact of large-sized particles was included. This choice relates to the desire to accurately estimate POC which likely includes relatively large-sized particles contributing to spikes in bbp, as well as small-sized particles. Both bbp and Chla were averaged into 1 m bins starting at a depth of 0.5 m below the surface. Following application of models to estimate POC based on bbp and Chla, any POC data less than 0 mg m-3 was forced to a value of 0 mg m-3, and a mean-filter with a window of 3 was used to moderately smooth the POC data for parameterization of vertical profiles.
The water column was divided into two zones; the epipelagic zone which includes the surface down to 200 m and the mesopelagic zone which includes the region from 200 m down to about 1 km. The epipelagic was further partitioned into euphotic and sub-euphotic layers. The mixed layer depth (MLD) was calculated with the Holte and Talley (2009) algorithm using potential density profiles based on temperature and salinity measurements. Photosynthetically available radiation immediately below the sea surface (i.e., PAR at depth z = 0–) was calculated by extrapolation of underwater PAR data to a depth of 0 m using a second order polynomial fit (Organelli et al., 2017). The euphotic zone depth (EZD) was determined as the depth at which PAR values are 0.5% of PAR(0–). Most of the actively photosynthesizing and productive phytoplankton are present within this euphotic zone (Wu et al., 2021). The EZD is a more reliable depth for assessing strength of POC export flux as opposed to constant depths (Buesseler et al., 2020); therefore, emphasis is placed on metrics related to EZD. The depth-integrated POC within the euphotic layer (iPOCeu) was calculated as Likewise, the depth-integrated POC within the sub-euphotic layer (iPOCsub) was calculated as Finally, the depth-integrated POC within the mesopelagic zone was calculated as , noting that the deepest datapoint was usually around 950–1000 m. Similar depth-integrated parameters have been useful for interpretation of BGC-Argo data in the Norwegian Sea (Dall’Olmo and Mork, 2014). Finally, an additional measure was also calculated which describes the depth at which the integrated POC is a specific fraction of the total integrated POC from the surface to 1000 m. For example, 50% of the total integrated POC is found above zi50 and it is calculated from when X = 50. This parameter is useful because it is normalized and therefore can be intercompared between profiles which differ in magnitude of POC. Deeper depths of zi50 indicate vertical profiles which include relatively more POC at depth than near the surface.
Results and Discussion
Particle Composition Proxy
The sensitivity of the particulate backscattering coefficient to particle composition underlies the theoretical framework of our proposed multivariable regression model. Theoretical simulations of the backscattering efficiency of natural assemblages of marine particles indicate sensitivity to various properties of particles, such as size distribution and composition characterized by shape, structure, and refractive index (Bohren and Huffman, 1983; Bricaud and Morel, 1986; Stramski et al., 2001; Quirantes and Bernard, 2004; Jonasz and Fournier, 2007; Xu et al., 2017; Organelli et al., 2018). Without accounting for these effects, estimates of the concentration of particulate organic carbon using backscattering measurements will be limited to marine environments exhibiting minimal variability in particle composition and size distribution. This is also corroborated by observations from previous studies which portray variation in relationships between POC and bbp along with expected or measured differences in particle assemblages (e.g., Stramski et al., 1999; Cetinić et al., 2012; Reynolds et al., 2016; Koestner et al., 2021).
In the current study, a composition proxy which is obtainable from in situ optical measurements and therefore included in our optically-based model to estimate POC is Chla/bbp, hereinafter denoted as ς. Figure 3 depicts scatter plots of ς vs. POC/SPM and ς vs. aph(410)/ap(410) for the available data from the entire dataset utilized in algorithm development and validation. Values of ς range from about 2 mg m-2, indicating relatively low chlorophyll-a per particulate backscattering and likely non-phytoplankton dominated particle assemblages, to over 1000 mg m-2, indicating relatively high chlorophyll-a per particulate backscattering and assemblages which are likely phytoplankton-dominated (Figure 3). There is a positive correlation between ς and POC/SPM demonstrating that ς can generally represent bulk changes in the organic vs. inorganic content of particle assemblages; however, this relationship is not strong. The composition term ς also represents changes in composition related to relative phytoplankton abundance as observed in the positive correlation between ς and aph(410)/ap(410), with the latter term representing the relative contribution of phytoplankton to the total particulate absorption coefficient at a light wavelength of 410 nm. These relationships exhibit some noticeable scatter resulting from various additional factors influencing ς such as acclimation of phytoplankton to various environmental growth conditions and phytoplankton community composition. Importantly, however, ς can represent large changes in particle composition beyond general organic vs. inorganic content; for example, when assemblages are organic-dominated with POC/SPM > 0.30, ς varies over nearly the entire range of ς and Chla, from about 30 mg m-2 at low Chla up to 2000 mg m-2 at high Chla (Figure 3). Generally speaking, higher values of the composition term ς tend to describe particle assemblages which are more organic and phytoplankton dominated while lower values (less than about 30 mg m-2) tend to represent particle assemblages which are mixed or inorganic-dominated likely with small or negligible influence of living phytoplankton (Figure 3). Note that the composition values in Figure 3 refer to derivations with bbp at λ = 550 nm. When deriving ς with longer wavelengths of bbp such as 700 nm, ς is typically about 10–30% higher.
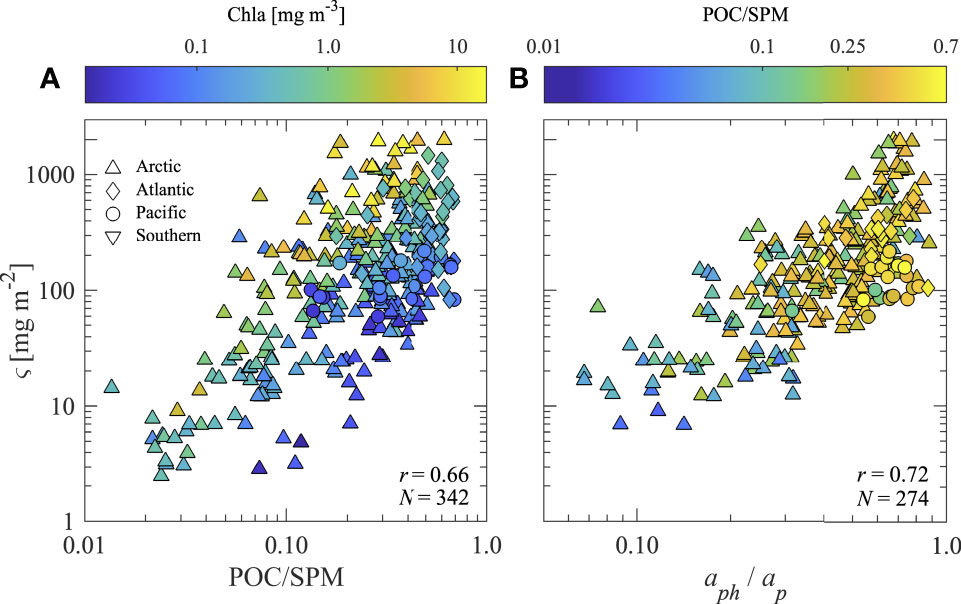
Figure 3 Scatter plots of (A) ς vs. POC/SPM with color indicating value of Chla and (B) ς vs. aph(410)/ap(410) with color indicating value of POC/SPM. Composition parameter ς = Chla/bbp is calculated with bbp at light wavelength λ = 550 nm. The Pearson correlation coefficient r based on log-transformed data and number of samples N are displayed.
POC Algorithms
Table 2 includes a summary of the range of bbp, POC, Chla, ς , and POC/SPM within our dataset used for model development and validation. Values of bbp and POC span about 3 orders of magnitude while Chla spans about 2 orders of magnitude, representing a large range of contrasting oceanic conditions from oligotrophic Pacific waters to productive coastal waters of the Arctic (Table 2; Figure 1). The variability within this dataset is particularly useful for the development and assessment of an algorithm for estimating POC over a wide range of natural conditions. Figures 4–6 describe algorithm development and validation analyses. In Figures 4, 5, two datapoints are outlined with a square for illustrative purposes and are contained in both algorithm development and validation datasets. These two samples have relatively similar POC values (about 200 mg m-3), but differ greatly in terms of composition and are therefore useful in assessing the effectiveness of each algorithm for compositionally-contrasting particulate assemblages.
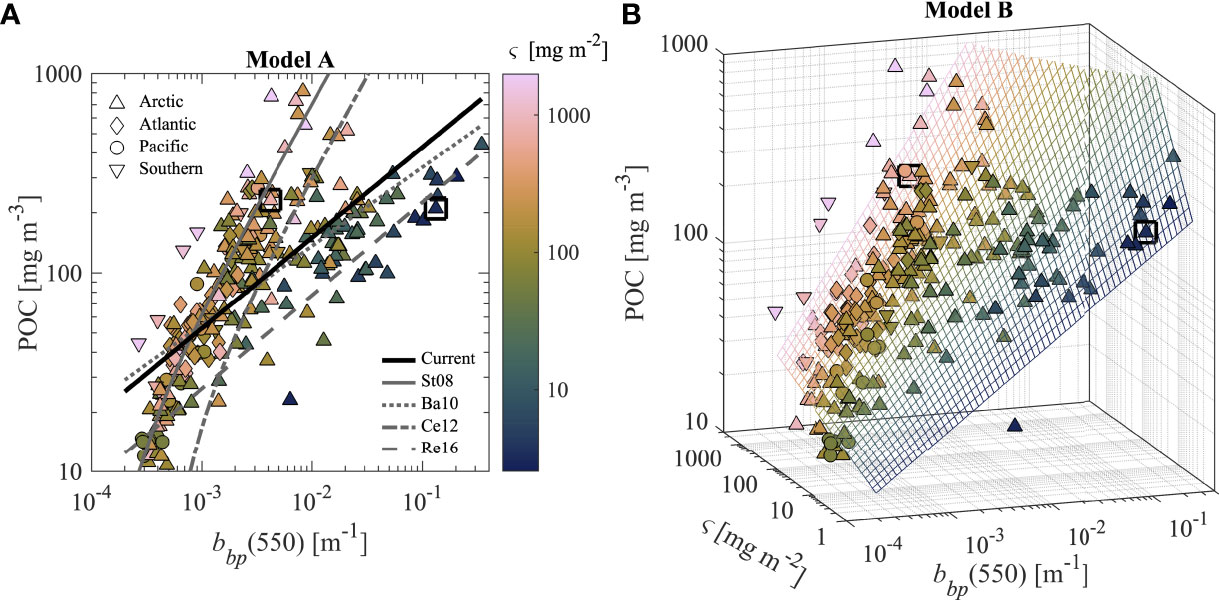
Figure 4 Two regression models for estimating POC based on measurements of bbp at λ = 550 nm. (A) POC as a function of bbp(550) color coded by composition value ς. A linear regression trendline representing Model A from the current study is shown with a solid black line. Regression lines from other studies are indicated in legend where St08 denotes Stramski et al., 2008 (λ = 555 nm), Ba10 denotes Balch et al., 2010 (λ = 532 nm), Ce12 denotes Cetinić et al., 2012 (λ = 532 nm), and Re16 denotes Reynolds et al., 2016 (λ = 550 nm). Note that Re16 refers to the analysis of mineral-dominated particle assemblages and Ce12 refers to downcast and includes a factor of 0.88 to adjust bbp(700 nm) to the value at λ = 532 nm. (B) Three-dimensional scatter plot of POC, ς, and bbp, also color coded by ς value. A grid is used to show estimations from Model B. Two datapoints are marked with a square in all panels and represent samples which have similar POC but contrasting composition. N = 257.
Figure 4A presents POC vs. bbp(550) and includes the single-component (univariate) regression model referred to as Model A. We first focus on algorithms developed with bbp(550) because backscattering sensors often utilized in oceanographic studies use light at or near this wavelength, including specifically the sensors utilized in the algorithm development and validation datasets, and this wavelength avoids absorption features associated with phytoplankton pigments. The power function model fit the algorithm-development dataset better compared with linear and exponential formulations, and improvements in statistical metrics derived with validation dataset were substantial. However, a single relationship does not perform well for the algorithm-development dataset and the data can be generally separated into groups with low ς and high ς (Figure 4A). For comparison, Figure 4A also includes four additional backscattering-based models from other studies. The Stramski et al., 2008 algorithm fits the high ς data quite well, but fails to represent the datapoints with low ς. In contrast, the Balch et al., 2010 algorithm based on surface Atlantic waters and Reynolds et al., (2016) algorithm based largely on mineral-dominated Arctic samples, fit the low ς data well but fail to represent the high ς datapoints. Model A also appears ineffective at capturing the two compositionally-contrasting datapoints (outlined with squares in Figure 4A). Despite these shortcomings, Model A is statistically significant (p-value< 0.01) and has an R2adj value of nearly 0.54 (Table 4). The best-fit regression coefficients are also shown in Table 4.
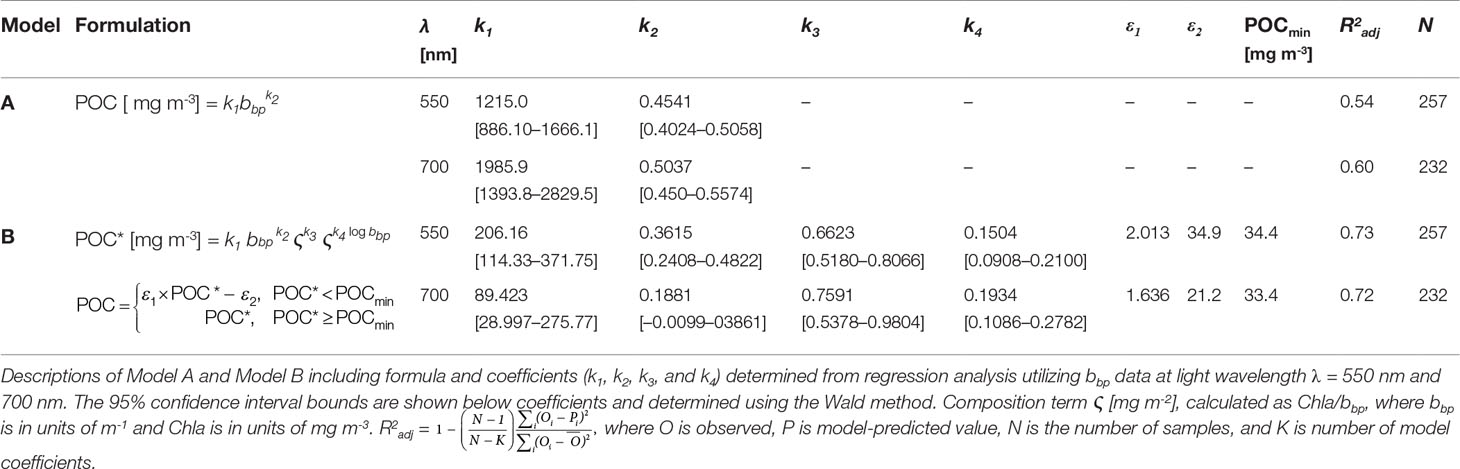
Table 4 Regression models for POC.
Figure 4B illustrates a three-dimensional scatter plot of bbp(550), POC, and ς for the algorithm development dataset. Several formulations of a multivariable regression model were attempted and the best approach is shown in Figure 4B using a three-dimensional mesh grid, referred to as Model B. This grid displays estimations of POC based on Model B’s input values of ς and bbp(550), and is colored by ς value. The exact formulation of Model B is shown in Table 4 and utilizes log10-transformed data with an interaction term (i.e., ςk4logbbp) and a bias correction term. There are improvements in the agreement between modeled and measured values for Model B as compared with Model A for various scenarios such as when ς is low and bbp increases or when ς is high and bbp increases (Figure 4). Moreover, the two compositionally-contrasting samples outlined with square symbols now appear much closer to the modeled values in Figure 4B as compared with Model A in Figure 4A. The R2adj value suggests that about 73% of the variance in observed values is adequately explained by Model B, whereas only about 54% of the variance in observed values of POC is accounted for by Model A (Table 4).
Figure 5 depicts results from a validation analysis which quantitively examines improvements in estimations of POC from multivariable Model B compared with Model A when using an independent validation dataset covering a similar range of oceanic conditions as the algorithm development dataset. Figures 5A, B depict modeled vs. measured POC data for the two regression-models with various statistical metrics displayed. Visually, it can be seen that most low and high ς data are far from the reference 1:1 line for Model A estimations of POC (Figure 5A). The Model-II linear regression line between log-transformed values of modeled and measured POC indicate general bias and poor agreement with the 1:1 line for Model A over the full range of measured POC. Substantial improvements in validation results are seen for Model B in Figure 5B. Overall there is minimal bias and good agreement between the regression line and the 1:1 line, and all statistical metrics indicate good performance for Model B. Values of MdAPD and MdSA are about 40% lower and RMSD is almost 50% lower for Model B as compared with values from Model A. Generally, we observe uncertainties less than about 30% for Model B estimations of POC. Uncertainties in POC estimations can be further examined by looking at residual plots for modeled POC as a function of measured POC in Figures 5C, D. The residuals (expressed in percent) are generally similar throughout the range of measured POC for Model B. In contrast, the residuals of Model A estimations have a pattern of decreasing residuals with increasing measured POC values. The spread of residuals is smallest for Model B with average percent residuals close to 0%. Finally, the two example datapoints indicated with a square are quite close to 0% residual for Model B while one of these datapoints approaches the bounds of the 95% limit of residuals for Model A (Figures 5C, D). This suggests that datapoints which may be outliers in a typical formulation such as the univariate backscattering-based Model A, and which represent highly contrasting environmental conditions and particulate assemblages, can be estimated with a significantly higher degree of certainty when using a multivariable model such as Model B. Note that for both regression models, many of the outlier data originate from samples collected in the Arctic (triangles in Figure 5).
In the next step of our analysis, Models A and B were reparametrized for use with bbp at λ = 700 nm which is typically measured with backscattering sensors deployed on BGC-Argo floats. For this purpose, we used a range of bbp(700) = 0.0001–0.03 m-1 representative of the range of values typically encountered by these profiling floats (Organelli et al., 2017). The regression model development and validation are summarized in Figure 6 and we observe similar results as seen for the models which utilize bbp at λ = 550 nm in Figures 4, 5. The model coefficients are also presented in Table 4. With the more limited range of bbp(700) data likely to be encountered by BGC-Argo floats that are typically deployed in the deep ocean, the univariate Model A for bbp(700) shows some improvements in terms of statistical metrics compared to Model A for bbp(550) (e.g., RMSD and MdSA are reduced to 128 mg m-3 and 35% from 142 mg m-3 and 47%, respectively). However, Model B utilizing bbp(700) is clearly superior to Model A utilizing bbp(700) (Figures 6C, D). In particular, RMSD of Model B is less than 70 mg m-3, uncertainty is less than 25% as assessed with MdAPD and MdSA, aggregate bias is minimal (e.g., MdR = 0.99), and the slope of the fitted Model-II regression line for log-transformed modeled vs. measured POC is 0.99 (Figure 6D).
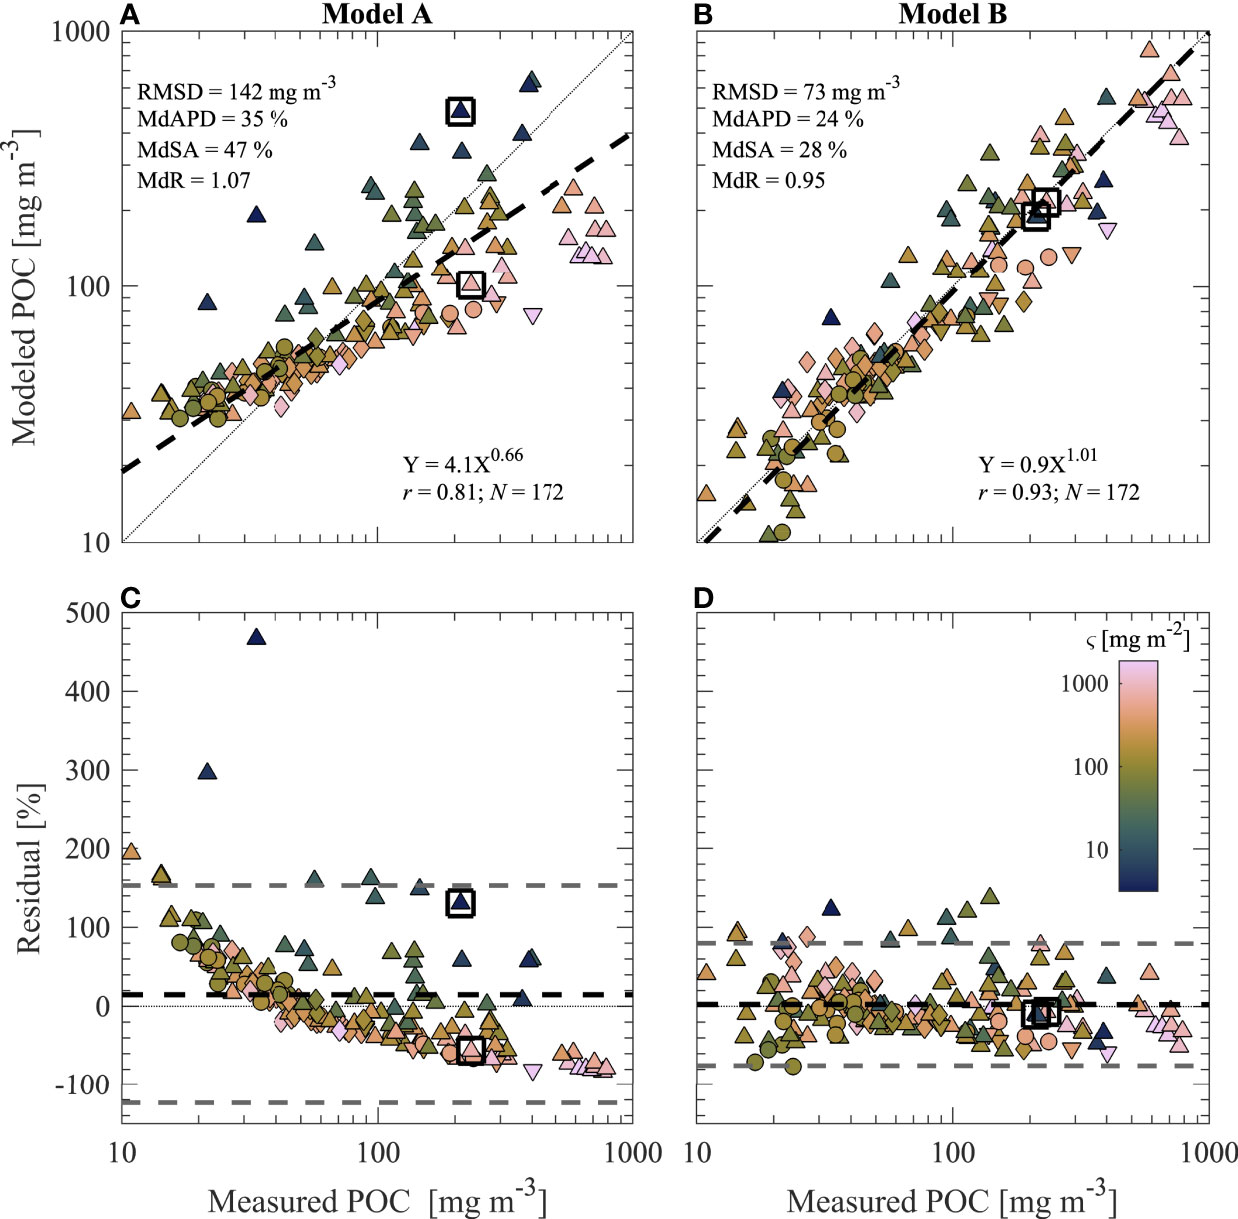
Figure 5 Validation of (A, C) Model A and (B, D) Model B from Figure 4 by comparison of modeled and measured POC data. Data are color coded by ς value described by color bar in (D). Statistical metrics described in Table 3 are displayed in each panel. Two datapoints are marked with a square for discussion purposes. (A, B) Modeled vs. measured POC. Statistical metrics derived from this comparison are shown. Model-II linear regressions of log10-transformed data are displayed with a dashed line and equation is shown, while a 1:1 dotted line is plotted for reference. (C, D) Residual plots from data in panels above. Percent residuals are defined as 100 % x (Modeled POC – Measured POC)/Measured POC. Black dashed line represents mean residual value while gray dashed lines represent approximate 95% confidence limits of residuals (i.e., mean ± 1.96 standard deviations).
Briefly, we recall that the multivariable Model B includes an interaction term (Table 4). As such, some multicollinearity is inherent to Model B which can contribute to uncertainty in model coefficients. The 95% confidence bounds of each model coefficient are shown in Table 4. Model coefficients k1 and k2 for Model B have higher uncertainty than k3 and k4, particularly for the model parameterized with λ = 700 nm (Table 4). Generally, multicollinearity is an issue if model coefficients are not statistically significant. The only model coefficient which may not be considered statistically significant is k2 when Model B is parameterized with λ = 700 nm (p-value = 0.06). All other coefficients have p-values much lower than 0.00001. Nonetheless, validation of Model B has shown that it is effective at estimating POC with an independent dataset (Figure 6).
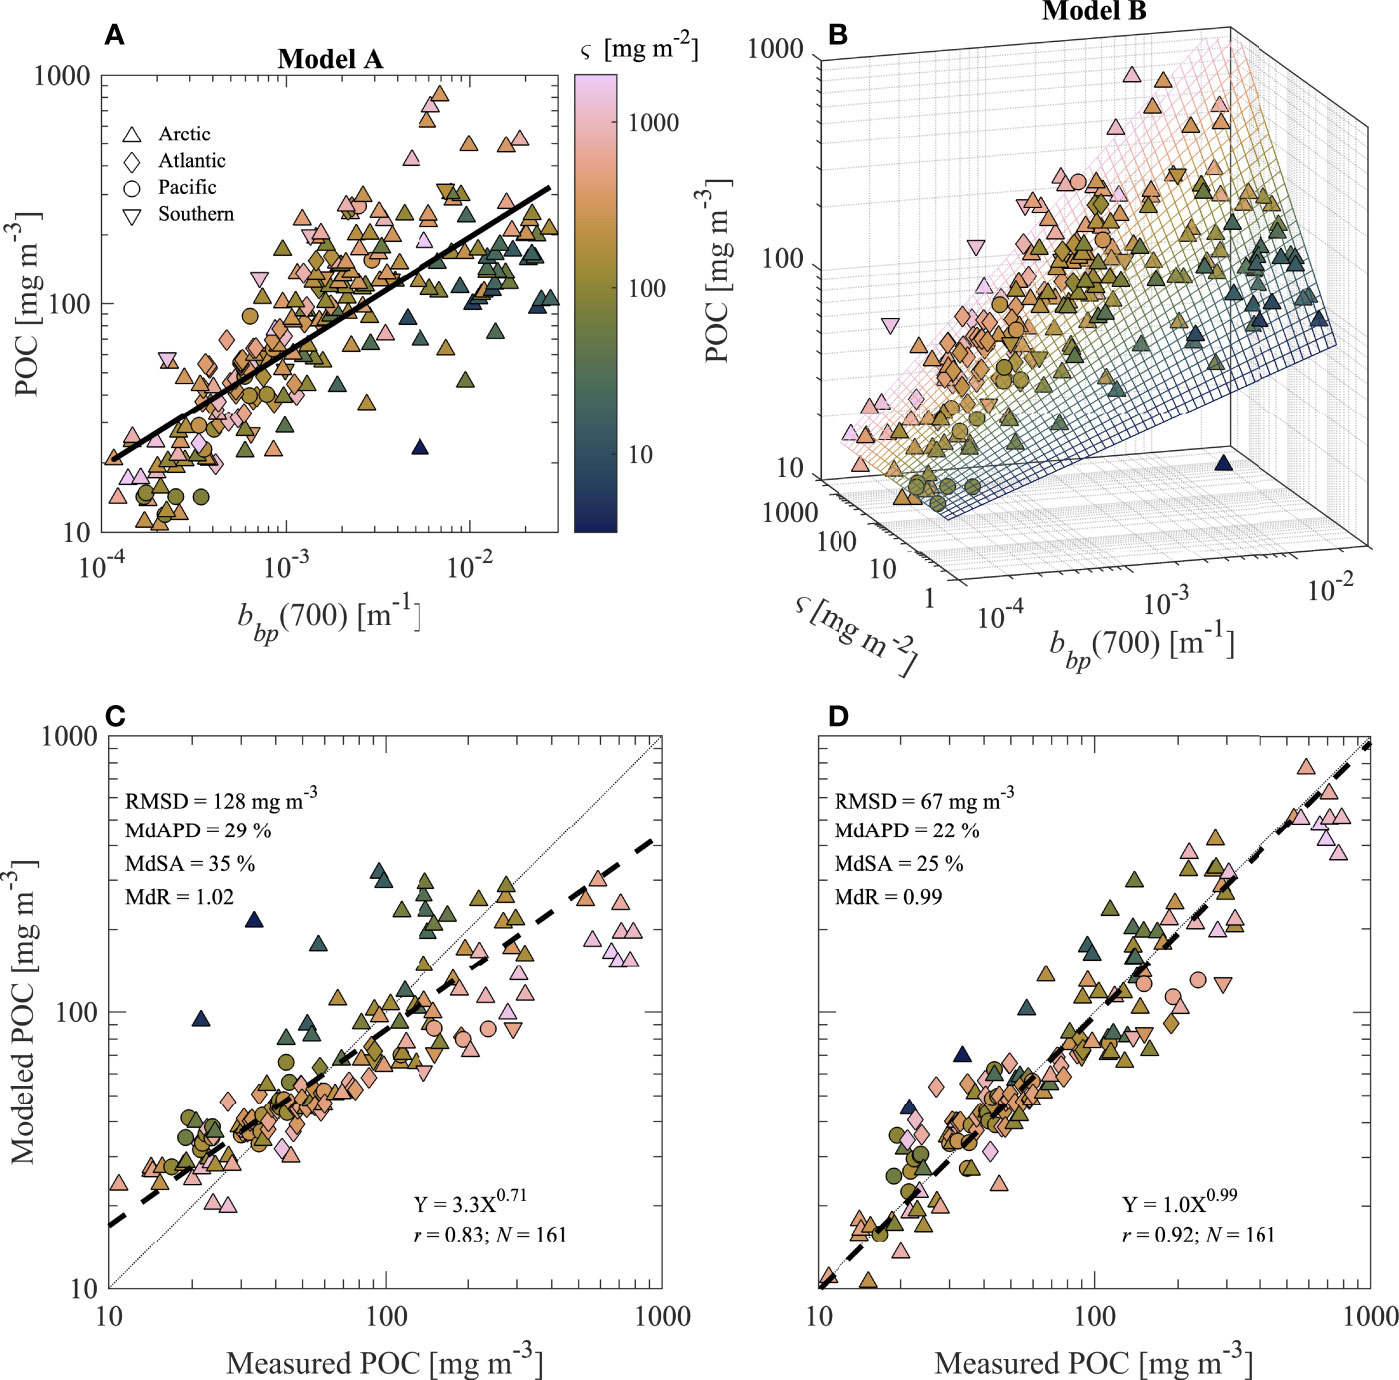
Figure 6 (A, B) Similar to Figure 4 and (C, D) similar to Figures 5A, B except regression analysis utilizes bbp data at λ = 700 nm and for bbp(700) < 0.03 m-1.
Particulate Organic Carbon Within the Labrador Sea Region
Model A and Model B were applied to depth-resolved bbp and Chla derived from fluorescence measurements acquired with six BGC-Argo floats surveying the region of the Labrador Sea from May 2013 until December 2015. Figures 7–9 describe analysis of this BGC-Argo dataset with emphasis placed on estimations of POC from multivariable Model B. Figure 7 depicts a summary of this analysis. Floats generally profiled every 1–10 days and remained just south and west of Greenland in waters which were approximately 1–4 km deep (Figure 7A). Example vertical profiles of Model B-derived POC are shown for 14 November 2014 and 29 May 2015 in Figures 7B, C. Typically late autumn and winter months have relatively low surface POC (about 50–60 mg m-3) which is uniform within the surface mixed layer while POC and ς values below the MLD decrease to minimum values of around 1–2 mg m-3 and 5–10 mg m-2, respectively, in the deep mesopelagic zone (Figure 7B). In late spring months, surface values of POC are higher (around 200 mg m-3) and ς remains relatively high throughout the epipelagic zone and into upper portions of the mesopelagic zone (Figure 7C). Late spring months also tend to have higher values of POC within the mesopelagic zone with minimum POC values of about 7 mg m-3 in some cases (Figure 7C). Often around May and June, there are also instances of relatively high ς (i.e., greater than 300 mg m-2) at depths below 200 m possibly indicating the presence of sinking phytodetritus and/or phytoplankton which are unlikely to still be actively photosynthesizing given they are well below the EZD (Figure 7C). Interestingly, while the integrated POC within the euphotic zone (iPOCeu) is similar for the two example profiles shown for 14 November 2014 and 29 May 2015, the sub-euphotic integrated POC (iPOCsub) is over 5 times and the mesopelagic-integrated POC (iPOCme) is about two times as large in May as they are in November (Figures 7B, C).
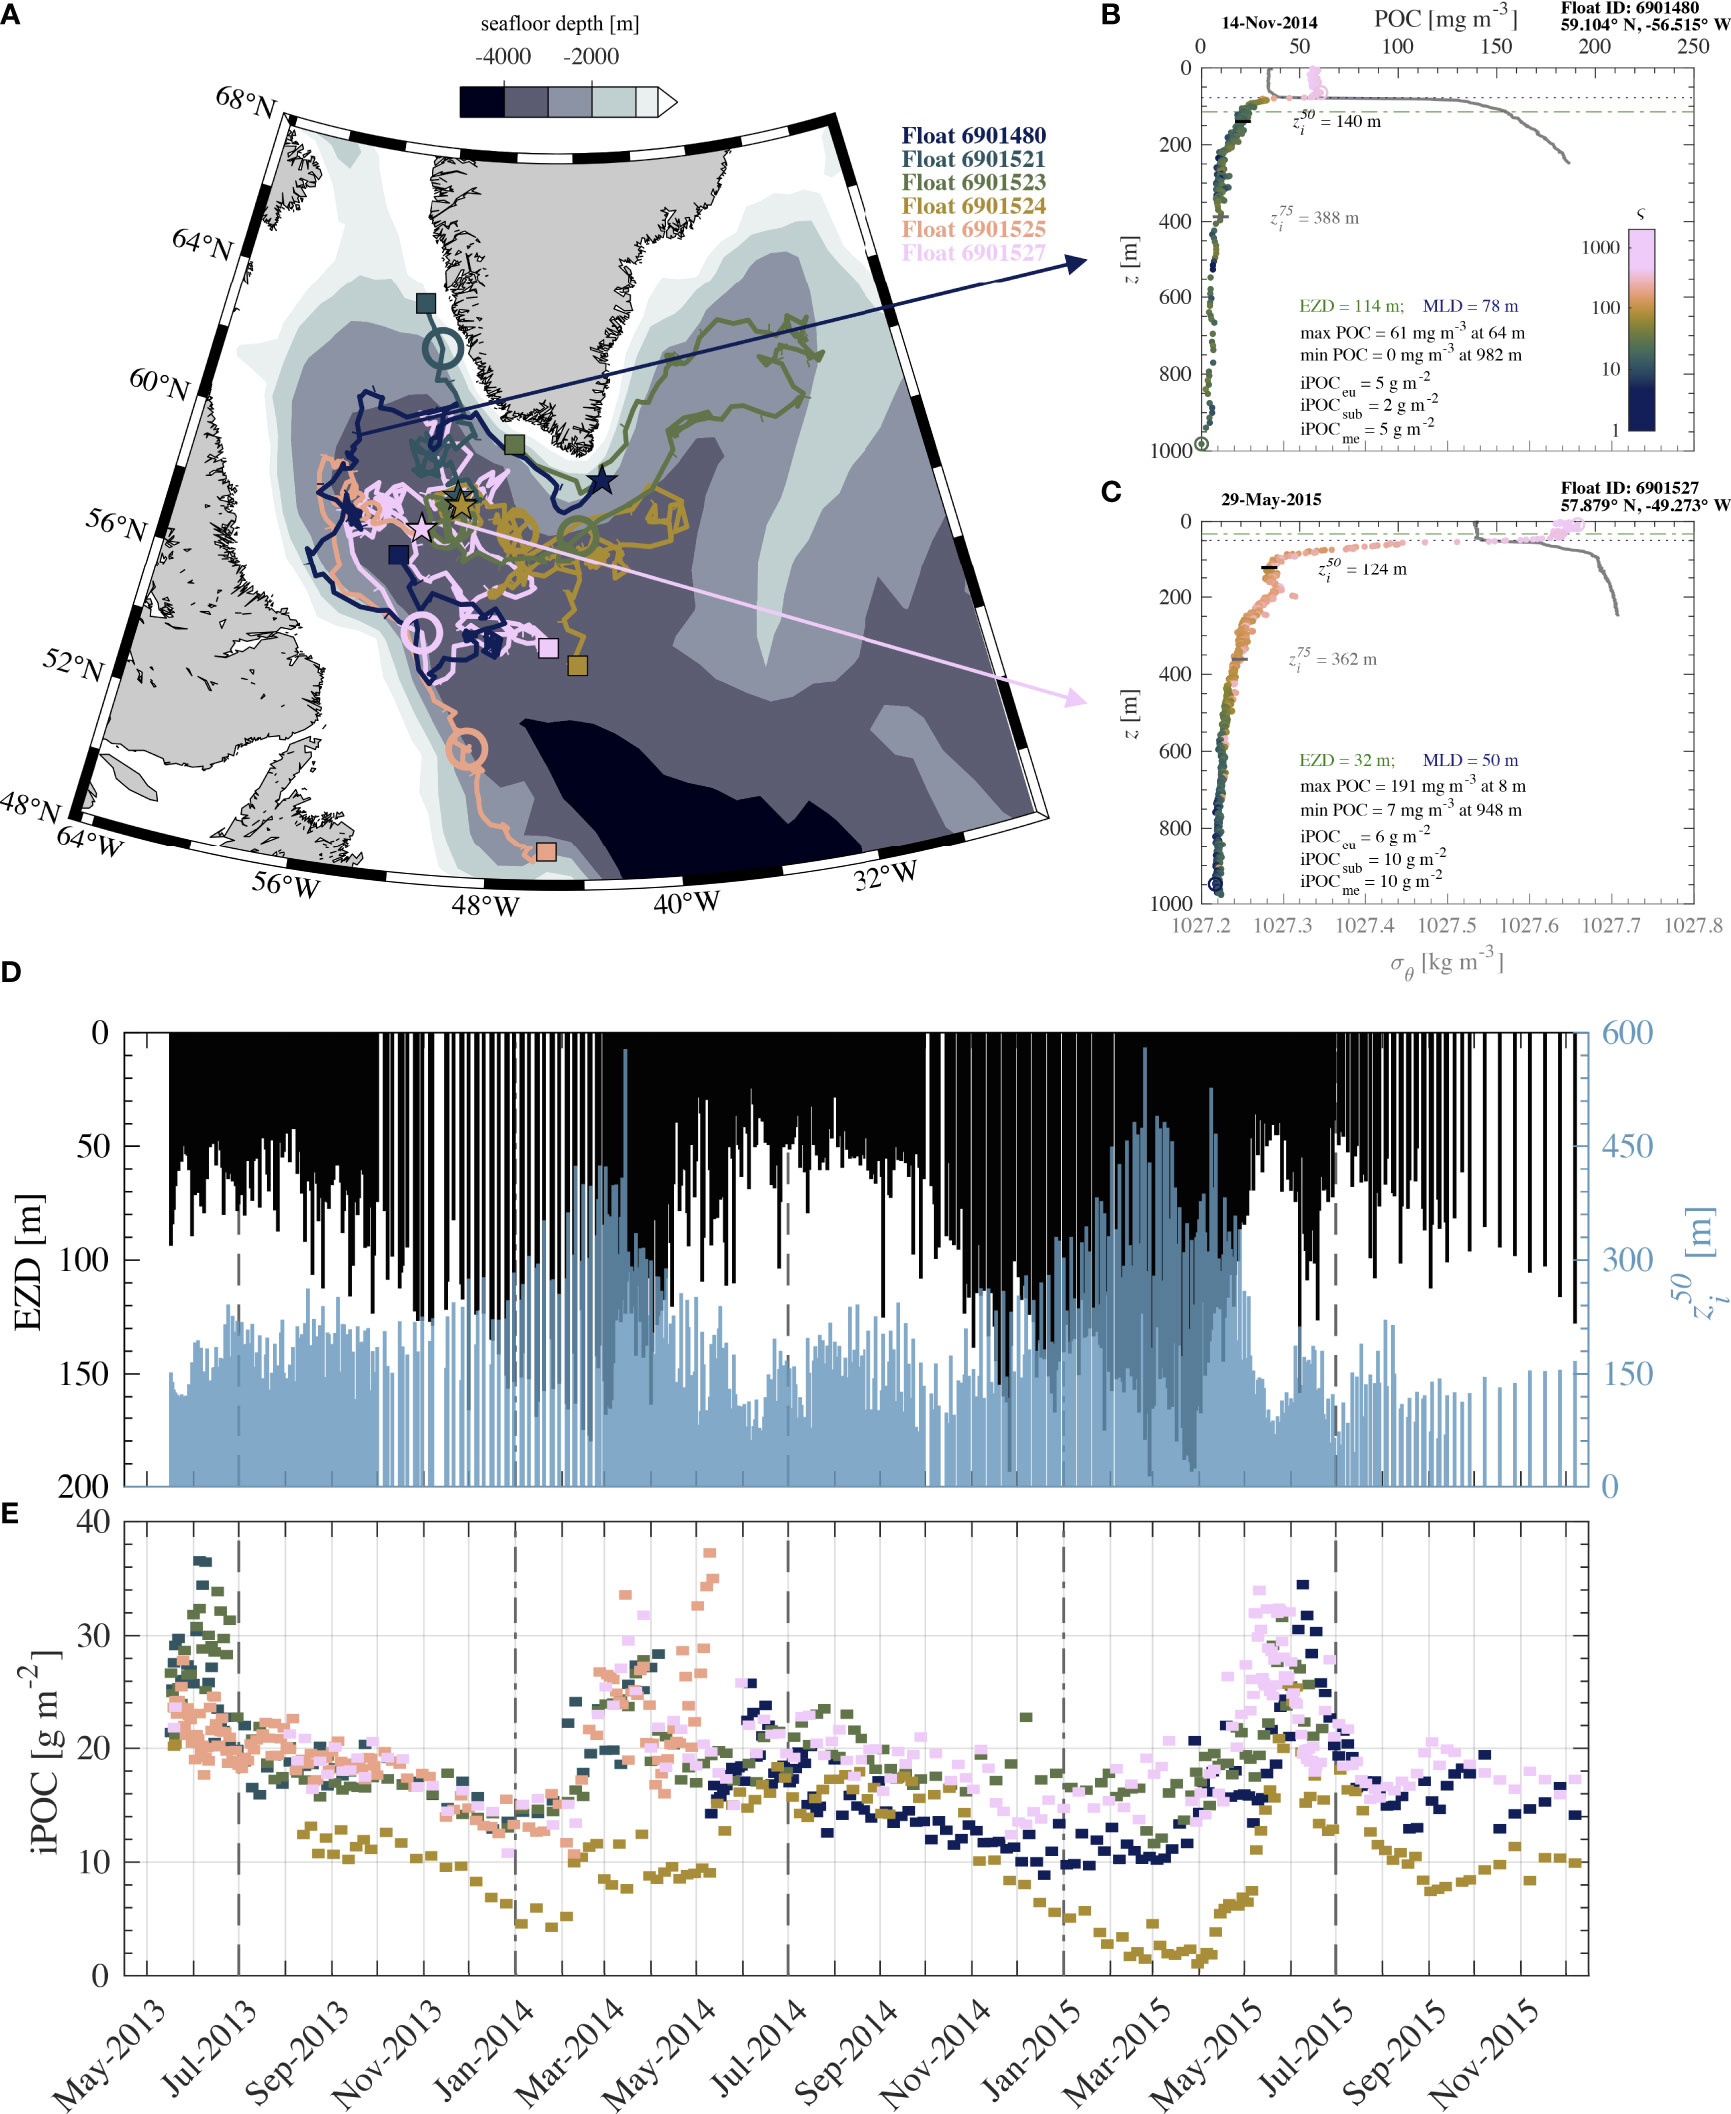
Figure 7 Analysis of BGC-Argo data from six floats deployed in the Labrador Sea region and active from May 2013 through December 2015. (A) Map of region where floats were vertically profiling. Bathymetric contour lines are color-filled as indicated. Tracks are colored by float identifier with monthly tick marks. Stars indicate starting location while squares indicate ending location, and a large circle indicates approximate location of floats in March 2014. Panels (B) and (C) depict example vertical profiles of POC derived from Model B and potential density of seawater σθ (referenced to surface pressure) for two different dates. (D) Summary of daily averages of the euphotic zone depth (EZD) in black and zi50 (with an inverted y-axis) in blue derived from BGC-Argo data (see text for details). (E) Total integrated POC within top 1 km of water column (i.e., iPOCeu + iPOCsub + iPOCme) derived from each BGC-Argo float as indicated by color in (A).
A summary of EZD and zi50 determined as the average data from each day is shown in Figure 7D, while total iPOC (i.e., iPOCeu + iPOCsub + iPOCme) from each float is shown in Figure 7E. As autumn turns to spring in 2013 and 2014, there is a deepening of EZD and zi50, followed by a relatively quick retreat around May 2014 and 2015 which accompanies a notable increase in total iPOC (Figures 7D, E). This is consistent with expectations in these northern latitudes as the surface ocean warms, available solar energy increases, and nutrient mixing leads to increased primary production in late spring. Typically, however, the highest values of zi50 are around 400 m and are seen earlier in the year, around March, and indicate that vertical profiles of POC are skewed towards deeper depths during this time.
Figure 8 displays the three depth-integrated POC measures from each float during the entire time series. Within the euphotic zone, there are visible seasonal patterns with generally larger values of iPOCeu (about 5–7 g m-2) observed in late spring into early autumn and minimum values (about 1–3 g m-2) observed in early winter. It is worth mentioning that these floats are encountering notable differences in terms of magnitude of iPOCeu most likely as a consequence of horizontal heterogeneity which highlights some challenges to interpret data from multiple floats (Figure 7A). For example, iPOCeu determined with float 6901527 is about 6 g m-2 in March 2015 while values are less than about 1 g m-2 as determined from measurements on float 6901524. Despite these differences, general patterns are still clear within the Labrador Sea region.
Beneath the euphotic zone, it is expected that net primary production is null or very low and therefore temporal dynamics in terms of POC will be driven mostly by vertical and horizontal transport as well as microzooplankton grazing and remineralization (e.g., Siegel et al., 2014). When considering the sub-euphotic zone, defined as from EZD down to 200 m, we find that values of iPOCsub can be very high in May and June, often 5–15 g m-2. Unlike iPOCeu, the highest iPOCsub values in May and June are not sustained into early autumn (Figures 8A, B). Values of iPOCsub generally decrease from July through March with values rarely exceeding 5 g m-2 (Figure 8B). Some of the seasonal trends observed in iPOCsub can be explained by deepening of the EZD, however the EZD is fairly consistent from about July to November (Figure 7D). This decrease in iPOCsub which generally doesn’t coincide with decreases in production from above may possibly be explained by more efficient grazing activities once microzooplankton populations stabilize in early summer as water temperatures warm (Head et al., 2003).
Regarding deeper vertical transport to the mesopelagic zone, it appears as though there are only minimal increases in iPOCme over 10 g m-2 coinciding with higher POC within the epipelagic zone around May through July (Figure 8). Typically, values of iPOCme in the Labrador Sea region are consistently about 5–10 g m-2 throughout the year and iPOCme is mostly featureless with the exception of a major event in March 2014 observed by four of the five floats profiling at the time recording iPOCme values upwards of 15–25 g m-2 (Figure 8C). The location of these floats is highlighted in Figure 7A and shows that they are generally near the continental shelf in mid-March 2014. This enhancement of POC in the mesopelagic zone does not appear to come from the surface waters directly above as it generally precedes increases in iPOCeu and iPOCsub which are likely related to late spring biological production in the region. This peculiar increase of iPOCme in March 2014 may be explained by eddy-driven subduction of earlier spring surface production further south or nearshore as terrestrial runoff increases with warming temperatures (Lacour et al., 2015). Modeling simulations have shown that mesopelagic POC can have notable transport by an eddy-driven subduction mechanism, particularly in the region of the Labrador Sea (Ohmand et al., 2015). Similar observations have also been made by BGC-Argo floats operating in the Southern Ocean (Llort et al., 2018). It is unlikely that this March 2014 iPOCme anomaly is an artifact of measurements as it is observed by multiple floats (Figure 8C). More work is needed to validate these results and verify that some of the most significant increases of POC within the mesopelagic zone in the Labrador Sea region appear to precede production of POC observed in the epipelagic zone during late spring.
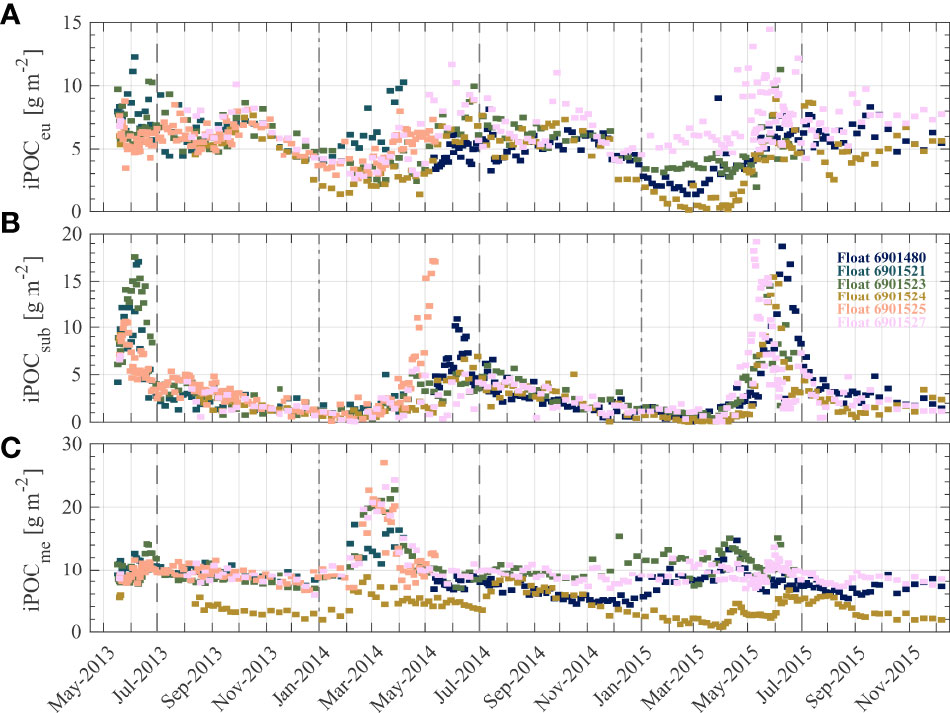
Figure 8 Three parameters describing depth-integrated particulate organic carbon (POC) for six BGC-Argo floats sampling in the Labrador Sea region detailed in Figure 7A. Parameters refer to POC integrated within (A) euphotic and (B) sub-euphotic layers of epipelagic zone, and (C) mesopelagic zone. See text for more details regarding calculation of depth-integrated POC parameters.
Figure 9 portrays various ratios of the three depth-integrated POC parameters over time to better depict some of the seasonal-trends observed in Figure 8. With the exception of May and June for all three years of available data, there is typically 1–10 times more POC within the euphotic layer of the epipelagic zone than the sub-euphotic layer (Figure 9). The efficiency of vertical transport of POC into the mesopelagic zone does not appear strong in May and June as the proportion of POC within the epipelagic zone is often 1–3 times the amount within the mesopelagic zone. As expected from observations of high iPOCme in March 2014, depth-integrated POC within the epipelagic zone is about 20–80% of the amount in the mesopelagic zone in March 2014. The ratio of epipelagic-integrated POC to mesopelagic-integrated POC shows that March 2015 also exhibits a similar trend of relatively high POC within the mesopelagic compared with epipelagic zone (Figure 9). Generally, however, for most of the year there are similar amounts of POC within the epipelagic and mesopelagic zones as indicated by a ratio of about 1 in Figure 9.
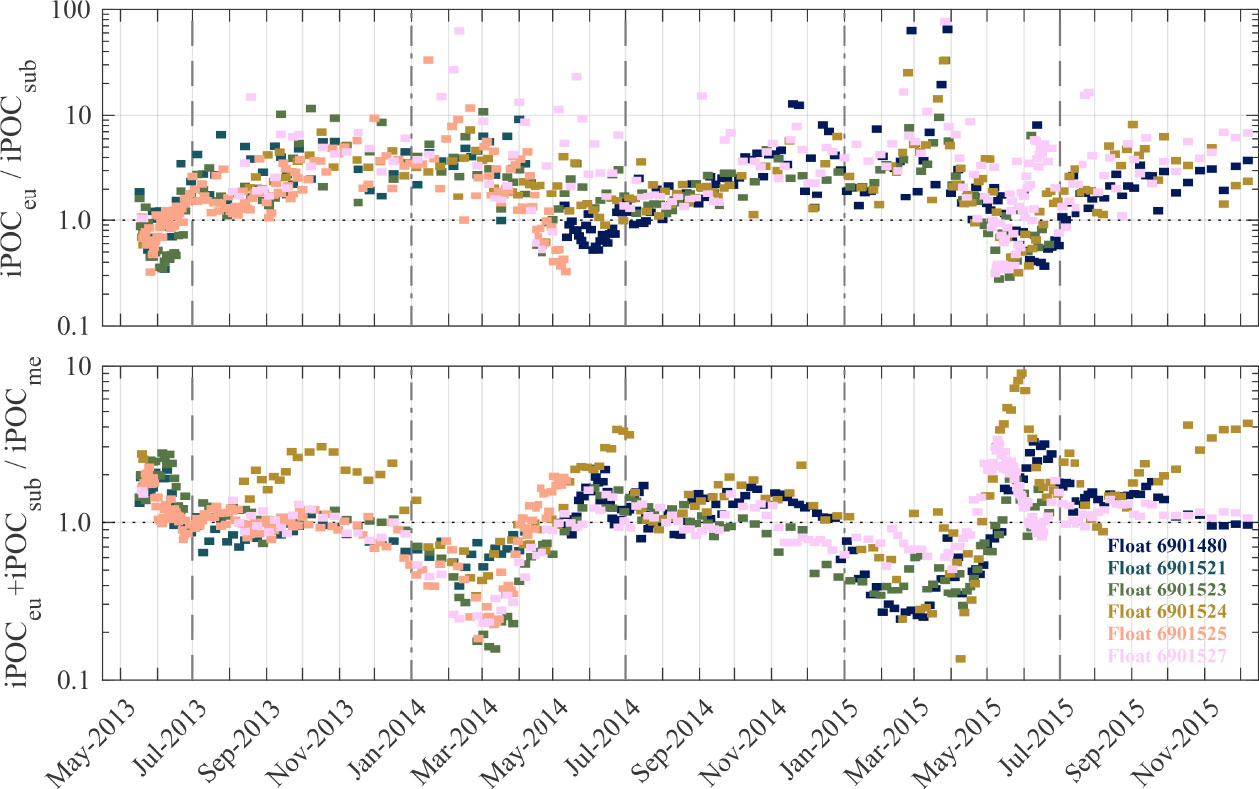
Figure 9 Ratios of depth-integrated POC parameters described in Figure 8.
Figure 10 includes a comparison between iPOCeu and iPOCme derived from univariate Model A and multivariable Model B. For iPOCeu, there are seasonal differences in Model A vs. Model B estimations. Compared with Model B estimates of iPOCeu, there tends to be underprediction of Model A estimates by about 50%, while in winter there is slight overprediction of Model A estimates (Figure 10). This is likely attributable to the ability of multivariable Model B to better account for overall changes in composition of particles (Figure 6). In the mesopelagic zone, there is consistently an overprediction of POC from Model A, which is commonly two to three times as high as Model B estimations of POC (Figure 10). We believe the lack of both a bias correction for low POC and a composition variable in Model A consistently leads to higher estimations of POC in the mesopelagic zone.
Values of total integrated POC within the upper 1 km of water column were previously reported in the Norwegian Sea using BGC-Argo data from 2010–2012 (Dall’Olmo and Mork, 2014). There, it was found that total iPOC values in the most productive months of May and June were typically about 5–10 g m-2. In the present study focused on the Labrador Sea region, values of total iPOC in May and June 2015 were about 20–30 g m-2 (Figure 7E). This difference can generally be related to geographic locations and may also be partially explainable by uncertainties in backscattering sensor calibration (e.g., Barnard, 2021; Erickson et al., 2022) or methodological differences, e.g., Dall’Olmo and Mork (2014) focused on small particles excluding large-sinking particles and also utilization of a univariate bbp-based model for POC. Of note, May 2015 in the Labrador Sea was reported to experience some of the most significant positive anomalies on record in terms of surface chlorophyll-a concentration and consequently primary production based on satellite observations at the time (Frey et al., 2015).
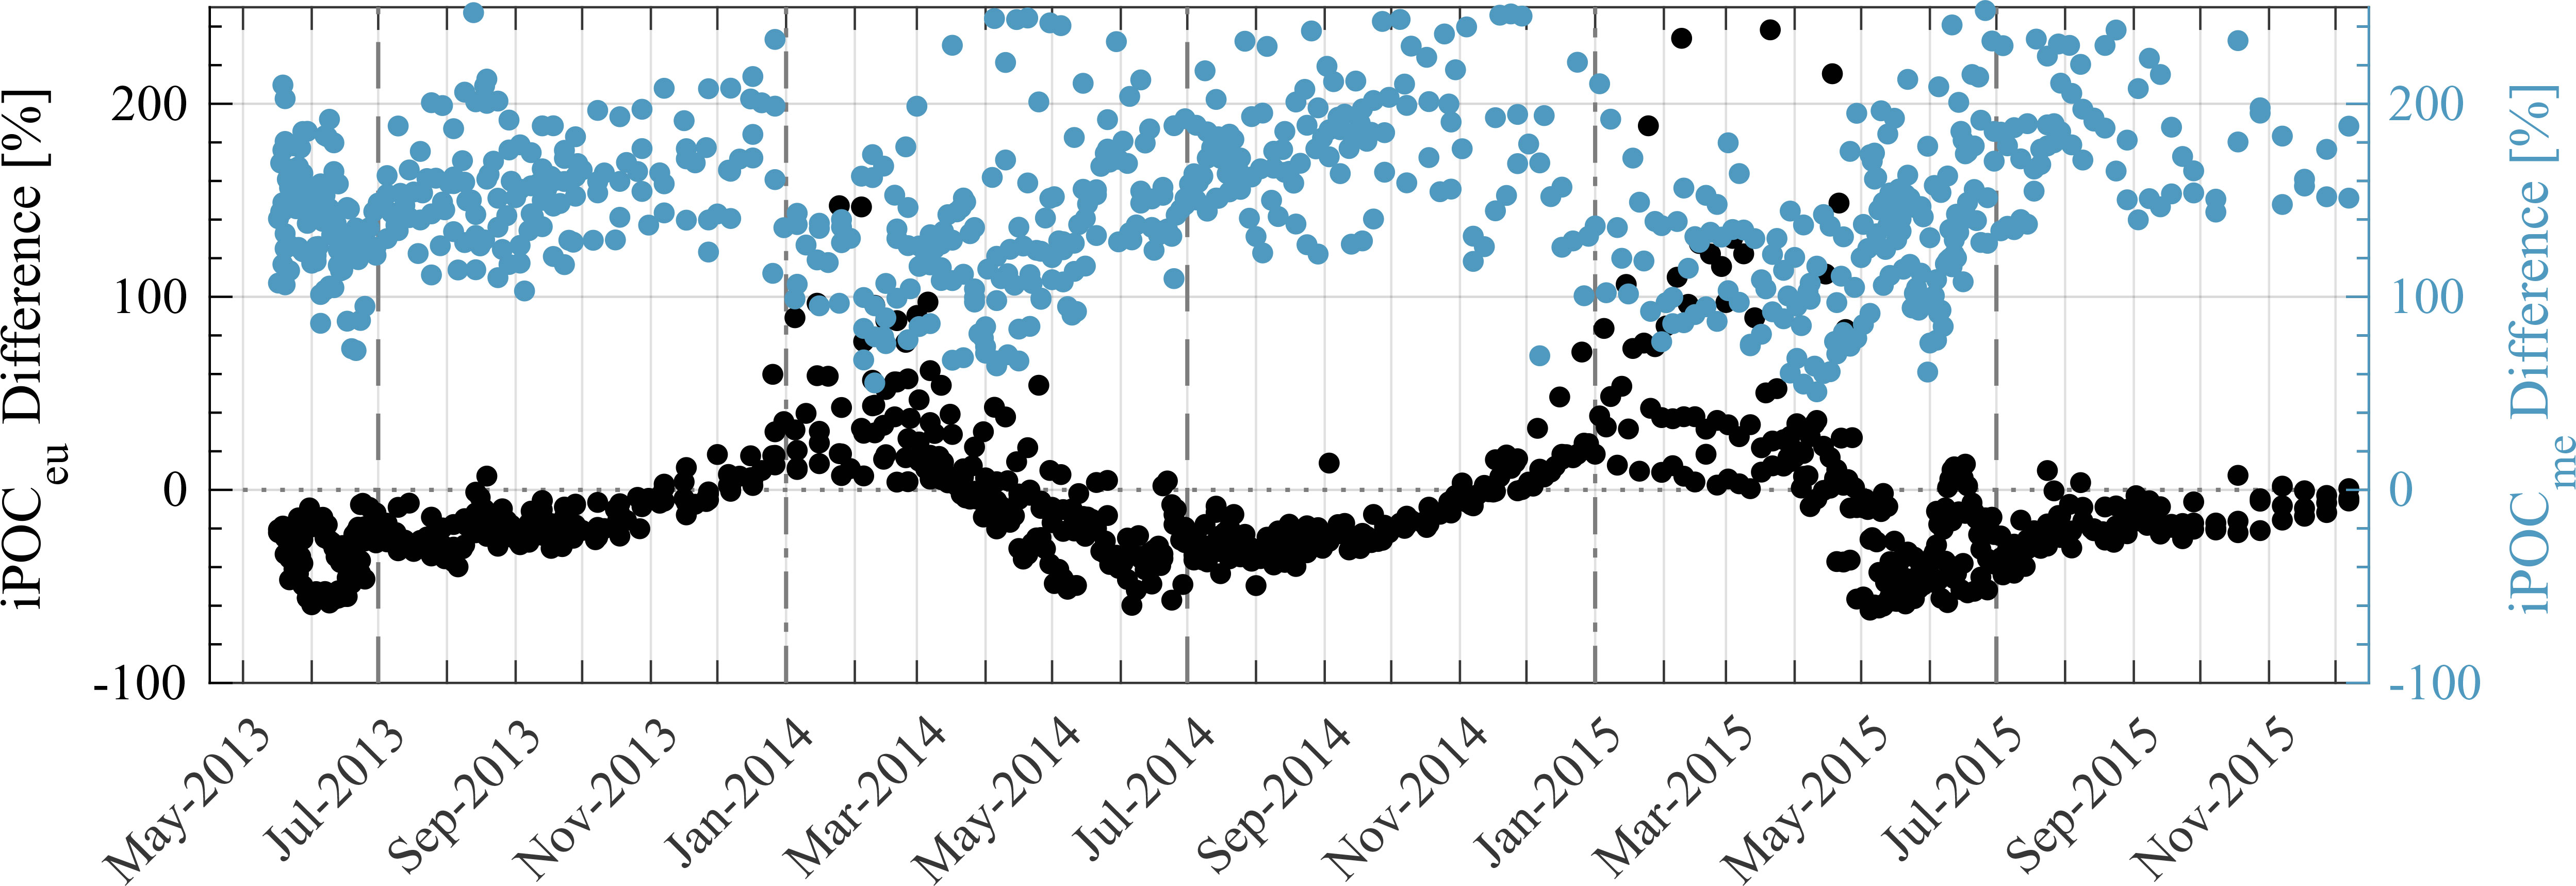
Figure 10 Percent difference between Model A and Model B estimates of iPOCeu and iPOCme from all float profiles described in Figure 7. For example, iPOCeu percent difference (black) is determined as , where superscript “A” or “B” denotes which regression model was used. Note, data is not differentiated by individual float.
In the current study, a significant portion of iPOC is associated with mesopelagic zone (e.g., nearly 60% of profiles contain iPOCme/iPOC values which are 0.4–0.6 and about 40% of profiles contain iPOCme/iPOC values greater than 0.5); therefore, it is important to compare current estimates with previously reported values in the mesopelagic zone. POC determined with large volume in situ filtration pumps at depths of around 800 m were about 1.2 mg m-3 and 3.0 mg m-3 in the oligotrophic Pacific Ocean waters near Hawaii and productive waters near the Oyashio Current, respectively (Bishop and Wood, 2008). It is recognized, however, that these types of POC measurements based on large volume in situ filtrations can be 5 to 200 times lower than measurements using smaller diameter filters with discrete water samples retrieved using Niskin bottles which are utilized in the current study (e.g., Gardner et al., 2003). Recent efforts to investigate uncertainty in mesopelagic POC measurements using data from the Atlantic meridional transects found that POC within the mesopelagic zone was 7 ± 3 mg m-3 (Sandoval et al., 2021). These values are generally consistent with the range of values established in the current study, which are about 9 ± 4 mg m-3 (mean ± 1 standard deviation) considering all measurements from depths greater than 500 m while minimum values of POC from each profile are approximately 6 ± 3 mg m-3. In conclusion and considering differences in methodological approaches for determining POC, optically-based estimates of POC at mesopelagic depths using Model B are consistent with previously published measurements based on filtration of seawater.
Concluding Remarks
Light scattering by natural assemblages of marine particles is a complicated phenomenon which depends on properties such as particle concentration, size distribution, and composition. The interplay of these effects can produce scattering results which can make the inversion problem, i.e., inferring particulate properties such as POC from scattering measurements, especially challenging. By accounting for particle concentration and composition in a multivariable algorithm for estimating POC from measurements of bbp and Chla, uncertainty of POC estimates were reduced compared with a univariate algorithm based only on bbp (e.g., from about 47% to 28% in terms of MdSA) when analyzing a large database of contrasting surface and subsurface natural seawater samples encompassing both coastal and offshore waters from major oceanic basins. The multivariable algorithm (referred to as Model B in the present study) is particularly useful for highly contrasting samples in terms of abundance of phytoplankton versus all types of particles contributing to backscattering. For example, percent differences between model-derived and observed POC of two compositionally-contrasting samples with similar POC are –7% and –10% for the multivariable algorithm while a univariate algorithm results in percent differences of –60% and 130%.
Considering the potential application of this multivariable approach to BGC-Argo floats which profile through the water column down to depths of 1 km, the model has been specially formulated for use with backscattering and chlorophyll-a fluorescence sensors often available on these floats. Studies utilizing BGC-Argo data are becoming increasingly more common (e.g., Dall’Olmo and Mork, 2014; Poteau et al., 2017; Johnson et al., 2017; Bellacicco et al., 2019; Briggs et al., 2020; Wang et al., 2020), but algorithms to estimate POC from BGC-Argo floats have been relatively simple univariate algorithms based on particulate backscattering coefficient alone. More advanced approaches which incorporate vertical variability in the relationship between bbp and POC have been utilized for studying POC distributions with BGC-Argo; however, these approaches still appear limited in terms of reliance on univariate algorithms based on bbp and restricted regional or seasonal applicability (Bol et al., 2018; Galí et al., 2022). In the present study we show that these types of simple algorithms are inadequate for a database of contrasting samples collected across diverse oceanic environments.
Improvements are unequivocable when using a multivariable POC algorithm owing to inclusion of a particle composition proxy as an additional predictor variable. Hence, it is recommended that such improved algorithms, such as the multivariable Model B presented in this study, are used for application with measurements taken across diverse environments characterized by variable particle assemblages resulting from temporal (e.g., seasonal or diel) or spatial (e.g., vertical or horizontal) variability. We expect, for example, this new multivariable regression model can be useful for large-scale biogeochemical modeling studies aimed at understanding and constraining the global biological carbon pump. As a demonstration, the multivariable regression model was applied to BGC-Argo data from the Labrador Sea region. It was found that sustained increases of POC in the euphotic zone throughout summer are not observed in the immediate depths below the euphotic zone, a peculiar pulse of POC in the mesopelagic around March 2014 precedes increases in the epipelagic in late spring, and mesopelagic-integrated POC is typically over 50% of total POC integrated within the top 1000 m of the water column. We also demonstrated that estimates of POC from the univariate backscattering-based regression model and the multivariable regression model applied to BGC-Argo float measurements show large differences. Based on the comparison of performance of univariate and multivariable models using an independent validation dataset containing data from various oceanic environments (Figure 6), we expect that the comparisons of POC retrievals from the BGC-Argo floats deployed in the Labrador Sea region are also affected by higher uncertainties in univariate model retrievals compared to multivariable model retrievals.
The particle composition proxy used in the present study combines the Chla and bbp variables, which has been constrained by the current state of available measurements of chlorophyll-a fluorescence and backscattering on typical underwater autonomous platforms. Although the use of this composition proxy was found to provide significant improvements in model estimations of POC, the advent of new in situ optical sensors specifically aimed at advancing the characterization of composition and size distribution of natural particle assemblages is encouraged. One potential avenue for such advancements is supported by recent experimental efforts demonstrating that relatively simple measurements of polarized light scattering at a single wavelength and just a couple of scattering angles can substantially aid in the characterization of particle size distribution and composition, with particularly useful relationships for assessing particle composition across contrasting marine environments (Koestner et al., 2020; Koestner et al., 2021). Recent successes with miniaturized underwater active camera systems (Picheral et al., 2022), hyperspectral radiometers (Organelli et al., 2021), and beam transmission sensors (Terrats et al., 2020) have shown that further advancements of sensor payloads on autonomous platforms are possible and can greatly expand usefulness of autonomous observations of the subsurface ocean.
Data Availability Statement
The raw data supporting the conclusions of this article will be made available by the authors, without undue reservation.
Author Contributions
All authors conceptualized the study with DK performing the bulk of the algorithm development and validation, and application to BGC-Argo data. RR contributed significantly to the processing, quality control, and organization of the algorithm development and validation datasets. DK wrote the first draft of the manuscript. All authors contributed to manuscript revision and approved the submitted version.
Funding
This study was supported by the U.S. National Aeronautics and Space Administration (Grants 80NSSC18K0956 and NNX17AI72G).
Conflict of Interest
The authors declare that the research was conducted in the absence of any commercial or financial relationships that could be construed as a potential conflict of interest.
Publisher’s Note
All claims expressed in this article are solely those of the authors and do not necessarily represent those of their affiliated organizations, or those of the publisher, the editors and the reviewers. Any product that may be evaluated in this article, or claim that may be made by its manufacturer, is not guaranteed or endorsed by the publisher.
Acknowledgments
This study was initiated when the first author (DK) was with the Scripps Institution of Oceanography, University of California San Diego. Most of this research was performed while DK held an NRC Research Associateship award at the Naval Research Laboratory in Washington D.C. POC analysis of seawater samples was done at the Marine Science Institute, University of California Santa Barbara. Thanks to all science crew and ship operators who facilitated data collection for algorithm development and validation as well as deployment of BGC-Argo floats in Labrador Sea. We also express our gratitude to M. Barbieux, E. Organelli, and H. Claustre for leading efforts in BGC-Argo data processing and organization. Special thanks to A. El-Habashi for fruitful discussions regarding algorithm development and S. Ackleson for aid with interpreting BGC-Argo results. We thank two reviewers for their constructive comments.
References
Allison D. B., Stramski D., Mitchell B. G. (2010). Empirical Ocean Color Algorithms for Estimating Particulate Organic Carbon in the Southern Ocean. J. Geophys. Res. 115, C10044. doi: 10.1029/2009JC006040
Balch W. M., Bowler B. C., Drapeau D. T., Poulton A. J., Holligan P. M. (2010). Biominerals and the Vertical Flux of Particulate Organic Carbon From the Surface Ocean. Geophys. Res. Lett. 37, L22605. doi: 10.1029/2010GL044640
Barbieux M., Organelli E., Claustre H., Schmechtig C., Poteau A., Boss E., et al. (2017). A Global Database of Vertical Profiles Derived From Biogeochemical Argo Float Measurements for Biogeochemical and Bio-Optical Applications. SEANOE. doi: 10.17882/49388
Barbieux M., Uitz J., Bricaud A., Organelli E., Poteau A., Schmechtig, et al (2018). Assessing the Variability in the Relationship Between the Particulate Backscattering Coefficient and the Chlorophyll a Concentration From a Global Biogeochemical-Argo Database. J. Geophys. Res. 123, 1229–1250. doi: 10.1002/2017JC013030
Barnard A. (2021). Correction of Scale Factors for Backscattering Channel on ECO Sensors Mounted on BGC-Argo Floats. SEANOE. doi: 10.17882/54520
Bellacicco M., Cornec M., Organelli E., Brewin R. J. W., Neukermans G., Volpe G., et al. (2019). Global Variability of Optical Backscattering by non-Algal Particles From a Biogeochemical-Argo Data Set. Geophys. Res. Lett. 46, 9767–9776. doi: 10.1029/2019GL084078
Biogeochemical-Argo Planning Group (2016). The Scientific Rationale, Design and Implementation Plan for a Biogeochemical-Argo Float Array. Eds. Johnson K., Claustre H. doi: 10.13155/46601
Bishop J. K. B. (1999). Transmissometer Measurement of POC. Deep-Sea Res. I 46, 353–369. doi: 10.1016/S0967-0637(98)00069-7
Bishop J. K. B., Wood T. J. (2008). Particulate Matter Chemistry and Dynamics in the Twilight Zone at VERTIGO ALOHA and K2 Sites. Deep Sea Res. I 55, 1684–1706. doi: 10.1016/j.dsr.2008.07.012
Bohren C. F., Huffman D. R. (1983). Absorption and Scattering of Light by Small Particles (New York, NY: Wiley).
Bol R., Henson S. A., Rumyantseva A., Briggs N. (2018). High-Frequency Variability of Small-Particle Carbon Export Flux in the Northeast Atlantic. Glob. Biogeochem. Cycles 32, 1803–1814. doi: 10.1029/2018GB005963
Boss E., Pegau W. S., Lee M., Twardowski M., Shybanov E., Korotaev G., et al. (2004). Particulate Backscattering Ratio at LEO 15 and its Use to Study Particle Composition and Distribution. J. Geophys. Res. 109, C01014. doi: 10.1029/2002JC001514
Boss E., Taylor L., Gilbert S., Gundersen K., Hawley N., Janzen C., et al. (2009). Comparison of Inherent Optical Properties as a Surrogate for Particulate Matter Concentration in Coastal Waters. Limnol. Oceanogr. Meth. 7, 803–810. doi: 10.4319/lom.2009.7.803
Boyd P. W., Trull T. W. (2007). Understanding the Export of Biogenic Particles in Oceanic Waters: Is There Consensus? Prog. Oceanogr. 72, 276–312. doi: 10.1016/j.pocean.2006.10.007
Brewin R. J. W., Sathyendranath S., Platt T., Bouman H., Ciavatta S., Dall’Olmo G., et al. (2021). Sensing the Ocean Biological Carbon Pump From Space: A Review of Capabilities, Concepts, Research Gaps and Future Developments. Earth Sci. Rev. 217, 103604. doi: 10.1016/j.earscirev.2021.103604
Bricaud A., Morel A. (1986). Light Attenuation and Scattering by Phytoplanktonic Cells: A Theoretical Modeling. Appl. Opt. 25, 571–580. doi: 10.1364/AO.25.000571
Briggs N., Dall’Olmo G., Claustre H. (2020). Major Role of Particle Fragmentation in Regulating Biological Sequestration of CO2 by the Oceans. Science 367, 791–793. doi: 10.1126/science.aay1790
Buesseler K. O., Boyd P. W., Black E. E., Siegel D. A. (2020). Metrics That Matter for Assessing the Ocean Biological Carbon Pump. Proc. Natl. Acad. Sci. U.S.A. 117 (18), 9679–9687. doi: 10.1073/pnas.1918114117
Cetinić I., Perry M. J., Briggs N. T., Kallin E., D’Asaro E. A., Lee C. M. (2012). Particulate Organic Carbon and Inherent Optical Properties During 2008 North Atlantic Bloom Experiment. J. Geophys. Res. 117, C06028. doi: 10.1029/2011JC007771
Cetinić I., Perry M. J., D’Asaro E., Briggs N., Poulton N., Sieracki M. E., et al. (2015). A Simple Optical Index Shows Spatial and Temporal Heterogeneity in Phytoplankton Community Composition During the 2008 North Atlantic Bloom Experiment. Biogeosciences 12, 2179–2194. doi: 10.5194/bg-12-2179-2015
Claustre H., Johnson K. S., Takeshita Y. (2020). Observing the Global Ocean With Biogeochemical-Argo. Annu. Rev. Mar. Sci. 12, 23–48. doi: 10.1146/annurev-marine-010419-010956
Dall’Olmo G., Mork K. J. (2014). Carbon Export by Small Particles in the Norwegian Sea. Geophys. Res. Lett. 41, 2921–2927. doi: 10.1002/2014GL059244
DeVries T., Weber T. (2017). The Export and Fate of Organic Matter in the Ocean: New Constraints From Combining Satellite and Oceanographic Tracer Observations. Glob. Biogeochem. Cycles 31 (3), 535–555. doi: 10.1002/2016gb005551
Downing J. P., Sternberg R. W., Lister C. R. B. (1981). New Instrumentation for the Investigation of Sediment Suspension Processes in the Shallow Marine Environment. Mar. Geol. 42, 19–34. doi: 10.1016/0025-3227(81)90156-0
Erickson Z. K., Cetinić I., Zhang X., Boss E., Werdell P. J., Freeman S., et al. (2022). Alignment of Optical Backscatter Measurements From the EXPORTS Northeast Pacific Field Deployment. Elem. Sci. Anth. 10, 1. doi: 10.1525/elementa.2021.00021
Frey K. E., Comiso J. C., Cooper L. W., Gradinger R. R., Grebmeier J. M., Tremblay J.-É. (2015). “Arctic Ocean Primary Productivity,” in Arctic Report Card 2015. Eds. Jeffries M. O., Richter-Menge J., Overland J. E. doi: 10.25923/8h3d-5v51
Friedlingstein P., Jonest M. W., O’Sullivan M., Andrew R. M., Bakker D. C. E., Hauck J., et al. (2022). Global Carbon Budget 2021. Earth Syst. Sci. Data 14, 1917–2005. doi: 10.5194/essd-14-1917-2022
Galí M., Falls M., Claustre H., Aumont O., Bernardello R. (2022). Bridging the Gaps Between Particulate Backscattering Measurements and Modeled Particulate Organic Carbon in the Ocean. Biogeosciences 19, 1245–1275. doi: 10.5194/bg-19-1245-2022
Gardner W. D., Mishonov A. V., Richardson M. J. (2006). Global POC Concentrations From in-Situ and Satellite Data. Deep Sea Res. II 53, 718–740. doi: 10.1016/j.dsr2.2006.01.029
Gardner W. D., Richardson M. J., Carlson C. A., Hansell D., Mishonov A. V. (2003). Determining True Particulate Organic Carbon: Bottles, Pumps and Methodologies. Deep Sea Res. II 50, 655–674. doi: 10.1016/s0967-0645(02)00589-1
Head E. J. H., Harris L. R., Yashayaev I. (2003). Distributions of Calanus Spp. And Other Mesozooplankton in the Labrador Sea in Relation to Hydrography in Spring and Summer, (1995–2000). Prog. Oceanogr. 59, 1–30. doi: 10.1016/S0079-6611(03)00111-3
Holte J., Talley L. (2009). A New Algorithm for Finding Mixed Layer Depths With Applications to Argo Data and Subantarctic Mode Water Formation. J. Atmos. Ocean. Technol. 26, 1920–1939. doi: 10.1175/2009JTECHO543.1
Intergovernmental Oceanographic Commission (1994). “Protocols for the Joint Global Ocean Flux Study (JGOFS) Core Measurements,” in Intergovernmental Oceanographic Commission, Scientific Committee on Oceanic Research, Manuals and Guides No. 29 (Paris: UNESCO-IOC), 170 pp.
IOCCG Protocol Series (2018). “Inherent Optical Property Measurements and Protocols: Absorption Coefficient,” in IOCCG Ocean Optics and Biogeochemistry Protocols for Satellite Ocean Colour Sensor Validation, vol. Volume 1.0 . Eds. Neeley A. R., Mannino A. (NS, Canada: IOCCG, Dartmouth).
IOCCG Protocol Series (2021). “Particulate Organic Matter Sampling and Measurement Protocols: Consensus Towards Future Ocean Color Missions,” in IOCCG Ocean Optics and Biogeochemistry Protocols for Satellite Ocean Colour Sensor Validation, vol. Volume 6.0. (NS, Canada: IOCCG, Dartmouth). Chaves, J. E., Cetinić, I., Dall’Olmo, G., Estapa, M., Gardner, W., Goñi, M., Graff, J. R., Hernes, P., Lam, P. J., Liu, Z., Lomas, M. W., Mannino, M., Novak, M. G., Turnewitsch, R., Werdell, P. J., Westberry, T. K.
Johnson K. S., Plant J. N., Coletti L. J., Jannasch H. W., Sakamoto C. M., Riser S. C., et al. (2017). Biogeochemical Sensor Performance in the SOCCOM Profiling Float Array. J. Geophys. Res. 122, 6416–6436. doi: 10.1002/2017jc012838
Jonasz M., Fournier G. (2007). Light Scattering by Particles in Water: Theoretical and Experimental Foundations (Cambridge, MA: Elsevier).
Kharbush J. J., Van Mooy B. A., Close H. G., Arnosti C., Smittenberg R. H., Le Moigne F. A. C., et al. (2020). Particulate Organic Carbon Deconstructed: Molecular and Chemical Composition of Particulate Organic Carbon in the Ocean. Front. Mar. Sci. 7. doi: 10.3389/fmars.2020.00518
Koestner D., Stramski D., Reynolds R. A. (2020). Polarized Light Scattering Measurements as a Means to Characterize Particle Size and Composition of Natural Assemblages of Marine Particles. Appl. Opt. 59, 8314–8334. doi: 10.1364/AO.396709
Koestner D., Stramski D., Reynolds R. A. (2021). Characterization of Suspended Particulate Matter in Contrasting Coastal Marine Environments With Angle-Resolved Polarized Light Scattering Measurements. Appl. Opt. 60, 11161–11179. doi: 10.1364/AO.441226
Lacour L., Claustre H., Prieur L., D’Ortenzio F. (2015). Phytoplankton Biomass Cycles in the North Atlantic Subpolar Gyre: A Similar Mechanism for Two Different Blooms in the Labrador Sea. Geophys. Res. Lett. 42, 5403–5410. doi: 10.1002/2015GL064540
Legendre L., Michaud J. (1999). Chlorophyll a to Estimate the Particulate Organic Carbon Available as Food to Large Zooplankton in the Euphotic Zone of Oceans. J. Plankton Res. 21, 2067–2083. doi: 10.1093/plankt/21.11.2067
Llort J., Langlais C., Matear R., Moreau S., Lenton A., Strutton P. G. (2018). Evaluating Southern Ocean Carbon Eddy-Pump From Biogeochemical-Argo Floats. J. Geophys. Res. 123, 971–984. doi: 10.1002/2017JC012861
Loisel H., Bosc E., Stramski D., Oubelkheir K., Deschamps P.-Y. (2001). Seasonal Variability of the Backscattering Coefficient in the Mediterranean Sea Based on Satellite SeaWiFS Imagery. Geophys. Res. Lett. 28, 4203–4206. doi: 10.1029/2001GL013863
Middelburg J. J. (2019). Marine Carbon Biogeochemistry: A Primer for Earth System Scientists (Berlin, Germany: Springer Nature).
Morel A., Bricaud A. (1981). Theoretical Results Concerning Light Absorption in a Discrete Medium, and Application to Specific Absorption of Phytoplankton. Deep Sea Res. 28A, 1375–1393. doi: 10.1016/0198-0149(81)90039-X
Neukermans G., Loisel H., Meriaux X., Astoreca R., McKee D. (2012). In Situ Variability of Mass-Specific Beam Attenuation and Backscattering of Marine Particles With Respect to Particle Size, Density, and Composition. Limnol. Oceanogr. 57, 124–144. doi: 10.4319/lo.2012.57.1.0124
Ohmand M. M., D’Asaro E. A., Lee C. M., Perry M. J., Briggs N., Cetinić I., et al. (2015). Eddy-Driven Subduction Exports Particulate Organic Carbon From the Spring Bloom. Science 348, 222–225. doi: 10.1126/science.1260062
Organelli E., Barbieux M., Claustre H., Schmechtig C., Poteau A., Bricaud A., et al. (2017). Two Databases Derived From BGC-Argo Float Measurements for Marine Biogeochemical and Bio-Optical Applications. Earth Syst. Sci. Data 9, 861–880. doi: 10.5194/essd-9-861-2017
Organelli E., Dall’Olmo G., Brewin R. J. W., Tarran G. A., Boss E., Bricaud A. (2018). The Open-Ocean Missing Backscattering is in the Structural Complexity of Particles. Nat. Commun. 9, 5439. doi: 10.1038/s41467-018-07814-6
Organelli E., Leymarie E., Zielinski O., Uitz J., D’Ortenzio F., Claustre H. (2021). “Hyperspectral Radiometry on Biogeochemical-Argo Floats: A Bright Perspective for Phytoplankton Diversity,” in Frontiers in Ocean Observing: Documenting Ecosystems, Understanding Environmental Changes, Forecasting Hazards, vol. 34 . Eds. Kappel E. S., Juniper S. K., Seeyave S., Smith E., Visbeck M., 90–91. A Supplement to Oceanography. doi: 10.5670/oceanog.2021.supplement.02-33
Parsons T. R., Maita Y., Lalli C. M. (1984). A Manual of Chemical and Biological Methods for Seawater Analysis (Oxford, England: Pergamon Press).
Picheral M., Catalano C., Brousseau D., Claustre H., Coppola L., Leymarie E., et al. (2022). The Underwater Vision Profiler 6: An Imaging Sensor of Particle Size Spectra and Plankton, for Autonomous and Cabled Platforms. Limnol. Oceanogr. Meth. 20, 115–129. doi: 10.1002/lom3.10475
Poteau A., Boss E., Claustre H. (2017). Particulate Concentration and Seasonal Dynamics in the Mesopelagic Ocean Based on the Backscattering Coefficient Measured With Biogeochemical-Argo Floats. Geophys. Res. Lett. 44, 6933–6939. doi: 10.1002/2017GL073949
Quirantes A., Bernard S. (2004). Light Scattering by Marine Algae: Two-Layer Spherical and Nonspherical Models. J. Quant. Spectrosc. Radiat. Transf. 89, 311–321. doi: 10.1016/j.jqsrt.2004.05.031
Rasse R., Dall’Olmo G., Graff J., Westberry T. K., van Dongen-Vogels V., Behrenfeld M. J. (2017). Evaluating Optical Proxies of Particulate Organic Carbon Across the Surface Atlantic Ocean. Front. Mar. Sci. 4. doi: 10.3389/fmars.2017.00367
Reynolds R. A., Stramski D., Mitchell B. G. (2001). A Chlorophyll-Dependent Semianalytical Reflectance Model Derived From Field Measurements of Absorption and Backscattering Coefficients Within the Southern Ocean. J. Geophys. Res. 106 (C4), 7125–7138. doi: 10.1029/1999JC000311
Reynolds R. A., Stramski D., Neukermans G. (2016). Optical Backscattering by Particles in Arctic Seawater and Relationships to Particle Mass Concentration, Size Distribution, and Bulk Composition. Limnol. Oceanogr. 61, 1869–1890. doi: 10.1002/lno.10341
Ricker W. E. (1973). Linear Regressions in Fishery Research. J. Fish. Res. Board Can. 30, 409–434. doi: 10.1139/f73-072
Roesler C., Uitz J., Claustre H., Boss E., Xing X., Organelli E., et al. (2017). Recommendations for Obtaining Unbiased Chlorophyll Estimates From in Situ Chlorophyll Fluorometers: A Global Analysis of WET Labs ECO Sensors. Limnol. Oceanogr. 15, 572–585. doi: 10.1002/lom3.10185
Sandoval P. S., Dall’Olmo G., Haines K., Rasse R., Ross J. (2021). Uncertainties of Particulate Organic Carbon Concentrations in the Mesopelagic Zone of the Atlantic Ocean. Open Res. Europe 1, 43. doi: 10.12688/openreseurope.13395.2
Sathyendranath S., Stuart V., Nair A., Oka K., Nakane T., Bouman H., et al. (2009). Carbon-To-Chlorophyll Ratio and Growth Rate of Phytoplankton in the Sea. Mar. Ecol. Prog. Ser. 383, 73–84. doi: 10.3354/meps07998
Siegel D. A., Buesseler K. O., Behrenfeld M. J., Benitez-Nelson C. R., Boss E., Brzezinski M. A., et al. (2016). Prediction of the Export and Fate of Global Ocean Net Primary Production: The EXPORTS Science Plan. Front. Mar. Sci. 3. doi: 10.3389/fmars.2016.00022
Siegel D. A., Buesseler K. O., Doney S. C., Sailley S. F., Behrenfeld M. J., Boyd P.W. (2014). Global Assessment of Ocean Carbon Export by Combining Satellite Observations and Food-Web Models.Glob. Biogeochem. Cycles 28, 181–196. doi: 10.1002/2013GB004743
Sokal R. R., Rohlf F. J. (1995). Biometry: The Principles and Practice of Statistics in Biological Research. 3rd ed (New York, NY: W. H. Freeman).
Stramska M., Stramski D. (2005). Variability of Particulate Organic Carbon Concentration in the North Polar Atlantic Based on Ocean Color Observations With Sea-Viewing Wide Field-Of-View Sensor (SeaWiFS). J. Geophys. Res. 110, C10018. doi: 10.1029/2004JC002762
Stramski D., Boss E., Bogucki D., Voss K. J. (2004). The Role of Seawater Constituents in Light Backscattering in the Ocean. Prog. Oceanogr. 61, 27–56. doi: 10.1016/j.pocean.2004.07.001
Stramski D., Bricaud A., Morel A. (2001). Modeling the Inherent Optical Properties of the Ocean Based on the Detailed Composition of the Planktonic Community. Appl. Opt. 40, 2929–2945. doi: 10.1364/AO.40.002929
Stramski D., Joshi I., Reynolds R. A. (2022). Ocean Color Algorithms to Estimate the Concentration of Particulate Organic Carbon in Surface Waters of the Global Ocean in Support of a Long-Term Data Record From Multiple Satellite Missions. Remote Sens. Environ. 269, 112776. doi: 10.1016/j.rse.2021.112776
Stramski D., Reynolds R. A., Babin M., Kaczmarek S., Lewis M. R., Röttgers R., et al. (2008). Relationships Between the Surface Concentration of Particulate Organic Carbon and Optical Properties in the Eastern South Pacific and Eastern Atlantic Oceans. Biogeosciences 5, 171–201. doi: 10.5194/bg-5-171-2008
Stramski D., Reynolds R. A., Kaczmarek S., Uitz J., Zheng G. (2015). Correction of Pathlength Amplification in the Filter-Pad Technique for Measurements of Particulate Absorption Coefficient in the Visible Spectral Region. Appl. Opt. 54, 6763–6782. doi: 10.1364/AO.54.006763
Stramski D., Reynolds R. A., Kahru M., Mitchell B. G. (1999). Estimation of Particulate Organic Carbon in the Ocean From Satellite Remote Sensing. Science 285, 239–242. doi: 10.1126/science.285.5425.23
Terrats L., Claustre H., Cornec M., Mangin A., Neukermans G. (2020). Detection of Coccolithophore Blooms With BioGeoChemical-Argo Floats. Geophys. Res. Lett. 47, e2020GL090559. doi: 10.1029/2020GL090559
Twardowski M. S., Boss E., Macdonald J. B., Pegau W. S., Barnard A. H., Zaneveld J. R. V. (2001). A model for estimating bulk refractive index from theoptical backscattering ratio and the implications for understanding particle composition incase I and case II waters. J. Geophys. Res. 106, 14129–14142. doi: 10.1029/2000JC000404
van der Linde D. W. (1998). Protocol for the determination of total suspended matter in oceans and coastal zones. Technical Note I.98.182. Joint Research Centre.
Wang B., Fennel K., Yu L., Gordon C. (2020). Assessing the Value of Biogeochemical Argo Profiles Versus Ocean Color Observations for Biogeochemical Model Optimization in the Gulf of Mexico. Biogeosciences 17, 4059–4074. doi: 10.5194/bg-17-4059-2020
Wu J., Lee Z., Xie Y., Goes J., Shang S., Marra J. F., et al. (2021). Reconciling Between Optical and Biological Determinants of the Euphotic Zone Depth. J. Geophys. Res. 126, e2020JC016874. doi: 10.1029/2020JC016874
Keywords: marine optics, particulate organic carbon, inherent optical properties, backscattering coefficient, chlorophyll-a fluorescence, biogeochemical-argo observations, bio-optical algorithms
Citation: Koestner D, Stramski D and Reynolds RA (2022) A Multivariable Empirical Algorithm for Estimating Particulate Organic Carbon Concentration in Marine Environments From Optical Backscattering and Chlorophyll-a Measurements. Front. Mar. Sci. 9:941950. doi: 10.3389/fmars.2022.941950
Received: 12 May 2022; Accepted: 08 June 2022;
Published: 12 August 2022.
Edited by:
Takafumi Hirata, Hokkaido University, JapanReviewed by:
Emanuele Organelli, National Research Council (CNR), ItalyGriet Neukermans, Ghent University, Belgium
Copyright © 2022 Koestner, Stramski and Reynolds. This is an open-access article distributed under the terms of the Creative Commons Attribution License (CC BY). The use, distribution or reproduction in other forums is permitted, provided the original author(s) and the copyright owner(s) are credited and that the original publication in this journal is cited, in accordance with accepted academic practice. No use, distribution or reproduction is permitted which does not comply with these terms.
*Correspondence: Daniel Koestner, daniel.koestner.optics@gmail.com