Transcriptomic analysis reveals yolk accumulation mechanism from the hepatopancreas to ovary in the pacific white shrimp Litopenaeus vannamei
 Zhi Li1† Minyu Zhou1†
  Yao Ruan2 Xiaoli Chen3 Chunhua Ren2 Hao Yang4
  Xin Zhang2 Jinshang Liu5 Huo Li5 Lvping Zhang2 Chaoqun Hu2
  Ting Chen2*
  Xugan Wu1*
- 1Key Laboratory of Exploration and Utilization of Aquatic Genetic Resources, College of Fisheries and Life Science, Shanghai Ocean University, Shanghai, China
- 2Chinese Academy of Sciences Key Laboratory of Tropical Marine Bio-resources and Ecology (LMB), South China Sea Institute of Oceanology, Chinese Academy of Sciences, Guangzhou, China
- 3Guangdong Research Center on Reproductive Control and Breeding Technology of Indigenous Valuable Fish Species, Fisheries College, Guangdong Ocean University, Zhanjiang, China
- 4Laboratory of Zoological Systematics and Application of Hebei Province, College of Life Sciences, Hebei University, Baoding, China
- 5Jinyang Biotechnology Co. Ltd., Maoming, China
The Pacific white shrimp Litopenaeus vannamei is an economically important penaeid species worldwide. Under farming conditions, the full ovarian maturation of L. vannamei generally depends on the combination of artificial ablation of unilateral eyestalk and feeding high-quality natural diets, suggesting that nutrient accumulation is important to ovarian maturation. In this study, we aimed to investigate the gene expression related to nutritional accumulation in L. vannamei during ovarian development by transcriptomic analysis. A total of 52.45 Gb of high-quality transcriptome data were obtained from 8 samples from the hepatopancreas and ovaries from shrimp in gonadal developmental stages I-IV. A total of 23,149 expressed genes were detected, of which 19,852 were known genes and 3,297 were novel genes. Our study found that genes related to amino acid, carbohydrate and lipid metabolism were expressed at higher levels in the hepatopancreas than in the ovary. The genes for most lipoproteins and their receptors were predominantly expressed in the hepatopancreas, while vitellogenin receptor (VgR) was specifically expressed in the ovary. Moreover, two vitellogenin (Vg) genes were identified, in which one was specifically expressed in the hepatopancreas and defined as Hp-Vg, and the other was specifically expressed in the ovary and defined as Ov-Vg. In addition, genes related to carotenoid metabolism were enriched in the hepatopancreas. This study provides solid evidence that the hepatopancreas is the major exogenous vitellogenesis site for ovarian maturation of L. vannamei. Two distinct Vg genes perform exogenous and endogenous vitellogenesis in the hepatopancreas and ovary in L. vannamei, respectively. The results of this study also presented some new insights for understanding the nutritional dynamics from the hepatopancreas to ovary during ovarian maturation in penaeids.
Introduction
The Pacific white shrimp Litopenaeus vannamei (Crustacea: Decapoda) is the most economically important shrimp worldwide. Under artificial conditions, however, domesticated L. vannamei generally cannot undergo full maturation without eyestalk ablation (Ceballos-Vázquez et al., 2010). After artificial ablation of unilateral eyestalk combined with feeding high-quality natural diets, female L. vannamei can undergo ovarian maturation quickly and spawn within 3-5 days post-eyestalk ablation (Nagaraju, 2011; Chen et al., 2018). Similar to other oviparous animals, the ovarian development of crustaceans is delicately divided into two processes, namely, oogenesis and vitellogenesis (Tsukimura, 2001). During vitellogenesis, the nutrients that mainly comprise proteins and lipids accumulate rapidly in oocytes (Wouters et al., 2001; Zmora et al., 2007) for the subsequent energy consumption of embryonic development (Heras et al., 2000). In shrimp, vitellin (Vn) is the major yolk protein component in mature oocytes, accounting for 60-90% of the total ovarian protein (Quackenbush, 2001). Structurally, Vn is a kind of apolipoprotein that binds to lipids to form lipoproteins (Avarre et al., 2007). Vn is encoded by its precursor gene vitellogenin (Vg) and is processed into mature protein by posttranslation proteolytic cleavage. In some shrimp species, the concentration of Vg could predict gonadal maturity status in adult females (Arcos et al., 2011).
Vitellogenesis is generally considered to be conducted in two ways, namely, endogenous and exogenous. The original sites for Vg production are distant in different oviparous animals: In birds (Tian et al., 2010) and fishes (Hiramatsu et al., 2015), Vg is synthesized in the liver; in insects, Vg is generated in the fat body (Tufail and Takeda, 2008); and in mollusks, Vg is consistently produced in the ovary (Ni et al., 2014). In crustaceans, the major sites for Vg production vary in different species, which have been reported from the hepatopancreas and ovaries (Mak et al., 2005; Jia et al., 2013). In some species of decapods, such as the mud crab Scylla paramamosain (Gong et al., 2015) and giant river prawn Macrobrachium rosenbergii, the ovary is only known as a site for Vg uptake and accumulation during ovarian development, synthesizing only small amounts of Vg (Tiu et al., 2006). In the ridgeback prawn Sicyonia ingentis, kuruma shrimp P. japonicus and swimming crab Callinectes sapidus (Zmora et al., 2009; Thongda et al., 2015), Vg synthesis occurs in both the hepatopancreas and ovaries. In L. vannamei, the expression of Vg mRNA was first detected in either the hepatopancreas or ovary (Tseng et al., 2002). The first L. vannamei Vg cDNA was identified from the ovary (Raviv et al., 2006), and a further study demonstrated that three Vg isoforms were differentially expressed in the hepatopancreas and ovary (Hoeger and Schenk, 2020). Thus, the regulation of Vg transcripts has also been investigated in the ovary (Tsutsui et al., 2013; Kang et al., 2014; Bae et al., 2017) and hepatopancreas (Chen et al., 2014; Luo et al., 2015).
In addition to yolk proteins, other nutrients, such as lipids and carotenoids, also accumulate in the ovaries during the gonadal development of shrimp (Chen et al., 2014; Luo et al., 2015). Carotenoids are considered to be essential nutrients for optimal nutritional requirements in shrimp feed (Lin et al., 2015). Naturally, carotenoids are produced by photosynthetic plants and bacteria, and like most animals, crustaceans do not have a capability to produce carotenoids de novo and have to acquire carotenoids by diet (Chen et al., 2014; Luo et al., 2015). The presence of various free and esterified forms of carotenoids, mainly astaxanthin (Axn) (Lee et al., 2010), was reported in all wild and cultured crustacean species. The esterification of Axn with specific fatty acids and the presence of carotenoid isoforms can greatly increase the complexity of their interactions with other biomolecules (Britton, 1995). Previous studies have shown that some crustaceans have a certain ability to convert β-carotene to Axn in some organs (Teruhisa et al., 1973; Wade et al., 2017). However, the conversion mechanism and tissue deposition of carotenoids remain unclear during the ovarian development cycle of L. vannamei.
To illustrate the nutritional dynamics from the hepatoscreas to ovaries and the nutrient deposition of the ovaries and hepatoscreas in the ovarian development cycle of crustaceans, we will use transcriptomes to analyze the expression of relevant genes, which will facilitate the improvement of artificial breeding and sustainable aquaculture of this economically valuable species.
Materials and methods
Animals and artificial induction of ovarian maturation
Female Pacific white shrimp (L. vannamei) were cultured at Jinyang Biotechnology Co. Ltd., Maoming, Guangdong, China. The shrimp were maintained in artificial seawater [pH 8.2 and 30 parts per thousand (ppt)] at 28°C and fed every morning with a normal shrimp diet. Female shrimp grown until body weights of 47.2±1.5 g and body lengths of 18.1±0.3 cm were used for analysis of ovarian development. At 7 days prior to artificially induced maturation, the shrimp were fed fresh clam worms, squid and oysters for nutritional reinforcement (Figure 1A). The animal experiments were conducted in accordance with the guidelines and approval of the Ethics Committees of South China Sea Institute of Oceanology, Chinese Academy of Sciences.
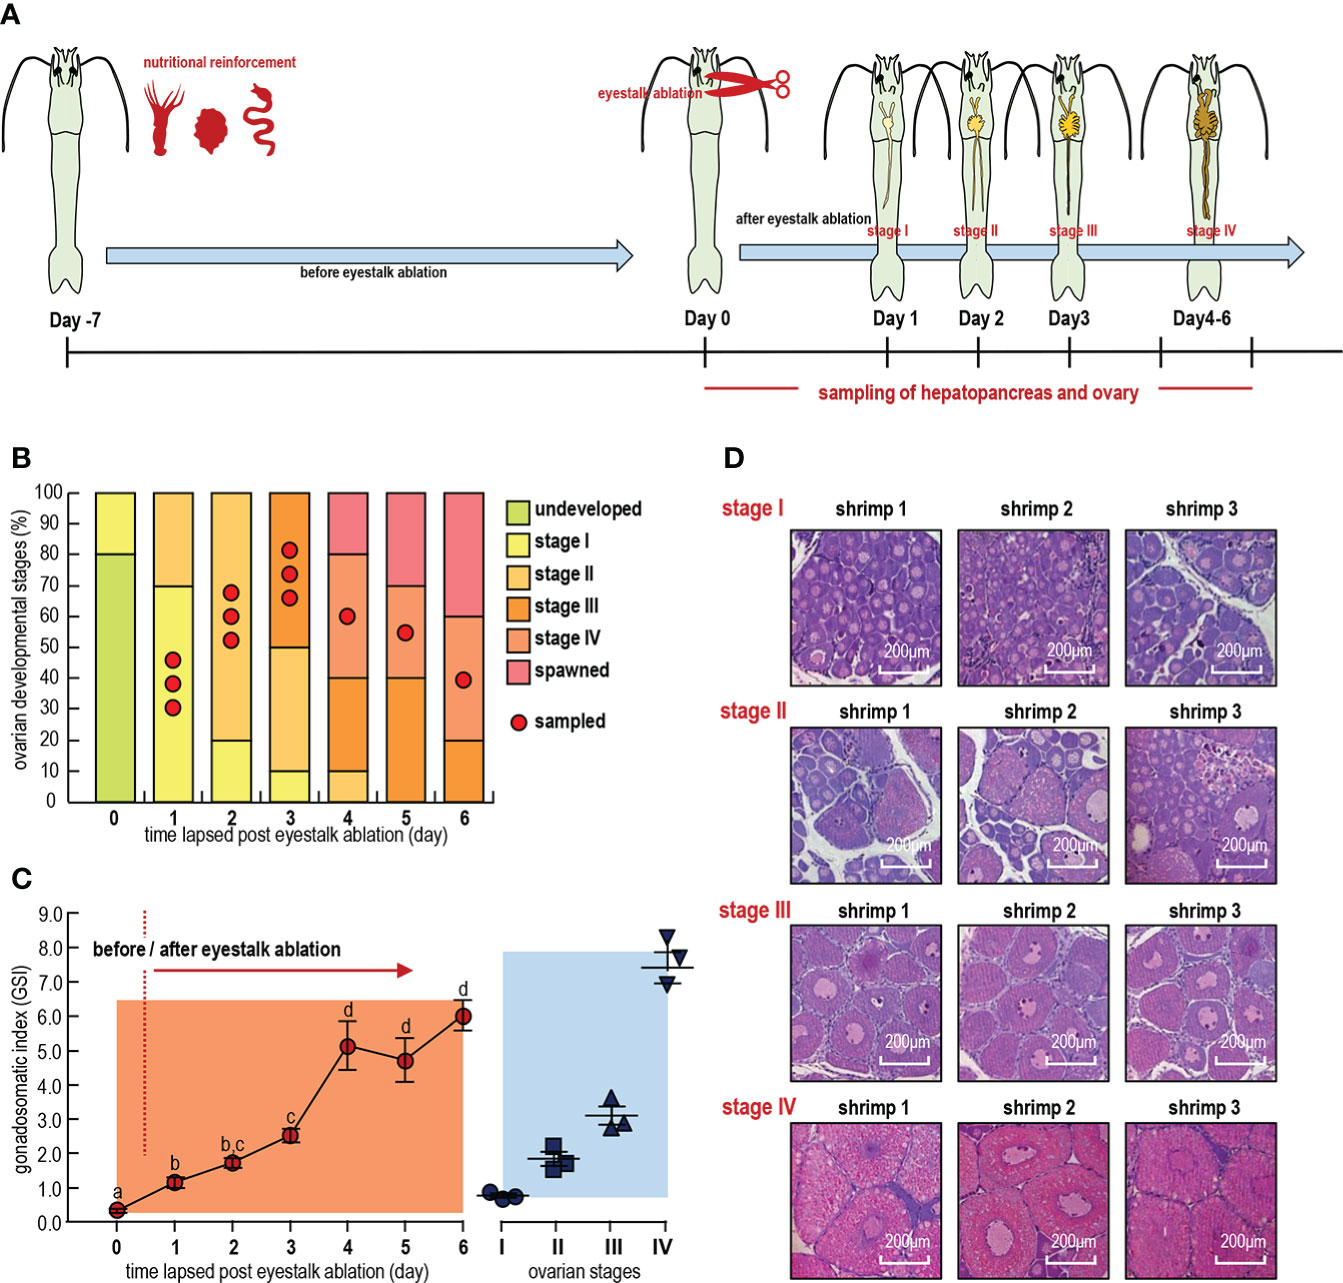
Figure 1 (A) Representative ovaries at different time points. (B) Distribution of samples over ovarian developmental stages. (C) Changes in gonadosomatic index (GSI) with days and ovarian developmental stages after eyestalk removal. Error bars represent standard derivations. Different letters indicate significant differences between time points of the same feed group (n = 3, mean ± sem, P < 0.05, ANOVA Duncan test). (D) HE staining of the ovaries and liver and pancreas. Stage: Four periods of ovarian development.
Sample collection and RNA extraction
Ovaries and hepatopancreas samples from female shrimp were collected from 1 to 6 days after unilateral eyestalk ablation for stages I, II, III and IV, respectively (Figure 1B). Ovarian maturation stages (stage I–IV) were assigned after histological processing of the anterior end of ovarian explants with the number 2–9 lobes (Liaaen-Jensen, 1997; Bae et al., 2017). Stage I ovaries are mainly comprised of oogonia and previtellogenic oocytes; stage II ovaries primarily comprise previtellogenic oocytes and endogenous vitellogenic oocytes; stage III ovaries process a large number of oocytes developing from endogenous vitellogenetic oocytes to exogenous vitellogenetic oocytes; and exogenous vitellogenic oocytes and mature oocytes predominate in stage IV ovaries (Figure 1D). The gonadosomatic index (GSI) of each shrimp was calculated as a percentage of ovary weight to body weight, and the GSIs for shrimp in stages I, II, III and IV were 0.5–1.0%, 1.0–2.5%, 2.5–5.0% and >5.0%, respectively (Figure 1C). All samples were frozen immediately in liquid nitrogen after dissection, and total RNA was extracted by using TRIzol Reagent (Invitrogen, Carlsbad, CA, USA).
Library construction and sequencing
The RNA integrity value (RIN) was checked by an Agilent 2100 Bianalyzer (Agilent, USA), and RNA-seq libraries were prepared following the standard Illumina protocols by the Beijing Genomics Institute (Beijing Genomics Institute, Beijing, China). In brief, mRNA equally contributed from 3 individuals was enriched by oligo-dT selection. Double-stranded cDNAs were synthesized using the fragmented mRNA as templates with random hexamer primers. The short fragments were connected with adapters, and suitable fragments were selected for PCR amplification. Then, the library was sequenced using an Illumina HiSeq 6000 (Illumina Inc., San Diego, CA, USA) in BGI.
Transcriptome assembly and annotation
The raw sequencing data were first filtered to remove the noise reads that contained additional low-quality, adaptor-polluted and high content of unknown base (N) reads by fastp software. Transcriptome assembly was performed based on the sequence of the L. vannamei genome (GenBank GCA_003789085.1) as a reference (Zhang et al., 2019). Clean data (reads) were compared with the reference genome using TopHat2 (http://tophat.cbcb.umd.edu/) to obtain the mapped data (reads) for subsequent analysis.
Functional annotation of the transcriptome was performed with 6 functional databases, including the nonredundant protein sequence database (NR), Swiss-Prot, Pfam, EggNOG (Clusters of Orthologous Groups of proteins), Gene Ontology (GO) and Kyoto Encyclopedia of Genes and Genomes (KEGG), as described previously (Jinxia et al., 2015).
Identification and validation of differentially expressed genes
Using RNA-Seq by Expectation-Maximization (RSEM), the read counts of each sample gene/transcript were obtained using the results of comparison to the genome as well as the genome annotation file. They were then converted to Fragments Per Kilobase of exon model per Million mapped fragments (FPKM), which in turn yielded normalized gene/transcript expression levels. After obtaining the number of read counts of genes/transcripts, differential expression analysis was performed on multiple samples (≥2) to identify differentially expressed genes/transcripts between samples and to investigate the function of differentially expressed genes/transcripts. Differentially expressed genes (DEGs) were detected with PossionDis based on the Poisson distribution, and genes with a fold change≥2.00 and a false discovery rate (FDR) ≤0.001 were considered significant DEGs. For pathway enrichment analysis, all DEGs were annotated using GO and KEGG databases.
Measurement of mRNA levels for lipoprotein transportation and carotenoid synthesis-related genes
Eight candidate genes from the apolipoprotein and carotenoid metabolic pathways were selected for fluorescent quantitative PCR validation. Total RNA was extracted from the ovaries and hepatopancreas of shrimp at four stages of ovarian development using TRIzol™ reagent (Invitrogen, Carlsbad, CA, USA), and RNA samples were reverse transcribed using Evo M-MLV RT Premix for RT−qPCR AG11706 (ACCURATE BIOTECHNOLOGY, Hunan, China), which allows for the amplification of cDNA from total RNA to amplify cDNA without isolating mRNA. Oligonucleotide primers (Table 1) specific to eight genes and the housekeeping gene (β-actin) were designed with Primer Premier 5.0 software and synthesized by Sangon Biotech (Shanghai) Co., Ltd. Each pair of primers was examined by PCR, which was conducted using SYBR Premix Ex Taq II (Takara, Kyoto, Japan) to ensure their availability for RT−qPCR. The PCR program for every target gene and β-actin was 95°C for 30 s, followed by 40 cycles of 95°C for 10 s and 60°C for 30 s. RT-qPCR was carried out using a SYBR® Green Premix Pro Taq HS RT-qPCR Kit AG11701 (ACCURATE BIOLOGY, China), performed with a Thermal® Cycler Dice Real Time System III (TaKaRa) in final volumes of 20 μL, each containing 1 μL of cDNA, 10 μL SYBR® Green Premix Pro Taq HS RT-qPCR Kit AG11701 (ACCURATE BIOLOGY, China), 0.5 μL each of forwards and reverse primers (10 μM), and 8 μL sterile water. Each sample was analyzed in triplicate along with the internal control gene. The target gene/β-actin mRNA ratio was calculated using the formula 2˗ΔCt, and the raw data were simply transformed into the selected gene-to-actin Ct ratio for statistical analysis.
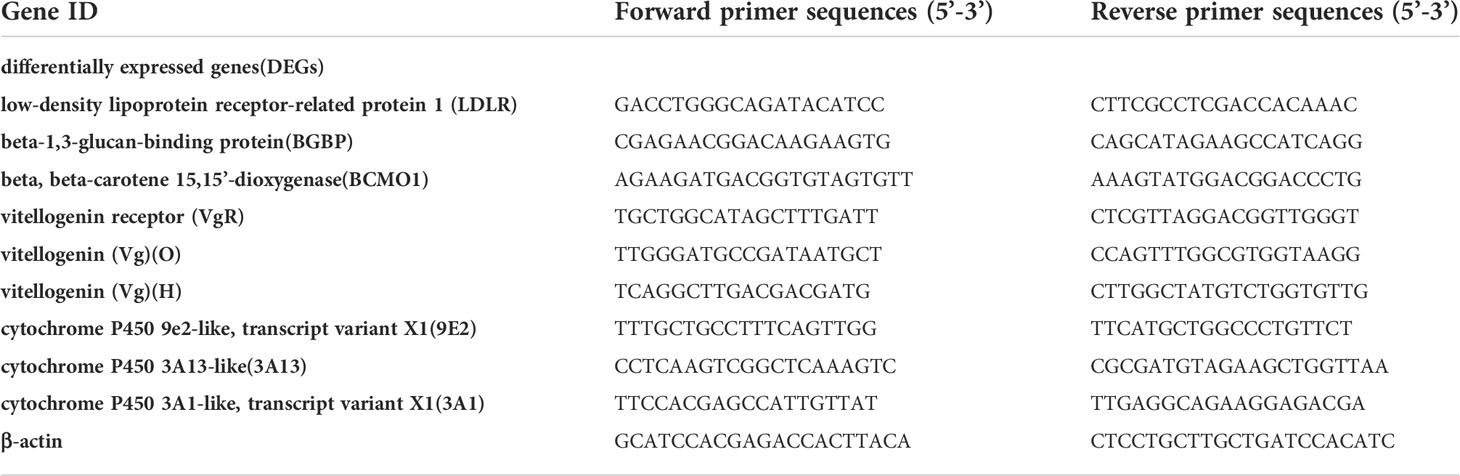
Table 1 Sequences of qPCR primers.
Data transformation and statistical analysis
For RT-qPCR, the expression levels of target genes were routinely normalized as a ratio of β-actin mRNA detected in the same sample. For RT-qPCR and GSI measurements, the data expressed as the mean±SE (standard error) were exported using TaKaRa DiceReal Time software and analyzed by using Student’s t test or one-way ANOVA followed by Fisher’s least significant difference (LSD) test.
Results
Effect of eyestalk ablation and nutritional reinforcement on ovarian maturation
Unilateral eyestalk ablation (UEA) and nutritional enrichment were applied to artificially induce ovarian maturation in female L. vannamei (Figure 1A). Based on our histological results (Figure 1D), the ovaries were found to develop to stage I at 0–3 days (Ov-I, Hp-I), to stage II at 1–4 days (Ov-II, Hp-II), to stage III at 3–6 days (Ov-III, Hp-III) and to stage IV at 4–6 days (Ov-IV, Hp-IV) and to spawn at 4–6 days after these administrations (Figure 1B). In this case, the mean gonadosomatic index (GSI) of the ovaries increased from 1.15 to 6.03 from day 0 to day 6 (Figure 1C), and the GSIs for stages I, II, III and IV were 0.82, 1.95, 3.29 and 7.11, respectively (Figure 1D). The GSI increasing pattern indicated a large amount of nutrient accumulation in ovaries during the exogenous vitellogenesis period from stage III to stage IV.
Quality control, trimming, de novo assembly and mapping
After filtering out low-quality reads using Illumina HiSeq 6000, fastp and SeqPrep software, we obtained data for shrimp ovaries and hepatopancreas in four stages. For the ovarian samples, 44,267,292, 44,175,442, 44,359,992 and 44,208,868 clean reads were generated for stages I, II, III and IV, respectively, and for the hepatopancreas samples, 44,630,016, 40,197,512, 44,540,914 and 44,043,748 clean reads were generated for stage I and for stages I, II, III and IV, respectively (Table 2). All sequence reads are deposited in the National Center for Biotechnology Information (NCBI) sequence read archive (SUB10677615). The Q20 values of all samples were higher than 95% by FastQC26 analysis, indicating high sequencing quality (Reference Gene Source: Penaeus_vannamei; GenBank GCA_003789085.1).
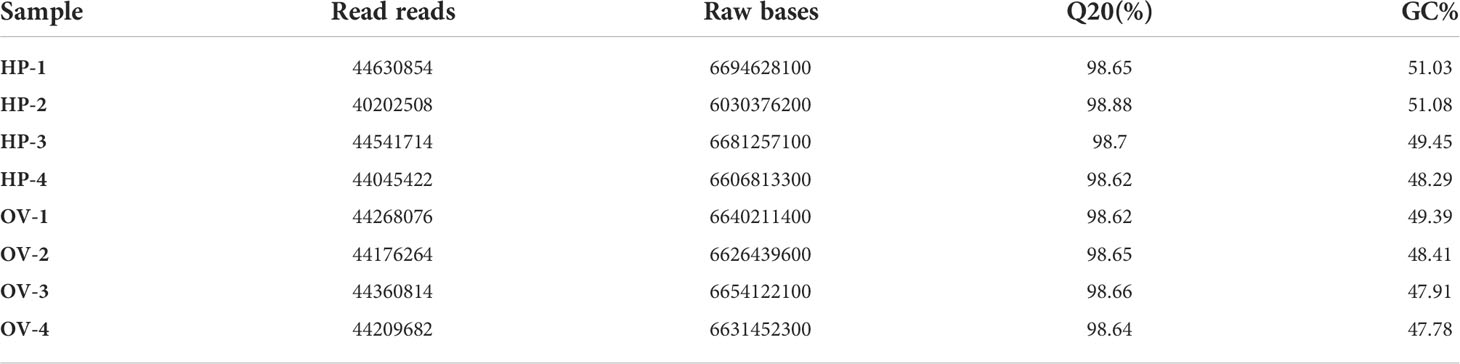
Table 2 Quality control and data statistics for clean reads.
Clean reads were pooled and assembled into nonredundant transcripts with a reference genome, and a total of 52192 transcripts were generated with an average length of more than 1800 bp (Table 3).
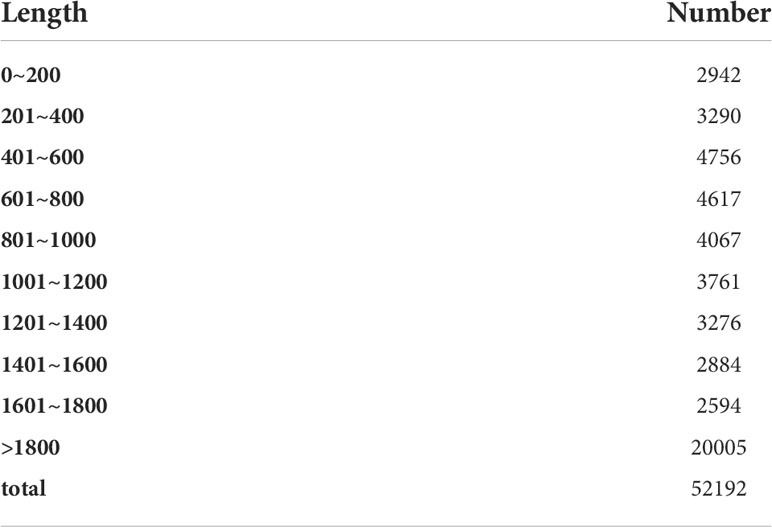
Table 3 Length distribution of transcripts.
Comparison of raw and clean data (reads) after quality control with the reference genome using HISAT2 revealed unique mappings of 29,617,891 (66.91%), 28,914,804 (65.45%), 29,535,553 (66.58%) and 29,529,228 (66.79%) for the four ovarian stages. The unique mapping of the four stages of the hepatopancreas reached 32,624,482 (73.1%), 28,488,888 (70.87%), 30,954,251 (69.5%) and 33,394,407 (75.82%), respectively (Table 4). The NR database annotated with the most functional information on transcripts.
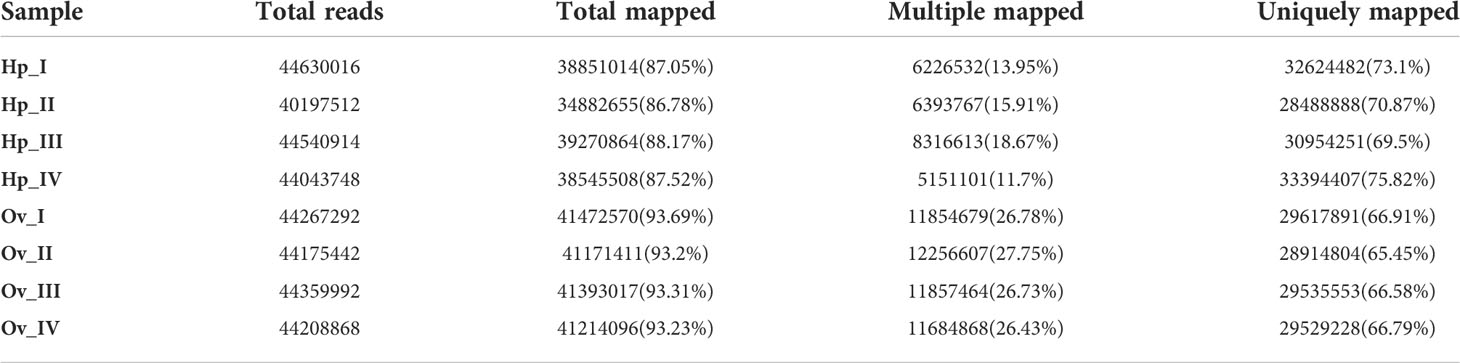
Table 4 Sequence Mapping Analysis.
Functional annotation and classification of genes
All genes were annotated using BLASTx with the NCBI nonredundant (Nr), KEGG, SWISS-PROT, GO, COG and PFAM protein databases. Annotation information was retrieved from proteins with the highest sequence similarity. In this study, 36,025 (90.9%) genes were annotated, and among them, 19,214, 9,695, 12,927, 14,095, 14,082 and 14,077 genes were annotated in the Nr, KEGG, SWISS-PROT, GO, COG, and PFAM databases, respectively (Figure 2A). The Venn diagram shows the annotation of expressed genes across databases, with 7,530 genes annotated to multiple libraries simultaneously, in addition to 2,540 genes annotated to the NR database. (Figure 2B).
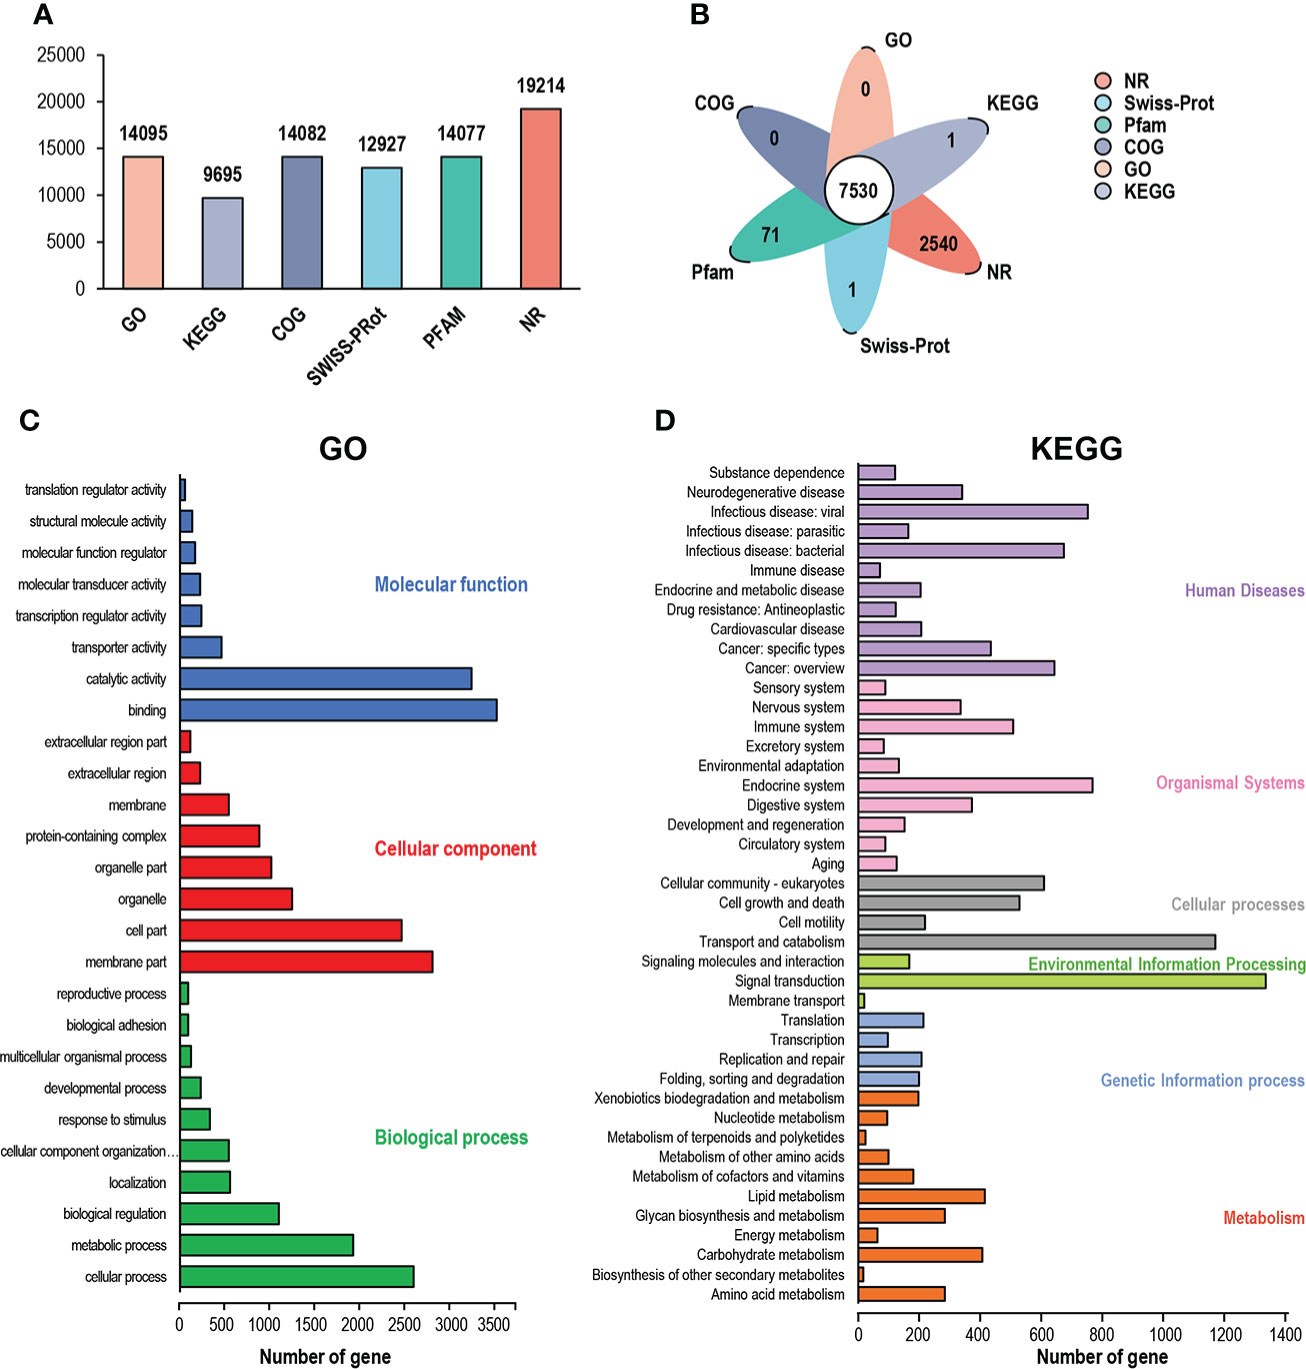
Figure 2 (A) All genes and transcripts obtained from the transcriptome assembly of Penaeus vannamei were compared with six major databases (NR, Swiss-Prot, Pfam, EggNOG, GO, and KEGG), and the Venn diagram shows the comparison of the data from the major databases. (B)Venn diagram of six databases, the white part is the number of common genes (C) GO classification results are summarized into three main GO categories (cellular components, molecular functions, and biological processes). The Y-axis represents the GO ontology. The X-axis indicates the number of genes. (D) KEGG classification of all transcripts. Columns represent the number of transcripts in each subcategory.
Based on the Gene Ontology (GO) database, the genes were annotated and assigned to three categories. Within the biological process category, “cellular process” (2,502 genes) and “metabolic process” (1,855 genes) were the dominant groups. Within the cellular component category, “membrane part” (2,705 genes) and “cell part” (2,375 genes) were the most abundant groups. Within the molecular function category, “binding” (3,396 genes) and “catalytic activity” (3,143 genes) were the dominant groups (Figure 2C). Based on the Kyoto Encyclopedia of Genes and Genomes (KEGG) database, a total of 15,902 genes were mapped to six specific pathways, including cellular processes, environmental information processing, genetic information processing, metabolism, human diseases, and organism systems (Figure 2D). These annotated genes were further subdivided into 43 subcategory pathways. Among them, we focused on the most annotated Metabolism section in the First Category; most genes fell under Amino acid metabolism (289 genes), Carbohydrate metabolism (414 genes), lipid metabolism (422 genes), and Glycan biosynthesis and metabolism (289 genes).
Differentially expressed genes and their functional enrichment analysis
The analysis of the relationship between samples from different stages of the hepatopancreas and ovary was demonstrated by a Venn diagram (Figure 3A). In this case, a total of 6730 genes were expressed in both tissues, of which 4079 and 1227 were genes specifically expressed in the hepatopancreas and ovary, respectively. Within the hepatopancreas, 8524 transcripts were commonly expressed at four stages, while at stages I, II, III and IV, the numbers of transcripts coexpressed in the hepatopancreas and ovary were 5541, 6098, 7508 and 6917, respectively (Figure 3A).
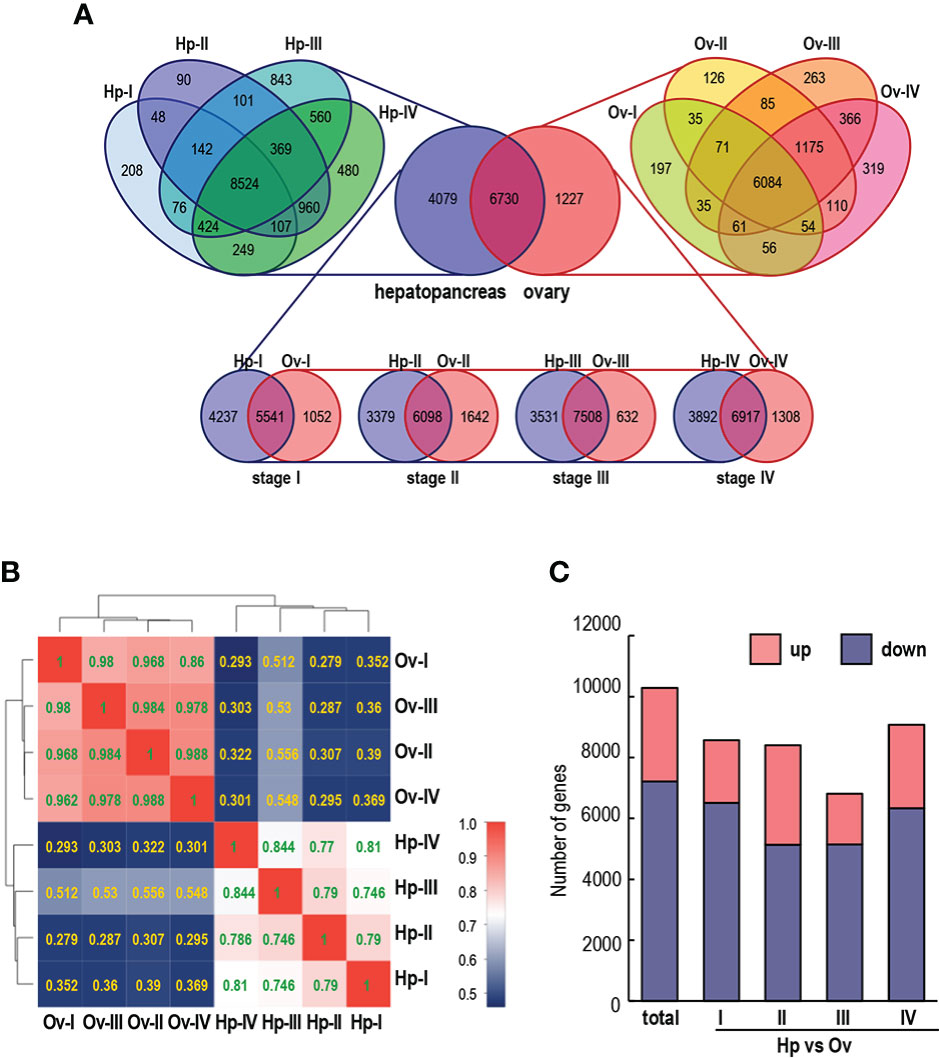
Figure 3 (A) Venn diagrams of unique and common genes in different stages of hepatopancreas and ovary development. (B) Correlation analysis of the four stages of ovary and hepatopancreas. The value is the correlation coefficient of the two samples; the larger the value is, the greater and more similar the correlation between the two samples. (C) Number of up- and down-regulated DEGs in each hepatopancreatic group compared to the ovarian group (first combinatorial bar) and pairwise comparison of four different staged hepatopancreatic and ovarian groups (last four combinatorial bars).
To identify DEGs involved in ovarian development, we used the RPKM value to compare the expression differences between different groups (Figure 3B). A large number of DEGs were screened with adjusted q < 0.05 and |log2Ratio|≥ 1. A total of 10288 differentially expressed genes (DEGs) were identified between ovarian and hepatopancreatic samples, including 3077 upregulated transcripts and 7211 downregulated transcripts. The ovarian and hepatopancreatic samples were divided into four stages for further comparison. Among them, 3267 and 5138 transcripts were upregulated and downregulated at stage II, and 2737 and 6337 DEGs were upregulated and downregulated at stage III in the hepatopancreas and ovary, respectively (Figure 3C).
Expression analysis of transcripts of genes related to lipid metabolism
The three most enriched pathways of metabolism were selected from the KEGG enriched pathways amino acid metabolism, carbohydrate metabolism, and lipid metabolism, and the gene sets of the three pathways were established separately. Pathway enrichment analysis was performed using the same principle as GO functional enrichment analysis, and the KEGG pathway function was considered to be significantly enriched when the corrected P value (Padjust) was <0.05. The enrichment results (Figure 4A) showed that most of the metabolism-related transcripts were upregulated in the hepatopancreas, while fewer were upregulated in the ovary. Three pathways related to lipid transport were identified from the lipid metabolism gene set: fatty acid biosynthesis (map00061), fatty acid degradation (map00062), and biosynthesis of unsaturated fatty acids (map01040), and the heatmap showed that the majority of transcripts associated with lipid transport were upregulated in the hepatopancreas and less in the ovary (Figure 4B).
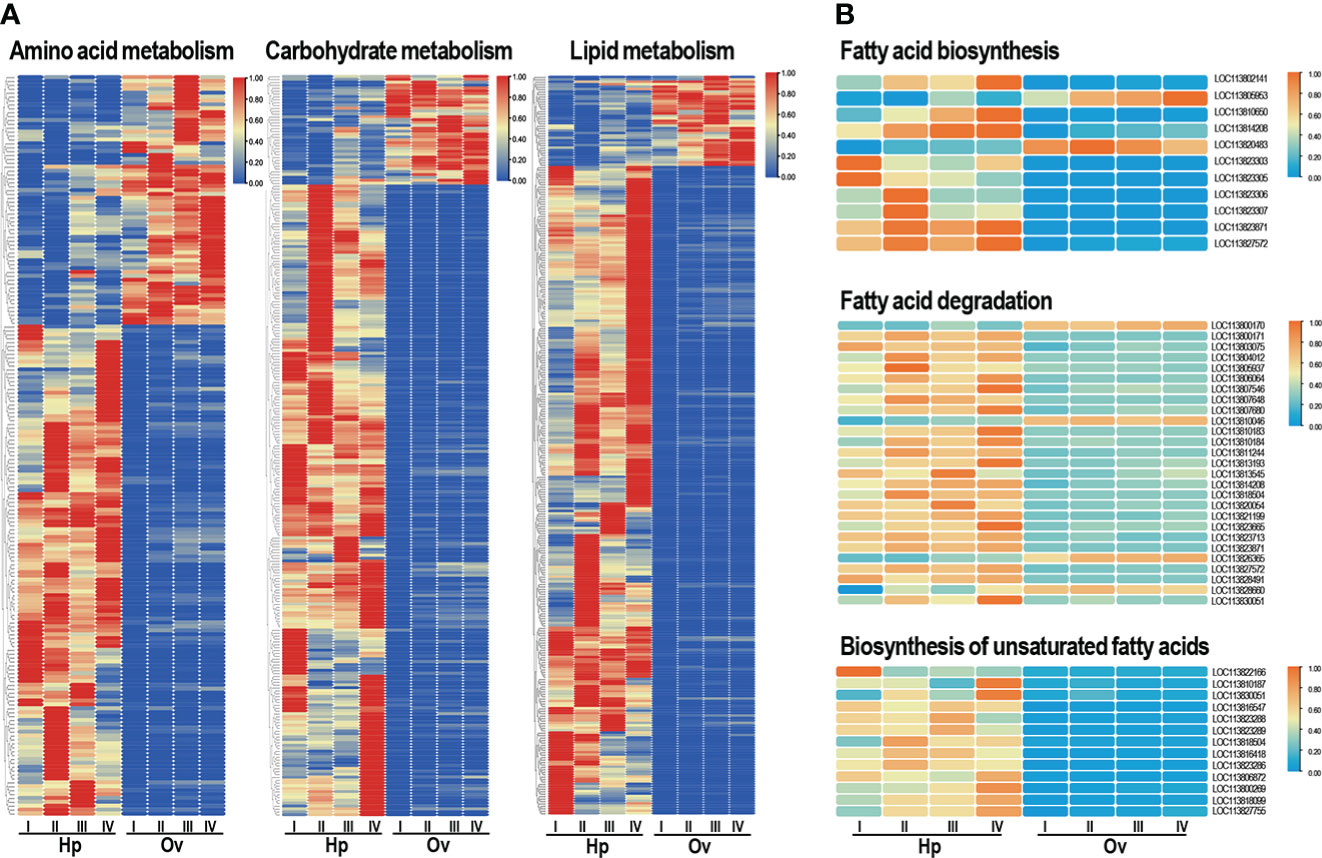
Figure 4 (A) KEGG analysis of three metabolic pathway transcripts up- and downregulated at different stages in the ovary and hepatopancreas. (B) Fatty acid metabolic pathway transcripts up- and down-regulated at different stages in the ovary and hepatopancreas. Orange and blue represent upwards and downwards shifts, respectively.
Identification and expression patterns of lipoprotein and their receptor genes
Apolipoproteins are important carriers for lipid transportation, providing the required nutrients during the shrimp ovarian development cycle. In this study, the expression levels of apolipoproteins and their receptors were selected for analysis and illustrated by a heatmap (Figure 5A). The apolipoprotein included vitellogenin (Vg, LOC11380422), apolipoprotein D (ApoD, LOC113810220 and LOC113815027), beta-1,3-guucan-binding protein (BGBP, LOC113813397 and LOC113807239), hemolymph protein (BGBP, LOC113813397 and LOC113807239) and hemolymph clottable protein (CP, LOC113819742 and LOC113807427), and the apolipoprotein receptor included vitellogenin receptor (VgR, LOC113811544 and LOC113811783), very low-density lipoprotein receptor (VLDLR, LOC113811553 and LOC113802323) and low-density lipoprotein receptor-related protein 1 (LDLR-RP1, LOC113824560) (Jia et al., 2016; Hoeger and Schenk, 2020; Li et al., 2021). In this case, Vg, ApoD, BGBP, BP, VLDLR and LDLR-RP1 transcripts were predominantly expressed in the hepatopancreas but not in the ovary, while one of the VgR transcripts appeared to have low ovarian expression and high hepatopancreas expression. The RT-qPCR results for BGBP, VgR and LDLR were consistent with the RNA-seq results (Figure 5B). However, the expression of Vg genes appeared in two different expression patterns for the two isoforms, which will be covered later in the section.
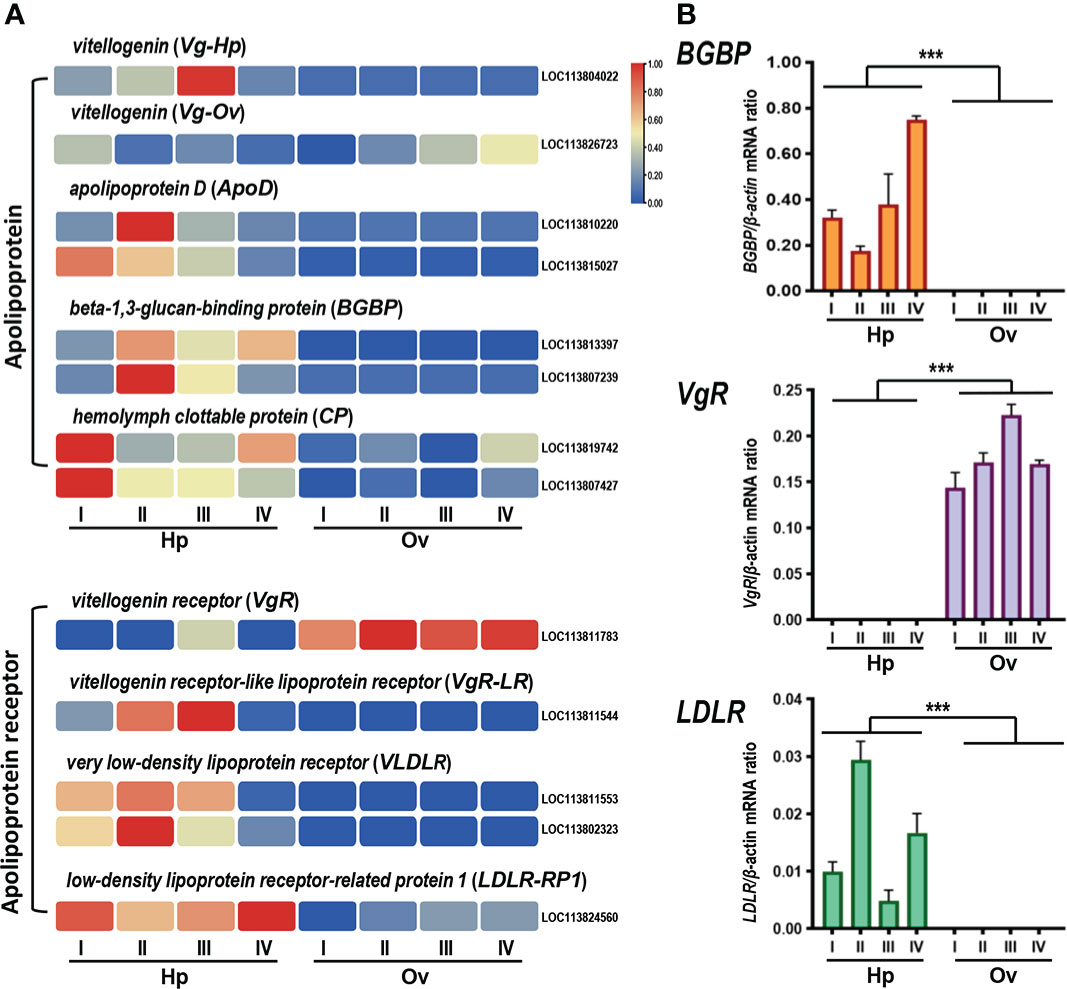
Figure 5 (A) Apolipoprotein and apolipoprotein receptor clustering heatmap analysis. (B) Quantitative realtime PCR validation of lipoprotein RNA-seq data. Three single genes were selected for validation, including beta-1,3-glucan binding protein (BGBP), vitellogenin receptor (VgR), and low density lipoprotein receptor (LDLR). The x-axis represents the developmental stage. Columns and bars represent the mean and standard error of the relative expression levels from RT-qPCR results (Y-axis on the left). Values with different superscripts indicate statistical significance (P < 0.05), calculated by one-way ANOVA. *** means significant difference.
Quantification and structural domain analysis of two Vg isoforms
By RT-qPCR, two transcripts of Vg genes showed completely opposite expression sites (Figure 6A), in which LOC113804022 had high expression in the hepatopancreas and was defined as hepatopancreatic vitellogenin (Hp-Vg), and LOC113826723 had high expression in the ovary and was defined as ovarian vitellogenin (Ov-Vg). Compared with Ov-Vg, HP-Vg transcriptional levels are higher than ovarian fragments. The nucleotide sequence similarity between the two Vg transcripts was 71.6%, indicating that the two genes do not encode the same protein. As shown in Figure 6B, prediction of structural domains indicated the presence of DUF1943, Pfam : DUF1081 and VWD domains in both Vg proteins. Ov-Vg contained the LPD_N domain, while it was replaced by the Pfam : Vitellogenin_N domain in Hp-Vg (Figure 6B). In addition, gene organizations showed that both types of Hp-Vg and Ov-Vg genes contain 15 exons separated by 14 introns, and all introns start with GT and end with AG, conforming to the GT/AG rule for intron splicing (Figure 6B).
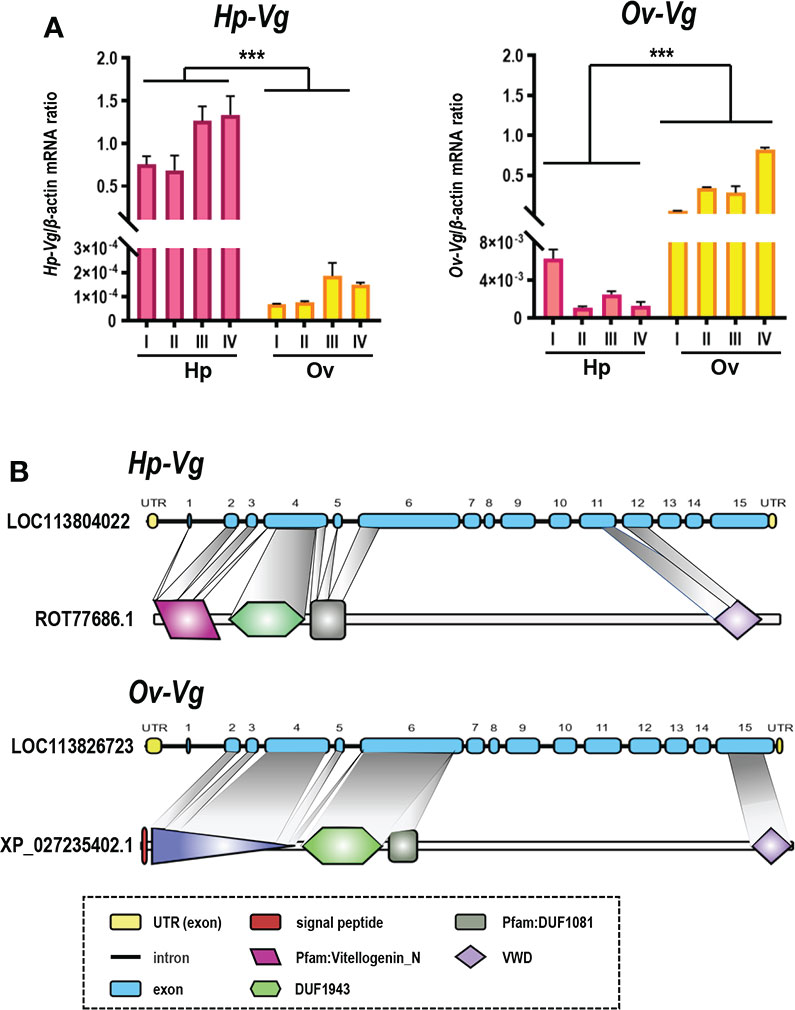
Figure 6 (A) RT-qPCR validation of two differentially expressed vitellogenin, named Hp-Vg as the hepatopancreatic type and Ov-Vg as the ovarian type. The X-axis is staging, left is hepatopancreatic, right is ovarian, Y-axis is sample CT to β-actin CT ratio. Values with different superscripts indicate statistical significance (P < 0.05), calculated by one-way ANOVA. (B) Comparison of Hp-Vg and Ov-Vg structural domains (Hp-Vg: ROT77686.1, Ov-Vg: XP_027235402.1) and exon/intron organization of genes (Hp-Vg: LOC11380422, Ov-Vg: LOC113826723). The ORF and UTR of exons are marked with dark blue and empty boxes, respectively, and introns are marked with solid lines. Solid lines. The lengths of the elements are indicated as nucleotides. *** means significant difference.
Expression analysis of transcripts of genes related to carotenoid metabolism
The primary pathway associated with carotenoid metabolism is metabolism of cofactors and vitamins, and the heatmap shows that transcripts of this pathway were more highly expressed in the hepatopancreas than in the ovary (Figure 7A). The results for the secondary pathway retinol metabolism were similar to those for the primary pathway (Figure 7B), with most transcripts highly expressed in the hepatopancreas. Four typical genes on the pathway were screened for heatmap and quantitative analysis (Figures 7C, D), and the enzyme BCOM1 (LOC113809949), associated with carotenoid cleavage, was found to be highly expressed in the hepatopancreas and almost absent from the ovary, while other representative genes cytochrome P450 3A1-like (3A1), transcript variant X1 cytochrome P450 3A13-like (3A13), and cytochrome P450 9e2-like, transcript variant X1 (9e2), which are CYP family member genes related to carotenoid processing, were also highly expressed only in the hepatopancreas, which was consistent with the RT-qPCR results.
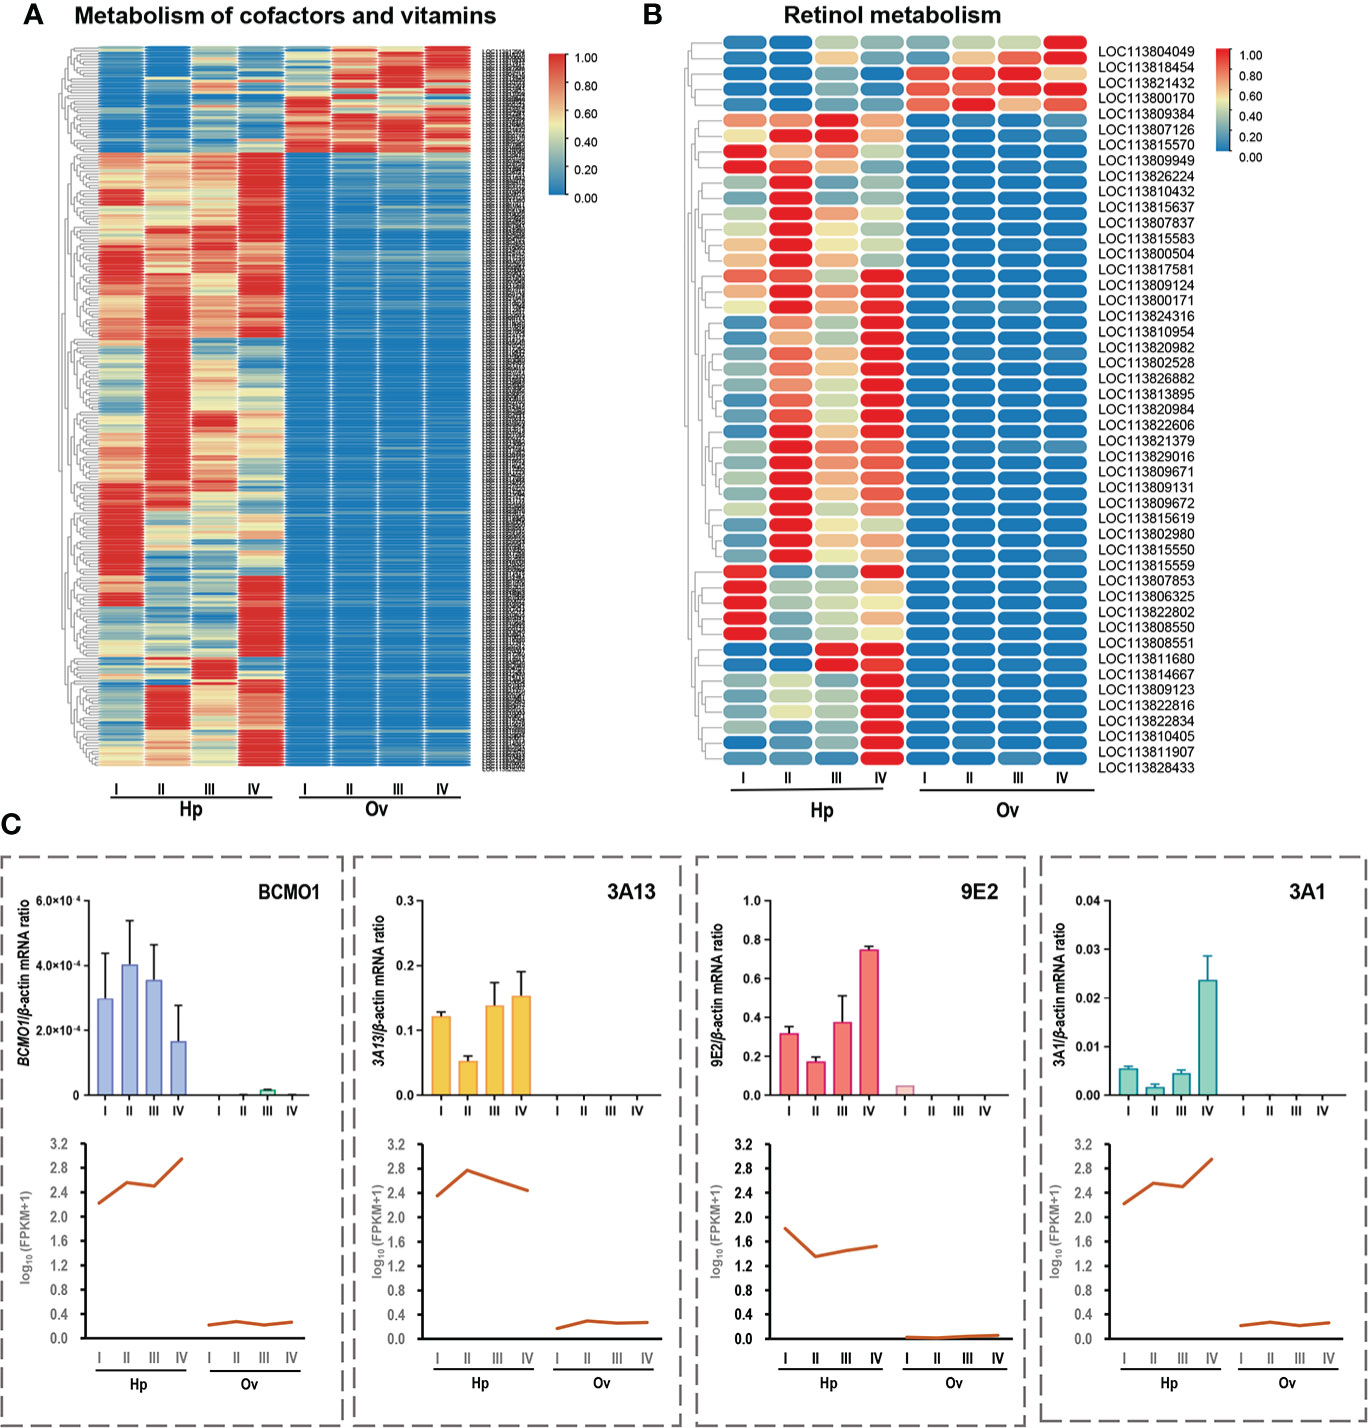
Figure 7 (A) Clustering heatmap analysis of vitamin metabolism genes in the primary pathway of carotenoid metabolism. (B) Clustering heatmap analysis of retinoid metabolism genes in the secondary pathway of carotenoid metabolism. (C) Realtime quantitative PCR validation of carotenoid metabolism-related RNA-seq data. Four representative genes were selected for validation, including beta, beta-carotene 15,15'-dioxygenase (BCMO1), cytochrome P450 3A13-like (3A13), cytochrome P450 3A1-like, transcript variant X1 (3A1) and cytochrome P450 9e2-like, transcript variant X1 (9E2). The X-axis represents developmental stages. Columns and bars represent the mean and standard error of the relative expression levels of RT-qPCR results (Y-axis on the left). Values with different superscripts indicate statistical significance (P < 0.05), calculated by one-way ANOVA.
Discussion
In this study, it was shown that the ovaries of L. vannamei could develop from stage I to stage IV within 4-6 days post-unilateral eyestalk ablation and 11-13 days of nutritional enrichment feeding the fresh clam worms, squid and oysters, respectively (Figure 1A), which was much shorter than the previous report on these shrimp without nutritional reinforcement (generally need 15-37 days to reach spawning after eyestalk ablation) (Du et al., 2018). This study suggested a synergistic effect between nutritional reinforcement with fresh food and eyestalk ablation on ovarian development of L. vannamei, similar to a previous report on black tiger shrimp Penaeus monodon (Hoeger and Schenk, 2020). Based on that, this study investigated the contributions of the hepatopancreas and ovaries to vitellin accumulation in the oocyte maturation of female shrimp by transcriptomic sequencing.
RNA-Seq is a type of NGS that provides important tools for the discovery of genes and the analysis of gene structure, genetic evolution and population genetics (Hoeger and Schenk, 2020). In recent years, a number of genes associated with crustacean ovarian development have been identified by genome (Zhang et al., 2019) and transcriptome (Sittikankaew et al., 2020) analyses. In this study, we identified transcripts associated with lipoprotein transportation, such as Vg, ApoD, BGBP, CP, VgR, VLDLR and LDLR-RP1, and with carotenoid metabolism, such as BCMO1, 3A13, 9E2 and 3A1, from the hepatopancreatic and ovarian transcriptomes of L. vannamei.
For analysing DEGs in different stages of the ovary and hepatopancreas in shrimp, the results showed that more DEGs were upregulated than downregulated in the hepatopancreas during the ovarian maturation cycle, particularly for lipid metabolism and transportation (Figures 4A, B), indicating that the hepatopancreas was the major lipid metabolism centre and supplied more lipids to the developing ovaries during ovarian development.
Based on the ultrastructural features of the crustacean hepatopancreas, nutrients are considered mainly absorbed by R-cells (Samuel and Bähler, 2010), the most abundant cell type in the hepatopancreas. R-cells can store large amounts of energy reserves, such as lipids and glycogen. In P. monodon and Palaemon elegans, rough endoplasmic reticulum (rER) vesicles often transport degraded lipid globules in a central direction, and peroxisomes and mitochondria are close to the lipid globule-rER complex for catabolism and further ß-oxidation (Wang et al., 2014).
The hepatopancreas synthesizes hemolymph proteins with different functions, such as hemocyanin, lipoproteins, antimicrobial peptides and coagulating proteins (Ahearn, 2010). Within the hemolymph proteins, lipoprotein is a kind of biochemical assembly whose primary function is to transport hydrophobic lipid molecules in hydrophilic plasma or other extracellular fluids (Vogt, 1994).
Most of the high-density lipoprotein HDL-BGBPs circulating in the hemolymph are thought to originate in the hepatopancreas, although they seem to be ubiquitously expressed (Holdich, 2002). The expression levels of HDL-BGBP vary based on species and tissues (Abdu et al., 2000). These lipoproteins differ from mammalian HDL because they include phospholipids as a major lipid component instead of triglycerides. The lipoproteins are probably synthesized in the R-cells and exported via the basal tubule system (Gloria et al., 2000). The results of this study showed that lipoprotein genes were predominantly expressed in the hepatopancreas rather than in the ovary, except for an Ov-Vg (Figures 5A, 6A), indicating that the hepatopancreas is the major site for lipoprotein synthesis even during ovarian development. Given that only VgR but not other lipoprotein receptors was mainly expressed in the ovary, it is logical to speculate that self-circulation from the hepatopancreas to the hepatopancreas is the normal form of lipoprotein transport in shrimp and that transportation from the hepatopancreas to ovary is a specific form for lipoprotein transport during female reproduction.
In this study, multiple Vg or Vg-like transcripts were identified from the transcriptome of L. vannamei, with different expression patterns during ovarian development. Hepatopancreas-expressed Vg (Hp-Vg) and ovary-expressed Vg (Ov-Vg) are considered to provide the greatest contributions to ovarian vitellin deposition (Figure 5A), and they share only 44.74% identity with each other at the amino acid (a.a.) sequence level. By BLAST screening, Hp-Vg and Ov-Vg transcripts were found to correspond to LOC113804022 and LOC113826723 in the L. vannamei genome and XR_003475567.1 and XM_027379601.1, respectively, as previously reported (Dai et al., 2021). Different Vg genes and multiple Vg isoforms with different expression patterns have been found in L. vannamei (Wang et al., 2020). However, their contribution to vitellin accumulation in oocytes is unclear. Based on the transcriptomes of the hepatopancreas and ovary from the banana shrimp F. merguiensis, black tiger shrimp P. monodon and lobster Panilus homarus, multiple Vg transcripts have also been identified (Vogt, 2019), indicating the presence of multiple Vg genes in crustaceans. Our study showed that one Vg gene (Hp-Vg) was restrictedly expressed in the hepatopancreas, while another Vg gene (Ov-Vg) was specifically expressed in the ovaries during the whole ovarian maturation of L. vannamei (Figure 6A).
Interestingly, the results of the current study showed that the signal peptide was only found in the a.a. sequences of Ov-Vg but not Hp-Vg (Figure 6B). It is speculated that Hp-Vg is transported from the hepatopanscreas to the ovary via the vitellogenin apolipoprotein, which does not require a signal peptide (Wang et al., 2020). In contrast, Ov-Vg is secreted and absorbed by ovaries independently via a paracrine pathway. Similarly, Vg isoforms with and without signal peptides have been reported in the mud crab S. paramamosain (Yang et al., 2016).
Carotenoids are the major pigments for crustaceans. Previous studies have shown crustaceans have to obtain carotenoids from their diets and can further convert some carotenoids, such as β-carotene and zeaxanthin, into Axn (Babin et al., 2020). During crustacean ovarian maturation, carotenoids first absorb and accumulate in the hepatopancreas in free and esterified forms and are then transported to the ovary via the hemolymph during vitellogenesis (Goodwin, 1986). Carotenoids are highly hydrophobic and therefore require special transport by lipoproteins, such as low-density lipoprotein in mammals and lipophorin in insects, through plasma or hemolymph for deposition in target tissues (Sachindra et al., 2005). However, to date, no lipoprotein for transporting carotenoids has been functionally identified in crustaceans.
Furthermore, retinols and other retinoid derivatives play a critical role in the developmental processes of crustaceans, including ovarian and larval development (Boonyaratpalin et al., 2001), which are generally produced from the central cleavage at the 15,15’-double bond of β-carotene by the carotenoid cleaving enzyme (BCMO) (M et al., 1988). The results of the current study showed that the transcripts related to carotenoid metabolism were associated with the map00830 pathway in ko00515 by KEGG alignment (Supplementary Figure S1). One major carotenoid cleaving enzyme (BCMO1) we identified in the L. vannamei transcriptome (Figure 8) from the current study. The high expression level of BCMO1 mRNA in the hepatopancreas indicates the accumulation of large carotenoids in the hepatopancreas. However, the actual absorption, transportation, deposition and metabolism of dietary carotenoids in crustaceans remain unclear and warrant further investigation.
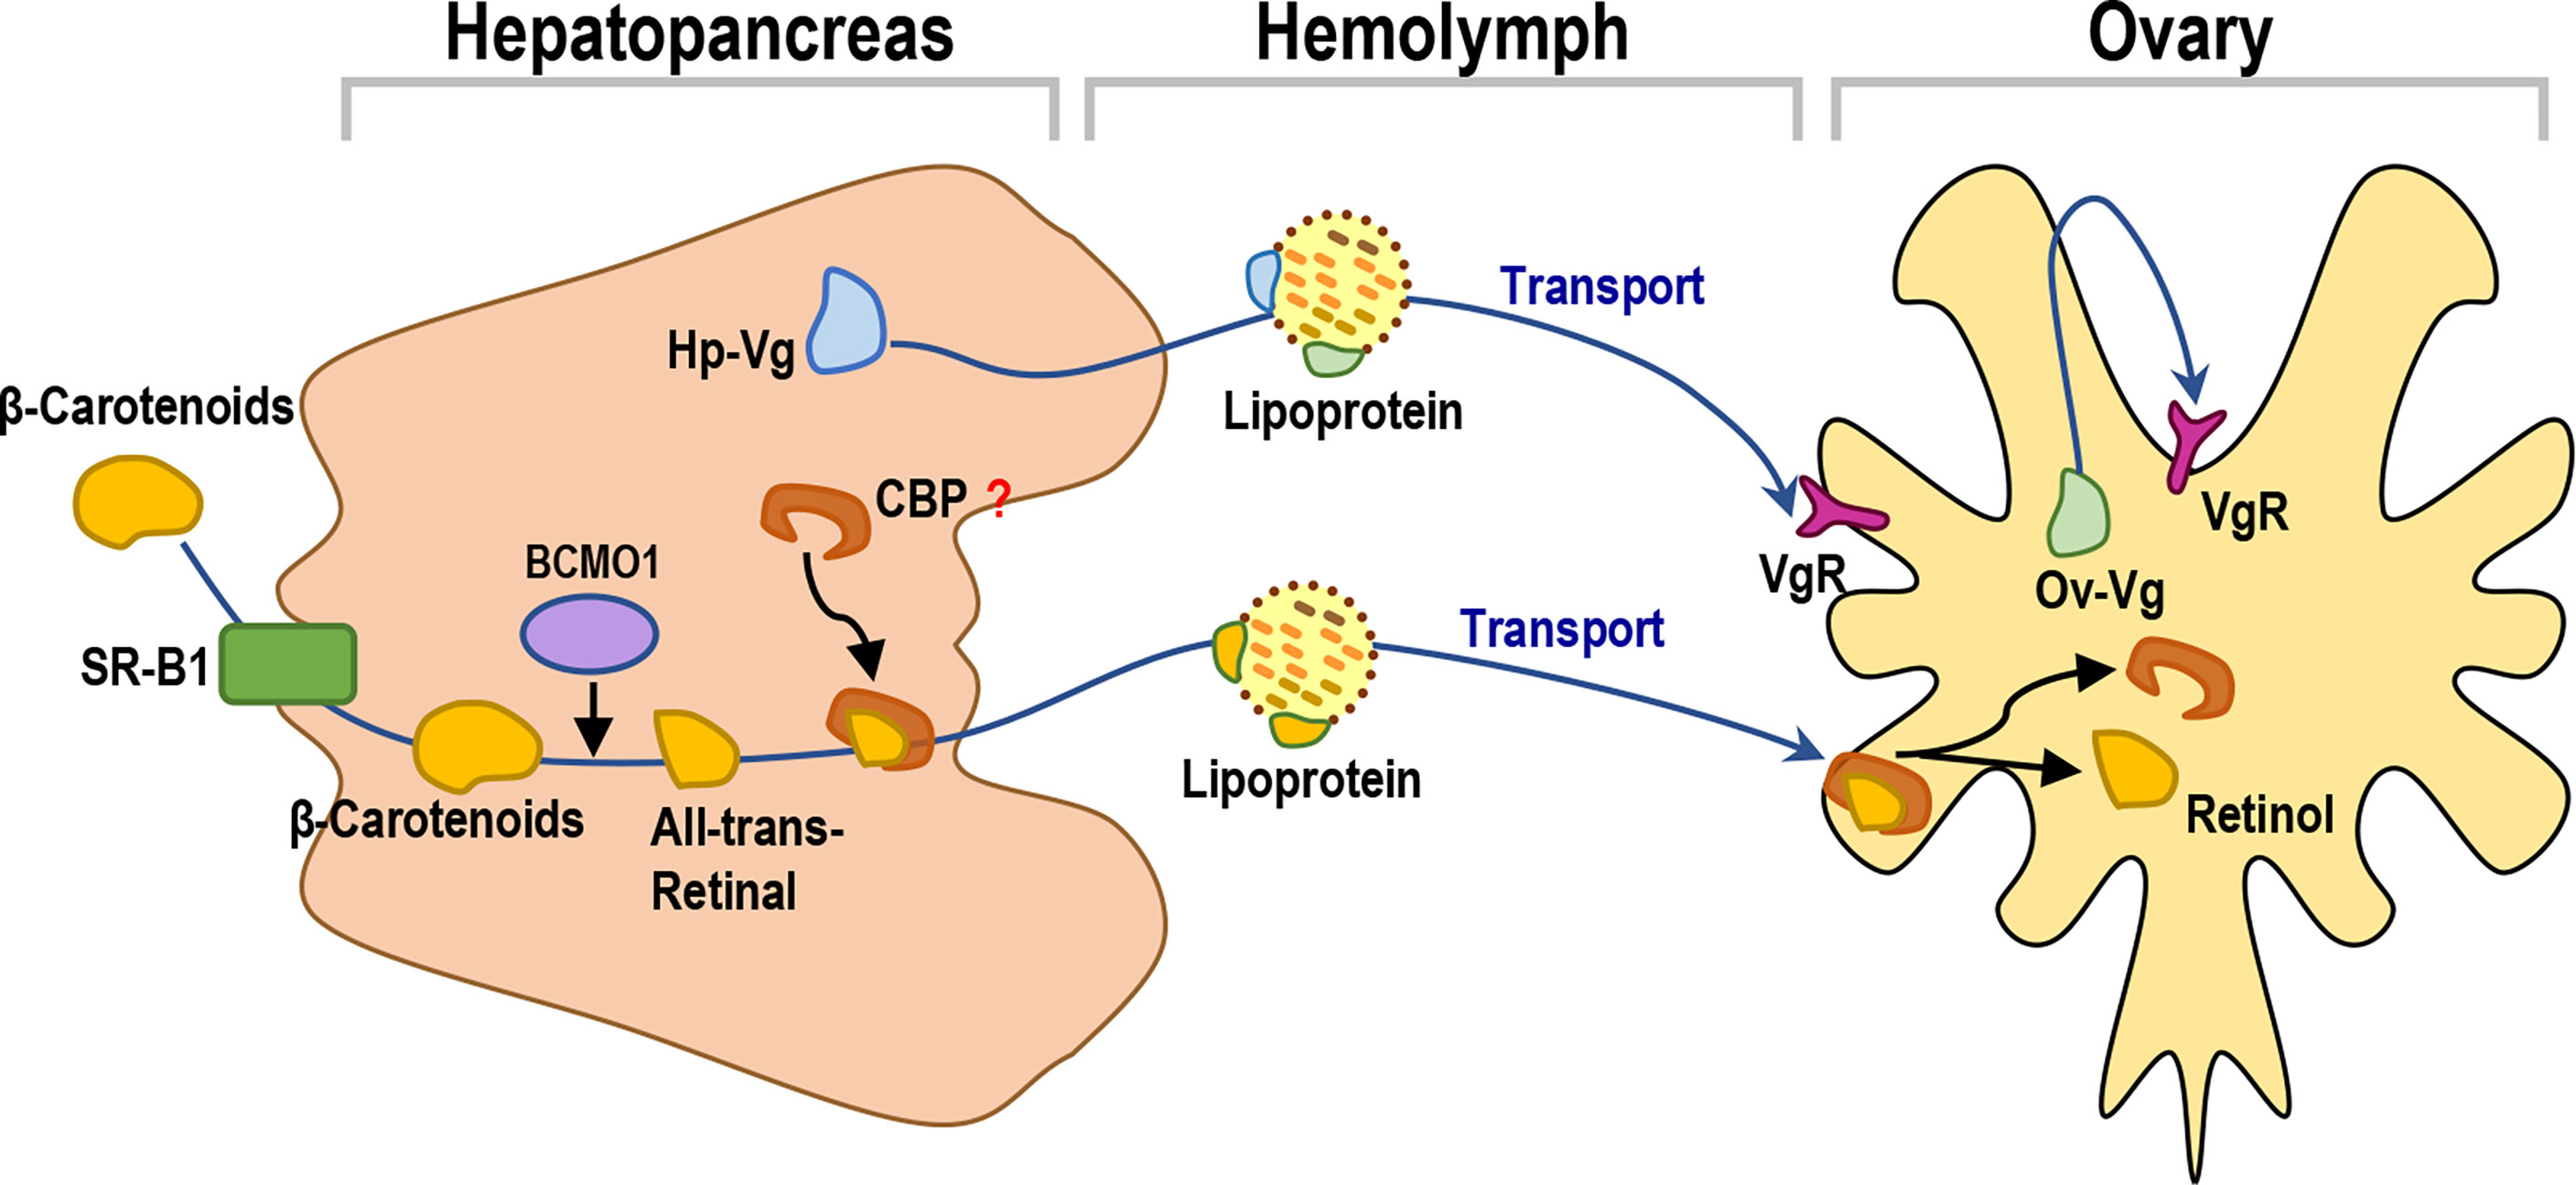
Figure 8 A working model for yolk nutrition production, transportation and accumulation pathways from the hepatopancreas to ovary in Pacific white shrimp.
Data availability statement
The datasets presented in this study can be found in online repositories. The names of the repository/repositories and accession number(s) can be found below: BioProject, accession number: PRJNA438564.
Author contributions
ZL, TC and XW designed and drafted the manuscript. MZ, YR, XC, JL and LZ performed animal collection and prepared samples. ZL, MZ, HY and XZ performed data processing and bioinformatic analysis. ZL, TC and XW conceived the study and experimental design and helped draft the manuscript. HL, CH and TC contributed reagents/materials/analysis tools. TC and XW supervised and conceived the experiments and corrected the manuscript. All authors read and approved the final manuscript.
Funding
This research was funded by the Guangdong Provincial Special Fund for Modern Agriculture Industry Technology Innovation Teams (2019KJ149) and the National Natural Science Foundation of China (31402287).
Acknowledgments
The authors thank Ms. Min Zhang and Ms. Ziyue Zhao for their help in data collection and Dr. Xiao Jiang for her help in manuscript preparation. The authors also thank the Majorbio Cloud Platform (Shanghai, China) for bioinformatics support.
Conflict of interest
Authors JL and HL are/were employed by Jinyang Biotechnology Co. Ltd.
The remaining authors declare that the research was conducted in the absence of any commercial or financial relationships that could be construed as a potential conflict of interest.
Publisher’s note
All claims expressed in this article are solely those of the authors and do not necessarily represent those of their affiliated organizations, or those of the publisher, the editors and the reviewers. Any product that may be evaluated in this article, or claim that may be made by its manufacturer, is not guaranteed or endorsed by the publisher.
Supplementary material
The Supplementary Material for this article can be found online at: https://www.frontiersin.org/articles/10.3389/fmars.2022.948105/full#supplementary-material
Supplementary Figure 1 | Retinol metabolism pathway by KEGG analysis showing different genes of action (yellow - known genes, green - new genes, red border - upregulated genes, blue border - downregulated genes). The KEGG pathway map 000830 is adapted from https://www.genome.jp/kegg-bin/show_pathway map00830, and the KEGG database has been previously described.
References
Abdu U., Yehezkel G., Sagi A. (2000). Oocyte development and polypeptide dynamics during ovarian maturation in the red-claw crayfish cherax quadricarinatus. Invertebrate Reprod. Dev. 37, 75–83. doi: 10.1080/07924259.2000.9652402
Ahearn G. A. (2010). Nutrient transport by the crustacean gastrointestinal tract: recent advances with vesicle techniques. Biol. Rev. 62, 45–63. doi: 10.1111/j.1469-185X.1987.tb00625.x
Arcos F. G., Ibarra A. M., Racotta L. S. (2011). Vitellogenin in hemolymph predicts gonad maturity in adult female Litopenaeus (Penaeus) vannamei shrimp. Aquaculture 316, 93–98. doi: 10.1016/j.aquaculture.2011.02.045
Avarre J. C., Lubzens E., Babin P. J. (2007). Apolipocrustacein, formerly vitellogenin, is the major egg yolk precursor protein in decapod crustaceans and is homologous to insect apolipophorin II/I and vertebrate apolipoprotein b. BMC Evol. Biol. 7, 3. doi: 10.1186/1471-2148-7-3
Babin A., Motreuil S., Teixeira M., Bauer A., Moreau Y.. (2020). Origin of the natural variation in the storage of dietary carotenoids in freshwater amphipod crustaceans. PloS One 15, e0231247. doi: 10.1371/journal.pone.0231247
Bae S. H., Okutsu T., Tsutsui N., Kang B. J., Chen H. Y., Wilder M. N. (2017). Involvement of second messengers in the signaling pathway of vitellogenesis-inhibiting hormone and their effects on vitellogenin mRNA expression in the whiteleg shrimp, litopenaeus vannamei. Gen. Comp. Endocrinol. 246, 301–308. doi: 10.1016/j.ygcen.2017.01.006
Boonyaratpalin M., Thongrod S., Supamattaya K., Britton G., Schlipalius L. E. (2001). Effects of ß-carotene source, dunaliella salina, and astaxanthin on pigmentation, growth, survival and health of penaeus monodon. Aquacult Res. 32 (Suppl 1), 182–190. doi: 10.1046/j.1355-557x.2001.00039.x
Britton G. (1995). Structure and properties of carotenoids in relation to function. FASEB J. Off. Publ. Fed. Am. Societies Exp. Biol. 9, 1551. doi: 10.1006/excr.1995.1406
Ceballos-Vázquez B. P., Palacios E., Aguilar-Villavicencio J., Racotta I. S. (2010). Gonadal development in male and female domesticated whiteleg shrimp, litopenaeus vannamei, in relation to age and weight. Aquaculture 308, 116–123. doi: 10.1016/j.aquaculture.2010.08.020
Chen T., Lin T., Li H., Lu T., Li J., Huang W., et al. (2018). Heat shock protein 40 (HSP40) in pacific white shrimp (Litopenaeus vannamei): Molecular cloning, tissue distribution and ontogeny, response to temperature, Acidity/Alkalinity and salinity stresses, and potential role in ovarian development. Front. Physiol. 9. doi: 10.3389/fphys.2018.01784
Chen T., Zhang L. P., Wong N. K., Zhong M., Ren C. H., Hu C. Q. (2014). Pacific white shrimp (Litopenaeus vannamei) vitellogenesis-inhibiting hormone (VIH) is predominantly expressed in the brain and negatively regulates hepatopancreatic vitellogenin (VTG) gene expression. Biol. Reprod. 90, 47. doi: 10.1095/biolreprod.113.115030
Dai H., Lv Z., Huang Z., Ye N., Li S., Jiang J., et al. (2021). Dietary hawthorn-leaves flavonoids improves ovarian function and liver lipid metabolism in aged breeder hens. Poultry Sci. 100, 101499. doi: 10.1016/j.psj.2021.101499
Du J. L., Zhang X. J., Yuan J. B., Zhang X. X., Li F. H., Xiang J. H. (2018). Wnt gene family members and their expression profiling in litopenaeus vannamei - ScienceDirect. Fish Shellfish Immunol. 77, 233–243. doi: 10.1016/j.fsi.2018.03.034
Gloria Y.-P., Teresa G. G., Vargas-Albore F., García-Bañuelos M. (2000). Synthesis of hemolymph high-density lipoprotein β-glucan binding protein by penaeus vannamei shrimp hepatopancreas. Mar. Biotechnol 2, 485–492. doi: 10.1007/s101260000030
Gong J., Ye H., Xie Y., Yang Y., Huang H., Li S., et al. (2015). Ecdysone receptor in the mud crab Scylla paramamosain: a possible role in promoting ovarian development. J. Endocrinol. 224, 273–287. doi: 10.1530/JOE-14-0526
Goodwin W. ,. T. (1986). Metabolism, nutrition, and function of carotenoids. Annu. Rev. Nutr. 6, 273. doi: 10.1146/annurev.nu.06.070186.001421
Heras H., Gonzalez-Baró M., Pollero R. J. (2000). Lipid and fatty acid composition and energy partitioning during embryo development in the shrimp macrobrachium borellii. Lipids 35, 645–651. doi: 10.1007/s11745-000-0569-z
Hiramatsu N., Todo T., Sullivan C. V., Schilling J., Reading B. J., Matsubara T., et al. (2015). Ovarian yolk formation in fishes: Molecular mechanisms underlying formation of lipid droplets and vitellogenin-derived yolk proteins. Gen. Comp. Endocrinol. 221, 9–15. doi: 10.1016/j.ygcen.2015.01.025
Hoeger U., Schenk S. (2020). Crustacean hemolymph lipoproteins. Subcell Biochem. 94, 35–62. doi: 10.1007/978-3-030-41769-7_2
Jia X., Chen Y., Zou Z., Lin P., Wang Y., Zhang Z. (2013). Characterization and expression profile of vitellogenin gene from Scylla paramamosain. Gene 520, 119–130. doi: 10.1016/j.gene.2013.02.035
Jia W., Ke-Cai X., Ying-Hong L., Ying X. (2016). De novo transcriptome analysis of Chinese citrus fly, bactrocera minax (Diptera: Tephritidae), by high-throughput illumina sequencing. PloS One 11, e0157656. doi: 10.1371/journal.pone.0157656
Jinxia P., Pinyuan W., Bin Z., et al. (2015). Gonadal transcriptomic analysis and differentially expressed genes in the testis and ovary of the pacific white shrimp (Litopenaeus vannamei). BMC Genomics. doi: 10.1186/s12864-015-2219-4
Kang B. J., Okutsu T., Tsutsui N., Shinji J., Bae S. H., Wilder M. N. (2014). Dynamics of vitellogenin and vitellogenesis-inhibiting hormone levels in adult and subadult whiteleg shrimp, litopenaeus vannamei: relation to molting and eyestalk ablation. Biol. Reprod. 90, 12. doi: 10.1095/biolreprod.113.112243
Lee C. Y., Lee B. D., Na J. C., An G. (2010). Carotenoid accumulation and their antioxidant activity in spent laying hens as affected by polarity and feeding period. Asian Australas. J. Anim. Sci. 23, 799–805. doi: 10.5713/ajas.2010.90296
Liaaen-Jensen S. (1997). Stereochemical aspects of carotenoids. Pure Appl. Chem. 69, 2027–2038. doi: 10.1351/pac199769102027
Lin K. H., Lin K. C., Lu W. J., Philip-Aloysius T., Thanasekaran J., Joen-Rong S. (2015). Astaxanthin, a carotenoid, stimulates immune responses by enhancing IFN-γ and IL-2 secretion in primary cultured lymphocytes in vitro and ex vivo. Int. J. Mol. Sci. 17, 44. doi: 10.3390/ijms17010044
Li Y. T., Tang B. P., Zhang S. P., Tang Y. Y., Zhang M. L. (2021). Transcriptome analysis of immune-related genes in sesarmops sinensis hepatopancreas in reaction to peptidoglycan challenge. Genomics 946–954. doi: 10.1016/j.ygeno.2021.01.011
Luo X., Chen T., Zhong M., Jiang X., Zhang L., Ren C., et al. (2015). Differential regulation of hepatopancreatic vitellogenin (VTG) gene expression by two putative molt-inhibiting hormones (MIH1/2) in pacific white shrimp (Litopenaeus vannamei). Peptides 68, 58–63. doi: 10.1016/j.peptides.2014.11.002
Mak A. S., Choi C. L., Tiu S. H., Hui J. H., He J. G., Tobe S. S., et al. (2005). Vitellogenesis in the red crab charybdis feriatus: Hepatopancreas-specific expression and farnesoic acid stimulation of vitellogenin gene expression. Mol. Reprod. Dev. 70, 288–300. doi: 10.1002/mrd.20213
M V., L R., L O. (1988). And quantitative variations in carotenoid pigments in the ovary and. - Arch. Int. Physiol. Biochim. 96 (5), 155–164.
Nagaraju G. P. (2011). Reproductive regulators in decapod crustaceans: an overview. J. Exp. Biol. 214, 3–16. doi: 10.1242/jeb.047183
Ni J. B., Zeng Z., Kong D. Z., Hou L., Huang H. Q., Ke C. H. (2014). Vitellogenin of fujian oyster, crassostrea angulata: Synthesized in the ovary and controlled by estradiol-17 beta. Gen. Comp. Endocrinol. 202, 35–43. doi: 10.1016/j.ygcen.2014.03.034
Quackenbush L. S. (2001). Yolk synthesis in the marine shrimp, penaeus vannamei. Integr. Comp. Biol. 41, 458–464. doi: 10.1093/icb/41.3.458
Raviv S., Parnes S., Segall C., Davis C., Sagi A. (2006). Complete sequence of litopenaeus vannamei (Crustacea: Decapoda) vitellogenin cDNA and its expression in endocrinologically induced sub-adult females. Gen. Comp. Endocrinol. 145, 39–50. doi: 10.1016/j.ygcen.2005.06.009
Sachindra N. M., Bhaskar N., Mahendrakar N. S. (2005). Carotenoids in different body components of Indian shrimps. J. Sci. Food Agric. 85, 167–172. doi: 10.1002/jsfa.1977
Samuel Margueratjürg, Bähler J. (2010). RNA-Seq: from technology to biology. Cell. Mol. Life Sci 67, 569–579. doi: 10.1007/s00018-009-0180-6
Sittikankaew K., Pootakham W., Sonthirod C., Sangsrakru D., Yoocha T., Khudet J., et al. (2020). Transcriptome analyses reveal the synergistic effects of feeding and eyestalk ablation on ovarian maturation in black tiger shrimp. Sci. Rep. 10, 3239. doi: 10.1038/s41598-020-60192-2
Teruhisa K., Yoko K., Shimaya M., Simpson K. L, Chichester C. O. (1973). The biosynthesis of astaxanthin–XIV. the conversion of labelled β-carotene-15,15′-3H2 into astaxanthin in the crab, portunus trituberculatus. Comp. Biochem. Physiol. Part B Comp. Biochem and Molecular Biology 46, 269–272. doi: 10.1016/0305-0491(73)90317-9
Thongda W., Chung J. S., Tsutsui N., Zmora N., Katenta A. (2015). Seasonal variations in reproductive activity of the blue crab, callinectes sapidus: Vitellogenin expression and levels of vitellogenin in the hemolymph during ovarian development. Comp. Biochem. Physiol. Part A Mol. Integr. Physiol. 179, 35–43. doi: 10.1016/j.cbpa.2014.08.019
Tian X., Gautron J., Monget P., Pascal G. (2010). What makes an egg unique? clues from evolutionary scenarios of egg-specific genes. Biol. Reprod. 83, 893–900. doi: 10.1095/biolreprod.110.085019
Tiu S. H. K., Hui J. H. L., Mak A. S. C., He J.-G., Chan S.-M. (2006). Equal contribution of hepatopancreas and ovary to the production of vitellogenin (PmVg1) transcripts in the tiger shrimp, penaeus monodon. Aquaculture 254, 666–674. doi: 10.1016/j.aquaculture.2005.11.001
Tseng D. Y., Chen Y. N., Liu K. F., Kou G. H., Lo C. F., Kuo C. M. (2002). Hepatopancreas and ovary are sites of vitellogenin synthesis as determined from partial cDNA encoding of vitellogenin in the marine shrimp, penaeus vannamei. Invertebrate Reprod. Dev. 42, 137–143. doi: 10.1080/07924259.2002.9652770
Tsukimura B. (2001). Crustacean vitellogenesis: Its role in oocyte development. Integr. Comp. Biol. 41, 465–476. doi: 10.1093/icb/41.3.465
Tsutsui N., Ohira T., Okutsu T., Shinji J., Bae S. H., Kang B. J., et al. (2013). Molecular cloning of a cDNA encoding vitellogenesis-inhibiting hormone in the whiteleg shrimp litopenaeus vannamei and preparation of its recombinant peptide using an e. coli expression system. Fisheries Sci. 79, 357–365. doi: 10.1007/s12562-013-0603-z
Tufail M., Takeda M. (2008). Molecular characteristics of insect vitellogenins. J. Insect Physiol. 54, 1447–1458. doi: 10.1016/j.jinsphys.2008.08.007
Vogt G. (1994). Life-cycle and functional cytology of the hepatopancreatic cells of astacus astacus (Crustacea, decapoda). Zoomorphology 114, 83–101. doi: 10.1007/BF00396642
Vogt G. (2019). Functional cytology of the hepatopancreas of decapod crustaceans. J. Morphology 280, 1405–1444. doi: 10.1002/jmor.21040
Wade N. M., Gabaudan J., Glencross B. D. (2017). A review of carotenoid utilisation and function in crustacean aquaculture. Rev. Aquaculture 9(2), 141–156. doi: 10.1111/raq.12109
Wang W., Li B., Zhou T., Wang C., Chan S. (2020). Investigation of gene sequence divergence, expression dynamics, and endocrine regulation of the vitellogenin gene family in the whiteleg shrimp litopenaeus vannamei. Front. Endocrinol. 11. doi: 10.3389/fendo.2020.577745
Wang W., Wu X., Liu Z., Zheng H., Cheng Y. (2014). Insights into hepatopancreatic functions for nutrition metabolism and ovarian development in the crab portunus trituberculatus: gene discovery in the comparative transcriptome of different hepatopancreas stages. PloS One 9, e84921. doi: 10.1371/journal.pone.0084921
Wouters R., Molina C., Lavens P., Calderon J. (2001). Lipid composition and vitamin content of wild female litopenaeus vannamei in different stages of sexual maturation. Aquaculture 198, 307–323. doi: 10.1016/S0044-8486(01)00522-1
Yang Y., Zheng B., Bao C., Huang H., Ye H. (2016). Vitellogenin2: spermatozoon specificity and immunoprotection in mud crabs. Reproduction 152, 235. doi: 10.1530/REP-16-0188
Zhang X. J., Yuan J. B., Sun Y. M., Li S. H., Gao Y., Yu Y., et al. (2019). Penaeid shrimp genome provides insights into benthic adaptation and frequent. - Nat. Commun. 10 (1), 356. doi: 10.1038/s41467-018-08197-4
Zmora N., Trant J., Chan S. M., Chung J. S. (2007). Vitellogenin and its messenger RNA during ovarian development in the female blue crab, callinectes sapidus: gene expression, synthesis, transport, and cleavage. Biol. Reprod. 77, 138–146. doi: 10.1095/biolreprod.106.055483
Keywords: transcriptome, Litopenaeus vannamei, hepatopancreas, ovarian maturation, vitellogenesis, carotenoid
Citation: Li Z, Zhou M, Ruan Y, Chen X, Ren C, Yang H, Zhang X, Liu J, Li H, Zhang L, Hu C, Chen T and Wu X (2022) Transcriptomic analysis reveals yolk accumulation mechanism from the hepatopancreas to ovary in the pacific white shrimp Litopenaeus vannamei. Front. Mar. Sci. 9:948105. doi: 10.3389/fmars.2022.948105
Received: 19 May 2022; Accepted: 11 July 2022;
Published: 02 August 2022.
Edited by:
Naoaki Tsutsui, Mie University, JapanCopyright © 2022 Li, Zhou, Ruan, Chen, Ren, Yang, Zhang, Liu, Li, Zhang, Hu, Chen and Wu. This is an open-access article distributed under the terms of the Creative Commons Attribution License (CC BY). The use, distribution or reproduction in other forums is permitted, provided the original author(s) and the copyright owner(s) are credited and that the original publication in this journal is cited, in accordance with accepted academic practice. No use, distribution or reproduction is permitted which does not comply with these terms.
*Correspondence: Ting Chen, chan1010@scsio.ac.cn; Xugan Wu, xgwu@shou.edu.cn
†These authors have contributed equally to this work