Fine-scale foraging segregation in a green turtle (Chelonia mydas) feeding ground in the Bijagós archipelago, Guinea Bissau
 Fernando Miguel Madeira1*
  Rui Rebelo1
  Paulo Catry2
  João Neiva3 Castro Barbosa4
  Aissa Regalla4
  Ana Rita Patrício2,5
- 1Center for Ecology, Evolution and Environmental Changes (cE3c) & CHANGE - Global Change and Sustainability Institute, Faculdade de Ciências da Universidade de Lisboa, Lisbon, Portugal
- 2MARE – Marine and Environmental Sciences Centre / ARNET - Aquatic Research Network, Ispa – Instituto Universitário de Ciências Psicológicas, Sociais e da Vida, Lisbon, Portugal
- 3Centre of Marine Sciences (CCMAR), University of Algarve, Faro, Portugal
- 4Institute of Biodiversity and Protected Areas (IBAP) of Guinea-Bissau, Dr. Alfredo Simão da Silva, Bissau, Guinea-Bissau
- 5Centre for Ecology and Conservation, College of Life and Environmental Sciences, University of Exeter, Penryn, United Kingdom
Green turtles (Chelonia mydas) are highly dependent on neritic foraging areas throughout much of their life. Still, knowledge of recruitment dynamics, foraging habits, and habitat use in these areas is limited. Here, we evaluated how the distribution and food preferences of green sea turtles from different life stages varied within a foraging aggregation. We focused on two islands in Guinea-Bissau, Unhocomo and Unhocomozinho, using water captures and survey dives to record habitat use and characteristics, and stable isotopes to infer diet. Additionally, we used stable isotopes to infer their diet. Two habitat types were sampled: deeper (2.26 ± 0.4 m) rocky sites fringed by mangrove with macroalgae, and sandy shallows (1.37 ± 0.12 m) surrounded by rocky reefs with macroalgae and seagrass. The two benthic communities were similar isotopically and in terms of species composition, except for the presence or absence of seagrass, which had unique signatures. We captured 89 turtles ranging from 35 cm to 97 cm in curved carapace length (i.e., juvenile to adult stages). Size distribution was habitat-dependent, with most smaller turtles present in sandy shallows and larger turtles favoring slightly deeper rocky sites. Turtle isotopic signatures differed between the habitat of capture, regardless of size, revealing a marked dichotomy in foraging preference. All turtles fed primarily on macroalgae, mostly rhodophytes. However, individuals captured in sandy habitats had evident seagrass skewed isotopic signatures. Larger turtles may be unable to use the more diverse shallower foraging sites due to increased vulnerability to predation. Despite the proximity of the sampled foraging sites (2.7 km apart), the two foraging subgroups seem to maintain consistently different feeding habits. Our study highlights how heterogeneous green turtle foraging habits can be within populations, even at small geographic scales.
Introduction
Intraspecific differentiation of foraging behavior is a common phenomenon (Mattingly et al., 2004). Differences in nutritional needs and habitat use may be associated with sex, life stage, or the individual, and present unique ways to explore available resources (Agrawal, 2001; Vander Zanden et al., 2013). Juvenile animals, for example, can feed on sources not explored by adults or use habitats inaccessible to them, and vice versa (Werner and Gilliam, 1984; Ferreira et al., 2018). Intraspecific niche segregation is quite frequent among marine megafauna, and has been observed in most groups such as fish, birds, mammals, and reptiles (Breed et al., 2006; McClellan et al., 2010; Benjamins et al., 2015; Ferreira et al., 2018; de Lima et al., 2019; Louzao et al., 2019; Welsh and Mansfield, 2022).
SIA has been widely applied in trophic and dietary studies of marine megafauna (Boecklen, 2011; Haywood et al., 2019). In this group, observation of feeding events and assessment of foraging areas is often difficult or impossible and so, by analyzing the isotopic composition of tissue samples, it is possible to assess their trophic dynamics and cryptic lifestyles (Hatase et al., 2006; Vander Zanden et al., 2013; Burgett et al., 2018). The most common isotopes used in trophic studies are those of carbon and nitrogen (Lepoint et al., 2004; Boecklen, 2011) : stable carbon isotope ratios (δ13C) are linked to the baseline sources of trophic webs, being useful to trace back the origins of consumed resources (Layman et al., 2007), while stable nitrogen isotope ratios (δ15N) accumulate gradually along the food chain, being good indicators of the trophic level of a consumer (Deniro and Epstein, 1981). As the assimilation of these two isotopes follows somewhat predictable rules, it is possible to combine them to ascertain the place of an organism within its trophic web (Shimada et al., 2014; D’Ambra et al., 2015). Some of the drawbacks of SIA result from the complexity of trophic systems, which limit its resolution, especially when several resources have similar signatures or the trophic pathways are intertwined (Phillips and Gregg, 2003; Schmidt et al., 2003). However, when some of the consumed organisms have distinct isotopic signatures, it is possible to use them as tracers to establish the connections within the trophic web (Lepoint et al., 2004; Suzuki et al., 2008). For instance, seagrasses tend to have more depleted δ15N values and more enriched δ13C values than algae, which are functionally distinct (Welsh, 2000; Lepoint et al., 2004; Campbell and Fourqurean, 2009). This isotopic difference frequently makes them easily traceable along the trophic chains (Winning et al., 1999).
Over the last two decades, the use of SIA in marine turtle studies has been invaluable to elucidate their spatial, foraging, and trophic ecology (Reich et al., 2007; Pearson et al., 2017; Haywood et al., 2019) . For green turtles (Chelonia mydas, Linnaeus, 1758), regarding foraging ecology alone, SIA has helped us uncover just how heterogenous their feeding habits can be (Esteban et al., 2020). Within populations, heterogeneity of foraging habits can range from ontogenetic differences in diet (Burgett et al., 2018), to unexpected pelagic feeding of previously thought obligate herbivore adults (Hatase et al., 2006), to sex-specific trophic variation (Roche et al., 2021). These differences can sometimes be significant within relatively small geographic scales, such as on the opposite shores of a single island (Hancock et al., 2018) or even within a single foraging area, diverging between individuals or age groups (Vander Zanden et al., 2013). This complexity hinders the generalization of what is an adequate habitat across world regions for this species and reinforces the need for in-loco assessments.
Previous surveys identified a green turtle foraging aggregation around the islands of Unhocomo and Unhocomozinho, Guinea Bissau (Catry et al., 2009; Patrício et al., 2022), but their foraging habits remain for the most part unknown. We conducted in-water surveys in four foraging sites around these islands aiming to (1) characterize available foraging habitats (2) describe the size structure of foraging green turtles and (3) use SIA to assess the isotopic niches, potential diet of turtles, and potential ontogenetic and habitat-related differences. This study provides the first integrative insight into the influence of local habitat characteristics and benthic communities on the trophic habits of a foraging aggregation of green turtles in the Bijagós archipelago, a globally key area for this species.
Materials and methods
Study area
The Bijagós Archipelago, Guinea-Bissau, West Africa, is recognized as an important nesting area for green turtles and hosts one of the largest green turtle rookeries in the Atlantic and worldwide, at Poilão island (Barbosa et al., 1998; Catry et al., 2002; Catry et al., 2009). We conducted sea turtle captures in the shallow waters surrounding Unhocomo and Unhocomozinho (N11°31’, W16°40’), the two westernmost islands of the Bijagós Archipelago in Guinea-Bissau (Figures 1A, B) and a known foraging aggregation for this species (Monteiro et al., 2021; Patrício et al., 2022). The combined area of both islands is approximately 20.79 km2, with a 47 km coastline fringed by a mix of mangroves, rock, mud flats, and sandy beaches.
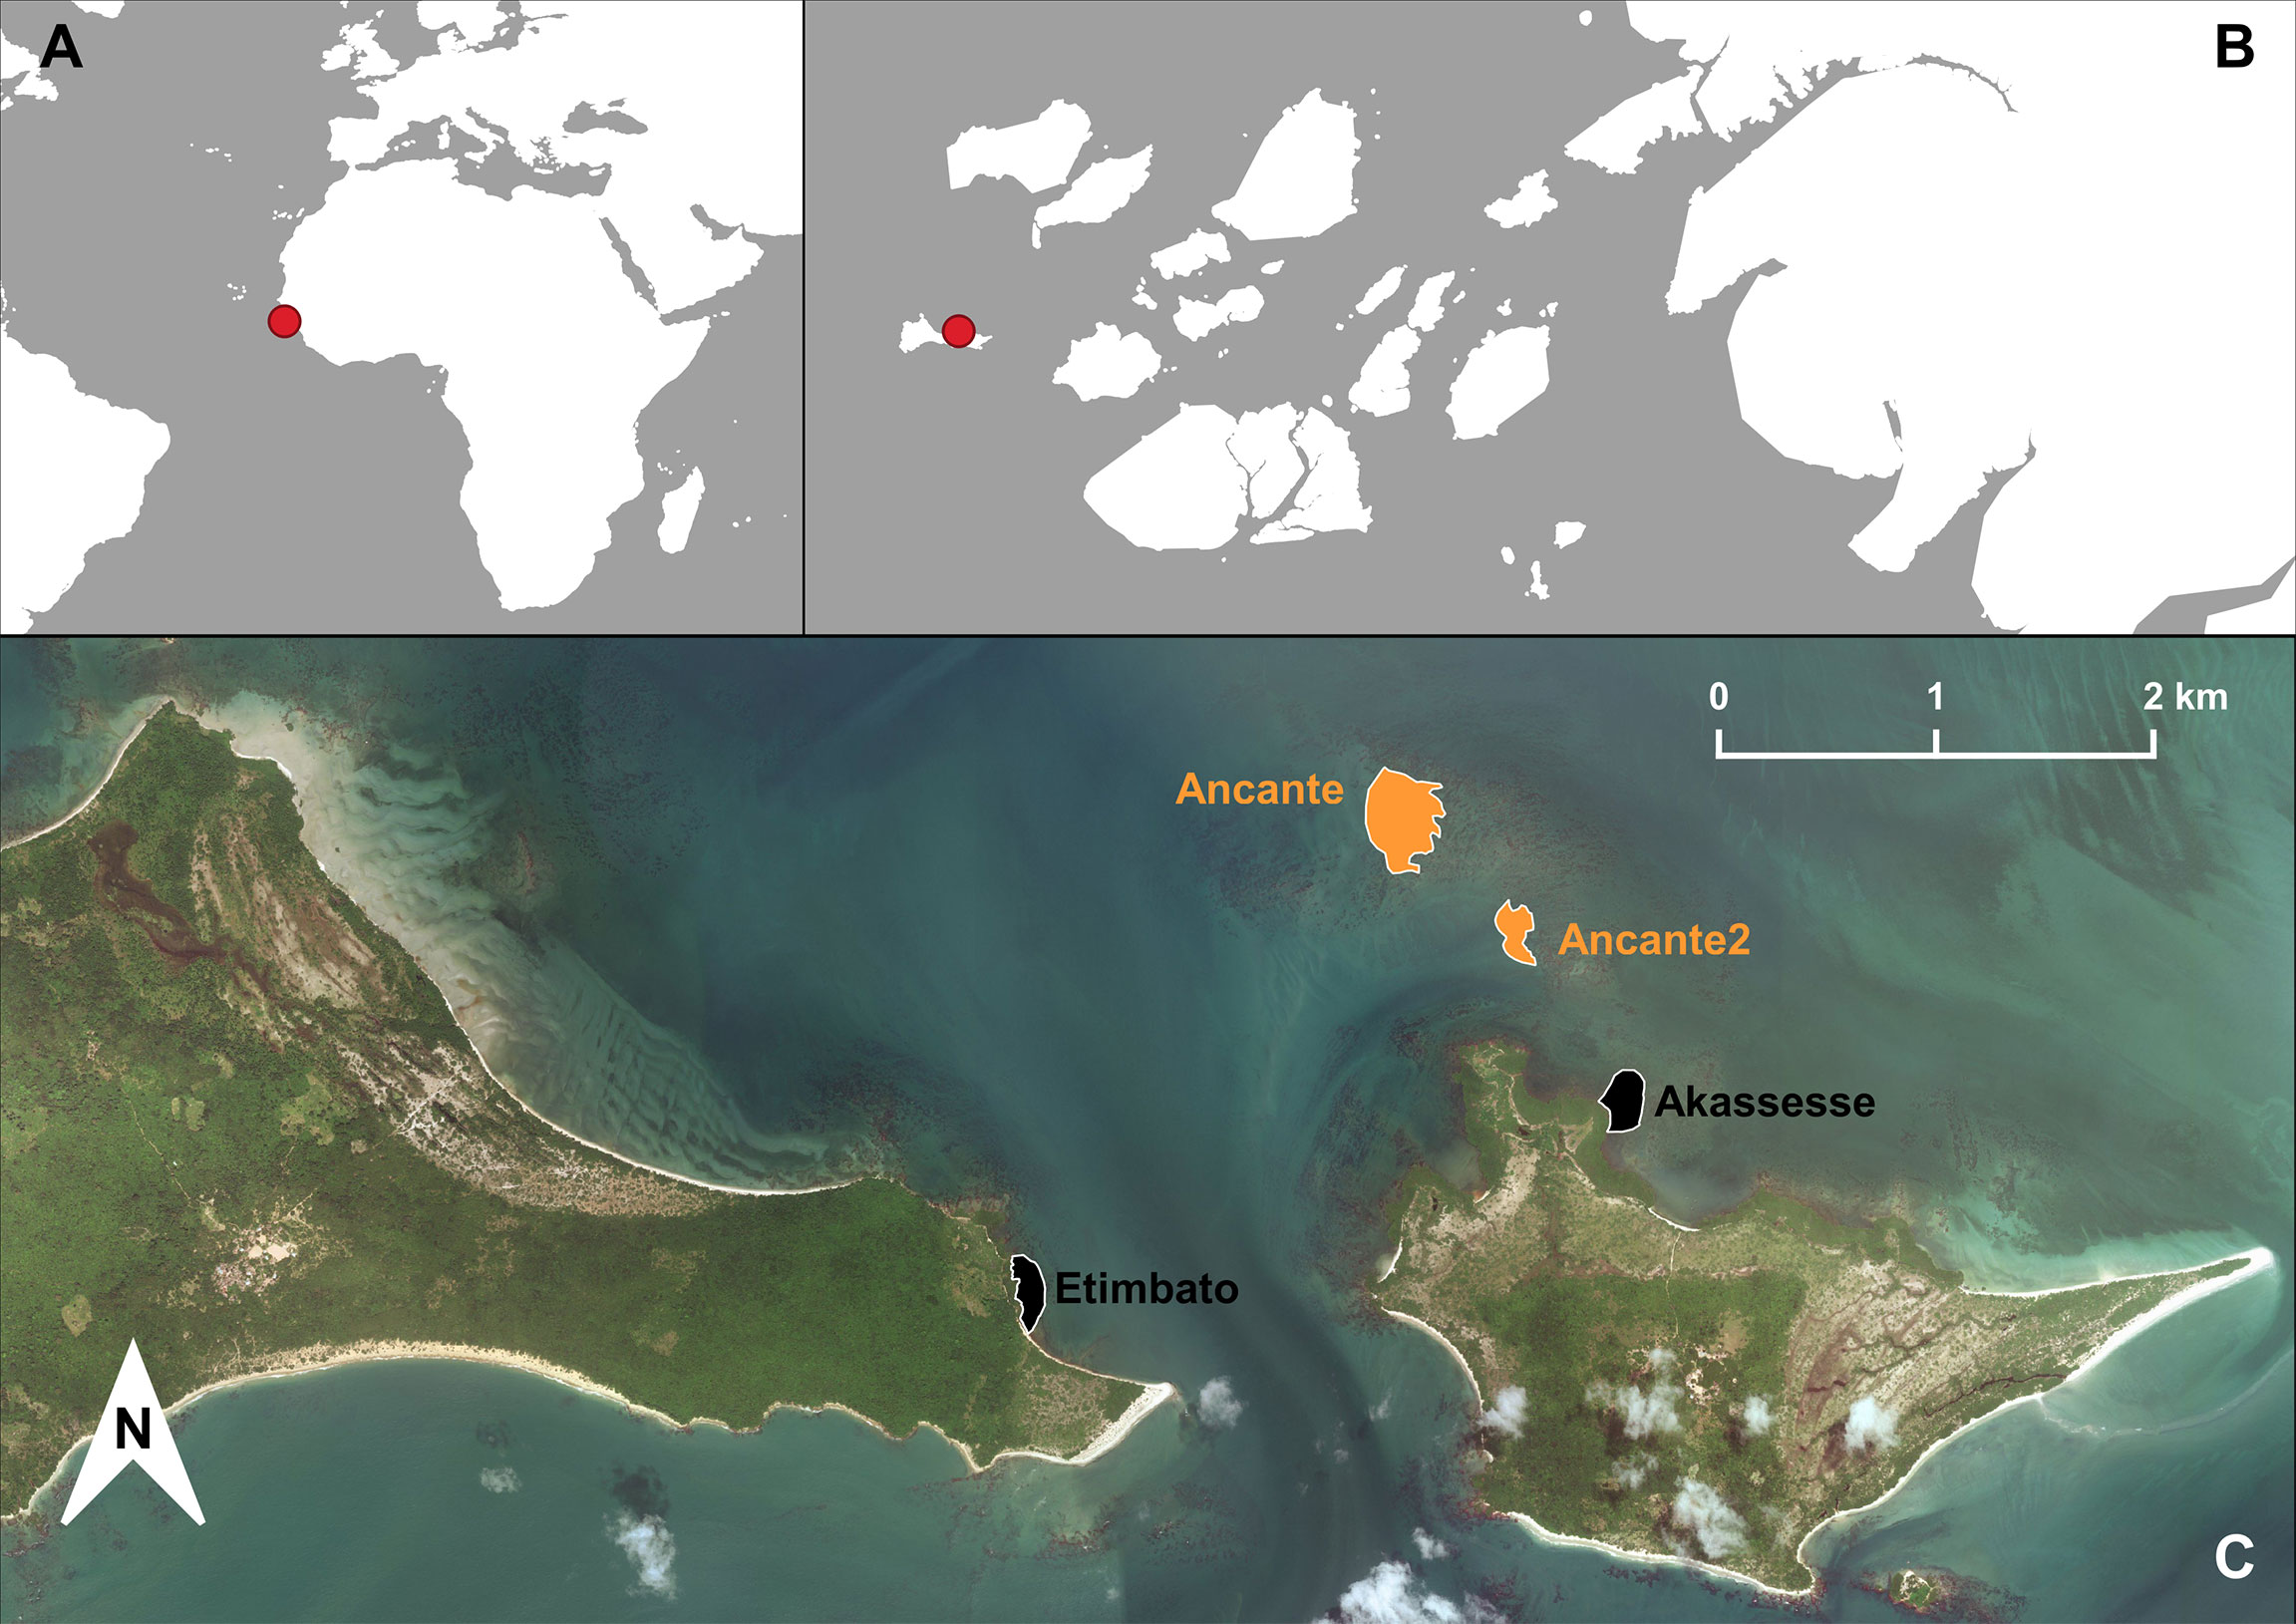
Figure 1 (A, B) Relative location of Unhocomo and Unhocomozinho islands in the Bijagós, Guinea-Bissau. (C) Sampled green turtle foraging sites, with respective area name, color labeled by habitat type: black – rocky-bottom; orange – sandy-bottom.
Turtle capture and sampling
We conducted four capture sessions, spanning between 4 to 5 days each, on 18-22 March and 21-25 October of 2018 and 25-28 March and 27-30 October of 2019. March and October correspond to the end of the dry and wet seasons, respectively. With the help of local fishers, we identified four locations with features appropriate for siege fishing and where the presence of immature turtles was known (Figure 1C). Being relatively shallow, these sites are mainly used by turtles during high tide, such as in other foraging grounds (Brand-Gardner et al., 1999; Pillans et al., 2021). We enclosed each site with a net (800 m long, 4 m height, 20 cm mesh size), deployed from a pirogue. A Garmin MAP64 was used to take GPS points at regular intervals along with the net. We recorded depth by using a weighted knotted rope at 3 random points inside the netted area at the beginning of each capture session. As the tide receded, the fishing net remained deployed for approximately 1 hour, being constantly monitored for turtles. Whenever one was found, it was captured using the “rodeo” method (Limpus et al., 1994) and brought to a logistic vessel for processing. We measured turtle curved carapace length (CCL, from the nuchal scute to the edge of the posterior marginal scutes) using a flexible tape to the nearest 0.1 cm. We applied metal flipper tags and PIT tags as in Balazs, 1999, and photographed the carapace and head for posterior visual photo-ID. We opted to only place flipper tags in turtles longer than 40 cm CCL since it is not advised to tag smaller turtles (Eckert and Beggs, 2006). Finally, we collected an epidermis sample from the right shoulder of each turtle using a sterile scalpel blade.
Benthic macrophytes and local community
To characterize the benthic vegetation, we placed a quadrat (50 x 50 cm, subdivided with a 10 x 10 cm grid) at 30 random locations at each sampling site. Through snorkeling, we noted all visually identifiable algae and seagrass taxa in the large quadrat, as well as the percent cover by algae/seagrass, rock, or sand, estimated by counting the number of grid cells. Whenever there was evidence of turtle grazing - short, cropped stalks, pulled root systems, or bite marks in the sand - we noted the species grazed. At each capture site, we gathered up to five samples of each main macroalgae species, as well as seagrass and mangrove leaves (Rhizophora sp.), when present. We repeated this in all sampling missions. We selected for stable isotope analysis all vegetation species with apparent turtle grazing marks and/or known to be fed upon by green turtles at this location (Díaz-Abad et al., 2022). We also included mangrove to discard its potential presence in the diet of the turtles. To better encompass the isotopic range of the local community and to estimate the position of the green turtles within it, we collected additional samples from other animals (up to five per species) at each site during both 2019 missions: epibenthic microalgae feeding gastropods (Cerithium sp.), mangrove snails (Littoraria sp.), the benthic invertebrate specialist West African spadefish (Chaetodipterus lippei) (Longhurst, 1957) and two active predatory fish species (family Carangidae, genera Trachinotus, and Alectis).
Sample preparation
We dried both vegetation and animal tissue samples in situ for immediate conservation. In the lab, we rinsed the samples with distilled water, dried them at 60°C for 24h, and stored them at -20°C. We dusted off algae and seagrass samples and removed all visible epiphytes before grinding the samples in a ball mill. For animal tissue (turtle, snails, and fish), we removed the outer skin/shell and selected the muscle tissue which we finely diced with a scalpel blade. Animal tissue samples with a high lipidic content tend to have depleted 13C values (Post et al., 2007), which may bias analysis. To confirm if lipid extraction was required, or if correction factors were necessary, we performed validation experiments and adjusted the data accordingly (see Supplementary materials, S1).
We weighed 0.75 to 1 mg of material for animal samples, and 4 to 5 mg for algae/seagrass samples into tin capsules with a microbalance, sealed and analyzed them for carbon and nitrogen. We determined the isotopic composition of the samples through mass spectrometry by continuous flow mode (CF-IRMS) (Preston and Owens, 1983) on a Sercon Hydra 20-22 (Sercon, UK) stable isotope ratio mass spectrometer, coupled to a EuroEA (EuroVector, Italy) elemental analyzer for online sample preparation by Dumas combustion. We calculated the ratios according to Michener and Lajtha (2007) as δ = [(Rsample e Rstandard)/Rstandard], where R is the 15N/14N or 13C/12C ratio. δ15N values were referred to atmospheric N2 while δ13C were referred to PeeDee Belemnite (PDB). We determined the precision of the isotope ratio analysis using values from six to nine replicates of laboratory standard material randomly spread between samples in every batch analysis. We used Casein OAS (Elemental Microanalysis, UK) and IAEA Casein (IAEA, Vienna, Austria) for the animal samples and Wheat Flour OAS (Elemental Microanalysis, UK) for the algae/seagrass samples. Accuracy between runs was 0.06 ± 0.04‰ for δ15N and 0.05 ± 0.02‰ for δ13C in animal samples; 0.04 ± 0.02‰ for δ15N and 0.06 ± 0.05‰ for δ13C in algae/seagrass samples. We performed these analyses on the CRIE (Center for Resources in Stable Isotopes) of the Center for Ecology, Evolution, and Environmental Change (cE3c) of the Faculty of Sciences of the University of Lisbon (FCUL).
Data analysis
We tested for differences in green turtle sizes between habitats using a Mann- Whitney U-test. Given the differences in sample size between the two habitats, we used a 2500-iteration bootstrap with replacement (simpleboot, Peng, 2019), to evaluate if mean size differences remain with adjusted sample size (see Supplementary materials, Figure S2). We considered turtles measuring between 35-40 cm CCL as recruits (range of green turtle sizes at recruitment, Reisser et al., 2013; Musick and Limpus, 2017), and classified all juveniles longer than 65 cm CCL as subadults (Limpus and Chaloupka, 1997; Monteiro et al., 2021). To better infer diet throughout juvenile growth, we divided juveniles (between recruits and subadults) into three size classes (40-50, 50-60, and 60-65 cm in CCL) and the remaining into subadults (65-80 cm CCL) and adults (> 80 cm CCL). To classify large turtles as potential reproducing adults, we used the sizes of breeding adults recorded at the island of Poilão, the most important green turtle nesting site in the archipelago, as a reference. We assumed turtles to be potential breeding adult females if CCL was longer than 81 cm (smallest observed CCL for nesting females at Poilão, F.M. Madeira personal observation) and no male characteristics were present (i.e. elongated tail) or males if larger than 83 cm CCL (minimum male size observed on mating aggregations at Poilão; IBAP, unpublished data) with obvious male phenotype.
Using Welch ANOVAs, we tested the variation in δ13C and δ15N signatures between the different size classes. We also tested for differences in the isotopic signatures of turtles from each habitat using a Mann-Whitney U-test for each size class, excluding recruits and individuals above 65cm CCL which were practically absent from sandy-bottom sites.
Using the Stable Isotope Bayesian Ellipses Package V.2.1.5 (SIBER, Jackson et al., 2011) available in R V.4.0.3 (R Core Team, 2020) we estimated recruit isotopic niche and compared the variation and overlap of isotopic niches from juvenile turtles captured in different habitats. This approach fits, through Bayesian inference, bivariate ellipses to isotopic data to calculate and compare isotopic niches (Jackson et al., 2011). Due to the low sample size in all groups (n < 50), standard ellipse areas (SEA) were corrected (SEAc) using the formula SEAc = SEA (n − 1)(n − 2)−1 (Jackson et al., 2011, Syväranta et al., 2013). Based on grazing evidence in the field and previous data (Díaz-Abad et al., 2022), the taxa Laurencia sp. (rhodophyte), tribe Dictyoteae (ochrophyte, including Canistrocarpus cervicornis, Dictyota ciliolata, Dictyota cf. rigida), Caulerpa serturalioides (chlorophyte) and Halodule wrightii (the single seagrass species in this area) were selected as representative dietary items for SIA.
We assessed the dietary importance of these food sources using the R package ‘MixSIAR’ V3.1.12 (Stock and Semmens, 2018). This Bayesian-mixing model uses source isotopic signatures from food to calculate their potential diet contribution while accounting for the trophic enrichment factor due to assimilation by the consumer. We calculated tissue-specific trophic enrichment factor for turtle epidermis using the values published by Seminoff et al., 2006 (juveniles: +0.17 ± 0.03‰ for δ13C, +2.80 ± 0.11‰ for δ15N) and Vander Zanden et al., 2012 (Juveniles: +1.87 ± 0.56‰ for δ13C and +3.77 ± 0.40‰ for δ15N; Adults: +1.62 ± 0.61‰ for δ13C and +4.04 ± 0.44 ‰ for δ15N). We used a concentration-dependent mixing model given that the dietary items sampled belonged to distinct functional groups, such as different macroalgae groups and a vascular plant (Phillips et al., 2014). Given that the isotopic turnover for skin of rapidly growing juvenile marine turtles is three to four months (Reich et al., 2008; Seminoff et al., 2021), corresponding to around 3 cm of growth (Bjorndal and Bolten, 1988), we assumed that turtles within the recruit size class would not have had time to assimilate local isotopic signatures, thus, we excluded them from MixSIAR analyses.
Data are presented as mean ± standard deviation unless otherwise stated.
Results
Foraging habitat
The four sampling sites consisted of two main habitat categories: two coastal sites, adjacent to mangroves (Rhizophora sp.), with rocky sea floors dominated by macroalgae including occasional large and dense patches of Caulerpa sertularioides (Table 1); two more offshore mostly sandy shoals surrounded by reefs exposed in the low tide, with extensive but low-density seagrass patches, and sparse rocks covered in macroalgae (Table 1). Rocky-bottom sites were deeper (Table 1), with the minimum depth at these sites (range: 1.7 m - 3 m) being higher than the maximum depth recorded at sandy-bottom sites (range: 1.3 m - 1.5 m). Despite having mostly the same assemblage of algae/seagrass (Figure 2), we found a higher species richness per sampling point at the sandy-bottom habitat (3.22 ± 1.75 species compared to 1.96 ± 1.23 at the rocky-bottom). There, 10 out of the 16 species occurred more frequently, growing on the sparce rocks, being the most frequent groups seagrass (Halodule wrightii in 60%) and brown algae (two species of the family Dictyotaceae present in 65% and 58% of the points). The rocky habitat in its turn was dominated by red and green algae (Spyridia sp. in 48% of the points, C. sertularioides in 42%, and Acanthophora spicifera in 36%). There were evident signs of grazing in the dense patches of C. sertularioides and the patches of H. wrightii.
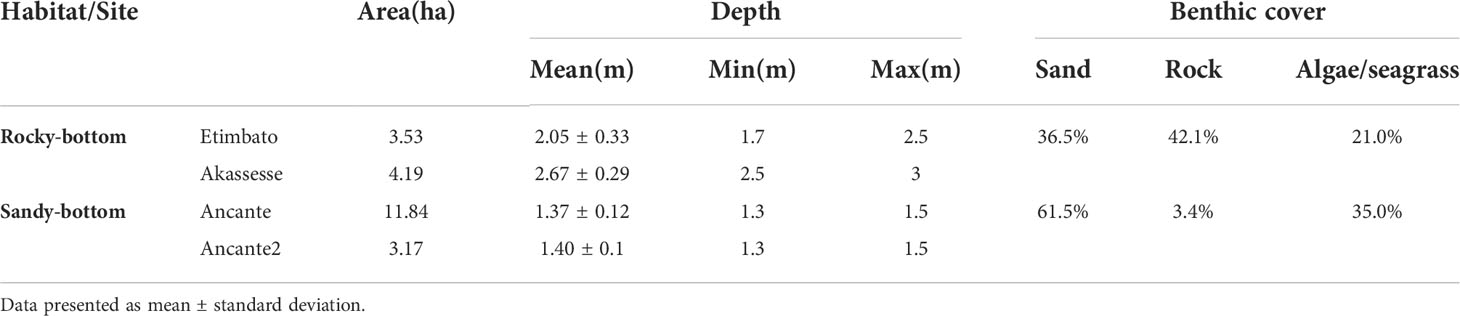
Table 1 Characteristics of two green turtle foraging habitat types surveyed at Unhocomo and Unhocomozinho islands, Guinea-Bissau.
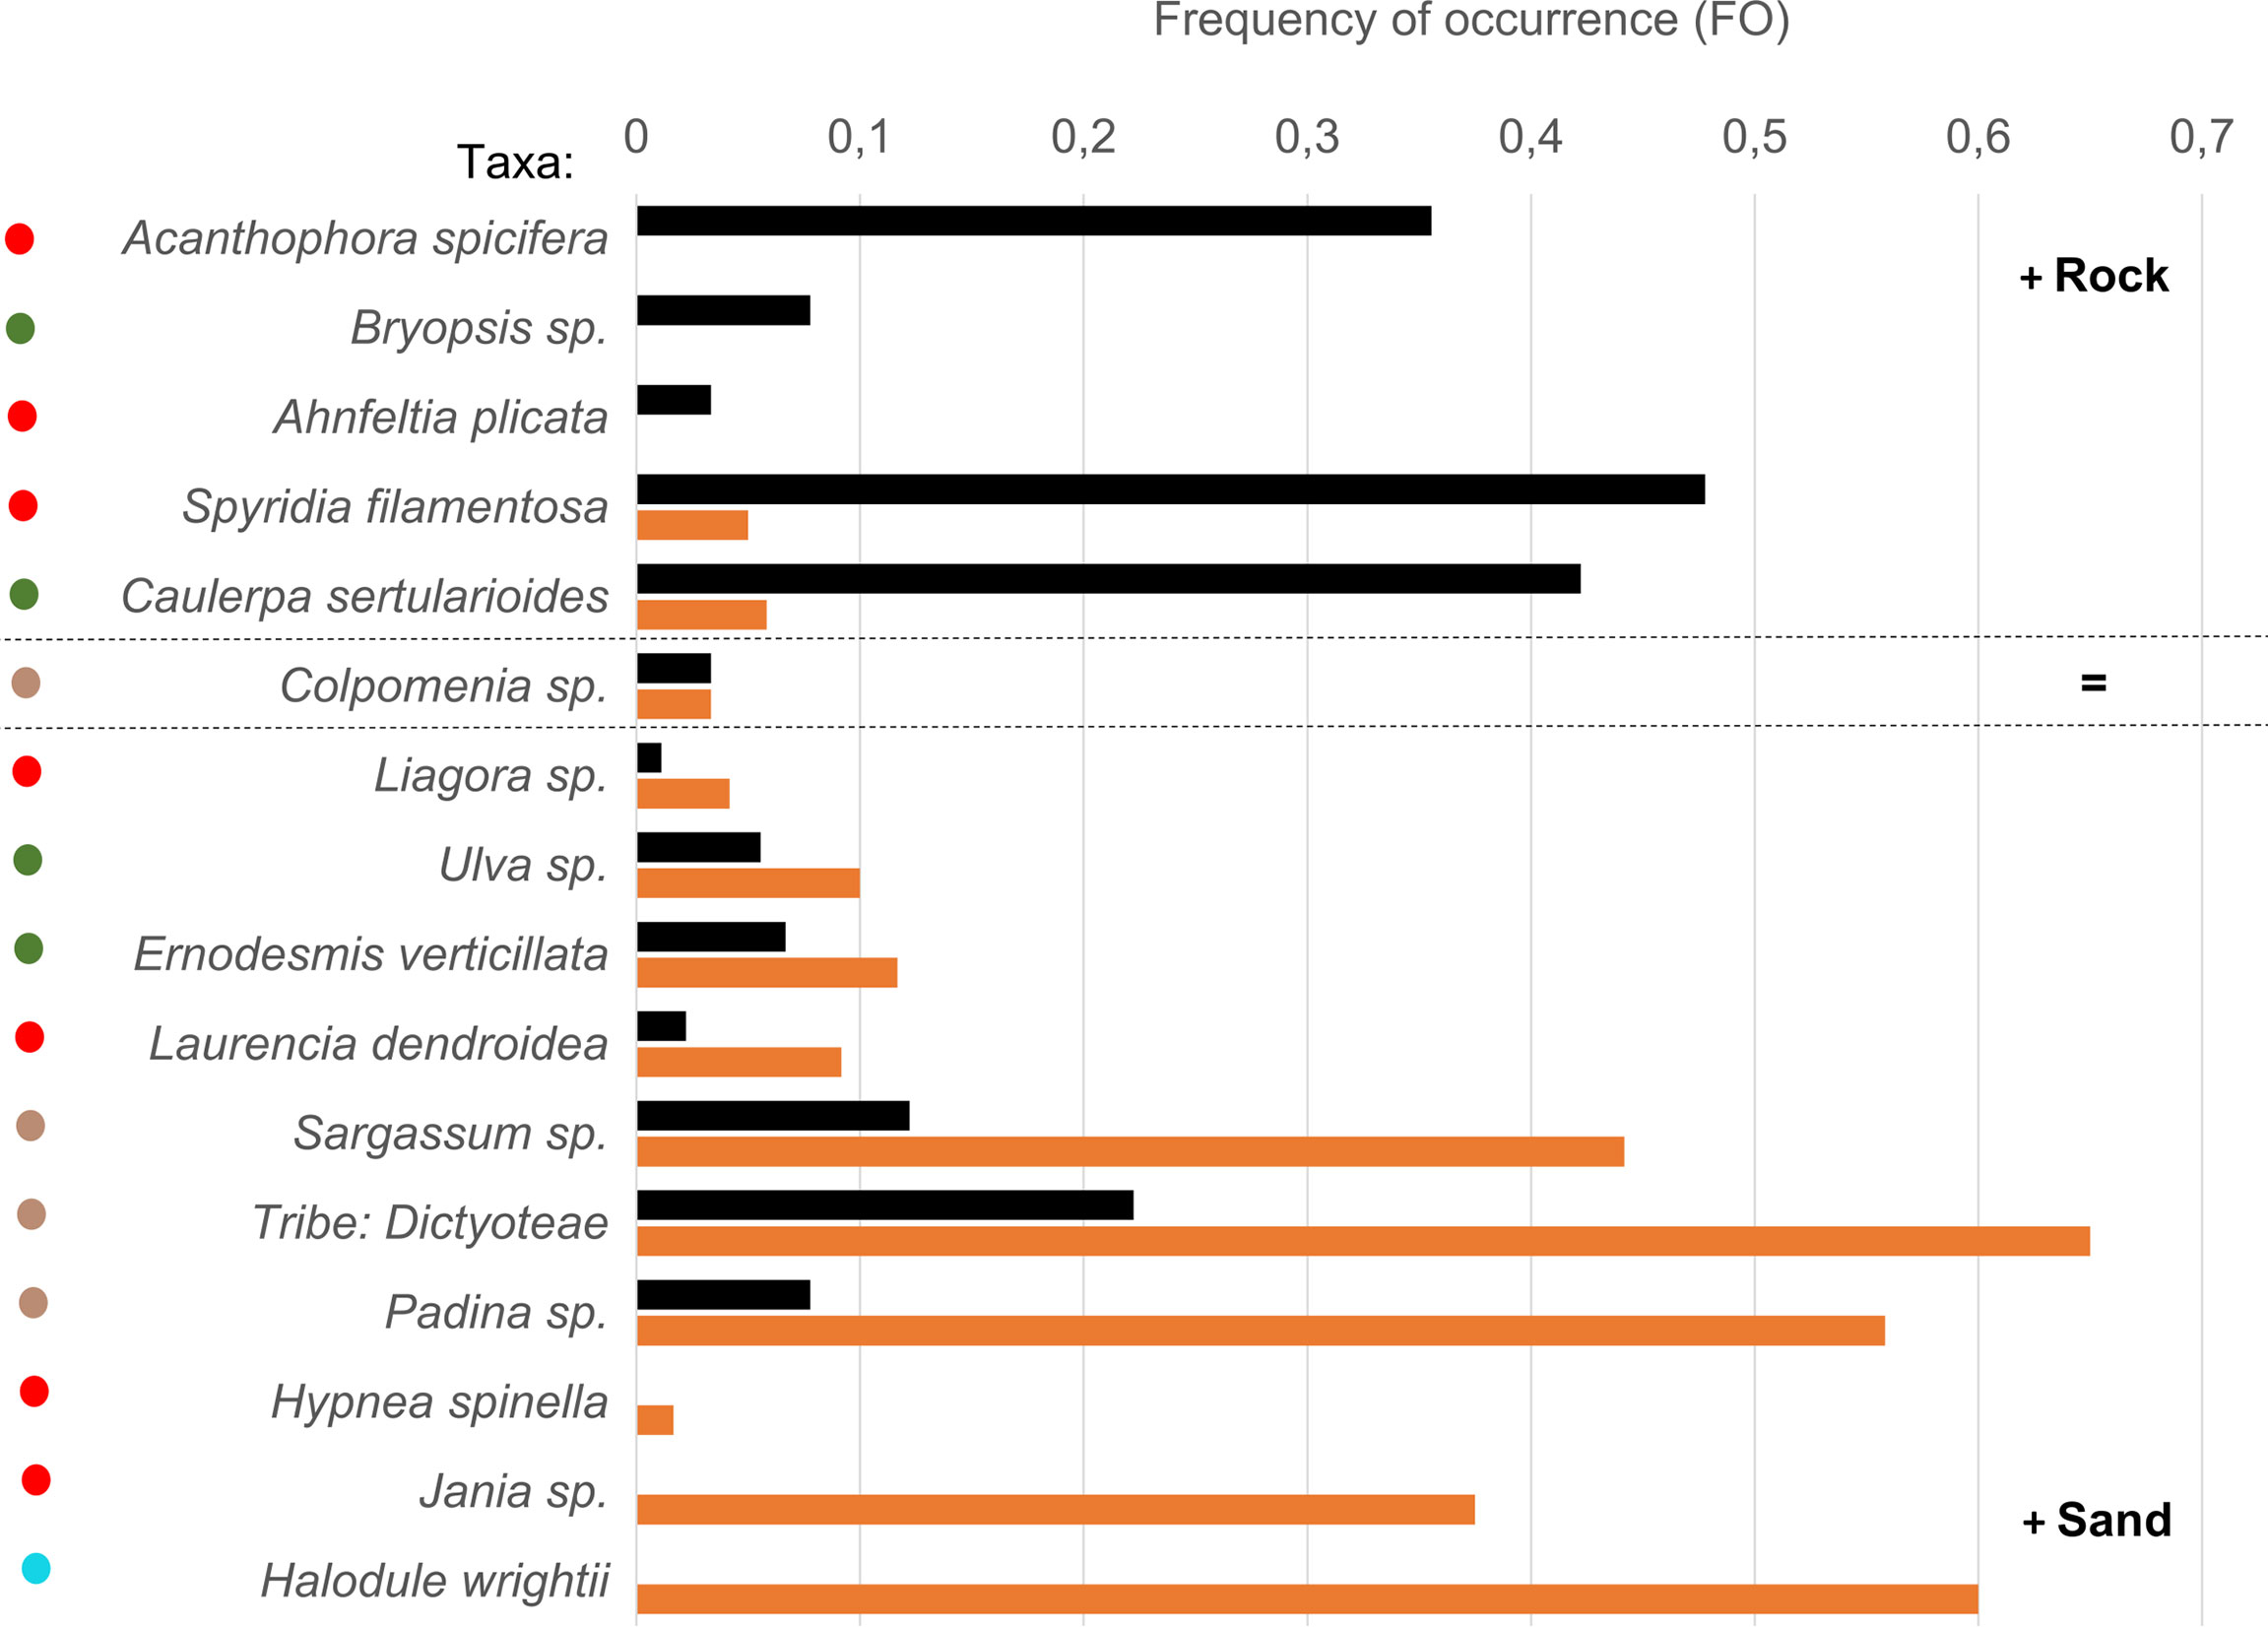
Figure 2 Frequency of occurrence of the benthic algae/seagrass taxa identified at Unhocomo and Unhocomozinho green turtle foraging grounds. Taxa are ordered from top to bottom from most common at the rocky-bottom habitat (black) to most common at sandy-bottom habitat (orange). Color coding on the left represents taxonomic groups – red, rhodophyta; green, chlorophyta; brown, ochrophyta; blue, tracheophyta (seagrass).
Green turtles
We captured 89 green turtles with sizes ranging from 35 cm to 97 cm curved carapace length (CCL), being 40-50 cm the most common size class (Figure 3). More turtles were captured at the sandy shoals (57), with different mean sizes between habitat types (Mann- Whitney U= 520.5, P = 0.01). We found no effect of different sample sizes in this comparison (see Supplementary Materials S2, Figure 1). Smaller turtles were more frequent on the sandy shoals (47.94 ± 8.28 cm CCL, min. 35 cm, max. 67 cm), while larger turtles were more frequent on the deeper rocky locations (59.93 ± 17.01 cm CCL, min. 35 cm, max. 97 cm). Adult-sized turtles (2 males and 2 females) were captured exclusively in the deeper, rocky sites. Despite the sample size, and the considerable sampling effort, there was a single recapture of one juvenile (56.8 cm CCL on the recapture occasion), first captured in March 2019 and then in October of the same year, having grown 1.3 cm in seven months (mean growth rate of ~0.19 cm per month).
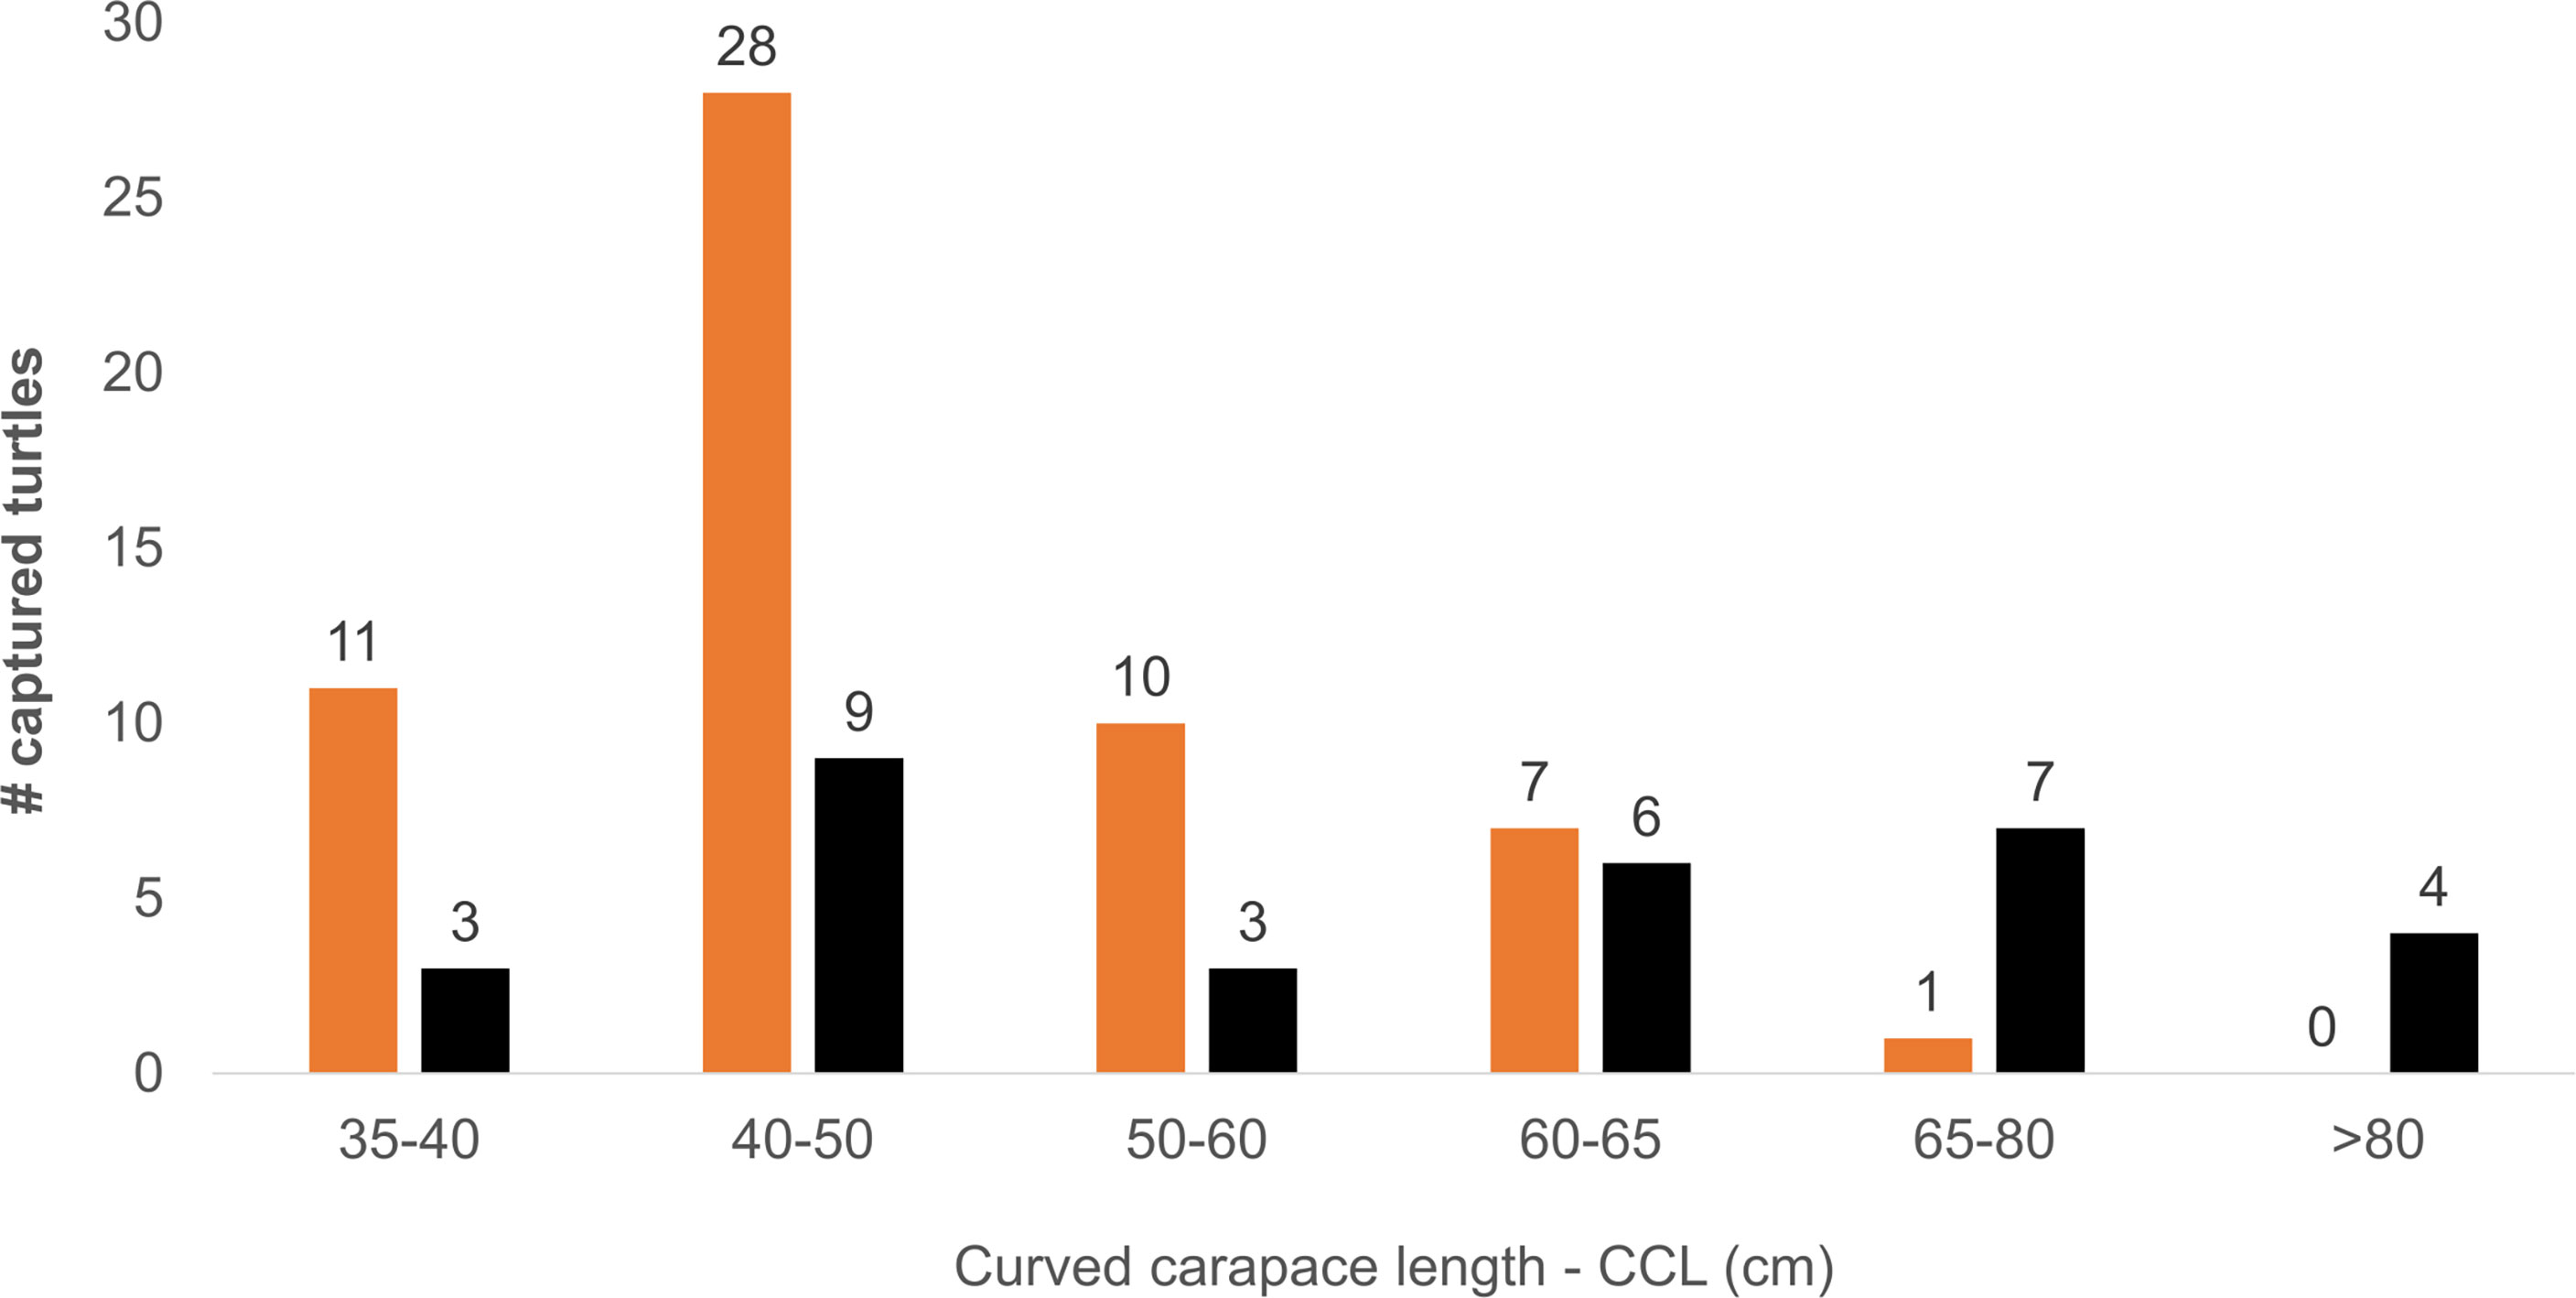
Figure 3 Size distribution of green turtles captured at foraging areas around Unhocomo and Unhocomozinho islands, Guinea-Bissau. Color indicates habitat of capture, black – rocky-bottom, orange – sandy-bottom.
Stable Isotope Analysis (SIA)
Concerning size, the carbon isotopic ratios (δ13C) of turtles between 50-60 cm CCL were significantly higher than those of the recruits (Welch ANOVA F: 3.63, df1 = 5, df2 = 18.90 P = 0.018; Figure 4; Table 2). Between habitats and considering only sizes between 40 and 65 cm CCL, there were differences in both isotopes (Figure 4), with all sandy site turtles having enriched δ13C values, and only the 60-65 cm CCL class having lower nitrogen isotopic ratios (δ15N).
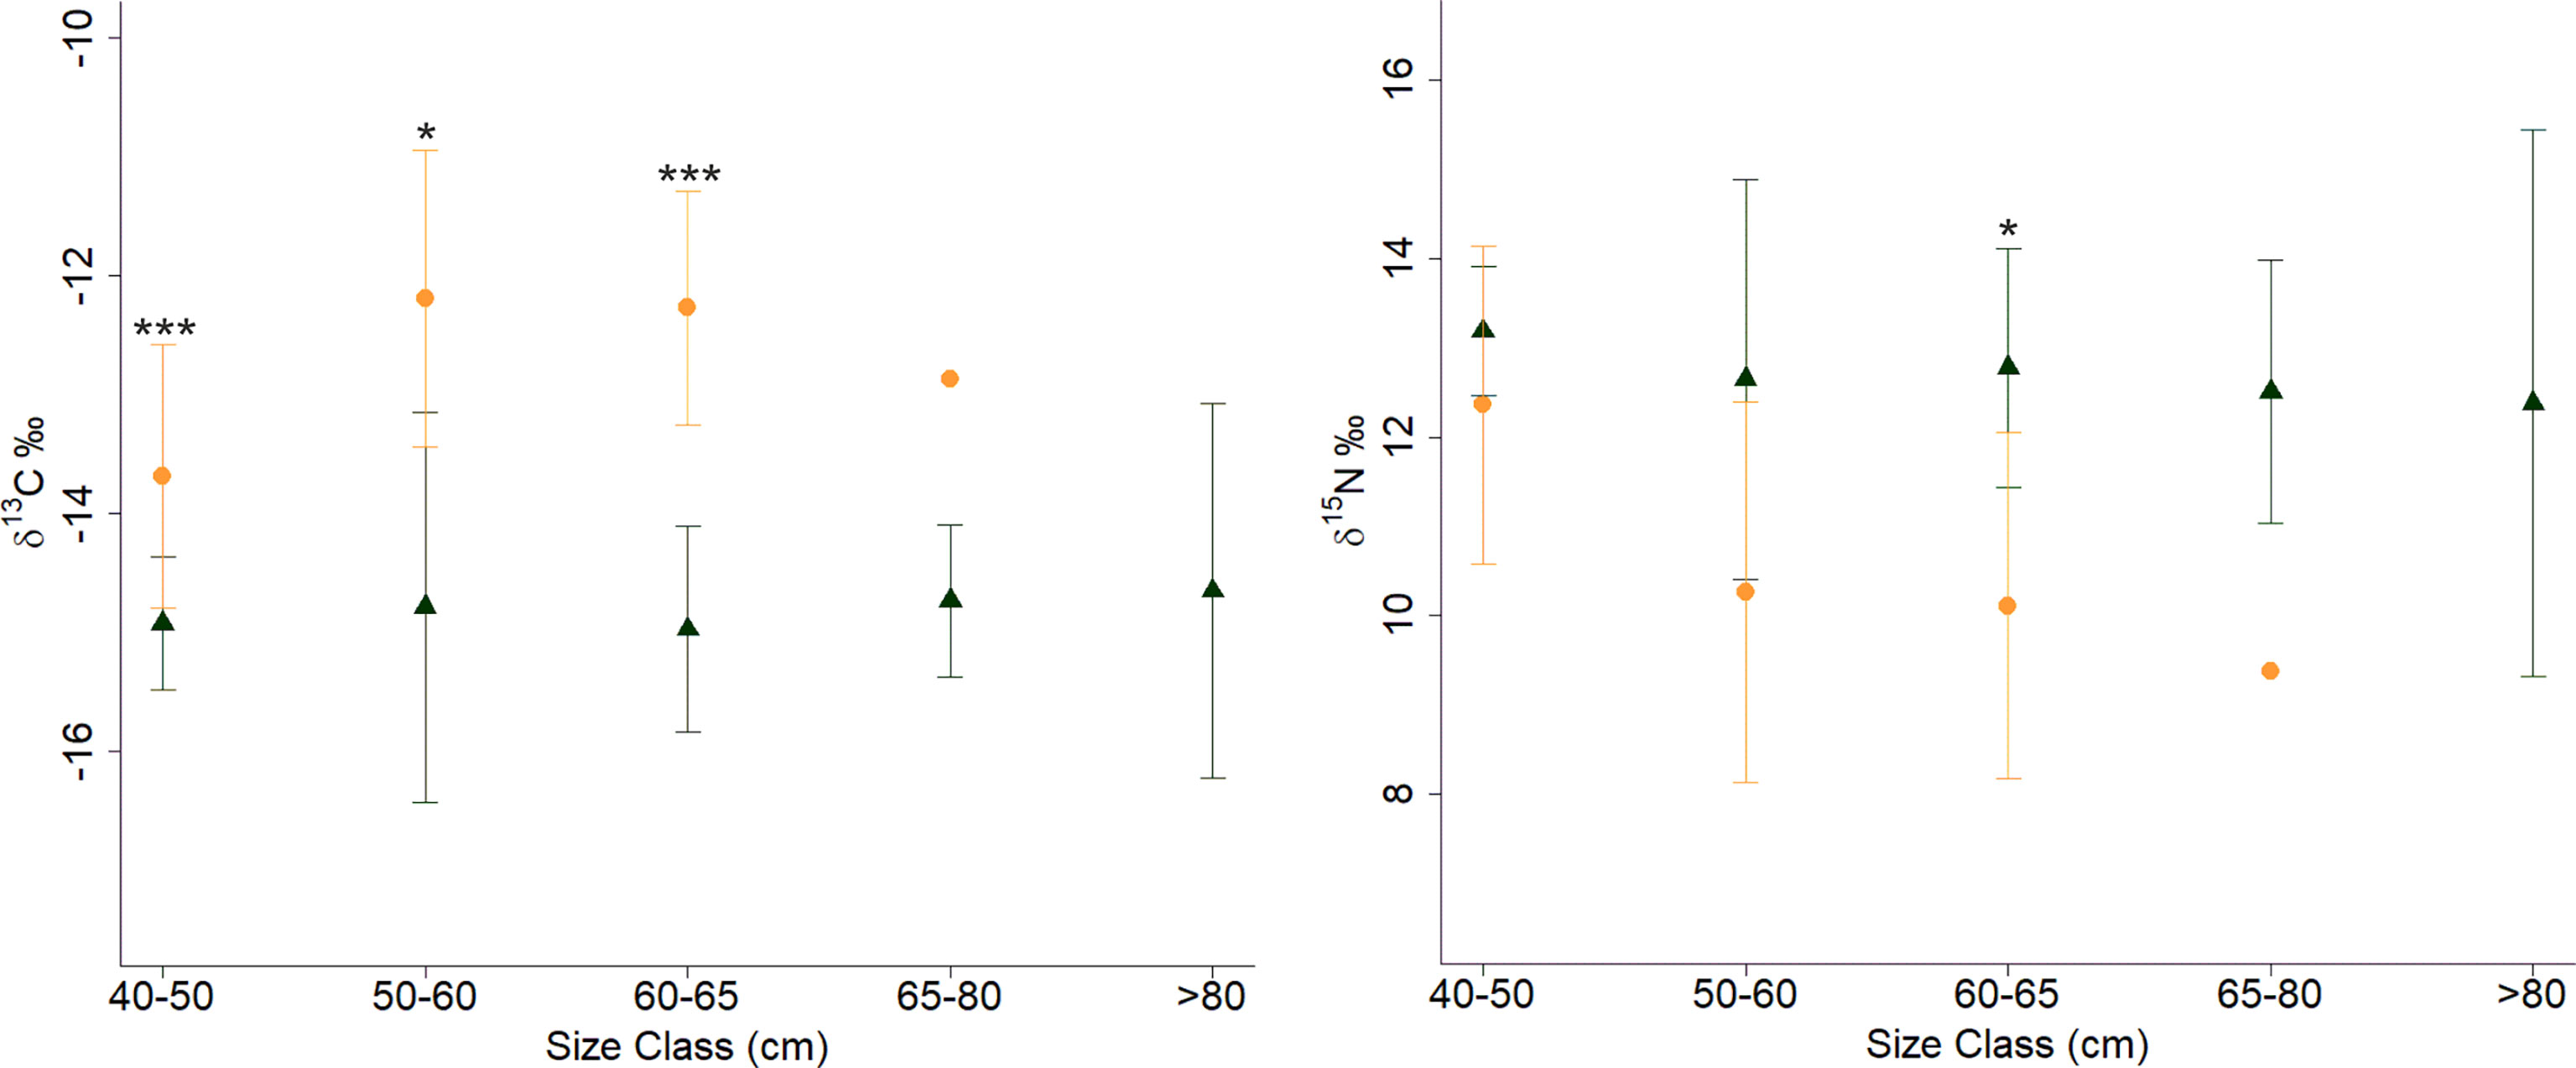
Figure 4 Carbon and nitrogen isotopic signatures (mean ± standard deviation) of green turtles from Unhocomo and Unhocomozinho foraging areas by curved carapace length (CCL, cm) size class. Color represents habitat of capture – black: rocky-bottom; orange: sandy-bottom. Statistically significance differences are represented as: *P < 0.05; ***P < 0.00.
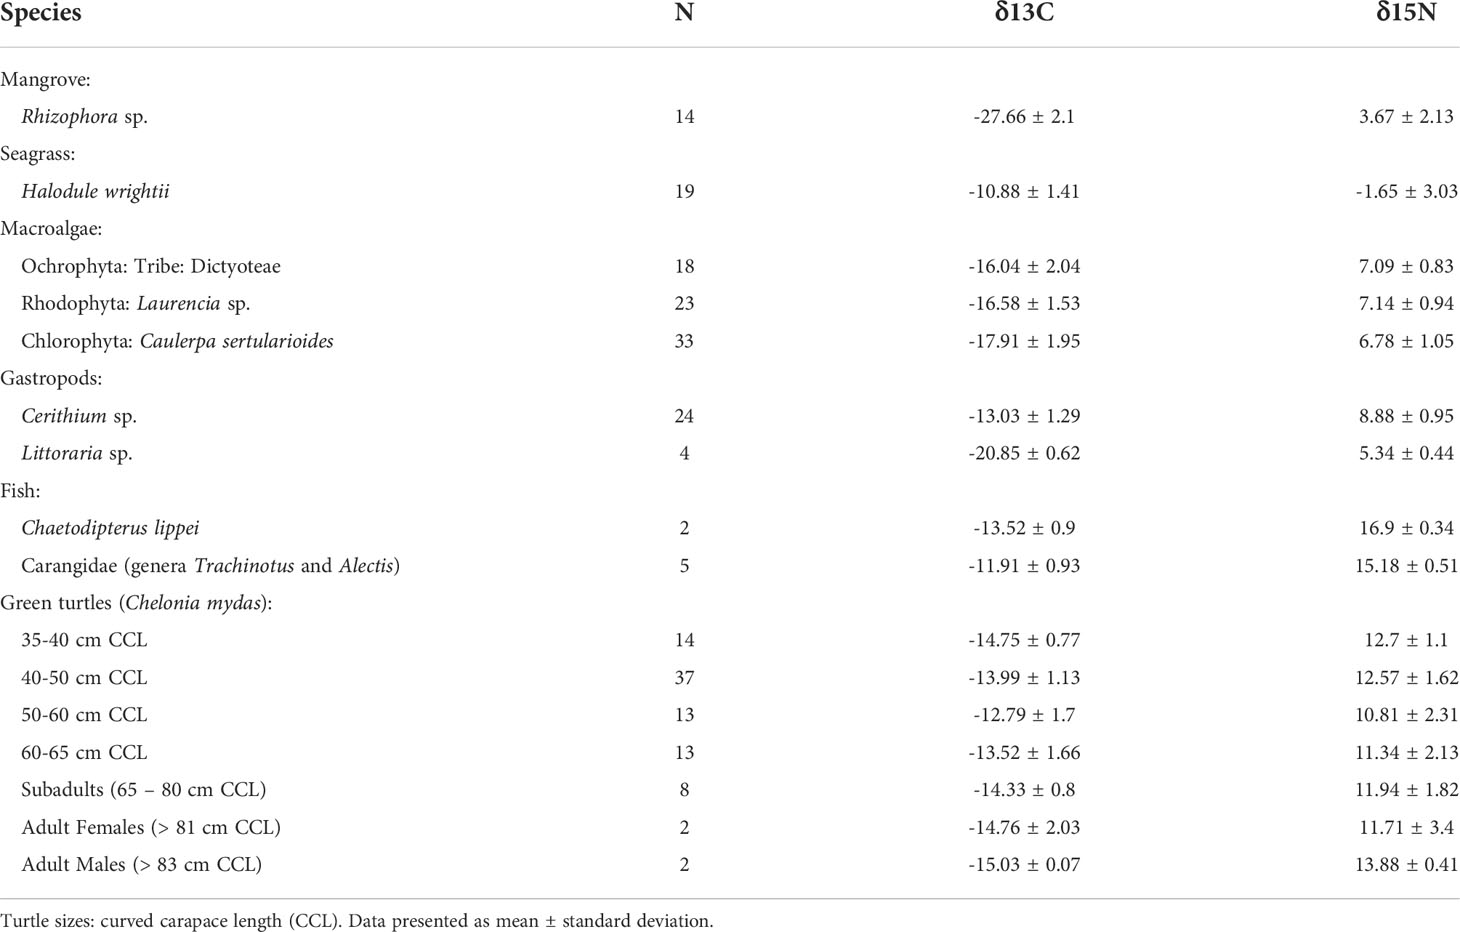
Table 2 Sample size and overall isotopic signatures of all species sampled at the Unhocomo and Unhocomozinho green turtle foraging areas.
Overall green turtle isotopic signatures were closer to those of the herbivorous/detritivore gastropod Cerithium sp., and just below the trophic level of both carnivorous fish groups (Figure 5). SIBER results indicated that recruit isotopic signatures were similar, regardless of capture location (not shown), while the remaining turtles were isotopically segregated by habitat of capture, with a niche overlap of only 0.01%, and turtles from rocky sites having lower δ13C and higher δ15N values (Figure 5).
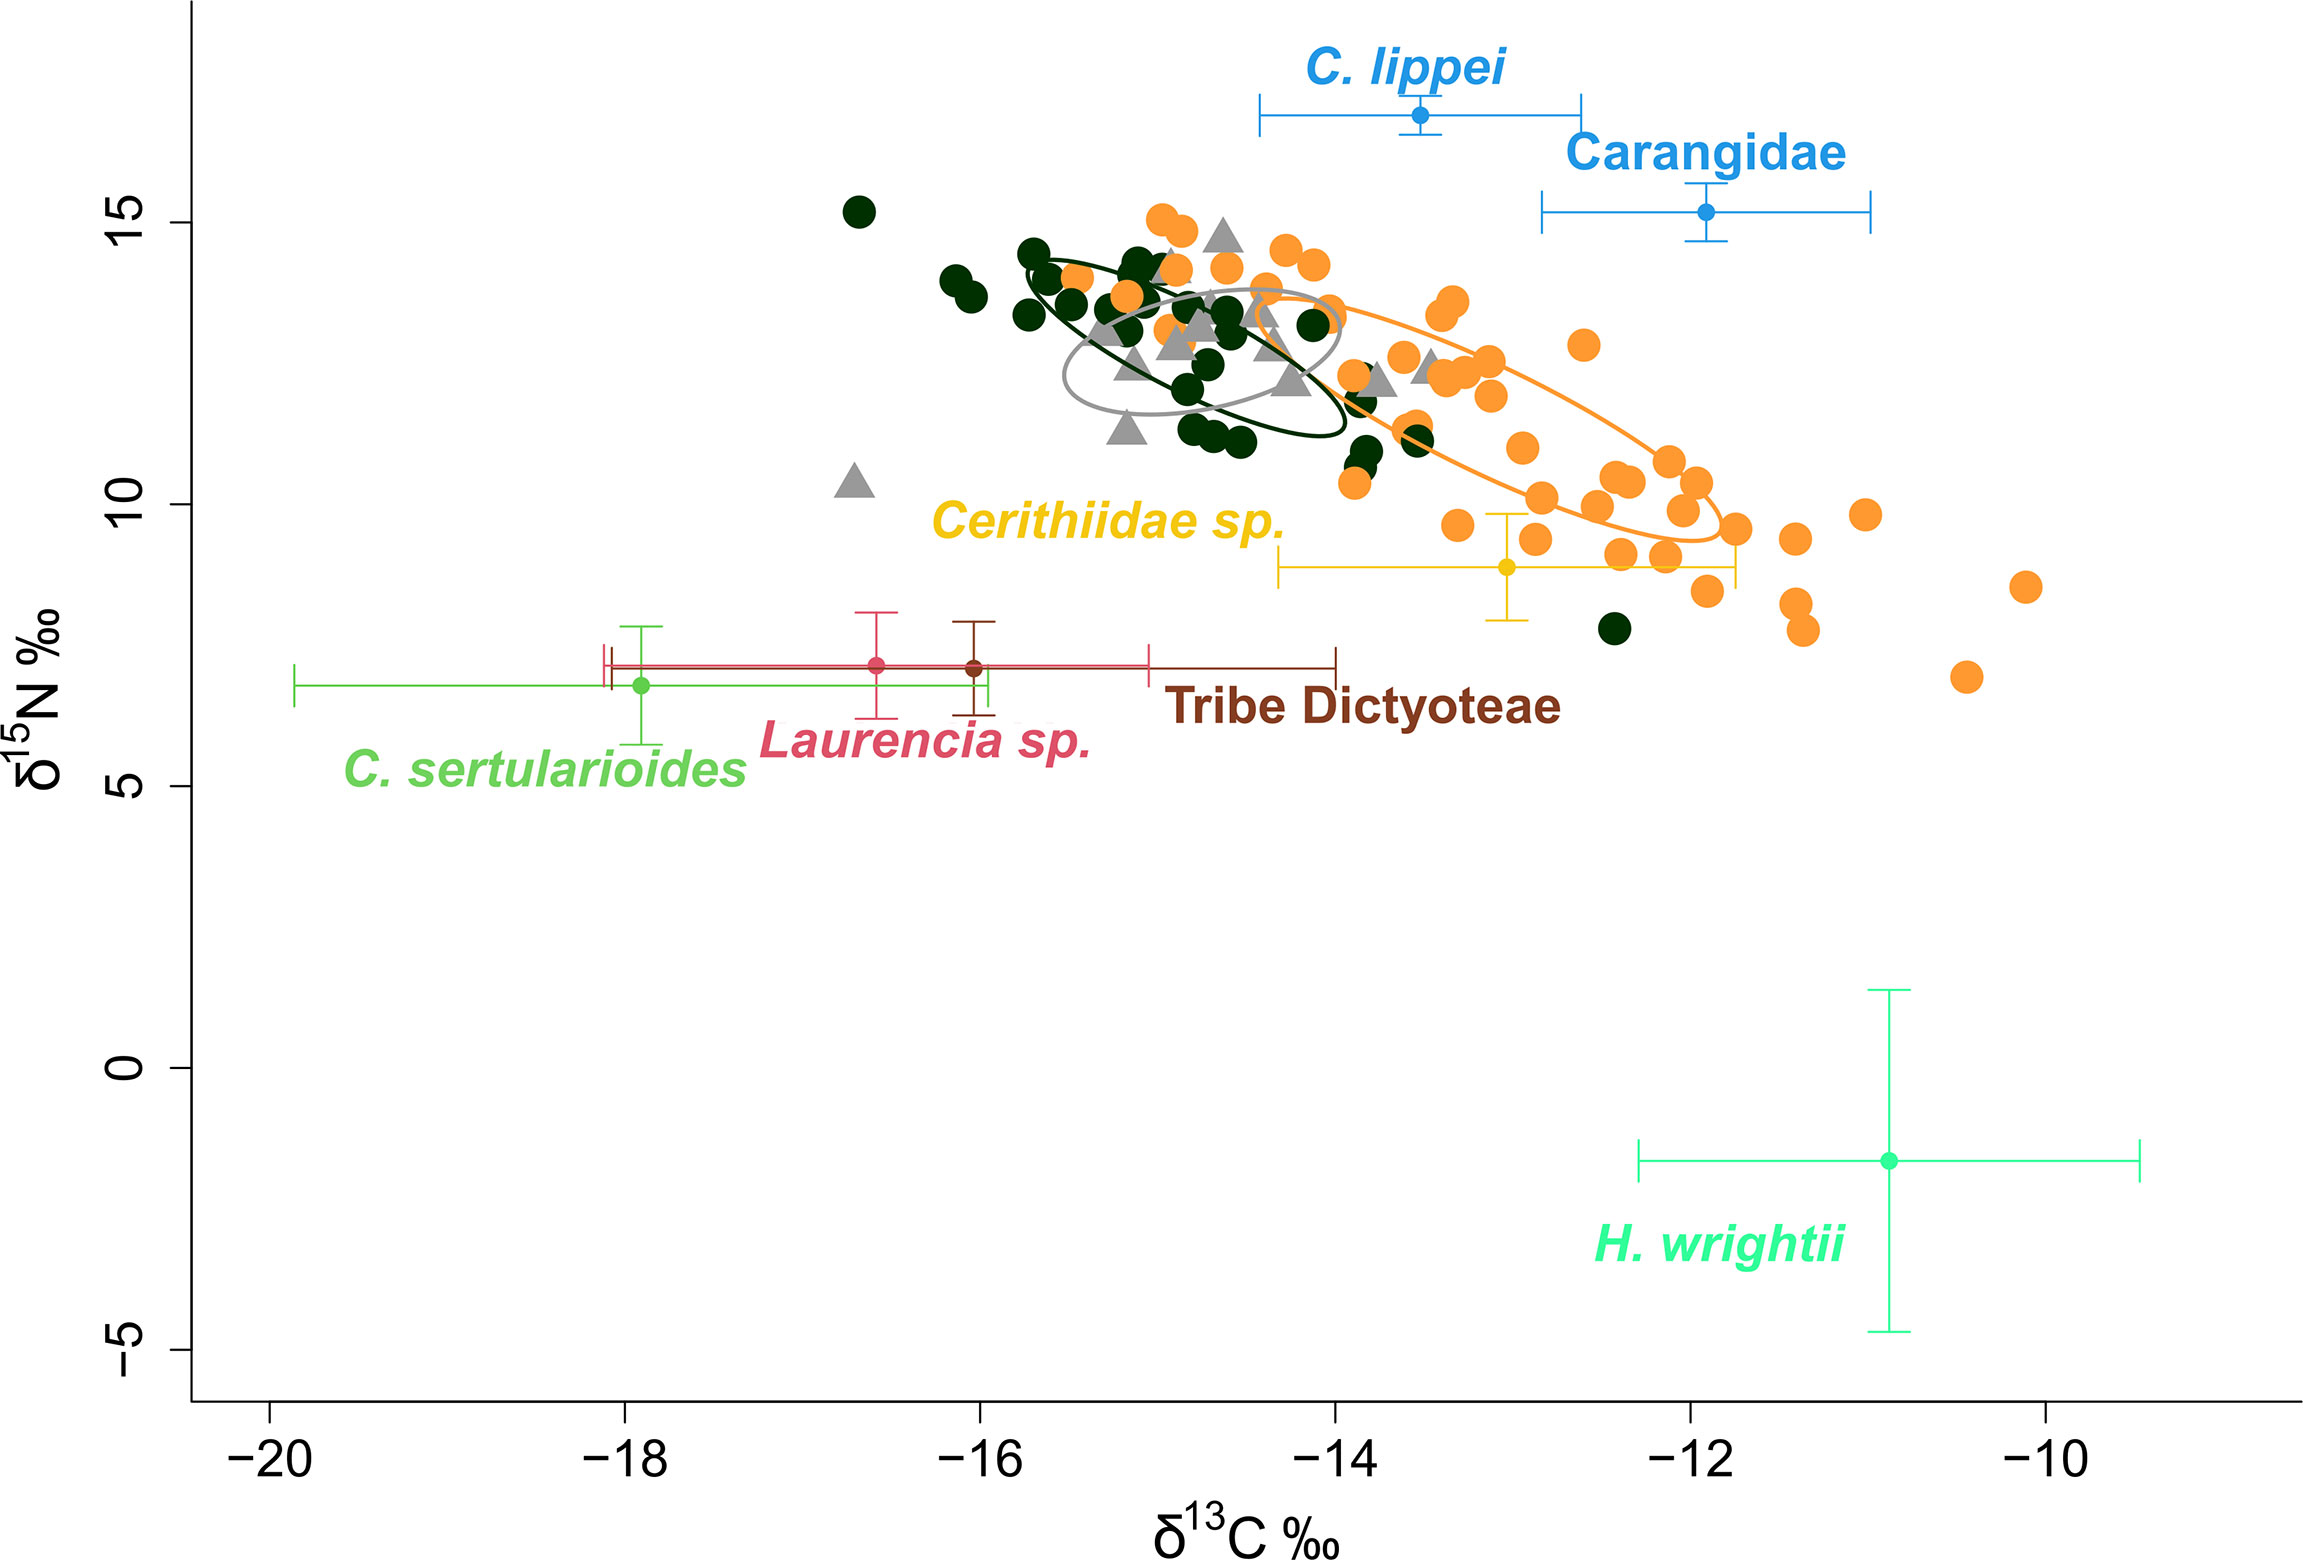
Figure 5 Isospace plot of green turtle isotopic signatures (points), macrophytes (red algae: Laurencia sp.; brown algae, Tribe Dictyoteae; green algae, Caulerpa sertularioides; seagrass, Halodule wrightii), and additional animal samples (benthic gastropod: Cerithiidae sp.; invertebrate specialist fish, Chaetodipterus lippei; active predatory fish, Carangidae) from Unhocomo and Unhocomozinho foraging grounds. Turtle symbols indicate life-stage – triangles, recruits; circles, established turtles – and colors indicate habitat of capture - black – rocky-bottom, orange – sandy-bottom. Ellipses represent the standard ellipse area corrected (SEAc) produced by SIBER, also color-coded by habitat.
There were no significant differences in the isotopic signatures of macroalgae between sites thus all samples were pooled by species (Table 2). Algae signatures were similar regardless of Division, ranging between (Figure 5, Table 2). The signatures of H. wrightii were strikingly different from those of other potential dietary items, having consistently higher values of δ13C and lower of δ15N (Table 2).
According to the MixSIAR Bayesian model results, the dietary item with the overall highest contribution for all turtles was, by far, the rhodophyte Laurencia sp. (~60 ± 12% of average estimated contribution, Figure 6). In fact, this species was estimated to be the single major consumed species for all individuals captured in the rocky-bottom sites (average contribution increasing from 66 ± 17% for turtles with 40 – 50cm CCL to 73 ± 20% for individuals >65cm CCL), followed by macroalgae from the tribe Dictyoteae and C. sertularioides (Figure 6). The estimated contribution of seagrass for the turtles captured in the rocky-bottom sites was virtually null for all sizes, including the smaller turtles. In contrast, regarding turtles from the sandy-bottom habitat, the seagrass is suggested as a considerable part of their diet for all size classes, up to 65 cm CCL. Its estimated contribution increases and then stabilizes along the successive size classes (averages starting from 5.5 ± 2.5% for turtles with 40 – 50cm CCL, to 19.4 ± 8% for individuals with 50-60 cm and 19.5 ± 8.7% for turtles with 60 - 65cm CCL), suggesting a continuous and consistent consumption throughout the period of post-recruitment juvenile growth.
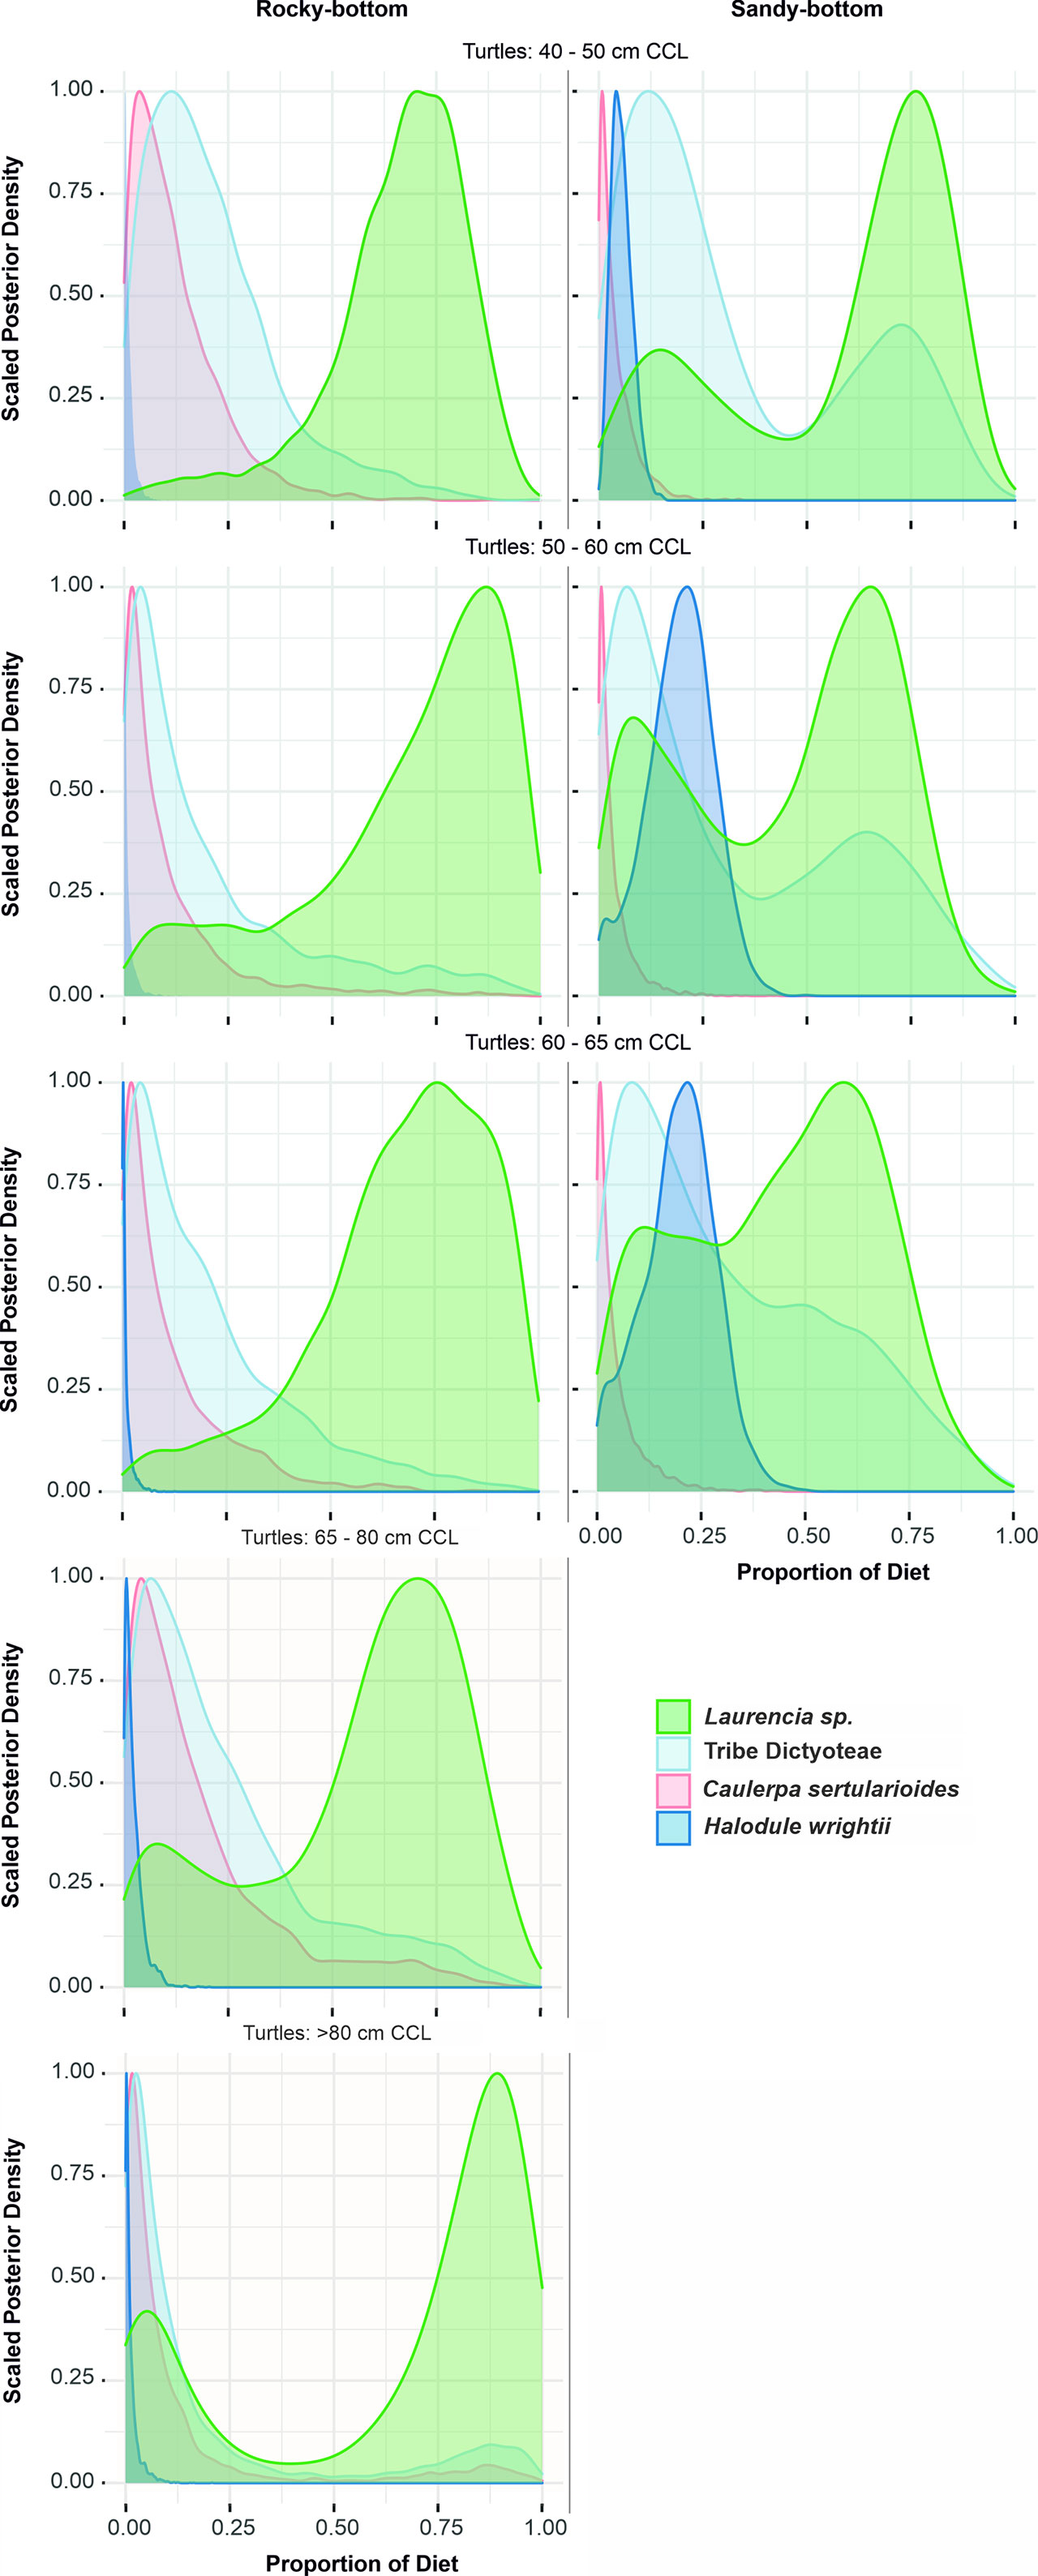
Figure 6 MixSIAR density distribution model results showing distributions of the proportion of different benthic algae/seagrass types on the diet of green turtles foraging at Unhocomo and Unhocomozinho, Guinea-Bissau. Left column: turtles captured in a rocky-bottom habitat. Right column: turtles captured in a sandy-bottom habitat. Lines: size classes; the 65 - 80 cm size class of the right column was omitted due to low sample size (n = 1).
Discussion
The coastal waters surrounding the islands of Unhocomo and Unhocomozinho are used by growing green turtles, maintaining animals of all sizes from recruits to subadults and adults.
In comparison with other populations, green turtles from this area are mostly herbivorous and completely specialized in marine food sources, given that their isotopic niche was lower on the δ15N axis than those of both groups of carnivorous fish, and that the signatures of mangrove, consumed by other green turtle populations (Arthur et al., 2008; Esteban et al., 2020), are too distant to suggest any importance for the diet.
Green turtle size distribution
Recruits and smaller juveniles were mostly captured at shallower sandy-bottom sites, being seemingly more frequent here. Shallower environments tend to be more productive and macrophyte rich (Sand-Jensen and Borum, 1991; Duarte, 1995; Borum and Sand-jensen, 1996), being considered better foraging grounds for green turtles (Makowski et al., 2006; Heithaus et al., 2007; Hazel et al., 2009). Indeed, despite the relatively small difference in depth between sites, most macrophyte taxa were more frequent in the shallower habitat. It is not uncommon to find marked macrophyte community structuring in small depth gradients, especially for light-dependent rooted/soft-bottom species (Jensen and Carstensen, 2018). As such, at the Bijagós archipelago, a big estuarine system, with sediment turbid waters (Campredon and Cuq, 2001; Brenninkmeijer et al., 2002), light availability must play an important role in limiting the depth distribution of local macrophytes. In fact, we only found seagrass (Halodule wrightii) at the shallower sandy sites, since its optimal growing depth tends to decrease from around 3m to < 1.5m in murky conditions (Duarte, 1991; Dunton, 1994; Kenworthy and Fonseca, 1996; Hale et al., 2004).
Despite this potential difference in foraging quality, larger turtles were mostly absent from the sandy habitat. We are confident that this difference is representative given that only one subadult and no adult turtles were sighted at these habitats. Additionally, the characteristics of the shallower sandy shoals, such as very low depth and the physical barrier provided by the surrounding reefs, make them ideal trapping locations, especially for larger turtles. A similar size distribution has been observed at other foraging aggregations, with larger turtles being more frequent in deeper open areas and juveniles in shallower more secluded sites (Heithaus et al., 2005; López-Mendilaharsu et al., 2005; Welsh and Mansfield, 2022). Some authors suggested that size-specific vulnerability to sharks may be the root of this pattern, as they are the main natural predators of marine turtles and prefer to hunt them in shallows (Heithaus et al., 2006). As turtles rely on speed and maneuverability to escape (Heithaus et al., 2002), in shallower more constrained areas, larger individuals are significantly hindered (Heithaus et al., 2007) therefore avoiding them. We do not have reliable information on the abundance of large sharks in our study sites but, since tiger sharks also occur on the West African coast (Domingo et al., 2016), we cannot exclude the hypothesis that turtles are responding to their predation effect.
The habitats surveyed in this study are shallower than most at other foraging aggregations, where, given the compared depth ranges, both could be perceived as belonging to the same low depth category (Makowski et al., 2006; Seminoff et al., 2006; Ballorain et al., 2013). Still, the marked differences observed, both in the benthic communities and turtle size distribution at such a fine scale may also occur in other foraging areas and should therefore be considered.
Isotopic niche segregation
We found that green turtle isotopic niches were noticeably segregated according to the habitat where they were captured, irrespective of body size. Since this pattern is so evidently area dependent, we can assume that their isotopic signatures result from the consumption of local resources. Turtles captured in the sandy-bottom sites had signatures skewed towards those of seagrasses, having consistently higher δ13C values than those from rocky sites, indicating that its consumption may be the driver of the observed isotopic segregation. Nevertheless, even for turtles from sandy-bottom sites, seagrasses are not the primary food source, with rhodophytes being the most consumed by all size groups, followed by ochrophytes as indicated by our results. A previous study that assessed green turtle diet through eDNA of esophageal and cloacal swabs from individuals captured at one of these sandy-bottom sites found a similar result, with red algae accounting for ~50% of their diet and pointing Laurencia sp. as a major food source (Díaz-Abad et al., 2022).
According to the global review on green turtle diet by Esteban et al. (2020), all turtles, despite being isotopically segregated by foraging habitat, fit the category of turtles with macroalgae dominated diet (in this case rhodophytes and ochrophytes), where seagrass is relatively sparse or absent. Only the presence of a tracer species, the seagrass H. wrightii, allowed us to further discriminate the seemingly constant foraging segregation of this population. Given the current worldwide seagrass decline (Jordà et al, 2012; Tang and Hadibarata, 2022), the long-term detectability of this pattern may be at risk. Still, it is compelling to learn that green turtles in the Bijagós can thrive mostly on macroalgae. If the rich seagrass meadows present in other West African foraging areas collapse (Cardona et al., 2009; Chefaoui et al., 2021), and are substituted by adequate macroalgae, local green turtle populations may be able to adopt a similar diet and persist. Alternatively, if they are too specialized to adapt, they may migrate to other more suitable foraging locations as in other populations (Kale et al., 2022).
The notorious absence of seagrass in the diet of all turtles found at rocky-bottom sites, reveals a striking finding of this work - that despite the overlaps in sizes between habitats and overall similar diets, same-sized turtles have distinct long-term feeding habits. Foraging specialization has been documented within green turtle populations, whether related to ontogenetic differences in feeding strategy (Vander Zanden et al., 2013) or to spatial segregation with opportunistic use of local resources (Gillis et al., 2018; Hancock et al., 2018). Remarkably, (Thomson et al., 2018) reported that individual preferences also have a role in foraging specialization, and the authors propose that different gut microbiota, more efficient in digesting specific food sources, may be influencing individual selection.
Our results add to the increasing number of studies reporting the role of individual selection on population sub-structuring in sea turtles. Here we found that even same-sized individuals, captured on adjacent sites separated by only ~ 0.7 km to ~ 2.7 km of unimpeded water, and which probably take refuge on the same deeper channels during the low tide, may segregate spatially during the high tide. Furthermore, they do not only seem to forage separately but are also feeding on habitat-specific food sources for long enough for them to be detected isotopically. This hints at a subtler pattern of foraging segregation, where the two groups have small-scale consistent habitat preferences, but not, as in (Thomson et al., 2018) strict dietary specialization. Instead, these turtles seem rather to have an overall similar diet, mostly feeding on rhodophytes, which they opportunistically complement with locally available resources, such as seagrass.
To our knowledge, this is one of the smaller spatial scales over which consistent differences in the diet of sea turtle individuals of the same size has been found (see a similar result for C. caretta by Raposo et al., 2019, concerning pelagic juveniles). In the future it will be important to verify if these differences are deliberate and long-lasting as if driven by specific gut microbiota or nutritional needs, or simply opportunistic, being secondary to individual habitat selection motivated by factors other than a diet.
Along with immature turtles, adults of both sexes also use this area, with origin on the large rookery of Poilão Island, in the southeast of the Bijagós, as recently revealed by satellite tracking (Patrício et al., 2022) and further observed here, as one adult female (97 cm curved carapace length - CCL) captured on 22/10/2018 was found 6 days later nesting at Poilão. However, so far, we have found no evidence of seagrass signal on the isotopic signatures of these adults, raising the question of where the immature seagrass-eating green turtles go when they reach subadult size. Given our limited sampling resolution, constrained by the availability of suitable locations for net deployment, there is a high chance that these turtles may transition to unsampled foraging sites and habitats.
Granted our low recapture rate there is a strong indication that, despite seemingly consistent foraging habits throughout juvenile growth, there is low foraging site fidelity for this population and that they may be foraging fluidly throughout the Bijagós archipelago. Nonetheless, the obvious size class and isotopic segregations found here, likely resulting from a combination of habitat characteristics along with individual preferences, reinforces the notion that the trophic ecology of green turtles is much more complex and nuanced than previously thought. Our results support that fine-scale studies are fundamental to assessing green turtle ecological heterogeneity, which needs to be considered in regional conservation efforts.
Data availability statement
The original contributions presented in the study are included in the article/Supplementary Material. Further inquiries can be directed to the corresponding author.
Ethics statement
The animal study was reviewed and approved by Orgão Responsável pelo Bem-estar Animal do ISPA (ORBEA - ISPA). Research permits were granted by the Instituto da Biodiversidade e das Áreas Protegidas, Dr. Alfredo Simão da Silva (IBAP), of Guinea-Bissau. Fieldwork protocols involving sea turtles followed recommended guidelines (NMFS-SFC, 2008), to enhance efficiency and reduce possible disturbance to the turtles, and were conducted by trained personnel, in collaboration with national authorities for biodiversity management.
Author contributions
FM collected data in the field, performed laboratory and data analysis, and prepared figures and tables. RR, PC, and AP conceived and designed the experiments, and collected data in the field. JN performed laboratory work and taxonomic identification of macroalgae. CB and AR provided technical and logistical support to the study. All authors contributed to and approved the final version of the manuscript.
Funding
This study was funded by: the MAVA Foundation through the project “Consolidation of sea turtle conservation at the Bijagós Archipelago, Guinea-Bissau”; the Regional Partnership for Coastal and Marine Conservation (PRCM), through the project “Survies des Tortues Marines”; the “La Caixa” Foundation (ID 100010434) through a fellowship awarded to ARP (LCF/BQ/PR20/11770003); the project AGA-KHAN/540316524/2019, the Fundação para a Ciência e a Tecnologia, Portugal, through a grant awarded to FM (PD/BD/140835/2018) and grants awarded to MARE (UIDB/04292/2020 and UIDP/04292/2020).
Acknowledgments
Research permits and logistic support were provided by the Instituto da Biodiversidade e das Áreas Protegidas, Dr. Alfredo Simão da Silva (IBAP). Fieldwork was conducted with the invaluable and irreplaceable collaboration of members from the local communities. We would like to thank Ester A. Serrão, and Tania Aires from CCMAR-Centre of Marine Sciences, CIMAR, University of Algarve, Faro, Portugal, for their invaluable help in identifying all macrophytes. We would also like to thank Jessica Monteiro and Natassia Bacco−Mannina for their participation and helpful input during sampling. Stable Isotope analyses were conducted at LIE - SIIAF is an I&D unit of the Faculdade de Ciências de Lisboa. All samples used in this study were collected and exported under the CITES permits 004/ONGC/2022; 22PTLX000731.
Conflict of interest
The authors declare that the research was conducted in the absence of any commercial or financial relationships that could be construed as a potential conflict of interest.
Publisher’s note
All claims expressed in this article are solely those of the authors and do not necessarily represent those of their affiliated organizations, or those of the publisher, the editors and the reviewers. Any product that may be evaluated in this article, or claim that may be made by its manufacturer, is not guaranteed or endorsed by the publisher.
Supplementary material
The Supplementary Material for this article can be found online at: https://www.frontiersin.org/articles/10.3389/fmars.2022.984219/full#supplementary-material
References
Agrawal A. A. (2001). Phenotypic plasticity in the interactions and evolution of species. Science 294, 321–326. doi: 10.1126/science.1060701
Arthur K., Boyle M., Limpus C. (2008). Ontogenetic changes in diet and habitat use in green sea turtle (Chelonia mydas) life history. Mar. Ecol. Prog. Ser. 362, 303–311. doi: 10.3354/meps07440
Balazs G. H. (1999). “Factors to consider in the tagging of Sea turtles,” in Research and management techniques for the conservation of sea turtles. Eds. Eckert K. L., Bjorndal K. A., Abreu-Grobois F. A. (Washington DC: IUCN/SSC Marine Turtle Specialist Group Publication), 9.
Ballorain K., Bourjea J., Ciccione S., Kato A., Hanuise N., Enstipp M., et al. (2013). Seasonal diving behaviour and feeding rhythms of green turtles at Mayotte island. Mar. Ecol. Prog. Ser. 483, 289–302. doi: 10.3354/meps10301
Barbosa C., Broderick A., Catry P. (1998). “Marine turtles in the orango national park (Bijagós archipelago, Guinea-Bissau),” in Marine turtle newsletter, vol. 81, 6–7.
Benjamins S., et al. (2015). Confusion reigns? a review of marine megafauna interactions with tidal-stream environments. Oceanography. Mar. Biol. 53, 1–54. doi: 10.1201/b18733-2
Bjorndal K. A., Bolten A. B. (1988). Growth rates of immature green turtles, Chelonia mydas, on feeding grounds in the southern Bahamas. Copeia 1988, 555–564. doi: 10.2307/1445373
Boecklen W. J. (2011). Use of stable isotopes in foraging ecology and food web analysis. Annu. Rev. Ecol. Evol. Syst. 42(1), 411–40. doi: 10.1146/annurev-ecolsys-102209-144726
Borum J., Sand-jensen K. (1996). Is total primary production in shallow coastal marine waters stimulated by nitrogen loading? Oikos 76, 406–410. doi: 10.2307/3546213
Brand-Gardner S. J., Lanyon J. M., Limpus C. J. (1999). Diet selection by immature green turtles, Chelonia mydas, in subtropical moreton bay, south-east Queensland. Aust. J. Zool. 47 (2), 181. doi: 10.1071/ZO98065
Breed G. A., Bowen W. D., McMillan J. I., Leonard M. L.. (2006). Sexual segregation of seasonal foraging habitats in a non-migratory marine mammal. Proc. R. Soc. B.: Biol. Sci. 273 (1599), 2319–2326. doi: 10.1098/rspb.2006.3581
Brenninkmeijer A., Stienen E. W. M., Klaassen M., Kersten M.. (2002). Feeding ecology of wintering terns in Guinea-Bissau. Ibis 144 (4), 602–613. doi: 10.1046/j.1474-919X.2002.00100.x
Burgett C. M., Burkholder D. A., Coates K. A., Fourqurean V. L., Kenworthy W. J., Manuel S. A., et al. (2018). Ontogenetic diet shifts of green sea turtles (Chelonia mydas) in a mid-ocean developmental habitat. Mar. Biol. 165 (2), 33. doi: 10.1007/s00227-018-3290-6
Campbell J., Fourqurean J. (2009). Interspecific variation in the elemental and stable isotope content of seagrasses in south Florida. Mar. Ecol. Prog. Ser. 387, 109–123. doi: 10.3354/meps08093
Campredon P., Cuq F. (2001). Artisanal fishing and coastal conservation in West Africa. J. Coast. Conserv. 7 (1), 91–100. doi: 10.1007/BF02742471
Cardona L., Aguilar A., Pazos L. (2009). Delayed ontogenic dietary shift and high levels of omnivory in green turtles (Chelonia mydas) from the NW coast of Africa. Mar. Biol. 156 (7), 1487–1495. doi: 10.1007/s00227-009-1188-z
Catry P., Barbosa C., Indjai B., Almeida A., Godley B. J., Vié J. C.. (2002). First census of the green turtle at poilão, bijagós archipelago, Guinea-Bissau: The most important nesting colony on the Atlantic coast of Africa. Oryx 36 (4), 400–403. doi: 10.1017/S0030605302000765
Catry P., Barbosa C., Paris B., Indjai B., Almeida A., Benoit L.. (2009). Ecology and conservation of Sea turtles in Guinea-Bissau. Chelonian. Conserv. Biol. 8 (2), 150–160. doi: 10.2744/CCB-0772.1
Chefaoui R. M., Duarte C. M., Tavares A. I., Frade D. G., Sidi Cheikh M. A., Abdoull Ba M., et al. (2021). Predicted regime shift in the seagrass ecosystem of the gulf of arguin driven by climate change. Global Ecol. Conserv. 32, e01890. doi: 10.1016/j.gecco.2021.e01890
D’Ambra I., et al. (2015). Fish rely on scyphozoan hosts as a primary food source: evidence from stable isotope analysis. Mar. Biol. 162 (2), 247–252. doi: 10.1007/s00227-014-2569-5
de Lima R. C., et al. (2019). Individual foraging specialization and sexual niche segregation in south American fur seals. Mar. Biol. 166 (3), 32. doi: 10.1007/s00227-019-3480-x
Deniro M. J., Epstein S. (1981). Influence of diet on the distribution of nitrogen isotopes in animals. Geochim. Cosmochim. Acta 45 (3), 341–351. doi: 10.1016/0016-7037(81)90244-1
Díaz-Abad L., Bacco-Mannina N., Madeira F. M., Neiva J., Aires T., Serrao E. A., et al. (2022). eDNA metabarcoding for diet analyses of green sea turtles (Chelonia mydas). Mar. Biol. 169 (1), 18. doi: 10.1007/s00227-021-04002-x
Domingo A., Coelho R., Cortes E., Garcia-Cortes B., Mas F., Mejuto J., et al. (2016). Is the tiger shark galeocerdo cuvier a coastal species? expanding its distribution range in the Atlantic ocean using at-sea observer data. J. Fish. Biol. 88 (3), 1223–1228. doi: 10.1111/jfb.12887
Duarte C. M. (1991). Seagrass depth limits. Aquat. Bot. 40 (4), 363–377. doi: 10.1016/0304-3770(91)90081-F
Duarte C. M. (1995). Submerged aquatic vegetation in relation to different nutrient regimes. Ophelia 41 (1), 87–112. doi: 10.1080/00785236.1995.10422039
Dunton K. H. (1994). Seasonal growth and biomass of the subtropical seagrass Halodule wrightii in relation to continuous measurements of underwater irradiance. Mar. Biol. 120 (3), 479–489. doi: 10.1007/BF00680223
Eckert K. L., Beggs J. A. (2006). Marine turtle tagging: a manual of recommended practices, In , WIDECAST technical report. (Issues 2, Revised Edition. Beaufort, North Carolina).
Esteban N., Mortimer J. A., Stokes H. J., Laloë J.-O., Unsworth R. K. F., Hays G. C.. (2020). A global review of green turtle diet: sea surface temperature as a potential driver of omnivory levels. Mar. Biol. 167 (12), 183. doi: 10.1007/s00227-020-03786-8
Ferreira R. L., Ceia F. R., Borges T. C., Ramos J. A., Bolten A. B.. (2018). Foraging niche segregation between juvenile and adult hawksbill turtles (Eretmochelys imbricata) at príncipe island, West Africa. J. Exp. Mar. Biol. Ecol. 498, 1–7. doi: 10.1016/j.jembe.2017.10.005
Gillis A. J.. (2018). Foraging ecology and diet selection of juvenile green turtles in the Bahamas: insights from stable isotope analysis and prey mapping. Marine Ecology Progress Series 599, 225–38. doi: 10.3354/meps12635
Hale J. A., Frazer T. K., Tomasko D. A., Hall M. O.. (2004). Changes in the distribution of seagrass species along florida’s central gulf coast: Iverson and bittaker revisited. Estuaries 27 (1), 36–43. doi: 10.1007/BF02803558
Hancock J., Vieira S., Jimenez V., Carvalho Rio J., Rebelo R.. (2018). Stable isotopes reveal dietary differences and site fidelity in juvenile green turtles foraging around são tomé island, West central Africa. Mar. Ecol. Prog. Ser. 600, 165–177. doi: 10.3354/meps12633
Hatase H., Sato K., Yamaguchi M., Takahashi K., Tsukamoto K.. (2006). Individual variation in feeding habitat use by adult female green sea turtles (Chelonia mydas): are they obligately neritic herbivores? Oecologia 149 (1), 52–64. doi: 10.1007/s00442-006-0431-2
Haywood J., Fuller W., Godley B., Shutler J., Widdicombe S., Broderick A.. (2019). Global review and inventory: how stable isotopes are helping us understand ecology and inform conservation of marine turtles. Mar. Ecol. Prog. Ser. 613, 217–245. doi: 10.3354/meps12889
Hazel J., Lawler I. R., Hamann M. (2009). Diving at the shallow end: Green turtle behaviour in near-shore foraging habitat. J. Exp. Mar. Biol. Ecol. 371 (1), 84–92. doi: 10.1016/j.jembe.2009.01.007
Heithaus M., Frid A., Wirsing A., Bejder L., Dill L.. (2005). Biology of sea turtles under risk from tiger sharks at a foraging ground. Mar. Ecol. Prog. Ser. 288, 285–294. doi: 10.3354/meps288285
Heithaus M. R., Hamilton I. M., Wirsing A. J., Dill L. M.. (2006). Validation of a randomization procedure to assess animal habitat preferences: microhabitat use of tiger sharks in a seagrass ecosystem. J. Anim. Ecol. 75 (3), 666–676. doi: 10.1111/j.1365-2656.2006.01087.x
Heithaus M. R., Frid A., Wirsing A. J., Dill L. M., Fourqurean J. W., Burkholder D., et al. (2007). State-dependent risk-taking by green sea turtles mediates top-down effects of tiger shark intimidation in a marine ecosystem. J. Anim. Ecol. 76 (5), 837–844. doi: 10.1111/j.1365-2656.2007.01260.x
Heithaus M. R., Frid A., Dill L. M. (2002). Shark-inflicted injury frequencies, escape ability, and habitat use of green and loggerhead turtles. Mar. Biol. 140 (2), 229–236. doi: 10.1007/s00227-001-0712-6
Jackson A. L., et al (2011). Comparing isotopic niche widths among and within communities: SIBER - Stable Isotope Bayesian Ellipses in R. J. Animal Ecol. 80 (3), 595–602. doi: 10.1111/j.1365-2656.2011.01806.x
Jensen D. K., Carstensen J. (2018). Light requirements of marine rooted macrophytes. (Issue Research note from DCE-Danish Centre for Environment and Energy).
Jordà G., Marbà N., Duarte C. M. (2012). Mediterranean Seagrass vulnerable to regional climate warming. Nat. Climate Change. 2 (11), 821–824. doi: 10.1038/nclimate1533
Kale N., Manoharakrishnan M., Bharti D., Poti M., Shanker K.. (2022). The island hoppers: how foraging influences green turtle Chelonia mydas abundance over space and time in the Lakshadweep archipelago, India. Endangered. Species. Res. 48, 1–14. doi: 10.3354/esr01181
Kenworthy W. J., Fonseca M. S. (1996). Light requirements of seagrasses Halodule wrightii and Syringodium filiforme derived from the relationship between diffuse light attenuation and maximum depth distribution. Estuaries 19 (3), 740–750. doi: 10.2307/1352533
Layman C. A., Arrington D. A., Montaña C. G., Post D. M.. (2007). Can stable isotope ratios provide for community-wide measures of trophic structure? Ecology 88, 42–48. doi: 10.1890/08-0167.1
Lepoint G., Dauby P., Gobert S. (2004). Applications of c and n stable isotopes to ecological and environmental studies in seagrass ecosystems. Mar. pollut. Bull. 49 (11–12), 887–891. doi: 10.1016/j.marpolbul.2004.07.005
Limpus C., Chaloupka M. (1997). Nonparametric regression modelling of green sea turtle growth rates (southern great barrier reef). Mar. Ecol. Prog. Ser. 149 (1–3), 23–34. doi: 10.3354/meps149023
Limpus C. J., Couper P. J., Read M. A. (1994). The green turtle, Chelonia mydas in Queensland: population structure in a warm temperate feeding area. Memoirs of the Queensland Museum 35 (1), 139–54.
Linnaeus C. (1758). Systema naturae per regna tria naturae, secundum classes, ordines, genera, species, cum character- ibus, differentiis, synonymis, locis. Salvii T. L. Ed. (Stockholm, Sweden), 823 pp.
Longhurst A. R. (1957). The food of the demersal fish of a West African estuary. J. Anim. Ecol. 26, 369–387. doi: 10.2307/1753
López-Mendilaharsu M., Gardner S. C., Seminoff J. A., Riosmena-Rodriguez R.. (2005). Identifying critical foraging habitats of the green turtle (Chelonia mydas) along the pacific coast of the Baja California peninsula, Mexico. Aquat. Conserv.: Mar. Freshw. Ecosyst. 15 (3), 259–269. doi: 10.1002/aqc.676
Louzao M., Valeiras J., García-Barcelona S., González-Quirós R., Nogueira E., Iglesias M., et al. (2019). Marine megafauna niche coexistence and hotspot areas in a temperate ecosystem. Continental. Shelf. Res. 186, 77–87. doi: 10.1016/j.csr.2019.07.013
Makowski C., Seminoff J. A., Salmon M. (2006). Home range and habitat use of juvenile Atlantic green turtles (Chelonia mydas l.) on shallow reef habitats in palm beach, Florida, USA. Mar. Biol. 148 (5), 1167–1179. doi: 10.1007/s00227-005-0150-y
Mattingly B., Jayne B. C., Mattingly W. B., Jayne B. C.. (2004). Resource use in arboreal habitat: structure affects locomotion of four ecomorphs of Anolis lizards. Ecology 85 (4), 1111–1124. doi: 10.1890/03-0293
McClellan C. M., Braun-McNeill J., Avens L., Wallace B. P., Read A. J.. (2010). Stable isotopes confirm a foraging dichotomy in juvenile loggerhead sea turtles. J. Exp. Mar. Biol. Ecol. 387 (1–2), 44–51. doi: 10.1016/j.jembe.2010.02.020
Michener R., Lajtha K. eds. (2008). Stable isotopes in ecology and environmental science. John Wiley & Sons
Monteiro J., Duarte M., Amadou K., Barbosa C., El Bar N., Madeira F. M., et al. (2021). Fibropapillomatosis and the chelonid alphaherpesvirus 5 in green turtles from West Africa. EcoHealth 18 (2), 229–240. doi: 10.1007/s10393-021-01526-y
Musick J. A., Limpus C. J. (2017). ‘Habitat utilization and migration in juvenile sea turtles’ in The biology of Sea turtles 1, pp. 137–163. doi: 10.1201/9780203737088
Patrício A. R., Beal M., Barbosa C., Diouck D., Godley B. J., Madeira F. M., et al. (2022). Green turtles highlight connectivity across a regional marine protected area network in West Africa. Front. Mar. Sci. 9. doi: 10.3389/fmars.2022.812144
Pearson R., van de Merwe J., Limpus C., Connolly R. (2017). Realignment of sea turtle isotope studies needed to match conservation priorities. Mar. Ecol. Prog. Ser. 583, 259–271. doi: 10.3354/meps12353
Phillips D. L., Inger R., Bearhop S., Jackson A. L., Moore J. W., Parnell A. C., et al. (2014). Best practices for use of stable isotope mixing models in food-web studies. Can. J. Zool. 92 (10), 823–835. doi: 10.1139/cjz-2014-0127
Phillips D. L., Gregg J. W. (2003). Source partitioning using stable isotopes: coping with too many sources. Oecologia 136 (2), 261–269. doi: 10.1007/s00442-003-1218-3
Pillans R. D., Fry G. C., Haywood M. D. E., Rochester W., Limpus C. J., Patterson T., et al. (2021). Residency, home range and tidal habitat use of green turtles (Chelonia mydas) in port Curtis, Australia. Mar. Biol. 168 (6), 1–18. doi: 10.1007/s00227-021-03898-9
Post D. M., Layman C. A., Arrington D. A., Takimoto G., Quattrochi J., Montaña C. G., et al. (2007). Getting to the fat of the matter: models, methods and assumptions for dealing with lipids in stable isotope analyses. Oecologia 152 (1), 179–189. doi: 10.1007/s00442-006-0630-x
Preston T., Owens N. J. P.. (1983). Interfacing an automatic elemental analyser with an isotope ratio mass spectrometer: the potential for fully automated total nitrogen and nitrogen-15 analysis. The Analyst 108 (1289), 971. doi: 10.1039/an9830800971
R Core Team. (2020). R: A language and environment for statistical computing. Vienna, Austria: R Foundation for Statistical Computing.
Raposo C., Patrício A. R., Catry P., Dellinger T., Granadeiro J. P.. (2019). Evidence for trophic differences between live and bycatch oceanic juvenile loggerhead sea turtles. Mar. Biol. 166 (3), 1–8. doi: 10.1007/s00227-019-3466-8
Reich K. J., Bjorndal K. A., Bolten A. B. (2007). The “lost years” of green turtles: using stable isotopes to study cryptic lifestages. Biol. Lett. 3 (6), 712–714. doi: 10.1098/rsbl.2007.0394
Reich K. J., Bjorndal K. A., Martínez del Rio C. (2008). Effects of growth and tissue type on the kinetics of 13C and 15N incorporation in a rapidly growing ectotherm. Oecologia 155 (4), 651–663. doi: 10.1007/s00442-007-0949-y
Reisser J., Proietti M., Sazima I., Kinas P., Horta P., Secchi E.. (2013). Feeding ecology of the green turtle (Chelonia mydas) at rocky reefs in western south Atlantic. Mar. Biol. 160 (12), 3169–3179. doi: 10.1007/s00227-013-2304-7
Roche D. C., Cherkiss M. S., Smith B. J., Burkholder D. A., Hart K. M.. (2021). Stable isotopes used to infer trophic position of green turtles (Chelonia mydas) from dry tortugas national park, gulf of Mexico, united states. Regional. Stud. Mar. Sci. 48, 102011. doi: 10.1016/j.rsma.2021.102011
Sand-Jensen K., Borum J. (1991). Interactions among phytoplankton, periphyton, and macrophytes in temperate freshwaters and estuaries. Aquat. Bot. 41 (1–3), 137–175. doi: 10.1016/0304-3770(91)90042-4
Schmidt K., Atkinson A., Stübing D., McClelland J. W., Montoya J. P., Voss M., et al. (2003). Trophic relationships among southern ocean copepods and krill: Some uses and limitations of a stable isotope approach. Limnol. Oceanography. 48 (1), 277–289. doi: 10.4319/lo.2003.48.1.0277
Seminoff J. A., Komoroske L. M., Amorocho D., Arauz R., Chacón‐Chaverrí D., Paz N., et al. (2021). Large-Scale patterns of green turtle trophic ecology in the eastern pacific ocean. Ecosphere 12 (6), 1–33. doi: 10.1002/ecs2.3479
Seminoff J., Jones T., Marshall G. (2006). Underwater behaviour of green turtles monitored with video-time-depth recorders: what’s missing from dive profiles? Mar. Ecol. Prog. Ser. 322, 269–280. doi: 10.3354/meps322269
Shimada T., Aoki S., Kameda K., Hazel J., Reich K., Kamezaki N.. (2014). Site fidelity, ontogenetic shift and diet composition of green turtles chelonia mydas in Japan inferred from stable isotope analysis. Endangered. Species. Res. 25 (2), 151–164. doi: 10.3354/esr00616
Stock B. C., et al. (2018). Analyzing mixing systems using a new generation of Bayesian tracer mixing models. PeerJ 6 (6), e5096. doi: 10.7717/peerj.5096
Suzuki K. W., Kasai A., Isoda T., Nakayama K., Tanaka M.. (2008). Distinctive stable isotope ratios in important zooplankton species in relation to estuarine salinity gradients: Potential tracer of fish migration. Estuarine. Coast. Shelf. Sci. 78 (3), 541–550. doi: 10.1016/j.ecss.2008.01.014
Syväranta J. (2013). An Empirical Evaluation of the Utility of Convex Hull and Standard Ellipse Areas for Assessing Population Niche Widths from Stable Isotope Data. PLoS ONE 8 (2), 1–8. doi: 10.1371/journal.pone.0056094
Tang K. H. D., Hadibarata T. (2022). Seagrass meadows under the changing climate: A review of the impacts of climate stressors. Res. Ecol. 4 (1), 27–36. doi: 10.30564/re.v4i1.4363
Thomson J. A. (2018). ‘Individual specialization in a migratory grazer reflects long-term diet selectivity on a foraging ground: implications for isotope-based tracking. Oecologia (Berlin Heidelberg: Springer) 188 (2), 429–39. doi: 10.1007/s00442-018-4218-z
Vander Zanden H. B., Bjorndal K. A., Bolten A. B. (2013). Temporal consistency and individual specialization in resource use by green turtles in successive life stages. Oecologia 173 (3), 767–777. doi: 10.1007/s00442-013-2655-2
Vander Zanden H. B., Bjorndal K. A., Mustin W., Ponciano J. M., Bolten A. B.. (2012). Inherent variation in stable isotope values and discrimination factors in two life stages of green turtles. Physiol. Biochem. Zool. 85 (5), 431–441. doi: 10.1086/666902
Welsh D. T. (2000). Nitrogen fixation in seagrass meadows: Regulation, plant-bacteria interactions and significance to primary productivity. Ecol. Lett. 3 (1), 58–71. doi: 10.1046/j.1461-0248.2000.00111.x
Welsh R. C., Mansfield K. L. (2022). Intraspecific spatial segregation on a green turtle foraging ground in the Florida keys, USA. Mar. Biol. 169 (2), 22. doi: 10.1007/s00227-021-04012-9
Werner E. E., Gilliam J. F. (1984). The ontogenetic niche and species interactions in size-structured populations. Annu. Rev. Ecol. Syst. 15 (1), 393–425. doi: 10.1146/annurev.es.15.110184.002141
Keywords: Chelonia mydas (green turtle), foraging segregation, stable isotopes, dietary studies, Bijagós archipelago, macrophytes
Citation: Madeira FM, Rebelo R, Catry P, Neiva J, Barbosa C, Regalla A and Patrício AR (2022) Fine-scale foraging segregation in a green turtle (Chelonia mydas) feeding ground in the Bijagós archipelago, Guinea Bissau. Front. Mar. Sci. 9:984219. doi: 10.3389/fmars.2022.984219
Received: 01 July 2022; Accepted: 01 August 2022;
Published: 25 August 2022.
Edited by:
Graeme Clive Hays, Deakin University, AustraliaReviewed by:
Gail Schofield, Queen Mary University of London, United KingdomKim Stokes, Swansea University, United Kingdom
Copyright © 2022 Madeira, Rebelo, Catry, Neiva, Barbosa, Regalla and Patrício. This is an open-access article distributed under the terms of the Creative Commons Attribution License (CC BY). The use, distribution or reproduction in other forums is permitted, provided the original author(s) and the copyright owner(s) are credited and that the original publication in this journal is cited, in accordance with accepted academic practice. No use, distribution or reproduction is permitted which does not comply with these terms.
*Correspondence: Fernando Miguel Madeira, fernandomadeira2@gmail.com