Stratification variability in the Yucatan Channel and its relationship with the Loop Current System
 Susana Higuera-Parra
 Efraín Moreles
 Erick R. Olvera-Prado
 Jorge Zavala-Hidalgo
- 1Facultad de Ciencias, Universidad Nacional Autónoma de México, Mexico City, Mexico
- 2Instituto de Ciencias del Mar y Limnología, Unidad Académica Procesos Oceánicos y Costeros, Universidad Nacional Autónoma de México, Mexico City, Mexico
- 3Instituto de Ciencias de la Atmósfera y Cambio Climático, Universidad Nacional Autónoma de México, Mexico City, Mexico
The non-seasonal stratification variability in the upper 400 m of the Yucatan Channel (YC) and its relationship with the Loop Current System is studied based on the analysis of long-term timescales not yet resolved in observational studies. Daily outputs from a 22-year free-running simulation performed with the HYbrid Coordinate Ocean Model were used, and the variability modes of the squared buoyancy frequency were estimated using Empirical Orthogonal Functions. Intrinsic ocean dynamics is the primary determinant of the dominant spatial and temporal variability of hydrography and dynamics in the YC. The leading mode, described by a vertical dipole at the western YC section with timescales of 1.5-7.5 years, is mainly determined by the Yucatan Current (YCu) variability. There is a strong connection between YCu dynamics, the upper YC hydrography, the Loop Current (LC) intrusion into the Gulf of Mexico, the detachment of Loop Current Eddies (LCEs), and cyclonic anomalies surrounding the LC. Intense eastward displacements of the YCu are associated with intense stratification anomalies in the western YC, the presence of cyclonic anomalies surrounding the LC southwest margin, detachments of LCEs with larger-than-average diameter, and intense LC retreat; before these eddy detachments, the LC metric values are lower than their average ones. Atmospheric forcing induces more complexity in YC dynamics and the Loop Current System; it produces a significant high-frequency signal that modifies their low-frequency behavior. The relationships found in this work could contribute to a better understanding of the upwelling development on the eastern Yucatan shelf.
1 Introduction
The Gulf of Mexico significantly influences different physical, ecological, biogeochemical, and geological processes in the North Atlantic. Extensive research has been conducted on characterizing the mean state and variability of the hydrography and ocean circulation of the Gulf, essential for better understanding its dynamics, diversity, and productivity under actual and future conditions (Sturges et al., 2005; Jochens and DiMarco, 2008; Yoskowitz et al., 2013; Moreles et al., 2021). The main circulation pattern and source of variability in the Gulf is the Loop Current System, consisting of the Loop Current (LC), which originates in the Yucatan Channel (YC) as the Yucatan Current (YCu), and the Loop Current Eddies (LCEs) (Schmitz et al., 2005; Sturges et al., 2005; NASEM, 2018; Hamilton et al., 2019). Figure 1 shows schematic representations of the main circulation features in the eastern Gulf of Mexico and relevant physiographic characteristics.
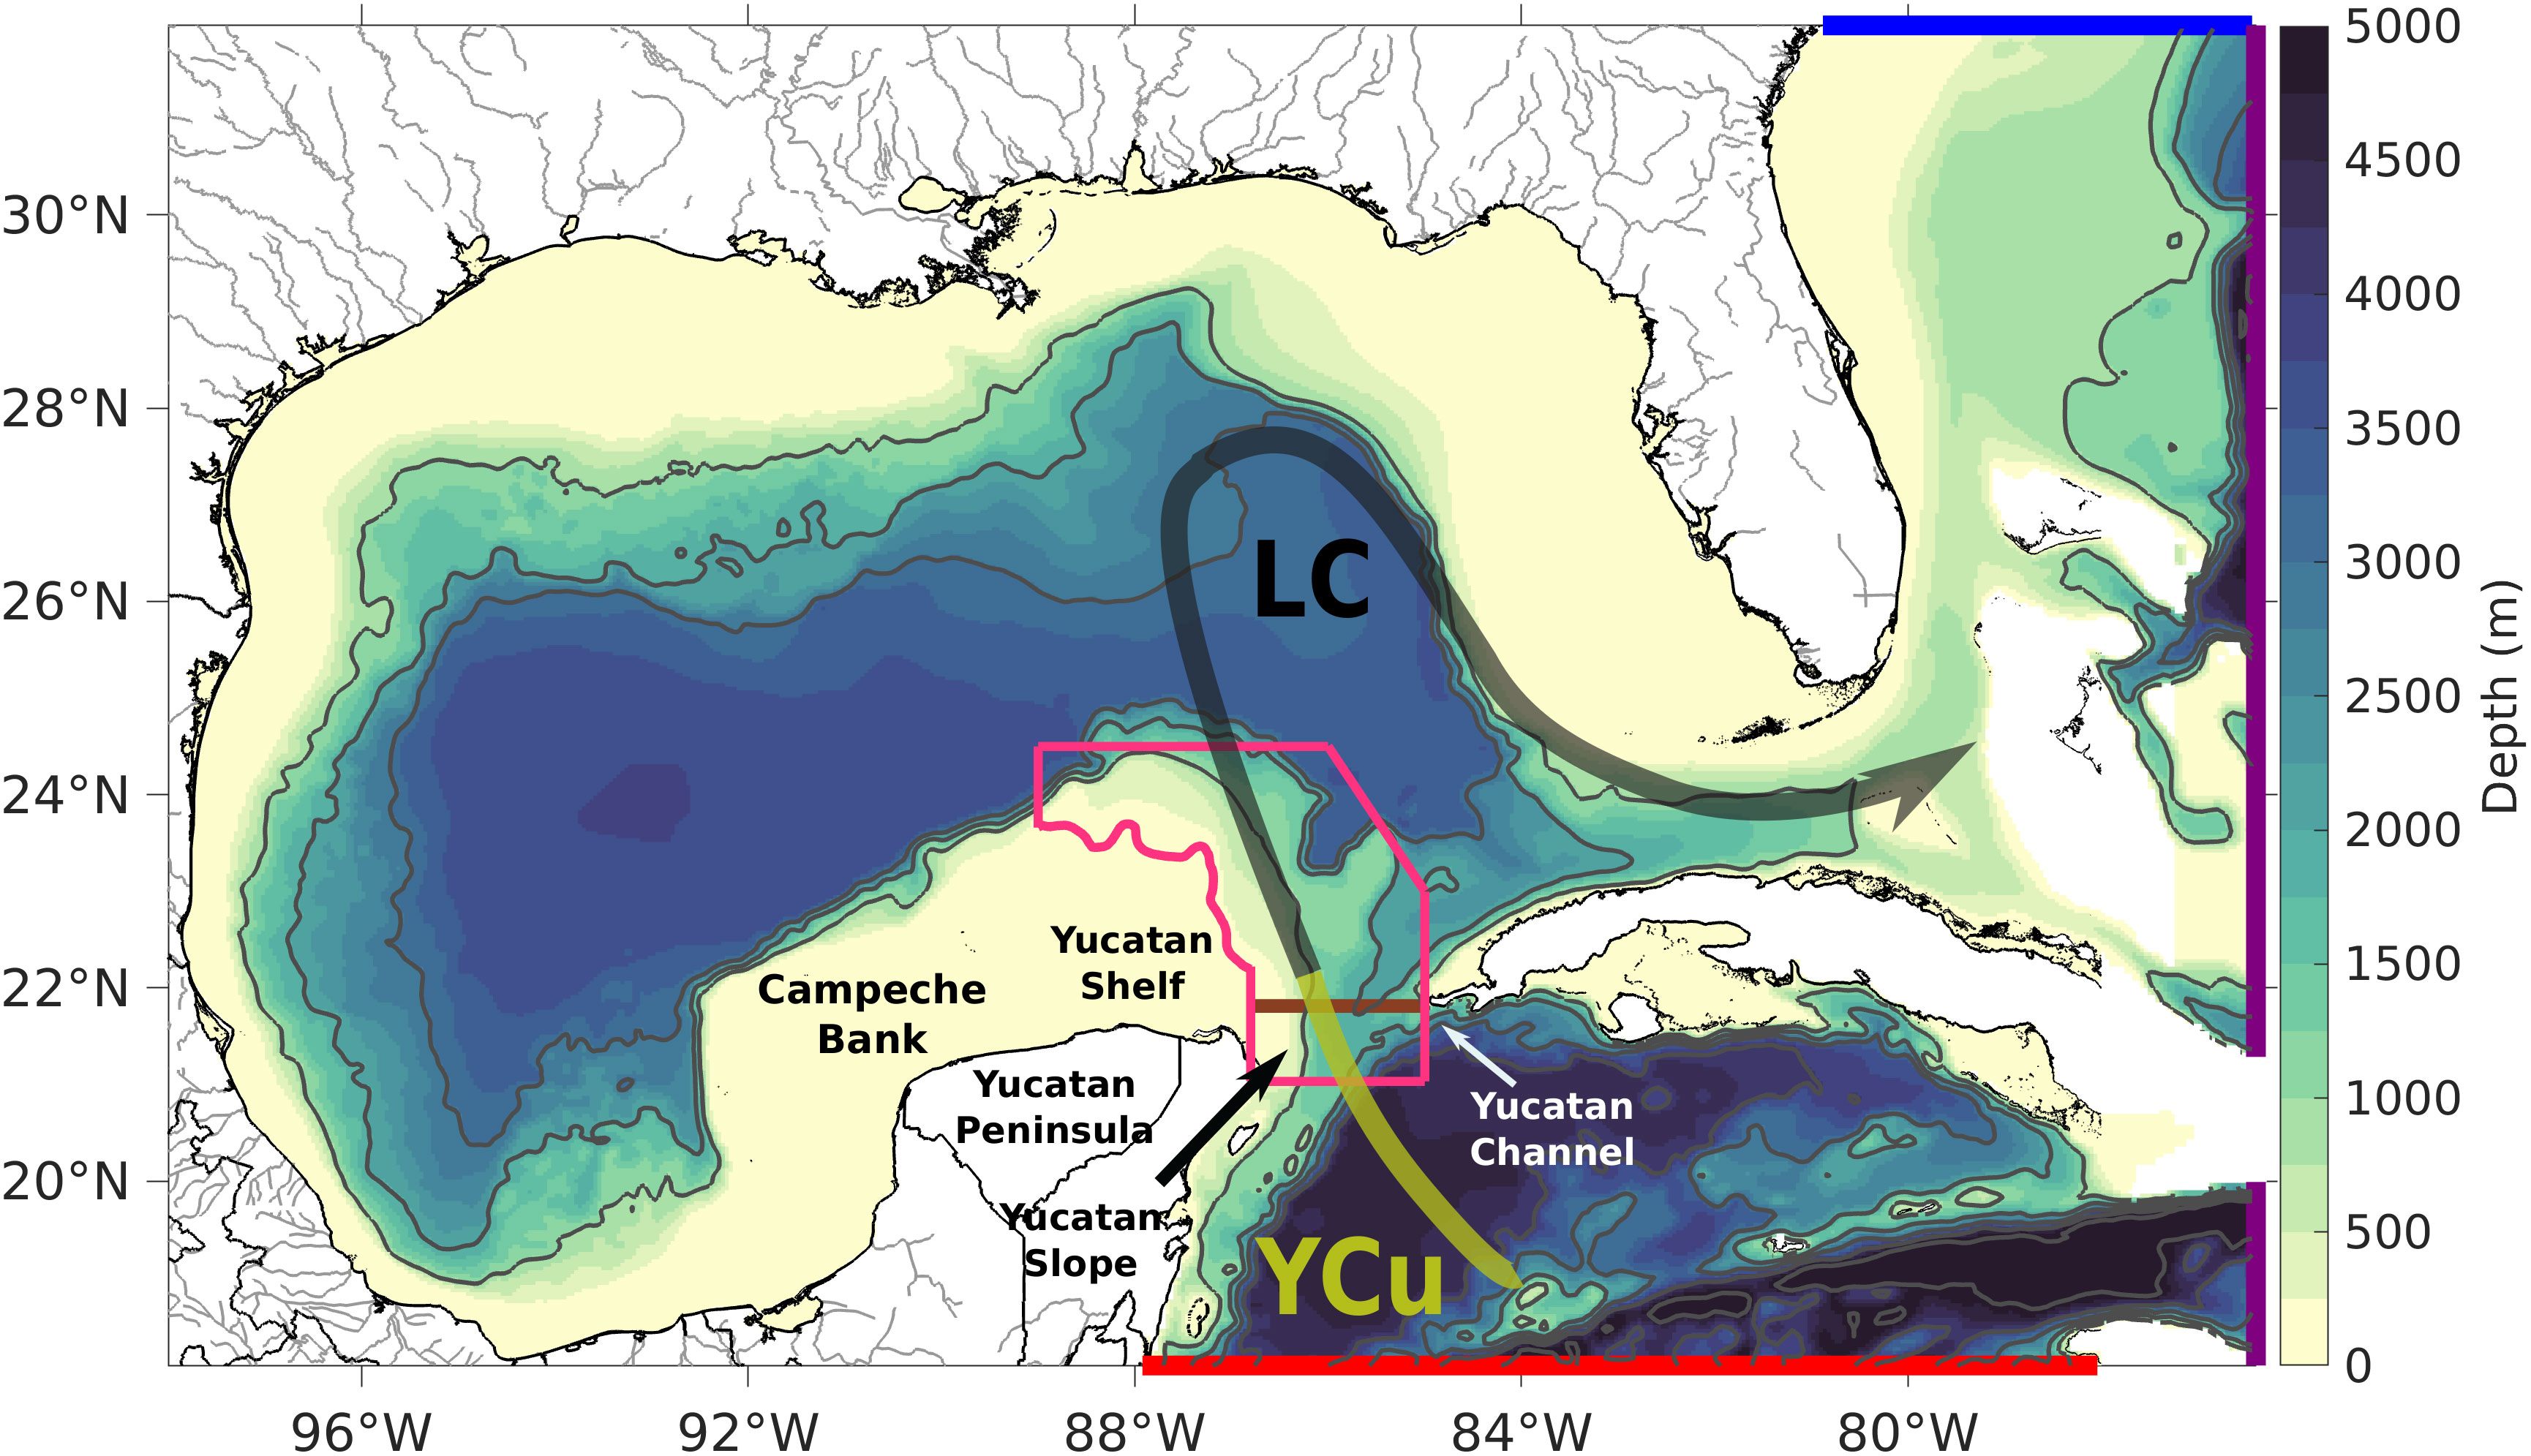
Figure 1 Map of the horizontal domain used to simulate the Gulf of Mexico hydrodynamics. Blue, purple, and red lines indicate the north, east, and south open boundaries. The main circulation features in the eastern Gulf and relevant physiographic characteristics are also represented. The brown line at 21.81° N indicates the transect used to analyze stratification variability across the Yucatan Channel. The pink polygon encloses the domain A1 (roughly south-limited by the 100m isobath) used to compute sea surface height anomalies. The gray contours represent the 1000, 2000, and 3000 m isobaths.
There is a strong relationship between YCu dynamics and YC hydrography (Candela et al., 2002; Ezer et al., 2003; Marín et al., 2008; Lin et al., 2009; Athie et al., 2011; Athié et al., 2012; Ramos-Musalem, 2013; Sheinbaum et al., 2016; Androulidakis et al., 2021), which significantly influences the region’s vital ecological and biogeochemical processes, e.g., the macro-nutrient and oxygen supply over the continental shelf and coral reef ecosystem (Gruber, 2011; Jacox and Edwards, 2011; Carrillo et al., 2016; Reyes-Mendoza et al., 2019; Androulidakis et al., 2021). Merino (1997), Reyes-Mendoza et al. (2016), and Jouanno et al. (2018) found that the interaction of the YCu with the Yucatan shelf establishes bottom Ekman pumping, which may contribute to the water upwelling with temperatures between 16.0-22.5°C at the northeastern tip of the Yucatan Peninsula. Enríquez and Mariño-Tapia (2014) found that the northeastward displacement of the YCu path enhances the Yucatan upwelling; Carrillo et al. (2016) related the isopycnals uplift in that region with an intensified YCu northward flow; Jouanno et al. (2018) suggested a relationship between a strengthened LC flow along the eastern Yucatan shelf and the enhancement of the Yucatan upwelling associated with higher stratification in the middle of the water column.
Relationships between the dynamics in the YC region and the Loop Current System behavior have also been explored: the structure of the YC transport and LC dynamics (Sheinbaum et al., 2002; Abascal et al., 2003; Ezer et al., 2003; Lin et al., 2009; Athié et al., 2015; Moreles et al., 2021), LC frontal eddies (Zavala-Hidalgo et al., 2003; Schmitz, 2005; Le Hénaff et al., 2012), cyclones blocking the LC (Zavala-Hidalgo et al., 2006), vorticity flux through the YC and LC dynamics (Candela et al., 2002; Oey, 2004), and relationships between YCu longitudinal displacements and LCE detachments (Ezer et al., 2003; Marín et al., 2008; Athie et al., 2011; Athié et al., 2012; Sheinbaum et al., 2016; Androulidakis et al., 2021). Roughly 90% of the water transport through the YC occurs above 400 m depth (Rousset and Beal, 2010; Candela et al., 2019), where the stratification is the strongest and has the highest variability related to the YCu flow structure. Therefore, significant relationships exist between YCu dynamics, the upper YC stratification, and the Loop Current System behavior.
Previous research has outlined meaningful relationships between YCu dynamics, upper YC hydrography, and the Loop Current System. However, these relationships need to be further investigated. Relationships obtained with simplified and theoretical models must be verified in more complex and realistic simulations or using long-term observations. An in-depth analysis of the YC stratification is still needed, which defines its long-term nature, spatial and temporal variability, relationship with YCu dynamics and the Loop Current System behavior, and causal relationships. Such an analysis is urgently needed due to the expected increase in the Gulf upper ocean stratification associated with climate change (Gruber, 2011; Yamaguchi and Suga, 2019). Exploring these processes is crucial to understanding the Loop Current System and predicting its response to climate change (Moreles et al., 2021).
This work aims to characterize the dominant non-seasonal stratification variability across the YC and its connection with YCu dynamics and the Loop Current System behavior. In order to achieve this aim, long-term free-running simulations of the Gulf hydrodynamics performed with an oceanic general circulation model were implemented to obtain statistically and physically consistent relationships between those processes. Statistical modes of variability were obtained from the buoyancy frequency squared using the Empirical Orthogonal Functions analysis. Also, analyses of different hydrographic variables across the YC and the LC metrics were conducted to identify relationships between those processes and to obtain insights into the causal relationships of the YC stratification. Simulations with incremental complexity and realism were implemented to achieve these goals: that is, the previously outlined analyses were first carried out considering only ocean dynamics and then incorporating the effects of atmospheric forcing, i.e., including mass, momentum, and energy fluxes between the ocean and the atmosphere.
2 Methods and data
2.1 The numerical simulations
In order to adequately represent the long-term statistics of the intrinsic YC stratification variability, long-term data with sufficient spatial and temporal sampling are needed. Long-term free-running simulations performed with oceanic general circulation models are valuable tools to achieve this goal, as they provide physically consistent descriptions of ocean dynamics satisfying the primitive equations. According to Morey et al. (2020), the HYbrid Coordinate Ocean Model, the Regional Ocean Modeling System, and the MIT General Circulation Model have the necessary dynamics to realistically represent and adequately describe the hydrodynamics of the Gulf of Mexico, its mean circulation, its deep circulation, and its variability.
In this study, the HYbrid Coordinate Ocean Model was used to simulate the Gulf of Mexico hydrodynamics, as it provides optimal simulation of coastal and open-ocean circulation features given its generalized hybrid vertical coordinate system (Bleck, 2002; Chassignet et al., 2007). A free-running simulation was configured with a horizontal domain of [98°W, 77°W] × [18°N, 32°N] (Figure 1), a spatial resolution of 1/25° ( 3.8-4.2 km), and 41 hybrid vertical layers, which are mainly isopycnal layers in the open ocean below the mixed layer and z-layers above it. The model bathymetry is a blended product that incorporates the one from the HYbrid Coordinate Ocean Model Consortium (hycom.org), the General Bathymetric Chart of the Oceans, and observations collected during several cruises. Monthly climatology river inflow is simulated at 40 locations along the coast, no data assimilation was used, and no tidal dynamics was incorporated. The simulations were nested within the 1/12° Global Ocean Forecasting System 3.1 reanalysis GLBv0.08-53.X (HYCOM-GOFS3.1, n.d.) using monthly open boundary conditions from a climatology of 22 years (1994–2015) of the model.
Twin simulations with incremental complexity and realism were performed to help obtain an in-depth description of the analyzed processes and reveal causal relationships between them. The main characteristics of each simulation and their differences are indicated below:
● Experiment without atmospheric forcing (NoAF). It focused on stratification variability attributable to ocean conditions in the absence of atmospheric forcing, referred to in this study as “intrinsic ocean dynamics.” Thus, it did not incorporate atmospheric forcing given by energy and momentum fluxes between the ocean and the atmosphere and river inflow.
● Experiment with atmospheric forcing (AF). It expanded the analysis by considering a more realistic experiment that included atmospheric forcing. The atmospheric forcing was obtained from the Climate Forecast System Reanalysis from 1994-2015 (NCEP-CFSR, n.d.), which comprises hourly fields of 10 m wind speed, 2 m air temperature, 2 m atmospheric humidity, surface shortwave and longwave heat fluxes, surface atmospheric pressure, and precipitation. Wind stress is computed via bulk formulae during the model execution considering the speed of ocean currents.
Both experiments share the same initial conditions. They were initialized from the mean state of January 1994 of the global reanalysis, with their target densities along the vertical inherited from the global reanalysis, and they were run from 1994-2015 (22 years) to be consistent with the boundary conditions. Instantaneous daily outputs were recorded and used for the analysis.
Experiment AF is the most realistic simulation; it represents the control run and is thus the one that was validated. The validation of variables related to stratification is shown in the Supplementary Material. Olvera-Prado et al. (2022) thoroughly validated this experiment, including mean circulation and transport, the Loop Current System, and energy fields. The conjoint validation showed a good agreement between the simulation outputs and observations. The validation results provide very high confidence in obtaining accurate and credible results.
2.2 Stratification measure
As a stratification measure, the buoyancy frequency squared () was considered (Gill, 1982; Jackett and McDougall, 1995),
where is the acceleration of gravity, is the locally referenced potential density, and is the vertical coordinate (negative downwards from the sea surface). measures the stability of a parcel of fluid, where the stability and instability conditions are given by positive and negative values of , respectively. This variable was computed along a latitudinal transect across the YC at 21.81°N, which was selected to represent the variability and dynamics at the YC (brown line in Figure 1). The SeaWater library of EOS-80 seawater properties (Morgan and CSIRO, 1994; Jackett and McDougall, 1995) was used to compute from daily model outputs of temperature and salinity fields. Daily profiles were obtained in the upper 400 m (from 5 to 395 m depth), with a vertical resolution of 10 m and longitudinally interpolated every 0.02°.
In order to reduce small-scale spatial variations in , each profile was smoothed using a low-pass Lanczos filter with a cut-off frequency of 1/3 and 3 weights. The variability analysis focuses on the mesoscale, i.e., ocean signals with horizontal scales of 50-500 km and time scales of 10-100 days (CTOH, 2013). Therefore, the time series were time-filtered using a low-pass Lanczos filter with a 45-day cut-off period and 61 weights; this filter will be called the mesoscale temporal filter.
2.3 Analysis of stratification variability and description of the Loop Current System
The YC stratification variability was analyzed from the field using the Empirical Orthogonal Functions (EOFs) technique. This technique derives the dominant patterns of variability from a field, characterizing its state in terms of statistical modes of variability, which contain a fraction of the total variance of the data. Each mode is represented by a spatial pattern and its evolution time series or principal component (PC) (Storch and Zwiers, 1999). The trend and annual cycle were removed from the field, its corresponding covariance matrix was constructed, and its variability modes were obtained. Results refer to the upper section of the YC, calculated at the latitudinal transect shown in Figure 1, and do not necessarily reflect the whole dynamics in the YC.
The proportion of the total variance of the data explained by a particular mode is represented by its proportion of explained variance, given by
where is the original data and is its reconstruction using a particular mode. The regions with a large proportion of explained variance are the most significant in describing the associated spatial patterns.
The description and time monitoring of the Loop Current System were addressed using the LC metrics proposed by Hamilton et al. (2000), who used a specific contour of the sea surface height as a proxy for the LC location. From the location of the LC, its metrics can be calculated: its northernmost latitude (LCNL), westernmost longitude (LCWL), length (LCL), and area (LCA). By plotting the LC metrics as time series, the LC intrusion is identified by a sustained increase in the time series, whereas the LCE detachment events are identified with the local minima in the series after an extended LC intrusion. Then, the LCE metrics can be calculated: the shedding period (LCEP) and diameter (LCED) of the LCEs and the LC retreat latitude (LCRL), i.e., the LC northernmost latitude after the LCE detachment.
The LCE detachment events with and without reattachments to the mean LC flow were identified; the LCE detachments not followed by a reattachment to the mean LC flow were called LCE separations. The relationship between the YC stratification variability and LC evolution was examined by comparing the resulting PC time series and LC metrics.
3 Results
3.1 Spatial variability of stratification in the Yucatan Channel
The primary mechanism that forces the YC stratification variability is the transport through the YC, mainly determined by the YCu. YCu dynamics is a crucial determinant of the vertical and horizontal hydrographic structure on the eastern coast of the Yucatan Peninsula (Enríquez and Mariño-Tapia, 2014; Carrillo et al., 2016; Reyes-Jiménez et al., 2023). Geostrophic balance arguments allow outline relationships between the zonal position of the YCu core (YCuZP), YCu transport, sea surface slope, and uplifting of isotherms (Athie et al., 2011; Athié et al., 2012; Athié et al., 2015). Since the structure of the meridional velocity through the YC strongly influences the YC stratification, a description of the spatial variability of the meridional velocity through the YC is first presented (Figure 2) and then referred to when describing the EOFs of (Figure 3). By contrasting the results for experiments NoAF and AF, it is possible to evaluate the influence of atmospheric forcing on different oceanic processes in the YC.
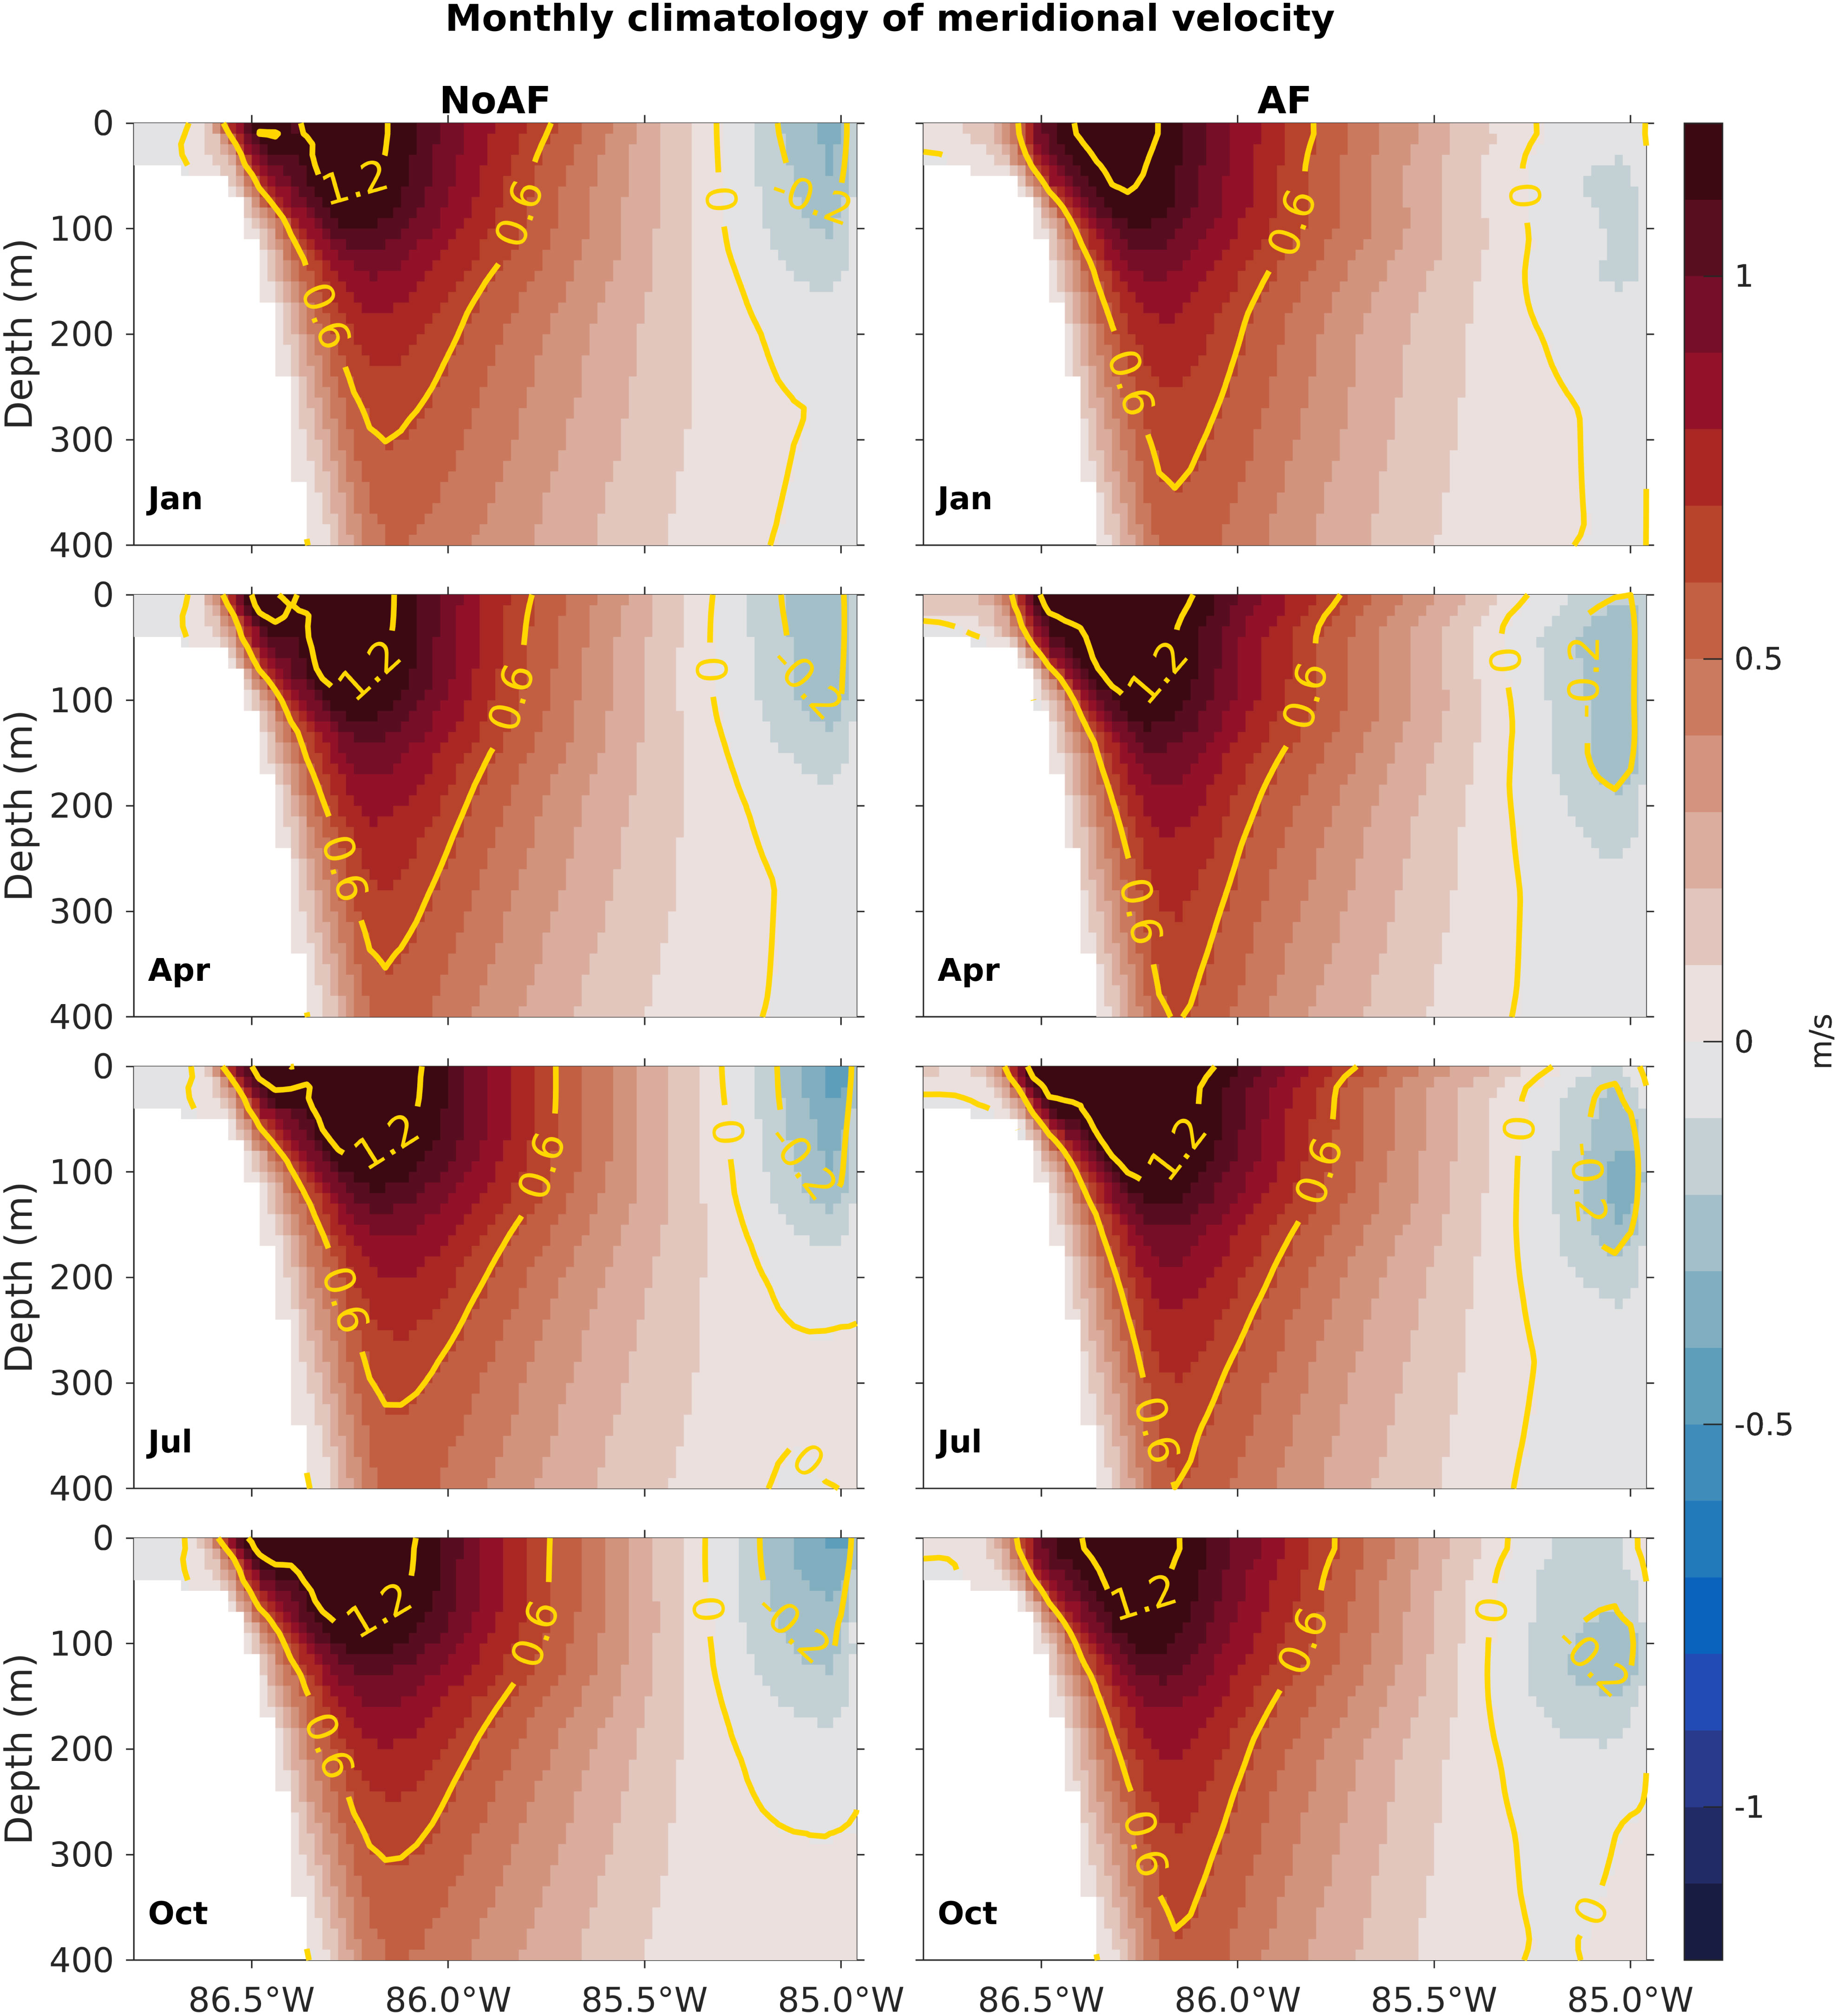
Figure 2 Monthly climatology of meridional velocity through the Yucatan Channel for experiments NoAF and AF. The velocity amplitude is represented in color scale, where red and blue represent northward and southward velocity, respectively. Yellow contours indicate the isotachs of -0.2, 0.0, 0.6, and 1.2 m/s.
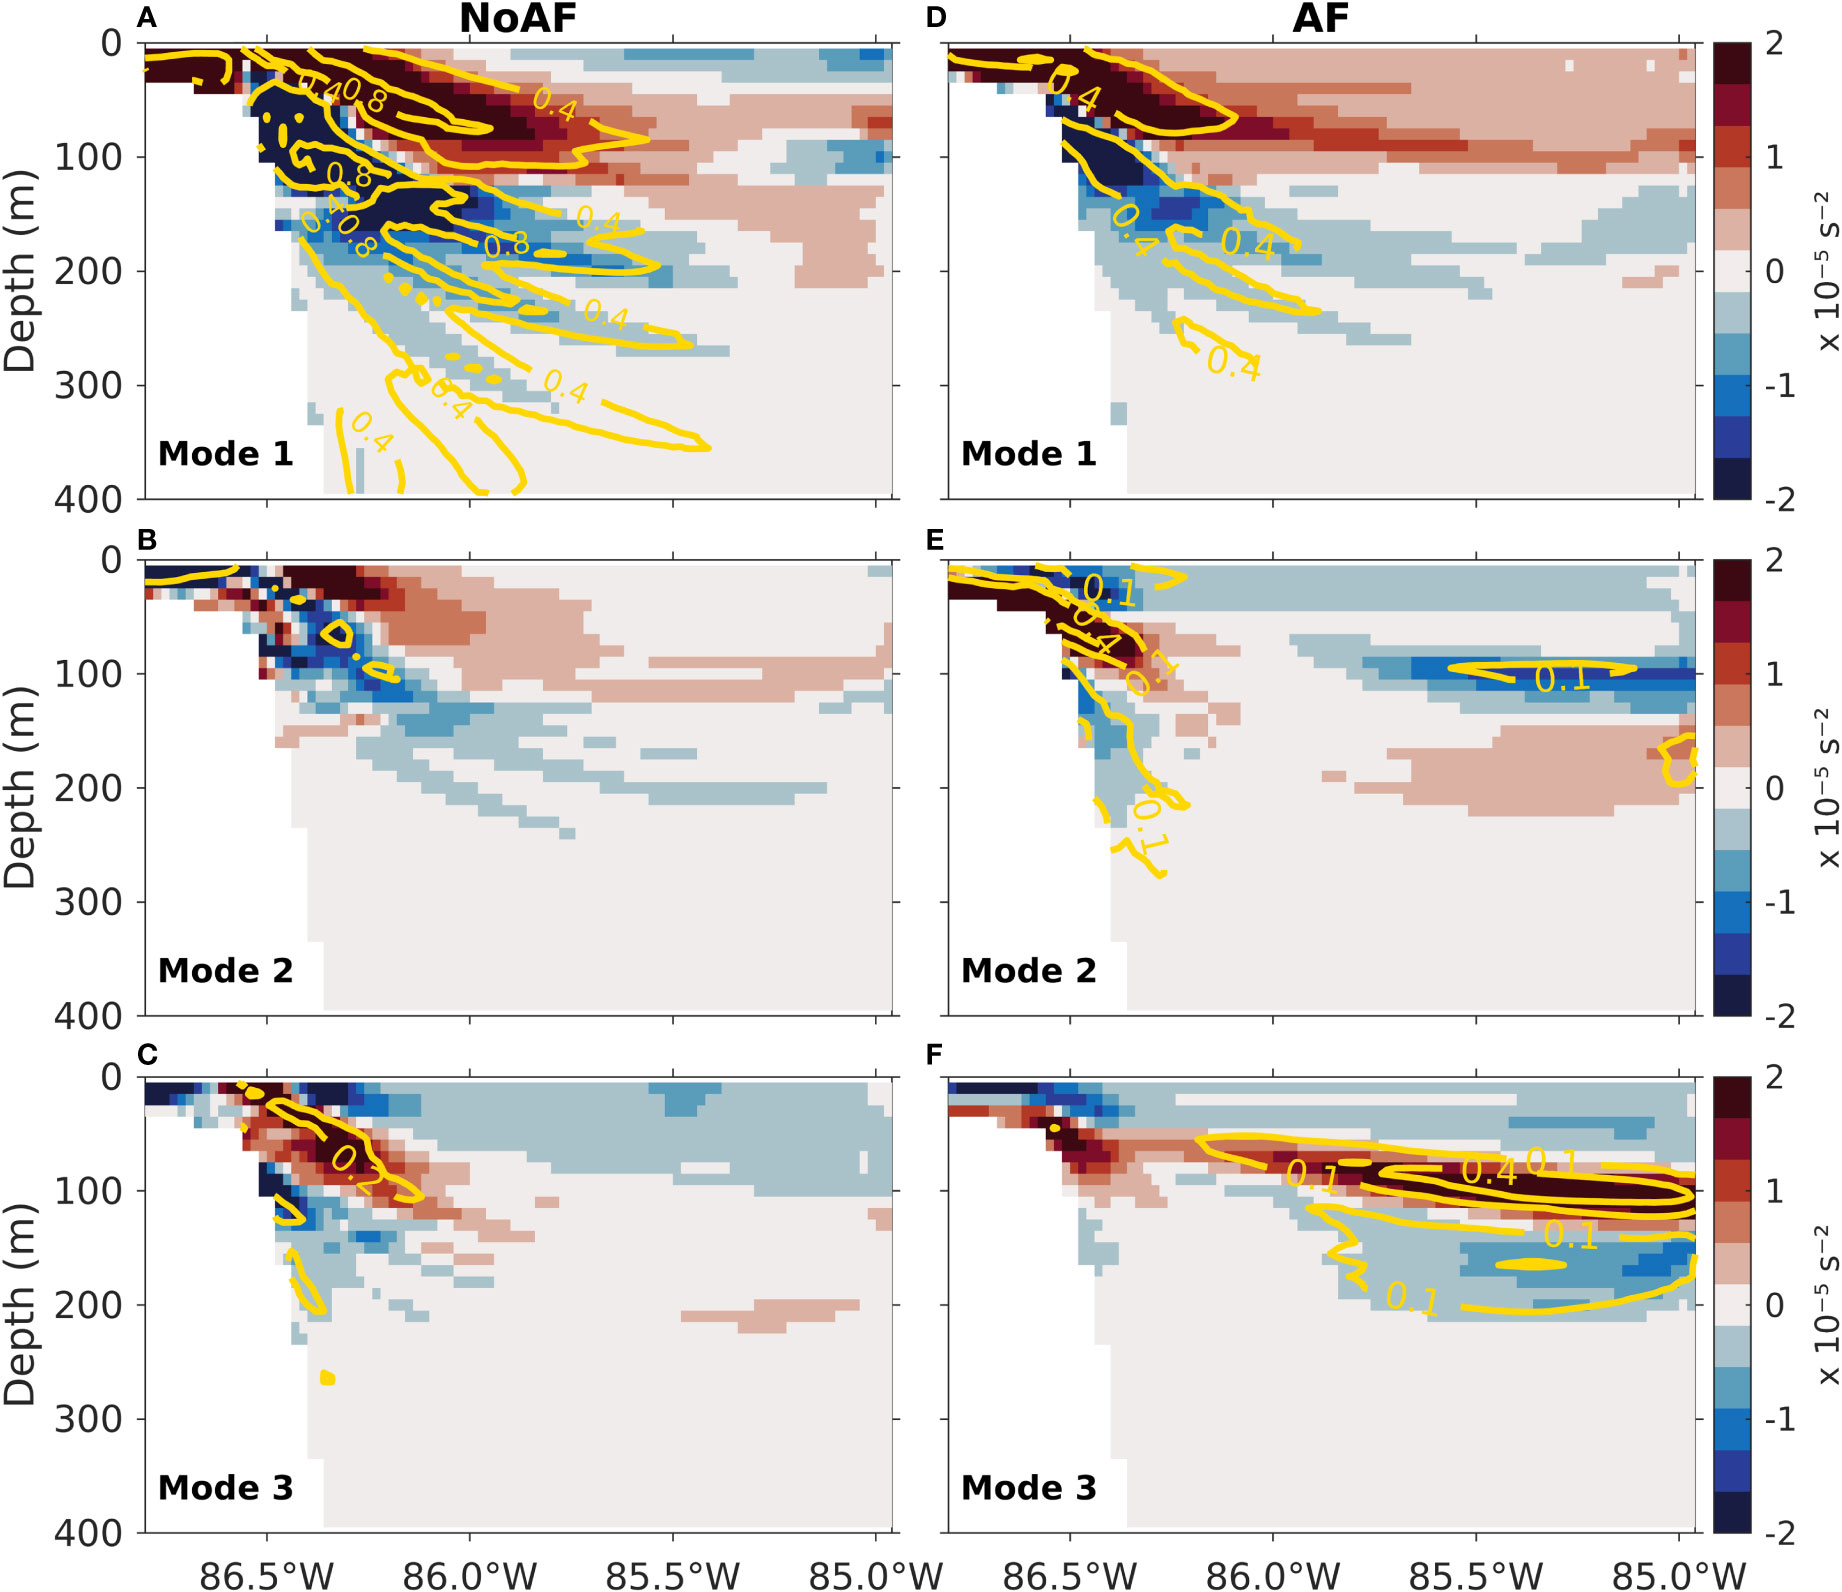
Figure 3 Spatial patterns of the first three EOFs of for experiments NoAF (A–C) and AF (D–F). The pattern amplitude is represented in color scale, and yellow contours represent its proportion of explained variance.
Figure 2 shows a monthly climatology of meridional velocity through the YC for experiments NoAF and AF, considering the 22 years of simulation. The velocity amplitude is represented in color scale, with red and blue representing northward and southward velocity, respectively, whereas yellow contours indicate specific isotachs. For both experiments, two main velocity structures are identified. The first is a very intense northward current in the western YC, associated with the YCu, which is very persistent throughout the year. The second is a less intense southward current near Cuba, present all year round.
For experiment NoAF (panels of the first column in Figure 2), the variations in the velocity structures are mainly associated with the YCu; thus, the dominant variability is located in the western YC and is the following:
1. The YCu core, delimited by the 0.6 m/s isotach (Athie et al., 2011), extends horizontally from the middle YC (around 85.7°W) to the Yucatan slope and extends vertically from the surface to about 300 m depth, reducing its width with depth. In spring, the YCu core has its minimum width, reaching up to 85.78°W on the surface, and reaches its maximum depth of about 360 m. As the year progresses, its horizontal extension slightly increases, and its vertical extension decreases, reaching its minimum depth of just 300 m in winter.
2. The structure of the southward current near Cuba is very persistent, without appreciable variations throughout the year. It is confined east of 85.4°W mainly in the upper 180 m of the water column, with intensities of about 0.2 m/s.
For experiment AF (panels of the second column in Figure 2), in contrast to experiment NoAF (panels of the first column in Figure 2), the YCu core reaches greater depths, and the southward current near Cuba exhibits significant variations throughout the year. The inclusion of atmospheric forcing modified the YCu with a non-seasonal behavior and established a seasonal variation of the southward current near Cuba. The variations in the velocity structures are the following:
1. In winter, the horizontal and vertical extension of the YCu core is the minimum, reaching up to 85.8°W on the surface and 350 m in depth. In spring, the YCu core increases its horizontal extension and reaches its maximum depth of more than 400 m. During summer, the YCu core reaches its maximum horizontal extension and slightly decreases its depth to about 400 m. In fall, the YCu core starts decreasing its horizontal extension and continues decreasing its vertical extension until reaching their minima in winter.
2. The southward current near Cuba is confined east of 85.4°W as in experiment NOAF, but with a vertical extension strongly varying throughout the year. During winter, the current is feeble and extends from 50-150 m depth. It intensifies during spring, reaching its maximum vertical extension from 0-250 m depth. During summer and fall, it weakens and reduces its vertical extension until reaching their minima in winter.
Now, the most important variability modes of are analyzed. Table 1 shows the contained variance in the first three modes, which constitute a non-degenerate set according to the rule of thumb of North et al. (1982).
• For experiment NoAF, a high percentage of the variance of is contained in the first mode (54%), representing the dominant variability of YC upper stratification. The high variance contained in the first mode evidences the YC upper stratification as a discernible mechanism, with most of the processes involved in its dynamics encompassing a single mode of variability. Results suggest that the stratification variability determined by ocean dynamics is non-complex and easy to describe. Hence, it is possible to associate the principal mode of variability with relevant physical processes, like the LC.
• When including atmospheric forcing, the stratification variance is distributed in a larger number of modes. Even three modes of experiment AF are not enough to gather the contained variance in the principal mode of experiment NoAF. Atmospheric forcing adds relevance to the higher-order modes and produces a more complex stratification variability, making it more difficult to associate physical processes with the resulting variability.
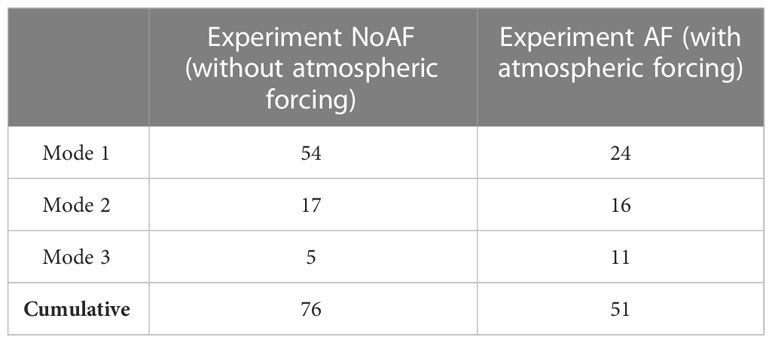
Table 1 Percentage of the total variance contained in the first three modes of for experiments NoAF and AF.
The spatial patterns of the EOFs of (Figure 3) are expected to identify the regions with high variability in the meridional velocity (Figure 2). Figure 3 shows the spatial patterns of the first three modes of for experiments NoAF and AF, in which the pattern amplitude is represented in color scale, and yellow contours represent its proportion of explained variance. The spatial patterns are described below:
1. The spatial pattern of the first mode in experiment NoAF (Figure 3A) consists of a well-defined structure of two anomalies with opposite signs at the western region, in the upper 250 m: an upper positive anomaly (the red-colored region) ranging from near the surface over the Yucatan slope to around 100 m depth at 85.5°W, and a lower negative one (the blue-colored region) extending from 50 m depth at 86.5°W to around 200 m depth at 85.5°W.
2. In experiment AF, the same bipolar spatial pattern occurs in the first mode but with a lower horizontal extension (Figure 3D).
3. In experiment NoAF, the spatial variability of modes 2 and 3 (Figures 3B, C) is located in the western YC and displays characteristics similar to mode 1. However, the regions with a large proportion of explained variance are small.
4. In contrast to experiment NoAF, the higher-order variability patterns are drastically modified in experiment AF when adding atmospheric forcing. Mode 2 mainly describes the variability of a positive anomaly in the western YC between 15 m depth and the Yucatan shelf (Figure 3E). Mode 3 shows high variability in the eastern YC (Figure 3F); it represents a bipolar anomaly consisting of an upper positive anomaly between 60 and 120 m depth and a lower negative one between 130 and 210 m depth. Variations in the intensity and extension of the southward current near Cuba (panels of the second column in Figure 2) may account for this variability. However, due to the small contained variance in Mode 3 in experiment AF (Figure 3F), its association with observed hydrodynamics variability in the eastern region must be addressed cautiously.
Since the high variance contained in the first mode for experiments NoAF and AF (Table 1) and their similitude (Figures 3A, D), these patterns are suggested to represent the fundamental and dominant variability of the YC stratification without and with atmospheric forcing. These results add to the evidence supporting YCu dynamics, specifically the variations in the YCu core, as the mechanism determining the dominant variability of the YC stratification.
3.2 Dominant variability of stratification and hydrography in the Yucatan Channel
This subsection analyzes, for experiments NoAF and AF, the timescales and relationships between the following processes:
1. The dominant variability of the YC stratification described by the principal component of the first mode (PC1).
2. The YCu core’s behavior. This is described by the time series of YCuZP, calculated as the longitude where the vertical average of the meridional velocity from the surface to 130 m depth along the computing transect reaches its maximum value. Similar to the processing of the data, the annual cycle was removed from this series, and the resulting anomalies were time-filtered using the mesoscale temporal filter. Figures 4A, F show the time series of PC1 and YCuZP.
3. The western YC hydrography. This was analyzed through Hovmuller diagrams of velocity and temperature at specific depths and longitudes across the YC. As illustrative cases, the meridional (Figures 4B, G) and zonal (Figures 4C, H) velocity components at 60 m depth and the temperature above the Yucatan slope at 86.42°W (Figures 4D, I) were calculated. To fully appreciate the physical characteristics of these fields, they are shown without the annual cycle removed in the Hovmuller diagrams but with the corresponding mesoscale temporal filtering.
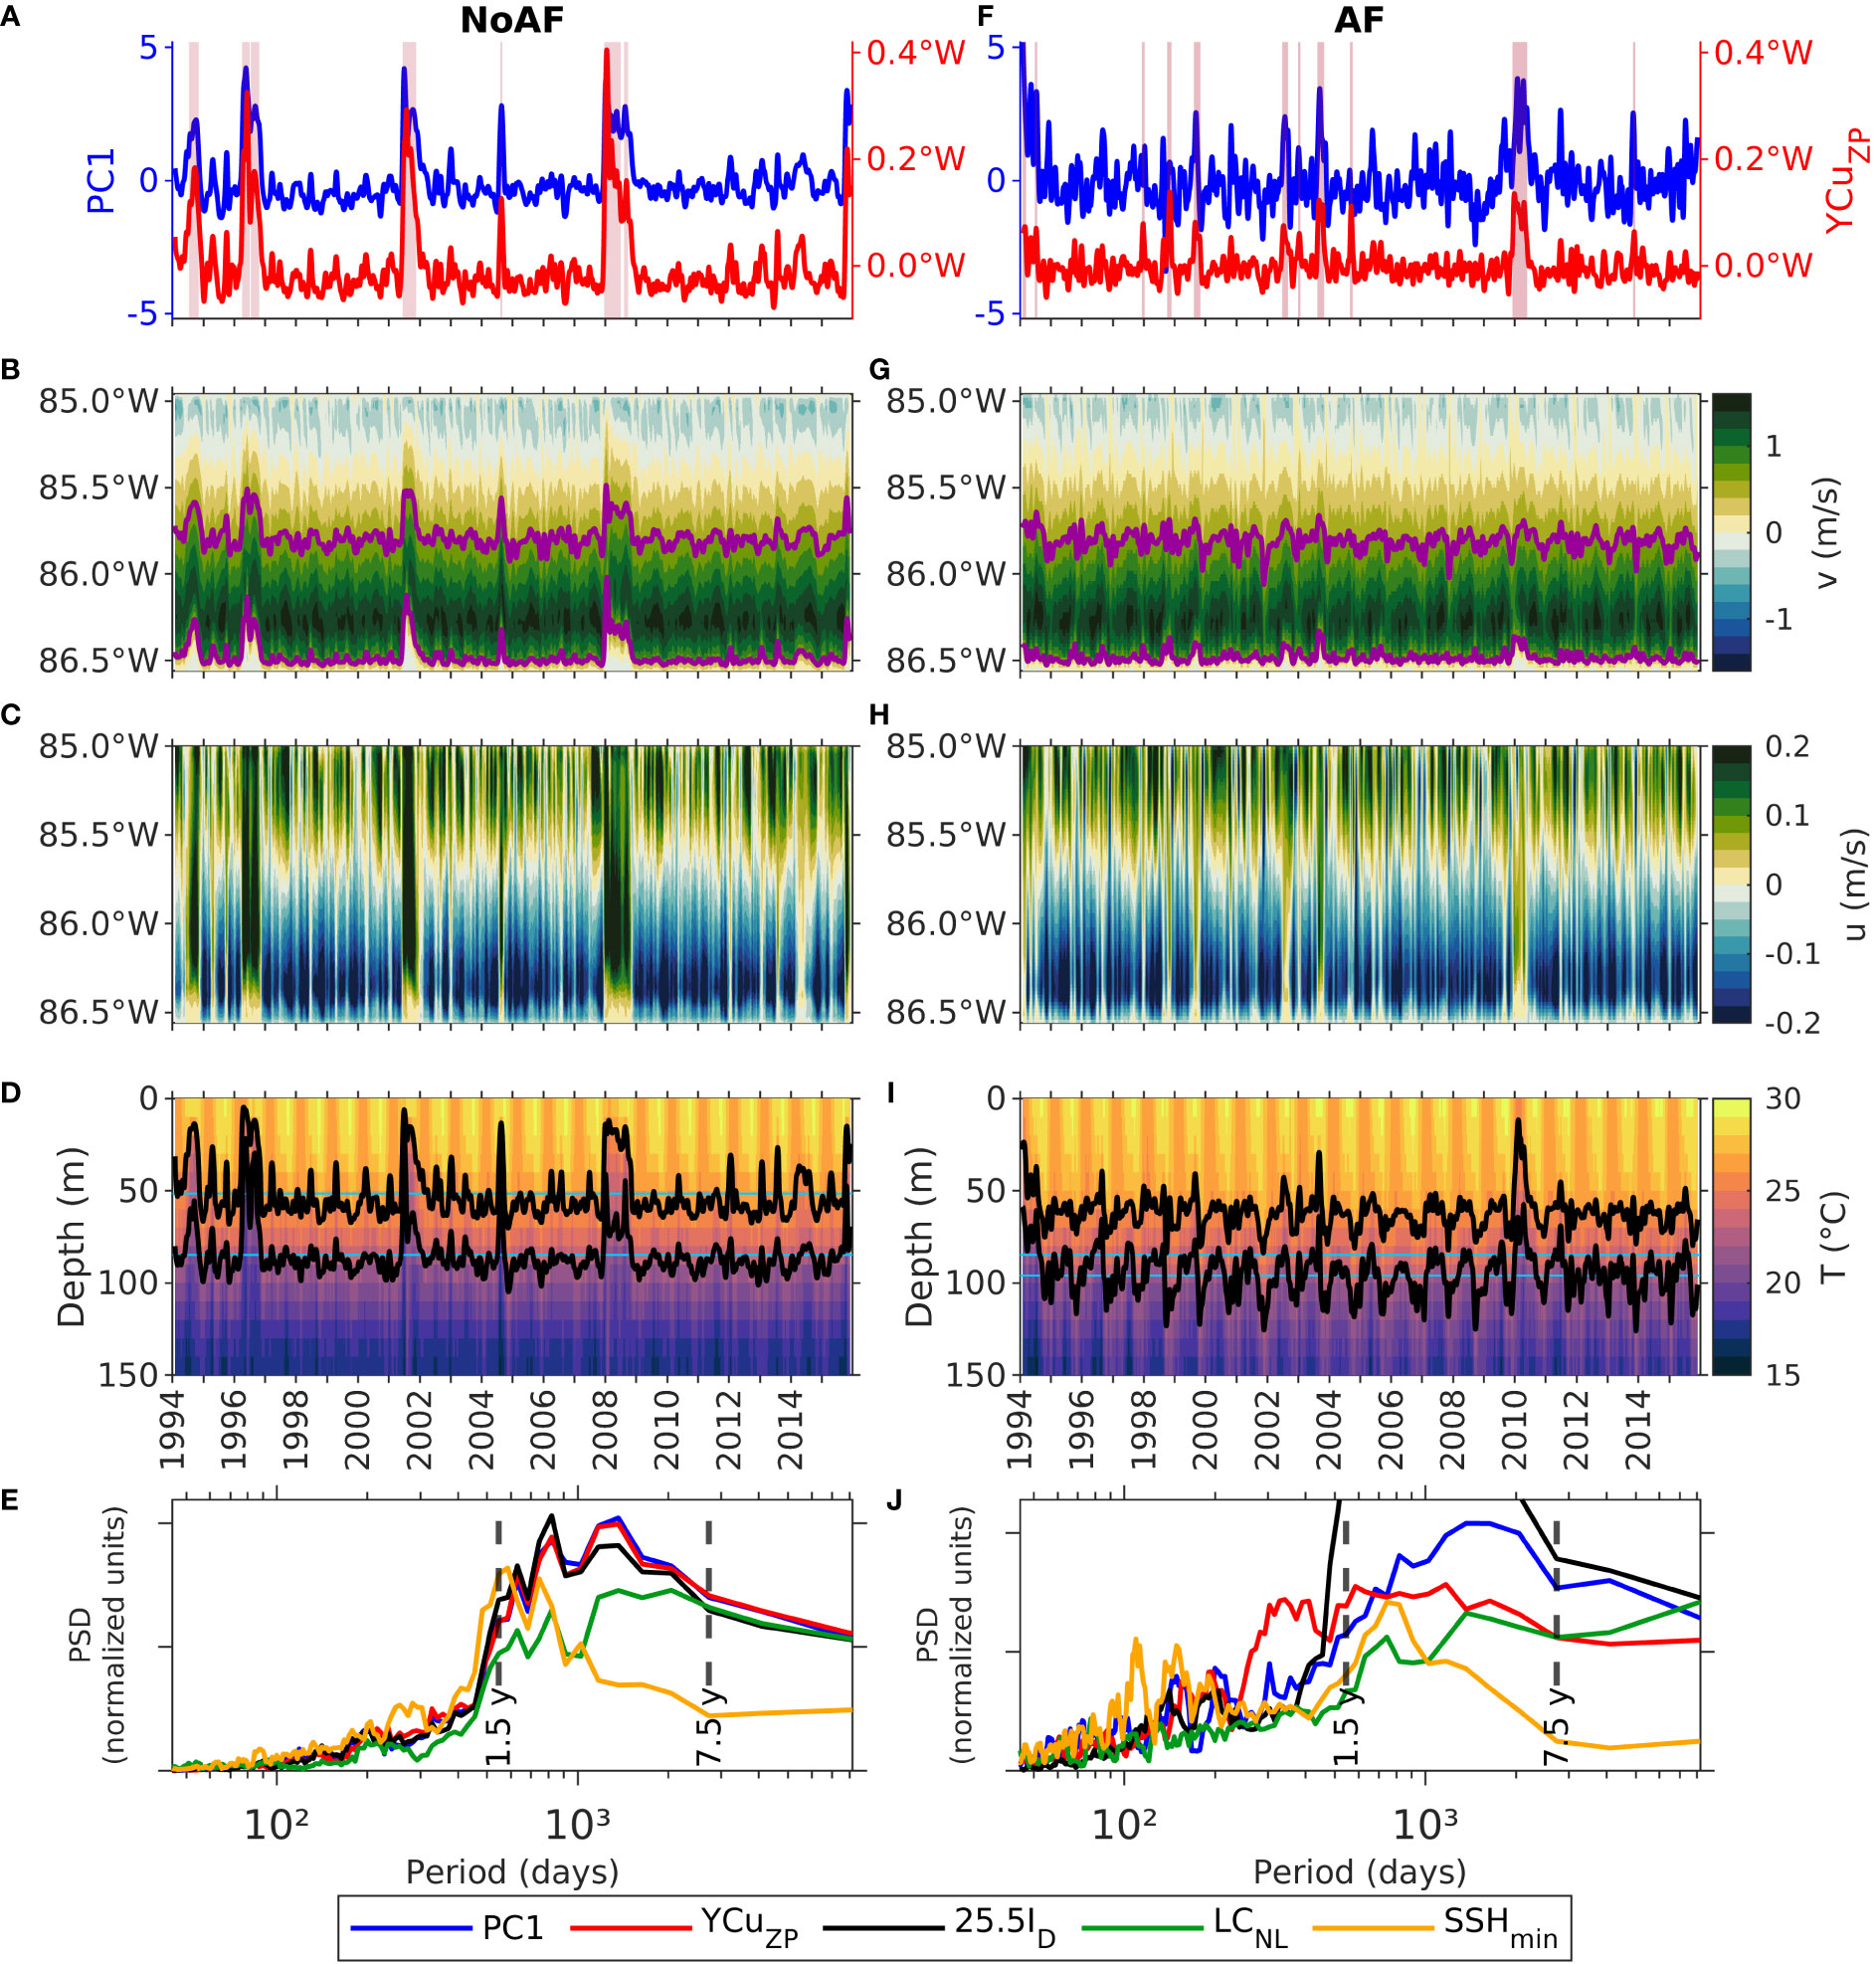
Figure 4 (A) Time series of the first principal component (PC1) and anomalies of the zonal position of the YCu core (YCuZP) for experiment NoAF, with the +YCuZP events pink-shaded. (F) Same as figure A for experiment AF. (B) Hovmuller diagram of meridional velocity at 60 m depth across the YC, highlighting the 0.6 m/s isotachs for experiment NoAF. (G) Same as figure B for experiment AF. (C) Hovmuller diagram of zonal velocity at 60 m depth across the YC for experiment NoAF. (H) Same as figure C for experiment AF. (D) Hovmuller diagram of temperature at 86.42°W across the YC, highlighting the 22.0 and 25.5°C-isotherms (black lines) and their corresponding mean depth (blue lines) for experiment NoAF. (I) Same as figure D for experiment AF. (E) Power spectral density (PSD) of the anomalies of: PC1, YCuZP, depth of 25.5°C-isotherm (25.5ID), LC northernmost latitude (LCNL), and SSHmin, for experiment NoAF. (J) Same as figure E for experiment AF.
The dominant variability of the YC stratification shows notable differences when considering intrinsic oceanic dynamics and when considering the effects of incorporating atmospheric forcing:
• In experiment NoAF, the PC1 (Figure 4A) shows interannual variability. It remains negative and close to zero most of the time, corresponding to a negative and weak phase of the spatial stratification pattern in the western YC (Figure 3A). Most of the time, there are weak stratification anomalies: negative ones at the upper 100 m and positive ones between 50 and 200 m depth. At irregular time intervals, an intense positive signal in PC1 stands out. This signal characterizes intense stratification anomalies in the western YC: positive ones at the upper 100 m and negative ones between 50 and 200 m depth.
• The PC1 in experiment AF (Figure 4F) shows interannual variability and a strong high-frequency signal. PC1 exhibits high positive values at irregular intervals, in which the spatial pattern of stratification in the western YC is very similar in both experiments: intense positive stratification anomalies at the upper 100 m and negative ones between 50 and 200 m depth. The PC1 oscillates rapidly around zero, and consequently, the associated spatial pattern of stratification changes rapidly over time (Figure 3D); there is no preferred stratification state, as there is when only intrinsic ocean dynamics is considered.
A crucial dynamical factor in YC dynamics is the YCu core displacement (represented by YCuZP), which has very different behavior in experiments NoAF and AF:
• In both experiments, the YCu core is confined between the same longitudes; its west and east limits are located around 86.5°W and 85.8°W, respectively. In experiment NoAF (Figure 4B), west and east limits displace eastward consistently, producing intense eastward displacements of up to 0.4°W.
• In experiment AF (Figure 4G), the west limit displaces eastward, but the east limit displaces both westward and eastward. In some periods, such displacements are inconsistent, reducing the width and overall eastward displacements of the YCu core, with maximum displacements of about 0.1°W. Atmospheric forcing induces complex mass counterflows at the eastern YC (Figure 2), resulting in a non-corresponding behavior of the west and east limits of the YCu core (Figures 4B, G).
• The duration of the eastward displacements of the YCu core is also affected when including atmospheric forcing. In experiment NoAF, the displacements can last almost a year (Figures 4A–C), whereas, in experiment AF, the displacements are not maintained beyond a few months (Figures 4F–H).
There is a clear connection between YCuZP and PC1; in general, increments in YCuZP are concurrent with increments in PC1 (Figures 4A, F). The events of noticeable eastward displacements of the YCu core were identified by periods with YCuZP values above the 90th percentile lasting 25 or more days. These events will be referred to as the +YCuZP events (pink-shaded periods in Figures 4A, F); they occurred in 1994, 1996, 2001, 2004, and 2008 in experiment NoAF, and in 1994, late 1997, 1998, 1999, 2002, 2003, 2004, 2010, and late 2013 in experiment AF. The characteristics of the +YCuZP events are mainly associated with the YCu core behavior, as described above. Compared to experiment NoAF, in experiment AF, there are more +YCuZP events with shorter occurrence periods, shorter duration, and lower intensity.
The eastward displacements of the YCu core and the YC stratification variability are also connected with YC hydrography. Figures 4D, I show, for both experiments, a Hovmuller diagram of temperature at 86.42°W across the YC (above the Yucatan slope), highlighting the 22.0 and 25.5°C-isotherms with black lines. In both experiments, the depth of the isotherm shows interannual variability, with an emphasized seasonal behavior in experiment AF caused by the seasonal air-sea fluxes as was shown by Jouanno et al. (2018).
• The 22.0°C and 25.5°C-isotherms’ depth in experiment NoAF significantly rises during the +YCuZP events (Figure 4D), with amplitude variations of 5-70 m and 20-100 m, respectively.
• In experiment AF, the 22.0°C and 25.5°C-isotherms are deeper and exhibit higher vertical variations than in experiment NoAF (Figure 4I). The 25.5°C-isotherm has variations from 10 to 80 m, whereas the 22.0°C-isotherm has variations from 60 to 125 m. The larger vertical extent of the YCu core (panels of the second column in Figure 2) may be associated with the lower vertical position of the isotherms in experiment AF. Rises of the isotherms are concurrent with the most intense or long-lasting +YCuZP events. Results indicate a strong connection between these three phenomena in the YC.
Figure 5 shows two standard similarity measures, the root mean square similarity and Pearson’s correlation (Cassisi et al., 2012), between different variables associated with the processes of interest, where 1 indicates the maximum similarity. This figure evinces the close connection between the processes described above. The similarity between PC1, YCuZP, and 25.5ID is very high for experiment NoAF, with mean values of 0.76 and 0.94 for the root mean square similarity and Pearson’s correlation, respectively. For experiment AF, the similarity is slightly lower due to the complex interactions induced by atmospheric forcing, with mean values of 0.56 and 0.69 for the root mean square similarity and Pearson’s correlation, respectively. The similarity measures give a rough estimation of the relative importance of atmospheric forcing on the connection between the eastward displacements of the YCu core and the stratification and hydrography at the upper YC. The similarity analysis also included LCNL and SSHmin, but their description is addressed in section 3.3.
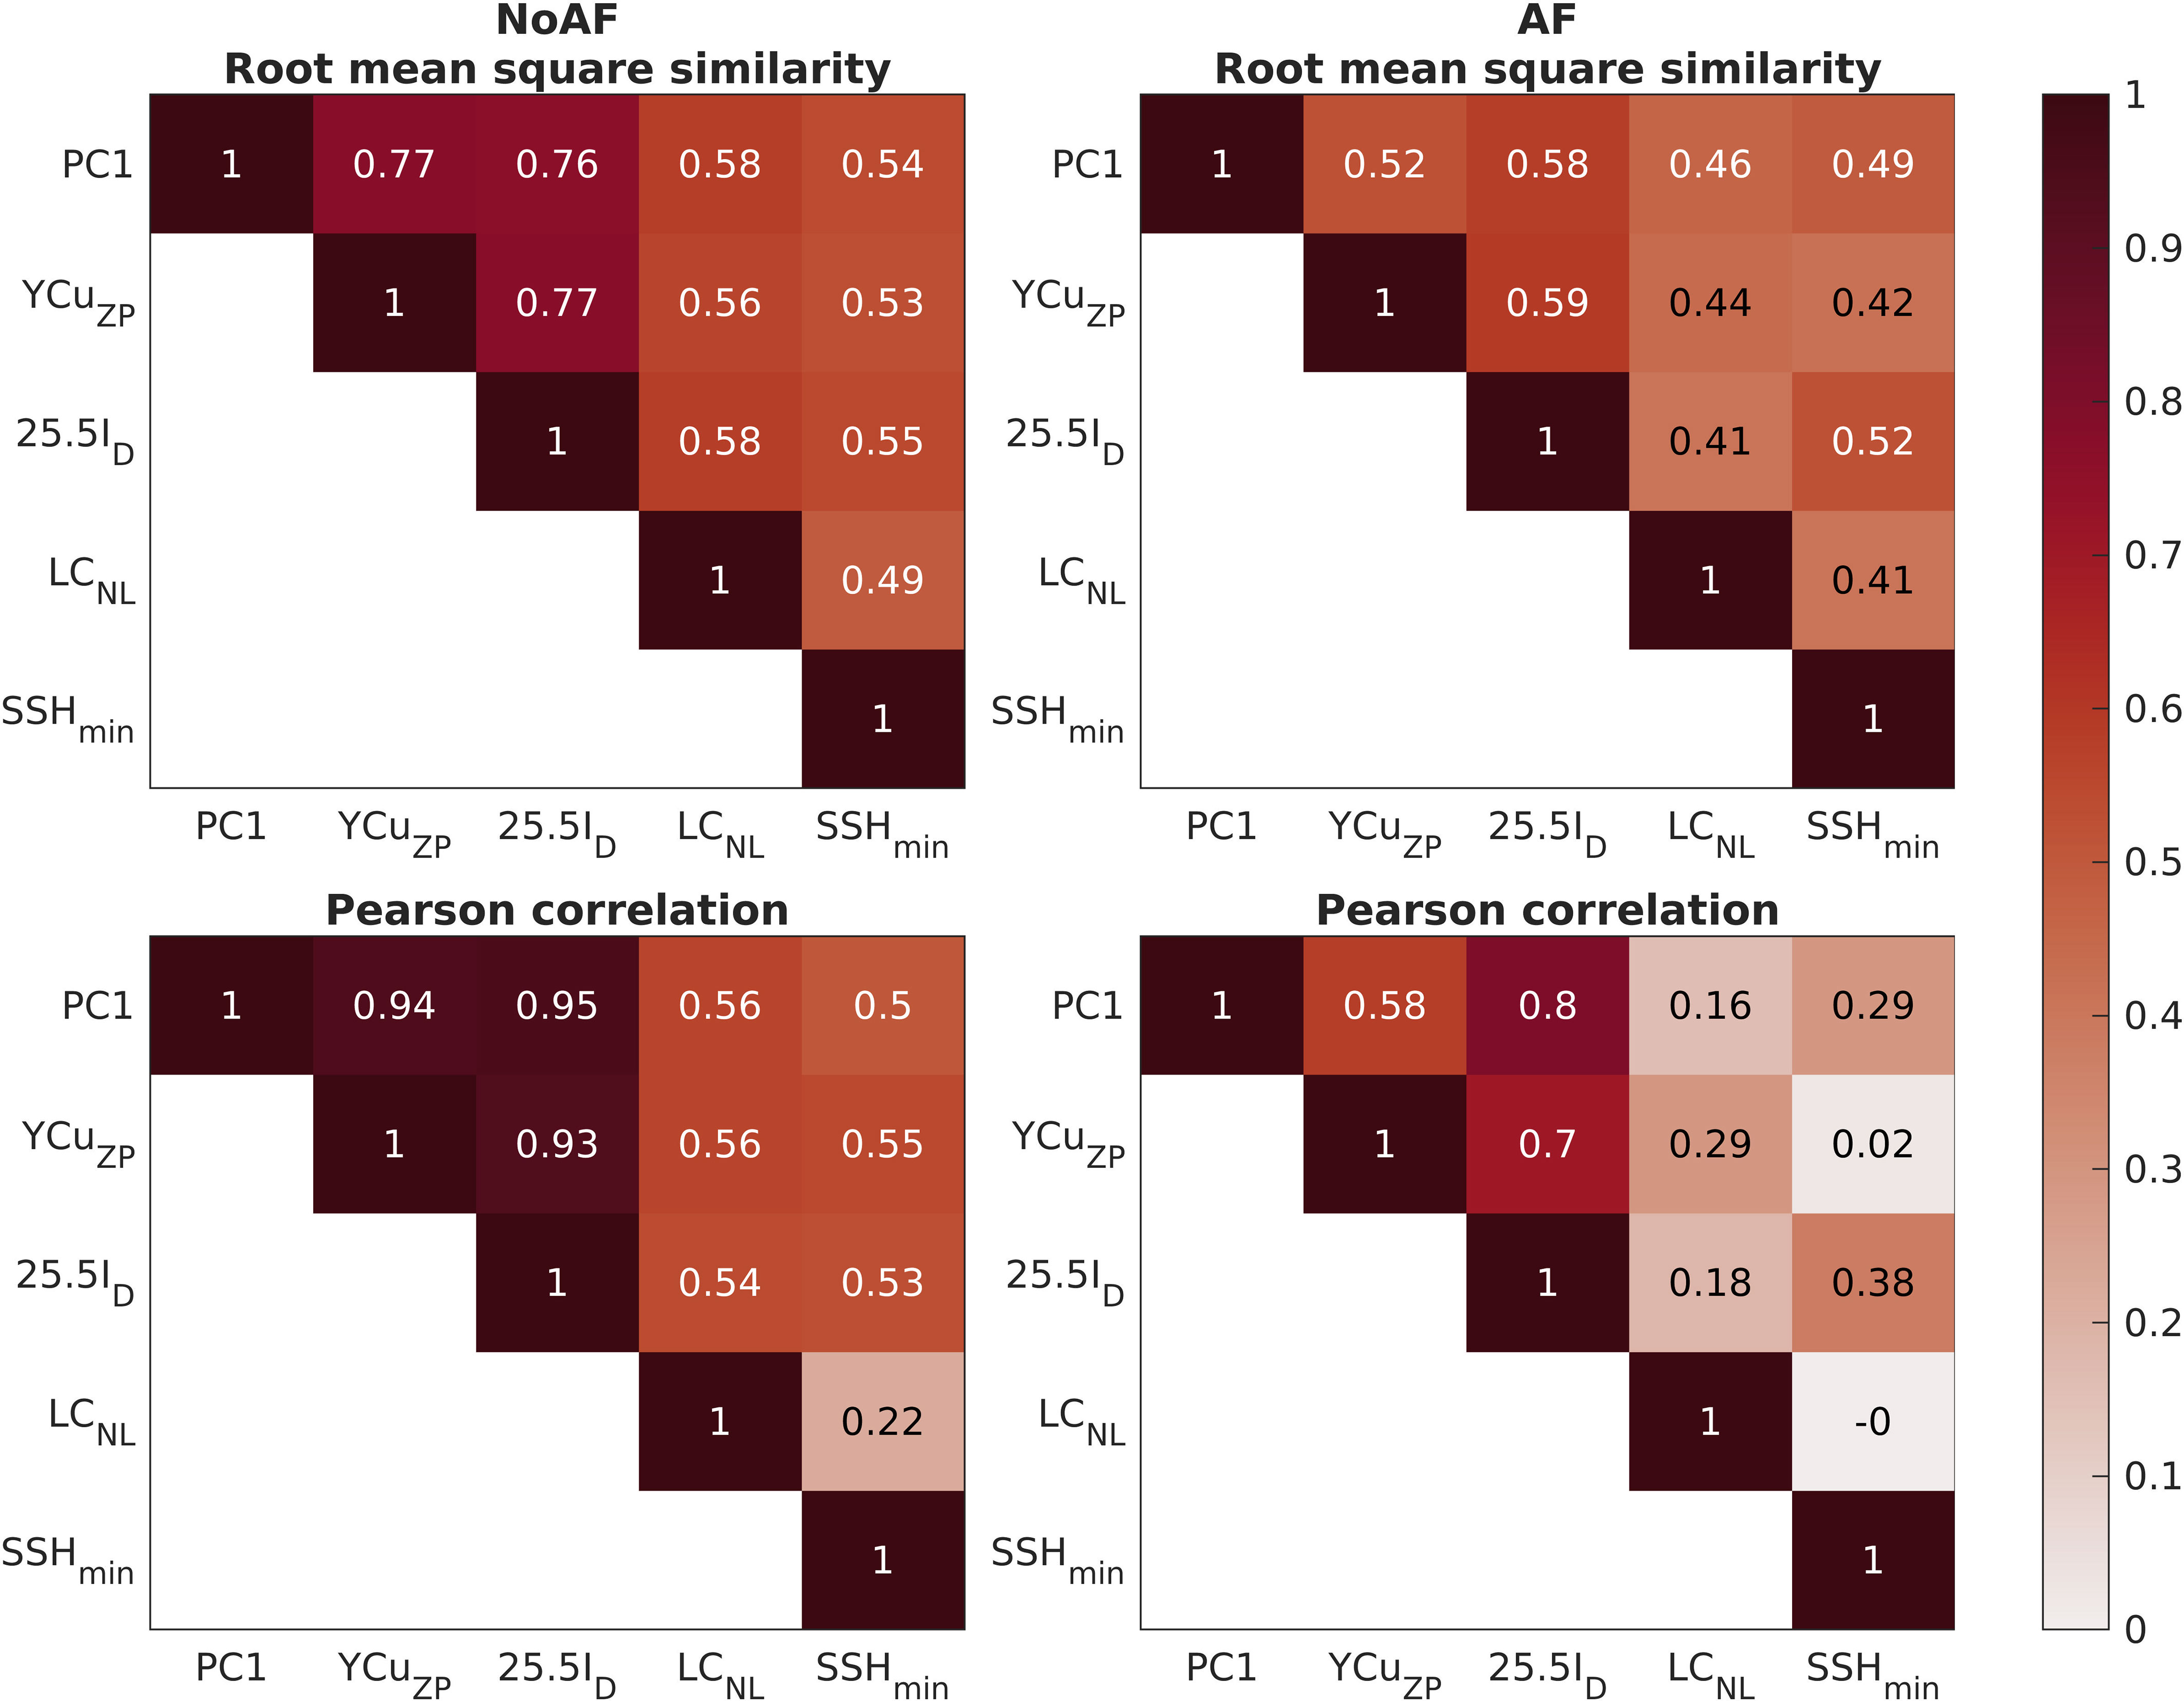
Figure 5 Similarity measures between different variables of interest for experiments NoAF and AF. All the time series are standardized anomalies except PC1. The time series 25.5ID, LCNL, and SSHmin were multiplied by -1 to calculate the similarity measures.
Finally, the temporal variability of these processes was also analyzed in the frequency domain through their spectra (Figures 4E, J), which were estimated using a multitaper approach with the annual cycle removed from the 22-year time series.
• When isolating intrinsic ocean dynamics (experiment NoAF), the dominant variability of the YC stratification (PC1), the YCu core’s behavior (YCuZP), and the western YC hydrography (25.5ID) exhibit the same spectral variance characteristics; they share the same temporal behavior. None of these processes have evident periodicity. They mainly vary over long timescales, with negligible short-term variations. Most of their spectral variance is concentrated in the 1.5-7.5 years period band, with relative maxima at about 2.2 and 3.5 years; the high spectral variance content in this period band is associated with the interannual period between the +YCuZP events. The high similarity between the spectral variance content of these processes indicates that their time persistence is very similar. Since the YCu is the primary mechanism determining the stratification and hydrography in the YC, it is suggested that the observed 1.5-7.5 year variability in the dominant stratification variability and western YC hydrography has its origin in YCu dynamics, specifically in the variation, location, and displacements of the YCu core.
• In general, including atmospheric forcing (experiment AF) preserves the dominant spectral variance content in the 1.5-7.5 years period band of experiment NoAF. However, as expected, atmospheric forcing modifies the dynamics in a rich and complex manner, resulting in the appearance of high-frequency signals. The high spectral variance content in the 1.5-7.5 years period band is similar and clearly identifiable in the YC stratification and the western YC temperature, regardless they now exhibit short-term variations mainly in periods shorter than five months. On the other hand, variations longer than three years are now de-emphasized in the YCu core’s behavior, and variations shorter than one year are significant. The connection between these processes is still appreciable, but modifications in YCu dynamics by including atmospheric forcing weaken such connection in the long-term, and complex dynamics appears on shorter time scales.
3.3 Stratification and circulation in the Yucatan Channel and the Loop Current System
3.3.1 Relationships between the Yucatan Current and the Loop Current
This subsection explores the conjoint variability of the YCu core’s dynamics, the YC western section hydrography, and the Loop Current System behavior. The aim is to provide robust relationships between these phenomena and gain insights into possible mechanisms of transmission of information between them, specifically during the +YCuZP events. A thorough analysis of the dynamical mechanisms of the LC and the formation and detachment of LCEs (causal relationships) is proposed for future research.
In order to explore those relationships, a Hovmuller diagram of YCuZP from 21.0°N to 22.5°N (Figures 6A, D), time series of PC1 and LCNL (Figures 6B, E), and an area chart of SSHmin (Figures 6C, F) were calculated for both experiments. SSHmin represents the minimum of sea surface height (SSH) anomaly in the domain A1 (see Figure 1); in this series, the annual cycle was removed, and the mesoscale temporal filter was applied. In Figure 6, the +YCuZP events are pink-shaded, and vertical dashed lines indicate LCE separations. This figure shows an appreciable correspondence between YCuZP, PC1, and LCNL for the entire simulation period in experiment NoAF; in experiment AF, the correspondence is less appreciable for the entire simulation period but clearly appreciable during the +YCuZP events (see also Figures 4, 5).
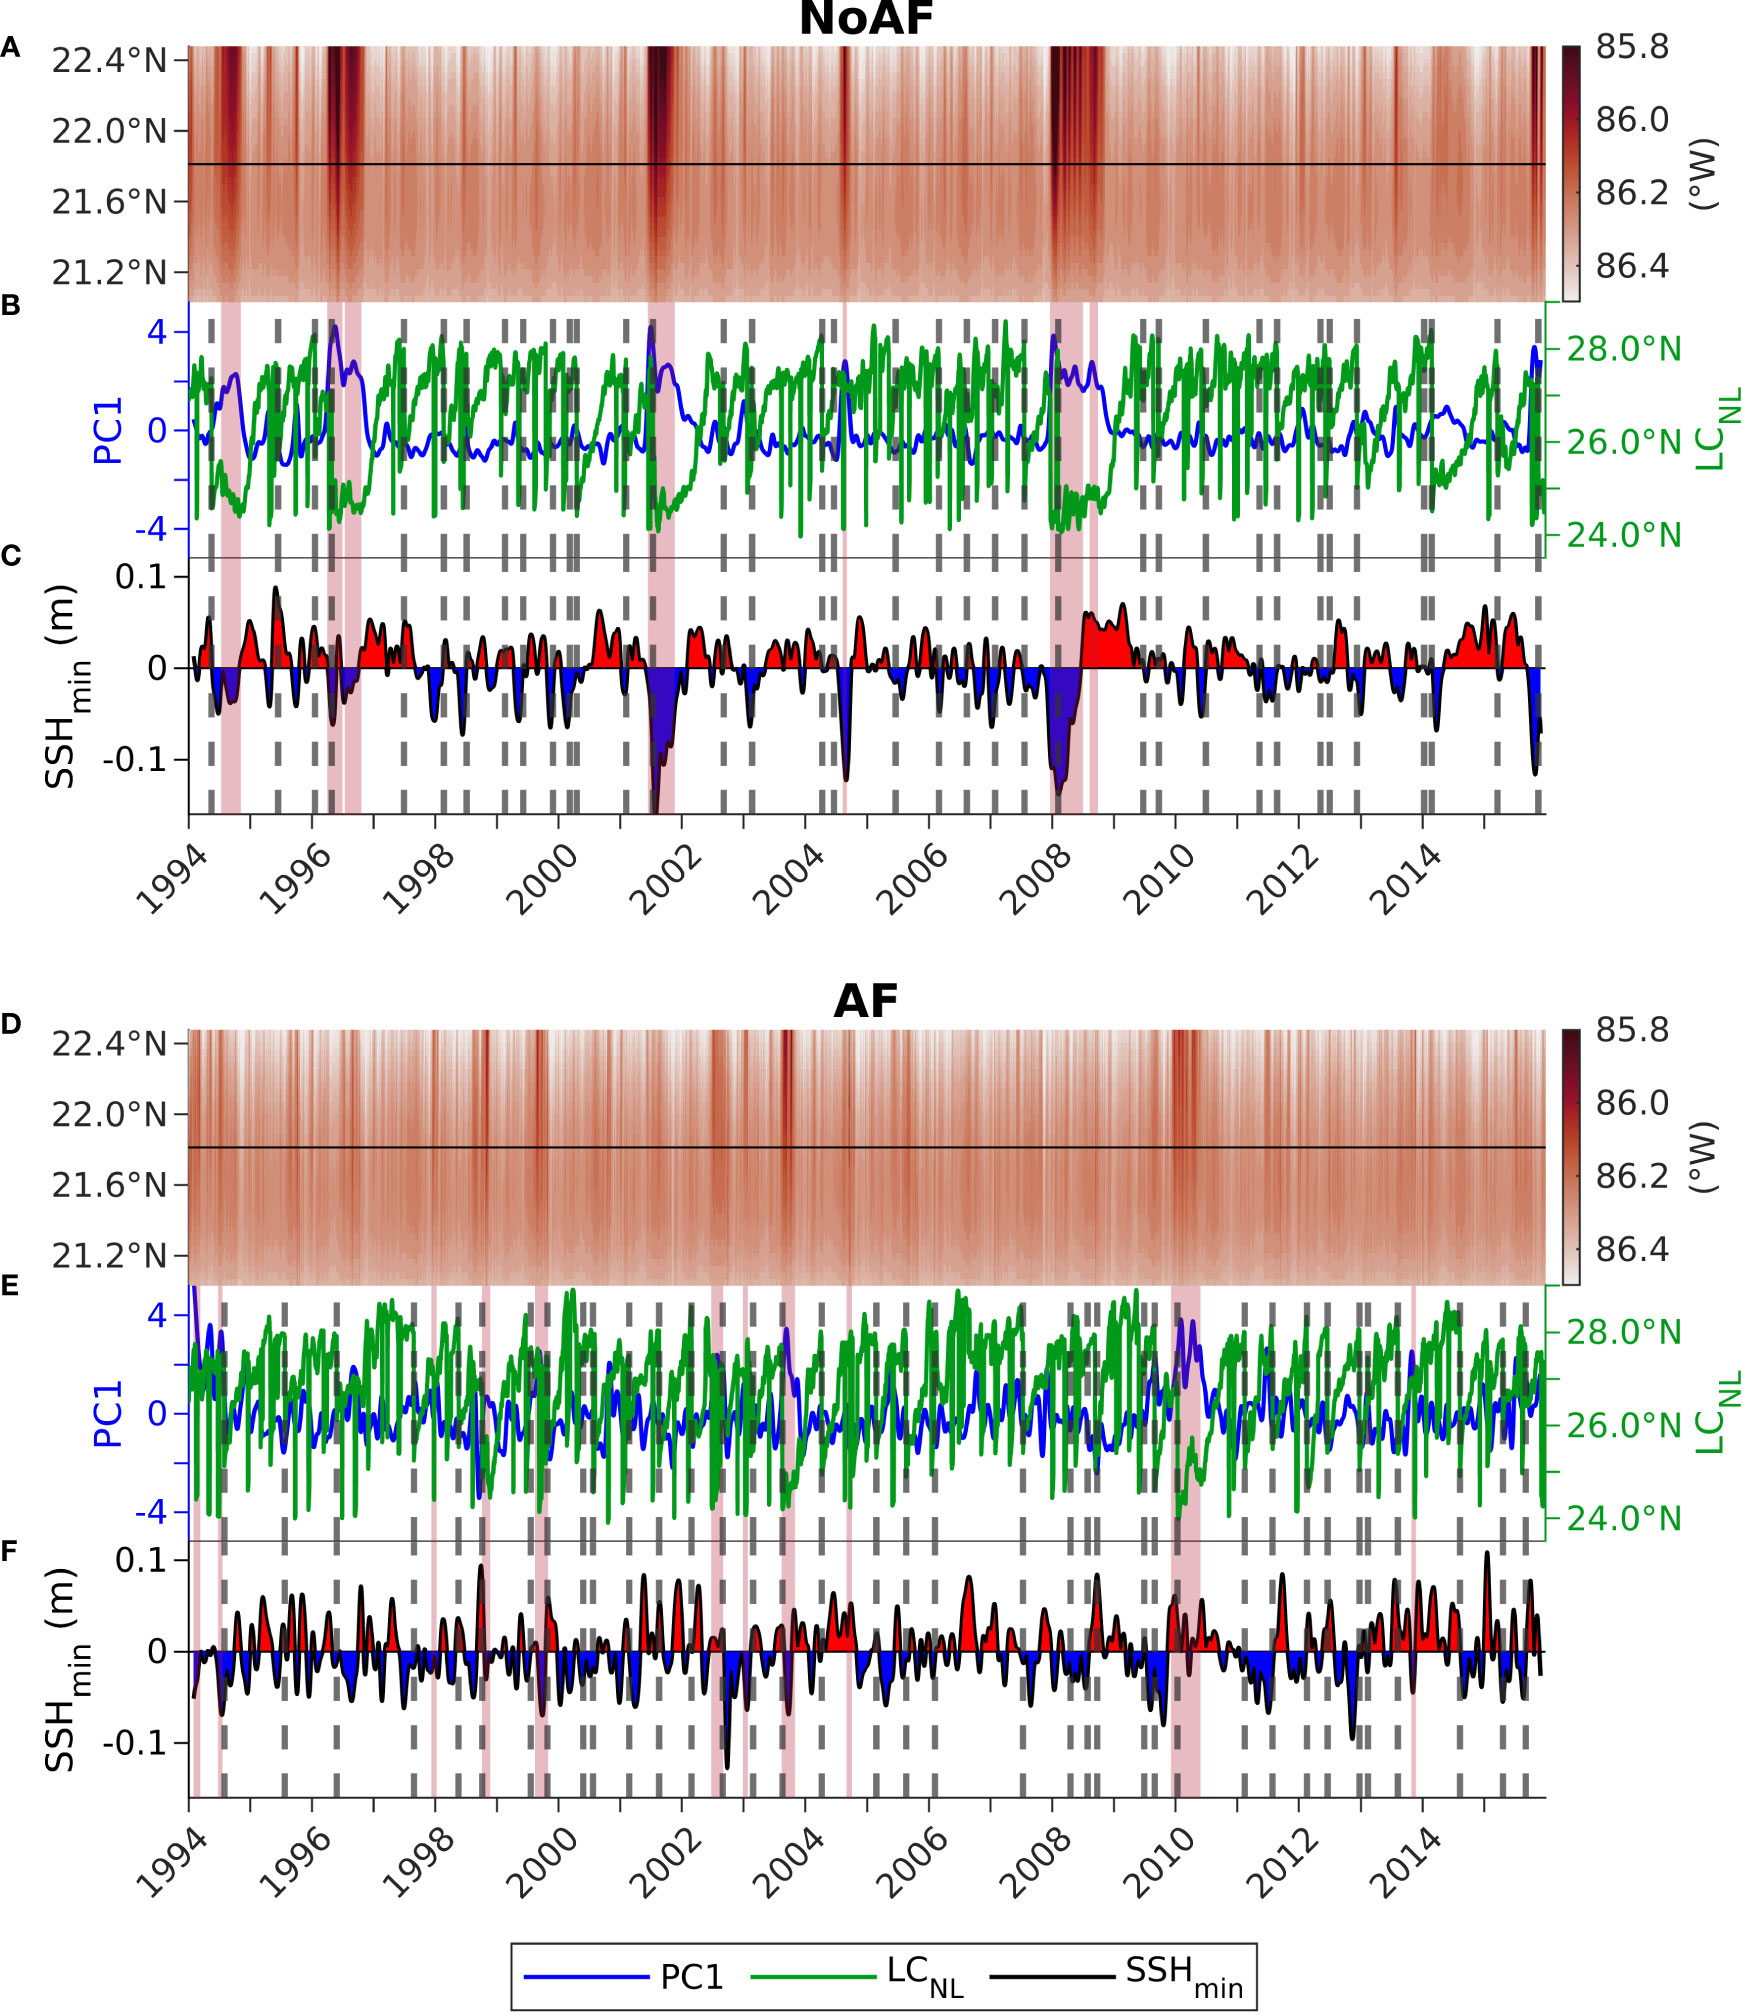
Figure 6 (A) Hovmuller diagram of YCuZP from 21.0°N and 22.5°N, (B) time series of PC1 and LCNL, and (C) area chart of SSHmin in domain A1 for experiment NoAF. (D–F) Same as figures (A–C) but for experiment AF. In panels (A, D), the horizontal black line is at 21.81°N, where the EOF analysis of stratification was performed. The +YCuZP events are pink-shaded, and vertical dashed lines indicate LCE separations.
During the +YCuZP events in experiment NoAF, the YCu core experiences intense eastward displacements beyond 85.9°W in its northern section at 22.5°N and moderate ones in its southern section at 21°N (Figure 6A). In contrast, the YCu is more north-south oriented in experiment AF, with moderate displacements in its northern section and null ones in its southern section (Figure 6D), only reaching 86.0°W for a short period in 1998, late 2003, and 2010. During the +YCuZP events, in both experiments, there is a concurrence of intense eastward displacements of the YCu (Figures 6A, D), intense stratification anomalies in the western YC section (positive ones at the upper 100 m and negative ones between 50 and 200 m depth) (Figures 6B, E), detachments of big LCEs, and intense LC retreat (Figures 6C, F). The concurrence between these processes also occurs in some LCE detachment events not identified as +YCuZP, characterized by a weak or short-lasting ( 25 days) eastward displacement of the YCu core. Such events occurred in 1995, 1998, 2003, 2012, 2013, and 2014 in experiment NoAF, and in 1995, 1996, 2000, 2005, and 2011 in experiment AF.
The above relationships between the YCu core behavior, YC hydrography, and the Loop Current System behavior can be readily appreciable by observing the oceanic conditions before and during a +YCuZP event. These conditions are typical for all the +YCuZP events in experiments NoAF and AF but atypical for the overall system behavior, and they appear associated with specific mechanisms in the YC and inside the Gulf of Mexico. Figure 7 shows the oceanic conditions before and during the +YCuZP event of 1996 for experiment NoAF. Previous conditions display the YCu core very close to the Yucatan eastern shelf at the YC section (Figure 7A), isotherms lowered above the Yucatan slope (Figure 7B), the maximum stratification located to the east of the Yucatan slope where the isotherms are squeezed (Figure 7C), and a northwestward extended LC (Figure 7D). During the +YCuZP event, the YCu core displaces away from the Yucatan eastern shelf (Figure 7E), isotherms are uplifted above the Yucatan slope (Figure 7F), the maximum of stratification is located above 100 m depth where the isotherms are squeezed when uplifted (Figure 7G), the YCu path deviates northeastward, and a big LCE detaches (Figure 7H). After the detachment, the YCu core displaces westward, the isotherms descend, and the stratification maximum descends above the Yucatan slope. An animation of this +YCuZP event is provided in the Supplementary Material. A similar figure and animation corresponding to the +YCuZP event of 2003 in experiment AF are also included in the Supplementary Material.
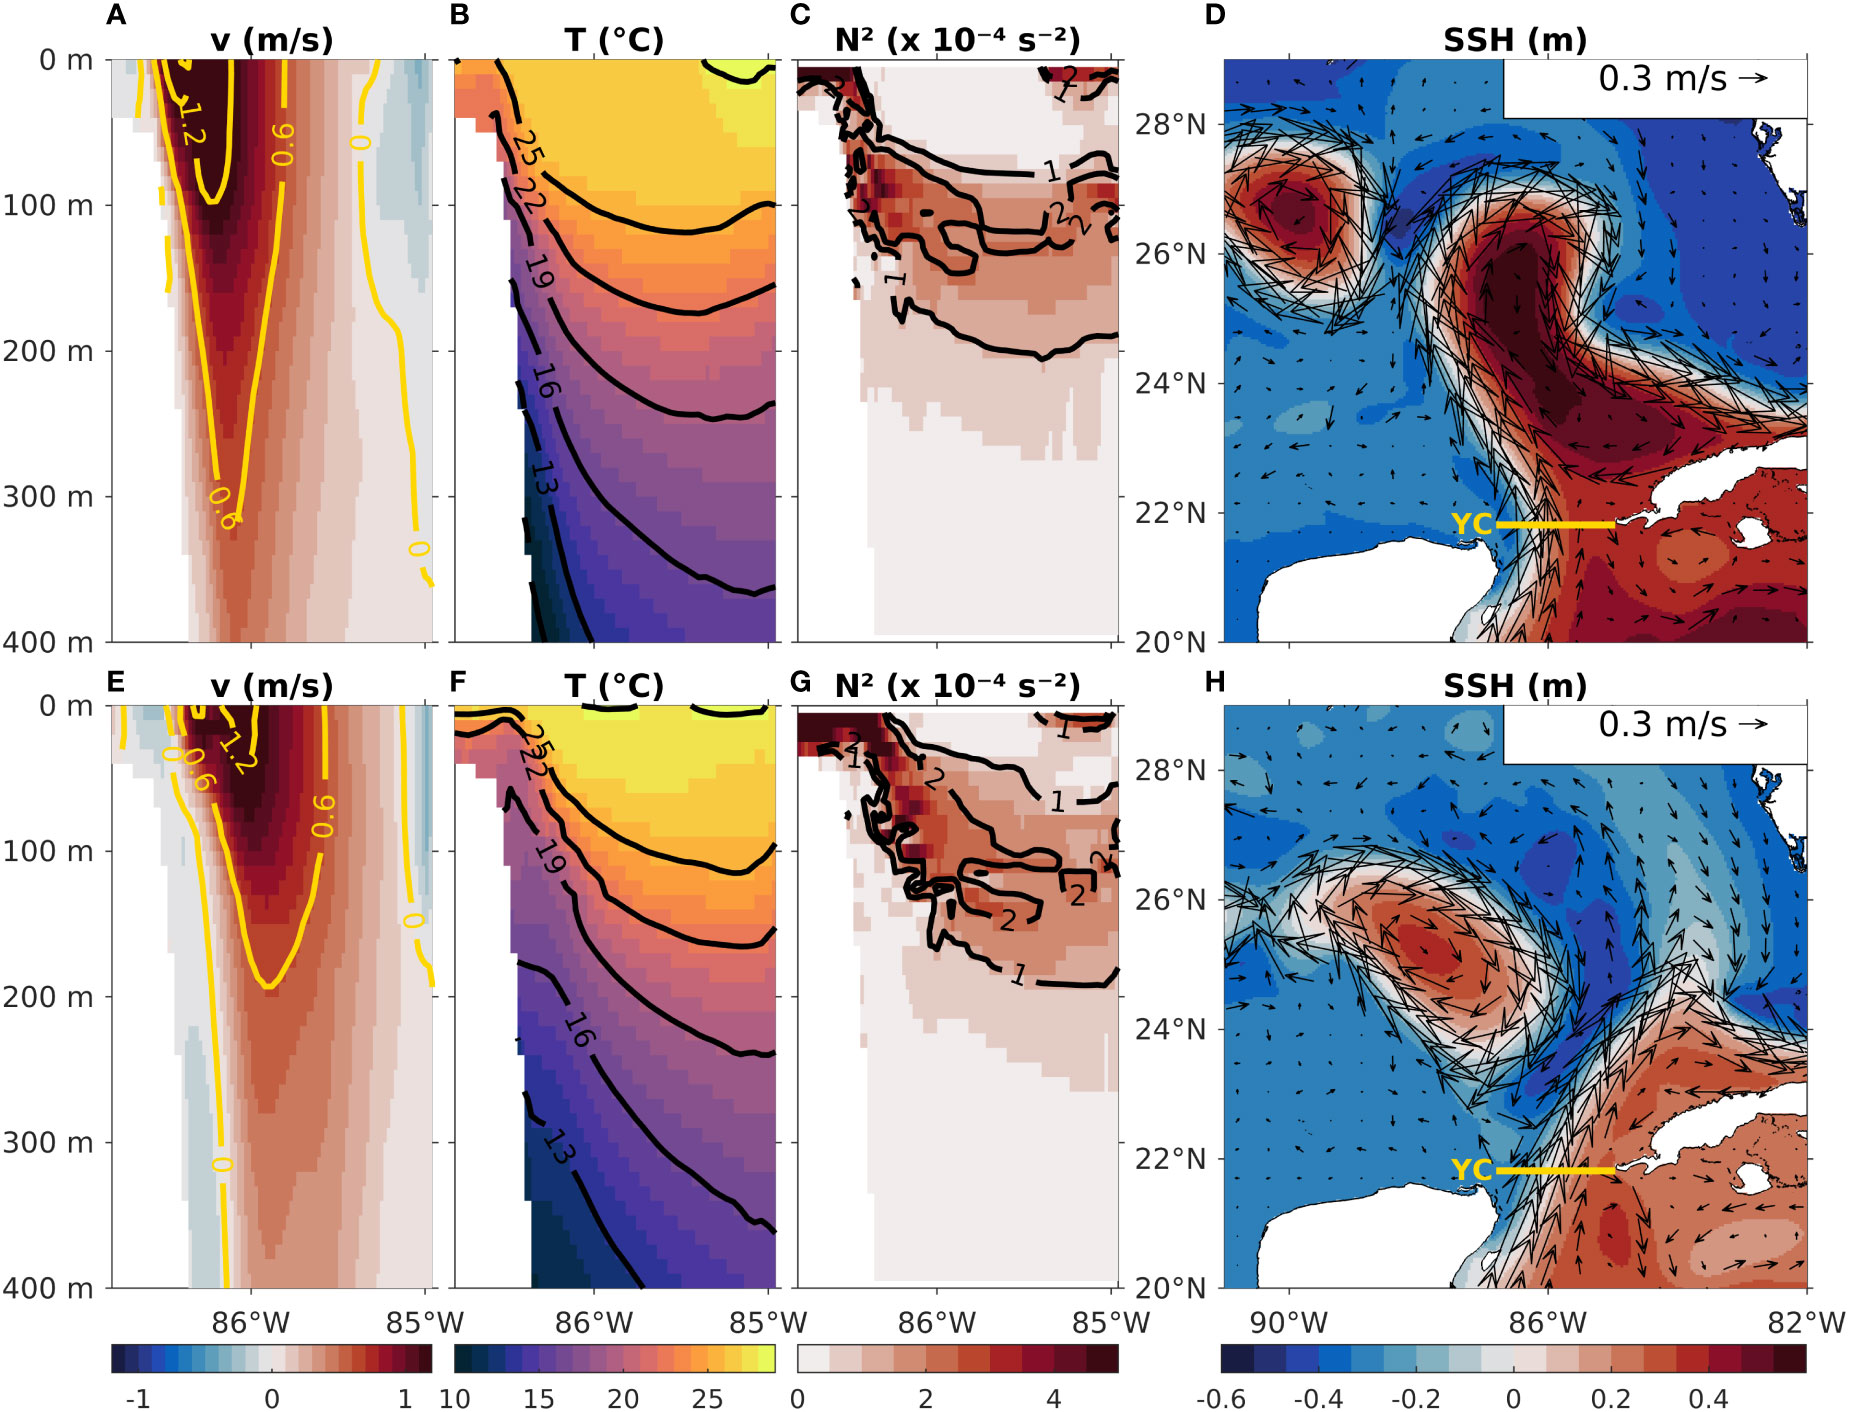
Figure 7 Instantaneous daily fields of the state of the ocean before (panels A–D) and during (panels E–H) the +YCuZP event of 1996 (days 64 and 140) in experiment NoAF. Vertical sections of (A, E) meridional velocity, (B, F) temperature, and (C, G) in the upper 400 m along a latitudinal transect across the YC at 21.81°N. (D, H) Sea surface height and surface velocity field in the eastern Gulf of Mexico.
Now that the results regarding LCNL and SSHmin have been presented, the similarity and spectral analyses shown in Figures 4 and 5 can be concluded. For both experiments, there is a high similarity between PC1, YCuZP, 25.5ID, LCNL, and SSHmin (Figures 4–6), with a prevalent 1.5-7.5 year variability among them (Figures 4E, J). However, the variability of LCNL and SSHmin exhibits important differences concerning the remaining variables. The spectral variance of LCNL is similar to that of PC1, YCuZP, and 25.5ID for experiment NoAF, with most of it contained in the 1.5-7.5 years period band but not as high as for the other variables (Figure 4E). By including atmospheric forcing (experiment AF), the low-frequency signal is preserved in LCNL, but it includes high-frequency energy in periods below five months and in the periods previously mentioned for the other processes (Figure 4J). The spectral variance of SSHmin is not concentrated in the 1.5-7.5 years period band (Figures 4E, J). Most of its spectral variance is contained in the 1.5-2.5 years period band for both experiments, with the addition of high-frequency energy in periods below seven months for experiment AF.
Additional characteristics in the Loop Current System behavior were identified for the two experiments. Figure 8 shows the LC metric values on the day before each LCE detachment and the LCE metric values on the detachment day for all the LCE detachment events. The gray lines correspond to all LCE detachments, the red lines correspond to the +YCuZP events, and the blue line represents the mean values of all the LCE detachments, which are:
• Experiment NoAF. LCNL, 27.62°N; LCWL, 89.78°W; LCL, 2127 km; LCA, 1.96 x 10⁵ km2; LCRL, 25.15°N; LCED, 350 km.
• Experiment AF. LCNL, 27.75°N; LCWL, 89.82°W; LCL, 2104 km; LCA, 1.88 x 10⁵ km2; LCRL, 25.14°N; LCED, 336 km.
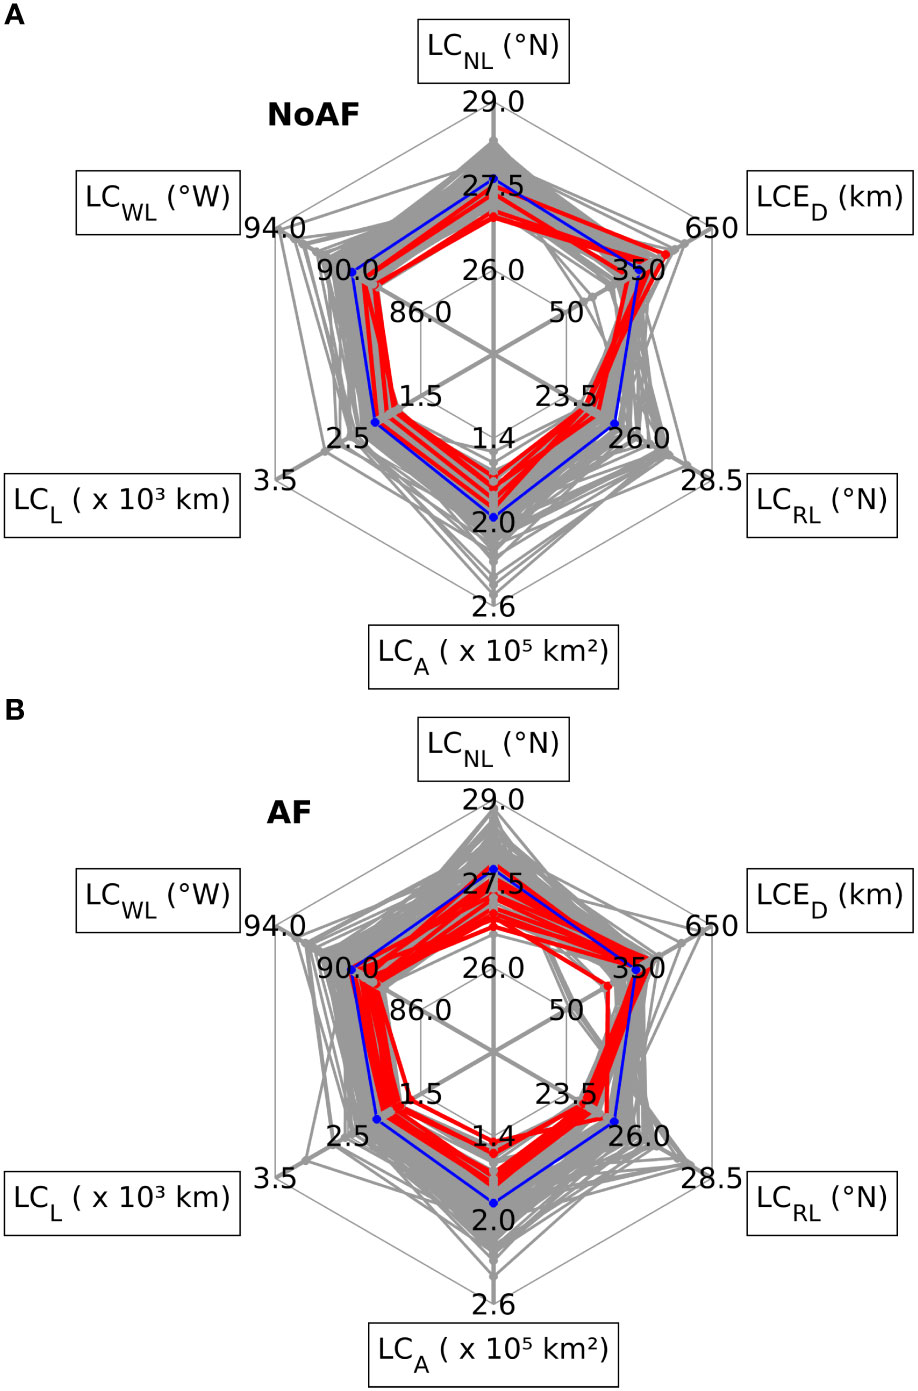
Figure 8 LC metric values on the day before LCE detachments and the LCE metrics on the day of LCE detachments for experiments (A) NoAF and (B) AF. The gray lines correspond to all LCE detachments, the red lines correspond to the +YCuZP events, and the blue line represents the mean values of all the LCE detachments. Abbreviations: LCNL, LC northernmost latitude; LCWL, LC westernmost longitude; LCL, LC length; LCA, LC area; LCRL, LC retreat latitude; LCED, LCE diameter.
The percentage differences in the LC and LCE metrics of experiment AF relative to experiment NoAF are less than 1% for LCNL, LCWL, LCL, and LCRL, whereas the percentage differences are 4% for LCA and LCED. By including atmospheric forcing, LCE activity increased from 95 detachments with 36 separations in experiment NoAF to 110 detachments with 37 separations in experiment AF. On average, the LC reaches higher latitudes in experiment AF than in experiment NoAF, whereas the average LCRL is very similar in both experiments; however, the LCED is not bigger in experiment AF than in experiment NoAF.
Similar conditions characterize the LCE detachments during the +YCuZP events in both experiments. Before a LCE detachment, the LC metric values are lower than their average ones; when the LCE detaches, LCRL is lower, and LCED is higher than their average values (Figure 8). After the LCE detachments in all the +YCuZP events, three scenarios are possible:
1. The detached LCE re-attaches to the main LC flow, and the +YCuZP event ends. Events occurred in 2004 in experiment NoAF, and in early 1994, late 1997, early 2003, 2004, and 2013 in experiment AF.
2. The LCE detachment is followed by a sequence of one or more reattachments and detachments, ending in a LCE separation; all of these detachments are associated with the same event of YCu eastward displacement. Events occurred in 1996, 2001, and 2008 in experiment NoAF, and in mid-1994, 1999, and mid-2002 in experiment AF.
3. The detached LCE does not reincorporate into the LC, representing a LCE separation. Events occurred in 1994 in experiment NoAF, and in late 1998, late 2003, and 2010 in experiment AF.
3.3.2 Yucatan Current dynamics, the Loop Current, and peripheral cyclonic anomalies
The relationships identified between YCu dynamics, the upper YC hydrography, the Loop Current System behavior, and cyclonic anomalies surrounding the LC suggest the existence of underlying physical mechanisms playing significant roles in transmitting information between YCu dynamics and the LC behavior. Interactions of the LC with peripheral cyclonic anomalies at its west margin are a potential underlying mechanism influencing the LC intrusion, YCu path deviation, and LCE detachment (Zavala-Hidalgo et al., 2002; Zavala-Hidalgo et al., 2003; Schmitz et al., 2005; Chérubin et al., 2006; Zavala-Hidalgo et al., 2006; Athié et al., 2012; Le Hénaff et al., 2012; Garcia-Jove et al., 2016; Jouanno et al., 2016; Sheinbaum et al., 2016).
The role of peripheral cyclonic anomalies on the relationship between YCu dynamics and the LC behavior, focusing on the +YCuZP events, was explored through the evolution of SSH and surface velocity fields in the eastern Gulf of Mexico. The area charts of SSHmin in Figures 6C, F show that the occurrence of the +YCuZP events is associated with the presence of cyclonic anomalies surrounding the LC southwest margin (with high negative values of SSHmin), which usually precede or coincide with a LCE detachment. The influence of peripheral cyclonic anomalies on YCu dynamics and the LC behavior is readily appreciable in the overall variability of experiment NoAF and less appreciable in experiment AF. Nonetheless, due to the dynamical correspondence between the dominant variability in experiments NoAF and AF, the influence of this mechanism is expected to operate similarly without and with atmospheric forcing.
A thorough analysis of the evolution of the cyclonic anomalies surrounding the LC during the +YCuZP events revealed the general behavior of this mechanism:
1. When the LC has a substantial northward intrusion, two cyclonic anomalies of varying intensity appear surrounding the LC, one at the northeastern Yucatan shelf and the other at the eastern margin of the LC (Figures 9A, D). The anomaly in the west is described by the negative values of SSHmin in the area charts of Figures 6C, F.
2. The YCu displaces eastward; the more intense the YCu displacement in its northern section, the stronger the resulting curvature on the LC west margin and the development of an LC necking. Then, both cyclonic anomalies squeeze the LC, and a LCE detachment is induced (Figures 9B, E).
3. The resulting LCE detachment may be followed by a sequence of one or more reattachment-detachments and a final eddy separation, in which the cyclonic anomalies surrounding the LC evolve to either merge or weaken separately (Figures 9C, F). Additional cyclonic anomalies at the southwestern and eastern margins of the LC participate in the following LCE detachments and separation.
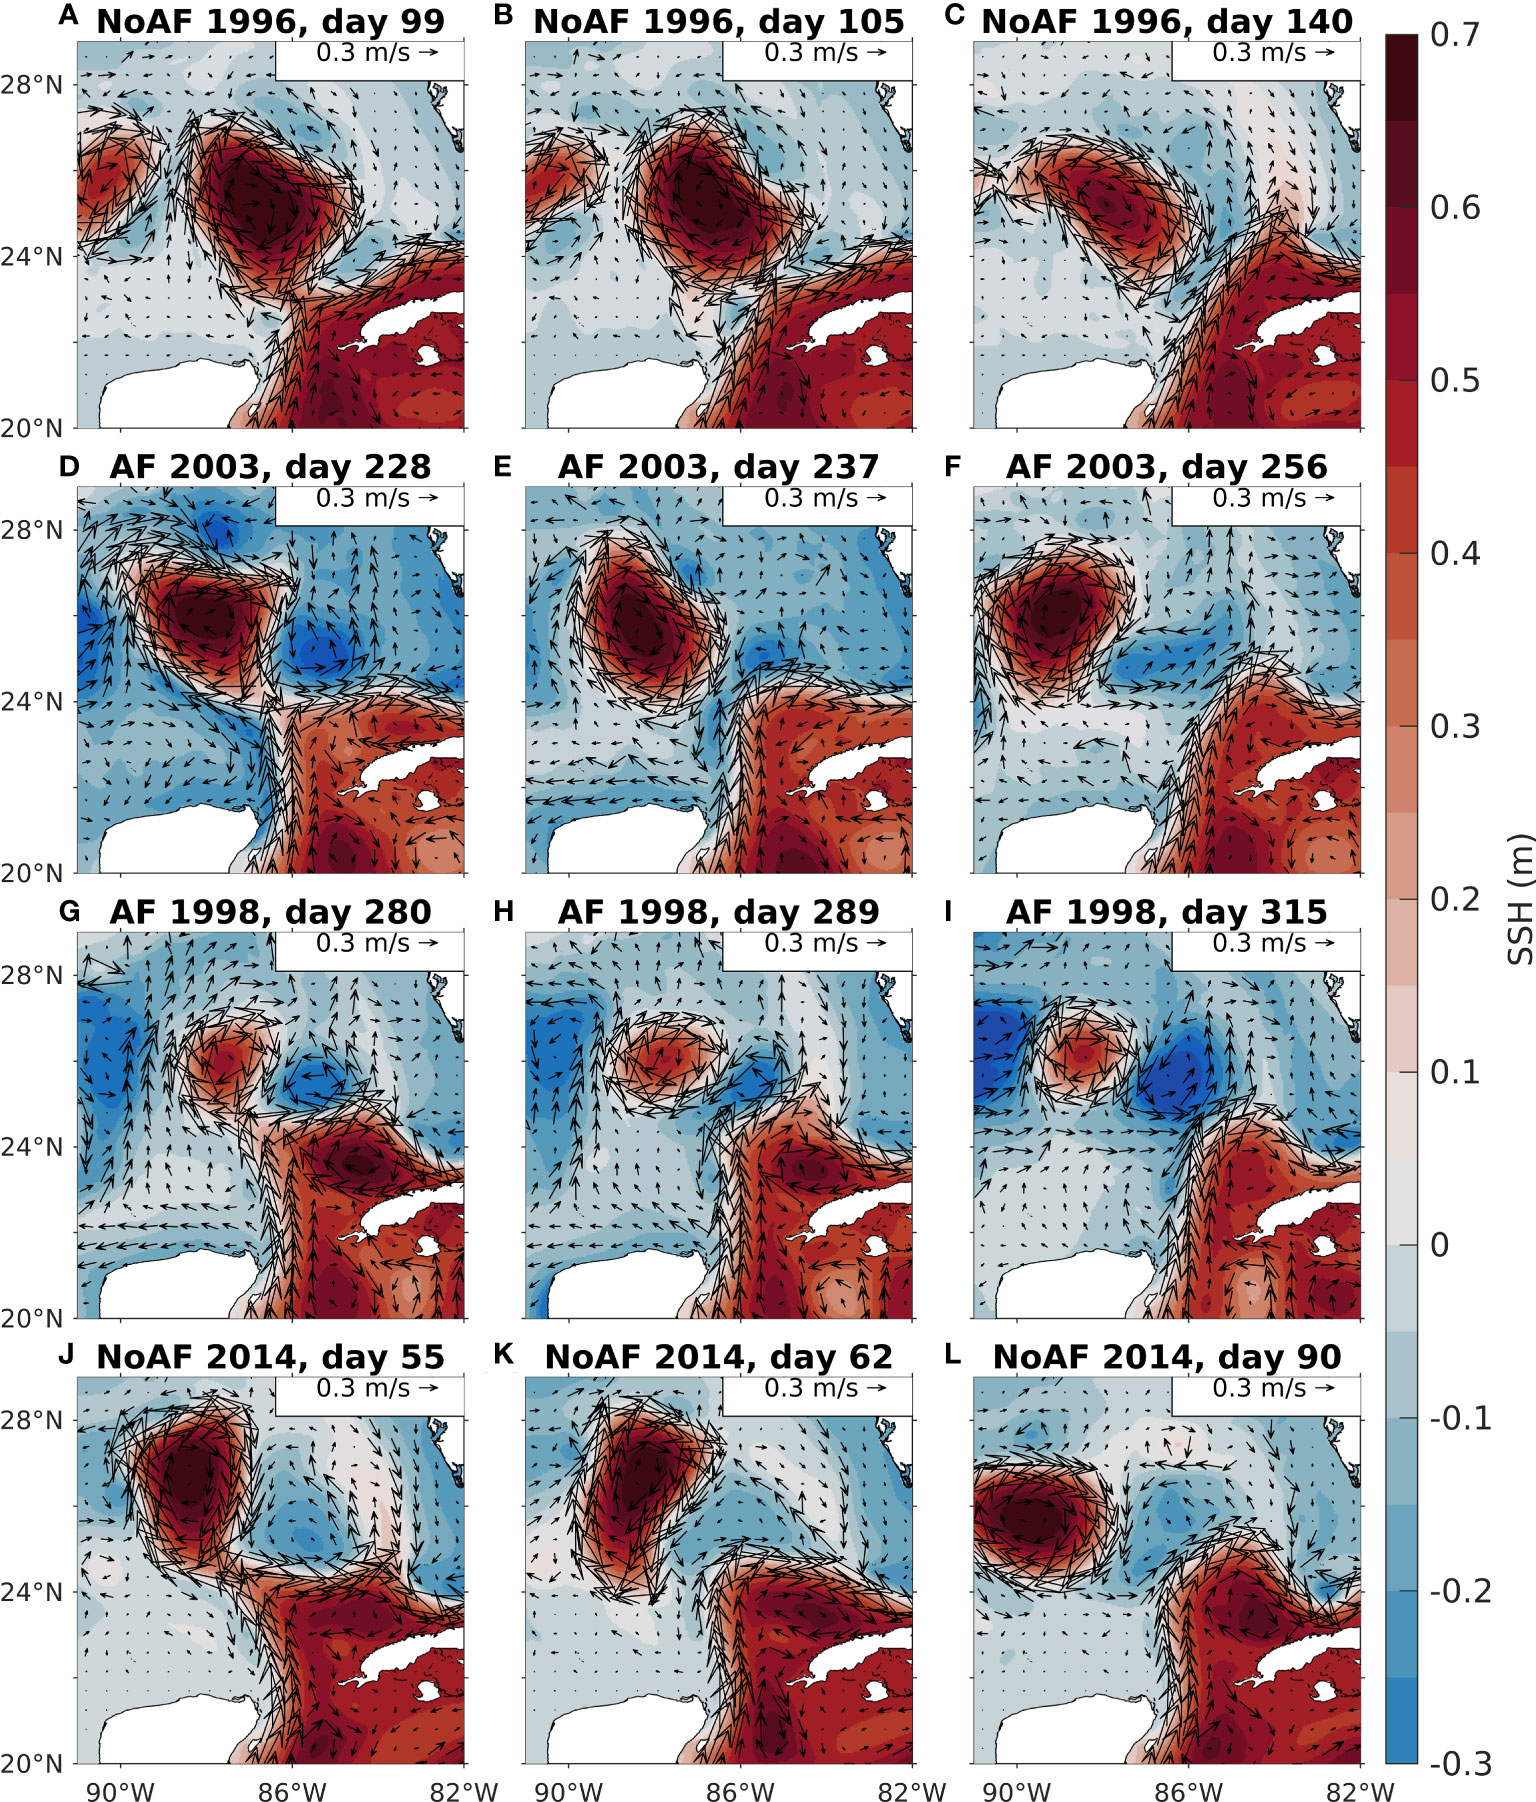
Figure 9 SSH and surface velocity fields in the eastern Gulf of Mexico, showing three main stages during the +YCuZP events of (A–C) 1996 in experiment NoAF, (D–F) 2003 in experiment AF, (G–I) 1998 in experiment AF, and (J-L) 2014 in experiment NoAF. The mean was removed from the SSH field to reduce the bias associated with seasonal height variations due to upper-ocean warming and cooling.
In some +YCuZP events, particular behavior of the YCu and LC is observed for those long-lasting events that occurred in 1994, 1996, 2001, and 2008 in experiment NoAF; and for those that occurred in late 1998, late 2003, and 2010 in experiment AF:
1. Following a LCE separation, the LC remains retracted for several months, reaching its minimum northernmost latitude: 24.06°N in experiment NoAF and 24.00°N in experiment AF.
2. During the retracted phase of the LC, the YCu path remains northeastward-oriented, with the isotherms uplifted above the Yucatan slope and the associated high stratification anomaly at the western YC section above 100 m depth (Figures 4, 6). Such behavior, more intense in experiment NoAF than in experiment AF, coincides with the prolonged presence of an intense cyclonic anomaly north of the LC blocking its intrusion into the Gulf (Figures 9C, F). This cyclonic anomaly resulted from merging the cyclonic anomalies surrounding the LC that led to the LCE separation (Figures 9A, B, D, E).
3. The subsequent gradual LC intrusion coincides with the westward displacement of the YCu core, the lowering of the isotherms above the Yucatan slope, and a weak negative stratification anomaly at the western YC section above 100 m depth (Figures 4, 6).
4. The prolonged LC retraction and gradual northward intrusion led to an extended detachment period (342-462 days in experiment NoAF and 184-303 days in experiment AF) of the subsequent LCE, which is longer than the average period of all detachments (84 days in experiment NoAF and 73 days in experiment AF).
5. During the event of 1998 in experiment AF, no intense cyclonic formations at the southwestern margin of the LC were observed (Figures 9G–I). The LCE separation was mainly associated with a cyclonic anomaly north of the LC, fed by a set of cyclonic anomalies from the northeastern Yucatan shelf that traveled around the LC.
Also, a significant behavior was identified for the events of weak or short-lasting (< 25 days) YCu eastward displacement, previously mentioned in subsection 3.3.1. Compared to the +YCuZP events, in those events, LCE detachments usually coincide with a weaker cyclonic anomaly at the southwestern margin of the LC and (or) a LC necking occurring in a higher latitude. In these events, the LC necking is insufficient to induce a LCE detachment, and the southwestern cyclonic anomaly displaces northwestward, preventing an intense YCu eastward displacement. The 2014 event in experiment NoAF (Figures 9J–L) exemplifies this mechanism. During the LCE detachment, the YCu core is slightly eastward displaced with a weak and loosely organized cyclonic anomaly at the northeastern Yucatan shelf, associated with a slight increase in the PC1 series (Figures 6A–C).
Results suggest that peripheral cyclonic anomalies and their interaction with the LC relate to YCu dynamics, the upper YC hydrography, and the Loop Current System behavior. Intense and well-organized cyclonic anomalies at the northeastern Yucatan shelf are associated with the isotherms’ uplift above the Yucatan shelf’s eastern slope, a stratification increase above 100 m depth at the western YC section, specific conditions of LC intrusion prior to the detachment of a big LCE, and an intense LC retreat. Absent or weak cyclonic anomalies deviate the system from this behavior.
4 Discussion
This work identified and described the most important non-seasonal spatial and temporal variability patterns of the YC upper stratification, considering long-term timescales not yet addressed by observational analyses. This study also revealed significant characteristics of the upper YC hydrography, YCu dynamics, the Loop Current System behavior, the cyclonic anomalies surrounding the LC, and the relationships between them.
Implementing twin simulations of the Gulf of Mexico hydrodynamics, without and with atmospheric forcing, allowed us to evaluate the effect of atmospheric forcing on different oceanic processes in the YC and the Gulf interior associated with the LC behavior. Atmospheric forcing excited additional eigenmodes of ocean dynamics associated with higher variability of the upper flow at the eastern YC, originating in the ocean-atmosphere interaction (Hasselmann, 1976; Grötzner et al., 1999). Consequently, it is impossible to easily track the resulting oceanic variability in terms of atmospheric variability and to a priori identify the resulting oceanic spectral variance. Compared to the variability only associated with ocean dynamics, atmospheric forcing induces a more complex behavior of YC dynamics and the Loop Current System. It produces a significant high-frequency signal and modifies the low-frequency behavior of those phenomena, which in the middle and long term means a more complex behavior of them and probably a reduction in their predictability. This result is consistent with previous ones that showed that simple models show more predictability of the LC (e.g., Moreles et al. (2021)) and that more complex models exhibit an increased variability.
Atmospheric forcing induces variability in periods around 8-15 months on YCuZP, with consistent spectral variance on period bands of 4.5-5.5 and 6-8 months; these periods are close to those of 5.6, 8.4 and 11.2 months found by Ezer et al. (2003) for the YCu flow position from 4-year model results. The findings of Jouanno et al. (2018) of high spectral variance around period bands of 180-365 and 60-100 days on Yucatan upwelling variability are supported by our results, with the addition that this variability is strongly related to that of YCuZP. Atmospheric forcing also induces interannual variability and high-frequency signal with periods shorter than five months in the LC behavior, which has been previously studied. Sheinbaum et al. (2016) found intense low-frequency (40-100 days) eddy kinetic energy peaks along the water column associated with LCE detachments. Donohue et al. (2016) found that SSH variability associated with LC’s northern front is dominated by LC advance and retreat, with most of its variance in periods longer than 100 days; at higher frequencies, most of the contained variance is found at the band of 40-100 days, with peaks during LCE events, and confined eastward of the Mississippi Fan. Atmospheric forcing has a small influence on the temperature and salinity of the water masses of the YCu, due to the relatively short time (around three days) that it takes a water mass in the YCu to move while the YCu flows along the Northwestern Caribbean Sea.
Since atmospheric forcing mainly modifies the higher-order variability modes of YC stratification and has a moderate effect on YC dynamics, results suggest that ocean dynamics is the primary determinant of the dominant spatial and temporal variability of the hydrography and dynamics in the YC. By isolating intrinsic ocean dynamics, an evident dominant mode of YC stratification variability arose, very similar to the dominant one when including atmospheric forcing. The dominant modes have an associated spatial pattern describing a dipole in the western YC, with most of their spectral variance concentrated in the 1.5-7.5 years period band, which originates in the variation, location, and displacements of the YCu core. The findings of this work complement previous ones that showed that the YCu is the dominant source of YC dynamics variability (Ezer et al., 2003; Marín et al., 2008; Athie et al., 2011; Sheinbaum et al., 2016) and that of Carrillo et al. (2016) who found that the YCu determines the spatial distribution of thermohaline properties in the northeastern tip of the Yucatan Peninsula.
The relationship between the eastward displacement of the YCu path and the isotherms’ uplifting at the upper western YC, previously found by Enríquez and Mariño-Tapia (2014), was corroborated in this study, showing it is a recurrent pattern that could be related to the cold nutrient-rich water upwelling at Yucatan northeastern coast (Enríquez and Mariño-Tapia, 2014; Carrillo et al., 2016; Reyes-Mendoza et al., 2016; Jouanno et al., 2018). The upper stratification at the western YC, the zonal position of the YCu core, and the vertical thermal structure above the Yucatan slope evolve in the same low-frequency timescales; the connection between them is strong without and with atmospheric forcing. Our work can contribute to a better understanding of the upwelling development on the eastern Yucatan shelf, which has significant dynamical and biological implications for the region (Merino, 1997; Abascal et al., 2003; Carrillo et al., 2016; Jouanno et al., 2018; Reyes-Jiménez et al., 2023). Studies of upper stratification are especially relevant in describing and forecasting mixing processes, oxygen and nutrient supply in the upper ocean, ocean uptake of greenhouse gasses, and local primary productivity (Gruber, 2011; Jacox and Edwards, 2011). Since regional ocean circulation is of primary importance in the variability of YC upper stratification, long-term studies are needed to evaluate the effects that changes in YC dynamics, such as the expected 20-25% reduction of YCu transport during the 21st century (Liu et al., 2012; Moreles et al., 2021), could have on the stratification and the consequent ecological and biogeochemical impact in the region.
Using observations from the 2003-2015 period, Varela et al. (2018) found an eastward trend of the YCu zonal position relative to the 1993-2003 period, probably associated with a cooling trend of the sea surface temperatures in the Yucatan shelf’s north coast during 1982-2015. Since our simulations were forced by climatological boundary conditions, we do not expect to see this eastward tendency. Our results indicate that eastward displacements of the YCu are an intrinsic part of its variability. If the YCu transport structure is maintained over time at its climatological values, neither a long-term eastward trend in its zonal position nor a cooling trend in temperature is expected to occur. Long-term simulations of the Gulf hydrodynamics incorporating interannual variability on the boundary conditions could shed light on these processes. Our methodological approach could serve as a basis for analyzing the effects of the expected changes in upper ocean stratification for different time horizons due to climate change.
The LC evolution is strongly related to its dynamical conditions at the YC, as previously evinced (Candela et al., 2002; Lin et al., 2009; Athié et al., 2012; Sheinbaum et al., 2016; Androulidakis et al., 2021; Moreles et al., 2021). The identified relationship between the eastward displacement of the YCu core and LCE detachments relates to previous studies suggesting these processes are connected with vorticity anomalies from the northwestern Caribbean Sea crossing the YC (Abascal et al., 2003; Marín et al., 2008; Athie et al., 2011; Athié et al., 2012; Sheinbaum et al., 2016; Androulidakis et al., 2021). We conducted preliminary analyses (not shown) of the vorticity flux in latitudinal sections along the YCu west margin without obtaining conclusive results, so further analyses are required to explore this relationship in detail and corroborate it.
The relationships between the cyclonic anomalies at the northeastern Yucatan shelf, the eastward displacement of the YCu core, LC intrusion, and LCE detachment support the results documented in previous observational and numerical works. Using simulation outputs from the Navy Coastal Ocean Model, Zavala-Hidalgo et al. (2002) described the formation of cyclones at the Campeche Bank and the LC east margin and their relationship to the LC necking during a LCE detachment. Later, Zavala-Hidalgo et al. (2003) associated the cyclone genesis at the Campeche Bank with the last stage of a big LCE detachment when the LC west margin displaces eastwards; Zavala-Hidalgo et al. (2006) described some mechanisms associated with the LC blocking by a large cyclone. These mechanisms were identified and described in experiments NoAF and AF, deepening our understanding of the physical system under study. The intense YCu eastward displacement and strong curvature on the LC west margin during the +YCuZP events could partially account for the generation of the cyclonic anomalies at the Yucatan shelf through local instabilities, as found by Chérubin et al. (2006). Additional research is needed to elucidate the origin, coherence, trajectories, and dissipation of such cyclonic anomalies and eventually reveal their causal dynamics.
The observed concurrent variability of different dynamical processes at the YC section and the Gulf interior allows us to suggest that the interaction of the LC with peripheral cyclones could be a potential mechanism associated with the transmission of information between YCu dynamics and the LC behavior, especially during LCE detachments. This study raised some questions: Could the cyclonic features at the Yucatan shelf be fed by cyclonic anomalies passing through the YC from the northwestern Caribbean Sea, as Jouanno et al. (2016) suggested? Could the related vorticity flux account for the eastward displacement of the YCu core and the isotherms’ uplift over the eastern slope of the Yucatan shelf? In order to respond to these questions, a thorough analysis of the potential vorticity flux through the YC and in meridional and zonal transects at the northeastern Yucatan shelf is proposed for future research.
A thorough analysis of the variability of wind stress, remote forcings, or heat and evaporation fluxes in the Gulf of Mexico could help provide a complete description of the stratification variability at the Yucatan Channel and the relative importance of its different driving mechanisms. Additionally, circulation and dynamics in the entire Gulf, including changes in its stratification, should significantly impact the Yucatan Channel dynamics. Such analyses are beyond the scope of this work and are proposed for future research.
5 Conclusions
This work described the non-seasonal dominant variability of the upper stratification at the Yucatan Channel; the regions with high variability and their timescales were identified. The stratification variability at the Yucatan Channel is mainly associated with the Yucatan Current variability, in agreement with previous research. In addition, we found and described new features of this system. Ocean dynamics is the primary determinant of the dominant hydrography variability and dynamics in the Yucatan Channel. The most important stratification variability modes are strongly connected with the hydrography and dynamics at the Yucatan Channel and the Loop Current System. We found physically consistent and statistically significant relationships between the variability at the Channel, eastward displacement of the Yucatan Current, the Loop Current intrusion, the detachment of big Loop Current Eddies, and the development of cyclonic anomalies at the northeastern Yucatan shelf. The influence of atmospheric forcing on such relationships and mechanisms was also addressed; it excited additional eigenmodes of ocean dynamics, producing significant high-frequency variability in YC dynamics and the Loop Current System, resulting in a more complex behavior of them and probably reducing their predictability in the middle and long term.
We expect our results will help expand our knowledge of the different dynamical processes occurring in the region, including those with biological relevance, such as the upwelling on the eastern Yucatan shelf. The results can be used as a baseline for further studies exploring the response of the above relationships to changes in stratification and transport of the Yucatan Current due to climate change. For future work, it is suggested to reproduce the analysis in an even more realistic setting by incorporating interannual variability into the model’s open boundary conditions.
Data availability statement
The datasets presented in this study can be found in online repositories. The names of the repository/repositories and accession number(s) can be found below: http://metadata.icmyl.unam.mx/handle/20.500.12201/11339.
Author contributions
SH-P validated the HYCOM simulations, analyzed and interpreted the data, created the figures, and wrote and revised the manuscript. EM conceived and designed the study, validated the HYCOM simulations, analyzed and interpreted the data, wrote and revised the manuscript, and acquired funding. EO-P implemented and validated the HYCOM simulations, analyzed and interpreted the data, and revised the manuscript. JZ-H interpreted the data and revised the manuscript. All authors contributed substantially to this work and approved it for publication.
Funding
This research was funded by UNAM-PAPIIT IA104320, the Instituto de Ciencias del Mar y Limnologı́a of the Universidad Nacional Autónoma de México (grants 626 and 101), and by the Mexican National Council for Science and Technology—Mexican Ministry of Energy—Hydrocarbon Fund, project 201441. This is a contribution of the Gulf of Mexico Research Consortium (CIGoM). We acknowledge PEMEX's specific request to the Hydrocarbon Fund to address the environmental effects of oil spills in the Gulf of Mexico.
Acknowledgments
The authors acknowledge the support of the participants in the project UNAM-PAPIIT IA104320: Luis Zamudio, María E. Osorio-Tai, Oscar Navarro-Sánchez, Jenny Vázquez-Ramírez, Pavel Oropeza-Alfaro, and Juan Nieblas-Piquero. SH-P thanks the support provided by UNAM-PAPIIT IA104320 and the Universidad Nacional Autónoma de México to complete her undergraduate studies. EO-P thanks the support provided by the program of postdoctoral fellowships UNAM-DGAPA. The authors acknowledge the reviewers for their valuable comments, which significantly improved this work.
Conflict of interest
The authors declare that the research was conducted in the absence of any commercial or financial relationships that could be construed as a potential conflict of interest.
Publisher’s note
All claims expressed in this article are solely those of the authors and do not necessarily represent those of their affiliated organizations, or those of the publisher, the editors and the reviewers. Any product that may be evaluated in this article, or claim that may be made by its manufacturer, is not guaranteed or endorsed by the publisher.
Supplementary material
The Supplementary Material for this article can be found online at: https://www.frontiersin.org/articles/10.3389/fmars.2023.1049662/full#supplementary-material
References
Abascal A. J., Sheinbaum J., Candela J., Ochoa J., Badan A. (2003). Analysis of flow variability in the Yucatan Channel. J. Geophysical Research: Oceans 108 (C12), 3381. doi: 10.1029/2003JC001922
Androulidakis Y., Kourafalou V., Olascoaga M., Beron-Vera F., Le Hénaff M., Kang H., et al. (2021). Impact of Caribbean anticyclones on Loop Current variability. Ocean Dynamics 71, 935–956. doi: 10.1007/s10236-021-01474-9
Athié G., Candela J., Ochoa J., Sheinbaum J. (2012). Impact of Caribbean cyclones on the detachment of Loop Current anticyclones. J. Geophysical Research: Oceans 117 (C3), C03018. doi: 10.1029/2011JC007090
Athié G., Candela J., Sheinbaum J., Badan A., Ochoa-de-la Torre J. (2011). Yucatan Current variability through the Cozumel and Yucatan channels. Cienc. Marinas 37, 471–492. doi: 10.7773/cm.v37i4A.1794
Athié G., Sheinbaum J., Leben R., Ochoa J., Shannon M. R., Candela J. (2015). Interannual variability in the Yucatan Channel flow. Geophysical Res. Lett. 42 (5), 1496–1503. doi: 10.1002/2014GL062674
Bleck R. (2002). An oceanic general circulation model framed in hybrid isopycnic-Cartesian coordinates. Ocean Model. 4, 55–88. doi: 10.1016/S1463-5003(01)00012-9
Candela J., Ochoa J., Sheinbaum J., López M., Pérez-Brunius P., Tenreiro M., et al. (2019). The flow through the Gulf of Mexico. J. Phys. Oceanography 49, 1381–1401. doi: 10.1175/JPO-D-18-0189.1
Candela J., Sheinbaum J., Ochoa J., Badan A., Leben R. (2002). The potential vorticity flux through the Yucatan Channel and the Loop Current in the Gulf of Mexico. Geophysical Res. Lett. 29 (22), 16-1–16-4. doi: 10.1029/2002GL015587
Carrillo L., Johns E., Smith R., Lamkin J., Largier J. (2016). Pathways and hydrography in the Mesoamerican Barrier Reef System Part 2: Water masses and thermohaline structure. Continental Shelf Res. 120, 41–58. doi: 10.1016/j.csr.2016.03.014
Cassisi C., Montalto P., Aliotta M., Cannata A., Pulvirenti A. (2012). “Similarity Measures and Dimensionality Reduction Techniques for Time Series Data Mining,” in Advances in data mining knowledge discovery and applications. Ed. Karahoca A. (Rijeka: IntechOpen), 71–96. doi: 10.5772/49941
Chassignet E. P., Hurlburt H. E., Smedstad O. M., Halliwell G. R., Hogan P. J., Wallcraft A. J., et al. (2007). The HYCOM (HYbrid Coordinate Ocean Model) data assimilative system. J. Mar. Syst. 65, 60–83. doi: 10.1016/j.jmarsys.2005.09.016
Chérubin L. M., Morel Y., Chassignet E. P. (2006). Loop Current ring shedding: the formation of cyclones and the effect of topography. J. Phys. Oceanography 36, 569–591. doi: 10.1175/JPO2871.1
CTOH. (2013). What are Mesoscale Processes? Available at: http://ctoh.legos.obs-mip.fr/applications/mesoscale/what-are-mesoscale-processes (Accessed December, 2022).
Donohue K., Watts D., Hamilton P., Leben R., Kennelly M., Lugo-Fernández A. (2016). Gulf of Mexico Loop Current path variability. Dynamics Atmospheres Oceans 76, 174–194. doi: 10.1016/j.dynatmoce.2015.12.003
Enríquez C., Mariño-Tapia I. (2014). “Mechanisms driving a coastal dynamic upwelling,” in Proceedings of the 17th Physics of Estuaries and Coastal Seas (PECS) Conference, Porto de Galinhas, Pernambuco, Brazil.
Ezer T., Oey L.-Y., Lee H.-C., Sturges W. (2003). The variability of currents in the Yucatan Channel: Analysis of results from a numerical ocean model. J. Geophysical Research: Oceans 108 (C1), 3012. doi: 10.1029/2002JC001509
Garcia-Jove M., Sheinbaum J., Jouanno J. (2016). Sensitivity of Loop Current metrics and eddy detachments to different model configurations: The impact of topography and Caribbean perturbations. Atmósfera 29, 235–265. doi: 10.20937/ATM.2016.29.03.05
Gill A. (1982). “Atmosphere-Ocean Dynamics,” in International geophysics, 1 edn. (United States of America: Academic Press), vol. 30.
Grötzner A., Latif M., Timmermann A., Voss R. (1999). Interannual to Decadal Predictability in a Coupled Ocean–Atmosphere General Circulation Model. J. Climate 12, 2607–2624. doi: 10.1175/1520-0442(1999)012<2607:ITDPIA>2.0.CO;2
Gruber N. (2011). Warming up, turning sour, losing breath: ocean biogeochemistry under global change. Philos. Trans. R. Soc. A: Mathematical Phys. Eng. Sci. 369, 1980–1996. doi: 10.1098/rsta.2011.0003
Hamilton P., Berger T. J., Singer J. J., Waddell E., Churchill J. H., Leben R. R., et al. (2000) “Desoto Canyon Eddy Intrusion Study, Final Report, Volume II. tech. rep., OCS study MMS 2000-080” in U.S. Dept. of the Interior, Minerals Management Service, Gulf of Mexico OCS Region, New Orleans, Louisiana. (United States Department of the Interior), 275.
Hamilton P., Bower A., Furey H., Leben R., Pérez-Brunius P. (2019). The Loop Current: Observations of Deep Eddies and Topographic Waves. J. Phys. Oceanography 49, 1463–1483. doi: 10.1175/JPO-D-18-0213.1
Hasselmann K. (1976). Stochastic climate models Part I. Theory. Tellus 28, 473–485. doi: 10.1111/j.2153-3490.1976.tb00696.x
HYCOM-GOFS3.1 HYCOM Consortium for Data Assimilative Modeling. GOFS 3.1: 41-layer HYCOM + NCODA global. Available at: https://www.hycom.org/data/glbv0pt08/expt-53ptx (Accessed November 15, 2021).
Jackett D. R., McDougall T. J. (1995). Minimal adjustment of hydrographic profiles to achieve static stability. J. Atmospheric Oceanic Technol. 12, 381–389. doi: 10.1175/1520-0426(1995)012<0381:MAOHPT>2.0.CO;2
Jacox M. G., Edwards C. A. (2011). Effects of stratification and shelf slope on nutrient supply in coastal upwelling regions. J. Geophysical Research: Oceans 116 (C3), C03019. doi: 10.1029/2010JC006547
Jochens A. E., DiMarco S. F. (2008). Physical oceanographic conditions in the deepwater Gulf of Mexico in summer 2000–2002. Deep Sea Res. Part II: Topical Stud. Oceanography 55, 2541–2554. doi: 10.1016/j.dsr2.2008.07.003
Jouanno J., Ochoa J., Pallàs-Sanz E., Sheinbaum J., Andrade-Canto F., Candela J., et al. (2016). Loop current frontal eddies: formation along the campeche bank and impact of coastally trapped waves. J. Phys. Oceanography 46, 3339–3363. doi: 10.1175/JPO-D-16-0052.1
Jouanno J., Pallàs-Sanz E., Sheinbaum J. (2018). Variability and Dynamics of the Yucatan Upwelling: High-Resolution Simulations. J. Geophysical Research: Oceans 123 (2), 1251–1262. doi: 10.1002/2017JC013535
Le Hénaff M., Kourafalou V. H., Morel Y., Srinivasan A. (2012). Simulating the dynamics and intensification of cyclonic Loop Current frontal eddies in the Gulf of Mexico. J. Geophysical Research: Oceans 117 (C2), C02034. doi: 10.1029/2011JC007279
Lin Y., Greatbatch R. J., Sheng J. (2009). A model study of the vertically integrated transport variability through the Yucatan Channel: Role of Loop Current evolution and flow compensation around Cuba. J. Geophysical Research: Oceans 114 (C8), C08003. doi: 10.1029/2008JC005199
Liu Y., Lee S.-K., Muhling B. A., Lamkin J. T., Enfield D. B. (2012). Significant reduction of the Loop Current in the 21st century and its impact on the Gulf of Mexico. J. Geophysical Research: Oceans 117 (C5), C05039. doi: 10.1029/2011JC007555
Marín M., Candela J., Sheinbaum J., Ochoa J., Badan A. (2008). On the near surface momentum balance in the yucatán Channel. Geofísica Internacional 47, 57–75. doi: 10.22201/igeof.00167169p.2008.47.1.67
Merino M. (1997). Upwelling on the Yucatan shelf: hydrographic evidence. J. Mar. Syst. 13 (1), 101–121. doi: 10.1016/S0924-7963(96)00123-6
Moreles E., Zavala-Hidalgo J., Martínez-López B., Ruiz-Angulo A. (2021). Influence of stratification and yucatan current transport on the loop current eddy shedding proces. J. Geophysical Research: Oceans 126, e2020JC016315. doi: 10.1029/2020JC016315
Morey S. L., Gopalakrishnan G., Sanz E. P., Souza J. M. A. C. D., Donohue K., Pérez-Brunius P., et al. (2020). Assessment of numerical simulations of deep circulation and variability in the gulf of mexico using recent observations. J. Phys. Oceanography 50, 1045–1064. doi: 10.1175/JPO-D-19-0137.1
Morgan P. P., CSIRO (1994). SEAWATER : a library of MATLAB computational routines for the properties of sea water / phillip p. Morgan (Australia:CSIRO Marine Laboratories Hobart, Tas), 37 pp.
NASEM. (2018). “National Academies of Sciences, Engineering, and Medicine,” in Understanding and predicting the Gulf of Mexico Loop Current: critical gaps and recommendations (Washington, DC: The National Academies Press). doi: 10.17226/24823
NCEP-CFSR. HYCOM Consortium for Data Assimilative Modeling. NCEP CFSR. Available at: https://www.hycom.org/dataserver/ncep-cfsr (Accessed November 15, 2021).
North G. R., Bell T. L., Cahalan R. F., Moeng F. J. (1982). Sampling errors in the estimation of empirical orthogonal functions. Monthly Weather Rev. 110, 699–706. doi: 10.1175/1520-0493(1982)110<0699:SEITEO>2.0.CO;2
Oey L.-Y. (2004). Vorticity flux through the Yucatan Channel and Loop Current variability in the Gulf of Mexico. J. Geophysical Research: Oceans 109 (C10), C10004. doi: 10.1029/2004JC002400
Olvera-Prado E. R., Romero-Centeno R., Zavala-Hidalgo J., Moreles E., Ruiz-Angulo A. (2022). Contribution of the wind and Loop Current Eddies to the circulation inthe southern Gulf of Mexico. ESS Open Arch. doi: 10.22541/essoar.167214412.29537730/v1
Ramos-Musalem K. (2013). Estudio numérico de los forzamientos que generan la surgencia de Yucatán. (Bsc. Thesis). UNAM Mexico, 95.
Reyes-Jiménez T., Athié G., Enriquez C., Sheinbaum J., Mariño-Tapia I., Marín-Hernández M., et al. (2023). Triggering mechanisms of the Yucatan upwelling. Continental Shelf Res. 255, 104910. doi: 10.1016/j.csr.2022.104910
Reyes-Mendoza O., Herrera-Silveira J., Mariño-Tapia I., Enriquez C., Largier J. L. (2019). Phytoplankton blooms associated with upwelling at Cabo Catoche. Continental Shelf Res. 174, 118–131. doi: 10.1016/j.csr.2018.12.015
Reyes-Mendoza O., Mariño-Tapia I., Herrera-Silveira J. A., Ruiz-Martínez G., Enriquez C. E., Largier J. L. (2016). The Effects of Wind on Upwelling off Cabo Catoche. J. Coast. Res. 32, 638–650. doi: 10.2112/JCOASTRES-D-15-00043.1
Rousset C., Beal L. M. (2010). Observations of the Florida and Yucatan Currents from a Caribbean Cruise Ship. J. Phys. Oceanography 40, 1575–1581. doi: 10.1175/2010JPO4447.1
Schmitz W. J. (2005). “Cyclones and Westward Propagation in the Shedding of Anticyclonic Rings from the Loop Current,” in Circulation in the Gulf of Mexico: Observations and Models. Eds. Sturges W., Lugo-Fernandez A. (American Geophysical Union), vol. 17, 241–261. doi: 10.1029/161GM18
Schmitz W. J., Biggs D. C., Lugo-Fernandez A., Oey L.-Y., Sturges W. (2005). “A Synopsis of the Circulation in the Gulf of Mexico and on its Continental Margins,” in Circulation in the Gulf of Mexico: Observations and Models. Eds. Sturges W., Lugo-Fernandez A., vol. 2, 11–29. (American Geophysical Union). doi: 10.1029/GM161
Sheinbaum J., Athié G., Candela J., Ochoa J., Romero-Arteaga A. (2016). Structure and variability of the Yucatan and Loop Currents along the slope and shelf break of the Yucatan Channel and Campeche bank. Dynamics Atmospheres Oceans 76, 217–239. doi: 10.1016/j.dynatmoce.2016.08.001
Sheinbaum J., Candela J., Badan A., Ochoa J. (2002). Flow structure and transport in the Yucatan Channel. Geophysical Res. Lett. 29, 10–1–10–4. doi: 10.1029/2001GL013990
Storch H. v., Zwiers F. W. (1999). Statistical Analysis in Climate Research. (Cambridge:Cambridge University Press). doi: 10.1017/CBO9780511612336
Sturges W., Lugo-Fernández A., Shargel M. (2005). Introduction to Circulation in the Gulf of Mexico. Circulation in the Gulf of Mexico: Observations and Models (American Geophysical Union (AGU)), 1–10. doi: 10.1029/161GM02
Varela R., Costoya X., Enriquez C., Santos F., Gómez-Gesteira M. (2018). Differences in coastal and oceanic SST trends north of Yucatan Peninsula. J. Mar. Syst. 182, 46–55. doi: 10.1016/j.jmarsys.2018.03.006
Yamaguchi R., Suga T. (2019). Trend and variability in global upper-ocean stratification since the 1960s. J. Geophysical Research: Oceans 124 (12), 8933–8948. doi: 10.1029/2019JC015439
Yoskowitz D., Leon C., Gibeaut J., Lupher B., Lopez M., Santos C., et al. (2013). Gulf 360: State of the Gulf of Mexico. tech. rep., harte research institute for Gulf of Mexico studies (Texas: Texas A&M University-Corpus Christi).
Zavala-Hidalgo J., Morey S., O’Brien J. (2002). “On the formation and interaction of cyclonic eddies with the Loop Current using NCOM and a suite of observations,” in OCEANS ‘02 MTS/IEEE, Vol. 3. 1463–1466. doi: 10.1109/OCEANS.2002.1191853
Zavala-Hidalgo J., Morey S. L., O’Brien J. J. (2003). Cyclonic Eddies Northeast of the Campeche Bank from Altimetry Data. J. Phys. Oceanography 33, 623–629. doi: 10.1175/1520-0485(2003)033<0623:CENOTC>2.0.CO;2
Keywords: stratification variability, Yucatan Current, Loop Current, Gulf of Mexico, Empirical Orthogonal Functions, HYbrid Coordinate Ocean Model
Citation: Higuera-Parra S, Moreles E, Olvera-Prado ER and Zavala-Hidalgo J (2023) Stratification variability in the Yucatan Channel and its relationship with the Loop Current System. Front. Mar. Sci. 10:1049662. doi: 10.3389/fmars.2023.1049662
Received: 20 September 2022; Accepted: 26 May 2023;
Published: 10 July 2023.
Edited by:
Ruoying He, North Carolina State University, United StatesReviewed by:
Baptiste Mourre, Balearic Islands Coastal Ocean Observing and Forecasting System (SOCIB), SpainLaurent Marcel Cherubin, Florida Atlantic University, United States
Copyright © 2023 Higuera-Parra, Moreles, Olvera-Prado and Zavala-Hidalgo. This is an open-access article distributed under the terms of the Creative Commons Attribution License (CC BY). The use, distribution or reproduction in other forums is permitted, provided the original author(s) and the copyright owner(s) are credited and that the original publication in this journal is cited, in accordance with accepted academic practice. No use, distribution or reproduction is permitted which does not comply with these terms.
*Correspondence: Efraín Moreles, moreles@cmarl.unam.mx
†These authors share first authorship