Flow cytometry-based biomarker assay for in vitro identification of microalgal symbionts conferring heat tolerance on corals
 Patrick Buerger1*
  Marcin Buler2*
  Heng L. Yeap3
  Owain R. Edwards2
  Madeleine J. H. van Oppen3,4 John G. Oakeshott2
  Leon Court2
- 1Macquarie University, Applied Biosciences, North Ryde, NSW, Australia
- 2The Commonwealth Scientific and Industrial Research Organisation, Environment, Black Mountain, Canberra, ACT, Australia
- 3School of BioSciences, The University of Melbourne, Parkville, Australia
- 4Australian Institute of Marine Science, Townsville, QLD, Australia
Corals’ tolerance to high temperature stress largely depends on their symbiotic microalgae (Symbiodiniaceae). However, the contributing microalgal traits and their relationships to one another are largely unclear. Here we compare the in vitro cellular profiles of seven Cladocopium C1acro microalgal strains (derived from the same ancestral strain) during a four-week exposure to 27°C or 31°C. One was an unselected wild-type strain (WT), three were selected at 31°C for nine years and shown to confer thermal tolerance on the coral host (SS+) and three others were similarly selected but did not confer tolerance (SS-). Flow cytometry was used to measure the staining intensities of cells treated with dyes representing the intracellular stress indicators reactive oxygen species (ROS), reduced glutathione (rGSH) and mitochondrial activity, as well as cell size/shape and photosynthetic pigments. Cell densities and photosynthetic efficiency (ϕPSII, Fv/Fm) were also measured. WT showed the highest levels of intracellular ROS and mitochondrial activity, lowest rGSH and largest cell sizes at both temperatures. SS+ strains had the lowest ROS and highest rGSH values and a unique pattern of correlations among parameters at 31°C. Our results support previous reports implicating the role of microalgal ROS, mitochondria and rGSH in holobiont thermal tolerance and suggest flow cytometry is a useful screening tool for identifying microalgal strains with enhanced thermal tolerance.
1 Introduction
Coral reefs are deteriorating rapidly across the world due to the increased incidence, severity and duration of marine heatwaves (Hughes et al., 2017). These extreme events disrupt the symbiosis between coral and endosymbiotic microalgae (Symbiodiniaceae), causing the loss of the algae from the coral tissue in a process known as coral bleaching (Glynn, 1996). Corals depend on photosynthates translocated from the Symbiodiniaceae for their nutrition, and without timely recolonization of Symbiodiniaceae the coral is likely to die. Mass bleaching events, in which whole regions of reef bleach severely, have been observed increasingly frequently in many parts of the world over recent years due to summer heatwaves (Hoegh-Guldberg, 1999; Hughes et al., 2018). For example, on the Great Barrier Reef (GBR) mass bleaching events have been recorded frequently in recent years, including 2016, 2017, 2020 and 2022, whereas fewer such events had been recorded there previously (e.g., in 1998, 2002 and 2006). The impacts of the recent events have increased in severity and footprint (Hughes et al., 2021), reducing coral recruitment and shifting community diversities, which is predicted to also impact ecosystem functioning (Cheung et al., 2021). Targeted intervention strategies could support coral adaptation to climate change if carbon emissions are simultaneously reduced (Anthony et al., 2017; Bay et al., 2019) but many of these strategies depend on understanding the molecular mechanisms underpinning thermal tolerance (van Oppen et al., 2017).
One of the main drivers of coral bleaching is assumed to be excess production of reactive oxygen species (ROS) (reviewed by Szabó et al., 2020). ROS molecules, such as superoxide () and hydrogen peroxide (H2O2), can be produced in the cell’s chloroplast, mitochondria and peroxisomes and their levels are usually controlled by antioxidant systems. However, at high temperatures, excess ROS can be produced through an over-reduction within electron transport chains, which can overwhelm antioxidant capacities and result in cellular malfunctions (Lesser, 1996; Downs et al., 2002; Lesser, 2006; Weis, 2008; but see Nielsen et al., 2018). In Symbiodiniaceae, excessive ROS produced in chloroplasts and mitochondria can lead to protein, DNA and organelle degradation (see review by Lesser, 2006; Roberty and Plumier, 2022). Extrapolating from effects demonstrated in higher plants (Sharma et al., 2020), ROS can affect a chloroplast’s photosystems and lead to photoinhibition (Takagi et al., 2016). Such declining physiological performance is commonly monitored through measurements of the maximum quantum yield and Photosystem II (PSII) operating efficiency. In mitochondria, excess ROS can also lead to disruption of mitochondrial membranes with impacts on cellular respiration (Lesser, 2006; Liberatore et al., 2016; Oakley and Davy, 2018), which can be measured, for example, as changes in their membrane potential (ΔΨm) (Dourmap et al., 2020; van Aken, 2021). Accordingly, declines in the functionalities of both microalgal chloroplasts and mitochondria are likely early indicators of oxidative heat stress.
Potentially counteracting these effects, however, antioxidant defense mechanisms such as superoxide dismutase enzymes and the reduced form of glutathione (rGSH) can help maintain an equilibrium between ROS production and scavenging, thus minimizing cellular damage and sustaining the natural molecular signaling function of ROS (Hasanuzzaman et al., 2020). In particular, glutathione is a prominent redox buffer in most eukaryotic cells (Brandes et al., 2009). The predominant form of a cells’ glutathione is in the reduced form (Mallick and Mohn, 2000), which is usually >90% of the total thiol content (Noctor et al., 2002; Owen and Butterfiel, 2010).
Notably, differences between Symbiodiniaceae species and strains have been found in the activities of several of these elements of ROS production, damage and scavenging. Hence, these differences could be important sources of variation in the tolerance of microalgal symbionts to elevated temperatures in vitro and in hospite (Suggett et al., 2017). A study system for examining the physiological basis of variation in the heat tolerance properties of the Symbiodiniaceae involves a set of closely related strains of Cladocopium C1acro developed through experimental evolution. Heat-evolved Cladocopium C1acro strains, referred to as heat-evolved strains (SS strains), and their wild-type counterparts (WT strains) were established from the same mother culture in 2011 and kept at 31°C and 27°C respectively since their establishment (Chakravarti et al., 2017). The ten SS strains show higher tolerance to 31°C, as reflected in higher growth rates, maintenance of photosynthetic efficiency and lower net ROS compared to the WT strains (Buerger et al., 2022). Some of the SS strains (hereafter SS+ strains) also enhanced thermal bleaching tolerance of coral larvae and juveniles, although other SS strains (hereafter SS-) did not. Specifically, larvae of the coral Acropora tenuis in symbiosis with any one of the SS+ strains (SS1, SS7 or SS8) were found to maintain symbiont numbers in their tissues during a short term heat stress experiment while larvae with SS- or WT strains bleached (Buerger et al., 2020) and juveniles of the coral A. tenuis in symbiosis with a SS+ strain (SS1) showed higher thermal tolerance than juveniles with a WT strain (Quigley and van Oppen, 2022).
While the SS+ strains showed superior tolerances in symbiosis with corals, it is unclear what aspects of their physiology distinguish them in culture, i.e., independently of the host. Literature on the effects of thermal stress on microalgal cells suggest changes in an array of potentially interacting traits, ranging from cell size and shape (Skau et al., 2017) to photosynthesis (Chakravarti and van Oppen, 2018) and mitochondrial function (Roberty and Plumier, 2022; see also Jakovljević and Stanković, 2020), could come into play. Elucidating which of these traits distinguish the SS+ strains in culture will not only help explain how those strains confer tolerance in hospite but could also provide biomarkers for efficient screening of microalgal cultures that might be suitable for reef restoration purposes.
Until now, flow cytometry has mainly been used in coral-related research to quantify Symbiodiniaceae cells in samples or to measure their pigment content (e.g., Lee et al., 2012; Krediet et al., 2015; McIlroy et al., 2016). However, it also allows rapid and sensitive characterization of the morphology and detailed physiology of the cells through light scattering and fluorescence measurements (Hyka et al., 2013). Combined with the use of cell sorting capabilities and specific fluorescence probes, flow cytometry can also be used to identify strains with desired features (Pereira et al., 2018; da Silva and Reis, 2020) and quantify specific biochemical processes with fluorescence markers. As needs, these properties and processes can be measured separately on different subpopulations and multiplexed in a single assay system. While plate readers can be used with fluorescence markers to examine cell suspensions for some of these measures, they do not provide the high throughput, single cell resolution and cell sorting capabilities. As yet, however, few studies have used the power of flow cytometry to assess the responses of Symbiodiniaceae cells to heat stress (Lee et al., 2012; Delamare-deboutteville et al., 2020; Maruyama et al., 2022) and none have used it to identify the underpinning physiologies, and hence potential biomarkers, associated with enhanced thermal tolerance, either in culture or in hospite.
The current study makes extensive use of flow cytometry and fluorescence probes to identify traits that distinguish Symbiodiniaceae strains with different thermal tolerances and capacities to confer their tolerance to the coral host.
2 Materials and methods
2.1 Microalgal strains
Seven Cladocopium C1acro strains (three SS+ strains, three SS- and one WT strain) were obtained from the Australian Institute of Marine Science in May 2020 (culture collection numbers: SCF-055.10 for WT10, SCF-055.01, SCF-055.07, and SCF-055.08 for the SS+ strains SS1, SS7 and SS8 respectively, and SCF-055.03, SCF-055.05 and SCF-055.09 for the SS- strains SS3, SS5 and SS9, respectively). The strains were established in an assisted evolution experiment that started in 2011, in which the temperature was increased for the SS strains from ambient 27°C to elevated 31°C over two months in a step-wise fashion and the best growing strains were transferred to the next step. Then, the SS strains were cultivated at 31°C on a permanent basis, showing enhanced in vitro thermal tolerance in several performance assessments (Chakravarti et al., 2017; Buerger et al., 2022). Some of the strains, here termed SS+, also conferred their thermal tolerance in hospite when in symbiosis with coral larvae (Buerger et al., 2020) and juvenile corals (Quigley and van Oppen, 2022). In comparison, the WT strain has been maintained at 27°C since 2011.
In the current experiment, the seven strains were characterized in vitro for nine physiological and morphological traits previously implicated in thermal tolerance over a 28-day period at ambient (27°C) and elevated temperatures (31°C). The parameters assessed were: cell densities (CellDen) through automated cell counts; photosynthetic efficiency, specifically maximum quantum yield and PSII operating efficiency (Fv/Fm, ϕPSII), through pulse-amplitude modulation chlorophyll fluorometry; and flow cytometry-based techniques which represent, albeit do not directly measure, intracellular reactive oxygen species (ROS), mitochondrial activity, reduced glutathione (rGSH) and photosynthetic pigments (mainly chlorophyll; Chl), plus cellular size and complexity as measured by forward and side scatter (FSC and SSC, respectively; Figure 1).
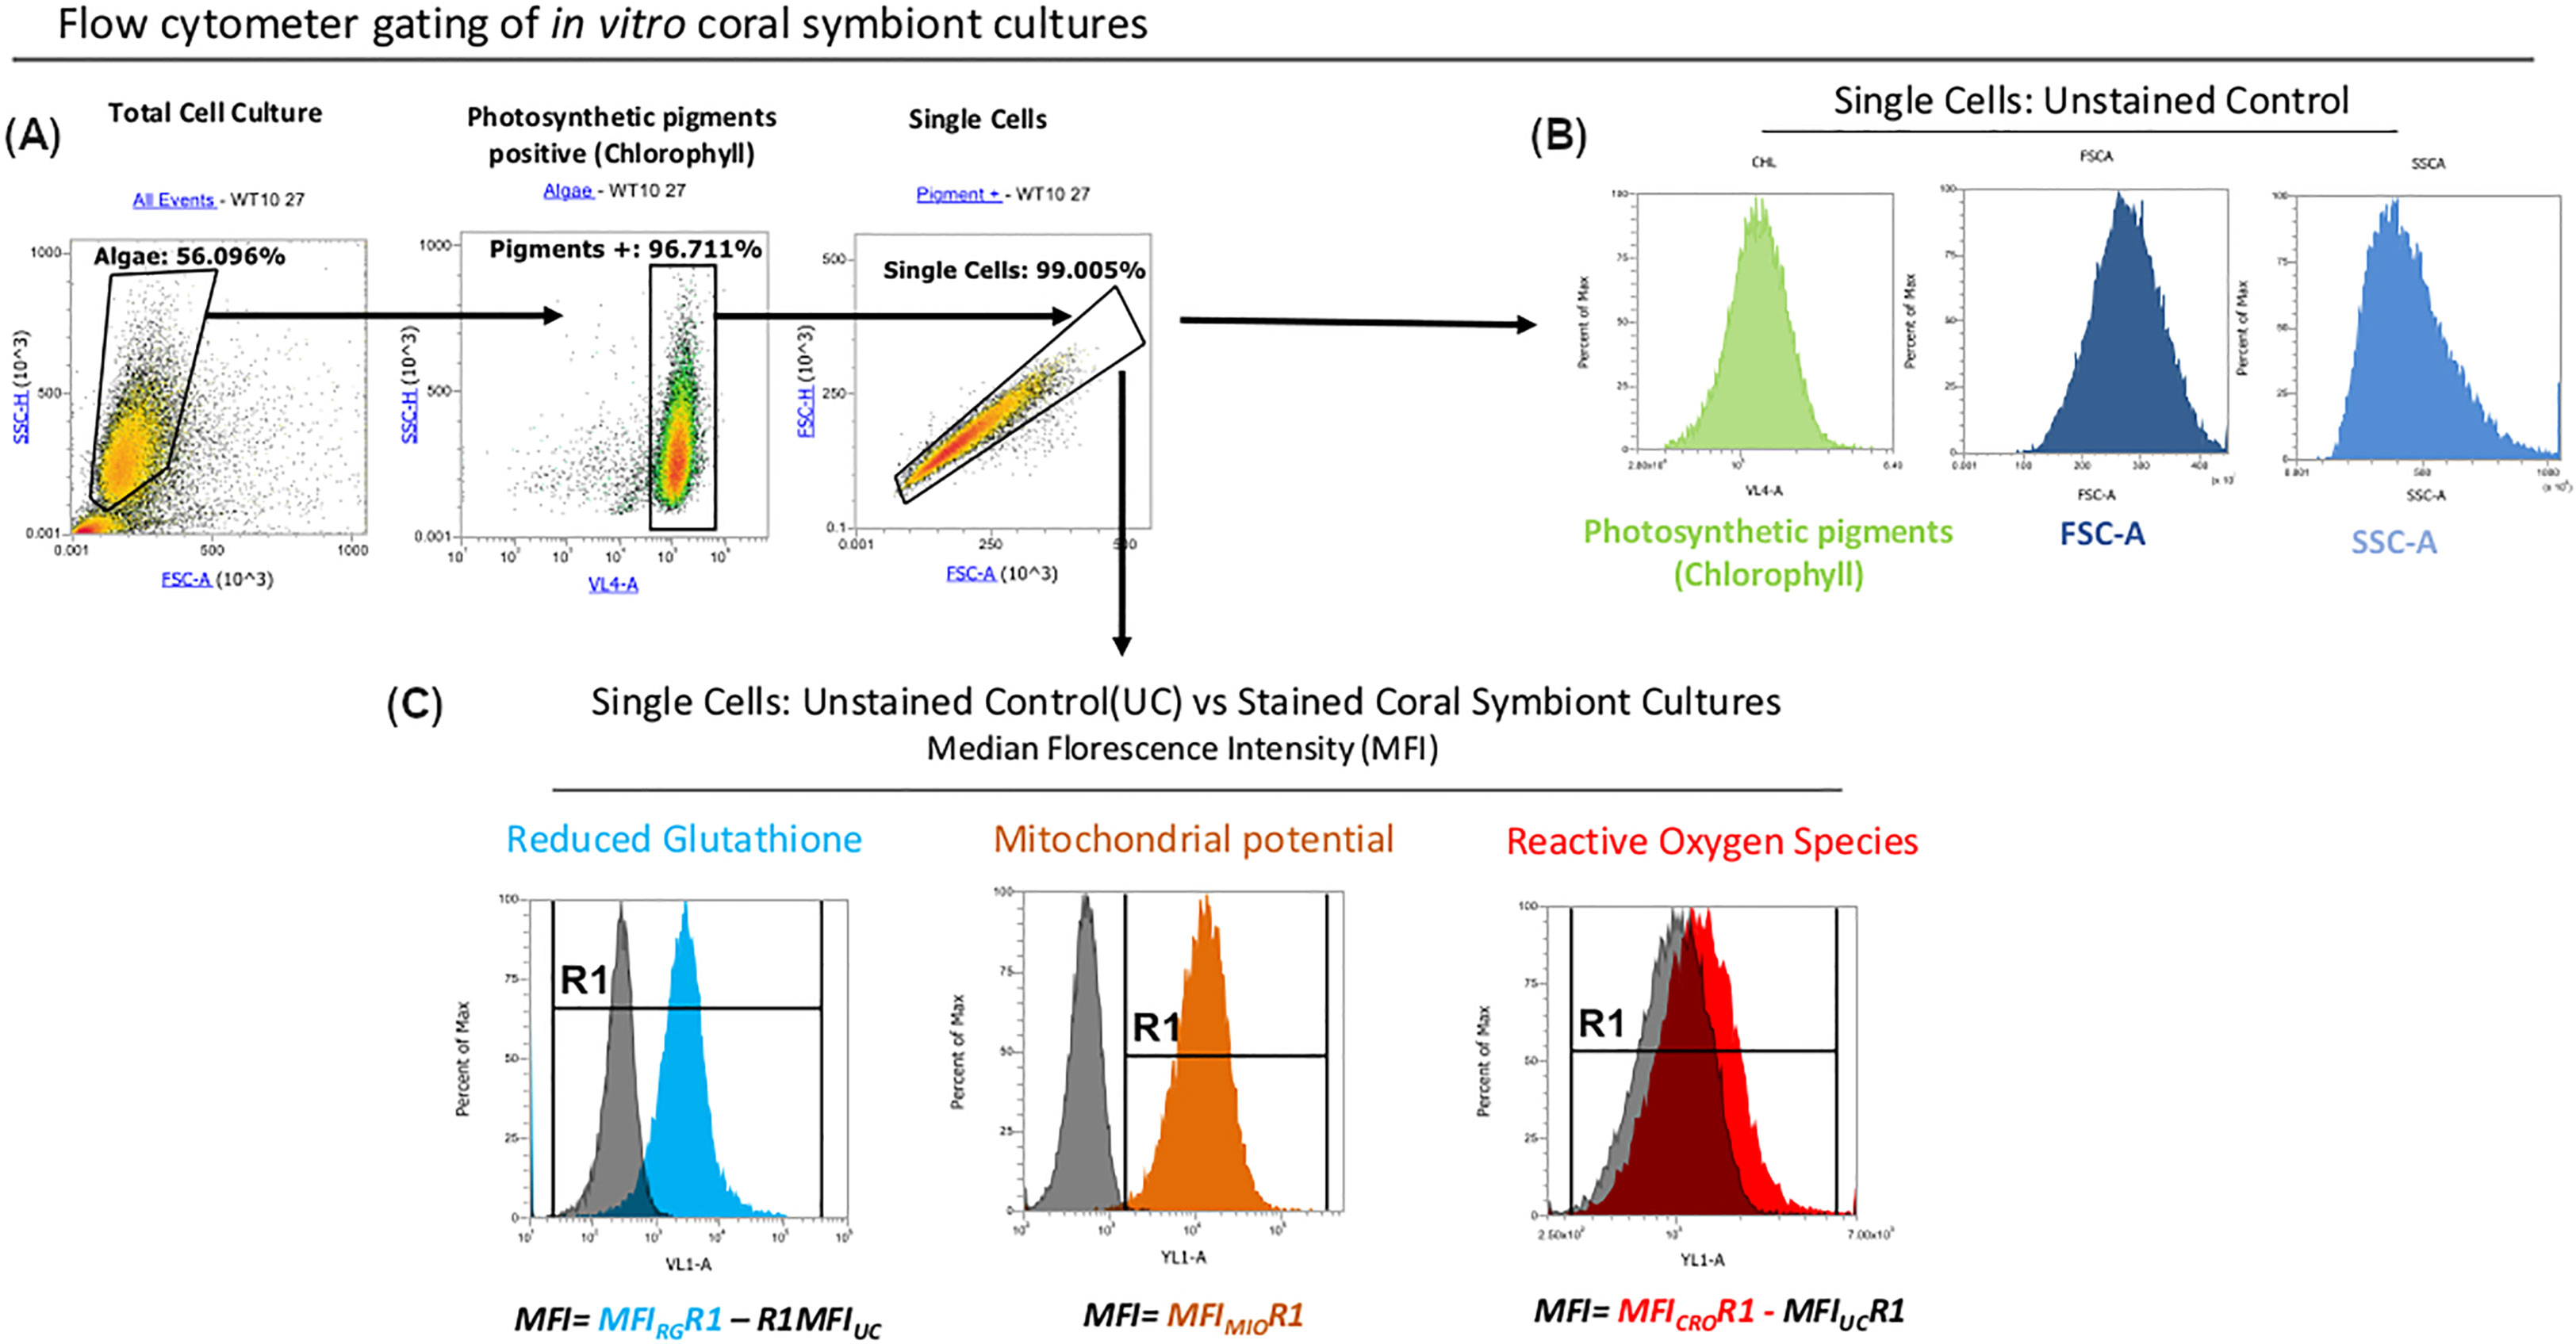
Figure 1 Flow cytometry workflow. (A) Microalgal cells were gated based on their characteristic FSC and SSC patterns. Only cells that were positive for photosynthetic pigments signal (likely chlorophyll) were selected for downstream analysis. (B) MFI values of Chlorophyll, FSC and SSC were measured in unstained controls (UCs). (C) Raw MFI values for rGHS and ROS were obtained in samples stained with Vita-Bright-48 and CellROX Orange reagents respectively and normalized by subtracting the autofluorescence signal from unstained controls in response to the excitation from the respective lasers. MFI values for MitoTracker Orange CMTMRos-stained cells used to measure mitochondrial potential (ΔΨm) were well separated from the autofluorescence signals of unstained controls and could therefore be analyzed without normalisation against unstained controls.
2.2 Experimental set up
Throughout our experiment, the strains were incubated in temperature-controlled rooms at either ambient (27°C) or elevated temperatures (31°C) with 50% relative humidity, using LED lights (type: SMD5050 LED 60 LEDs/m; spectrum: Figure S1) at a light intensity of 31 to 33.5 PAR on a 12:12 light:dark cycle. Each culture was provided 0.2 µM of filtered IMK medium prepared from Mili-Q water and Red Sea Salt (Red Sea/cat: 398-01333) and enriched with Daigo’s IMK Medium for Marine Microalgae (cat: 398-01333, Nihon Pharmaceutical Co).
To obtain enough biological material for the experiment, the seven strains were each cultured for three months at 27°C in 100 mL media (175 cm2 growth flasks, cat: NUN159910, Thermo Fisher Scientific) and then split into 25 cm2 assay flasks, seeded at 3 x 10⁵ cells/mL in a total volume of 31 mL. Performance at 27°C and 31°C was then compared over 28 days, which would have included approximately 5 - 6 microalgal generations spanning the lag, exponential and stationary phases of the culture (Chakravarti et al., 2017 estimated ~80 generations per year for similar culture conditions). To minimize evaporation, the assay flasks were arranged and stored in clear plastic boxes (Sistema, Klip it Plus, plastic type: polypropylene). Each box contained one assay flask for each of five SS strains and one WT10 control assay flask. When we measured the light spectrum both with and without the lid, no effect was observed on the light transmission (data not shown). The boxes with the assay flasks were placed at 27°C to allow them to acclimate for two days after subculturing. To minimize variation in light exposure within the respective temperature-controlled rooms, all box positions were rotated on the shelf twice per week and assay flask positions were randomized within a box at each sampling time-point.
Nine response variables were measured on samples of each flask at Days 4, 11, 18 and 28. We tested five assay flasks for each of the six SS strains and six assay flasks of the WT10 strain at two temperatures per time-point (total number of samples per time-point: 72). To optimize the workflow, reduce the risk of overstaining samples (Figure S2) and keep differences in processing times to a minimum, we therefore staggered the workflow over three days for each time-point, only processing 24 samples on each measurement day. These 24 samples were then prepared according to four Attune protocols (unstained controls, VitaBright-48, CellROX Orange, MitoTracker Orange). At each time-point, the microalgal cells were detached from the assay flask surface using a sterile disposable cell scraper (cat: 83.3951, Sarstedt) and resuspended uniformly by gentle pipetting using an S1 Pipet Filler (cat: 9531, Thermo Fisher Scientific) fitted with a sterile 0.45 µM hydrophobic filter (cat: MAT9057, Thermo Fisher Scientific) and a sterile disposable 10 mL serological pipette (cat: 357551, Corning). A total of 6.5 mL was removed per assay flask at each sampling time and transferred to a sterile 15 mL tube (cat: 430766, Corning) until split proportionally for each of the following measurements.
2.3 Cell densities
Cell density readings were obtained on a TALI image-based cytometer (cat: T10796, Thermo Fisher Scientific). Two technical replicate readings of 25 µL were made on each assay flask at each time-point and averaged to give a final estimate. TALI cytometer settings for each reading were: viability assay, 20 fields, cell gating 5 to 14 µM, sensitivity setting 6; circularity setting 8. The cell count measurements were then used to normalize each strain’s samples to 0.4 * 106 cells/mL prior to the following flow cytometry measurements.
2.4 Cell staining
After density normalization, aliquots of 1.5 mL were used as unstained control cells or taken into the respective staining workflows using CellROX Orange (representing ROS, i.e., superoxides) and MitoTracker Orange (representing mitochondrial activity). In addition, aliquots of 1 mL were taken into the VitaBright-48 staining workflow (representing thiols, in particular reduced glutathione). Each of the aliquots for the respective stains were washed once by centrifugation and concentrated (Table 1). The cells were then subjected to the respective staining protocols below and measured for their fluorescence intensity on the Attune NxT Flow Cytometer. To minimise processing times, the sample batches were stained in a staggered manner, starting the second stain while measuring the first and starting the third while measuring the second, with VB-48 always applied first, followed by CellROX Orange and then MitoTracker Orange.
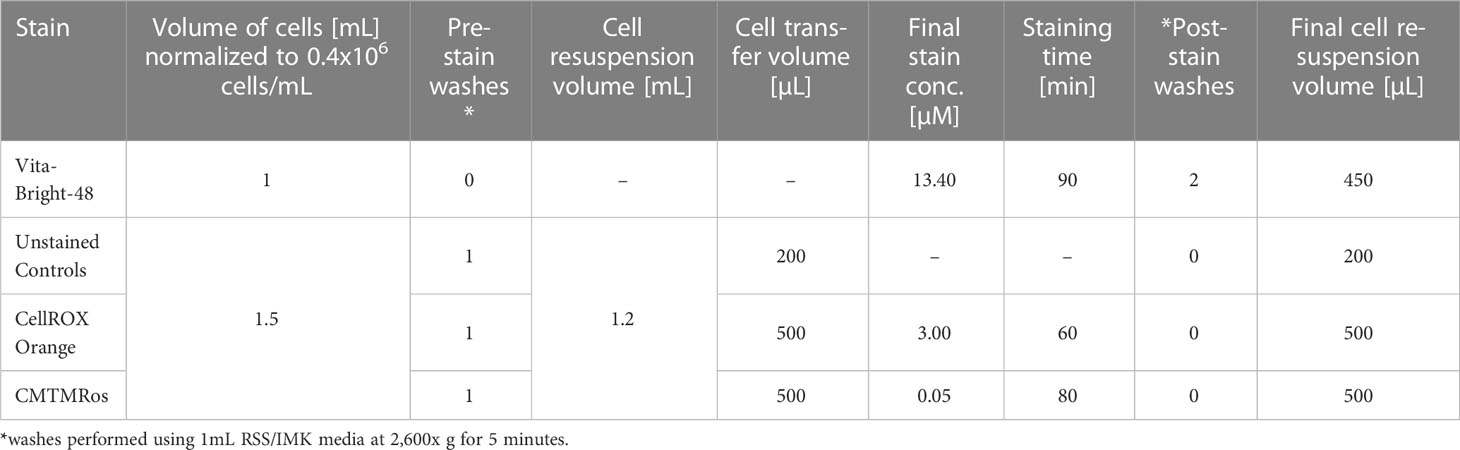
Table 1 Washing and staining conditions prior to flow cytometry.
2.5 Intracellular ROS staining with CellROX Orange
CellROX Orange is a cell-permeable dye that is not fluorescent in its reduced state but becomes fluorescent after it is oxidized in the cell’s cytoplasm on contact with various forms of ROS (hydrogen peroxide, hydroxyl radicals, nitric oxide, or peroxynitrite or superoxide anions, hereafter H2O2, HO, NO, O2– or ONOO–, respectively; Johnson & Spence, 2010). While CellROX Orange is not suitable to distinguish and quantify specific forms of ROS, in this study it is used to estimate the overall oxidative stress response of a cell. To measure intracellular ROS, 0.5 mL samples of cell culture normalized as above were resuspended by vortexing and then stained with CellROX Orange reagent (cat: C10443, Thermo Fisher Scientific). To prepare a 250 µM working stock of the staining solution, a 16 µL sample of CellROX Orange reagent at 2.5 mM was diluted 1:10 by the addition of 144 µL of fresh media (as per manufacturer’s instructions). Staining of cells was synchronized across all tubes by pipetting 6 µL of the working stock into the lid of each 2 mL tube and then mixing all tubes in a tube rack at once by repeated inversion. The cells were then incubated for 60 minutes at room temperature in a dark cupboard (final stain concentration of 3 µM).
2.6 rGSH staining with VitaBright-48
VitaBright-48 is a cell-permeable fluorescence dye that reacts with thiols, including rGSH (Skindersoe et al., 2012; Skindersoe and Kjaerulff, 2013). Here, we considered the measured values as approximations of reduced glutathione levels (here referred to as rGSH). One mL samples of cell culture normalized as above were resuspended by vortexing and stained with VitaBright-48 contained in Solution 6 (cat: 910-3006, ChemoMetec; 1.34 mM for VitaBright-48; 0.75 mM PI) (Skindersoe et al., 2012). Staining was synchronized across all 2 mL tubes in a measurement day by first pipetting 10 µL of Solution 6 into the lid of each 2 mL tube and then mixing all tubes in a tube rack at once by repeated inversion. The cells were then incubated for 90 minutes at room temperature in the dark (final stain concentration of 13.4 µM for VitaBright-48 and 7.5 µM for PI). After staining, the microalgae were washed twice by pelleting the cells each time at 2,600 g for five minutes and then resuspending in 1 mL fresh media by briefly vortexing. The cells were pelleted one final time as above and then resuspended in 450 µL fresh media.
2.7 Mitochondria staining with Mitotracker orange
Mitotracker Orange (CMTMRos, cat: M7510, Thermo Fisher Scientific) was used to assess mitochondrial activity. Each tube of stain contained 50 μg lyophilized solid CMTMRos, which was reconstituted to 200 µM with the addition of 585 µL DMSO. A 5 µL sample of that solution was then diluted 1:40 by the addition of 195 µL DMSO to produce a 5 µM working stock. For the staining, cell culture samples of 0.5 mL were normalized as above, dispensed into 2 mL tubes (cat: 0030120094, Eppendorf) and treated with the working stock. Staining was synchronized across all tubes by pipetting 5 µL of 5 µM CMTMRos into the lid of each 2 mL tube and then mixing all tubes in a tube rack at once by repeated inversion. The microalgal cells were then incubated for 80 minutes at room temperature in the dark (final stain concentration of 5 nM, Table 1).
2.8 Flow cytometry
Microalgal cells were acquired with the Attune NxT Flow Cytometer and analyzed with Attune NxT software (Thermo Fisher Scientific) and FCS files of all raw data can be made available on request. The specific gating configurations used selected for discrete photosynthetic pigments-positive cells (Figure 1 and see below), reducing potential contamination from cell debris. Details of instrument settings, number of cells measured, acquisition and drawing volumes and peak emissions/bandwidths for the filters used and the excitation/emission maxima of the three stains are given in Table S1. The fluorescence intensity of a population on a logarithmic scale (Figure 1) of pigments-positive cells and their side and forward scatter heights (SSC-H and FSC-H, respectively) were determined in unstained controls (UC), while samples stained with the respective dyes were treated and acquired separately to avoid spectral crossover.
Due to a relatively high background signal and/or weak dye signal in samples treated with VitaBright-48 and CellROX Orange dyes respectively, values for these stains were calculated by subtracting the measured blanks (unstained controls, MFIUC) from the stain’s MFIs (Figure 1). In contrast, a distinctive peak separation in MitoTracker Orange CMTMRos stained samples allowed us to measure mitochondrial activity in cells without MFIUC subtraction.
The Attune was configured with three lasers, one of excitation 405 nm for measuring rGSH and Chl, one of excitation 488 nm for measuring FSC and SSC, and one of excitation 561 nm for measuring ROS and MitoTracker Orange. In order to ensure consistent measurements between samples and to avoid potential instrument blockages, we performed a rinse step after every six samples. Note that we do not know which specific photosynthetic pigments contributed to our Chl measurements because chlorophyll a, b and c and carotenoids have overlapping absorption spectra and are all excited by the 405 nm laser.
2.9 Photosynthetic efficiency
At each time-point, photosynthetic efficiency was assessed using an imaging pulse-amplitude modulation chlorophyll fluorometer (IPAM M-series, Walz, Germany). Measurements of maximum quantum efficiency (Fv/Fm) calculated as [(Fm - Fo)/Fm] (Murchie and Lawson, 2013) were performed on 6 hour dark-adapted samples in their assay flasks with a starting volume of 30 mL (Fo = the minimal level of fluorescence; Fm = maximum possible yield of fluorescence). The dark adaptation time was chosen for logistical reasons. Three technical replicate measurements on each flask assayed were averaged at each time-point to generate a biological replicate. The operating efficiency of PSII photochemistry (ΔF/Fm or ϕPSII) calculated as [(Fm′ - F′)/Fm′] (Murchie and Lawson, 2013) was measured after a five minute actinic light exposure (blue LED, 450 nm) in order to light adapt the (F′ = steady-state level of fluorescence of light adapted samples; Fm′ = maximum possible yield of fluorescence of light adapted sample). For both variables, measurements at three circular locations were averaged as technical replicates for each flask. The following instrument settings were used: measurement intensity, 6; saturation pulse, 10; gain, 2; damping, 2. The data for each strain, with means across replicates, are given in Figure S3, while the raw data is available in the Supplementary Data.
2.10 Statistical analysis
The raw flow cytometry data showed dispersed distributions and some extreme values, albeit no clear outliers, as indicated by some relatively large standard deviations (Figure S3). We therefore analysed the median rather than mean fluorescence intensity because the former (hereafter MFI) provides a more accurate and robust representation of the behaviour of the majority of a well dispersed population (Cram, 2002; Hawley and Hawley, 2004; Lugli et al., 2010; Givan, 2011).
All nine response variables were presented with 95% confidence intervals assuming t distributions (the flow cytometry variables on natural log scales, and the physiological variables with their raw values). All variables were then scale-normalized to unit ranges. We then ran a PERMANOVA (R version 4.1.1, package vegan) for each individual variable against a full interaction model for the factors temperature, sampling time and strain group. MANOVA and ANOVA were not used because the data for all variables failed normality, heteroscedasticity and outlier tests (from the R packages mvnormtest, biotools and mvoutlier respectively). Pearson correlations were calculated between the respective parameters and visualized as a matrix. We then performed a principal component analysis (PCA) on the normalized variables to obtain a reduced number of variables which was used as input for linear discriminant analyses (LDAs) to visualize the differences between strain groups across temperatures and sampling times. For visualization of the LDA, meeting the assumptions of normality and homoscedastic is not required (Hastie et al., 2009). Pairwise plots to demonstrate group separations considering minimal numbers of parameters were also generated.
Since our flow cytometry did not quantify the absolute values of the underlying biochemistries, the differences in them between strains, temperatures and sampling times revealed by our statistical analyses must be interpreted in relative rather than absolute terms.
3 Results
3.1 Changes in individual variables
None of the three measurements CellDen, ϕPSII, and Fv/Fm showed significant differences at 27°C between the three types of strains. However, at 31°C, all three measurements were able to statistically differentiate between the three types of strains from Day 4 onwards (see the 95% confidence intervals in Figure 2A). At 27°C, CellDen increased to a plateau by ~11 Days while ϕPSII and Fv/Fm values decreased, particularly after ~11 Days. At 31°C, the CellDen of all three strain types only rose slightly up to ~11 Days and then fell, but the trajectory for SS+ was significantly higher than that of SS-, which in turn was higher than that of WT (cell densities of 0.917 x 10⁶, 0.672 x 10⁶ and 0.484 x 10⁶ for SS+, SS- and WT strains, respectively). Similarly, ϕPSII and Fv/Fm at 31°C also decreased in all three strain types but the decrease was less for the SS+ than the SS- or WT strains (ϕPSII values decreased by 27%, 37% and 37% and Fv/Fm values decreased by 50%, 62% and 70% for SS+, SS- and WT strains, respectively).
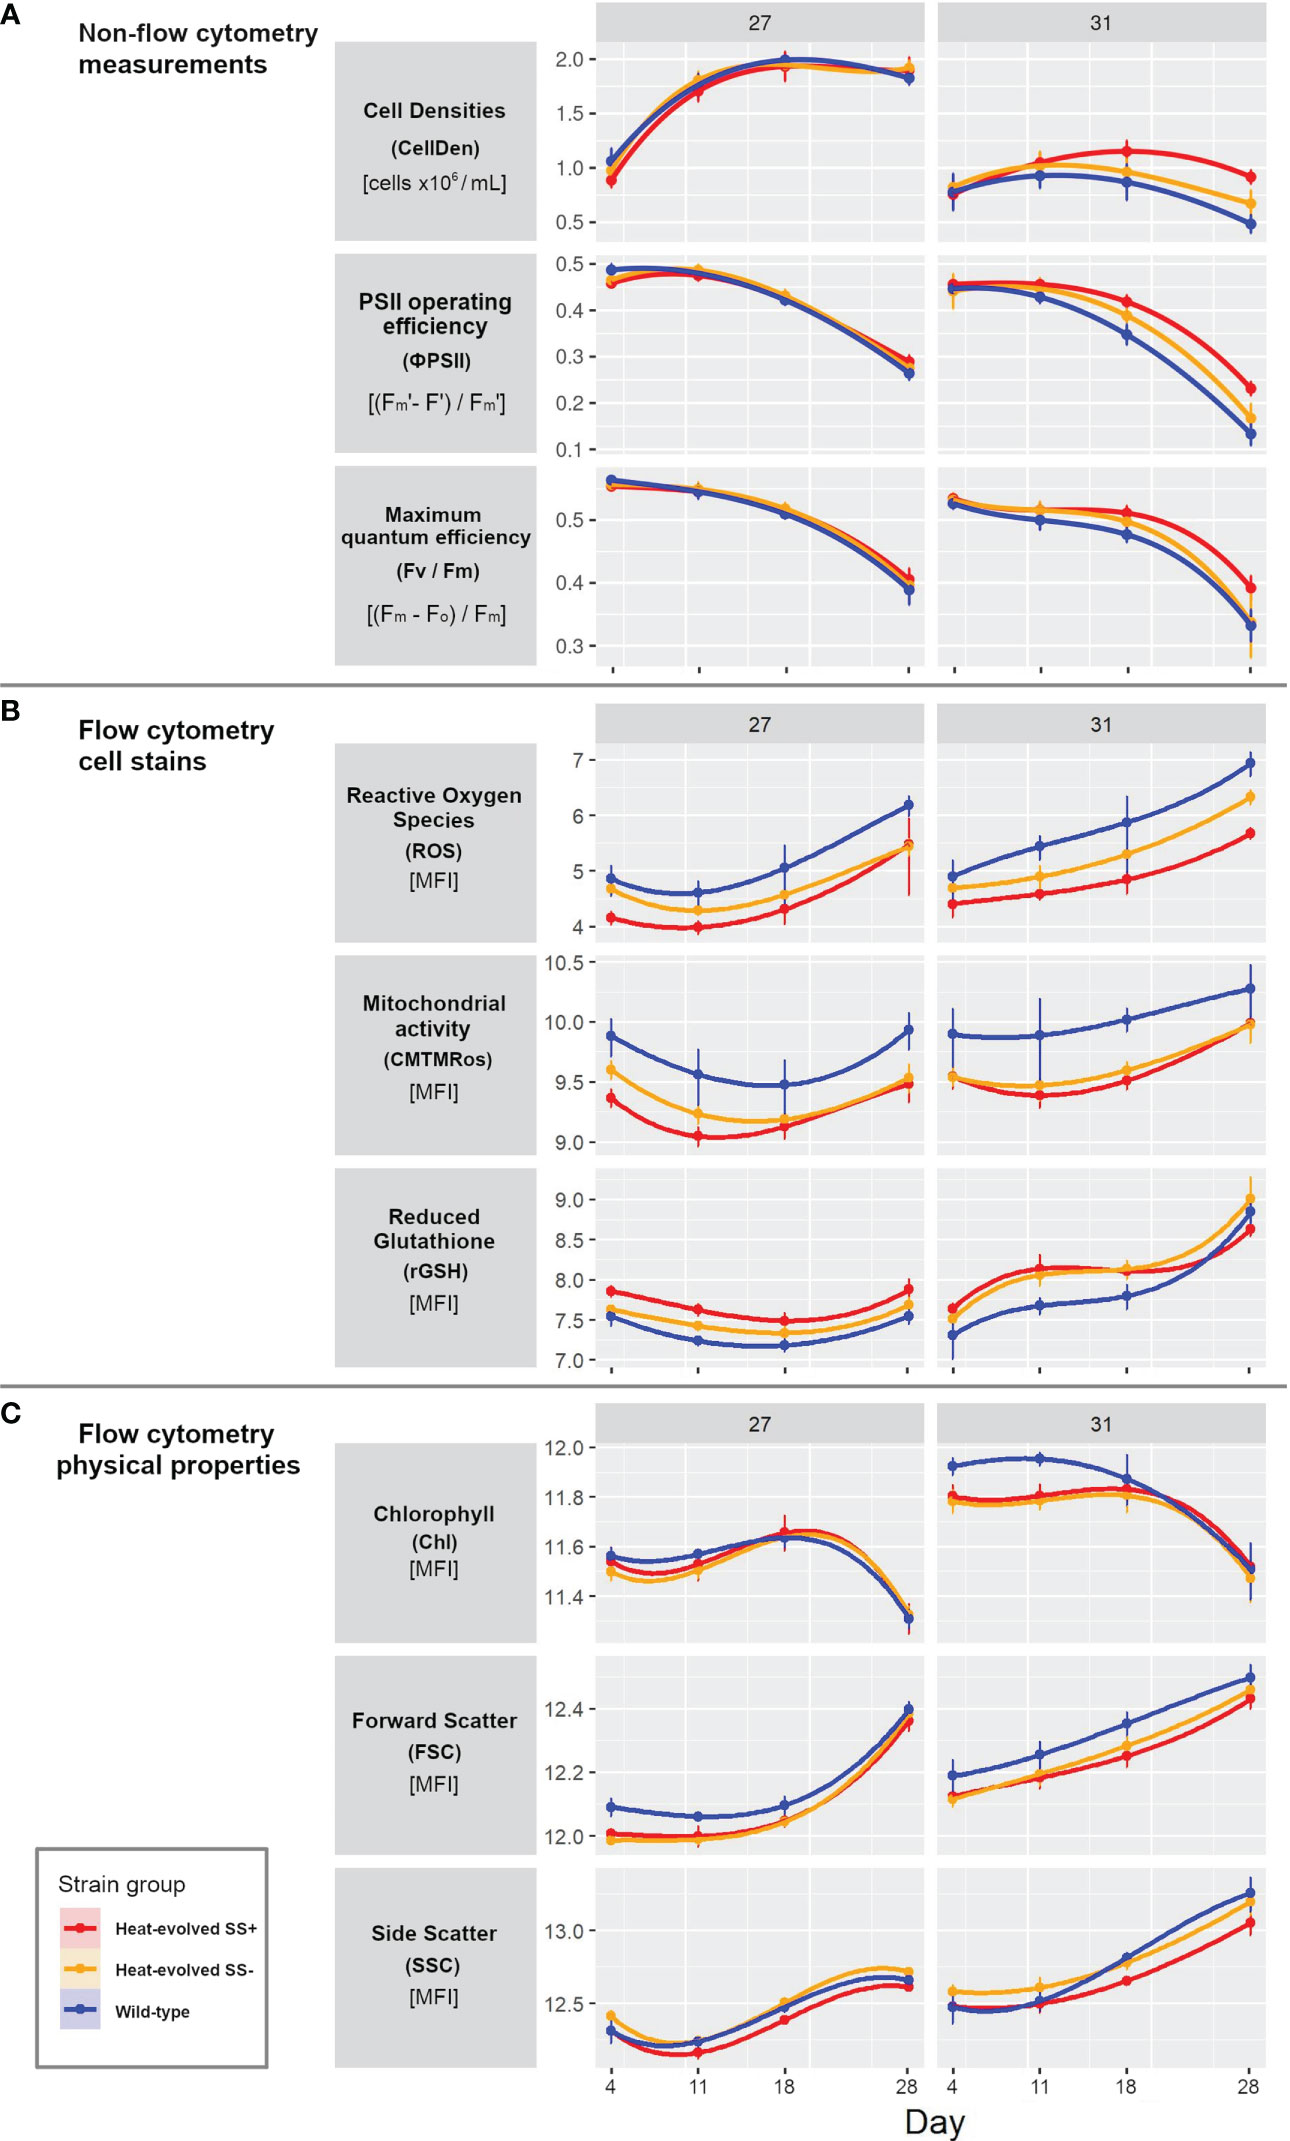
Figure 2 Progress curves for the three strain types for each variable and temperature. (A) Non-flow cytometer measurements of cell density, PSII operating efficiency and maximum quantum efficiency. (B) Flow cytometry cell dye measurements of reactive oxygen species (CellROX Orange), mitochondrial activity (MitoTracker Orange, CMTMRos) and reduced glutathione (VitaBright-48), all displayed as median fluorescent intensity [MFI]. (C) Flow cytometry measurement of the physical properties photosynthetic pigments, and cell size and shape (forward and side scatter respectively). Panel (A) is showing raw data values, while panel (A, B) are presented on natural log scales [log(data point +1)]. Error bars show 95% confidence intervals based on 5 or 6 replicates and assuming t distributions. Measurements were taken on Days 4, 11, 18 and 28.
In contrast, the three dye-based flow cytometry measurements ROS, mitochondrial activity and rGSH revealed significant differences between the three types of strains at both temperatures (Figure 2B). At 27°C the values for all measures dropped initially (by ~ 25%; note that this and all other % changes given below were calculated on untransformed values) and then rose again, with SS+ always significantly lower than WT for ROS (by 101 ± 10%) and mitochondrial activity (by 58 ± 12%) and significantly higher for rGSH (by ~28 ± 3%). SS- was intermediate (between SS+ and WT) for all three variables but moved closer to SS+ for ROS and mitochondrial activity over time. At 31°C the values for all three variables showed a stronger upward trend over time. SS+ values were again consistently lower than WT values for ROS (by 158 ± 80%) and mitochondrial activity (by 51 ± 17%). Compared to the SS+ strains at 31°C, the WT showed 5 times as much fluorescence for CellROX Orange on Day 28 (ROS fluorescence for SS+ 290; SS- 559; WT: 1,029). rGSH values were also again significantly higher initially for SS+ than WT but in this case the difference disappeared over time. SS- was again consistently intermediate for ROS but similar to SS+ for the other two variables.
Relatively few differences between the strain types were evident in the flow cytometry measurements of physical cell properties (FSC, SSC) and photosynthetic pigments (Chl) at either temperature (Figure 2C). There was little change in any of the three measures over the first three time-points at 27°C, but by Day 28 Chl had dropped (by ~20%) and FSC had risen considerably (by ~42%), and SSC had risen to a lesser extent. While SS+ and SS- were initially lower than WT for FSC (by ~10%), that difference had disappeared by Day 28. The directions of the changes over the course of the experiment for each measure at 31°C were similar to those at 27°C but the relationships between the strains changed over time for both Chl and SSC. Chl values were also initially slightly (only ~5%) lower for SS+ and SS- than WT but the difference disappeared by Day 14. SS- values were always higher than SS+ values for SSC but WT values were initially similar to SS+ but similar to SS- at Days 11 and 28. On the other hand, SS+ and SS- showed slightly lower FSC values (by ~7%) than WT at 31°C throughout the experiment.
In sum, all nine measures changed during the experiment, with the trajectories of several differing between temperatures and most differing between strain types, particularly between SS+ and WT, for at least one of the temperatures. Of the key parameters proposed from earlier work (see Introduction), ROS and mitochondrial activity showed relatively minor differences between temperatures but relatively large differences between strain types, while rGSH showed greater differences between temperatures but less consistent differences between strains. Differences also occurred in photosynthetic efficiencies, although the patterns of change differed; there were clear drops in the last time interval, particularly at 31°C, as well as strain type and temperature differences at that interval. Cell density increased early and cell shape changed late in all three strain types at 27°C, whereas at 31°C cell density did not show marked temporal change, but clear strain type differences emerged in all three measures, particularly cell density.
3.2 Permutational analysis of variance
As expected from the progress curves, three-way factorial permutational analyses of variance (PERMANOVAs) showed large main effects of time and temperature and smaller but still significant effects of strain type on all nine parameters (Table 2). However, at least two of the four interaction terms were also significant for all the variables, and in all cases at least one of them involved strain type. The combined contributions of main or interaction terms involving strain type to the total variance were ~28% for ROS and ~23% for mitochondrial activity but less than 10% for all the other variables. For most of the variables, including ROS, the main effect of strain type contributed less than half of their respective combined contributions but for mitochondrial activity it accounted for most of it (~21 of the 23%).

Table 2 Analyses of variance.
3.3 Correlations among measurements
To better understand the relationships among the variables, pairwise correlational analyses (Pearson’s r) on various sets of the data were carried out. The first of these analyses included all the data (Figure 3A). The strongest positive correlations overall were between Fv/Fm and ϕPSII and between FSC and SSC (r = 0.92 and 0.85 respectively), which was expected given that the first two of these both measure photosynthetic efficiency and the second two both relate to cell size/shape. Fv/Fm and ϕPSII were also both strongly negatively correlated with both FSC and SSC (r between -0.83 and -0.75), suggesting lower photosynthetic efficiency in larger cells. Otherwise, the largest correlations were positive ones between ROS and FSC and SSC (r = 0.82 and 0.78 respectively) and negative ones between ROS and Fv/Fm and ϕPSII (r = -0.70 and -0.69 respectively), suggesting that the larger cells with compromised photosynthetic efficiency also had greater ROS.
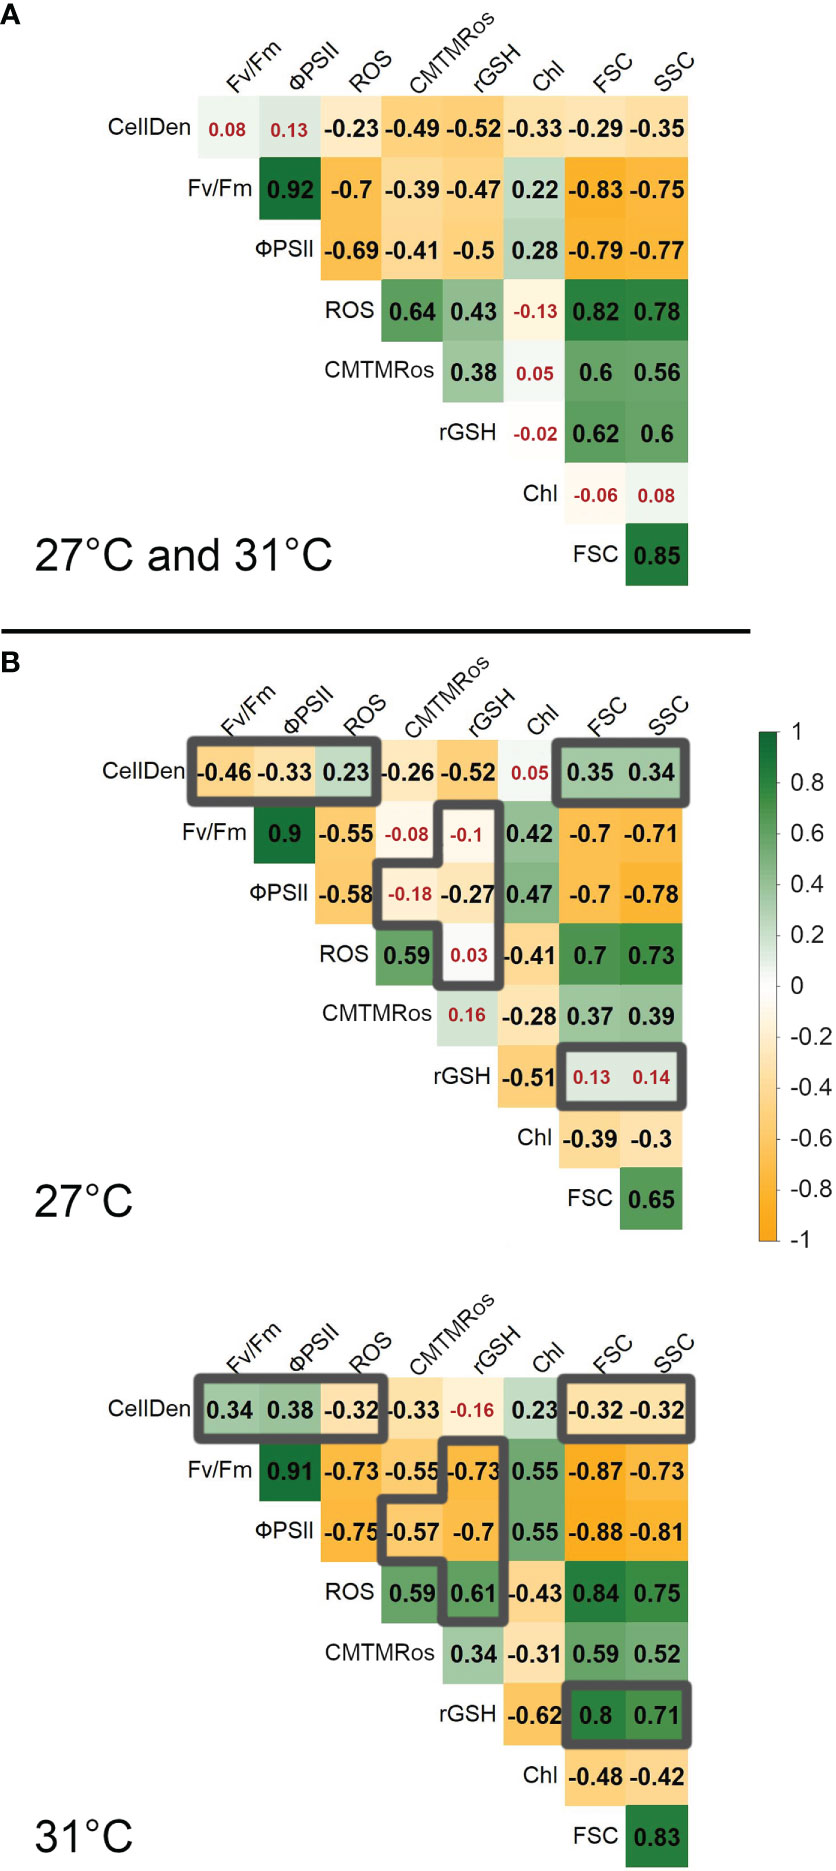
Figure 3 Pairwise Pearson correlation coefficients (r) between parameters. (A) shows the results for all data, combining 27°C and 31°C. (B) shows the results for each temperature separately. To highlight major differences between the two temperatures, grey borders are used to mark r values that differ between 27°C and 31°C by ≥0.5. In order to facilitate visualization of large vs small correlations in each panel, red numbers are used to indicate r values< 0.2. CellD, cell densities; Fv/Fm, maximum quantum efficiency; ϕPSII, PSII operating efficiency; ROS, reactive oxygen species measured with CellROX Orange; CMTMRos, mitochondrial activity measured using MitoTracker Orange; rGSH, reduced glutathione measured with VitaBright-48; Chl, pigment content of cells; FSC, forward scatter; SSC, side scatter.
While several other positive and negative correlations were statistically significant, they generally explained less than half the variation in the constituent variables (i.e., r2< 0.50), indicating that they provided considerable independent information.
Calculating the correlations separately for the two temperatures showed most of the correlations (31 out of 36) were larger in magnitude at 31°C (Figures 3B). This suggests closer links between the differences in most of the variables at the elevated temperature. The only major exception was the correlation between CellDen and rGSH (-0.52 at 27°C cf. -0.16 at 31°C). Considering also the magnitude, eleven of the correlations differed by more than 0.5 between the two data sets. In particular, at 31°C ROS was more strongly negatively correlated with Fv/Fm, ϕPSII and cell densities than at 27°C (r = -0.73, -0.75 and -0.32, cf -0.55, -0.58 and 0.32, respectively) and more positively correlated with rGSH (r = 0.61 cf 0.03, respectively), while rGSH was itself more negatively associated with Fv/Fm and ϕPSII (r = -0.73 and -0.70 cf -0.10 and -0.27 respectively). These differences are consistent with more severe effects of ROS at 31°C on photosynthetic output and cell health (as represented by cell densities) and an adaptive response in rGSH at that temperature to sequester ROS.
There were also much stronger positive associations of rGSH with FSC and SSC at 31°C than 27°C (r = 0.80 and 0.71 cf 0.13 and 0.14 respectively), suggesting that the larger cells at 31°C had higher content of rGSH than those at 27°C.
Other large differences between the 31°C and 27°C correlations included: reversals in the directions of the associations of CellDen with FSC and SSC (r = -0.32 and -0.32 cf 0.35 and 0.34 respectively) and CellDen with Fv/Fm and ϕPSII (r = 0.34 and 0.38 cf -0.46 and -0.33 respectively), and stronger negative associations of mitochondrial activity with Fv/Fm and ϕPSII (r = -0.55 and -0.57 cf -0.08 and -0.18). These differences suggest fundamental changes in the relationships between cell densities, cell size, photosynthetic efficiency and mitochondrial activity during the experiments at the two temperatures.
Finally, we computed the correlations among the measured parameters separately for both the two temperatures and the three strain types. The correlation matrices for the WT, SS- and SS+ strains at 27°C were very similar overall (Figure 4A). The largest differences were found in the correlations between CellDen and FSC (WT: 0.11, SS-: 0.54, and SS+: 0.25) and between mitochondrial activity and FSC (WT: 0.60, SS-: 0.11, and SS+: 0.34). Thus, at ambient temperature there were no strong differentiations between the three strain groups in the relationships between parameters. However, several large differences were evident between the matrices for the three types of strains at 31°C (Figures 4A–C). Most notably, for the WT and SS- strains, CellDen were involved in several significant positive and negative correlations with other variables, whereas, for the SS+ strains, CellDen were not correlated with any other variable at this temperature. Together with the progress curves for the different variables (Figure 2), these results show that the SS+ strains maintained relatively stable cell densities at 31°C over the course of the experiment, despite significant changes in other variables. In contrast, CellDen (and some other variables) in the WT and SS- strain groups at 31°C changed much more over time.
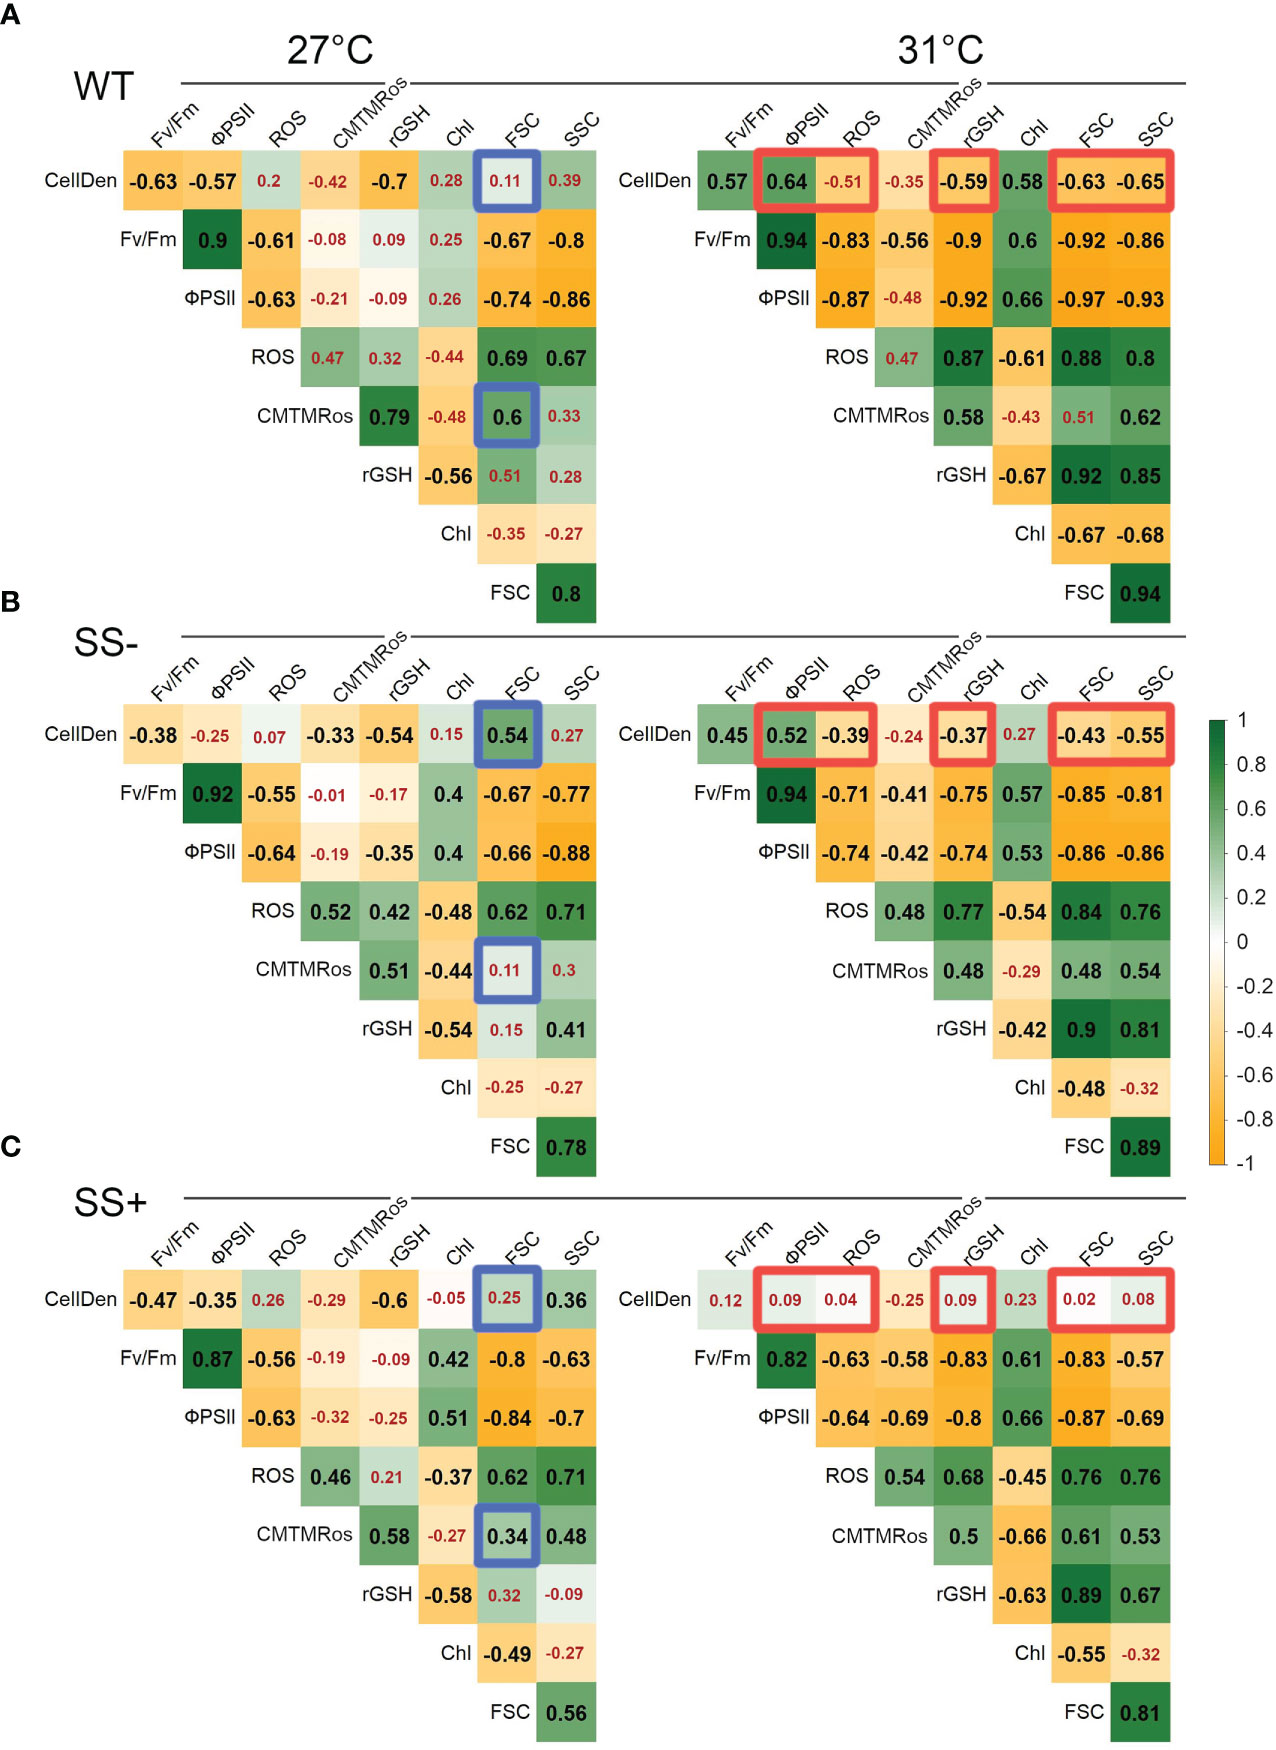
Figure 4 Pairwise Pearson correlation coefficients (r) between parameters for each strain type and temperature. (A) WT, (B) SS+ and (C) SS-. In order to facilitate visualization of large vs small correlations in each panel, red numbers are used to indicate non-significant correlations that were above p > 0.05. To highlight major differences between the two temperatures, blue and orange borders indicate r values that differ between strain types by ≥0.5 at 27°C and 31°C respectively. Variable abbreviations are as shown in Figure 2.
3.4 Multivariate analyses
In view of the complex interactions between many of the parameters that were exposed in the previous analyses, we then used multivariate methods to assess their cumulative effects. Specifically, we aimed to separate the strains with a linear discriminant analysis (LDA) and identify the minimum number of variables needed to distinguish strains with enhanced in hospite thermal tolerance. We dropped FSC and ϕPSII at the outset of these analyses because they had shown broadly similar behaviors to SSC and Fv/Fm respectively in the previous analyses. A principal component analysis (PCA) of the seven retained variables found that most (94.6%) of their variation was accounted for by five principal components (Figure S4, Table S2). These five components were then used as the input for the LDA.
As might be expected from the analyses above, LD1 and LD2 (explaining 66.1% and 23.3% of the between group variance respectively) distinguished the data for different times and temperatures respectively (Figure S5, Table S3). However, the three strain types were also separated, with all three distinguished at 27°C and SS+ distinguished from the other two at 31°C. In particular, the SS+ strains also changed less over time (i.e., showed a shorter Day 4 to Day 28 distance) at the higher temperature than did the other strains. There was also less variation among the three constituent SS+ strains (i.e., less dispersion around the centroids) than among the three SS- strains (Figure S5).
We next carried out separate LDAs on the data for each Day and with two subsets of the seven variables in order to compare the abilities of the seven variables to separate the strain groups from each other. We found that LDAs using the five flow cytometer measurements achieved similar levels of resolution as ones using all seven (Figures 5A, B). Interestingly also, the distinction between the three strain groups at 31°C was greater in the later Days, whereas at 27°C it was greater in the earlier Days. Under these two conditions (i.e., later Days at 31°C and earlier Days at 27°C), the SS+ and WT groups were clearly distinct from one another in LD1/LD2 space, with the SS- group intermediate between the other two.
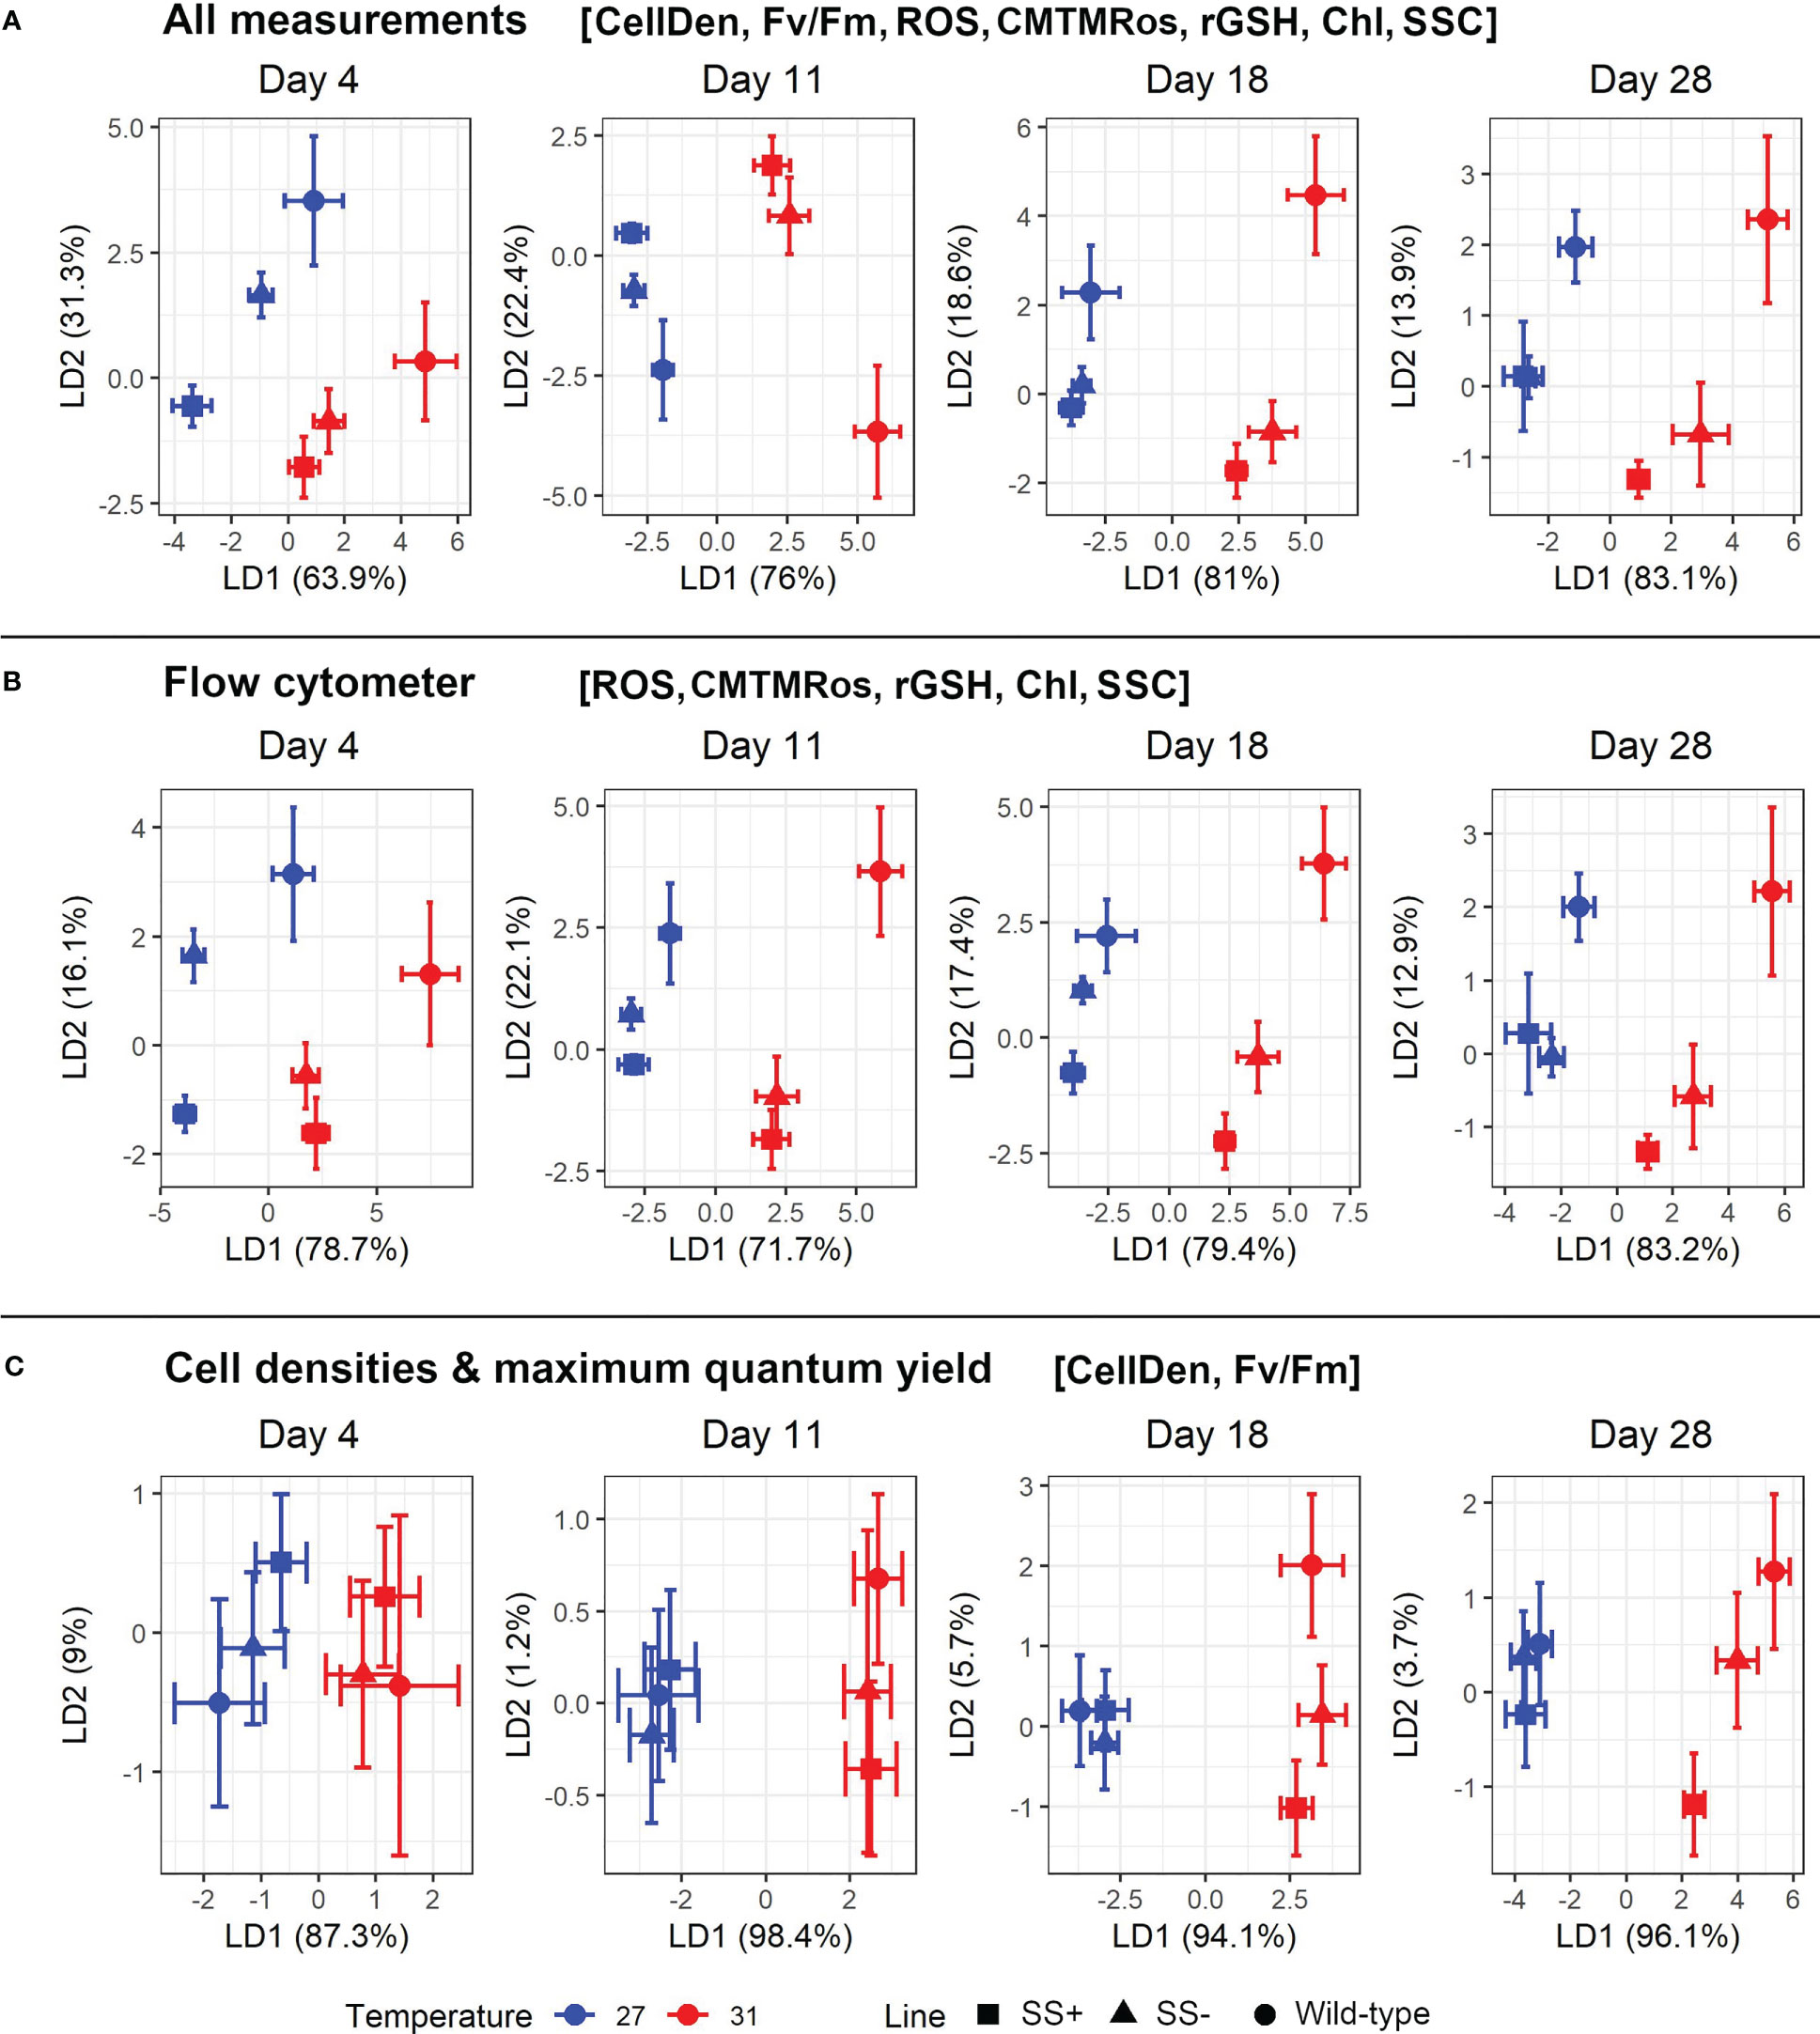
Figure 5 Plot of the two major linear discriminant functions for each strain type and temperature using various combinations of variables. (A) uses all seven retained variables (i.e., excluding ϕPSII and FSC), (B) just uses the five retained cytometry-based variables (i.e., ROS), CMTMRos, rGSH, Chl and SSC) and (C) just uses the two non-flow cytometry variables retained (i.e., CellDen and Fv/Fm). Mean values with their 95% confidence limits are given for the strain group (WT, SS+, SS-).
The LDAs only using the two non-flow cytometer variables retained, CellDen and Fv/Fm, showed broadly similar trends, including clearer discrimination between the strain groups in later Days at 31°C and earlier ones at 27°C, but overall, the resolution was somewhat less (Figure 5C).
The patterns in the LDAs thus showed that most of the variables contributed to some degree to the differentiation between strains. However, given the prominence of ROS, mitochondrial activity and rGSH in previous literature on heat tolerance, and the importance of ROS and mitochondrial activity revealed in our analyses, we also examined all the pairwise plots of those three variables alone. We found that most of the six pairwise plots for the two earlier Days at 27°C were able to distinguish the three types of strains, with no overlap between SS+ and WT and SS- again intermediate between them, albeit with some overlap with WT (Figures 6, S5).
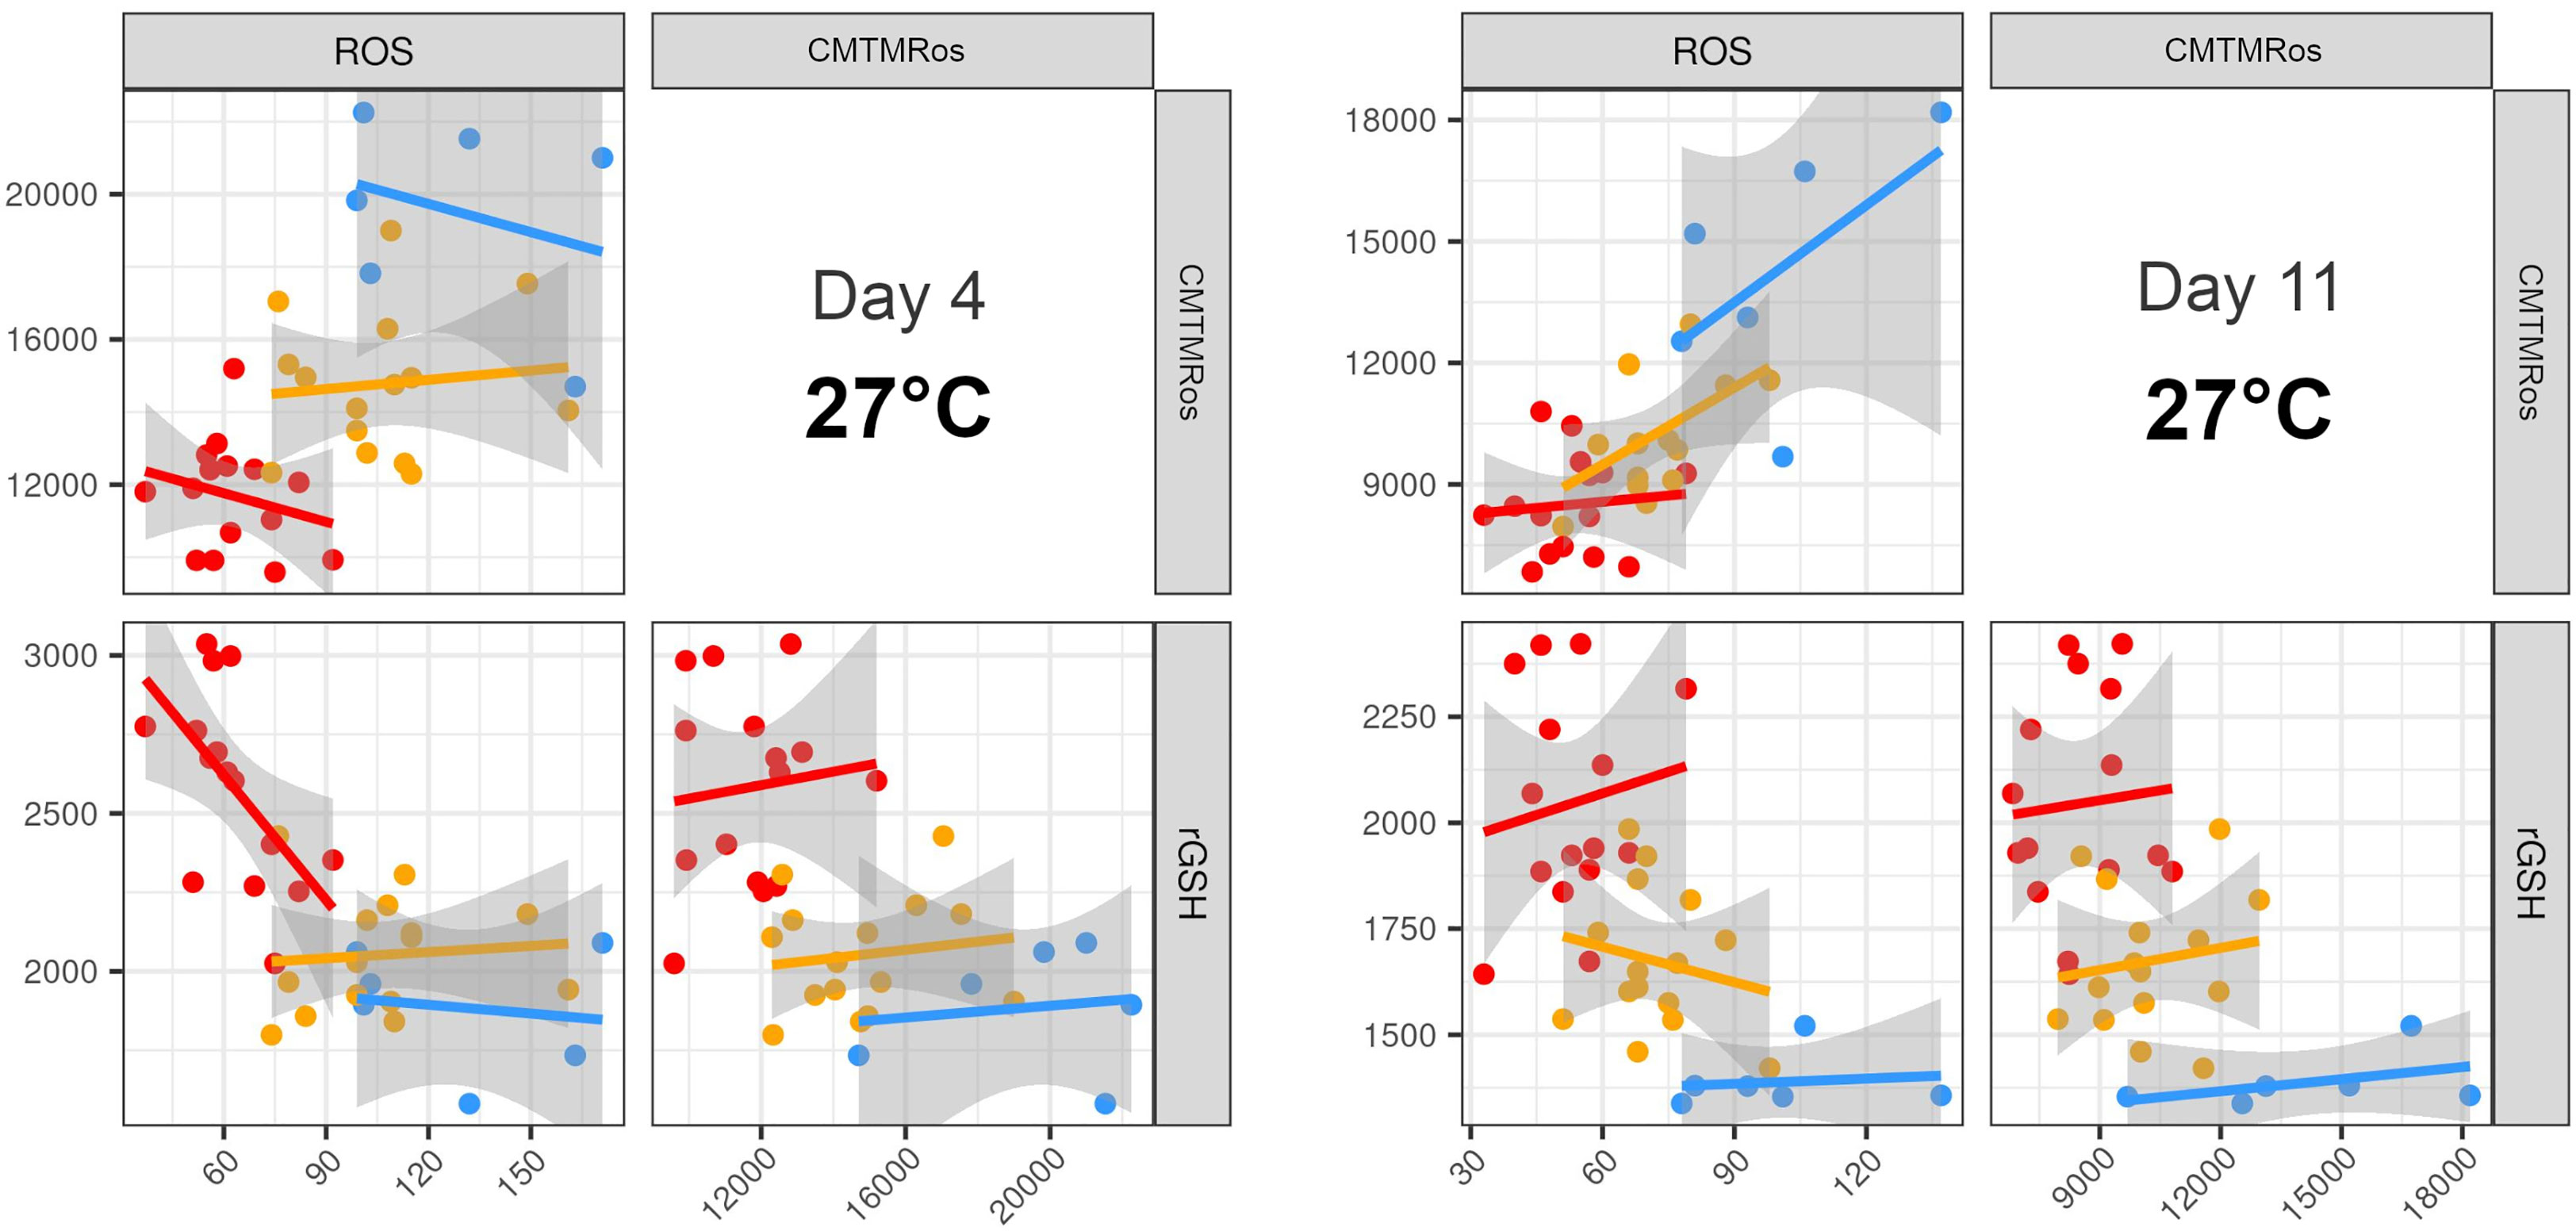
Figure 6 Pairwise plots of the three variables that most clearly separate the three strain types. The best resolution was achieved with a combination of ROS, mitochondria activity and rGSH at ambient temperature at Days 4 and 11. WT (blue), SS- (yellow), SS+ (red). Each point on each plot represents a different replicate of the respective strains. Equivalent plots for Days 18 and 28 at each temperature are shown in Figure S6.
4 Discussion
4.1 Methodological caveats
We have been able to use fluorescence markers and flow cytometry to identify in vitro physiological differences between our heat selected and control strains and, within the former, between those conferring heat tolerance in hospite and those not. Our results for the stain-based parameters were not calibrated against direct measures of the underlying biochemistries and we also lacked the specificity and proportionality validations for some of the parameters usually carried out with earlier methodologies. Nevertheless, where comparisons are possible, the directions of effects we have found broadly agree with predictions based on previous literature (see also below). We therefore suggest that our findings are valid representations of the relativities of each parameter among strains, temperatures and time-points, and their various interactions, whilst also recognizing the additional value in calibrating our methodology against absolute quantifications of the underlying biochemistries in future studies.
One additional caveat on the interpretation of our results concerns the time course of the experiment. We found the values for our stain parameters dropped initially in all three strain types and then rose again, while those for some other parameters (such as cell densities and photosynthetic activity) dropped markedly in all strains in the last sampling interval. We do not know the cause of the initial declines but those in the last time interval suggest the cells were becoming stressed by Day 28. The change in the last interval may be associated with the life cycle of the culture changing from exponential to stationary phase, perhaps reflecting nutrient depletion in the media. While no data on nutrient levels were available for the current experiment, it would be useful to measure them in future experiments, or to conduct those experiments under conditions of continuous nutrient supply.
A third caveat on our methods concerns the relatively long dark adaptation times (~six hours) we used ahead of our measurement of maximum quantum yield. Variable dark adaptation times are common in the literature, but they are generally under two hours (Bhagooli et al., 2021). We do not know how this difference would have affected our results.
Notwithstanding these caveats, consistent differences between strains and temperatures were still observed under our treatment conditions, with SS+ strains always showing lower values for ROS and mitochondrial activity and higher values for rGSH compared to WT. Overall, the SS- strains were generally intermediate for all three of these variables but moved closer to SS+ for ROS and mitochondrial activity over time.
4.2 Differences between SS and WT strains
The six heat-evolved Cladocopium C1acro SS strains we have studied had been exposed to 31°C for nine years before this work. Our preliminary biochemical analyses after six years of exposure (Buerger et al., 2020) showed that they out-performed the WT in terms of their cell growth, photosynthetic performance and ROS secretion at 31°C. Those earlier results are supported and extended by the progress curves of the current experiment. The current results show that the adaptation of the SS strains to the elevated temperature is associated with a variety of physiological changes, some of them manifest at both ambient and elevated temperatures and some only in the latter.
Compared to WT, the SS strains had lower values for intracellular ROS and mitochondrial activity as well as higher rGSH at both temperatures (except for rGSH at 31°C) at the start of the experiment and throughout its the duration. This suggests some of the adaptation of the SS strains to the elevated temperature was based on constitutively expressed differences in genes affecting oxidant/antioxidant pathways. This idea is also borne out by our previous findings that the SS strains showed both higher constitutive expression of heat tolerance genes at ambient temperatures and lower extracellular ROS at elevated temperatures (measured with CellROX Orange in Buerger et al., 2020).
Thus, we have shown that cellular processes affecting ROS, mitochondrial activity and rGSH levels are good candidates to be causally involved in the difference between the SS and WT strain groups and hence in the thermal tolerance of the microalgae themselves. The expression of ROS was heavily dependent on time and temperature, while the mitochondrial activity and rGSH were less dependent on those other factors. ROS can be produced in both the chloroplasts and mitochondria (Szabó et al., 2020) and the pool of available thiols (rGSH is a common ROS quenching mechanism in eukaryotes; Brandes et al., 2009). It has been shown that when ROS accumulates in a heat stressed cell, it can overwhelm the antioxidant systems, damage photosystems and reduce photosynthetic activity (Sharma et al., 2020), as well as disrupt mitochondrial functionality (Liberatore et al., 2016). Hence, several of the correlations between variables at 31°C were as might be expected. These included 1) a negative correlation between ROS and photosynthetic activities during heat stress due to the damage that oxidative radicals can cause to the photosystem, 2) a positive correlation between ROS and available thiols to quench oxidative radicals during heat stress, and 3) some correlation between the mitochondrial membrane potential and the level of oxidative stress. Given the absence of heat stress at 27°C, our findings of low/negligible values for the corresponding correlations at that temperature were also in line with expectations (Figures 3B, C).
MitoTracker Orange fluorescence has been shown to selectively stain mitochondria in microalgae such as Chlamydomonas (Salinas et al., 2012) and Chromera (Sharaf et al., 2019). Since the dye is positively charged, it is commonly referred to as a marker of mitochondrial membrane potential (Johnson & Spence, 2010), but research has shown that fluctuations in its fluorescence can also be linked to changes in the thiol groups of the mitochondria (Scorrano et al., 1999). We have not tested what specific effects it represents in our study but, assuming that the dye is a reflection of ΔΨm, the lower ΔΨm values and higher rGSH levels for the heat-evolved compared to the other strains, could be interpreted as adaptations which decrease their ROS production and enhance their ROS scavenging potential, respectively (Grene, 2002; Demine et al., 2019). However, as a consequence the cell would probably have to decouple its mitochondrial membrane potential and, as a result, show reduced ATP production from the mitochondria (Demine et al., 2019). This could further lead to slower growth rates in the absence of compensating production elsewhere (Larosa and Remacle, 2018). We saw no evidence of slower growth rates in the current study, but did see evidence for such a growth trade-off at ambient temperature in another experiment (Buerger et al., 2022).
Also of note is that MitoTracker Orange fluorescence actually increased in later Days in all strains at both temperatures, but particularly in WT at 31°C. This increase may reflect some level of hyperpolarization of the mitochondrial membranes and greater production of ATP, which can be an early sign of severe cellular stress (Weir et al., 2003) and would be consistent with the drop in cell densities observed, particularly for the WT in later Days at 31°C. However, the increase in fluorescence of MitoTracker Orange could also be related to the number of thiols present in the mitochondria instead of actual changes in the mitochondrial potential (Scorrano et al., 1999). MitoTracker Orange is mildly reactive to thiols due to its chloromethyl functional group and, in some cases, its fluorescence has been shown to increase independently of changes in the mitochondrial membrane potential (Scorrano et al., 1999). In any case, the oxidative state of mitochondrial can significantly influence the redox state of a cell, even if the mitochondria only produce a small amount of total reactive oxygen species (ROS) within the cell. This is due in part to the impact on associated signaling molecules but is also influenced by the lower ROS detoxification capability of mitochondria in comparison to other organelles such as the chloroplasts and peroxisomes (Foyer and Noctor, 2003). This highlights the complexity of the cellular redox state and underscores the complex role that mitochondria play in a cell’s redox state.
Other variables related to photosynthetic efficiency, namely cell density, size and morphology also differed between SS and WT strains. But these differences were generally more evident at 31°C than 27°C or at later rather than earlier sampling times. We speculate that these temperature and time dependent changes may reflect genetic adaptations that are induced by high temperature stress or may be secondary, consequential processes rather than primary, causal ones. Further investigation is necessary to determine the underlying mechanisms and causal relationships. In either event, the correlations among those variables and with ROS, mitochondrial activity and rGSH rarely explained more than half of their respective variances, so at least some of their differences reflect effects that were independent of each other and the oxidant/antioxidant differences.
Notably, comparative transcriptomics of three of the SS strains and the WT strain in holobionts with the coral Acropora tenuis at ambient temperatures had previously shown differences in the expression of genes involved in photosynthesis and measured photosynthetic yields between the two sorts of strains (Buerger et al., 2020). Notwithstanding the profound differences between in vitro and in hospite conditions, the two studies thus concur in finding differences between the SS and WT strains related to photosynthesis. To gain a more comprehensive understanding of the molecular mechanisms underlying the observed differences between microalgae strains, future studies should focus on integrating flow cytometry assays with different omics analyses.
Our findings for FSC indicating that the adaptations of the SS strains to the elevated temperature included relatively smaller cell sizes than WT also corroborates some earlier literature. Thus exposure to elevated temperatures over several years has been found to result in smaller cell sizes for other microalgae, including Emiliania huxleyi, Chrysochromulina rotalis and Prymnesium polylepis, as well (Skau et al., 2017). However, other literature suggests it may not be a specific adaptation to heat stress; decreases in cell sizes have also been reported as adaptations to fluctuating high pCO2 stress that evolve over time in the green microalga Ostreococcus (Schaum et al., 2016). Evolution towards smaller cell sizes still may help the microalgae counteract a swelling effect of the stress on individual cells; such an effect has been reported for other Symbiodiniaceae strains exposed to 32°C (Fujise et al., 2018) and was evident in the progress curves for FSC values in all our strains, but particularly WT, over the 28 Day course of the experiment.
4.3 Differences between SS+ and SS- strains
Importantly, our progress curves also showed differences in many of the variables between the SS+ and SS- strain groups, even though neither group had been exposed to elevated temperature in holobionts as opposed to ex hospite microalgae in culture since their establishment. In particular, ROS, CellDen, Fv/Fm and SSC all showed clear differences between SS+ and both SS- and WT in the later time-points at the higher temperature. Further, the performance of the SS- strains was in many cases intermediate between those of the SS+ and WT strains and the directions of the differences generally suggested that the SS+ strains experienced the least, WT the most, and SS- intermediate levels of stress at 31°C. These results imply that some of the same processes, particularly the oxidant/antioxidant and photosynthesis-related processes, operate to confer tolerance from microalgae to coral hosts in holobionts and ex hospite for microalgae in culture. Further, they suggest that more extreme changes from WT are needed to confer tolerance on the holobionts than from the heat-evolved microalgae.
Supporting the progress curves, the SS+ strains were also distinguished from the others in the temperature-dependent patterns of pairwise correlations among many of the variables. The most striking example involved cell densities, which showed little correlation with any other variable in SS+ at 31°C but were strongly correlated with most other variables in the other strain group-temperature combinations.
The key role of constitutively expressed differences in oxidant/antioxidant-related variables in distinguishing SS+ from the other strain types is shown by the fact that they could be separated using ROS, mitochondrial activity and rGSH data for 27°C alone. As noted, the differences in ROS measured here were in intracellular ROS, whereas our previous work (Buerger et al., 2020) did not find a difference between the two groups of heat selected strains in leaked, extracellular ROS. The extracellular ROS assay (which added the CellROX Orange to the culture medium after the Symbiodiniaceae cells had been removed by centrifugation, see Supplementary Materials; Levin et al., 2016; Chakravarti et al., 2017; Buerger et al., 2022) was only sensitive enough to detect a difference between the heat-evolved strains and wild-type strains. Extracellular ROS species such as hydrogen peroxide (H2O2) with longer lifetimes (Szabó et al., 2020) and singlet oxygen (1O2) sensitizing metabolites (Rehman et al., 2016) could trigger holobiont bleaching through effects on the coral host, whereas intracellular ROS species with shorter lifetimes might do so through intracellular effects on the microalgae (Rehman et al., 2016). However, insomuch as intracellular ROS could represent the pool from which leaked ROS is obtained, the intracellular ROS might also impact holobiont tolerance through effects on the host (Weis, 2008). Based on the relatively low levels of secreted ROS in all heat-evolved strains (Buerger et al., 2020), we suggest that their cell integrity was maintained during exposure to elevated temperatures. This suggestion could be tested in future experiments with cell envelope integrity probes. However, compared to SS-, SS+ strains must have additional strategies to also avoid intracellular ROS production with shorter lifetimes or the secretion of singlet oxygen sensing metabolites (Rehman et al., 2016) to account for their increased thermal tolerance in holobionts.
The fact that the dye-based flow cytometry assays for ROS, mitochondrial activity and rGSH at 27°C could distinguish SS+ strains from the others we tested could also be significant from a practical point of view. In particular, they suggest that in vitro data sets similar to ours could be used to train a supervised machine learning algorithm to predict the in vivo thermal tolerance of relatively large numbers of otherwise uncharacterised strains. Depending on the data, logistic regression, linear discriminant analysis (LDA), or partial least squares discriminant analysis (PLS-DA) could be used. The current data does not have enough replication to produce a reliable prediction model but a larger training set, perhaps of the order of 20 strains, could be sufficient to enable relatively rapid and mechanistically informative screens for a much larger number of unknown strains, the most promising of which could then be validated by in vivo testing in various holobionts. Validated strains could then be utilized for reef restoration purposes.
5 Conclusions
Our flow cytometry methodology has enabled us to differentiate between microalgal strains with distinct in vitro and in hospite heat tolerance profiles. Such a capability has not previously been available and opens up the possibility of large scale in vitro screening for candidate Symbiodiniaceae strains that confer their thermal tolerance phenotypes into a symbiosis with coral. Additionally, our methodology provides mechanistic information which could provide further guidance to future selection and breeding programs aimed at developing superior strains for deployment in various reef restoration contexts.
Specifically we found our heat-evolved Cladocopium strains differ from a control wild-type strain derived from the same mother culture in several aspects of oxidant/antioxidant levels, photosynthesis and cell size. The patterns of change suggest multiple physiological differences might have been involved, some constitutively expressed and some only evident at elevated temperatures. The more extreme phenotypes for some of these properties were also associated with higher temperature tolerance in hospite. In particular, expression of relatively low levels of intracellular ROS, mitochondrial activity and high levels of rGSH in ex hospite cultures at ambient temperature were found to be sufficient alone to distinguish the known heat-evolved strains that confer tolerance to the coral host from the others tested.
A key priority from here will be to test whether the differences we have found using flow cytometry are generalizable across more Cladocopium strains (and possibly also other Symbiodiniaceae species) and thermal tolerance phenotypes in vitro and in hospite. Where generalizable patterns are found, it should then be possible to develop and deploy sophisticated training data sets and machine learning algorithms in relatively high throughput screens for strains suited for reef restoration purposes.
Data availability statement
The original contributions presented in the study are included in the article/Supplementary Material. Further inquiries can be directed to the corresponding authors.
Author contributions
Conceptualization: MB, LC, PB, JO, MO, OE. Data curation: HY, PB, LC, MB. Formal analysis: HY, PB, LC, JO, MB. Funding acquisition: LC, OE, JO, MB, PB, MO. Investigation: LC, PB, MB. Methodology: MB, LC, PB, JO. Project administration: LC, JO, OE. Resources: LC, PB, MB. MO, OE. Supervision: LC, JO. Validation: LC, PB, MB, HY, JO. Visualization: HY, PB, LC, JO, MB. Writing – review & editing: PB, JO, LC, HY, MB, MO, OE. All authors contributed to the article and approved the submitted version.
Funding
The authors acknowledge the following funding sources: internal funding from CSIRO Land & Water to L.C. and J.G.O.; CSIRO Synthetic Biology Future Science Platform funding to MB; CSIRO Research Office OCE Postdoctoral Fellowship to P.B.; Australian Research Council Laureate FL180100036 to M.J.H.v.O.
Acknowledgments
The authors have no conflict of interest and no financial interest to declare. We thank Dr Laila Abudulai from Life Sciences Solutions for discussions and advice regarding the experimental design and interpretation of the flow cytometry assays. We also thank Dr Melanie Carmody and Prof Barry Pogson from the Australian National University for providing the imaging pulse-amplitude modulation chlorophyll fluorometer for the photosynthetic measurements.
Conflict of interest
The authors declare that the research was conducted in the absence of any commercial or financial relationships that could be construed as a potential conflict of interest.
Publisher’s note
All claims expressed in this article are solely those of the authors and do not necessarily represent those of their affiliated organizations, or those of the publisher, the editors and the reviewers. Any product that may be evaluated in this article, or claim that may be made by its manufacturer, is not guaranteed or endorsed by the publisher.
Supplementary material
The Supplementary Material for this article can be found online at: https://www.frontiersin.org/articles/10.3389/fmars.2023.1094792/full#supplementary-material
References
Anthony K., Bay L. K., Costanza R., Firn J., Gunn J., Harrison P., et al. (2017). New interventions are needed to save coral reefs. Nat. Ecol. Evol. 1, 1420–1422. doi: 10.1038/s41559-017-0313-5
Bay L., Rocker M., Boström-Einarsson L., Babcock R., Buerger P., Cleves P., et al. (2019). T3: intervention technical summary. Australian Institute of Marine Science (AIMS).
Bhagooli R., Mattan-Moorgawa S., Kaullysing D., Louis Y. D., Gopeechund A., Ramah S., et al. (2021). Chlorophyll fluorescence – a tool to assess photosynthetic performance and stress photophysiology in symbiotic marine invertebrates and seaplants. Mar. Pollut. Bull. 165, e0135725. doi: 10.1016/j.marpolbul.2021.112059
Brandes N., Schmitt S., Jakob U. (2009). Thiol-based redox switches in eukaryotic proteins. Antioxidants Redox Signal. 11, 997–1014. doi: 10.1089/ars.2008.2285
Buerger P., Alvarez-Roa C., Coppin C. W., Pearce S. L., Chakravarti L. J., Oakeshott J. G., et al. (2020). Heat-evolved microalgal symbionts increase coral bleaching tolerance. Sci. Adv. 6 (20), eaba2498. doi: 10.1126/sciadv.aba2498
Buerger P., Vanstone R., Maire J., van Oppen M. J. (2022). Long-term heat selection of the coral endosymbiont cladocopium C1 acro (Symbiodiniaceae) stabilizes associated bacterial communities. Int. J. Mol. Sci. 23 (9), 4913. doi: 10.3390/ijms23094913
Chakravarti L. J., Beltran V. H., van Oppen M. J. H. (2017). Rapid thermal adaptation in photosymbionts of reef-building corals. Glob. Change Biol. 275, 2214–2273. doi: 10.1111/gcb.13702
Chakravarti L. J., van Oppen M. J. H. (2018). Experimental evolution in coral photosymbionts as a tool to increase thermal tolerance. Front. Mar. Sci. 5. doi: 10.3389/fmars.2018.00227
Cheung M. W. M., Hock K., Skirving W., Mumby P. J. (2021). Cumulative bleaching undermines systemic resilience of the great barrier reef. Curr. Biol. 31, 5385–5392.e4. doi: 10.1016/j.cub.2021.09.078
Cram L. S. (2002). Flow cytometry, an overview. Methods Cell Sci. 24, 1–9. doi: 10.1023/A:1024198904819
da Silva T. L., Reis A. (2020). Applications of flow cytometry in marine biotechnology. Encycl. Mar. Biotechnol. 3109–3118. doi: 10.1002/9781119143802.ch138
Delamare-deboutteville J., Dove S., Rosic N. (2020). Heat stress in symbiotic dinoflagellates : signalling towards life or death? 1–18. doi: 10.22541/au.158896259.96523538
Demine S., Renard P., Arnould T. (2019). Mitochondrial uncoupling: a key controller of biological processes in physiology and diseases. Cells 8, 795. doi: 10.3390/cells8080795
Dourmap C., Roque S., Morin A., Caubrière D., Kerdiles M., Béguin K., et al. (2020). Stress signalling dynamics of the mitochondrial electron transport chain and oxidative phosphorylation system in higher plants. Ann. Bot. 125, 721–736. doi: 10.1093/aob/mcz184
Downs C. A., Fauth J. E., Halas J. C., Dustan P., Bemiss J., Woodley C. M. (2002). Oxidative stress and seasonl coral bleaching. Free Radic. Biol. Med. 33, 533–543. doi: 10.1016/S0891-5849(02)00907-3
Foyer C. H., Noctor G. (2003). Redox sensing and signalling associated with reactive oxygen in chloroplasts, peroxisomes and mitochondria. Physiol. Plant 119, 355–364. doi: 10.1034/j.1399-3054.2003.00223.x
Fujise L., Nitschke M. R., Frommlet J. C., Serôdio J., Woodcock S., Ralph P. J., et al. (2018). Cell cycle dynamics of cultured coral endosymbiotic microalgae (Symbiodinium) across different types (species) under alternate light and temperature conditions. J. Eukaryot. Microbiol. 65, 505–517. doi: 10.1111/jeu.12497
Givan A. L. (2011). Flow cytometry protocols. flow cytom. protoc. Methods Mol. Biol. 699. doi: 10.1007/978-1-61737-950-5
Glynn P. W. (1996). Coral reef bleaching: facts, hypothesis, and implications. Glob. Change Biol. 2, 495–509. doi: 10.1111/j.1365-2486.1996.tb00063.x
Grene R. (2002). Oxidative stress and acclimation mechanisms in plants. Arab. B. 1, e0036. doi: 10.1199/tab.0036.1
Hasanuzzaman M., Bhuyan M. H. M. B., Zulfiqar F., Raza A., Mohsin S. M., Al Mahmud J., et al. (2020). Reactive oxygen species and antioxidant defense in plants under abiotic stress: revisiting the crucial role of a universal defense regulator. Antioxidants 9, 1–52. doi: 10.3390/antiox9080681
Hastie T., Tibshirani R., Friedman J. (2009). “The elements of statistical learning,” in Data mining, inference, and prediction, 2nd ed. (Springer: New York, NY, USA).
Hoegh-Guldberg O. (1999). Climate change, coral bleaching and the future of the world’s coral reefs. Mar. Freshw. Res. 50, 839–866. doi: 10.1071/MF99078
Hughes T. P., Anderson K. D., Connolly S. R., Heron S. F., Kerry J. T., Lough J. M., et al. (2018). Spatial and temporal patterns of mass bleaching of corals in the anthropocene. Science 80)5, 80–83. doi: 10.1126/science.aan8048
Hughes T. P., Kerry J. T., Álvarez-Noriega M., Álvarez-Romero J. G., Anderson K. D., Baird A. H., et al. (2017). Global warming and recurrent mass bleaching of corals. Nature 543, 373–377. doi: 10.1038/nature21707
Hughes T. P., Kerry J. T., Connolly S. R., Álvarez-Romero J. G., Eakin C. M., Heron S. F., et al. (2021). Emergent properties in the responses of tropical corals to recurrent climate extremes. Curr. Biol. 31, 5393–5399.e3. doi: 10.1016/j.cub.2021.10.046
Hyka P., Lickova S., Přibyl P., Melzoch K., Kovar K. (2013). Flow cytometry for the development of biotechnological processes with microalgae. Biotechnol. Adv. 31, 2–16. doi: 10.1016/j.biotechadv.2012.04.007
Jakovljević D., Stanković M. (2020). Adaptive strategies of plants under adverse environment: mitigating effects of antioxidant system. Plant Ecophysiol. Adapt. under Clim. Change Mech. Perspect. II Mech. Adapt. Stress Amelior. 163–186. doi: 10.1007/978-981-15-2172-0_8
Johnson & Spence (2010). Molecular probes handbook, a guide to fluorescent probes and labeling technologies, 11th Edition. Life Technologies.
Krediet C. J., DeNofrio J. C., Caruso C., Burriesci M. S., Cella K., Pringle J. R. (2015). Rapid, precise, and accurate counts of symbiodinium cells using the guava flow cytometer, and a comparison to other methods. PloS One 10 (8), e0135725. doi: 10.1371/journal.pone.0135725
Larosa V., Remacle C. (2018). Insights into the respiratory chain and oxidative stress. Biosci. Rep. 38, BSR20171492. doi: 10.1042/BSR20171492
Lee C. S., Wilson Yeo Y. S., Sin T. M. (2012). Bleaching response of symbiodinium (zooxanthellae): determination by flow cytometry. Cytom. Part A 81 A, 888–895. doi: 10.1002/cyto.a.22111
Lesser M. P. (1996). Elevated temperatures and ultraviolet radiation cause oxidative stress and inhibit photosynthesis in symbiotic dinoflagellates. Limnol. Oceanogr. 41, 271–283. doi: 10.4319/lo.1996.41.2.0271
Lesser M. P. (2006). Oxidative stress in marine environments: biochemistry and physiological ecology. Annu. Rev. Physiol. 68, 253–278. doi: 10.1146/annurev.physiol.68.040104.110001
Levin R. A., Beltran V. H., Hill R., Kjelleberg S., McDougald D., Steinberg P. D., et al. (2016). Sex, scavengers, and chaperones: transcriptome secrets of divergent symbiodinium thermal tolerances. Mol. Biol. Evol. 33, 2201–2215. doi: 10.1093/molbev/msw119
Liberatore K. L., Dukowic-Schulze S., Miller M. E., Chen C., Kianian S. F. (2016). The role of mitochondria in plant development and stress tolerance. Free Radic. Biol. Med. 100, 238–256. doi: 10.1016/j.freeradbiomed.2016.03.033
Lugli E., Roederer M., Cossarizza A. (2010). Data analysis in flow cytometry: the future just started. Cytom. Part A 77, 705–713. doi: 10.1002/cyto.a.20901
Mallick N., Mohn F. H. (2000). Reactive oxygen species: response of algal cells. J. Plant Physiol. 157, 183–193. doi: 10.1016/S0176-1617(00)80189-3
Maruyama S., Mandelare-Ruiz P. E., McCauley M., Peng W., Cho B. G., Wang J., et al. (2022). Heat stress of algal partner hinders colonization success and alters the algal cell surface glycome in a cnidarian-algal symbiosis. Microbiol. Spectr. 10, e01567–22. doi: 10.1128/spectrum.01567-22
McIlroy S. E., Gillette P., Cunning R., Klueter A., Capo T., Baker A. C., et al. (2016). The effects of symbiodinium (Pyrrhophyta) identity on growth, survivorship, and thermal tolerance of newly settled coral recruits. J. Phycol. 52, 1114–1124. doi: 10.1111/jpy.12471
Murchie E. H., Lawson T. (2013). Chlorophyll fluorescence analysis: a guide to good practice and understanding some new applications. J. Exp. Bot. 64, 3983–3998. doi: 10.1093/jxb/ert208
Nielsen D. A., Petrou K., Gates R. D. (2018). Coral bleaching from a single cell perspective. ISME J. 12 (6), 1558–1567. doi: 10.1038/s41396-018-0080-6
Noctor G., Gomez L., Vanacker H., Foyer C. H. (2002). Interactions between biosynthesis, compartmentation and transport in the control of glutathione homeostasis and signalling. J. Exp. Bot. 53, 1283–1304. doi: 10.1093/jexbot/53.372.1283
Oakley C. A., Davy S. K. (2018). Cell Biology of Coral Bleaching. In Coral Bleaching (pp. 189–211). Cham: Springer International Publishing. doi: 10.1007/978-3-319-75393-5_8
Owen J. B., Butterfiel D. A. (2010). Measurement of oxidized/reduced glutathione ratio. Methods Mol. Biol. 648, 269–277. doi: 10.1007/978-1-60761-756-3_18
Pereira H., Schulze P. S. C., Schüler L. M., Santos T., Barreira L., Varela J. (2018). Fluorescence activated cell-sorting principles and applications in microalgal biotechnology. Algal Res. 30, 113–120. doi: 10.1016/j.algal.2017.12.013
Quigley K. M., van Oppen M. J. H. (2022). Predictive models for the selection of thermally tolerant corals based on offspring survival. Nat. Commun. 13, 1543. doi: 10.1038/s41467-022-28956-8
Rehman A. U., Szabó M., Deák Z., Sass L., Larkum A., Ralph P., et al. (2016). Symbiodinium Sp. cells produce light-induced intra- and extracellular singlet oxygen, which mediates photodamage of the photosynthetic apparatus and has the potential to interact with the animal host in coral symbiosis. New Phytol. 212, 472–484. doi: 10.1111/nph.14056
Roberty S., Plumier J. C. (2022). Bleaching physiology: who’s the “weakest link” - host vs. symbiont? Emerg. Top. Life Sci. 6, 17–32. doi: 10.1042/ETLS20210228
Salinas T., Duby F., Larosa V., Coosemans N., Bonnefoy N., Motte P., et al. (2012). Co-Evolution of mitochondrial tRNA import and codon usage determines translational efficiency in the green alga chlamydomonas. PloS Genet. 8. doi: 10.1371/journal.pgen.1002946
Schaum C. E., Rost B., Collins S. (2016). Environmental stability affects phenotypic evolution in a globally distributed marine picoplankton. ISME J. 10, 75–84. doi: 10.1038/ismej.2015.102
Scorrano L., Petronilli V., Colonna R., Di Lisa F., Bernardi P. (1999). Chloromethyltetramethylrosamine (Mitotracker orange™) induces the mitochondrial permeability transition and inhibits respiratory complex I. J. Biol. Chem. 274, 24657–24663. doi: 10.1074/jbc.274.35.24657
Sharaf A., Füssy Z., Tomčala A., Richtová J., Oborník M. (2019). Isolation of plastids and mitochondria from Chromera velia. Planta 250, 1731–1741. doi: 10.1007/s00425-019-03259-3
Sharma A., Kumar V., Shahzad B., Ramakrishnan M., Singh Sidhu G. P., Bali A. S., et al. (2020). Photosynthetic response of plants under different abiotic stresses: a review. J. Plant Growth Regul. 39, 509–531. doi: 10.1007/s00344-019-10018-x
Skau L. F., Andersen T., Thrane J. E., Hessen D. O. (2017). Growth, stoichiometry and cell size; temperature and nutrient responses in haptophytes. PeerJ 9, 1–18. doi: 10.7717/peerj.3743
Skindersoe M. E., Rohde M., Kjaerulff S. (2012). A novel and rapid apoptosis assay based on thiol redox status. Cytom. Part A 81 A, 430–436. doi: 10.1002/cyto.a.22032
Skindersoe & Kjaerulff (2013). Comparison of three thiol probes for determination of apoptosis-related changes in cellular redox status. Cytom Part A. 85, 179–187. doi: 10.1002/cyto.a.22410
Suggett D. J., Warner M. E., Leggat W. (2017). Symbiotic dinoflagellate functional diversity mediates coral survival under ecological crisis. Trends Ecol. Evol. 32, 735–745. doi: 10.1016/j.tree.2017.07.013
Szabó M., Larkum A., Vass I. (2020). A review: the role of reactive oxygen species in mass coral bleaching. Photosynthesis in Algae: Biochemical and Physiological Mechanisms. (Springer), 459–488. doi: 10.1007/978-3-030-33397-3_17
Takagi D., Takumi S., Hashiguchi M., Sejima T., Miyake C. (2016). Superoxide and singlet oxygen produced within the thylakoid membranes both cause photosystem I photoinhibition. Plant Physiol. 171 (3), 1626–1634. doi: 10.1104/pp.16.00246
van Aken O. (2021). Mitochondrial redox systems as central hubs in plant metabolism and signaling. Plant Physiol. 186, 36–52. doi: 10.1093/plphys/kiab101
van Oppen M. J. H., Gates R. D., Blackall L. L., Cantin N., Chakravarti L. J., Chan W. Y., et al. (2017). Shifting paradigms in restoration of the world’s coral reefs. Glob. Change Biol. 23, 3437–3448. doi: 10.1111/gcb.13647
Weir I. E., Pham N. A., Hedley D. W. (2003). Oxidative stress is generated Via the mitochondrial respiratory chain during plant cell apoptosis. Cytom. Part A 54, 109–117. doi: 10.1002/cyto.a.10054
Keywords: Symbiodiniaceae, heat stress resistance, flow cytometry, reactive oxygen species, reduced glutathione, mitochondrial activity, biomarkers
Citation: Buerger P, Buler M, Yeap HL, Edwards OR, van Oppen MJH, Oakeshott JG and Court L (2023) Flow cytometry-based biomarker assay for in vitro identification of microalgal symbionts conferring heat tolerance on corals. Front. Mar. Sci. 10:1094792. doi: 10.3389/fmars.2023.1094792
Received: 10 November 2022; Accepted: 17 April 2023;
Published: 01 May 2023.
Edited by:
Eric J. Armstrong, Université de Perpignan Domitia, FranceReviewed by:
Milan Szabo, Eötvös Loránd Research Network (ELKH), HungaryKieran Mulroney, Harry Perkins Institute of Medical Research, Australia
Copyright © 2023 Buerger, Buler, Yeap, Edwards, van Oppen, Oakeshott and Court. This is an open-access article distributed under the terms of the Creative Commons Attribution License (CC BY). The use, distribution or reproduction in other forums is permitted, provided the original author(s) and the copyright owner(s) are credited and that the original publication in this journal is cited, in accordance with accepted academic practice. No use, distribution or reproduction is permitted which does not comply with these terms.
*Correspondence: Patrick Buerger, patrick.buerger@mq.edu.au; Marcin Buler, marcinbuler@gmail.com