Surface cross-equatorial pathways of seawater from the Bay of Bengal
 Zhengbei Zhang1,2,3,4,5
  Jing Wang1,4,5*
  Jiajia Hao1,4,5
  Dongliang Yuan1,2,3,4,5* Kunxiang Wang1,2,3,4,5
- 1CAS Key Laboratory of Ocean Circulation and Waves, Institute of Oceanology, and Center for Ocean Mega-Science, Chinese Academy of Sciences, Qingdao, China
- 2Key Laboratory of Marine Science and Numerical Modeling, First Institute of Oceanography, Ministry of Natural Resources, Qingdao, China
- 3Shandong Key Laboratory of Marine Science and Numerical Modeling, Qingdao, China
- 4Laoshan Laboratory, Qingdao, China
- 5University of Chinese Academy of Sciences, Beijing, China
Cross-equatorial pathways of heat and salt in the Eastern Indian Ocean are analyzed using Lagrangian trajectories based on the ECCO2 model simulation and drifter-derived currents combined with Argo data. The results show that most of the particles released in the Bay of Bengal move across the equator near the eastern boundary of the upper Indian Ocean (< 50m) during the southwest monsoon season and join the South Equatorial Current of the wind-driven circulation. Meridional salt and heat transports associated with the cross-equatorial currents feature significant seasonal variations, with stronger southward transports during the southwest monsoon than northward transports during the northeast monsoon, which are correlated significantly with the surface Ekman transports. The estimated annual mean salt and heat transports, based on the model (observational) data, are -0.06×10⁹ (-0.11×10⁹) kg·s-1 and -0.20 (-0.38) PW (1PW = 1015 W), respectively, southward across the equator.
1 Introduction
The Indian Ocean climate is dominated by the monsoon system. The circulation of the eastern tropical Indian Ocean presents significant seasonal variability under the influence of the monsoon. In winter, the westward Northeast Monsoon Current (NMC) transports low salinity water from the Bay of Bengal (BOB) to the Arabian Sea; In boreal summer, the eastward Southwest Monsoon Current (SMC) transports high salinity water from the Arabian Sea to the BOB (Shetye et al., 1996; Jensen, 2001; Shankar et al., 2002; Jensen, 2003; Zhang and Du, 2012). During the monsoon transition seasons, the Wyrtki Jets (WJs) transport high salinity water from the western Indian Ocean eastward along the equator between 2°S and 2°N (Wyrtki, 1973; Han et al., 1999). In contrast, the circulation in the southern Indian Ocean is less affected by the northern Indian Ocean monsoon and the currents are relatively stable. The South Java Current (SJC), forced by the Northwest monsoon through the equatorial Kelvin waves flows eastward along the west coast of Sumatra and Java. The Indonesian throughflow (ITF) carries Indonesian seas waters with higher temperature and lower salinity than the Indian Ocean waters westward into the southeastern tropical Indian Ocean year-round. The SJC and ITF feed the South Equatorial Current (SEC), forming a low-salinity tongue between 10°S and 20°S and influencing the stratification and salinity balance south of the equator (Gordon et al., 1997; Song and Gordon, 2004; Wijffels and Meyers, 2004; Wijffels et al., 2008; Zhang et al., 2016; Chen et al., 2022).
The cross‐equatorial cell (CEC) of the Indian Ocean is a wind-driven, shallow overturning circulation, which plays an important role in maintaining the ocean heat and salt balances of the Indian Ocean (Hsiung, 1985; Wacongne and Pacanowski, 1996; Lee and Marotzke, 1997; Lee and Marotzke, 1998; Lee, 2004; Chirokova and Webster, 2006; Horii et al., 2013). During the summer monsoon, southwesterly winds in the Northern Hemisphere and southeasterly in the Southern Hemisphere form an antisymmetric zonal wind straddling the equator. Southward Ekman transports on both sides of the equator result in cross-equatorial meridional transport. The southward transport during the boreal summer connects the upwelling area in the Northern Hemisphere and the subduction area in the southeastern Indian Ocean, forming a meridional overturning cell. During the winter monsoon, the southwesterly winds become northeasterly winds in the Northern Hemisphere, and southeasterlies become northwesterly in the Southern Hemisphere so that the surface Ekman transports reverse directions (Garternicht and Schott, 1997; Schott and McCreary, 2001; Miyama et al., 2003; Chen et al., 2017; Wang and McPhaden, 2017).
The Indian Ocean warm pool is located in the tropical eastern Indian Ocean basin with the warmest surface temperature distributed predominantly north of the equator. The heat gained by the northern Indian Ocean must be transported southward to maintain the heat balance of the BOB (Yu et al., 2007; Han et al., 2014). The surface branch of the CEC transports the heat obtained in the North Indian Ocean to the south across the equator, while the subsurface branch transports colder thermocline water to the north, connecting with the upwelling offshore of Somalia and Oman. The annual mean heat transport (MHT) of the upper layer across the equator is estimated from the observational data to be greater than -0.5 PW (Hsiung et al., 1989; Hastenrath and Greischar, 1993). The study of Horii et al. (2013) shows that the heat transport across the equator in the Indian Ocean is approximately -0.65 PW based on the acoustic Doppler current profiler (ADCP) data from the RAMA moorings on the equator. The MHT estimated by Loschnigg and Webster (2000) and Garternicht and Schott (1997) using numerical models are -0.4 PW and -0.2 PW, respectively.
The BOB receives the largest net precipitation in the world, with the lowest salinity waters of the Eastern Indian Ocean (EIO) located mainly north of the equator. The BOB low salinity is enhanced by the large volume of river discharge and is in contrast with the higher salinity Swaters of the equatorial EIO (Dai and Trenberth, 2002; Rao and Sivakumar, 2003; Sengupta et al., 2006; Vinayachandran and Kurian, 2007; Gonaduwage et al., 2019). To maintain the salt balance, the fresh water in the BOB must be transported away by the upper ocean circulation. Part of the low-salinity water is transported to the Arabian Sea (Stramma et al., 1996; Shankar et al., 2002; Prasanna Kumar et al., 2004; Gopalakrishna et al., 2005), but the majority of the low-salinity water is concentrated on the eastern BOB, which is transported to the equator along the eastern boundary (Han and McCreary, 2001; Jensen, 2003; Miyama et al., 2003; Benshila et al., 2014). Sengupta et al. (2006) show that the freshwater transport across the 6°N section (80°E-100°E) in the BOB is 0.13 Sv to the south. Hormann et al. (2019), based on surface drifters and Argo float trajectories, indicate that there are two export pathways for the freshwater of the BOB: 1) entering the Arabian Sea south of Sri Lanka carried by the NMC during the northeast monsoon and, 2) crossing the equator along the western coasts of Sumatra into the Southern Hemisphere.
The Lagrangian tracking method has been widely applied to study the water mass transportation in the Indian Ocean. Miyama et al. (2003) used the Lagrangian tracking method in a hierarchy of numerical models to investigate the structure and dynamics of the cross-equatorial currents over the western and central Indian Ocean. Jensen (2003) used passive tracers in a 4.5-layer numerical model to analyze the pathway of the cross-equatorial currents originating in the BOB and the Arabian Sea. L'Hégaret et al. (2018) diagnosed three cross-equatorial gyres of the northern Indian Ocean driven by seasonally reversing monsoon using simulated tracers. However, most studies of the cross-equatorial pathways have focused on the western and central Indian Ocean based on numerical models. The seasonal cycle of the surface branch of the CEC near the eastern boundary in the Indian Ocean lacks studies, the details of which are yet to be disclosed. The cross-equatorial transport in the eastern Indian Ocean is important for the balance of salt and heat in the Indian Ocean due to the concentration of freshwaters near the eastern boundary and the collision of the equatorial currents with the Sumatra coasts and island chains generating complicated circulation patterns. The latest high-resolution ocean models provide an opportunity to study the structure of ocean currents near the eastern boundary.
The remainder of this paper is organized as follows. In section 2, the data and method are described. The seasonal distributions of the surface temperature and salinity in the EIO are shown in section 3.1. The cross-equatorial pathways of fresh water in the EIO are analyzed using Lagrange particle trajectories in section 3.2. The annual and seasonal variations of MST and MHT in the EIO are analyzed in section 3.3. Conclusions and discussions are summarized in section 4.
2 Data and methods
2.1 Datasets
We use the high-resolution model ECCO2 (Estimating the Circulation and Climate of the Ocean Phase II, cube92 version), based on the Massachusetts Institute of Technology general circulation model (MITGCM, Marshall et al., 1997), with a spatial resolution of 0.25° longitude× 0.25° latitude and temporal resolution of 3 days. There are 50 levels covering 5-5906 m in the vertical. The model includes variables such as temperature, salinity, three-dimensional currents, etc. The current climatology is calculated based on 13 years from 2005 to 2017.
The surface current velocity data used in this study are from drifter-derived climatology of Global Near-surface Currents developed by Laurindo et al. (2017), which is updated to July 2020. This dataset builds on the climatology of Lumpkin and Johnson (2013), derived from satellite-tracked surface drifter data. The data provide monthly near-surface (15-m) currents climatology. Uncertainties in the dataset are related to the number of observations and the variance, but, the Indian Ocean is reasonably well sampled. Following the study of L’Hegaret et al. (2018), the daily currents are derived from the monthly current data, with a spatial resolution of 0.25° longitude× 0.25° latitude.
The surface drifter data used are obtained from the Global Drifter Program (GDP), which is a plan of the Atlantic Oceanographic and Meteorological Laboratory (AOML). The drifters provide 15-m currents, location, velocity, and sea surface temperature (Lumpkin and Pazos, 2007). The data are screened through the quality control procedures by the Drifter Data Assembly Center (DAC) of the AOML and interpolated into 6-hour intervals using the Kriging method (Hansen and Poulain, 1996; Lumpkin and Centurioni, 2019). Previous studies have shown that the drifter trajectories represent the characteristics of the Indian Ocean current field well (e.g. Wu et al., 2020).
The monthly salinity and temperature from the Argo dataset obtained from the International Pacific Research Center (IPRC) are used to validate the model output. The gridded Argo data cover the period of 2005 to 2017 with 27 vertical layers from 0 m to 2000 m, and a horizontal resolution of 1° longitude ×1° latitude. The monthly wind data used to calculate the Ekman transport are from the European Centre for Medium-Range Weather Forecasts Interim Reanalysis (ERA-Interim). We use the data from 2005-2017, with a spatial resolution of 1° longitude×1° latitude.
2.2 Lagrangian tool
The Lagrangian analysis is an effective way of identifying the origin and destination of water particles. Herein, we used a diagnostic Lagrangian tool, a. k. a. the CMS (Connectivity Modelling System, Paris et al., 2013), which is an open-source Fortran toolbox, created by the University of Miami, for the multiscale tracking of biotic and abiotic particles in the ocean. The CMS uses a 4th-order Runge-Kutta integration method to calculate particle advection and position. The CMS has been used in many topics in a variety of studies (e.g. Peña-Izquierdo et al., 2015; Cheng et al., 2016; Tamsitt et al., 2017; Kourafalou et al., 2018). The CMS has been used on velocity fields from many high-resolution models such as OFES, HYCOM, ECCO2, and many other ocean models. To analyze the pathways of cross-equatorial currents in the EIO, the trajectories of water masses are described using the Lagrangian analysis method.
2.3 Estimates of upper layer MHT and MST
The thermocline of the Indian Ocean is strong and stable. The heat and salt transports of the upper ocean can be estimated using ECCO2, Argo temperature, and salinity data. The MHT and MST are estimated as shown in Equation (1) and Equation (2), respectively:
where xE is the east boundary; H =50 m; ρ, s, v, cp, θ denote the density, salinity, meridional current, specific heat, and potential temperature, respectively.
3 Results
3.1 General features
The seasonal distributions of observed and simulated currents, SSS, and SST are cross-validated in Figures 1, 2. The results suggest that the ECCO2 model can reproduce the seasonal and spatial structure of the observed data fairly well in the EIO. In boreal winter, driven by the northeast monsoon, a strong westward NMC appears in southern Sri Lanka. The NMC extends from the southeast of the BOB to the southern Arabian Sea, which transports the low salinity water from the BOB into the Arabian Sea. As the surface circulation is adjusted with the monsoonal forcing in spring, the NMC disappears gradually. Under the influence of the westerly wind, strong eastward WJs appear between 2°S and 2°N, which force the formation of the SJC (Clarke and Liu, 1993; Clarke and Liu, 1994; Qu and Meyers, 2005) entering the southeastern Indian Ocean along the Sumatra-Java coasts before joining the westward SEC. In boreal summer, influenced by the strong southwest monsoon, the SMC appears on the southeast side of Sri Lanka with a maximum of 0.5 m·s-1, which transports high salinity waters from the Arabian Sea eastward into the BOB. The southwest monsoon weakens gradually in fall, forcing stronger WJs north of the equator than in the south. The eastward SMC (WJs) in summer (fall), the southward current along the western coasts of Sumatra, and the westward SEC form a cyclonic circulation system.
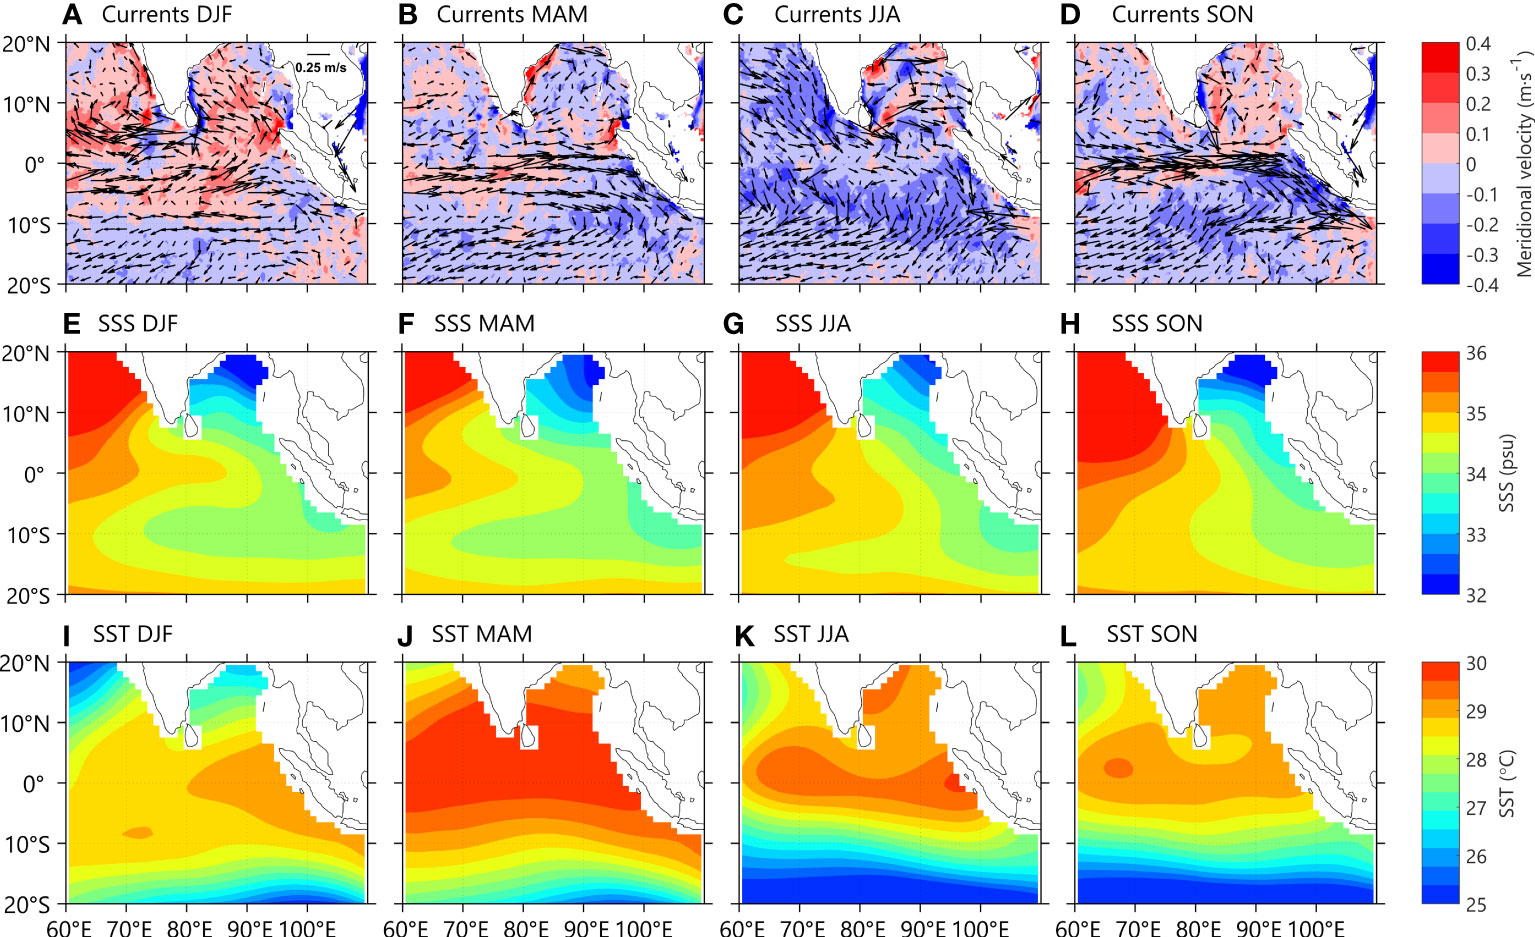
Figure 1 Seasonal distribution of (A–D) currents (arrows), meridional velocity (shading), (E–H) SSS, and (I–L) SST provided by the drifter-derived currents and Argo data. The seasons are winter (DJF, December- February), spring (MAM, March-May), summer (JJA, June-August), and fall (SON, September-November), respectively.
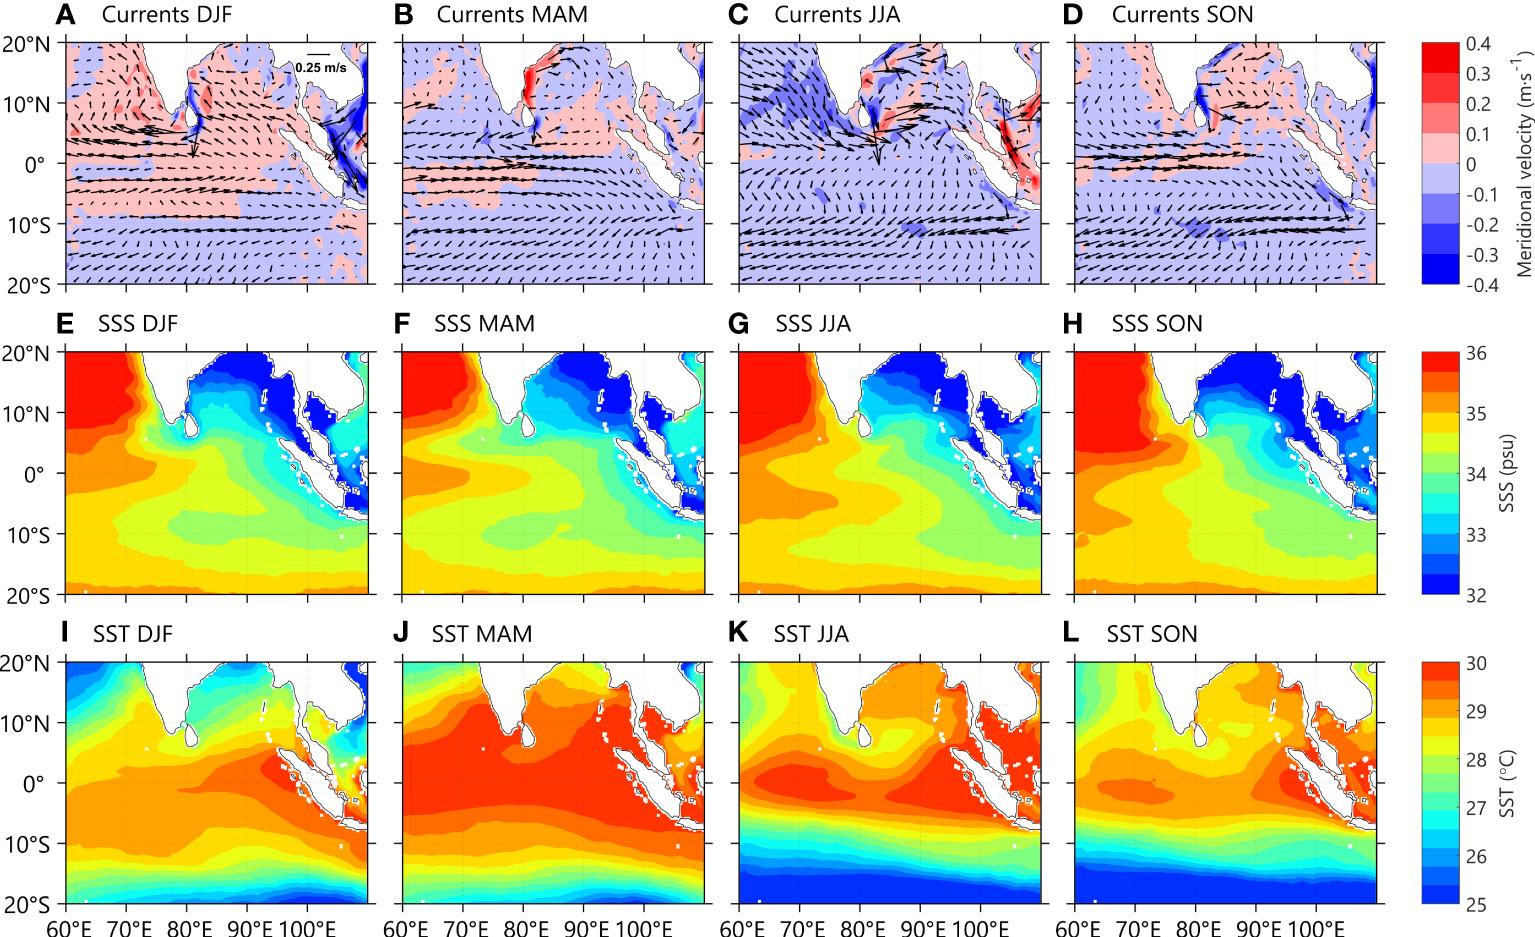
Figure 2 Same as Figure 1, but obtained from the ECCO2 data.
Low salinity waters are located in the BOB and the eastern boundary, with a minimum of 32.0 psu (Figures 1E–H, 2E–H). In contrast, the salinity of the Arabian Sea is much higher, with a maximum exceeding 36.0 psu; Associated with the salinity distributions in the Arabian Sea and the BOB, the SSS near the equator has a large zonal gradient, which is generally high in the west and low in the east. During the monsoon transition seasons, the WJs carry high salinity waters from the western Indian Ocean to the east, forming a high salinity tongue along the equator. In addition, salt exchange between the BOB and the Arabian Sea occurs through the SMC (NMC) during the summer (winter), forming a high (low) salinity tongue south of Sri Lanka. South of the equator, there is a westward extending low salinity tongue, which is due to the transport of low salinity waters by the ITF and SEC.
The SST in the EIO is higher year-round in climatology, with the SST in most sea areas higher than 28 °C (Figures 1I–L, 2I–L). Generally, the SST is higher near the equator than that off the equator, and north of the equator than in the south. In spring, the Pacific-Indian Ocean warm pool SST is the highest. In boreal summer and fall, the spatial temperature difference is the smallest. In winter, the SST in the north decreases due to the change in sea surface thermal conditions.
3.2 Trajectories of Lagrangian particles and surface drifters
Surface particles are tracked using the Lagrangian analysis method. Here we select two background fields: ECCO2 and drift-derived currents. The seasonal variation in the drift-derived current is consistent with the ECCO2 simulation, suggesting the reality of the model simulation.
The particles are released in the EIO on the first day of each month and tracked for a year following the vertically averaged currents in the upper 15 m. The 501 particles in total are released along 5°N from 85°E to 95°E, with an interval of 0.02° in the zonal direction. For the sake of clarity, only 10% of the particle trajectories are shown in the plot. Seasonal variations of the trajectories in Figures 3, 4 suggest that the BOB waters move southward across the equator along the eastern boundary of the Indian Ocean during spring through summer, whereas they are transported into the Arabian Sea all through winter before crossing the equator in the central basin. Almost all the particles released at the mouth of the BOB move southward in summer, consistent with the southward surface Ekman transport of the southwest monsoon. In fall through winter, nearly no particles move southward, except near the western boundary, suggesting the north advective by the surface Ekman transport of the northeastern monsoon.
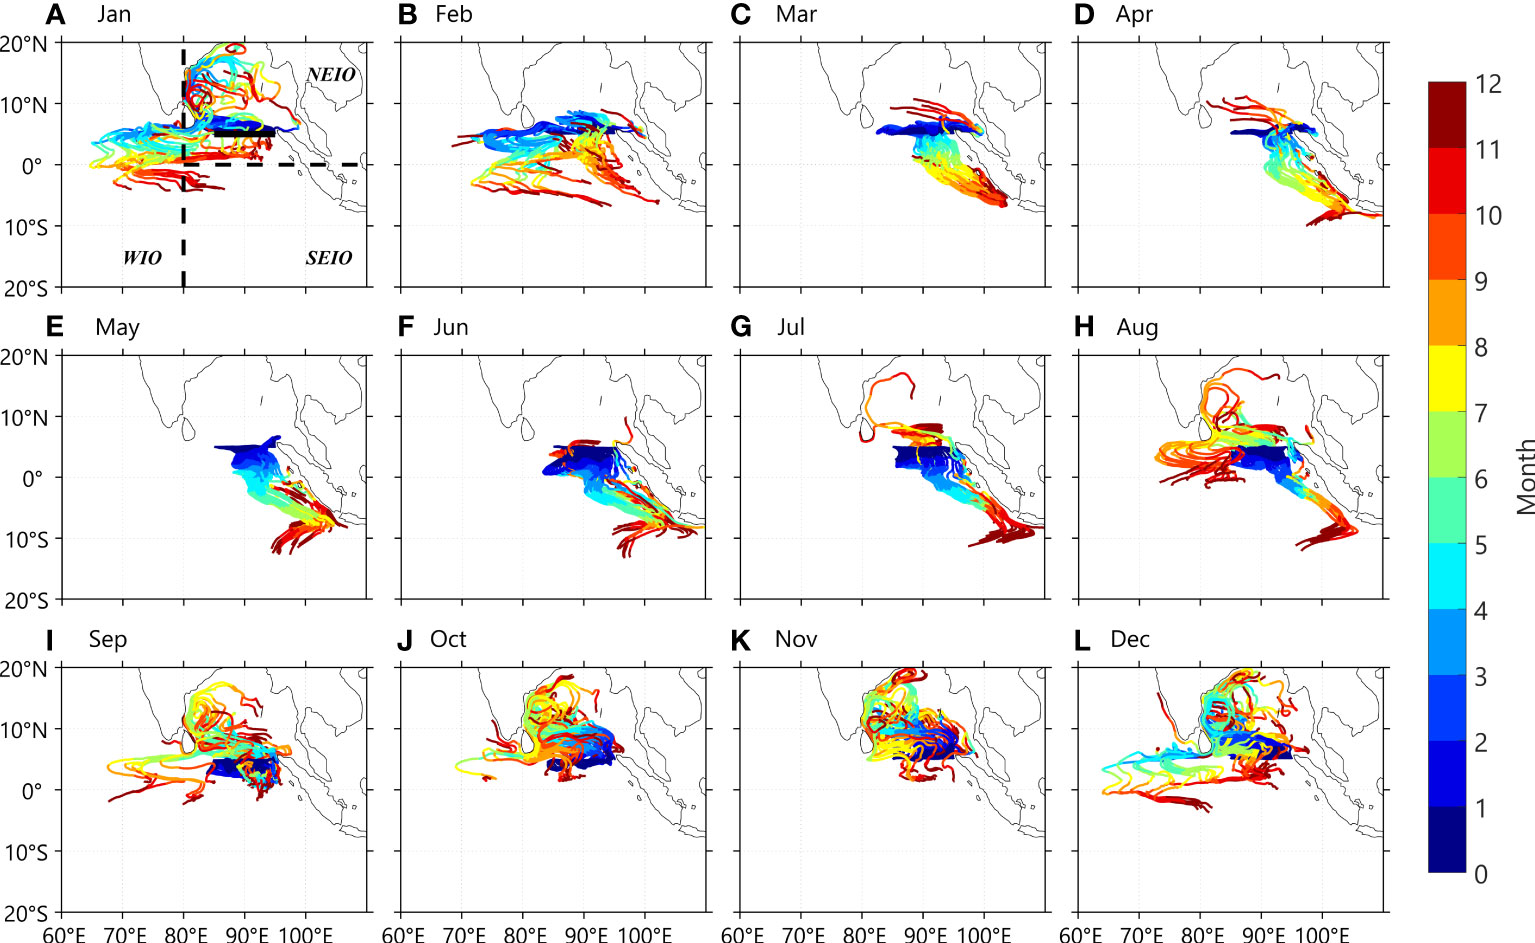
Figure 3 Trajectories of particles released on the 1st of each month and tracked forward in time for a year using the ECCO2 currents data. The solid black line in (A) represents the initial locations (85°E-95°E, 5°N) of the particles released with an interval of 0.02° in the zonal direction. For clarity, only 10% of the particle trajectories are shown. The black dotted lines in (A) mark the three regions: NEIO, northern part of the EIO; SEIO, southern part of the EIO; WIO, western Indian Ocean.
According to the spatial distribution of particles, we divide the study region into three parts (Figure 3): the northern part of the EIO (NEIO, east of 80°E and north of the equator), the southern part of the EIO (SEIO, east of 80°E and south of the equator), and the western Indian Ocean (WIO, west of 80°E). There are significant seasonal variations of particles (Figures 3, 4). During the monsoon transition period (March-May, Figures 3C–E, 4C–E), the equatorial region was controlled by strong westerly winds as the northeast monsoon subsided gradually and the southwest monsoon began to strengthen. The surface circulation of EIO is adjusted in two states: the mouth of the BOB is dominated by eastward currents and southward surface Ekman transport, which prevented the particles from entering the BOB; The strong eastward WJs near the equator between 2°S and 2°N force the particles to concentrate near the eastern boundary region. In summer (June-August, Figures 3F–H, 4F–H), the WJs disappear and the particles are to spread westward. However, most of the particles are still concentrated on the east boundary due to the strengthening of the southwest monsoon, which forces the eastward SMC to reverse directions. At this time, a southward surface Ekman transport across the equator dominates the eastern mouth of the BOB and the western Sumatra coastal areas. This surface branch of the CEC forms a cyclonic circulation system with the eastward SMC, the SJC, and the westward SEC in the Southern Hemisphere, which forces most of the particles to travel across the equator into the Southern Hemisphere and eventually join the SEC.
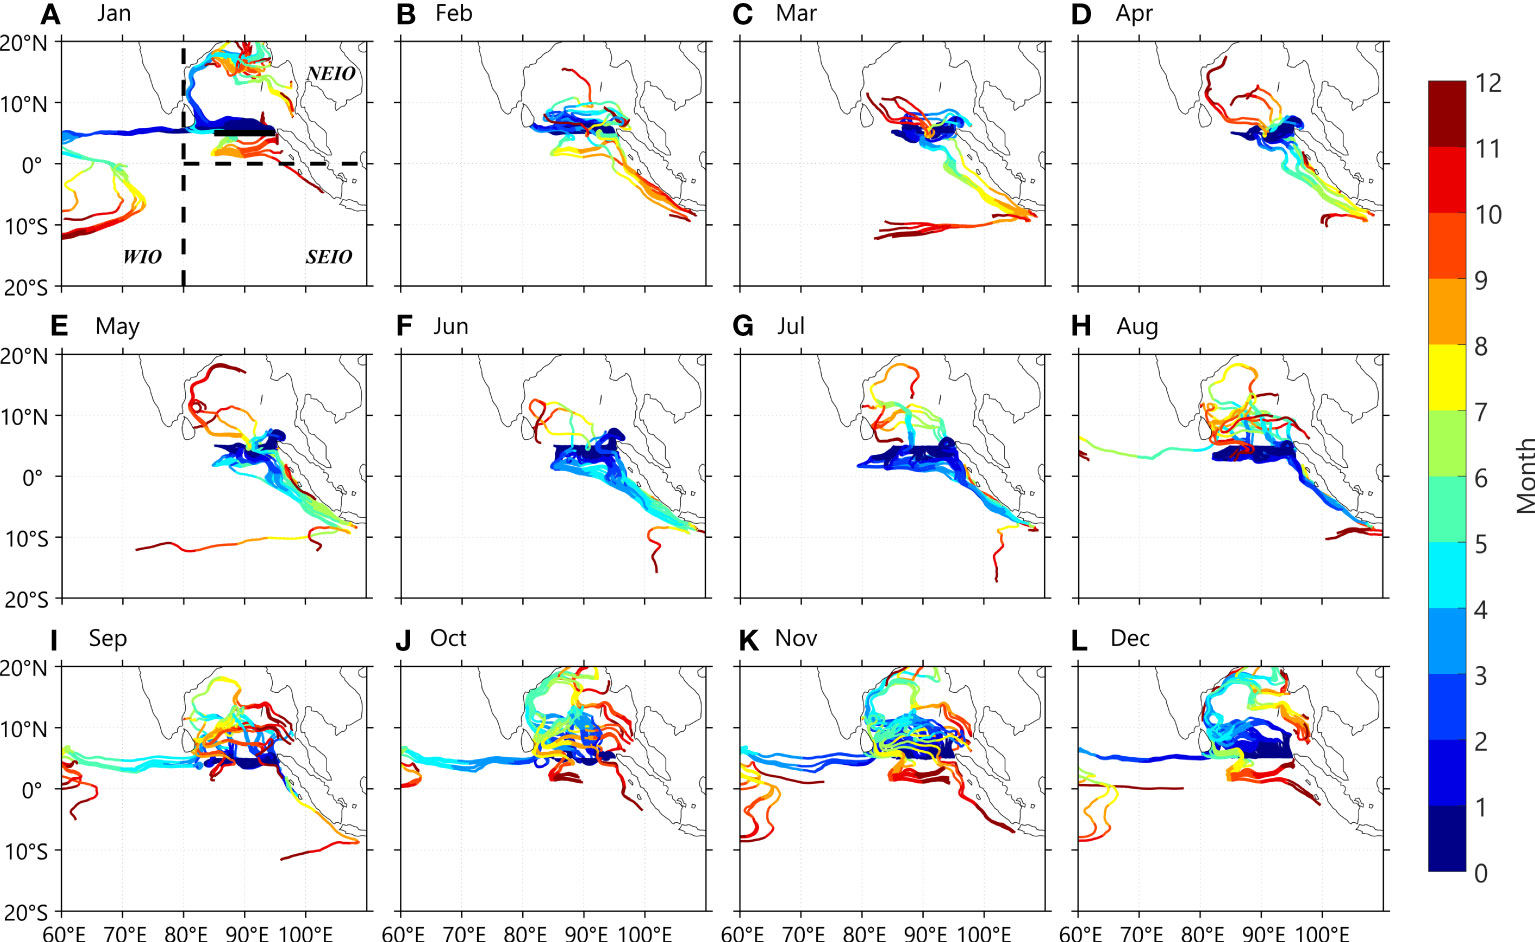
Figure 4 Same as Figure 3, but tracked using the drifter-derived currents data.
In boreal fall, the surface circulation changes with the wind field. Advected by the WJs, most particles are concentrated near the eastern boundary. With the strengthening of the northeast monsoon, the Ekman transport is northward and particles are transported northward to join the NMC. In addition, the north branch of the WJs contributes to the northward movement of particles along the eastern boundary (Wang, 2017). Under the influence of both, the particles enter the BOB (Figures 3I–K, 4I–K).
In boreal winter (December-February, Figures 3B, L, 4A, B, 4L), the northeast monsoon forces the NMC south of Sri Lanka to intensify. The NMC extends from southeast of the BOB to the region west of 65°E, resulting in some particles entering the western Indian Ocean. The intensity of NMC peaks in January, with a maximum velocity of 0.5 m·s-1, introducing the largest number of particles into the western Indian Ocean. Moreover, due to the northward surface Ekman transport and the anticyclonic circulation in the BOB, particles move to the north and enter the bay off the east coasts of India. During the northeast monsoon season, the cyclonic circulation of the EIO is similar to that in the southwest monsoon season, except that the northern boundary is occupied by the SMC and WJs. The southern boundary is still the SEC as in the southwest monsoon season. However, the northward surface Ekman transports prevents the particles from moving southward across the equator. The number of cross-equatorial trajectories is much less than that in spring and summer.
To further quantify the seasonal variations of the trajectory, the percentage distribution of particles released from the different months in the NEIO, the SEIO, and the WIO is calculated (Figure 5). The largest number of particles is seen in the NEIO where particles are released. The concentrations of particles also exhibit apparent seasonal variability. In May, the numbers of particles in the NEIO and SEIO reached the minimum and maximum, respectively. At the time, Ekman transport was southward since the southwest monsoon recently began, and the particles have enough time to cross the equator. Many particles are transported northward in the fall before reaching the equator since southward Ekman transport reverses directions. When the northeast monsoon strengthens and the NMC intensity reaches its maximum, the largest number of particles concentrate in the WIO in winter. The statistical analysis using drifter-derived currents shows similar and consistent seasonal distributions of the particles.
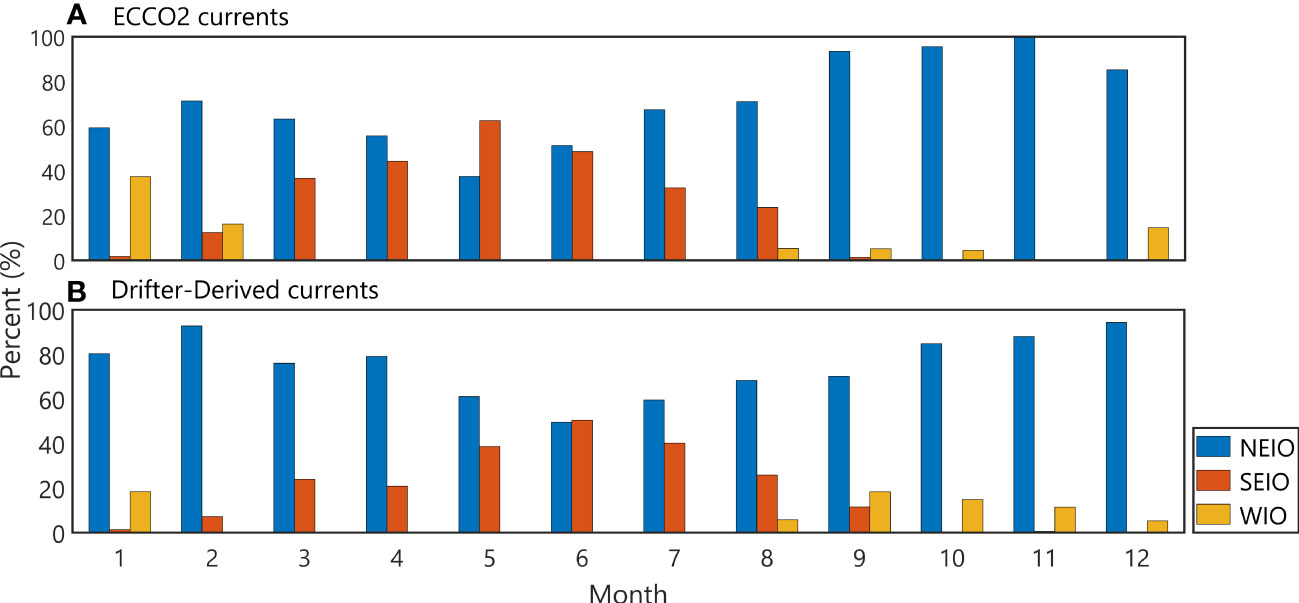
Figure 5 Percentage distributions of particles in the three regions (in Figure 3A) released in different months based on the (A) ECCO2 and the (B) drifter-derived currents.
Three representative paths of the particle trajectories are identified according to the distribution of particles, and the three-dimensional trajectories of particles under three typical paths selected from the Figure 3 are shown in Figure 6. In path I, particles move northward into the BOB and are trapped in the bay; In path II, the particles move swiftly westward into the western Indian Ocean with the NMC, and then across the equator in the central and western basin; In path III, the particles move southward across the equator along the west coasts of Sumatra-Java and join the SEC. Compared with the vertical movement, path I and path III are dominated by the horizontal movement (Figures 6A, B, E). The cross-equatorial trajectories in the EIO show significant differences from those crossing the equator in the central and western basin in Path II. Particles crossing the equator along Paths I and III are mainly concentrated in the upper layer (<50 m), whereas, the particles following path II show significant vertical movement down to as deep as 80 m depths after crossing the equator. The particles in path II first move westward, then cross the equator southward and descend to 60-80 m, due to the subduction of the off-equatorial waters (Figures 6C). At the peak of the summer monsoon, northward surface currents and southward subsurface currents in the Indian Ocean (a. k.a. the equatorial roll) appear in the western and central Indian Ocean (Wacongne and Pacanowski, 1996; Schott et al., 2002; Miyama et al., 2003). Under the influence of the equatorial roll, the cross-equatorial particles in path II move to the deeper waters. In contrast, the movement of the particles across the equator is mainly confined in the surface layer in the EIO due to the surface Ekman transports.
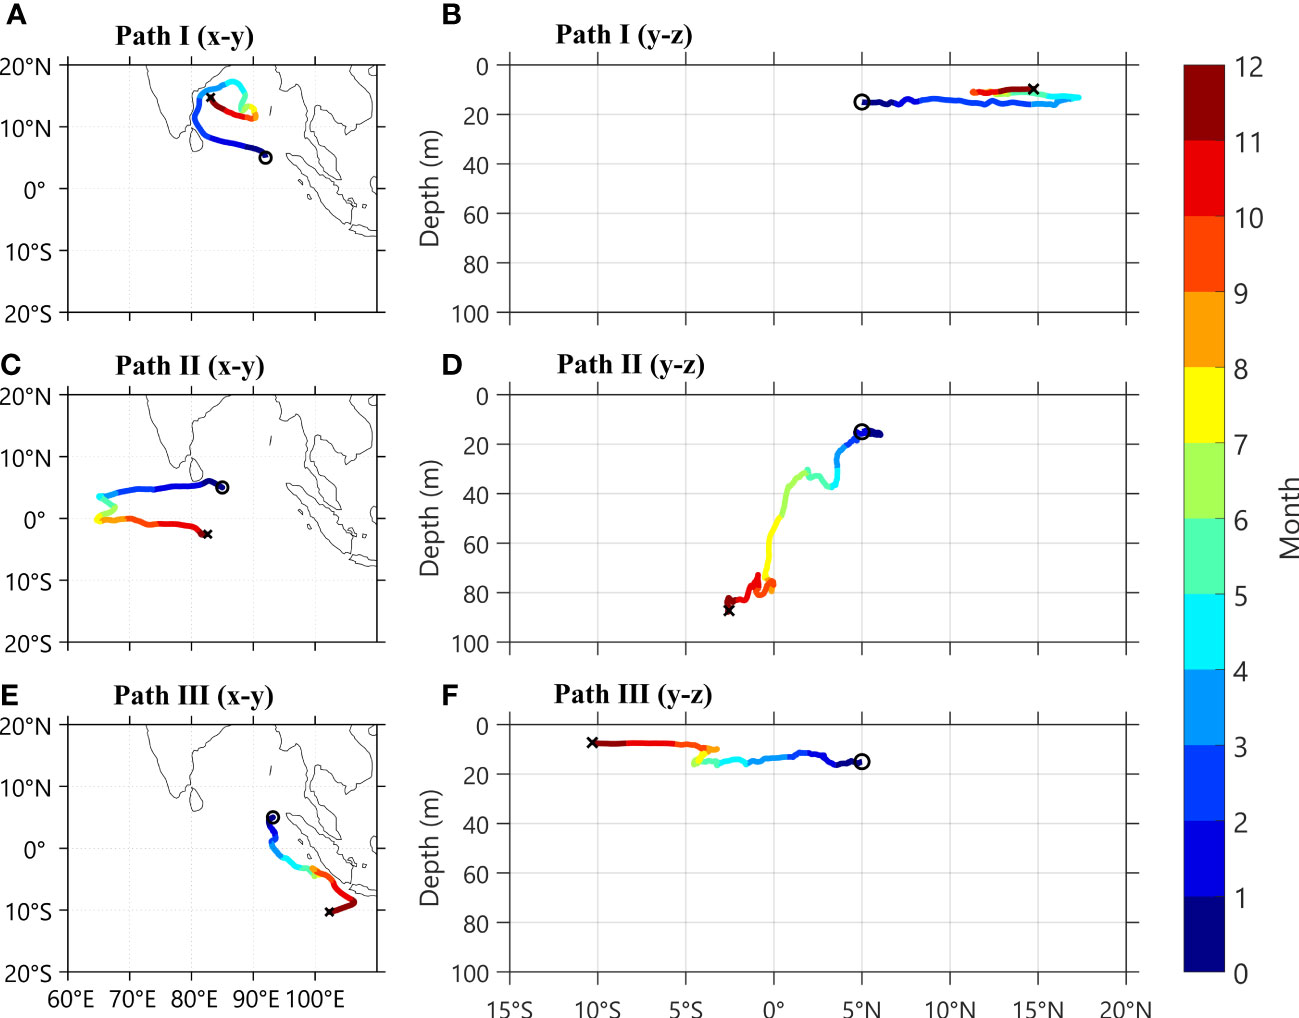
Figure 6 Three typical drifter trajectories tracked forward in time for a year using the ECCO2 currents, showing horizontal (A, C, E) and vertical (B, D, F) views. Path I-III are shown in (A–F), respectively. Trajectories illustrate the types of common paths for particles. The circles and crosses represent the initial and final positions of the particles, respectively.
The trajectories and velocity of the surface drifters in the EIO are analyzed based on the GDP data. We selected 151 drifters in total passing through the study area (5°N, 85°E-95°E) for each season, and their trajectories are analyzed throughout their lifetime (Figure 7). The trajectories of the surface drifters show three main paths, which are consistent with the model results. The drifters released in winter are difficult to move southward due to the northward surface Ekman transports. Some drifters entered the BOB while others drifted with the NMC into the western Indian Ocean (Figure 7). Similar to in winter, the drifters are influenced by the eastward WJs in fall, most of which cannot move westward (Figure 7). Due to the southward surface Ekman currents, some of the drifters released in summer are transported to the south, also consistent with the model results. In the ensuing months, as the direction of the monsoon reverses, the drifters that do not reach the Southern Hemisphere turn back to the north, and finally end in the BOB (Figure 7). In comparison, the drifters released in spring have enough time to move southward, with only a few of them ending in the BOB (Figure 7).
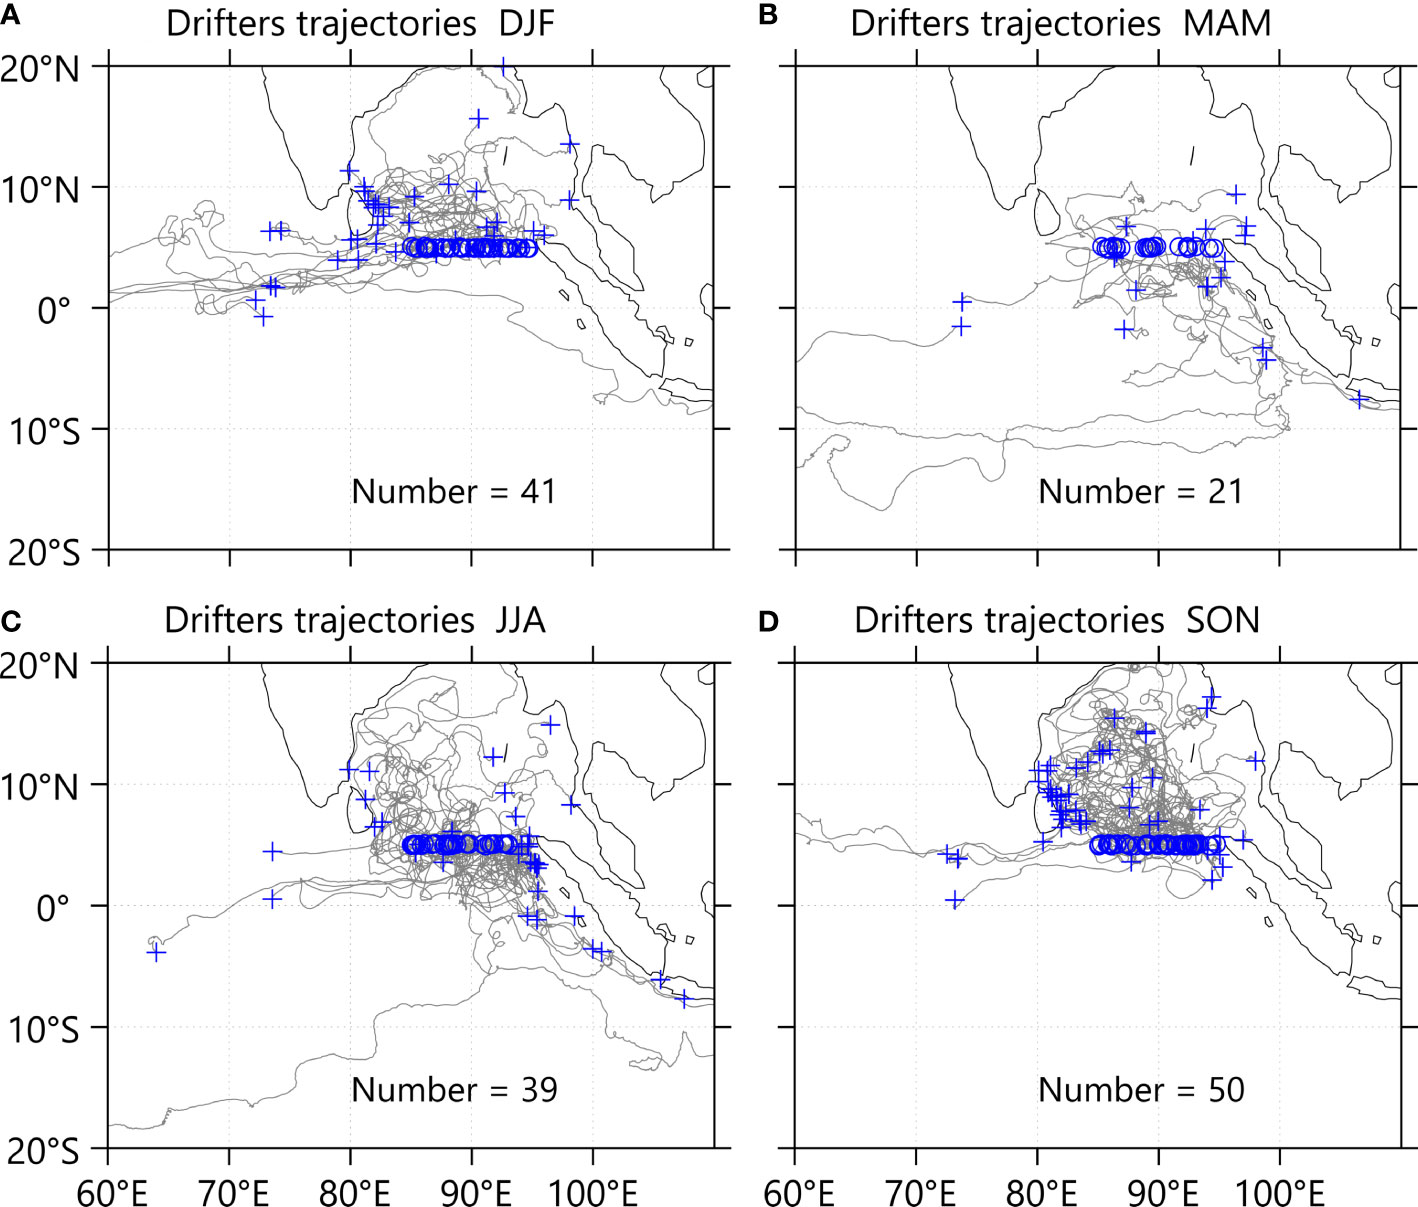
Figure 7 Trajectories of surface drifters (Total number = 151) from the GDP starting within the northern reach of the EIO (5°N, 85°E-95°E). The surface drifters are released in boreal (A) winter, (B) spring, (C) summer, and (D) fall, respectively. The gray lines indicate the trajectories of the surface drifter. The blue circles and plus signs represent the initial and final positions of the trajectories, respectively.
3.3 Meridional heat and salt transports in the upper EIO
The cross-equatorial exchange of the particles directly affects the balance of the salt and heat budgets of the North and South Indian Ocean. The Lagrangian trajectories of the particles have shown that most particles cross the equator near the eastern boundary. Therefore, we select the eastern boundary region (east of 90°E) to estimate the MST and MHT of the upper layer. The annual mean transport (Figure 8) is calculated as the zonally accumulated MST and MHT integrated from the eastern boundary, showing an alternating zonal distribution, with southward transport south of 5°N, northward transport between 5°N and 15°N, and southward transport north of 15°N. The MHT and MST on the equator are southward, indicating cross-equatorial southward transport of salinity and heat, with the transport intensity increasing with latitude in the South Indian Ocean. The annual mean cross-equatorial MST and MHT estimated by the model (observational) data are -0.06 ×10⁹ (-0.11 ×10⁹) kg·s-1 and -0.20 (-0.38) PW, respectively (Table 1).
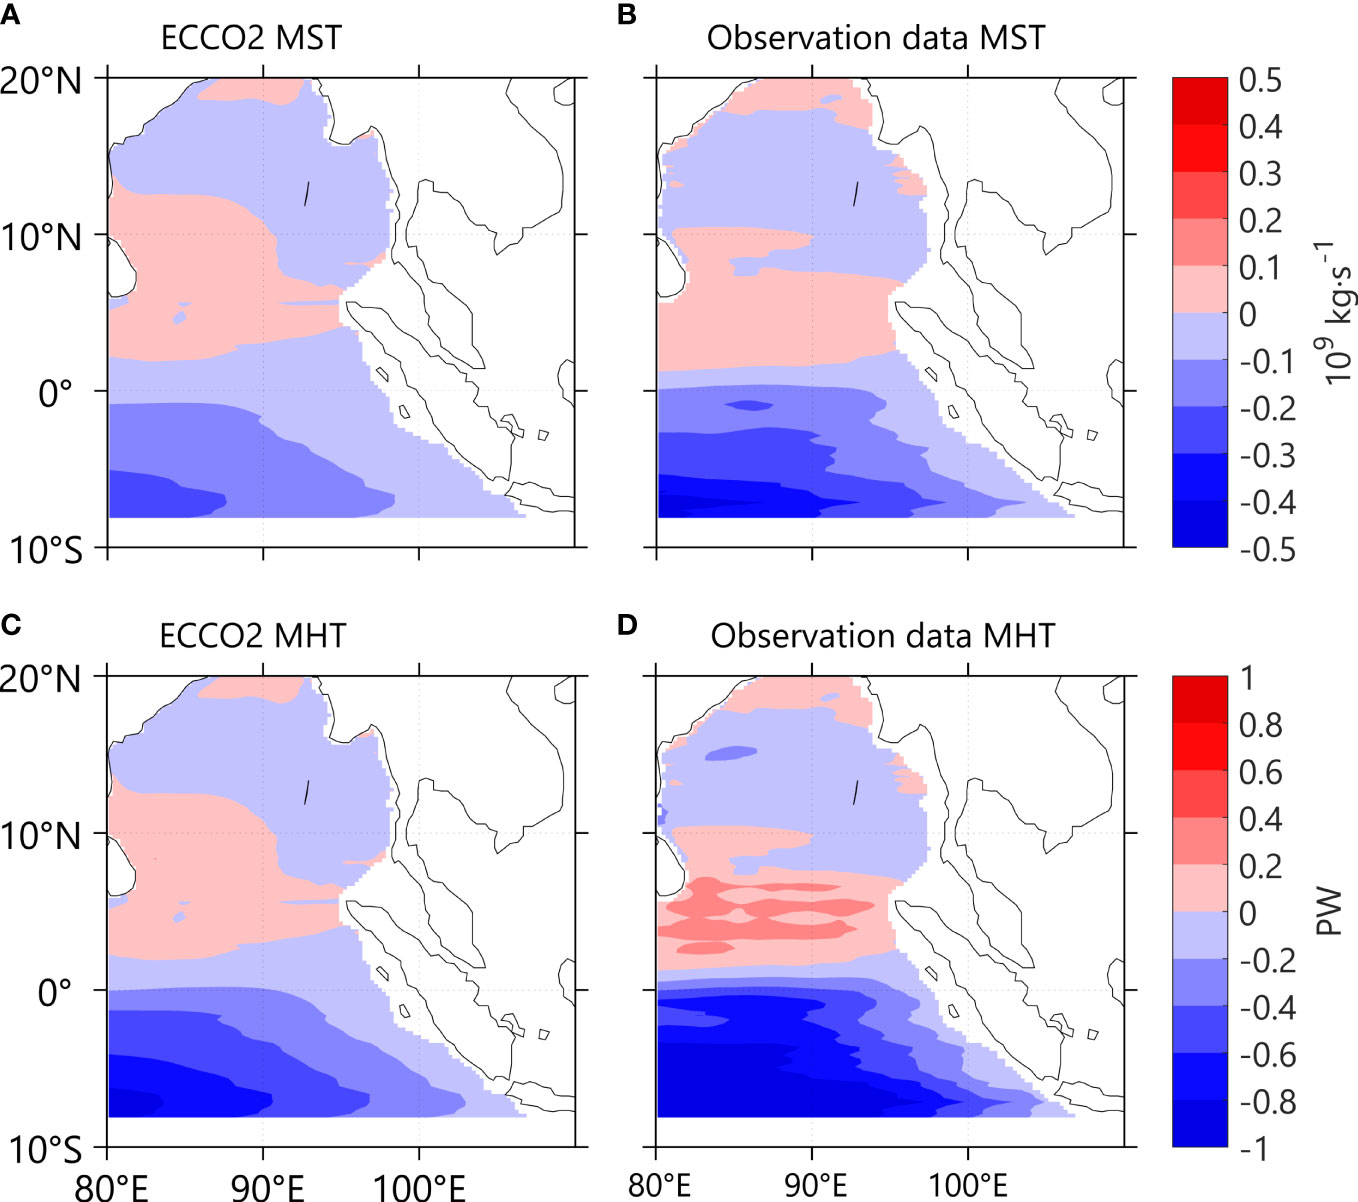
Figure 8 Annual mean meridional (A, B) salt (unit: 109 kg·s-1) and (C, D) heat (unit: PW) transports from (A, C) ECCO2 and (B, D) observational data (drifter-derived currents and Argo data). Positive values are northward transports.
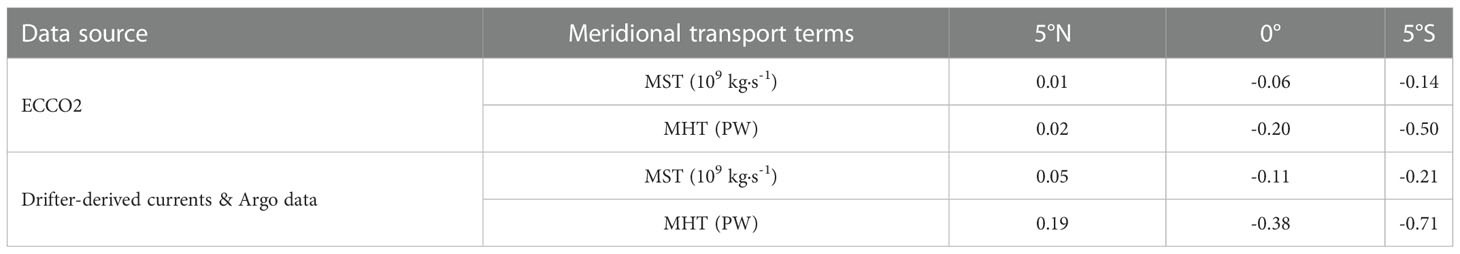
Table 1 Annual means of the MST and MHT. The western boundary of the integral is 90°E. Positive values are northward transports.
The MHT and MST show sizable seasonal variations in the EIO (Figures 9, 10), especially in the region north of the equator where the southward currents dominate from May to September, and northward currents from October to April. The change of the transport direction is associated with the monsoon climate of the Indian Ocean. The southwest and northeast monsoons prevail in the northern Indian Ocean in summer and in winter, respectively, with the surface Ekman transports changing directions under the influence of the monsoon, hence the strong seasonal variability. The seasonal variations inside the BOB are significantly different from those on the equator, which may be due to the complicated circulation in the bay.
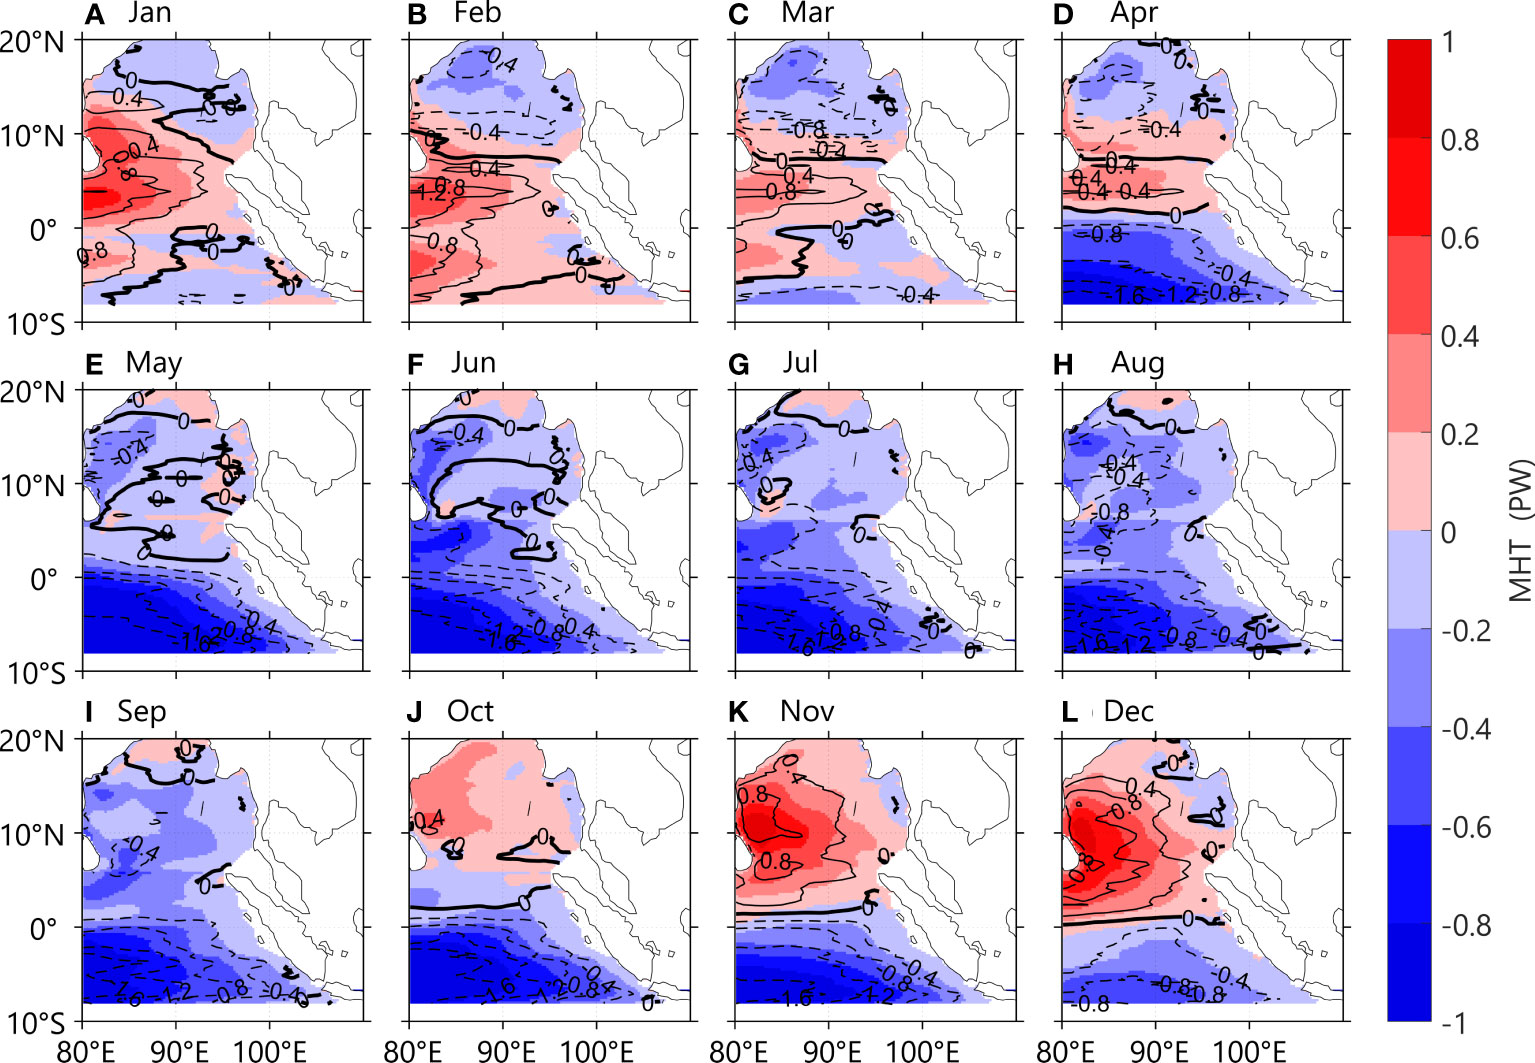
Figure 9 Monthly meridional salt transports (A-L) based on the ECCO2 (shading) and the observational data (drifter-derived currents and Argo data, contours), respectively. Positive values are northward transports. Unit: 109 kg·s-1.
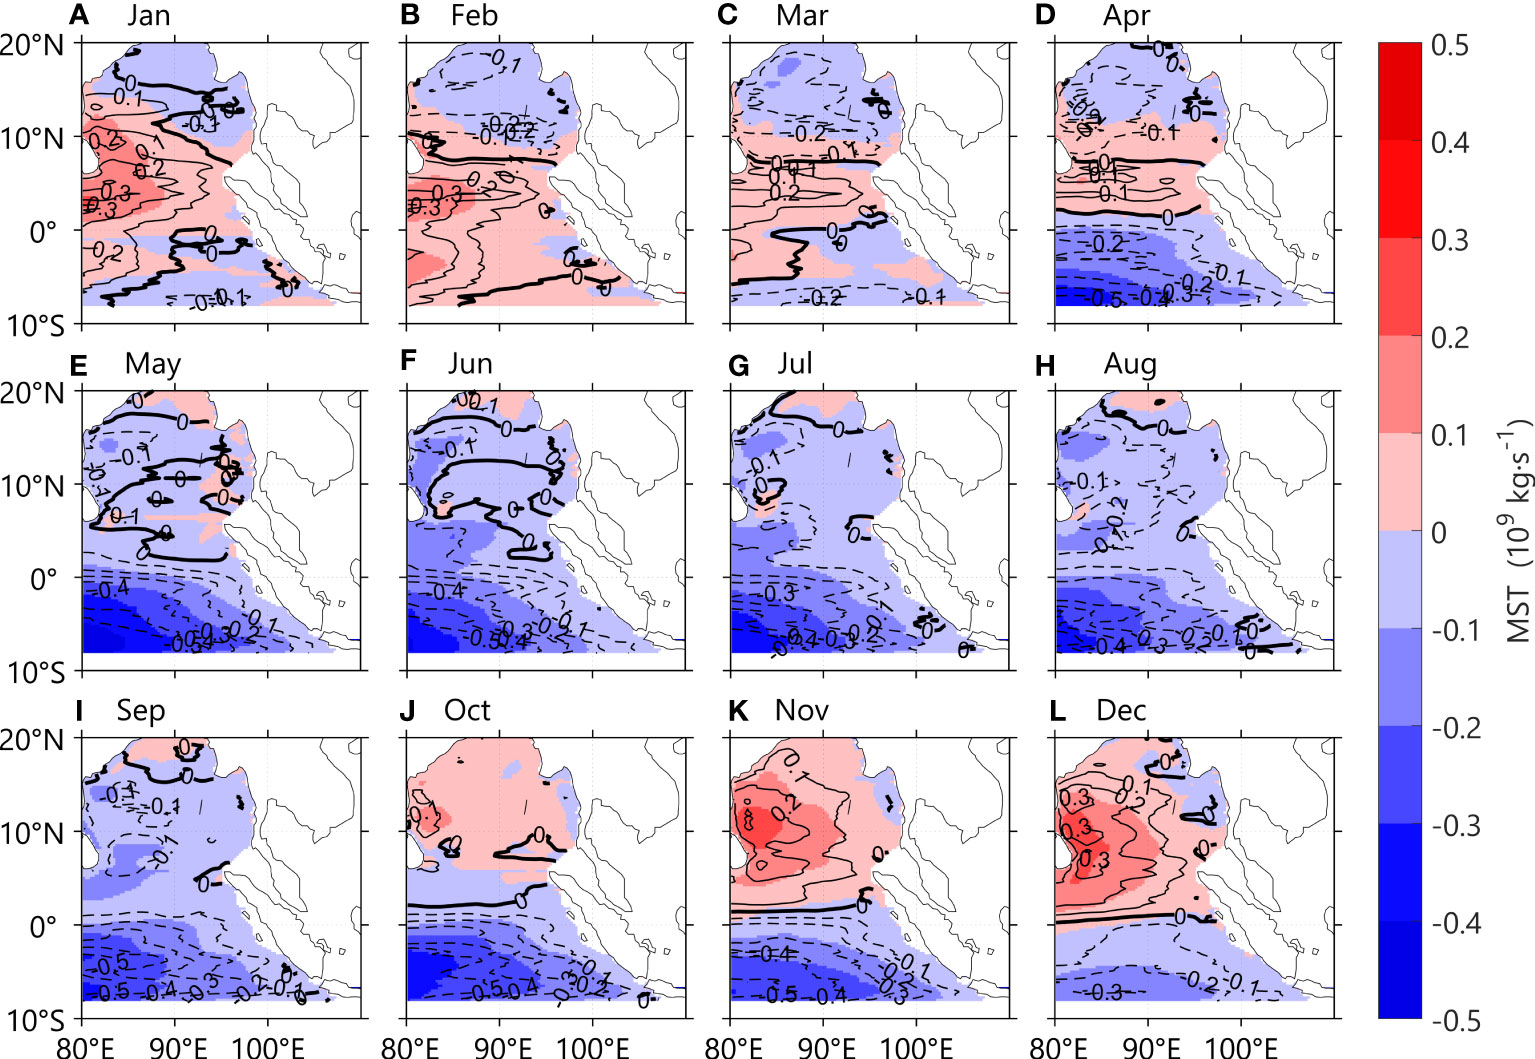
Figure 10 Monthly meridional heat transport (A-L) based on the ECCO2 (shading) and the observation data (drifter-derived currents and Argo data, contours), respectively. Positive values are northward transports. Unit: PW.
The meridional transport on the equator is governed by the equatorial Sverdrup transport [i. e., where τx is the zonal wind stress, β=∂f/∂y f is the Coriolis parameter, y is the latitude, and ρ is the water density], since the Coriolis parameter vanishes on the equator (Horii et al., 2013). North of the equator, the zonally integrated MST and MHT are southward from May to September, and northward from October to April. On and south of the equator, the zonally integrated MST and MHT are southward throughout the year except in winter, when the northeast monsoon peaks, and there is weak northward transport on and south of the equator (Figures 11B). The seasonal variations in zonally integrated MST and MHT are dominated by the surface Ekman transports (Figure 11). The Ekman transports at different latitudes exhibit different seasonal variations, with significant correlations with the MHT and MST above the 95% confidence level in ECCO2 (observation) data. The correlation coefficients are 0.94 (0.98) at 5°N, 0.93 (0.86) at the equator, and 0.65 (0.51) at 5°S, suggesting the strong influence of the monsoon in the North Indian Ocean than in the south.
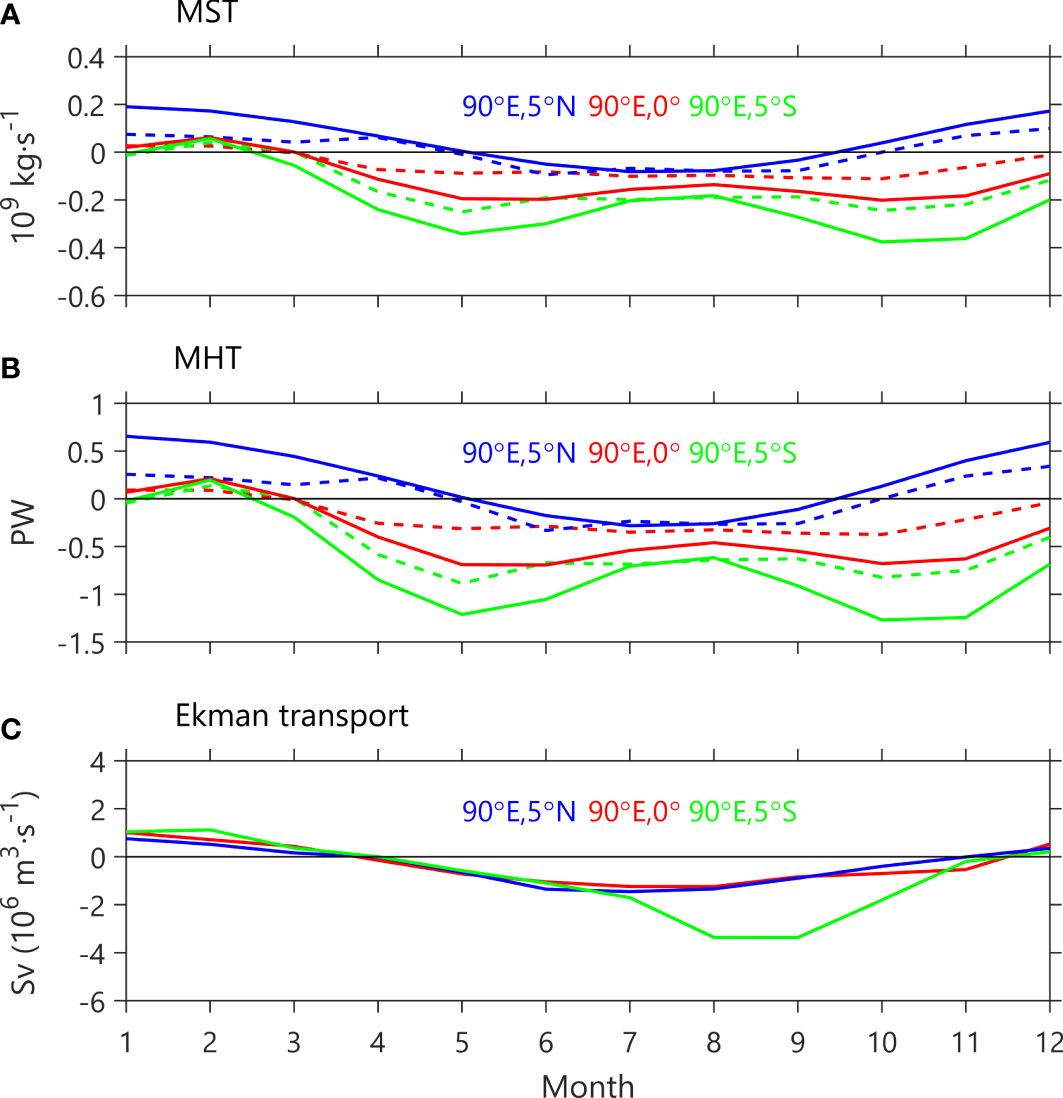
Figure 11 Zonally integrated (A) MST, (B) MHT, and (C) Ekman transports at 5°N, 0°, and 5°S, respectively, from the observations (solid lines) and the ECCO2 data (dashed lines). The western boundary of the integral is 90°E. Positive values are northward transports.
4 Conclusions and discussions
In this study, the cross-equatorial pathways of particle movement and the associated salt and heat transports in the EIO are investigated using the ECCO2 model, Argo profiling data, surface drifter data, and the Lagrangian analysis tool. Tracking of the particle trajectories suggests that there are three output pathways of the freshwater from the BOB (Figure 12): 1) During the winter monsoon, the Ekman transport is northward and the freshwater is carried by the northward Ekman currents into the BOB. This water can not cross the equator (Path I). 2) During the winter monsoon, the other part of freshwater moves to the western basin transported by the westward NMC into the central equatorial Indian Ocean. This amount of freshwater moves acrosses the equator in the central basin to the Southern Hemisphere as the monsoon direction changes in summer, resulting in the Ekman transport turning to the south. (Path II). 3) During the summer monsoon, the surface Ekman transport is southward and the freshwater from the BOB is carried by the Ekman currents southward in the upper ocean (< 50 m). Pushed to the east by the SMC and the WJs, the freshwater moves to the eastern boundary in the equatorial eastern Indian Ocean and finally crosses the equator in a Eastern Boundary Current off the west coasts of Sumatra and Java, before joining the westward SEC in the Southern Hemisphere (Path III). Statistical analyses suggest that most of the freshwater crosses the equator along Path III.
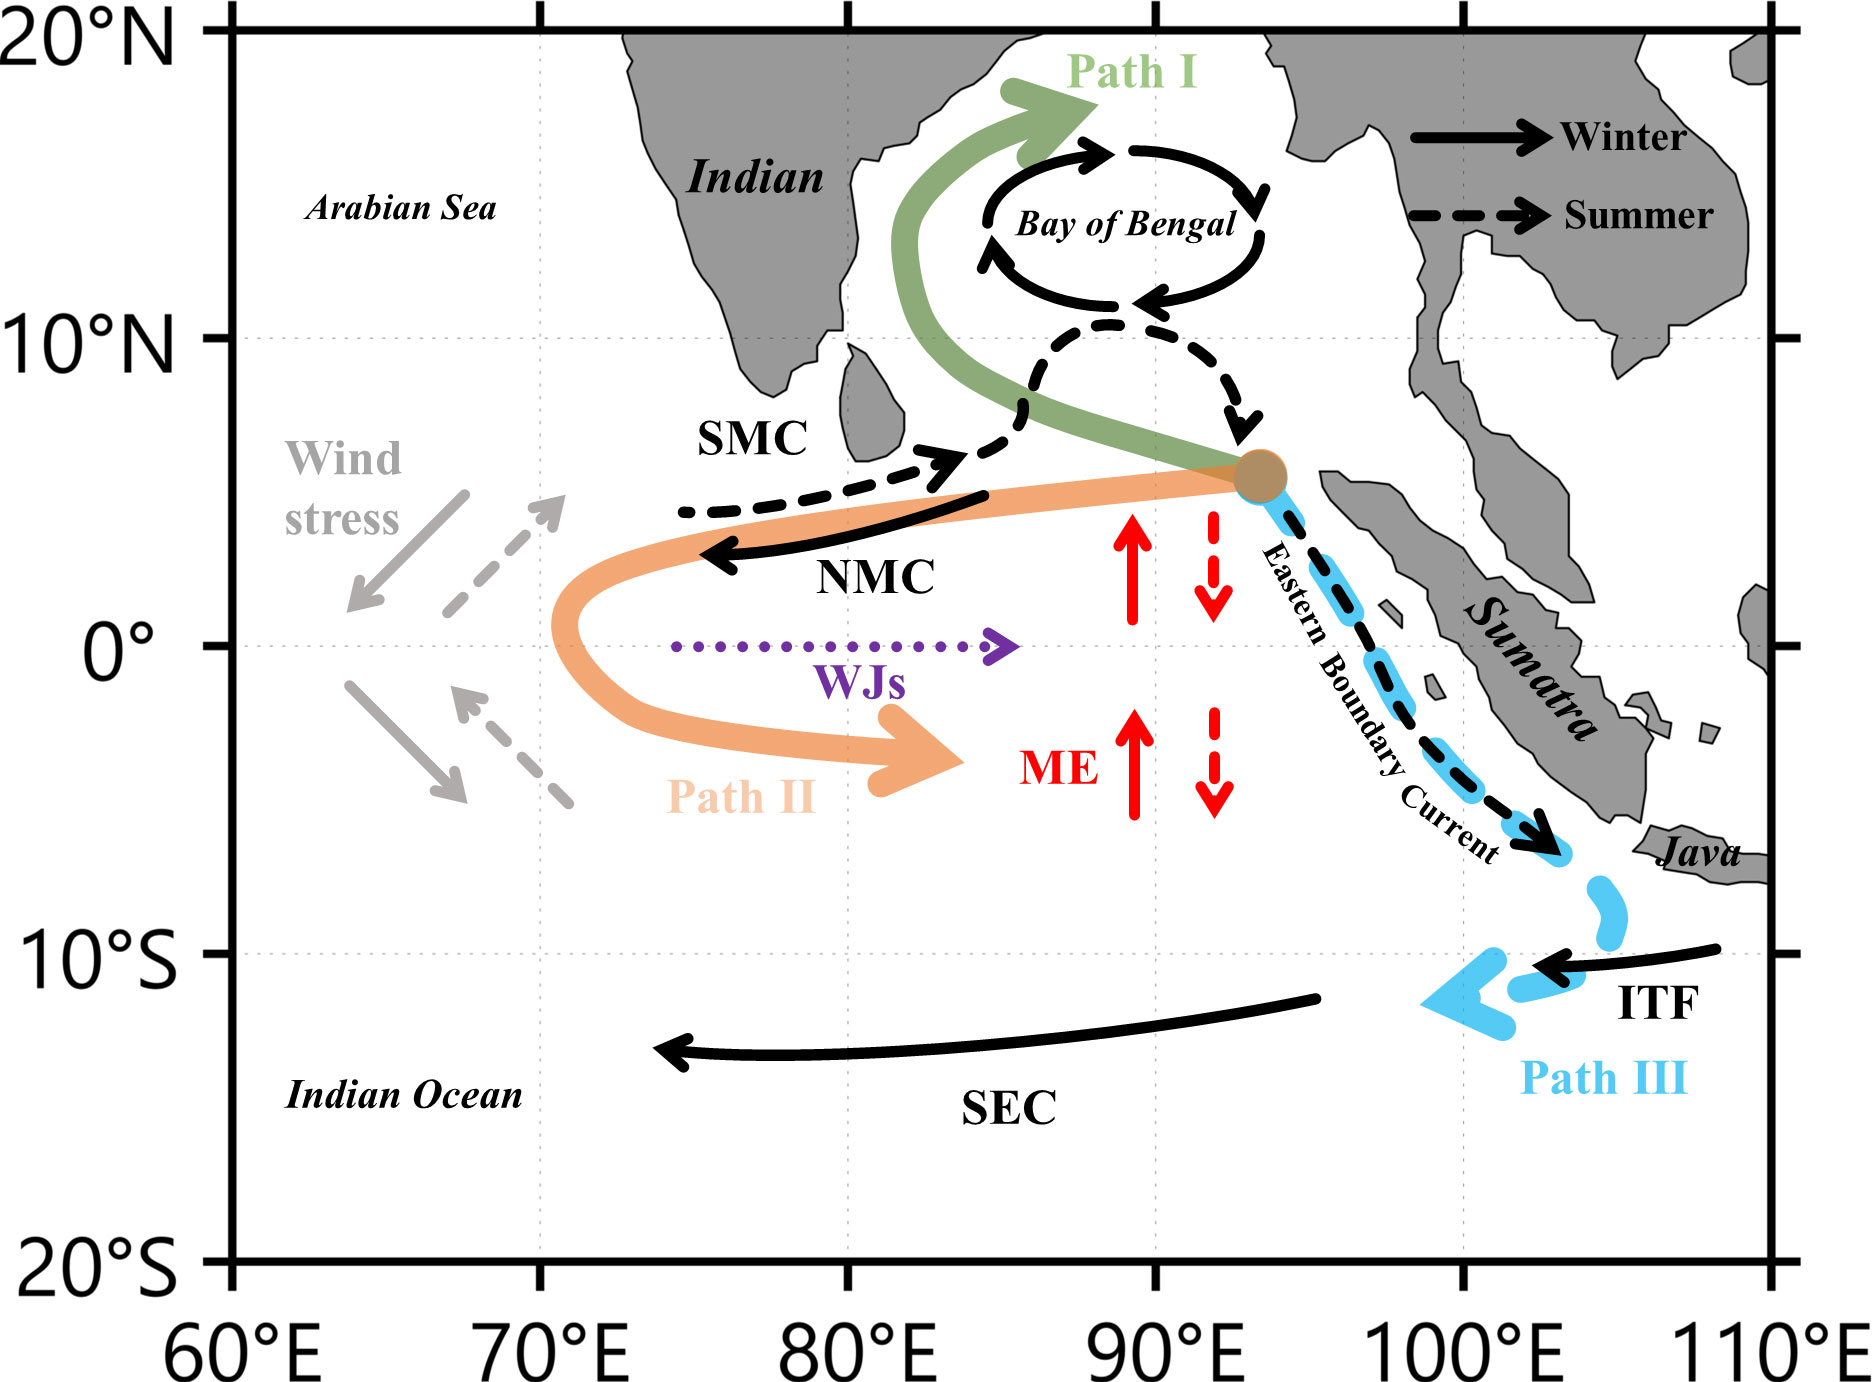
Figure 12 Three typical pathways as described in section 3.2 and the seasonal currents of the EIO. The solid and dashed arrows represent winter and summer, respectively. The red (ME) and gray arrows indicate the directions of meridional Ekman currents and wind stress, respectively. The green, orange, and blue arrows represent path I, path II, and path III, respectively. The purple-dotted arrow indicates the WJs which appear in the monsoon transition seasons. The black arrows south of 10°S are the SEC and ITF which appear throughout the year.
The cross-equatorial transport in the EIO is significant for the balance of salt and heat in the Indian Ocean, and the freshwater and heat obtained from the Northern Hemisphere are carried along the path III to the Southern Hemisphere. This study discloses the dynamic of the cross-equatorial path, and analyses the seasonal variations of the pathways, enriching the research of the CEC in the Indian Ocean. Besides, the freshwater and heat along the pathways contribute to the development of the ecosystem environment, economy, and fisheries in the EIO, especially for the Sumatra-Java coast.
The annual means of the cross-equatorial MST and MHT in the upper EIO are estimated to be -0.06 ×10⁹ (-0.11 ×10⁹) kg·s-1 and -0.20 (-0.38) PW, based on the simulated (observational) data east of 90°E. The estimate is within the range of the previous estimates of the southward cross-equatorial transport (Hsiung et al., 1989; Hastenrath and Greischar, 1993; Garternicht and Schott, 1997; Loschnigg and Webster, 2000; Horii et al., 2013). The estimated MST and MHT from the model are smaller than the observational data. The MST and MHT in the upper EIO show significant seasonal variability north of the equator: southward from May to September, whereas northward from October to April. On and south of the equator, southward MST and MHT occur throughout the year except in winter, when significant northward transports of salt and heat are associated with the northeast monsoon. The seasonal variability of MST and MHT is found significantly correlated with the surface Ekman transport seasonality in the Northern Hemisphere, whereas insignificantly correlated with the Ekman transports in the south, suggesting strong impact of the surface Ekman transports in the north. The southward MHT and MST suggest upwelling and overturning circulation in the North Indian Ocean, the investigation of which is postponed to a later study.
Data availability statement
The original contributions presented in the study are included in the article/supplementary material. Further inquiries can be directed to the corresponding authors.
Author contributions
ZZ: writing, mapping, and data processing. JW: analysis, editing, and project administration. JH: supervision. DY: methodology, review, and funding acquisition. KW: data collection. All authors contributed to the article and approved the submitted version.
Funding
This study is supported by National Key R&D Program of China (2020YFA0608800, 2019YFA0606702, 2019YFC1509102), NSFC (41720104008, 91858204), Laoshan Laboratory (No.2022LSL010304-4), the Strategic Priority Research Program of the Chinese Academy of Sciences (Grant No. XDB42000000). J. Wang is supported by the NSFC (41776011). D. Yuan is supported by the “Taishan Scholar Project” of the Shandong province and by the “Kunpeng Outstanding Scholar Program” of the FIO/MNR of China.
Conflict of interest
The authors declare that the research was conducted in the absence of any commercial or financial relationships that could be construed as a potential conflict of interest.
Publisher’s note
All claims expressed in this article are solely those of the authors and do not necessarily represent those of their affiliated organizations, or those of the publisher, the editors and the reviewers. Any product that may be evaluated in this article, or claim that may be made by its manufacturer, is not guaranteed or endorsed by the publisher.
References
Benshila R., Durand F., Masson S., Bourdallé-Badie R., de Boyer Montégut C., Papa F., et al. (2014). The upper bay of Bengal salinity structure in a high-resolution model. Ocean. Model. 74, 36–52. doi: 10.1016/j.ocemod.2013.12.001
Cheng Y., Putrasahan D., Beal L., Kirtman B. (2016). Quantifying agulhas leakage in a high-resolution climate model. J. Clim. 29 (19), 6881–6892. doi: 10.1175/JCLI-D-15-0568.1
Chen G., Han W., Li Y., McPhaden M. J., Chen J., Wang W., et al. (2017). Strong intraseasonal variability of meridional currents near 5 n in the Eastern Indian ocean: Characteristics and causes. J. Phys. Oceanogr. 47 (5), 979–998. doi: 10.1175/JPO-D-16-0250.1
Chen G., Han W., Wang D., Zhang L., Chu X., He Y., et al. (2022). Seasonal structure and interannual variation of the south equatorial current in the Indian ocean. J. Geophys. Res. Ocean 127 (11). doi: 10.1029/2022JC018969
Chirokova G., Webster P. J. (2006). Interannual variability of Indian ocean heat transport. J. Clim. 19 (6), 1013–1031. doi: 10.1175/JCLI3676.1
Clarke A. J., Liu X. (1993). Observations and dynamics of semiannual and annual sea levels near the eastern equatorial Indian ocean boundary. J. Phys. Oceanogr. 23 (2), 386–399. doi: 10.1175/1520-0485(1993)023<0386:oadosa>2.0.co;2
Clarke A. J., Liu X. (1994). Interannual sea level in the northern and eastern Indian ocean. J. Phys. Oceanogr. 24 (6), 1224–1235. doi: 10.1175/1520-0485(1994)024<1224:ISLITN>2.0.CO;2
Dai A., Trenberth K. E. (2002). Estimates of freshwater discharge from continents: Latitudinal and seasonal variations. J. Hydrometeorol. 3 (6), 660–687. doi: 10.1175/1525-7541(2002)003<0660:EOFDFC>2.0.CO;2
Garternicht U., Schott F. (1997). Heat fluxes of the Indian ocean from a global eddy-resolving model. J. Geophys. Res. Ocean 102 (C9), 21147–21159. doi: 10.1029/97JC01585
Gonaduwage L. P., Chen G., McPhaden M. J., Priyadarshana T., Huang K., Wang D. (2019). Meridional and zonal eddy-induced heat and salt transport in the bay of Bengal and their seasonal modulation. J. Geophys. Res. Ocean 124 (11), 8079–8101. doi: 10.1029/2019JC015124
Gopalakrishna V. V., Johnson Z., Salgaonkar G., Nisha K., Rajan C. K., Rao R. R. (2005). Observed variability of sea surface salinity and thermal inversions in the Lakshadweep Sea during contrast monsoons. Geophys. Res. Lett. 32 (18). doi: 10.1029/2005GL023280
Gordon A. L., Ma S., Olson D. B., Hacker P., Ffield A., Talley L. D., et al. (1997). Advection and diffusion of Indonesian throughflow water within the Indian ocean south equatorial current. Geophys. Res. Lett. 24 (21), 2573–2576. doi: 10.1029/97GL01061
Han W., McCreary J. J.P. (2001). Modeling salinity distributions in the Indian ocean. J. Geophys. Res. Ocean 106 (C1), 859–877. doi: 10.1029/2000JC000316
Han W., McCreary J. P. Jr., Anderson D. L. T., Mariano A. J. (1999). Dynamics of the eastern surface jets in the equatorial Indian ocean. J. Phys. Oceanogr. 29 (9), 2191–2209. doi: 10.1175/1520-0485(1999)029<2191:DOTESJ>2.0.CO;2
Hansen D. V., Poulain P. M. (1996). Quality control and interpolations of WOCE-TOGA drifter data. J. Atmos. Ocean. Technol. 13 (4), 900–909. doi: 10.1175/1520-0426(1996)013<0900:QCAIOW>2.0.CO;2
Han W., Vialard J., McPhaden M. J., Lee T., Masumoto Y., Feng M., et al. (2014). Indian Ocean decadal variability: A review. Bull. Am. Meteorol. Soc 95 (11), 1679–1703. doi: 10.1175/BAMS-D-13-00028.1
Hastenrath S., Greischar L. (1993). The monsoonal heat budget of the hydrosphere-atmosphere system in the Indian ocean sector. J. Geophys. Res. Ocean 98 (C4), 6869–6881. doi: 10.1029/92JC02956
Horii T., Mizuno K., Nagura M., Miyama T., Ando K. (2013). Seasonal and interannual variation in the cross-equatorial meridional currents observed in the eastern Indian ocean. J. Geophys. Res. Ocean 118 (12), 6658–6671. doi: 10.1002/2013JC009291
Hormann V., Centurioni L. R., Gordon A. L. (2019). Freshwater export pathways from the bay of Bengal. Deep. Sea. Res. 2. Top. Stud. Oceanogr. 168, 104645. doi: 10.1016/j.dsr2.2019.104645
Hsiung J. (1985). Estimates of global oceanic meridional heat transport. J. Phys. Oceanogr. 15 (11), 1405–1413. doi: 10.1175/1520-0485(1985)015<1405:EOGOMH>2.0.CO;2
Hsiung J., Newell R. E., Houghtby T. (1989). The annual cycle of oceanic heat storage and oceanic meridional heat transport. Q. J. R. Meteorol. Soc 115 (485), 1–28. doi: 10.1002/qj.49711548502
Jensen T. G. (2001). Arabian Sea And bay of Bengal exchange of salt and tracers in an ocean model. Geophys. Res. Lett. 28 (20), 3967–3970. doi: 10.1029/2001GL013422
Jensen T. G. (2003). Cross-equatorial pathways of salt and tracers from the northern Indian ocean: Modelling results. Deep. Sea. Res. 2. Top. Stud. Oceanogr. 50 (12-13), 2111–2127. doi: 10.1016/S0967-0645(03)00048-1
Kourafalou V. H., Androulidakis Y. S., Kang H., Smith R. H., Valle-Levinson A. (2018). Physical connectivity between pulley ridge and dry tortugas coral reefs under the influence of the loop Current/Florida current system. Prog. Oceanogr. 165, 75–99. doi: 10.1016/j.pocean.2018.05.004
L'Hégaret P., Beal L. M., Elipot S., Laurindo L. (2018). Shallow cross-equatorial gyres of the Indian ocean driven by seasonally reversing monsoon winds. J. Geophys. Res. Ocean 123 (12), 8902–8920. doi: 10.1029/2018JC014553
Laurindo L. C., Mariano A. J., Lumpkin R. (2017). An improved near-surface velocity climatology for the global ocean from drifter observations. Deep. Sea. Res. 1. Oceanogr. Res. Pap. 124, 73–92. doi: 10.1016/j.dsr.2017.04.009
Lee T. (2004). Decadal weakening of the shallow overturning circulation in the south Indian ocean. Geophys. Res. Lett. 31 (18). doi: 10.1029/2004GL020884
Lee T., Marotzke J. (1997). Inferring meridional mass and heat transports of the Indian ocean by fitting a general circulation model to climatological data. J. Geophys. Res. Ocean 102 (C5), 10585–10602. doi: 10.1029/97JC00464
Lee T., Marotzke J. (1998). Seasonal cycles of meridional overturning and heat transport of the Indian ocean. J. Phys. Oceanogr. 28 (5), 923–943. doi: 10.1175/1520-0485(1998)028<0923:SCOMOA>2.0.CO;2
Loschnigg J., Webster P. J. (2000). A coupled ocean–atmosphere system of SST modulation for the Indian ocean. J. Clim. 13 (19), 3342–3360. doi: 10.1175/1520-0442(2000)013<3342:ACOASO>2.0.CO;2
Lumpkin R., Centurioni L. (2019). Global drifter program quality-controlled 6-hour interpolated data from ocean surface drifting buoys. NOAA national centers for environmental information. Dataset. doi: 10.25921/7ntx-z961
Lumpkin R., Johnson G. C. (2013). Global ocean surface velocities from drifters: Mean, variance, El niño–southern oscillation response, and seasonal cycle. J. Geophys. Res. Ocean 118 (6), 2992–3006. doi: 10.1002/jgrc.20210
Lumpkin R., Pazos. M. (2007). “Measuring surface currents with surface velocity program drifters: The instrument, its data and some recent results,” in Lagrangian Analysis and prediction of coastal and ocean dynamics. Eds. Griffa A., Kirwan A. D., Mariano A. J., Ozgokmen T., Rossby T. (Cambridge University Press), 39–67. doi: 10.1017/CBO9780511535901.003
Marshall J., Adcroft A., Hill C., Perelman L., Heisey C. (1997). A finite-volume, incompressible navier stokes model for studies of the ocean on parallel computers. J. Geophys. Res. Ocean 102 (C3), 5753–5766. doi: 10.1029/96JC02775
Miyama T., McCreary J. P. Jr., Jensen T. G., Loschnigg J., Godfrey S., Ishida A. (2003). Structure and dynamics of the Indian-ocean cross-equatorial cell. Deep. Sea. Res. 2. Top. Stud. Oceanogr. 50 (12-13), 2023–2047. doi: 10.1016/S0967-0645(03)00044-4
Paris C. B., Helgers J., Van Sebille E., Srinivasan A. (2013). Connectivity modeling system: A probabilistic modeling tool for the multi-scale tracking of biotic and abiotic variability in the ocean. Environ. Modell. Soft. 42, 47–54. doi: 10.1016/j.envsoft.2012.12.006
Peña-Izquierdo J., van Sebille E., Pelegrí J. L., Sprintall J., Mason E., Llanillo P. J., et al. (2015). Water mass pathways to the north Atlantic oxygen minimum zone. J. Geophys. Res. Ocean 120 (5), 3350–3372. doi: 10.1002/2014JC010557
Prasanna Kumar S., Narvekar J., Kumar A., Shaji C., Anand P., Sabu P., et al. (2004). Intrusion of the bay of Bengal water into the Arabian Sea during winter monsoon and associated chemical and biological response. Geophys. Res. Lett. 31 (15). doi: 10.1029/2004GL020247
Qu T., Meyers G. (2005). Seasonal variation of barrier layer in the southeastern tropical Indian ocean. J. Geophys. Res. Ocean 110 (C11). doi: 10.1029/2004JC002816
Rao R. R., Sivakumar R. (2003). Seasonal variability of sea surface salinity and salt budget of the mixed layer of the north Indian ocean. J. Geophys. Res. Ocean 108 (C1), 9–1. doi: 10.1029/2001JC000907
Schott F. A., Dengler M., Schoenefeldt R. (2002). The shallow overturning circulation of the Indian ocean. Prog. Oceanogr. 53 (1), 57–103. doi: 10.1016/S0079-6611(02)00039-3
Schott F. A., McCreary J. J.P. (2001). The monsoon circulation of the Indian ocean. Prog. Oceanogr. 51 (1), 1–123. doi: 10.1016/S0079-6611(01)00083-0
Sengupta D., Bharath Raj G. N., Shenoi S. S. C. (2006). Surface freshwater from bay of Bengal runoff and Indonesian throughflow in the tropical Indian ocean. Geophys. Res. Lett. 33 (22). doi: 10.1029/2006GL027573
Shankar D., Vinayachandran P. N., Unnikrishnan A. S. (2002). The monsoon currents in the north Indian ocean. Prog. Oceanogr. 52 (1), 63–120. doi: 10.1016/S0079-6611(02)00024-1
Shetye S. R., Gouveia A. D., Shankar D., Shenoi S. S. C., Vinayachandran P. N., Sundar D., et al. (1996). Hydrography and circulation in the western bay of Bengal during the northeast monsoon. J. Geophys. Res. Ocean 101 (C6), 14011–14025. doi: 10.1029/95JC03307
Song Q., Gordon A. L. (2004). Significance of the vertical profile of the Indonesian throughflow transport to the Indian ocean. Geophys. Res. Lett. 31 (16). doi: 10.1029/2004GL020360
Stramma L., Fischer J., Schott F. (1996). The flow field off southwest India at 8N during the southwest monsoon of august 1993. J. Mar. Res. 54 (1), 55–72. doi: 10.1357/0022240963213448
Tamsitt V., Drake H. F., Morrison A. K., Talley L. D., Dufour C. O., Gray A. R., et al. (2017). Spiraling pathways of global deep waters to the surface of the southern ocean. Nat. Commun. 8 (1), 1–10. doi: 10.1038/s41467-017-00197-0
Vinayachandran P. N., Kurian J. (2007). Hydrographic observations and model simulation of the bay of Bengal freshwater plume. Deep. Sea. Res. 1. Oceanogr. Res. Pap. 54 (4), 471–486. doi: 10.1016/j.dsr.2007.01.007
Wacongne S., Pacanowski R. (1996). Seasonal heat transport in a primitive equations model of the tropical Indian ocean. J. Phys. Oceanogr. 26 (12), 2666–2699. doi: 10.1175/1520-0485(1996)026<2666:SHTIAP>2.0.CO;2
Wang J. (2017). Observational bifurcation of wyrtki jets and its influence on the salinity balance in the eastern Indian ocean. Atmos. Ocean. Sci. Lett. 10 (1), 36–43. doi: 10.1080/16742834.2017.1239506
Wang Y., McPhaden M. J. (2017). Seasonal cycle of cross-equatorial flow in the central Indian ocean. J. Geophys. Res. Ocean 122 (5), 3817–3827. doi: 10.1002/2016JC012537
Wijffels S., Meyers G. (2004). An intersection of oceanic waveguides: Variability in the Indonesian throughflow region. J. Phys. Oceanogr. 34 (5), 1232–1253. doi: 10.1175/1520-0485(2004)034<1232:AIOOWV>2.0.CO;2
Wijffels S. E., Meyers G., Godfrey J. S. (2008). A 20-yr average of the Indonesian throughflow: Regional currents and the interbasin exchange. J. Phys. Oceanogr. 38 (9), 1965–1978. doi: 10.1175/2008JPO3987.1
Wu W., Du Y., Qian Y. K., Cheng X., Wang T., Zhang L., et al. (2020). Structure and seasonal variation of the Indian ocean tropical gyre based on surface drifters. J. Geophys. Res. Ocean 125 (5). doi: 10.1029/2019JC015483
Wyrtki K. (1973). An equatorial jet in the Indian ocean. Science. 181 (4096), 262–264. doi: 10.1126/science.181.4096.262
Yu L., Jin X., Weller R. A. (2007). Annual, seasonal, and interannual variability of air–sea heat fluxes in the Indian ocean. J. Clim. 20 (13), 3190–3209. doi: 10.1175/JCLI4163.1
Zhang Y., Du Y. (2012). Seasonal variability of salinity budget and water exchange in the northern Indian ocean from HYCOM assimilation. Chin. J. Oceanol. Limnol. 30 (6), 1082–1092. doi: 10.1007/s00343-012-1284-7
Keywords: cross-equatorial currents, Lagrangian tracer, meridional salt transport, meridional heat transport, Eastern Indian Ocean
Citation: Zhang Z, Wang J, Hao J, Yuan D and Wang K (2023) Surface cross-equatorial pathways of seawater from the Bay of Bengal. Front. Mar. Sci. 10:1101716. doi: 10.3389/fmars.2023.1101716
Received: 18 November 2022; Accepted: 20 January 2023;
Published: 02 February 2023.
Edited by:
Raden Dwi Susanto, University of Maryland, United StatesReviewed by:
Tomoki Tozuka, The University of Tokyo, JapanGengxin Chen, State Key Laboratory of Tropical Oceanography, South China Sea Institute of Oceanology (CAS), China
Copyright © 2023 Zhang, Wang, Hao, Yuan and Wang. This is an open-access article distributed under the terms of the Creative Commons Attribution License (CC BY). The use, distribution or reproduction in other forums is permitted, provided the original author(s) and the copyright owner(s) are credited and that the original publication in this journal is cited, in accordance with accepted academic practice. No use, distribution or reproduction is permitted which does not comply with these terms.
*Correspondence: Dongliang Yuan, dyuan@fio.org.cn; Jing Wang, wangjing@qdio.ac.cn