A vector radiative transfer model for simulating the microwave emissivity of sea foam based on matrix operator method
 Xuchen Jin1,2
  Xianqiang He2,3
  Yan Bai2
  Difeng Wang2 Jianyun Ying4 Qiankun Zhu2 Fang Gong2 Chenghu Zhou1 Delu Pan1,2*
- 1Southern Marine Science and Engineering Guangdong Laboratory (Guangzhou), Guangzhou, Guangdong, China
- 2State Key Laboratory of Satellite Ocean Environment Dynamics, Second Institute of Oceanography, Ministry of Natural Resources, Hangzhou, Zhejiang, China
- 3School of Oceanography, Shanghai Jiao Tong University, Shanghai, China
- 4Laboratory of Ocean Engineer, Second Institute of Oceanography, Ministry of Natural Resources, Hangzhou, Zhejiang, China
Modeling sea foam emissivity is important for microwave remote sensing of the ocean. Based on the matrix-operator method, we propose a vector radiative transfer model (RTM) for the simulation of wave propagation in the foam layer and the sea foam emissivity is then calculated. The RTM simulates the emissivity of a vertically structured foam layer with various water properties. We assess the model simulations under different conditions. It is found that the foam thickness and the void fraction profile could be critical parameters in modeling foam emissivity. The sea foam emissivity could range from 0.2 to 0.3 in our simulations with varying foam thicknesses and void fraction profiles. Then, comparisons were made to experimental data for validation, and our model achieved a good consistency with the different experimental measurements of three previous studies. And it was also found that the modeled emissivity fits the experimental data well using an exponential profile with a small profile shape-control parameter.
1 Introduction
Microwave radiometry is one of the most important methods for observing the oceans. Many crucial physical atmospheric and oceanic properties such as rain rate, sea surface salinity (SSS), and sea surface temperature (SST) are measured by microwave sensors (Chelton et al., 2000; Kerr et al., 2010; Skofronick-Jackson et al., 2017). These properties play a significant role in physical circulations, ecosystem dynamics, identifying different water masses, and detecting changes in the global water cycle. However, the measurement accuracy is affected by many factors, including sea surface roughness (Yueh et al., 1994; Yueh, 1997; Voronovich, 2013), atmospheric emission and attenuation (Liebe, 1989; Clough et al., 2005; Rothman et al., 2013), extraterrestrial radiations (Le Vine and Abraham, 2004), and sea foam (Rose et al., 2002; Reul and Chapron, 2003; Anguelova and Gaiser, 2013). This indicates that successful satellite observations require an accurate model of the microwave radiative transfer processes for better understanding of these variables affecting brightness temperature (TB) and developing calibration and correction methods for retrieval of atmospheric and oceanic properties.
Wave Propagation in the foam layer has received significant interest due to its strong signature in various microwave channels. Besides, sea foam is also involved in many coupled atmospheric-oceanic processes, including the gas exchange process (Wanninkhof et al., 2009), sea spray aerosol production (Blanchard, 1963; Lewis et al., 2004; De Leeuw et al., 2011), and ocean surface albedo (Kokhanovsky, 2004). The ratio of the foam-covered sea surface to seawater surface i.e., foam coverage is the critical parameter to understand these processes. The development of sea foam emissivity model provides a method for estimating foam coverage using the variations of sea surface emissivity (Hwang, 2011; Anguelova and Bettenhausen, 2019; Hwang et al., 2019). Thus, devising an independent correction scheme for the TB measurement of foam-covered sea surfaces using an accurate sea foam emissivity model is necessary.
Since the early 2000s, various collections of new experimental data of sea foam (Rose et al., 2002; Camps et al., 2005; Padmanabhan et al., 2006) have been available, and several sea foam models have been developed. For example, Guo et al. (2001) and Chen et al. (2003) proposed foam emissivity models based on dense-medium radiative transfer (DMRT) theory, and the wave scattering and emission were solved using the quasi-crystalline approximation. Anguelova and Gaiser (2013); Wei et al. (2014) and Yin et al. (2016) employed the incoherent approach for sea foam emissivity determination. Reul and Chapron (2003); Raizer (2007) and Plant and Irisov (2017) modeled the macroscopic characteristics of sea foam under different meteorological and oceanographic conditions, including the vertical structure of sea foam, distribution of the foam thickness, and void fraction at the top of sea foam. However, most of these models were developed considering a specific condition and cannot meet the simulation needs under various seawater and foam conditions (for example, different water temperatures, frequencies, and foam thicknesses).
This paper develops a new sea foam emissivity model at microwave frequencies using radiative transfer theory and the matrix-operator method. This model computes the TBs for various seawater properties at given observation angles. The vertical profile of the void fraction is presented by an exponential function to match the bubble distribution inside the foam layer. The simulated TBs are then compared to experimental measurements for validation. In Section II, the basic definitions and assumptions of our model, together with formulations of the radiative transfer processes are described. The model simulations are presented in Section III, and validations of the present model are illustrated in Section IV. Conclusions and discussions for the model results are finally provided in Section V.
2 Development of the radiative transfer model for sea foam emissivity
2.1 Model assumption
Modeling the emissivity of foam-covered sea surfaces could be complicated due to the uncertainty of the foam layer properties, such as the top void fraction, void fraction profile, foam thickness, and so on. However, only a few measurements of foam properties were performed, and the reported results show significant differences. For example, the microstructure of bubbles in the interior of the foam layer (i.e., void fraction profile of foam layer) are different in Rose et al. (2002) and Camps et al. (2005), in which the result of Camps et al. (2005) show an apparent trend of void fraction varies with depth while the trend is inconspicuous in Rose et al. (2002). Thus, some assumptions are made for the macroscopic characteristics of the foam layer.
First, as mentioned before, although the void fraction profiles inside the foam layer are quite different among experiments, we assume it has an exponential distribution, as reported in Anguelova and Gaiser (2011). And we assume that the temperature and salinity inside the foam layer do not significantly change as Jessup et al. (1997) used an infrared device to observe the breaking waves and reported that foam thermodynamic temperature is the same as that of the bulk seawater. Considering the upwind and crosswind asymmetry of sea surface emissivity induced by wind-generated rough sea surface, it is reasonable that the emission of the foam-covered sea surface is also azimuthally asymmetric. However, due to the lack of measurements in this aspect and for computational efficiency, we assume that sea foam emission is azimuthally symmetric.
Second, the volume scattering within the foam layer is ignored in this paper since the seawater is heavily absorptive for microwave radiation; the analysis of volume scattering in vertically structured foam layers revealed that in low-frequency microwave channels, the scattering effect in sea foam is weak (Camps et al., 2005; Anguelova and Gaiser, 2012). And we also treat the air–foam and foam–water boundaries as planes rather than rough surfaces. Thus the Fresnel reflectivities are utilized in the present model. Finally, the distributed foam thickness is replaced by the effective average thickness since few relevant measurements and studies are available.
Overall, our model assumptions are listed as follows:
1. The depth profile of the void fraction in sea foam follows an exponential distribution.
2. The water properties of sea foam are uniformly distributed in the vertical direction, i.e., from the bottom to the top of sea foam, the water temperature and salinity remain unchanged.
3. We assume that the emission of sea foam is azimuthally symmetric.
4. The multi-scattering effect of bubbles embedded in the foam layer is ignored in our model.
5. The boundary conditions are of the Fresnel type (namely planar) described with Fresnel reflectivities.
6. The thickness of the foam layer can be described by the effective thickness instead of the distributed foam layer thickness.
2.2 Radiative transfer model for seafoam
As shown in Figure 1, considering thermal emission from a layered medium with particles embedded in a background medium (i.e., seawater), the radiative transfer equation (RTE) describing the radiant field in a layered medium has the following form (Evans and Stephens, 1991; Jin et al., 2020):
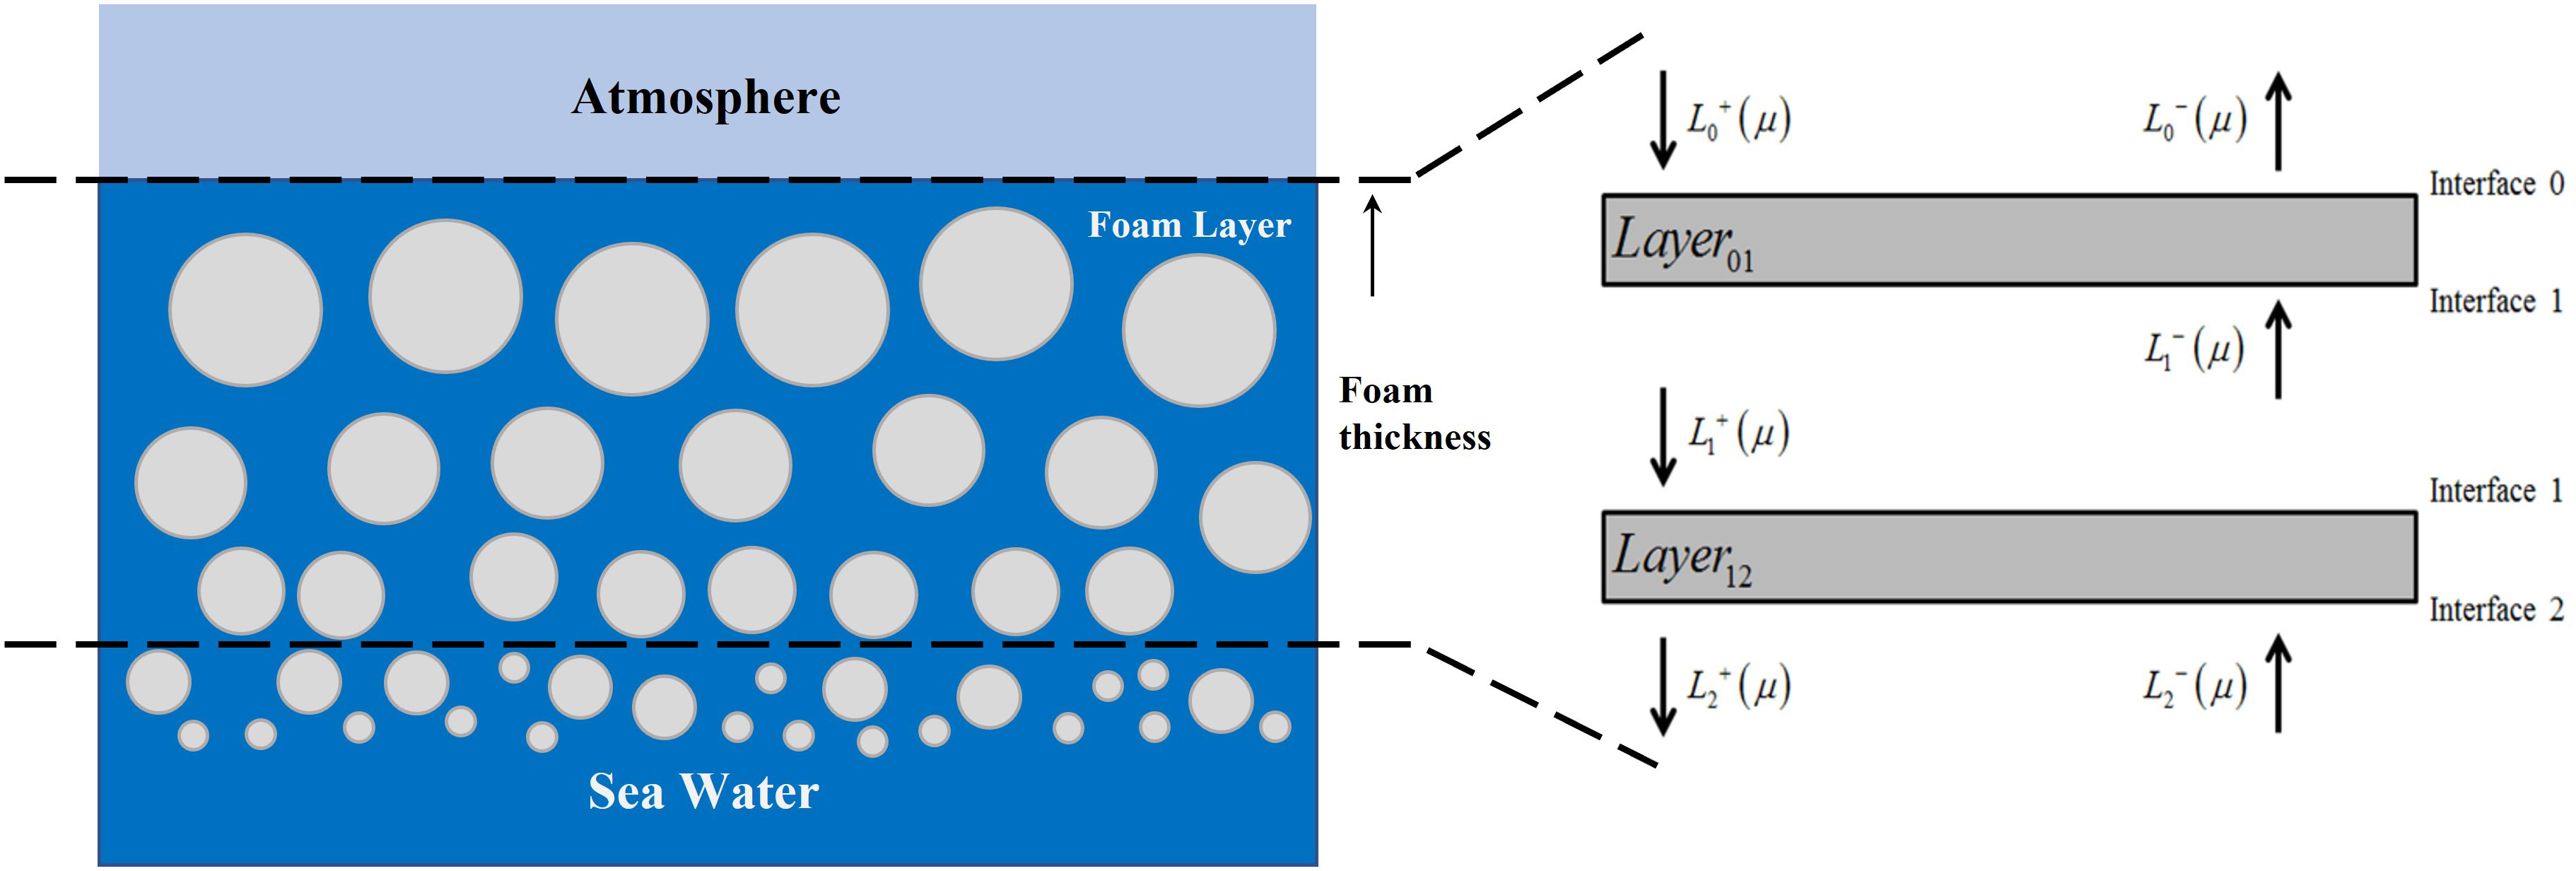
Figure 1 Geometrical configuration for thermal emission from the foam-covered ocean.
where is the Stokes vector consisting of the horizontally polarized intensity () and the vertically polarized intensity (); is the cosine of the zenith angle with a positive sign indicating the downward direction and a negative sign for the upward direction; is the optical depth; is the single scattering albedo; is the Planck function. is the scattering matrix of the medium.
As mentioned in Section 2.1, we only consider the vertical and horizontal polarizations (V-pol and H-pol, respectively) in this paper so that the third and fourth Stokes parameters are discarded. Thus the shape of the rotation matrix is degraded from 4×4 to 2×2. As the emission of sea foam is azimuthally symmetric in our assumption, using the Gaussian-quadrature method, the radiative transfer equation could be rewritten as:
where and are the nodes of the Legendre polynomial of order 2N; is the Gaussian-quadrature weight function. Converting parameters and into matrices, in which the and are the diagonal matrices defined by the form and respectively, (2) could be rewritten as:
where the superscripts ‘+’ and ‘-’ denote the downward and upward directions, respectively. The partial derivative equations (3) and (4) can be discretized as follows:
Thus, the matrices of the reflection, transmission, and internal radiation source can now be defined as
With and being either ‘+’ or ‘-’. According to the matrix operator method [17] and the schematic diagram shown in Figure 1, the propagation of radiant field in the two combined media is subject to the following relationships:
and
In which the transmission coefficients of downward and upward radiant fields for the layer ( and ) and layer ( and ) as well as the reflection coefficients of downward and upward radiant fields for the layer ( , ) and ( , ) are determined. , , and are the internal radiation sources of downward and upward radiant fields for the layers and , respectively. The schematic diagram of the matrix-operator method is shown in Figure 1. And the elements in transmission and internal radiation are:
where is the Kronecker delta function, and subscripts and represent the row and column of the matrix, respectively. Moreover, and are the Planck blackbody functions of the upper and lower layers, respectively.
2.3 Vertical profile of the seafoam properties
In the past decades, several approaches have been utilized to model the vertical variability of sea foam for foam emissivity. Raizer (2007); Anguelova and Gaiser (2011), and Yin et al. (2016) treated foam as a layered medium, in which the void fraction varied with the depth into the foam layer. Thus, the foam layer thickness and void fraction profile are used to model the foam emissivity. Different from previous studies, Guo et al. (2001); Chen et al. (2003), and Zhou et al. (2003) treated the foam as a whole layer and assumed a constant void fraction. They modeled the foam as densely packed spherical air bubbles coated by seawater so that the core of the coated particle is air, and the shell is seawater. Thus the outer and inner radii of the particles are the most significant factors in modeling foam emissivity. In this paper, as shown in Figure 1, we have separated the entire medium into several thin layers. Thus a vertical profile of the void fraction is needed. Following Anguelova and Gaiser (2013), the profile of void fraction is defined as follows:
where is the void fraction, the subscripts ‘top’ and ‘bot’ denote the void fractions at the top and bottom of the foam layer, respectively; m is the parameter that controls the shape of the profile. Generally, the void fraction at the top of the foam layer ( ) should be set at a relatively large value to cover an extensive range of possible void fraction values. It should also be noted that the void fraction profile of an artificially generated foam layer is well stratified (see Figure 3 of Camps et al., 2005). Thus, it is better to use a small profile shape-control parameter (i.e., use a small m value) to ensure consistency with the stratification. In this section, we choose m = 0.01 for comparison. Thus, it is better to use a small profile shape-control parameter (i.e., use a small m value) to ensure consistency with the stratification. In this section, we choose m = 0.01 for comparison.
Based on the void fraction profile as a function of depth, the effective permittivity of the mixed medium using the cubic rule model can be defined as:
where and are the permittivity values of foam and seawater, respectively. In this paper, the permittivity of seawater is calculated using a single Debye equation, and the parameters of the equation developed by Klein and Swift (Klein and Swift, 1977) are adopted. Thus, the optical path and optical depth (τ) are then determined by so that the total loss of radiation can be obtained. As a dense medium, the path of radiation in foam is affected by the refraction angle, which is determined by Snell’s law. According to Ulaby et al. (1981), for radiation with an incidence angle onto a vertically structured foam layer, the refraction angle is
where is the wavenumber of radiation in air; and have the following form:
where is the attenuation factor and is the phase factor, which can be calculated as:
Combining (13)–(15), the optical depth () of foam is then defined as:
Figure 2 shows the void fraction profile of a foam layer with thickness at 2 cm, together with the real and imaginary parts of permittivity as a function of the void fraction at 1.4 GHz with seawater temperature = 20 °C and salinity = 34 psu. For the sake of simplicity and clarity, and are set to 99% and 1%, respectively, as shown in Figure 2. Although it is reasonable that with the increase of depth into foam, the imaginary part of the permittivity increases and the foam layer becomes lossier, the selection of at 1% seems too arbitrary. Thus in this paper, a relatively high value of the void fraction for the lower boundary of the foam layer (i.e., the foam-water boundary), and a relatively low value of the shape-control factor m is set to match the experimental measurements. Besides, a small value of m suggests that the foam layer is well stratified.
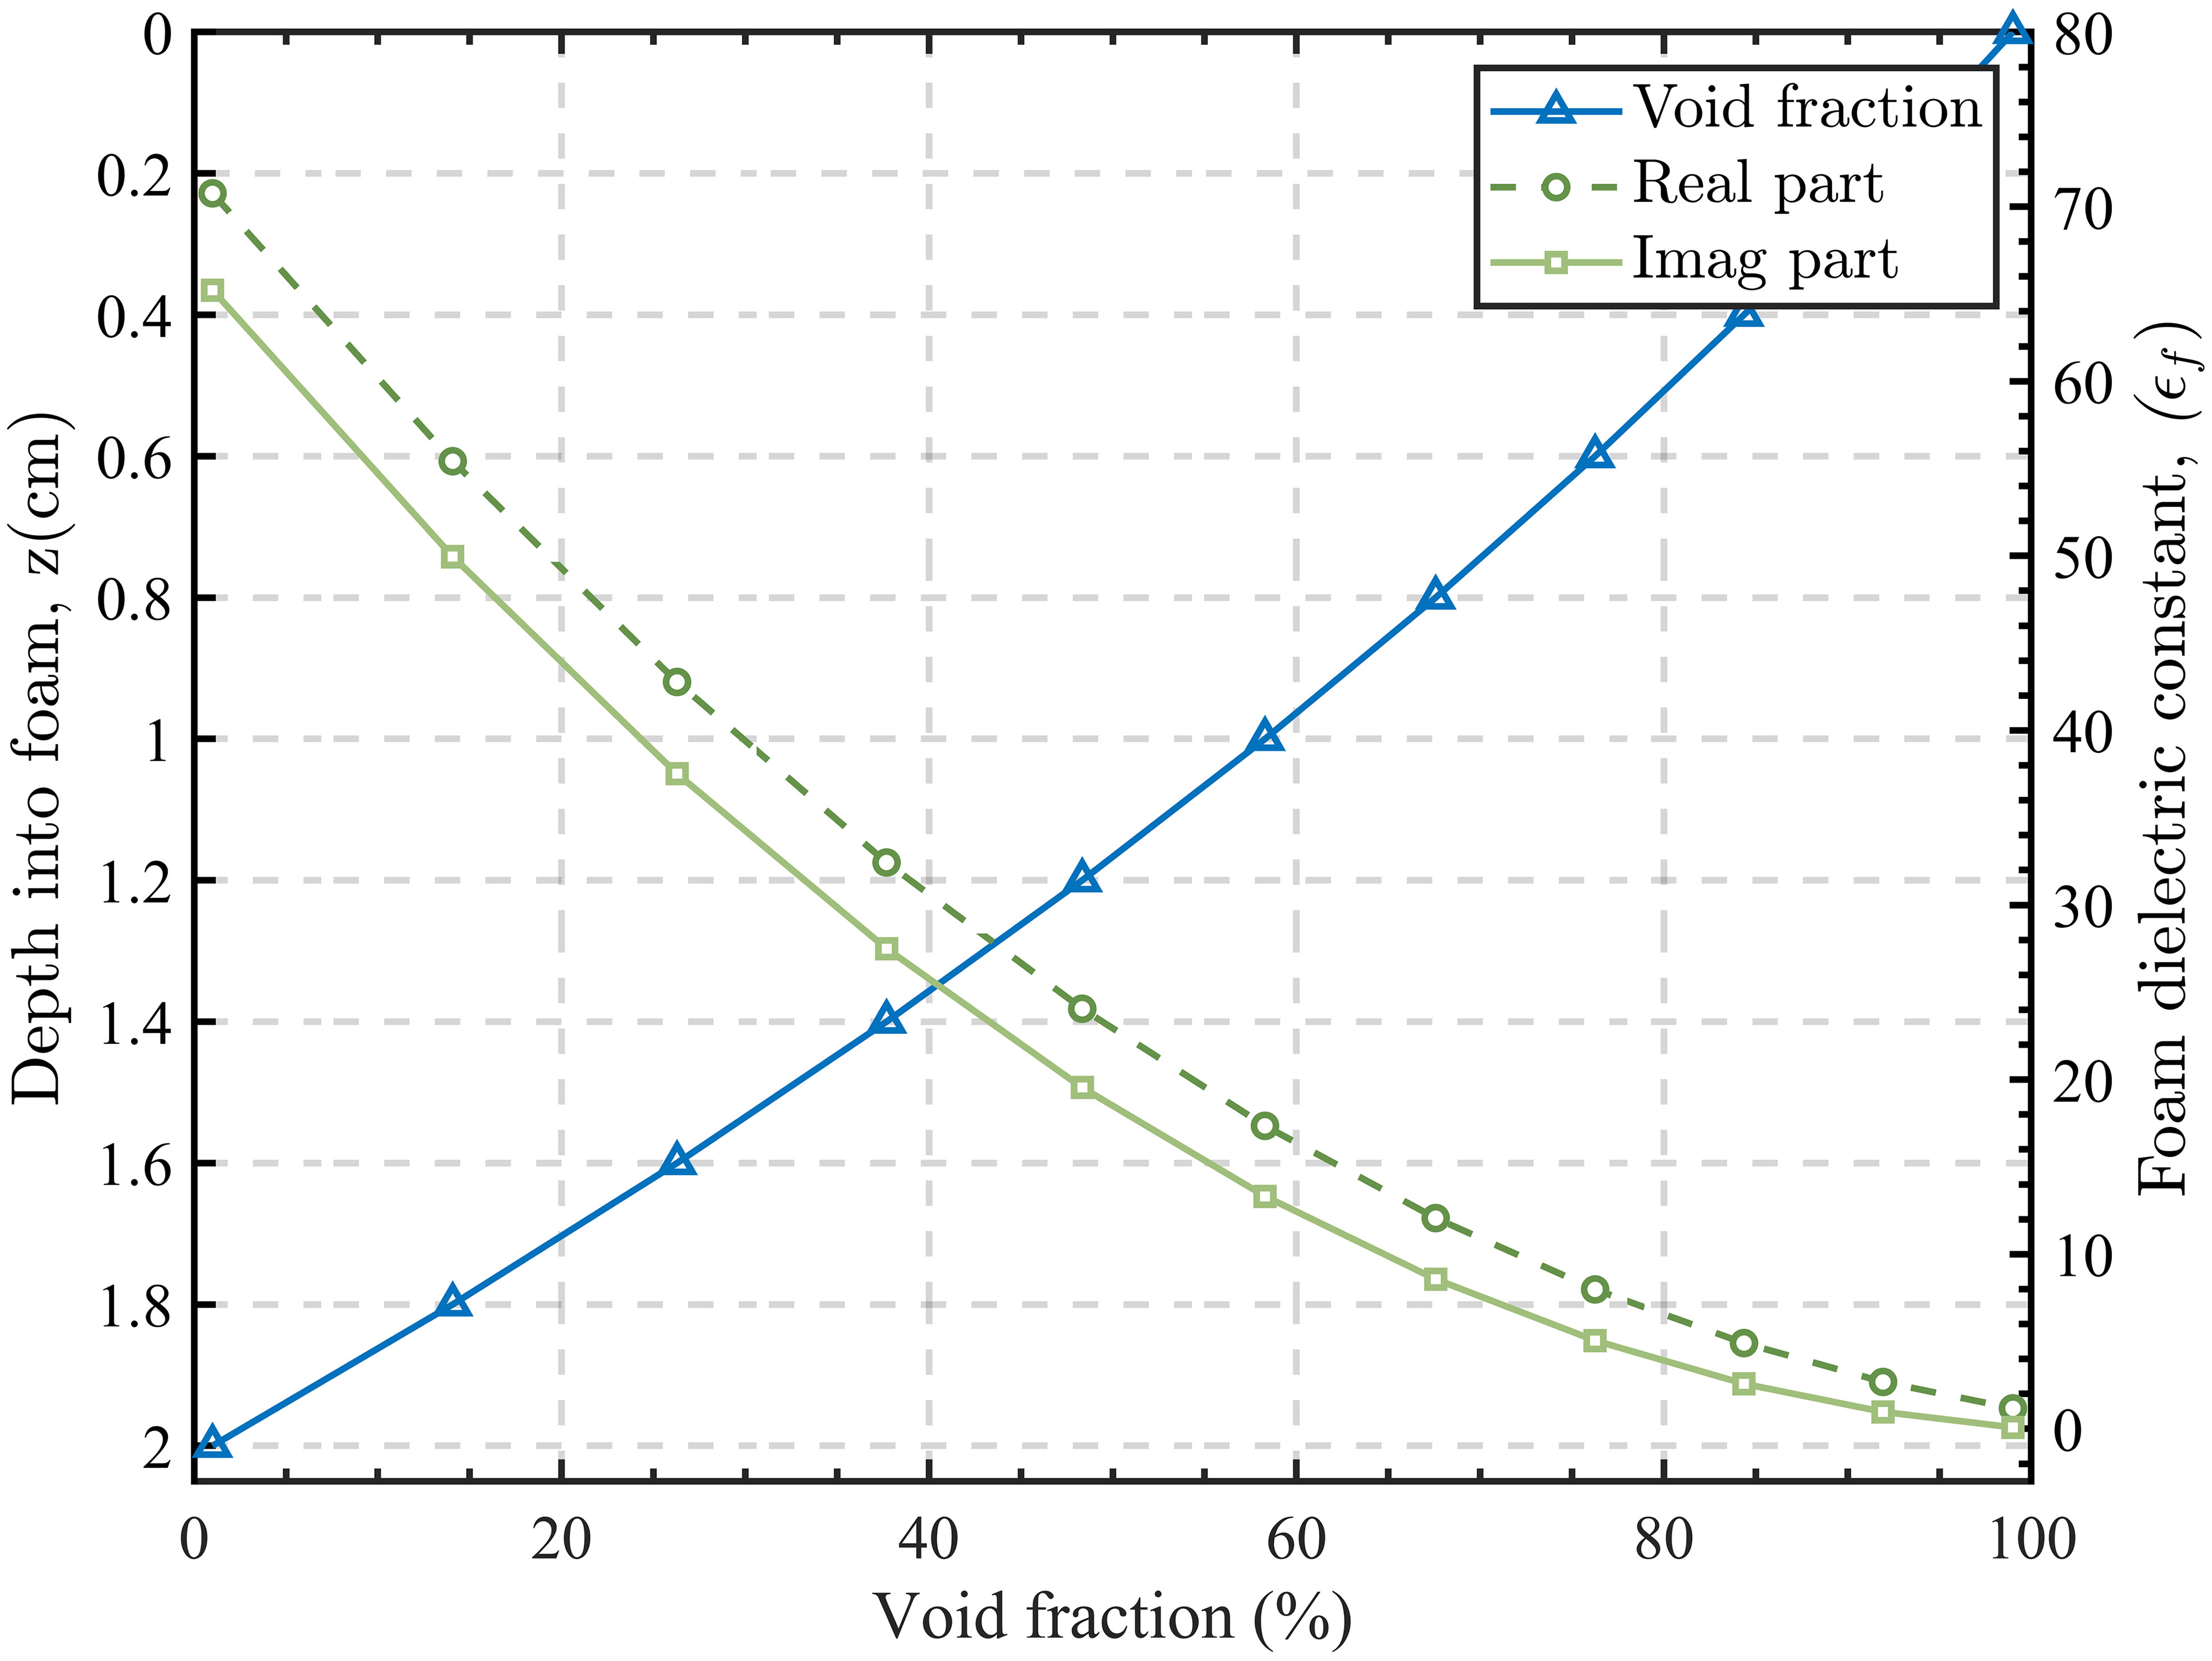
Figure 2 Void fraction profile of the foam layer with thickness z = 2 cm and complex permittivity of sea foam obtained with the refractive mixing rule as a function of the void fraction at 1.4 GHz.
In this paper, as mentioned in Section 2.2, the foam layer is first divided into several thin layers for calculating the matrices of the reflection, transmission, and internal radiation sources and then these layers are combined to obtain the emissivity of the entire foam layer. In addition, we build up a look-up table (LUT) storing the refraction angles to perform the process of calculation. The air–foam and foam–water boundaries are assumed as Fresnel type boundaries so that reflectivities are obtained with Fresnel reflection coefficients.
3 Model simulations
3.1 Dependence of the foam emissivity on the foam thickness
The results of foam emissivity for different foam thicknesses and frequencies are shown in Figure 3. The foam emissivity is presented as a function of incidence angle, and three frequencies (1.4, 10.8, and 36.5 GHz) are demonstrated. It is seen that foam thickness determines the foam emissivity. The foam emissivities increase with the foam thickness for both horizontal and vertical polarizations.
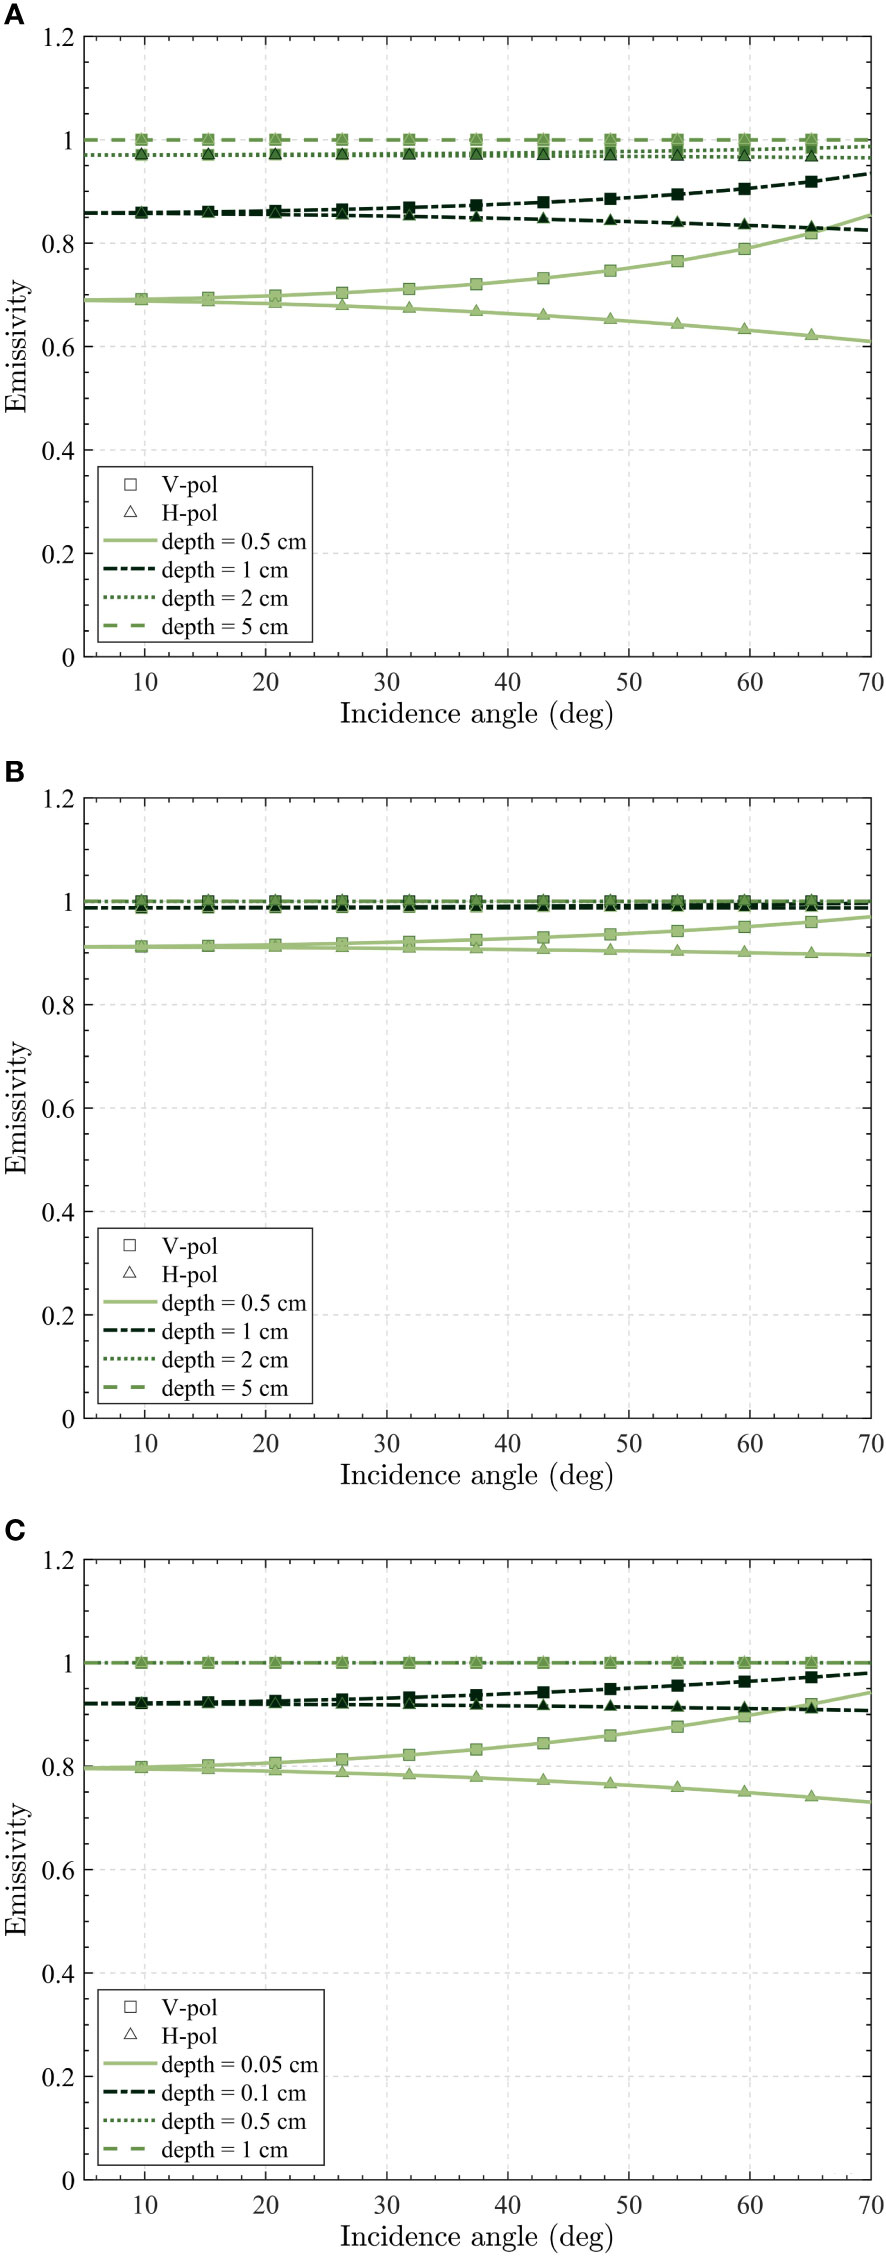
Figure 3 Dependence of foam emissivity on incidence angle at three frequencies: (A) 1.4 GHz; (B) 18.7 GHz; (C) 37 GHz with four different foam layer thicknesses. V-pol (triangle symbols) and H-pol (square symbols).
Figure 3 demonstrates that the emissivity saturation from radiometrically thick foam layers (z = 5 cm for 1.4 GHz in panel a; z = 1 cm for 10.8 GHz in panel b; and z = 0.5 cm for 36.5 GHz in panel c) is preserved for all incidence angles. Similar to seawater, the foam emissivity shows polarization characteristics until saturated. It is also seen that, with the increase of frequency, the foam emissivity tends to become saturated. At 37 GHz, even mechanically thin layers (z = 0.5 cm in Figure 3C, dotted curve) will saturate the emissivity signal. In contrast, foam emissivity resembled that of seawater for typically thin foam layers at relatively low frequencies (1.4 GHz and 10.8 GHz). Despite this, the foam emissivity is high compared to seawater emissivity, even for a thin layer at a low frequency. For example, the foam emissivity is higher than 0.6 when the foam thickness is larger than 0.5 cm at L-band. Consider that the value of foam thickness typically varies from 1 cm to about 4 cm in the ocean (Reul and Chapron, 2003; Anguelova and Gaiser, 2013), and the emissivity of seawater is about 0.3-0.4, the appearance of foam could cause a notable signal enhancement. As such, the impact of foam on satellite observations is severe, especially in regard to SSS remote sensing, in which the sensitivity of the brightness temperature to the water salinity is low (0.2–0.8 K/psu)(Yueh et al., 2001).
3.2 Dependence of the foam emissivity on the shape of the void fraction profile
We find that the shape of the void fraction profile could be another significant factor determining the foam emissivity. In this section, the L-band (1.4 GHz) is chosen for demonstration instead of higher frequencies because the foam emissivity is easier to reach saturation at higher frequencies.
Figure 4 shows the void fraction variation as a function of the depth in a foam layer with thickness z = 1 cm. It is shown that the parameter m determines the shape of the void fraction profile , and the shape of could vary within an extensive range when m is smaller than 1. On the other hand, when m is larger than 1, the shape of closely resembles a linear pattern. This implies that the choice of m could have a significant impact on the foam emissivity. Since few observations have been performed regarding this topic, it is difficult to determine the best choice and needs to be refined in the future.
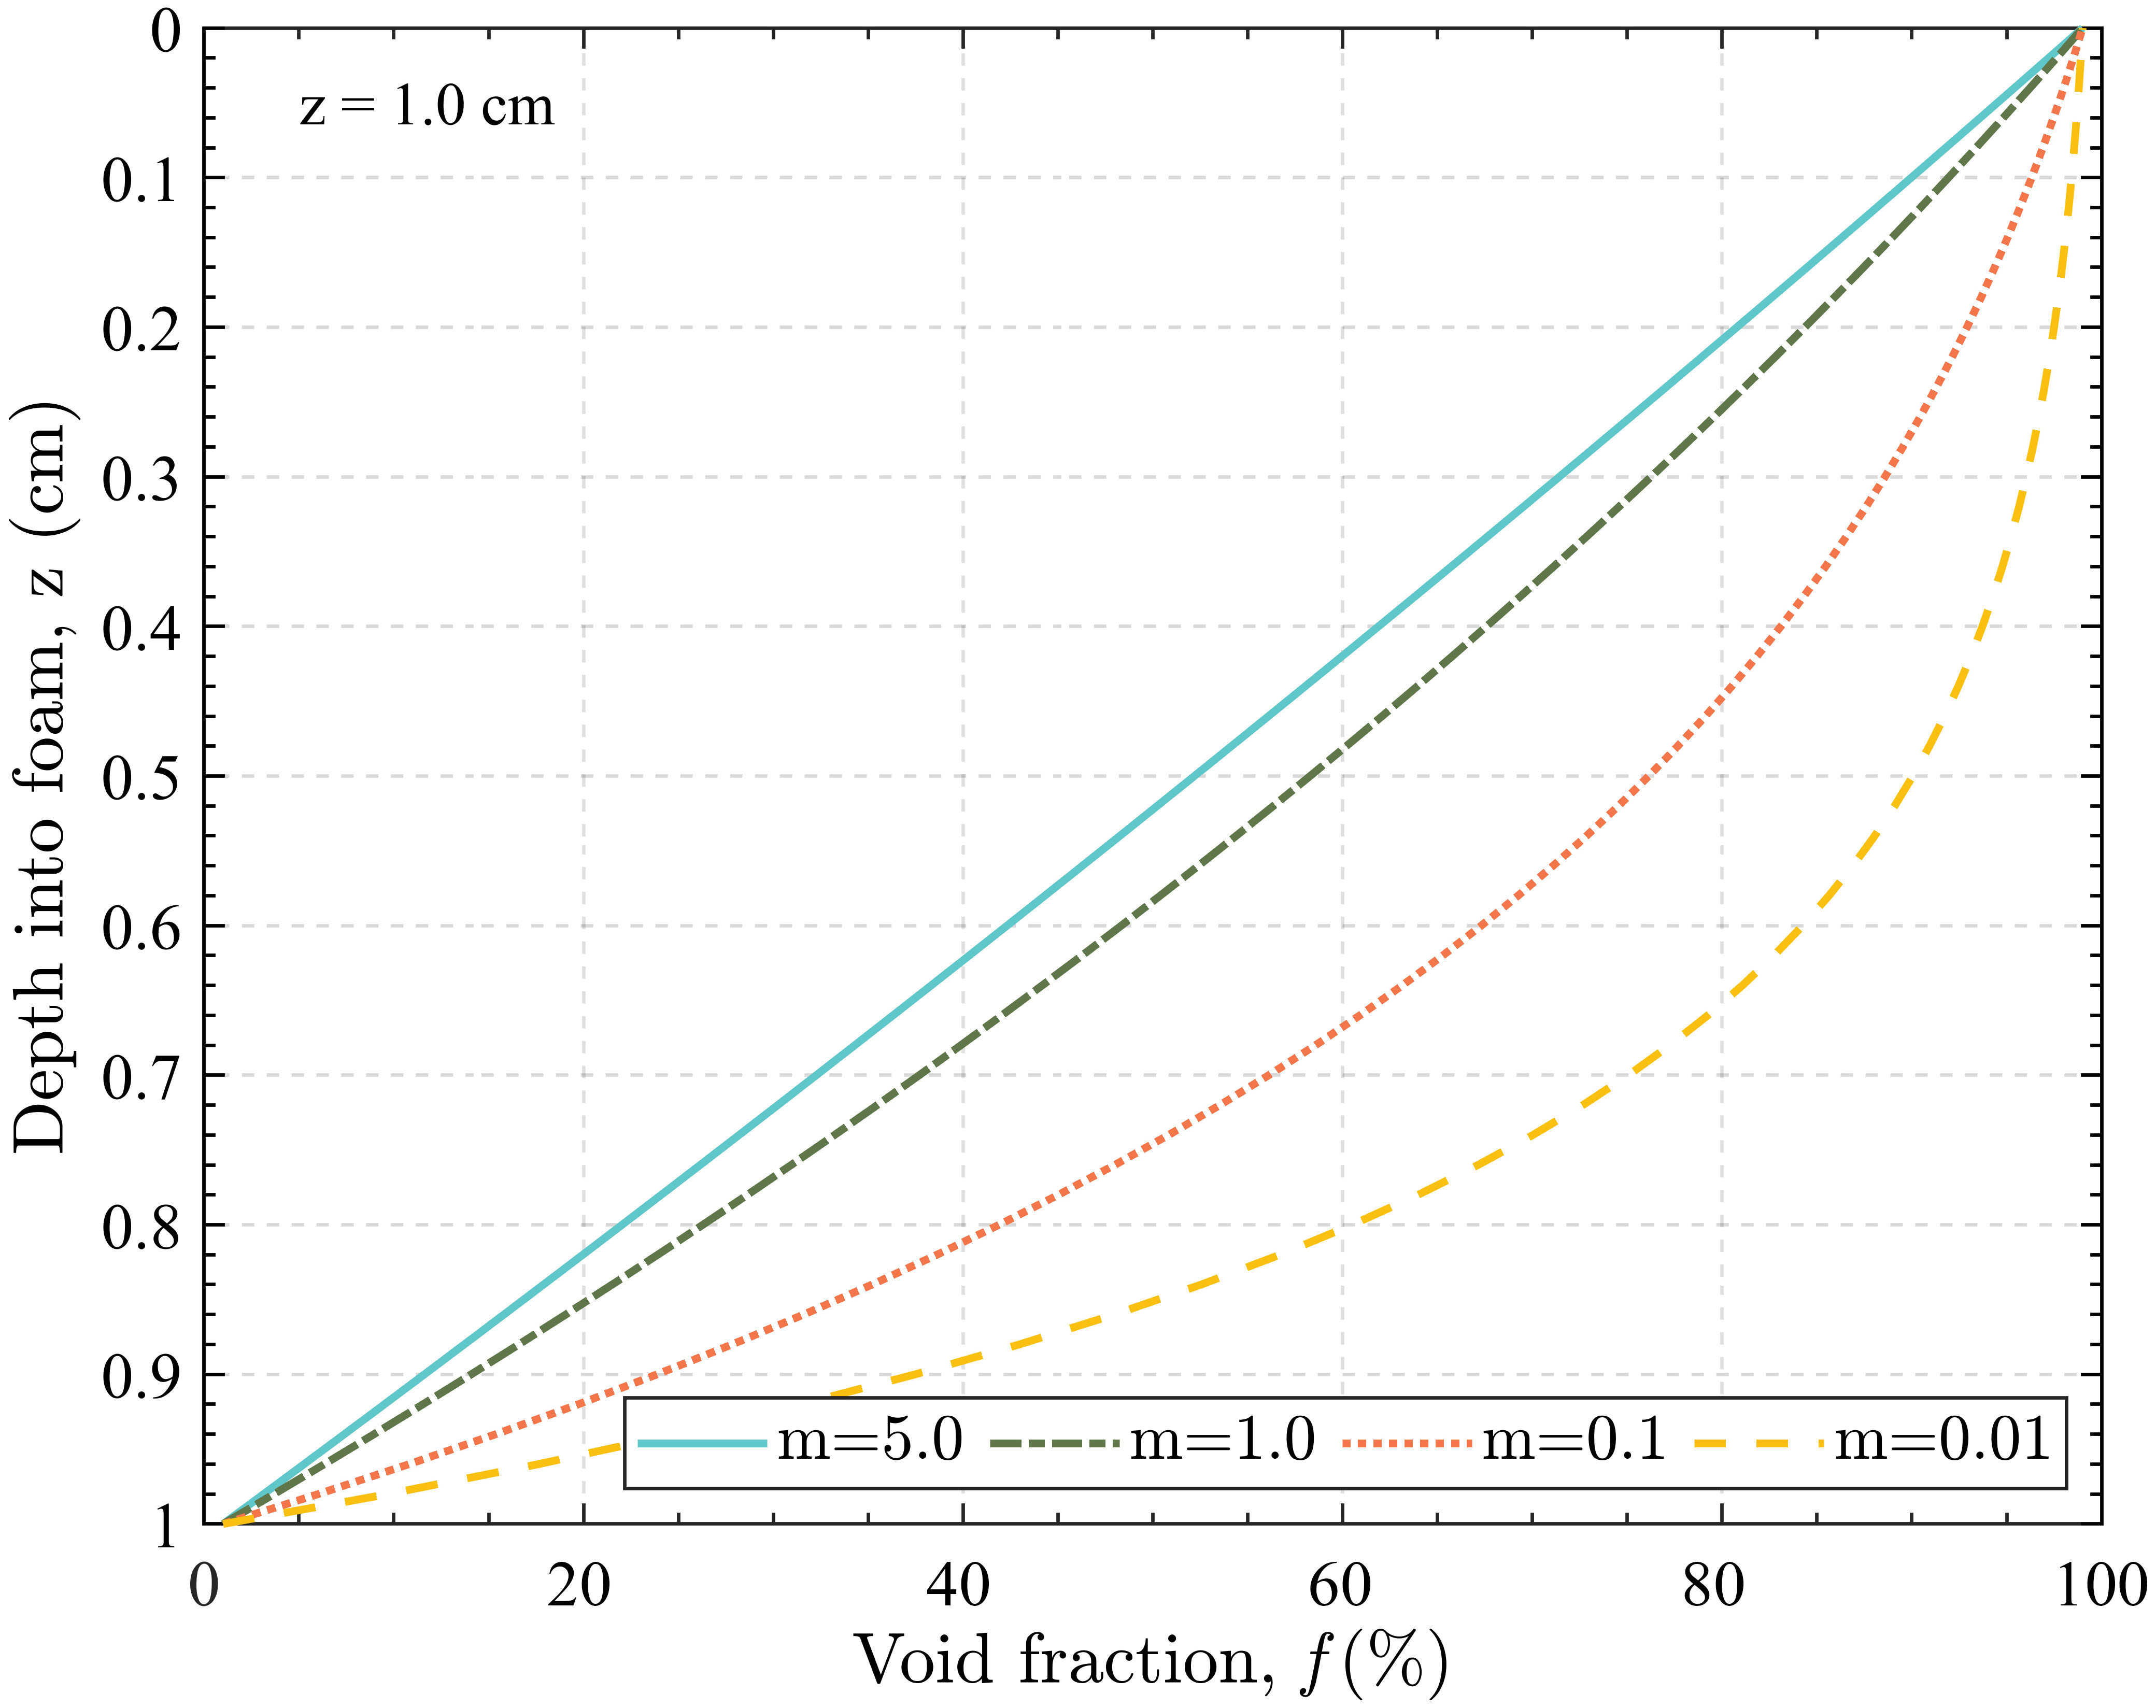
Figure 4 Void fraction profile in foam layer with thickness z = 1 cm.
Figure 5 shows the foam emissivity as a function of the incidence angle for different void fraction profiles at L-band with water temperature = 20 °C, salinity = 34 psu, and foam thickness z = 1 cm. It could be seen that the void fraction profile has a significant impact on foam emissivity. With the shape-control factor m ranging from the lowest value (m = 0.01) to the highest value (m = 5), the foam emissivity varies from 0.68 to 0.88. A small value of m indicates that the foam layer is well stratified so that the upper layer is filled with bubbles. In contrast, a relatively high value of m suggests that the foam layer is well-mixed. Knowing this, when simulating the foam emissivity, m should be carefully selected.
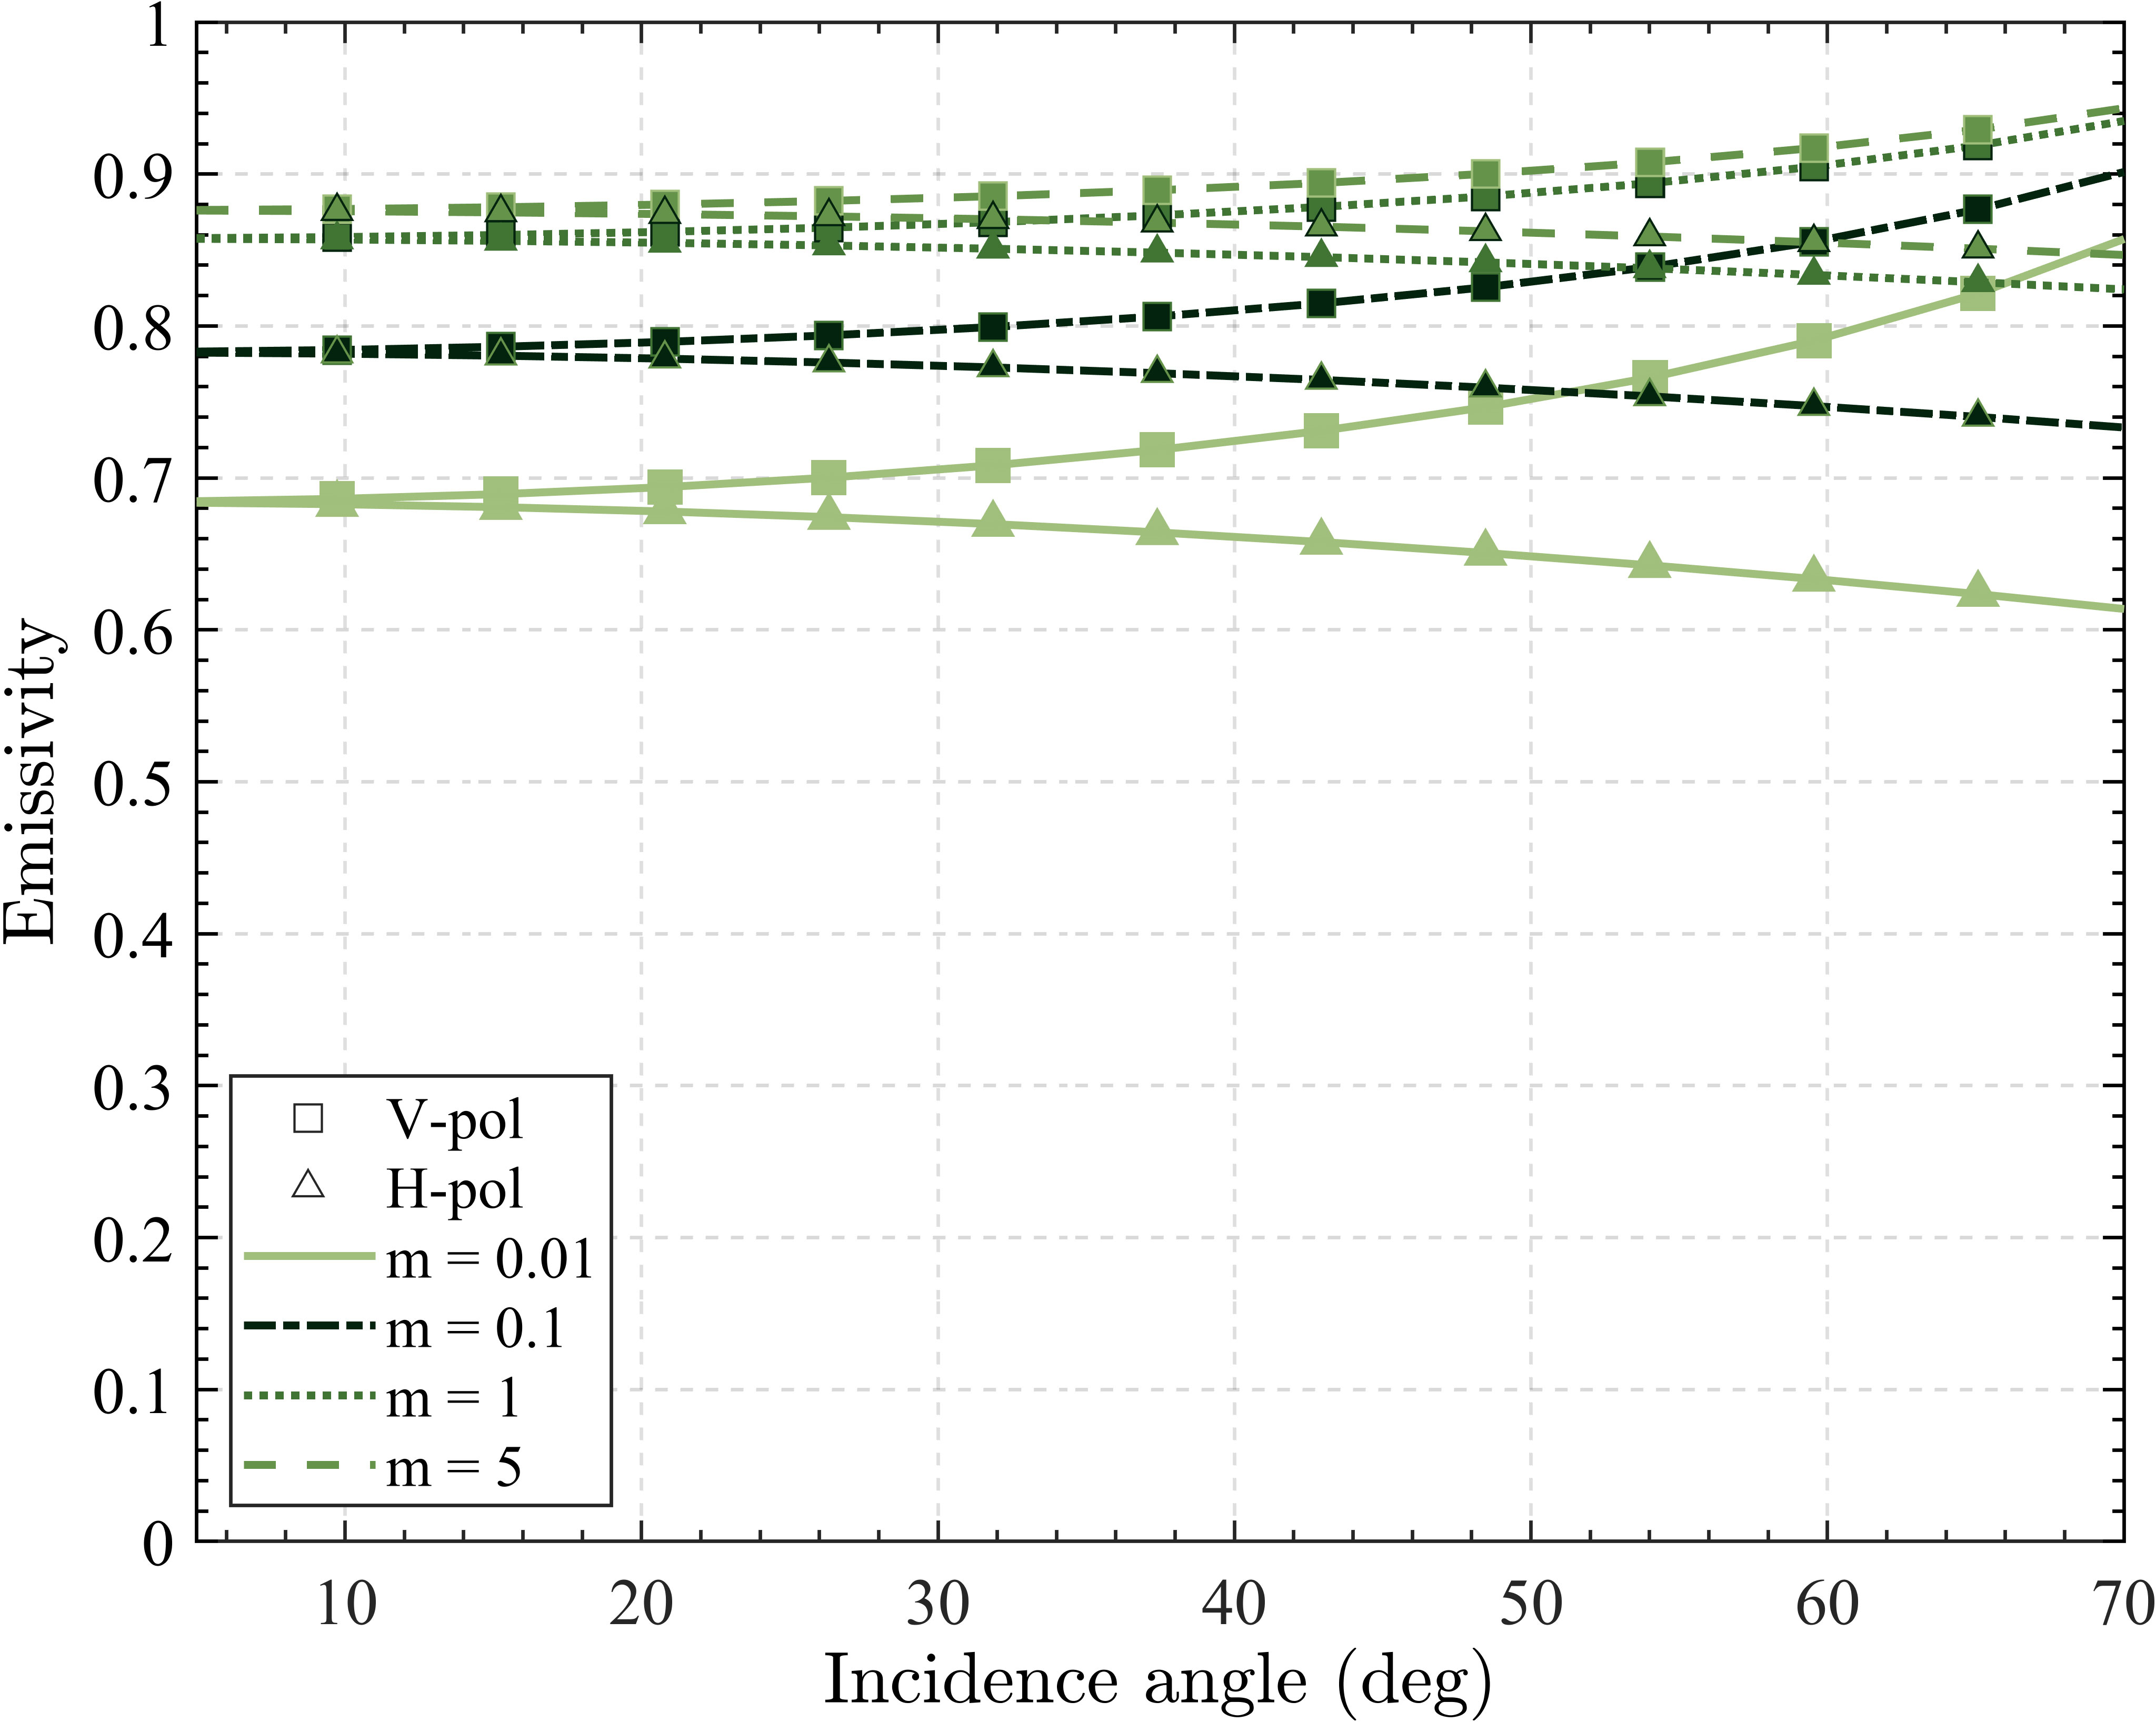
Figure 5 Foam emissivity as a function of incidence angle for different void fraction profiles at 1.4 GHz (input parameters: water temperature = 20°C salinity = 34 psu, and foam thickness z = 1 cm). V-pol (triangle symbols) and H-pol (square symbols).
4 Model validation
4.1 Comparison of the modeled foam emissivity to Camps et al. experimental measurements
Camps et al. (2005) conducted a measurement of foam-covered seawater at L-band in a pool with air diffusers to generate foam. In the experiment, wide ranges of water properties were evaluated, with the salinity ranging from 0 to 37 psu, the water temperature ranging from 14 to 20 °C, foam layer thickness ranging from approximately 0.9 to 1.7 cm. In this paper, we select four sets of typical experimental data for comparison, and the input parameters of the present model are listed in Table 1. The comparison is conducted with all elements ( , salinity, temperature and foam thickness) the same as those in Camps et al. (2005); only is tuned to best fit the experimental data. And the model simulations are directly compared to the experimental data since the observed foam emissivity has been scaled to a 100% foam coverage. Camps et al. (2005), we estimate the accuracy of the model simulations in terms of root–mean–square (RMS) error in this study.
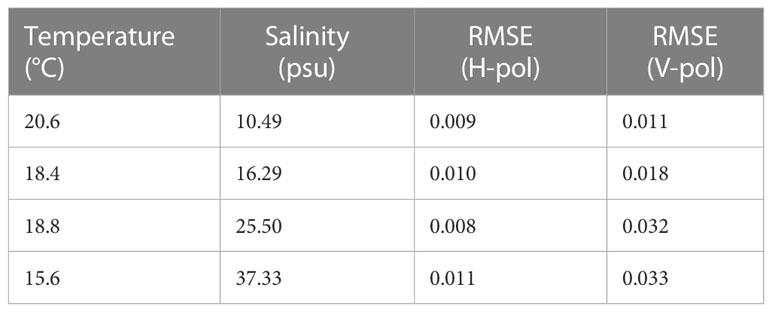
Table 1 Water properties of the measurements and RMS errors for the Camps et al. developed emissivity model compared to experimental data.
Camps et al. (2005) developed a physical foam emissivity model using the dipole approximation method described by (Dombrovskiy and Rayzer, 1992). Camps et al. (2005) used a Gamma distribution as the size distribution of bubbles embedded in seawater, and the effective permittivity is then determined to calculate the foam emissivity. The developed model performs quite well by finding the optimal values of bubble parameters (packing coefficient and foam radius), with the RMS error ranging from 0.008 to 0.033.
Compared to the Camps model, our model provides a similar accuracy, with RMS error ranging from 0.009 to 0.026. The results of the comparison between our model and the experimental data are shown in Figure 6. It is demonstrated that the present model simulations are consistent with the experimental data, especially for horizontal polarization, and the RMS errors are all lower than 0.02. Furthermore, Camps found that the measured values show a larger variation with the incidence angle than their model predictions at vertical polarization, which is not observed in our comparison. In general, our model shows a very good agreement with the experimental data.
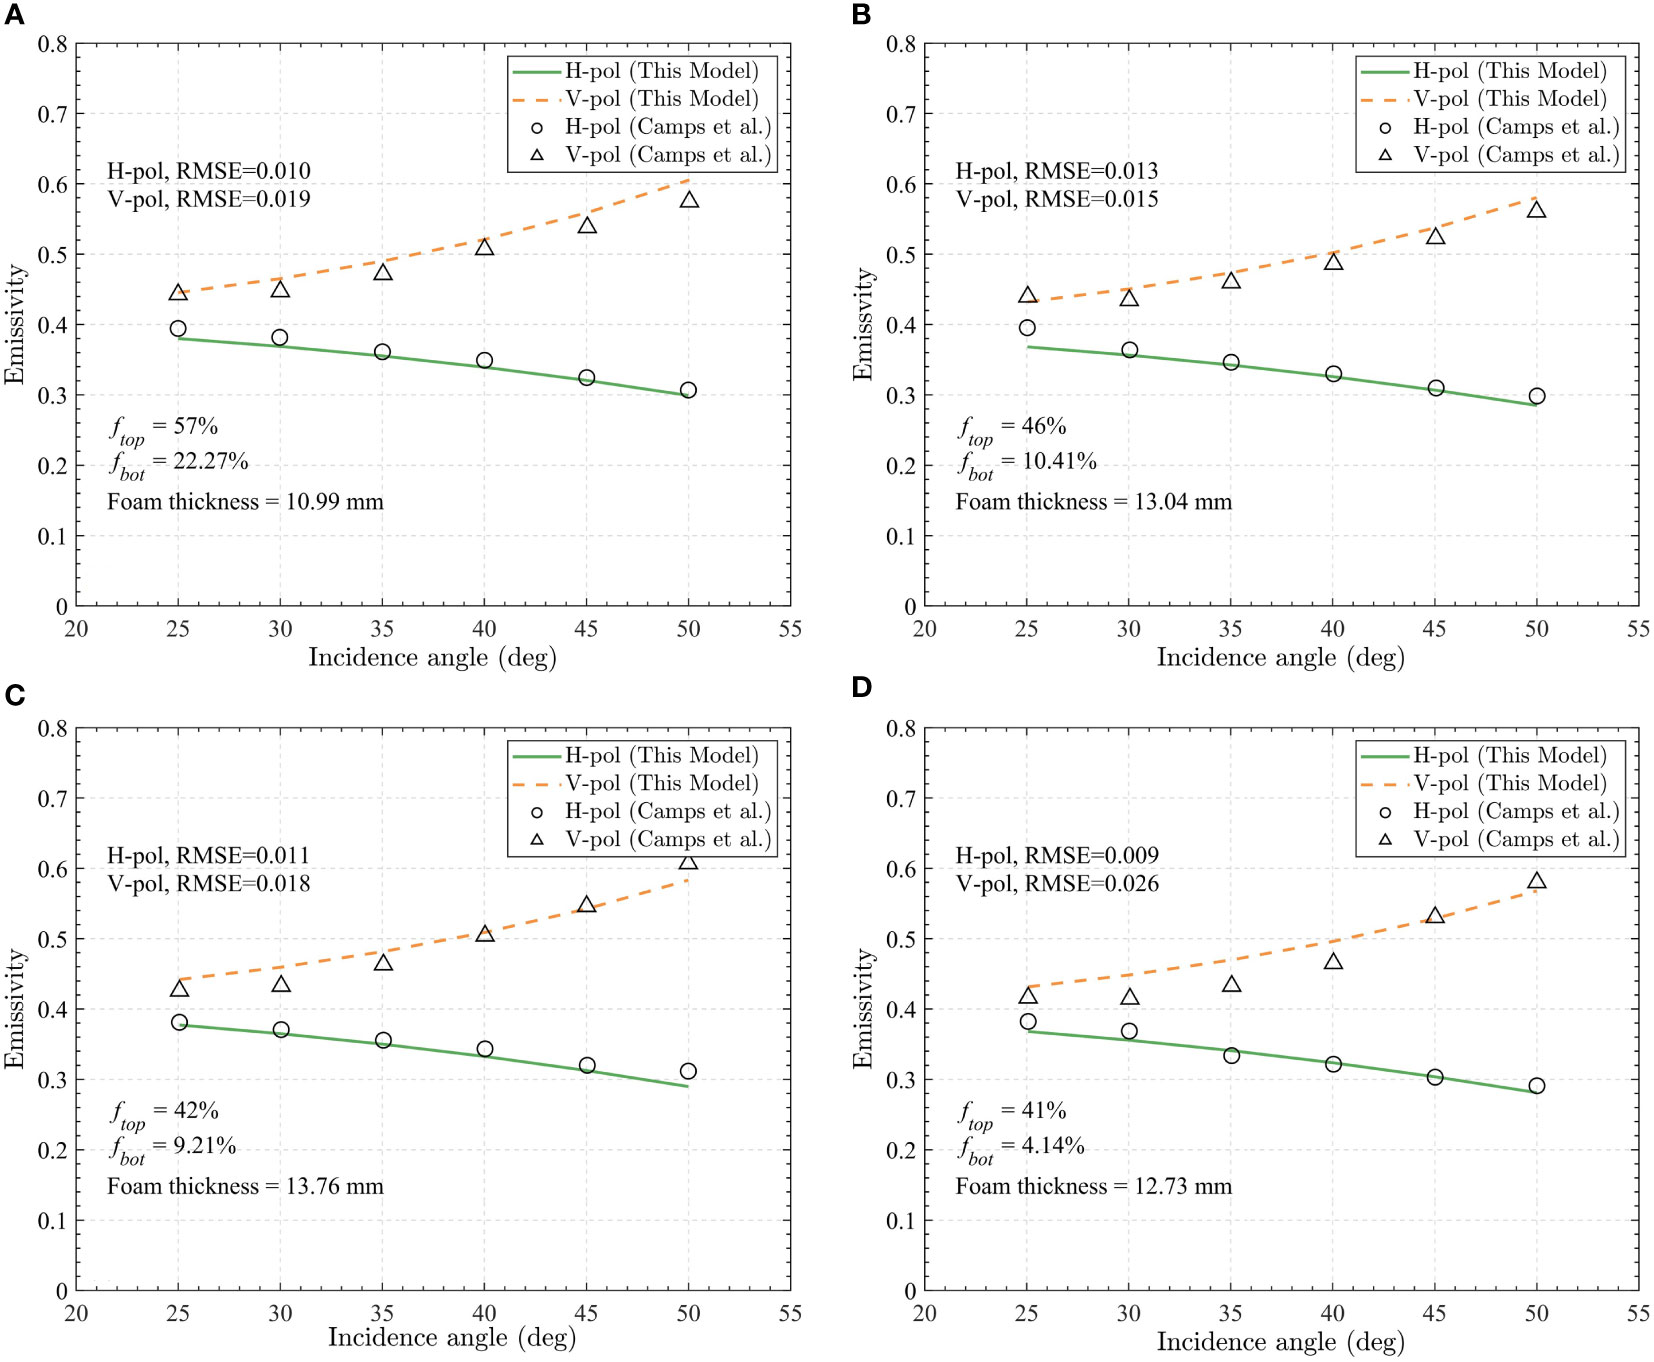
Figure 6 Comparison of the foam emissivity calculated with the present model to the experimental data (Camps et al., 2005, symbols) with different water properties: (A) temperature Ts = 20.6°C salinity Ss = 10.49 psu; (B) temperature Ts =18.4°C salinity Ss = 16.29 psu; (C) temperature Ts =18.8°C, salinity Ss = 25.5 psu; (D) temperature Ts =15.6°C, salinity Ss = 37.33 psu.
4.2 Comparison of the modeled foam emissivity to Wei et al. experimental measurements under low water temperature conditions
Wei et al. (2014) performed several observations of artificially generated foam at the L-band under low water temperature conditions. It is shown that water temperatures are all lower than 2 °C, and water salinity is in the range of 31 to 38 psu, which are quite different from those of water properties measured by Camps et al. (2005). Compared to Camps et al. (2005); Wei et al. (2014) provided a more extensive range of incidence angles and more measurements, namely, the incidence angle ranges from 30° to 59°, and 32 sets of observations for both horizontal and vertical polarizations are provided.
Since the foam is created in a pool by air diffusers, the water surface consists of a foam-covered area and a mixed air-water area. Following Wei et al. (2014), the ratio of the foam-covered area to the mixed air-water area is approximately 1.2, and the effective permittivity of the air-mixed seawater is calculated using Eq. (12) with . It should also be noted that Wei et al. (2014) used a constant void fraction instead of a vertical profile of the void fraction. Thus, we use the constant void fraction for comparison as well. The water properties and void fraction of the foam layer are extracted from Wei et al. (2014), as listed in Table 2.
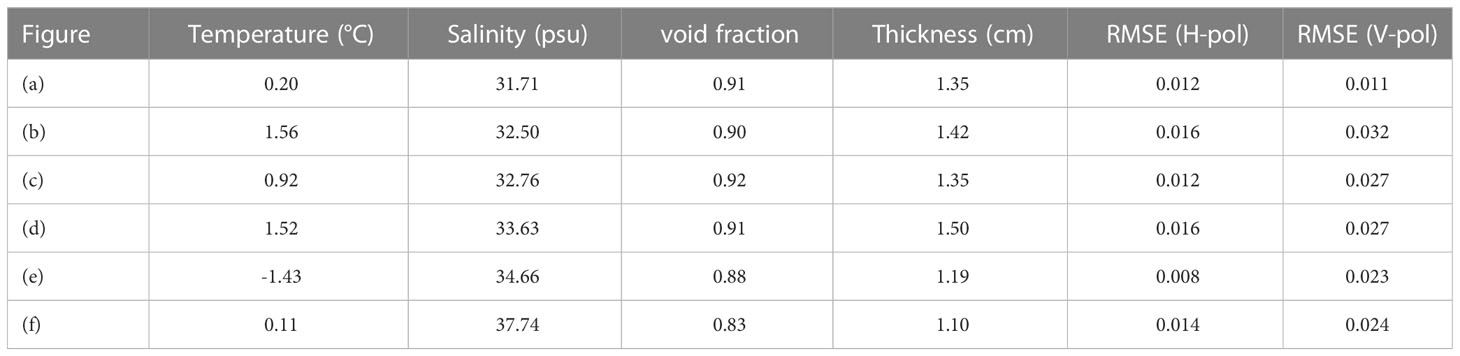
Table 2 Water properties of the measurements and RMS errors for the present model compared to Wei et al. experimental data.
The comparisons of the present model to experimental data are shown in Figure 7, and the water properties and RMS errors are listed in Table 2. Similar to the previous comparison, it turns out that the present model shows a good agreement with the experimental data, in which the RMS errors are all lower than 0.032 for both polarizations. It is noticed that in Figures 7B, D, our model underestimates the foam emissivity at small incidence angles and overestimates at large incidence angles, which is more notable for vertical polarization so that the corresponding RMS errors are greater than those of horizontal polarization. This could be due to the missing information on the seawater permittivity beneath the foam layer, in which the water consists of water and bubbles rather than pure seawater. Considering the possible uncertainties of foam coverage, void fraction profile, and dielectric properties, the result indicates that the present model could simulate the emissivity of the foam-covered sea surface over a relatively wide range of water properties.
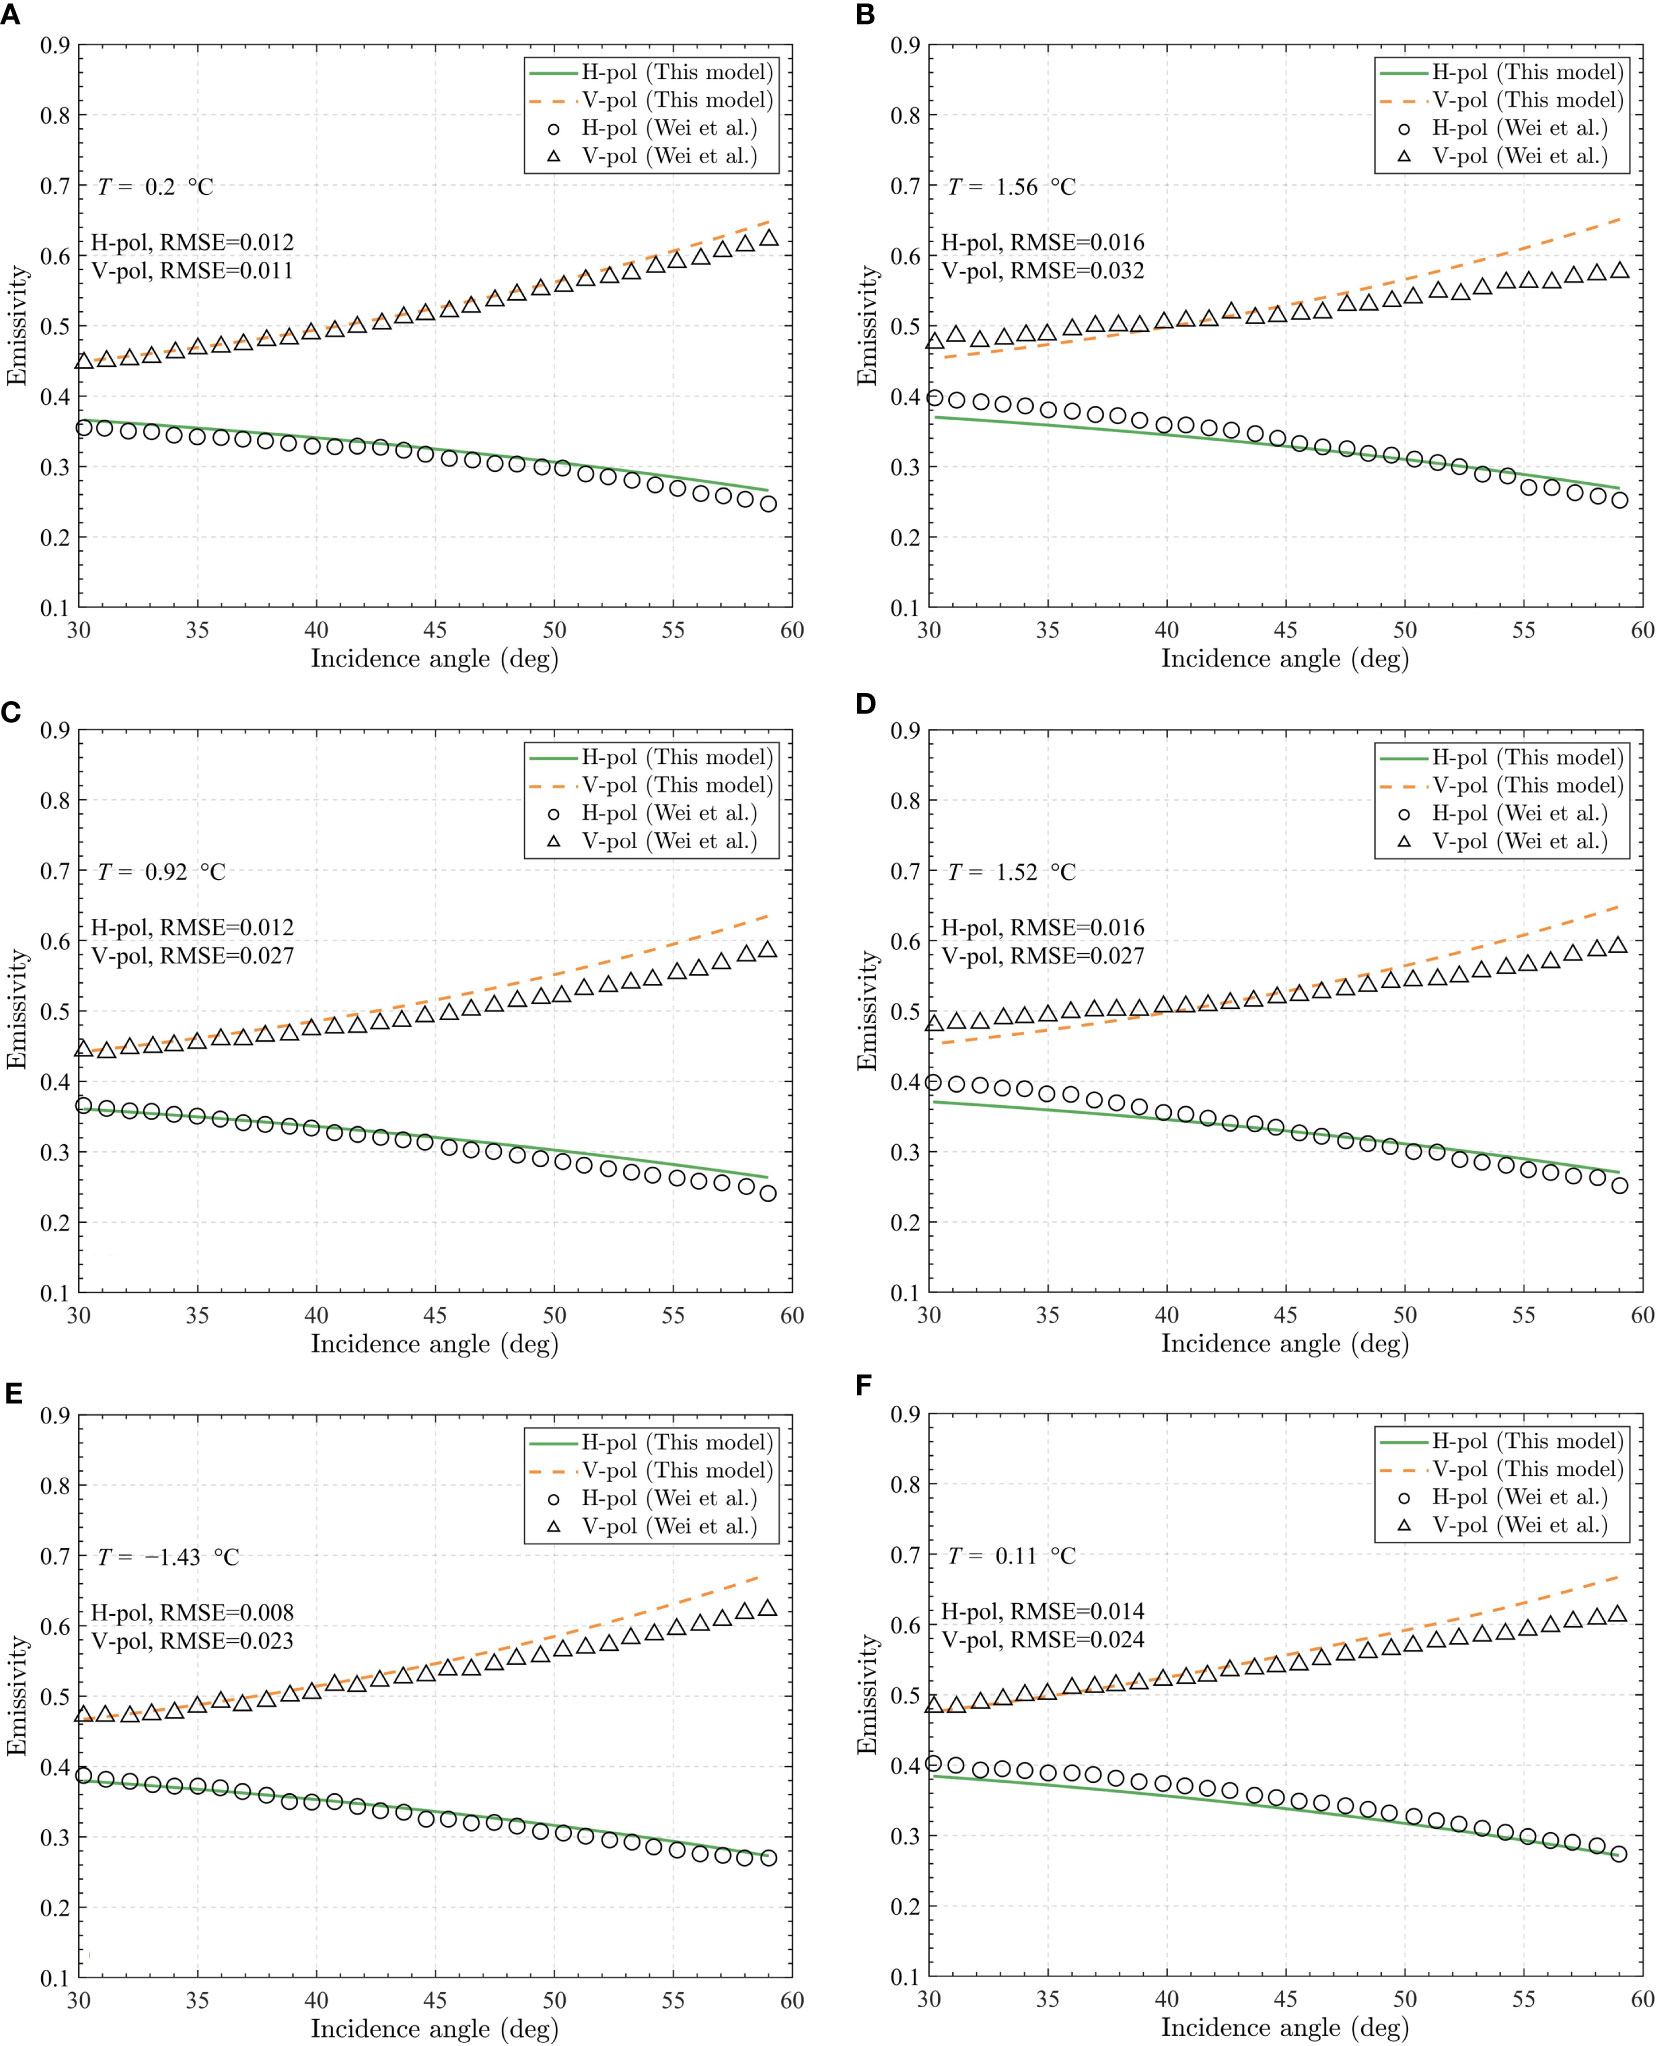
Figure 7 Comparison of the foam emissivity calculated with the present model to the experimental data (Wei et al., 2014, symbols) with different water properties: (A) temperature Ts = 0.20 °C salinity Ss = 31.71 psu; (B) temperature Ts =1.56°C salinity Ss = 32.50 psu; (C) temperature Ts =0.92 °C, salinity Ss= 32.76 psu; (D) temperature Ts =1.52°C, salinity Ss = 33.63 psu; (E) temperature Ts = -1.43°C, salinity Ss = 34.66 psu; (F) temperature Ts =0.11 °C, salinity Ss = 37.74 psu.
4.3 Comparison of the modeled foam emissivity to Rose et al. experimental measurements
Similar to Camps et al. (2005) and Wei et al. (2014); Rose et al. (2002) measured the foam emissivity with a dual-channel microwave radiometer, but the operating frequencies are at 10.8 and 36.5 GHz instead of 1.4 GHz. In contrast to the vertical profiles reported in Camps et al. (2005), it could be observed that the bubbles in the seawater do not exhibit any stratification, as shown in Figure 3 of Rose et al. (2002). Thus, it is reasonable that the void fraction is independent of depth. The thickness of the foam layer is assumed to be uniformly distributed with an approximate thickness of 2.8 cm. And according to the estimates of Rose et al. (2002), the void fraction of the foam layer is about 80% to 90%. Thus, we assume a constant void fraction instead of an exponentially distributed void fraction changing with depth in this section. In addition, to best fit the experimental data, we choose = 91% and 90% for validation at 10.8 and 36.5 GHz, respectively.
The comparisons of the present model to the experimental data are shown in Figure 8, the upper panel shows the results at 10.8 GHz, and the lower panel shows the results at 36.5 GHz. The results indicate that the present model simulation results reasonably agreed with the experimental measurements. The horizontal polarization results show even better consistency, with RMS errors of 0.009 and 0.014 at 10.8 and 36.5 GHz, respectively. We also conducted a comparison between our model and the DMRT model proposed by Chen et al. (2003), as well as the incoherent method by Anguelova and Gaiser (2013), as shown in Table 3. The result showed that our model performs better than the DMRT model. Furthermore, our model demonstrated comparable accuracy to Anguelova’s model. At a frequency of 10.8 GHz, the RMSEs were 0.009 and 0.014 for horizontal and vertical polarizations, respectively, compared to 0.011 and 0.015 for Anguelova’s model. Similarly, at a frequency of 36.5 GHz, the RMSEs were 0.014 and 0.024 for horizontal and vertical polarizations, respectively, compared to 0.015 and 0.017 for Anguelova’s model. However, at large incidence angles, especially for vertical polarization, the differences between the model simulations and experimental data increase. This could be due to the increase in the scattering effect of bubbles at higher frequencies. The refinement of the model by investigating the scattering effect of bubbles will be studied in the future.
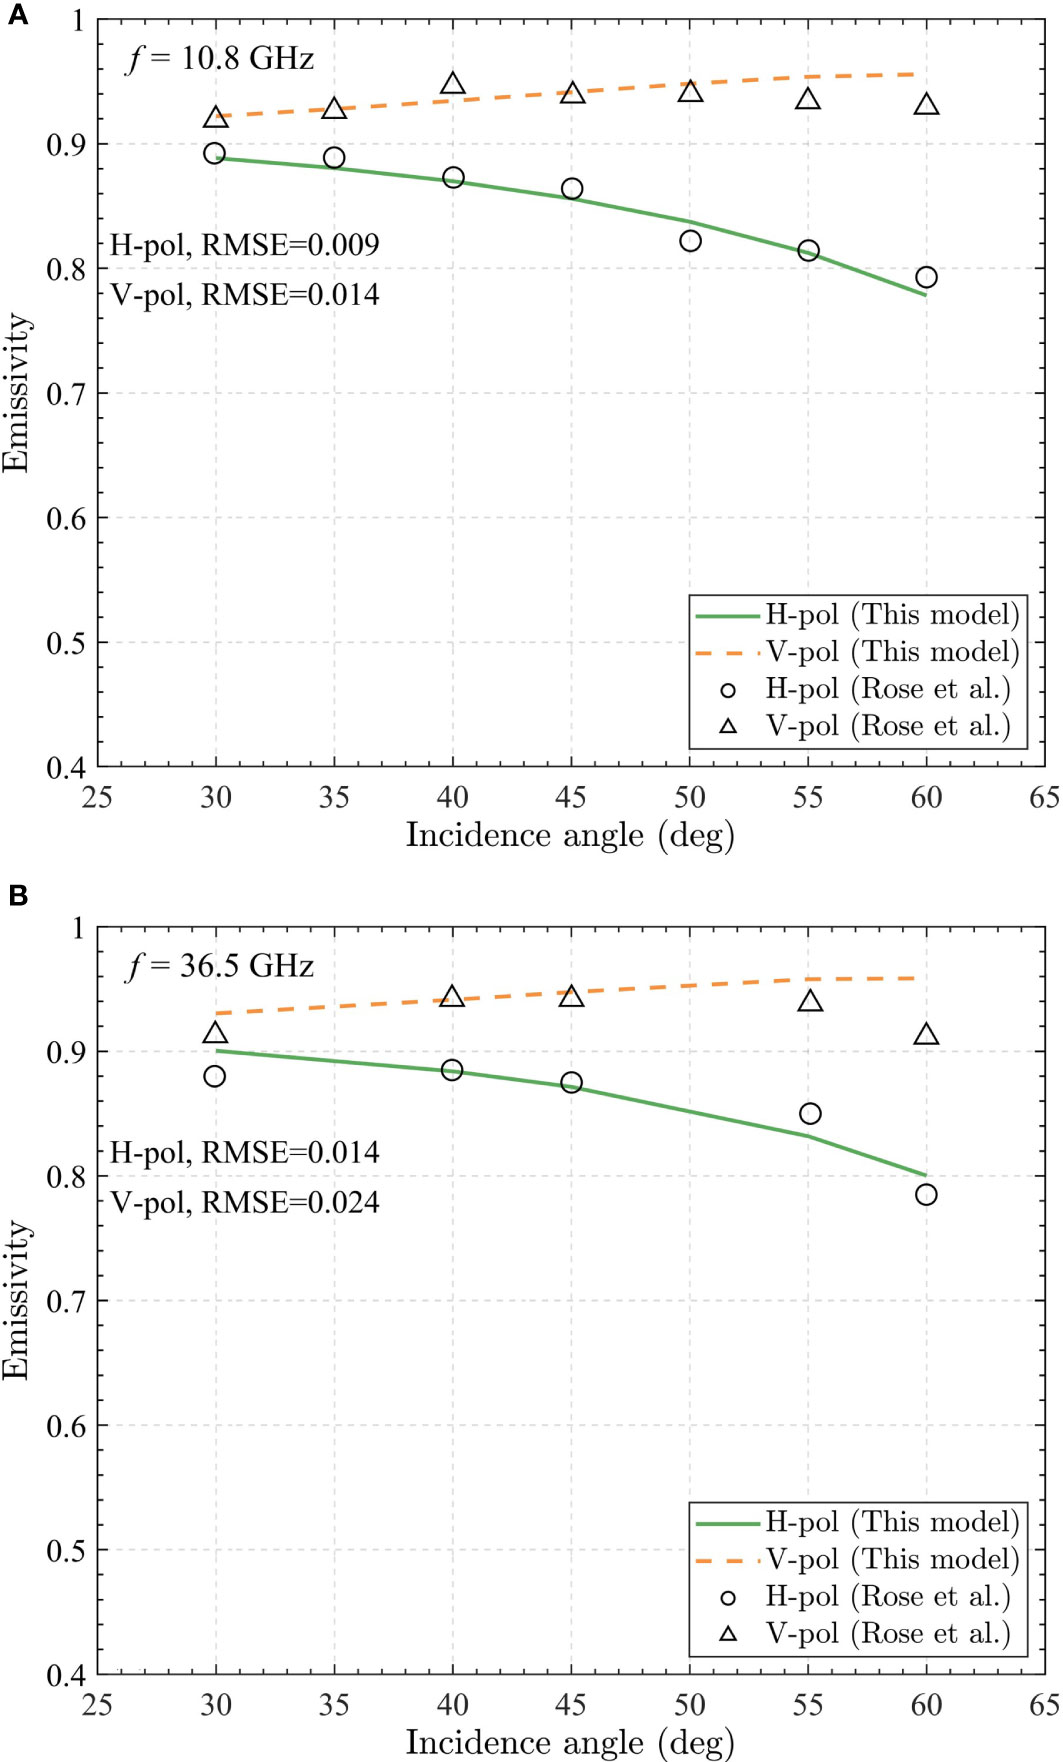
Figure 8 Comparison of the foam emissivity calculated with the present model to the experimental data (Rose et al., 2002, symbols) at two frequencies: (A)10.8 GHz; (B) 36.5 GHz.
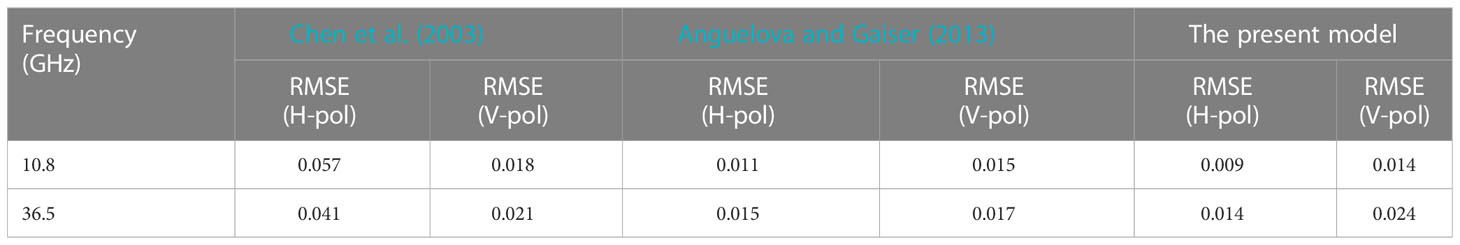
Table 3 RMS errors for various models compared to Rose et al. experimental data.
5 Summary and discussion
In this paper, a new foam emissivity model has been presented for passive microwave remote sensing applications. The model solves the RTE using the matrix operator method and provides simulations of the polarimetric and multiangular brightness temperatures under various seawater and foam conditions. In the proposed model, the foam layer is first divided into several layers in terms of the vertical void fraction profile. Reflection, transmission, and source matrices are determined for each thin layer with a different effective permittivity. A LUT is developed for storing refraction angles of the dense medium. Then, these layers are combined to determine the foam emissivity. The model could also provide the radiative terms contributing to the foam emissivity, such as the upwelling and downwelling emissivities within the foam layer and the emissivity of seawater beneath the foam layer. Thus, the model could potentially support further research—for example, the vertical foam structure and foam coverageunder different conditions or fast correction of the foam emissivity in terms of efficient algorithms.
We assessed the model simulations with different parameters: the depth of the foam layer and profile shape control factor m. It is found that both factors have a significant impact on foam emissivity. 1) with the increase of foam thickness, the foam emissivity increases rapidly for all incidence angles. And the foam emissivity tends to reach saturation at high frequencies. 2) with the increase of the shape control factor m, the foam emissivity increases for all incidence angles and polarizations. 3) it is very reasonable to use a relatively small value of m in model simulations, which means the foam layer is well stratified.
The model simulations are then compared to experimental measurements at three different frequencies for validation. First, compared to Camps et al. (2005) experimental data, the results demonstrate that the model simulations are consistent with the observations and the RMS errors of the model simulations are all lower than 0.026 for both polarizations. The model simulations are also validated against Wei et al. (2014). experimental data at L-band under low water temperature conditions. And it is also found that the present model shows a very good agreement with the experimental data, with RMS errors lower than 0.032. The error induced by the uncertainty of the vertical foam structure could be eliminated by adjusting the vertical void fraction profile. This also provides evidence that the void fraction profile could be a critical parameter in foam emissivity modeling. Finally, the model is validated at 18.7 and 36.5 GHz against Rose et al. (2002). experimental data. The model yields better results at a lower frequency (10.8 GHz), with RMS errors at 0.009 and 0.014 for both polarizations. However, it is also found that the difference between model simulation and experimental data increases at large incidence angles. This could be due to the increase in the scattering effect of bubbles.
Overall, the model developed in this study could simulate the foam emissivity under various conditions (different water temperatures, frequencies, and foam thickness) with a relatively high accuracy. However, the present model still has some arbitrary assumptions and needs to be refined: 1) this model ignores the multi-scattering effect of bubbles embedded in the foam layer. This may cause bias in modeling sea foam emissivity at a relatively high frequency (for example, 36.5 GHz) and should be studied in future work; 2) although we have found that the present model fits experimental data well by using a small profile shape-control parameter, the vertical void fraction profile under different water properties is still difficult to estimate due to the lack of abundant in-situ measurements. In our future work, efforts will be made to improve the RTM accuracy by considering the scattering properties of bubbles at high frequencies. In addition, a more precise macroscopic structure of the foam layer will be studied for accurate predictions of polarimetric and multiangular foam emissivities through reliable physical models and experimental data.
Data availability statement
The original contributions presented in the study are included in the article/Supplementary Material. Further inquiries can be directed to the corresponding author.
Author contributions
XJ: conceived the manuscript, wrote the first draft, developed the model. XH: wrote the manuscript, developed the model. YB, DW, JY, QZ, and FG: wrote the manuscript. CZ and DP: critically reviewed the paper. All authors contributed to the article and approved the submitted version.
Funding
This research was funded by the National Natural Science Foundation of China (Grants #U22B2012, #41825014, and # 42176177), the Key Special Project for Introduced Talents Team of Southern Marine Science and Engineering Guangdong Laboratory (Guangzhou) (GML2019ZD0602), and the Zhejiang Provincial Natural Science Foundation of China (Grant #LDT23D06021D06).
Acknowledgments
We thank the staff of the satellite ground station, satellite data processing and sharing center, and marine satellite data online analysis platform of the State Key Laboratory of Satellite Ocean Environment Dynamics, Second Institute of Oceanography, Ministry of Natural Resources (SOED/SIO/MNR), for their help with data processing. We also thank reviewers for their careful review and constructive suggestions that improved the manuscript.
Conflict of interest
The authors declare that the research was conducted in the absence of any commercial or financial relationships that could be construed as a potential conflict of interest.
Publisher’s note
All claims expressed in this article are solely those of the authors and do not necessarily represent those of their affiliated organizations, or those of the publisher, the editors and the reviewers. Any product that may be evaluated in this article, or claim that may be made by its manufacturer, is not guaranteed or endorsed by the publisher.
References
Anguelova M. D., Bettenhausen M. H. (2019). Whitecap fraction from satellite measurements: algorithm description. J. Geophysical Research: Oceans 124, 1827–1857. doi: 10.1029/2018JC014630
Anguelova M. D., Gaiser P. W. (2011). Skin depth at microwave frequencies of sea foam layers with vertical profile of void fraction. J. Geophysical Research: Oceans 116, C11002. doi: 10.1029/2011JC007372
Anguelova M. D., Gaiser P. W. (2012). Dielectric and radiative properties of sea foam at microwave frequencies: conceptual understanding of foam emissivity. Remote Sens. 4, 1162–1189. doi: 10.3390/rs4051162
Anguelova M. D., Gaiser P. W. (2013). Microwave emissivity of sea foam layers with vertically inhomogeneous dielectric properties. Remote Sens. Environ. 139, 81–96. doi: 10.1016/j.rse.2013.07.017
Blanchard D. C. (1963). The electrification of the atmosphere by particles from bubbles in the sea. Prog. oceanography 1, 73–202. doi: 10.1016/0079-6611(63)90004-1
Camps A., Vall-Llossera M., Villarino R., Reul N., Chapron B., Corbella I., et al. (2005). The emissivity of foam-covered water surface at l-band: theoretical modeling and experimental results from the frog 2003 field experiment. IEEE Trans. Geosci. Remote Sens. 43, 925–937. doi: 10.1109/TGRS.2004.839651
Chelton D. B., Wentz F. J., Gentemann C. L., de Szoeke R. A., Schlax M. G. (2000). Satellite microwave sst observations of transequatorial tropical instability waves. Geophysical Res. Lett. 27, 1239–1242. doi: 10.1029/1999GL011047
Chen D., Tsang L., Zhou L., Reising S. C., Asher W. E., Rose L. A., et al. (2003). Microwave emission and scattering of foam based on monte carlo simulations of dense media. IEEE Trans. Geosci. Remote Sens. 41, 782–790. doi: 10.1109/TGRS.2003.810711
Clough S., Shephard M., Mlawer E., Delamere J., Iacono M., Cady-Pereira K., et al. (2005). Atmospheric radiative transfer modeling: a summary of the aer codes. J. Quantitative Spectrosc. Radiative Transfer 91, 233–244. doi: 10.1016/j.jqsrt.2004.05.058
De Leeuw G., Andreas E. L., Anguelova M. D., Fairall C., Lewis E. R., O’Dowd C., et al. (2011). Production flux of sea spray aerosol. Rev. Geophysics 49, 1–39. doi: 10.1029/2010RG000349
Dombrovskiy L., Rayzer V. Y. (1992). Microwave model of a two-phase medium at the ocean surface. Izvestiia-Russian Acad. Sci. Atmospheric Ocean Phys. 28, 650–650.
Evans K., Stephens G. (1991). A new polarized atmospheric radiative transfer model. J. Quantitative Spectrosc. Radiative Transfer 46, 413–423. doi: 10.1016/0022-4073(91)90043-P
Guo J., Tsang L., Asher W., Ding K.-H., Chen C.-T. (2001). Applications of dense media radiative transfer theory for passive microwave remote sensing of foam covered ocean. IEEE Trans. Geosci. Remote Sens. 39, 1019–1027. doi: 10.1109/36.921420
Hwang P. A. (2011). Foam and roughness effects on passive microwave remote sensing of the ocean. IEEE Trans. Geosci. Remote Sens. 50, 2978–2985. doi: 10.1109/TGRS.2011.2177666
Hwang P. A., Reul N., Meissner T., Yueh S. H. (2019). Ocean surface foam and microwave emission: dependence on frequency and incidence angle. IEEE Trans. Geosci. Remote Sens. 57, 8223–8234. doi: 10.1109/TGRS.2019.2919001
Jessup A., Zappa C., Loewen M., Hesany V. (1997). Infrared remote sensing of breaking waves. Nature 385, 52–55. doi: 10.1038/385052a0
Jin X., He X., Shanmugam P., Bai Y., Gong F., Yu S., et al. (2020). Comprehensive vector radiative transfer model for estimating sea surface salinity from l-band microwave radiometry. IEEE Trans. Geosci. Remote Sens. 59, 4888–4903. doi: 10.1109/TGRS.2020.3007878
Kerr Y. H., Waldteufel P., Wigneron J.-P., Delwart S., Cabot F., Boutin J., et al. (2010). The smos mission: new tool for monitoring key elements of the global water cycle. Proc. IEEE 98, 666–687. doi: 10.1109/JPROC.2010.2043032
Klein L., Swift C. (1977). An improved model for the dielectric constant of sea water at microwave frequencies. IEEE Trans. antennas propagation 25, 104–111. doi: 10.1109/TAP.1977.1141539
Kokhanovsky A. (2004). Spectral reflectance of whitecaps. J. Geophysical Research: Oceans 109, C05021. doi: 10.1029/2003JC002177
Le Vine D. M., Abraham S. (2004). Galactic noise and passive microwave remote sensing from space at l-band. IEEE Trans. Geosci. Remote Sens. 42, 119–129. doi: 10.1109/TGRS.2003.817977
Lewis E. R., Schwartz S. E. (2004). Sea Salt aerosol production: mechanisms, methods, measurements, and models Vol. 152 (Washington, D.C, USA: American geophysical union).
Liebe H. J. (1989). Mpm–an atmospheric millimeter-wave propagation model. Int. J. Infrared millimeter waves 10, 631–650. doi: 10.1007/BF01009565
Padmanabhan S., Reising S. C., Asher W. E., Rose L. A., Gaiser P. W. (2006). Effects of foam on ocean surface microwave emission inferred from radiometric observations of reproducible breaking waves. IEEE Trans. Geosci. Remote Sens. 44, 569–583. doi: 10.1109/TGRS.2006.870234
Plant W. J., Irisov V. (2017). A joint active/passive physical model of sea surface microwave signatures. J. Geophysical Research: Oceans 122, 3219–3239. doi: 10.1109/IGARSS.2017.8127248
Raizer V. (2007). Macroscopic foam–spray models for ocean microwave radiometry. IEEE Trans. Geosci. Remote Sens. 45, 3138–3144. doi: 10.1109/TGRS.2007.895981
Reul N., Chapron B. (2003). A model of sea-foam thickness distribution for passive microwave remote sensing applications. J. Geophysical Research: Oceans 108, C103321. doi: 10.1029/2003JC001887
Rose L. A., Asher W. E., Reising S. C., Gaiser P. W., St Germain K., Dowgiallo D. J., et al. (2002). Radiometric measurements of the microwave emissivity of foam. IEEE Trans. Geosci. Remote Sens. 40, 2619–2625. doi: 10.1109/TGRS.2002.807006
Rothman L. S., Gordon I. E., Babikov Y., Barbe A., Benner D. C., Bernath P. F., et al. (2013). The hitran2012 molecular spectroscopic database. J. Quantitative Spectrosc. Radiative Transfer 130, 4–50. doi: 10.1016/j.jqsrt.2013.07.002
Skofronick-Jackson G., Petersen W. A., Berg W., Kidd C., Stocker E. F., Kirschbaum D. B., et al. (2017). The global precipitation measurement (gpm) mission for science and society. Bull. Am. Meteorological Soc. 98, 1679–1695. doi: 10.1175/BAMS-D-15-00306.1
Ulaby F., Moore R., Fung A. (1981). Microwave remote sensing: active and passive Vol. I (Norwood, MA, USA: Addison-Wesley Publishing Company).
Voronovich A. G. (2013). Wave scattering from rough surfaces Vol. 17 (Berlin, Heidelberg, Germany: Springer Science & Business Media).
Wanninkhof R., Asher W. E., Ho D. T., Sweeney C., McGillis W. R. (2009). Advances in quantifying air-sea gas exchange and environmental forcing. Annu. Rev. Mar. Sci. 1, 213–244. doi: 10.1146/annurev.marine.010908.163742
Wei E.-B., Liu S.-B., Wang Z.-Z., Tong X.-L., Dong S., Li B., et al. (2014). Emissivity measurements of foam-covered water surface at l-band for low water temperatures. Remote Sens. 6, 10913–10930. doi: 10.3390/rs61110913
Yin X., Boutin J., Dinnat E., Song Q., Martin A. (2016). Roughness and foam signature on smos-miras brightness temperatures: a semi-theoretical approach. Remote Sens. Environ. 180, 221–233. doi: 10.1016/j.rse.2016.02.005
Yueh S. H. (1997). Modeling of wind direction signals in polarimetric sea surface brightness temperatures. IEEE Trans. Geosci. Remote Sens. 35, 1400–1418. doi: 10.1109/36.649793
Yueh S. H., Kwok R., Li F., Nghiem S., Wilson W., Kong J. A. (1994). Polarimetric passive remote sensing of ocean wind vectors. Radio Sci. 29, 799–814. doi: 10.1029/94RS00450
Yueh S. H., West R., Wilson W. J., Li F. K., Njoku E. G., Rahmat-Samii Y. (2001). Error sources and feasibility for microwave remote sensing of ocean surface salinity. IEEE Trans. Geosci. Remote Sens. 39, 1049–1060. doi: 10.1109/36.921423
Keywords: sea foam emissivity, foam, radiative transfer, Matrix operator method, microwave remote sensing
Citation: Jin X, He X, Bai Y, Wang D, Ying J, Zhu Q, Gong F, Zhou C and Pan D (2023) A vector radiative transfer model for simulating the microwave emissivity of sea foam based on matrix operator method. Front. Mar. Sci. 10:1103843. doi: 10.3389/fmars.2023.1103843
Received: 21 November 2022; Accepted: 03 April 2023;
Published: 01 May 2023.
Edited by:
Kyung-Ae Park, Seoul National University, Republic of KoreaReviewed by:
Qing Xu, Ocean University of China, ChinaPeng Ren, China University of Petroleum (East China), China
Xiaobin Yin, Ocean University of China, China
Copyright © 2023 Jin, He, Bai, Wang, Ying, Zhu, Gong, Zhou and Pan. This is an open-access article distributed under the terms of the Creative Commons Attribution License (CC BY). The use, distribution or reproduction in other forums is permitted, provided the original author(s) and the copyright owner(s) are credited and that the original publication in this journal is cited, in accordance with accepted academic practice. No use, distribution or reproduction is permitted which does not comply with these terms.
*Correspondence: Delu Pan, pandelu@sio.org.cn