Distributions, sources, and air-sea fluxes of nitrous oxide in Bohai Bay, China
 Zhi Wang
 Ting Gu
 Yujian Wen
 XuDong Cui1,2
  Dai Jia
 Jun Sun
- 1Research Centre for Indian Ocean Ecosystem, Tianjin University of Science and Technology, Tianjin, China
- 2Institute for Advanced Marine Research, China University of Geosciences (Wuhan), Guangzhou, China
- 3State Key Laboratory of Biogeology and Environmental Geology, China University of Geosciences (Wuhan), Wuhan, China
Introduction: Polluted bays are one of the critical areas for the production and emissions of marine nitrous oxide (N2O), which has a strong effect on global warming and plays a critical role in stratospheric ozone depletion.
Methods: In 2020, the distributions of N2O concentrations and emissions in the water column of Bohai Bay (BHB) were surveyed during two cruises.
Results and discussion: The average N2O concentrations were higher in summer compared to autumn, with the oversaturation of N2O in both seasons. A declining gradient of N2O was found from the Hai River and Yellow River estuarine areas to the offshore sea, particularly in summer, implying riverine input was an important source of N2O. The vertical distribution of N2O was uniform in each season owing to the vertical mixing of water columns in the offshore sea, with N2O hotspots at the bottom of the two estuaries in summer and at the surface of the Hai River estuary in autumn. Moreover, the dominant sources of dissolved N2O were analyzed. N2O in the water column was predominately produced by nitrification and coupled nitrification-denitrification on suspended particulate matter. The mixing of water masses, particularly polluted water masses from coastal input, provides high N2O to the entire area of BHB, particularly in summer. Notably, nutrient and organic matter input from the coast could also indirectly drive N2O production by stimulating microbe activities of nitrification and denitrification under the water currents. In addition, statistical analysis revealed that ammonium, dissolved oxygen, and temperature were the dominant controlling factors of N2O in BHB. The annual flux of N2O in BHB was evaluated to be 6.5 Gg, accounting for 0.15% of the global oceanic N2O emission with 0.0044% of the global ocean area. Hence, as a typical polluted bay, BHB acted as a strong N2O source to the atmosphere on a per-unit-area basis.
Introduction
Nitrous oxide (N2O) is a greenhouse gas that is less abundant in the atmosphere than CO2 but has a warming effect 273 times greater than CO2 on a 20-year time scale (IPCC, 2019). N2O is one of the main pollutants that destroy the ozone layer, particularly after the impact of chlorofluorocarbon (CFCs) on the ozone layer was eliminated (Valverde, 2009). Marine environments are the second largest natural source of N2O emissions, accounting for 21% of the world’s total N2O flux (Tian et al., 2020).
To better understand the mechanisms of marine N2O production and emission, nitrification and denitrification activities, the two predominant microbial processes in the generation of N2O, must be taken into account (Hahn, 1974). In the presence of molecular oxygen, ammonium () is oxidized to nitrite () via hydroxylamine (NH2OH), with N2O as a by-product (Anderson, 1964). The N2O production from nitrification in oceanic environments has been identified by a positive relationship between apparent oxygen utilization and N2O excess (Forster et al., 2009). N2O concentrations during nitrification also increase significantly with decreasing O2 concentrations (Codispoti and Christensen, 1985). Some studies have demonstrated that the denitrification-generated N2O has a limited effect on N2O flux in shelf seas (Chen et al., 2021; Gu et al., 2021). Denitrification usually occurs when DO falls below the threshold of 2 mg L-1(Codispoti et al., 2000).
Previous research indicated that in high turbidity water, although with relatively high DO concentration, the low-O2 microenvironment formed within suspended particulate matter (SPM) can also produce N2O (Xia et al., 2017a). SPM, containing organic matter and minerals, can influence biogeochemical processes in coastal seas and estuaries (Turner and Millward, 2002). Xia et al. (2017a) found a declining trend of oxygen concentration from the external to the internal of SPM in oxic waters because of the degradation of organic matter by bacteria on SPM and the oxidation of reducing matter associated with SPM. The results indicated that sufficient oxygen in the external of SPM is suitable for nitrifying bacteria to survive and oxidize to , while low oxygen in the internal of SPM favors the survival of denitrifying bacteria turning to N2. That is to say, SPM can provide oxic and low oxygen microenvironments for coupled nitrification-denitrification (CND) in oxic waters (Xia et al., 2017a). According to nitrogen stable isotope tracer experiments, CND was found to occur on SPM and the rate increased with the SPM concentration and decreased with the particle size of SPM (Xia et al., 2017a; Xia et al., 2017b). Moreover, Xia et al. (2017a) found that, as the intermediate product of denitrification, the average release of N2O was the highest with SPM of 50–100 µm within a range of 20–200 µm in an incubation system. Hangzhou Bay, adjacent to the East China Sea, is influenced by tidal currents and waves and has a high carrying capacity for SPM, which is carried downstream from the Changjiang River and the Qiantang River. Previous research found that SPM in the oxic water of Hangzhou Bay was consisted of outer nitrifiers and inner denitrifiers, detected by fluorescence in situ hybridization (FISH) analysis, which indicated that CND could occur on the SPM in oxic waters with high turbidity (Zhu et al., 2018). In addition, N2O production pathways (nitrification and denitrification) and production rates are affected by many environmental factors, including type and concentration of substrate, temperature, salinity, DO and pH, which, combined together, dictate the distribution of emissions of N2O (Quick et al., 2019; Chen et al., 2021; Gu et al., 2021).
Because of the complexity of marine environments, the distribution of N2O emissions is not uniform. Some bay areas are crucial N2O sources under the influence of intensive human activities and river discharge on the coast, particularly in estuaries (Sierra et al., 2017; Bange et al., 2019). Water masses rich in N2O are directly delivered into bay regions by rivers. Moreover, organic matter and nutrient discharge are also beneficial for the in-situ production of N2O. The air-to-sea N2O flux of Prydz Bay, in the Southern Ocean, with low human influence, was -1.20 ± 0.44 μmol m-2 d-1 (Zhan et al., 2015). However, in Jiaozhou Bay and Tokyo Bay, with high influence from human activities, coastal water discharge, and groundwater input, the N2O fluxes reached 37.3 ± 51.9 μmol m-2 d-1 and 28.6 ± 27.7 μmol m-2 d-1, respectively (Hashimoto et al., 1999; Zhang et al., 2006). Therefore, because of complicated geographical characteristics and the large difference in anthropogenic activities in these regions, the N2O production paths and how environmental variables control the emissions of N2O are less well known. Research is needed to improve the regional and global accuracy of N2O evaluation.
Bohai Bay (BHB), one of the three major bays of the Bohai Sea (BS) in China, covers an area of 15,900 km2. It is a large and semi-enclosed inner sea located in the northwestern part of the BS (Figure 1). The seafloor topography is roughly from south to north, sloping from the shore to the sea (Capelle and Tortell, 2016). The BHB is generally affected by the monsoon wind, which is strong in winter and weak in summer (Tao et al., 2020). The transport of water in BHB is controlled by the water currents (residual circulation), which are driven by tides (Li et al., 2019; Tao et al., 2020). As shown in Figure 1, with circulation, water from the central basin of the BS goes into BHB. One part of the water mass turns south and passes across the mouth of BHB, traveling back to the center of the BS, to form an anticlockwise vortex in the northern mouth of the bay (MACV). Another part continues flowing until it reaches the coast of Tanggu district in Tianjin City of China and then two branches are formed. One branch turns north entering the northwest part of BHB. This water current flows along the coastline to the coast near the Caofeidian district, forming a clockwise vortex in the northwest part of BHB (NCV). Another branch turns south and goes along the west shoreline to the coast near Huanghua city, where the water mass is divided into two current flows. One current turn northeast and forms an anticlockwise vortex in the central part of BHB (NACV). Another current travels eastward and encounters Yellow River coastal current. Then, the current comes out of BHB at the central part of the mouth (Li et al., 2019).
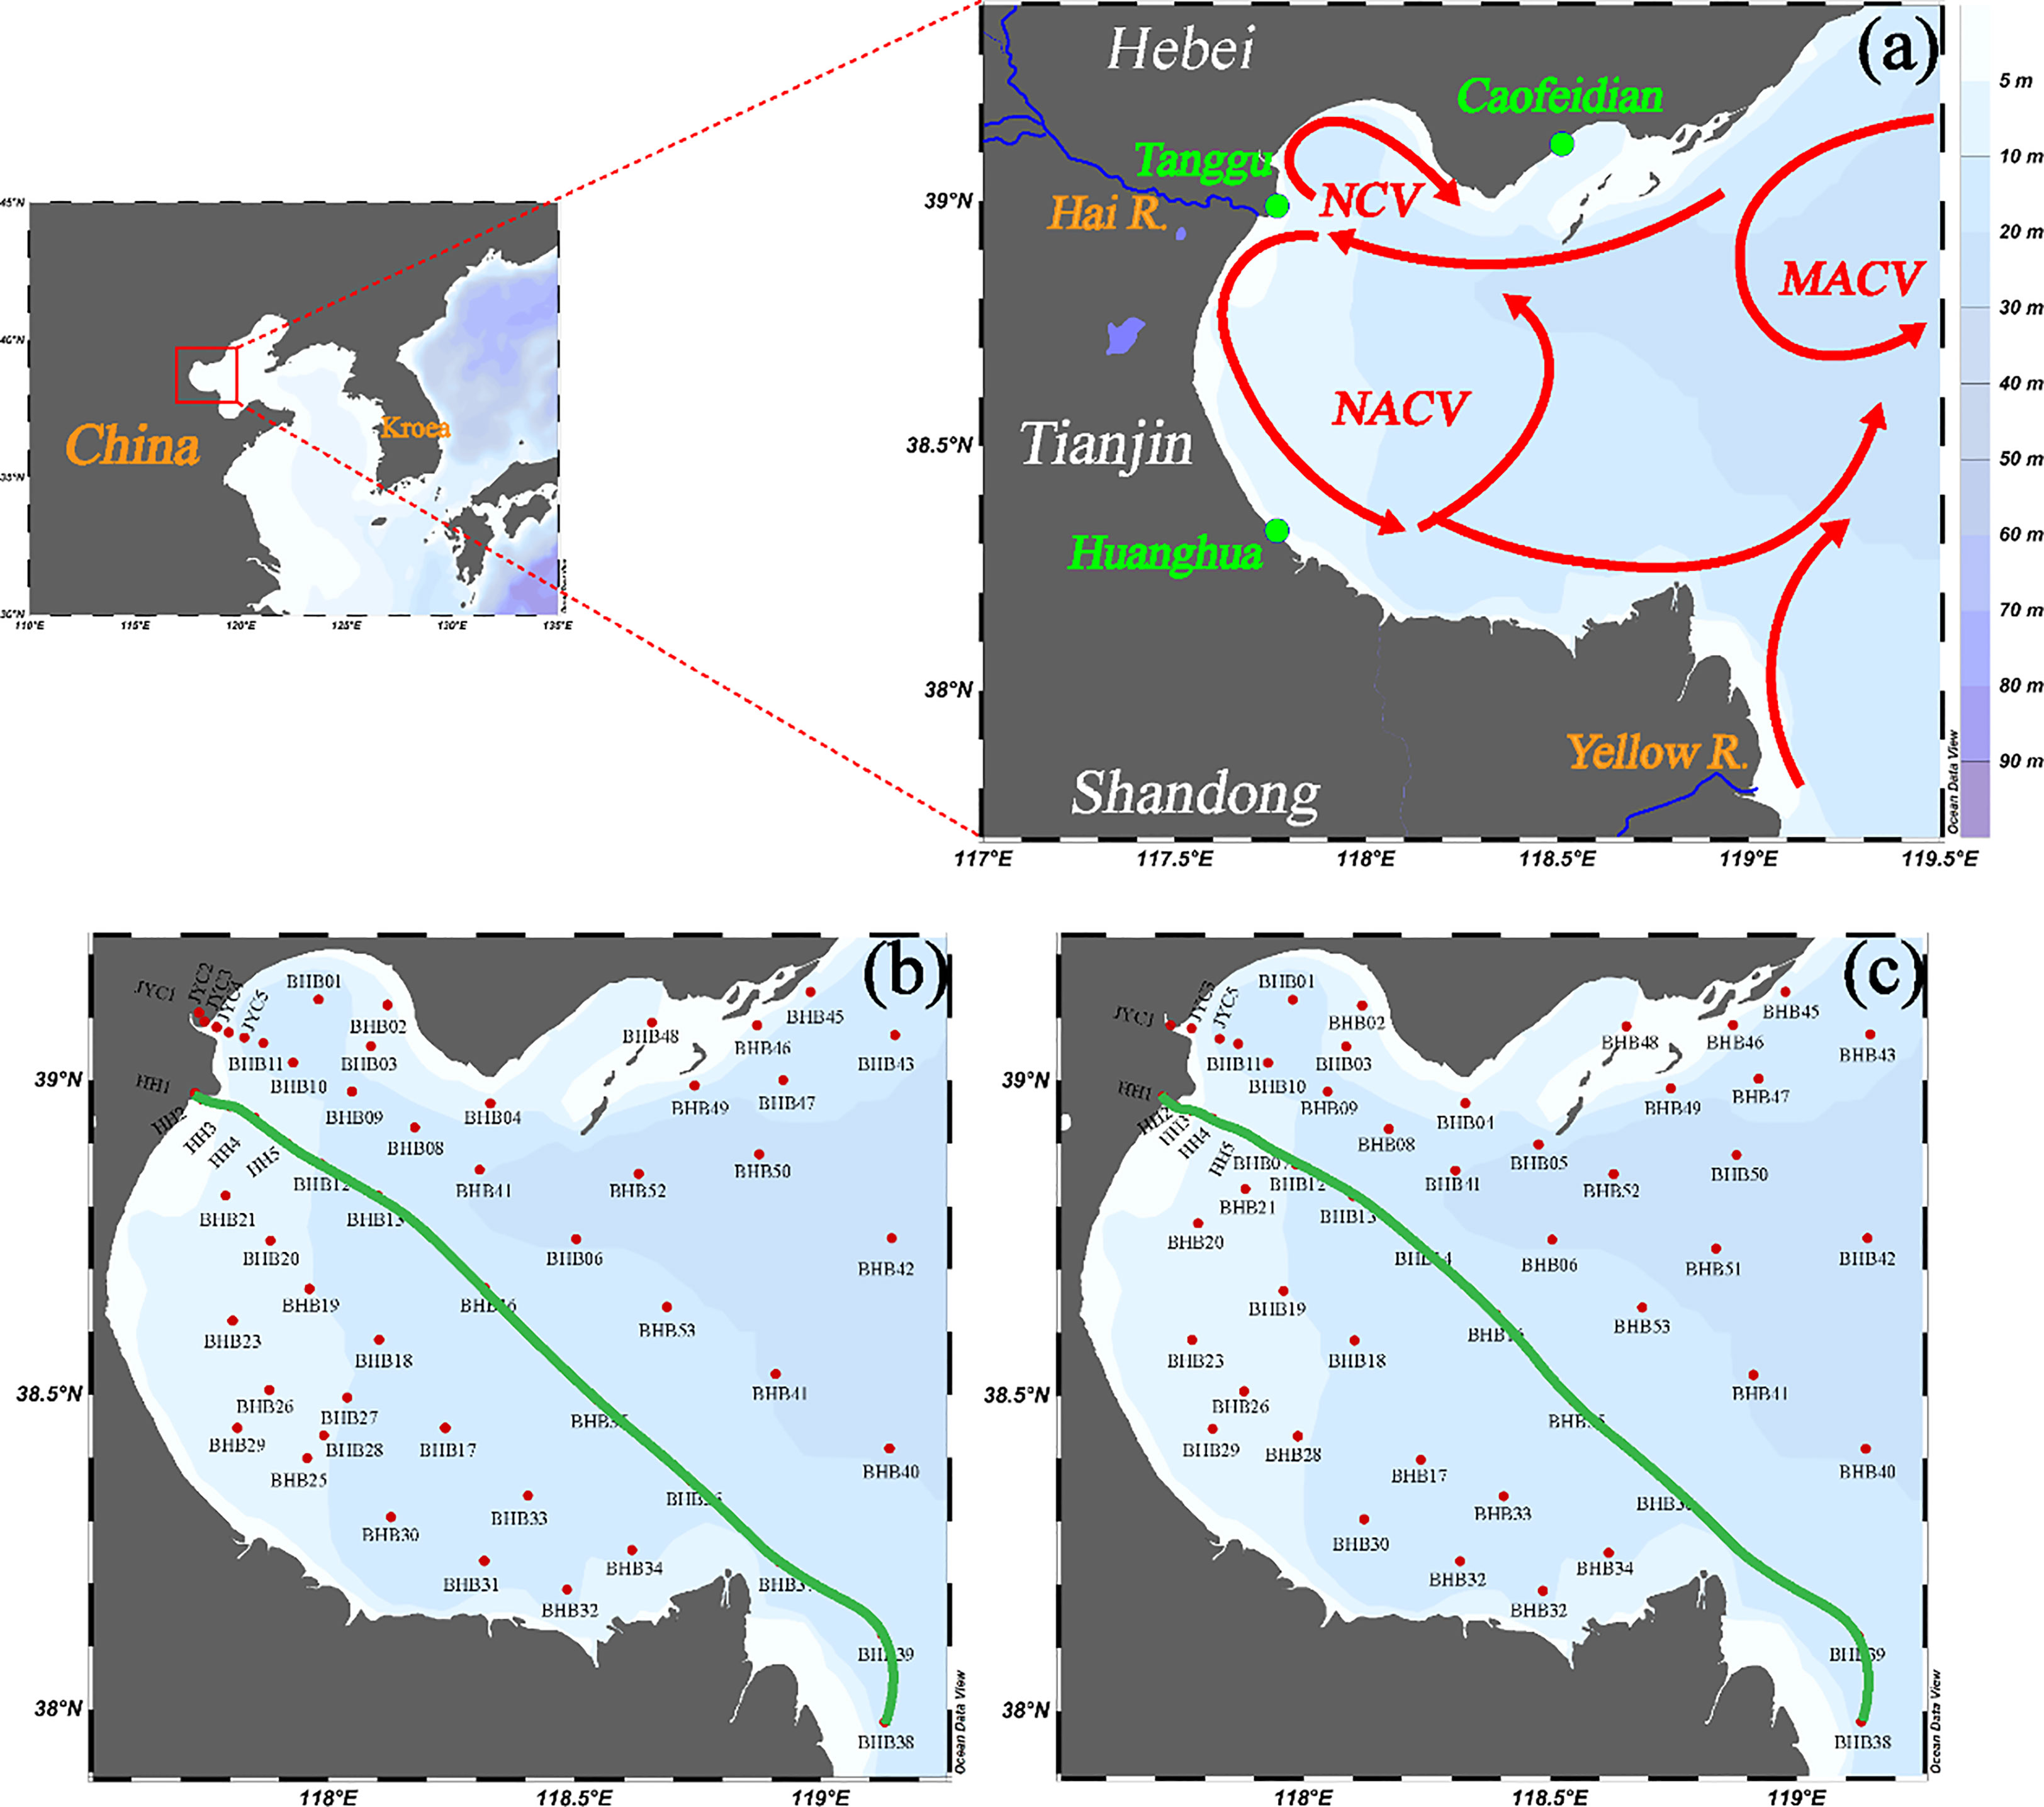
Figure 1 Sampling map and regional water currents (A) and sampling locations in summer (B) and autumn (C) of 2020. Red solid lines represent water currents. Green solid lines represent the selected section. MACV: anticlockwise vortex near the mouth of the bay; NCV: clockwise vortex in the northwest of BHB; NACV: anticlockwise vortex in the center of the bay.
BHB is also considered to be one of the most polluted marine areas in China due to the high impact of human activities (Zhuang and Gao, 2013). Besides dozens of drainages, more than 50 continental rivers flow directly into BHB. In addition, some large and medium-sized coastal cities are located around the bay. The region has experienced rapid economic development and urbanization, with some parts of the coastal waters of BHB receiving contaminants surpassing Class III of the Chinese Sea Water Quality Standard (GB 3097-1997). The coastal wastewater discharges from industry, agriculture, aquaculture, and sewage all contribute to the pollutants. In addition, the pollutants, which accounted for 87% of the total contaminants in the bay, originated inland and are transported through the rivers discharging into the bay (Zhao and Kong, 2000). Riverine runoff carries 95% of the terrestrial contaminants into BHB (Zhao and Kong, 2000). Besides a large amount of input of nutrients and organic matter, these rivers deliver oversaturated N2O water into BHB (Cai et al., 2014; Li et al., 2022; Tang et al., 2022). Compared to other bays, BHB is semi-enclosed inner bay with relatively low water exchange velocity (Li et al., 2019) and multiple large rivers flowing into it, such as the Yellow River (second-largest river in China) and the Hai River. Meanwhile, BHB has been subject to significant anthropogenic disturbances, including urbanization, industrialization, agriculture and fishing activities. Therefore, BHB has unique geographical features and anthropogenic disturbances.
Nevertheless, researches of N2O in BHB are inadequate. First, Gu et al. (2021) pointed out, because of riverine input, the BS has been an important N2O source with an annual emission of 17.2 Gg. Yet, even though the estuarine and coastal areas have the most intensive human activities in the BS, dissolved N2O in BHB was not included in earlier studies (they were mainly conducted in the central basin areas of the BS) (Li, 2010; Gu et al., 2021). N2O data for BHB are thus scarce. Second, summer time oxygen depletion (DO< 2 mg L−1) in BHB has be expanding and intensifying (Zhang et al., 2016). By investigating the distribution of N2O concentrations in BHB, we can study the mechanisms regulating the production and emission of N2O and apply them to promote the accuracy of modelling in BHB and similar regions.
We investigated the spatial-temporal distribution of N2O concentrations and fluxes in BHB during the summer and autumn of 2020. Potential N2O sources and possible environmental controlling factors are discussed. The main research objectives are (1) to identify whether BHB is a source of N2O to the atmosphere and (2) to investigate the effects of the unique geography and anthropogenic disturbances on the distribution and emissions of N2O.
Materials and methods
Sample collection and analysis
The survey was carried out in the summer (23 July–3 August) and Autumn (23 October–6 November) of 2020 and a total of 60 stations were investigated (Figure 1). Water samples were collected from two to three water layers with a 4 L×6 SBE 55 eco multi-channel water sample collector. Vertical distributions of temperature and salinity were simultaneously obtained with a RBRmaestro multi-parameter logger (RBR, Ottawa, Canada). On board, DO, N2O, and pH samples were instantly transferred from the water sample collector into 100 mL brown glass bottles, 60 mL brown glass bottles, and 250 mL polypropylene bottles, respectively. We followed the Winkler method to transfer, store, and analyze the DO samples (Grasshoff et al., 2009); pH samples were measured on board using the Mettler Toledo Seven Compact series pH meter (S210-K) (Mettler Toledo Technologies, Zurich, Switzerland) equipped with an Expert Pro pH probe (Mettler Toledo Technologies, Zurich, Switzerland).
N2O samples were collected by the following procedure. A silicone sampling tube was inserted into the bottom of the glass bottle (60 ml, CSN, Shanghai City, China) and filled with seawater (avoiding air bubbles). When the sample was full and overflowed at least twice the volume of the glass bottle, the silicone sampling tube was slowly withdrawn and the convex surface was maintained while saturated mercury chloride solution (0.2 ml) was added. Each bottle was covered with a butyl rubber stopper and sealed with a polyethylene cap. After collection, samples were transferred and stored in the dark under refrigeration at 4°C. Dissolved N2O concentrations in seawater samples were determined by static headspace-gas chromatography, with HP-Plot/column (J&WGC column, Agilent Technologies, USA) with an electron capture detector. We used standard gases of N2O (291, 617, and 4980 ppb) to calibrate the ECD.
The apparent oxygen utilization (AOU) is calculated as the difference between the equilibrium concentrations of dissolved oxygen ([O2]eq) at in-situ water temperature and salinity and the observed oxygen concentration. [O2]eq was estimated based on the equation of Weiss (1970). Excess N2O (ΔN2O) is the difference between the observed N2O concentration (([N2O]obs)) and the equilibrated N2O concentration ([N2O]eq) at the in-situ temperature and salinity. The [N2O]eq was calculated using the equation of Weiss and Price (1980).
The sample collection and determination of DIN (, , and ) were conducted according to the following steps. Water samples (200 mL) were filtered with a GF/F filter membrane (25 mm diameter, 0.7 μm pore size, Whatman, UK) at low pressure (<0.05 MPa). The filtrate was frozen until it was transported to the laboratory and analyzed. The concentration of DIN was measured with an AA3 Auto-Analyzer (SEAL Analytical, Norderstedt, Germany) according to the classical colorimetric methods. was measured by the indophenol blue method. and were measured by the copper-cadmium column reduction method and α-Naphthylamine method, respectively (Ehrhardt and Kremling, 2007).
Flux estimation
The N2O saturation (R, %) and sea-air emission flux (F, μmol m-2 d-1) were estimated as follows:
where the and refer to the observed dissolved N2O concentration in the surface layer and equilibrated N2O concentration corresponding to the temperature and salinity at the site (Weiss and Price, 1980). K (cm h-1) is the gas transport velocity, calculated from the wind speed (U10) and the Schmidt number (Sc). There are different equations for calculating K (Liss and Merlivat, 1986; Nightingale et al., 2000; Ho et al., 2006; Wanninkhof, 2014). Recently, the equations of K by Nightingale et al. (2000) and Wanninkhof (2014) were widely used in the shelf seas, such as the BS, the East China Sea, and the Yellow Sea (Chen et al., 2021; Gu et al., 2021). In order to compare the N2O fluxes between BHB and other shelf seas, the above two equations of K were supplied in our study. The formulas are as follows:
where U10 (m s−1) is the average of wind speeds measured at a height of 10 m above the sea surface with a shipboard automatic weather station for each cruise.
Models and analysis
We used an aggregated boosted tree (ABT) to analyze and estimate the relative influence of the environmental variables of the water column on the N2O concentrations based on the “gbmplus” package in R (De’ath, 2001; Elith et al., 2008). Multiple linear regression (MLR) models with forward selection were applied to analyze the relative quantitative effect of the environmental parameters on the N2O concentration, according to the regression coefficients of the MLR equation (Duan et al., 2012). Generalized additive models (GAM) were used to analyze the correlation between N2O response and the top three most dominant environmental variables (, DO, and temperature). The fitting of GAM models was performed by the ‘mgcv’ package in R to individually fit the responses of , DO, and temperature to N2O concentrations. Moreover, the relationships between the AOU and versus ΔN2O were investigated with simple unary linear regression analysis. Both the multiple and unary linear regression were performed using SPSS software (version 23.0).
Results
Hydrographic conditions
Temperature and salinity in seawater showed spatial-temporal variation (Figure 2). The average temperature of seawater in summer (25.4 ± 2.7 °C) from all the water layers was observed to be higher than in autumn (15.8 ± 1.0 °C). In summer, the temperature in the three layers exhibited a declining gradient from the coastal to the offshore area, especially in the bottom layer. The temperature distribution patterns of the three layers in autumn were completely different from that in summer, with low temperatures in the coastal area and high temperatures in the center of BHB. The average temperature in summer was approximately 10°C higher than in autumn. Compared to temperature, the variation of salinity in BHB was relatively small and mainly occurred in the estuary as controlled by diluted water input from rivers. Evident gradients of salinity occurred in the estuary of the Hai River and the Yellow River, which deliver the largest freshwater input into BHB. In addition, the ranges of the depth for each layer (surface layer, middle layer and bottom layer) were set by averagely dividing the depth of water column into three parts. The temperature and salinity show relatively small vertical gradients and exhibit similarities between the surface, middle, and bottom layers.
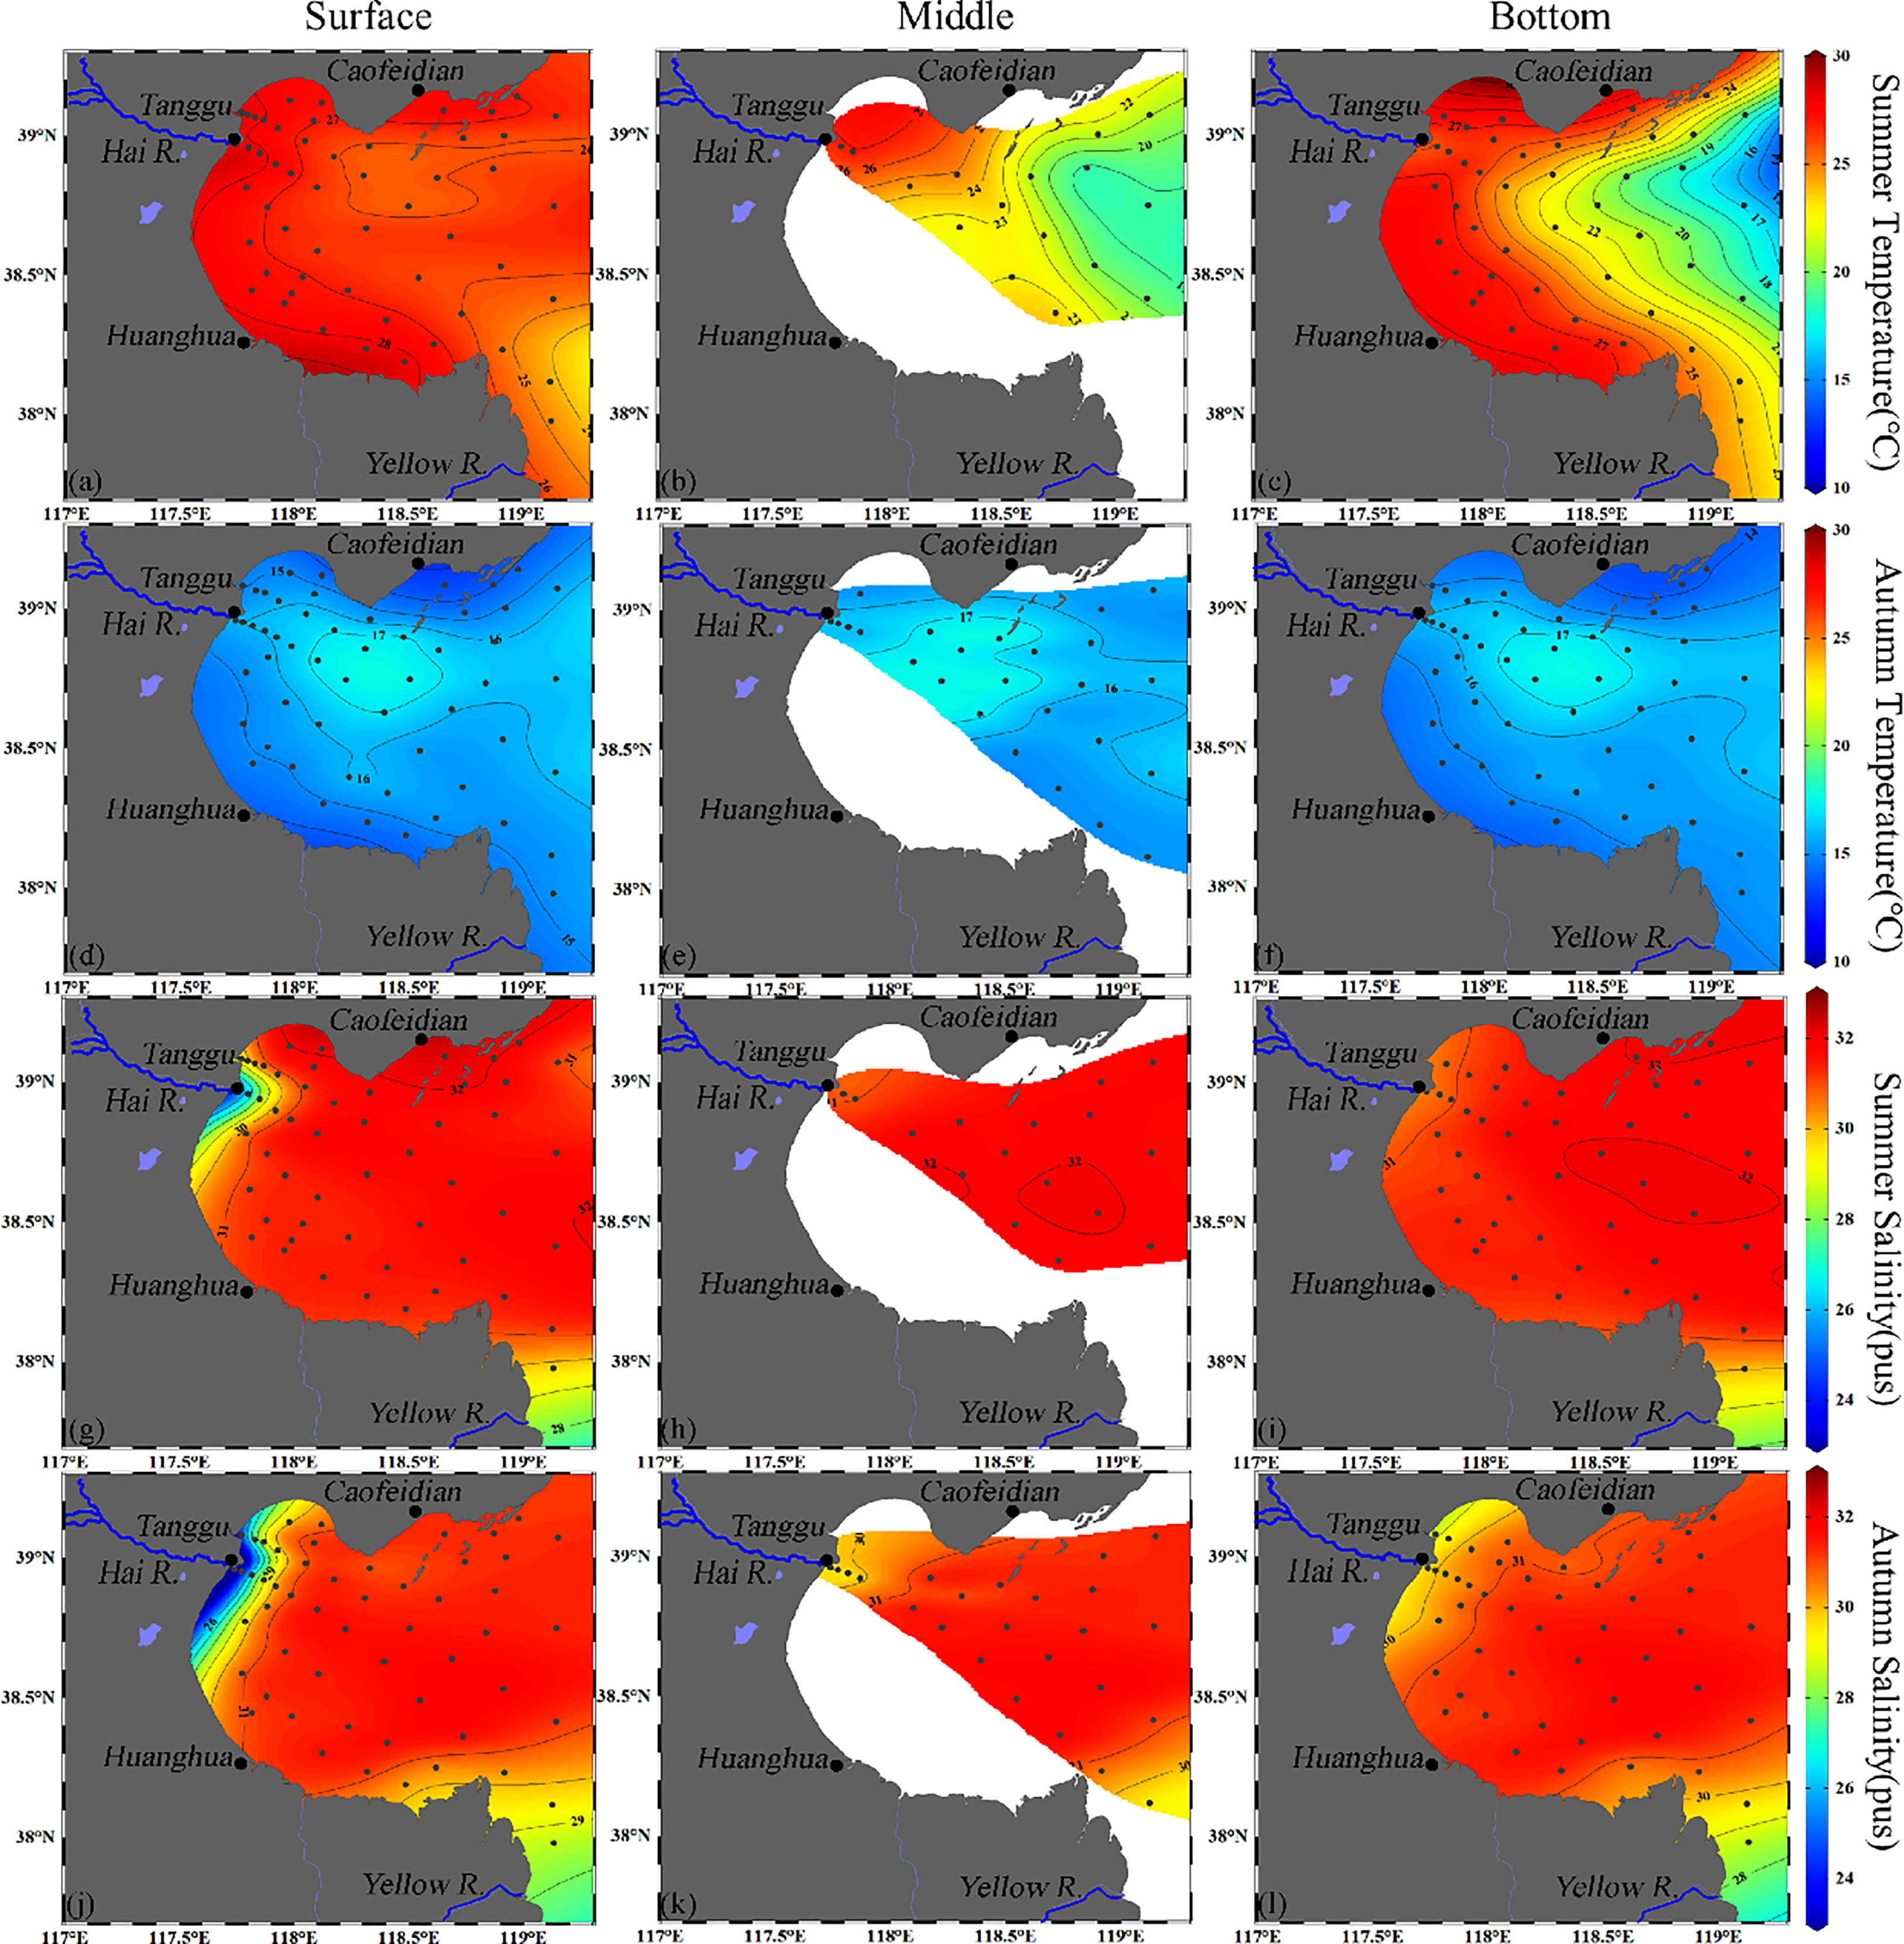
Figure 2 Horizontal distribution of temperature (°C) (A–G) and salinity (H–L) of surface, middle, and bottom waters of BHB during summer and autumn, 2020.
The average concentrations were higher in summer (2.6 ± 1.6 μmol L-1) than in autumn (1.7 ± 2.1 μmol L-1) (Figure 3). The hotspots of mainly occurred in the Hai River estuary, the coast of Caibeidian and Huanghua, and central BHB. The DO temporal distribution showed the mean DO concentrations in autumn was higher than in summer. Low DO concentrations were mainly observed in the Hai River estuary areas (Figure 3).
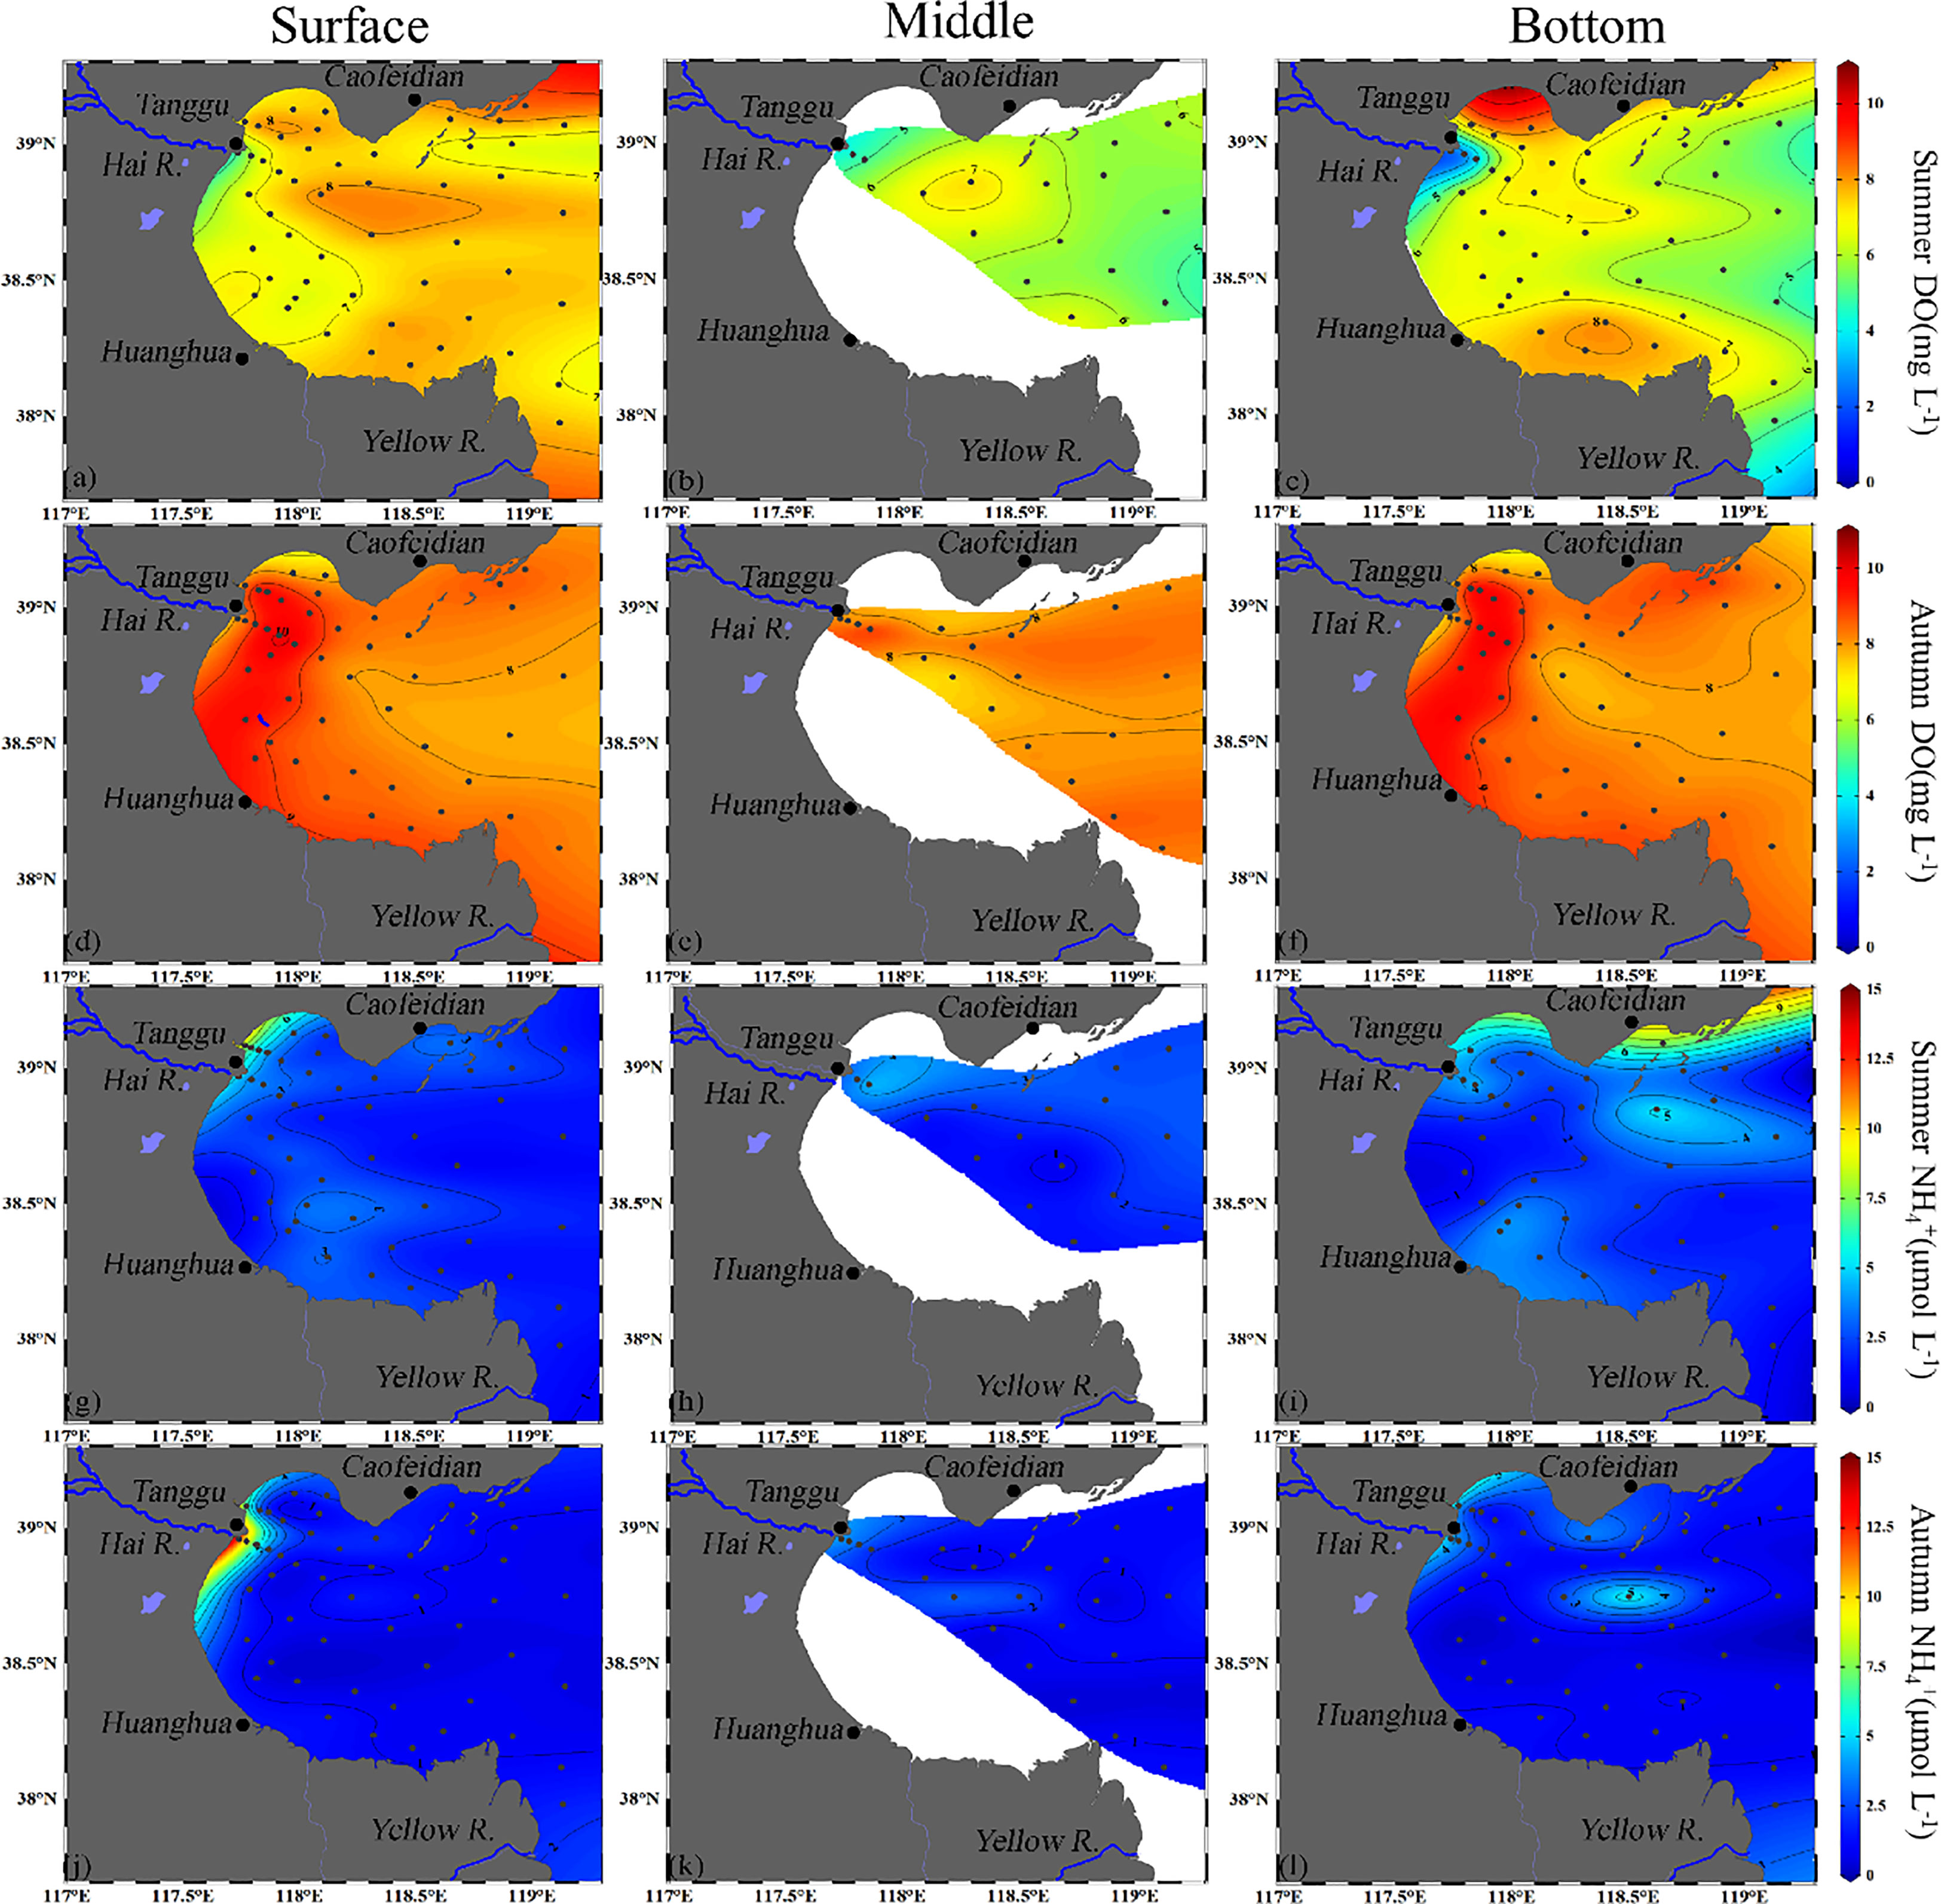
Figure 3 Horizontal distribution of DO (mg L-1) (A–F) and (μmol L-1) (G–L) of surface, middle and bottom waters of BHB during Summer and Autumn, 2020.
Horizontal distribution of N2O
Average N2O concentrations were found to be higher in summer (32.3 ± 6.5 nmol L-1) than in autumn (23.2 ± 4.6 nmol L-1) and the N2O distribution patterns of the two seasons were also distinct (Figure 4). In summer, the three layers exhibited a similar distribution pattern of N2O concentration, with average concentrations of 32.6 ± 6.4, 32.9 ± 6.6, and 32.4 ± 7.7 nmol L-1 in the surface, middle, and bottom layers, respectively. N2O hotspots occurred in the estuaries of the Yellow River and the Hai River, and the coastal waters adjacent to the Caofeidian and Huanghua. Other areas had relatively low concentrations and the lowest concentrations occurred at the northern mouth of BHB because of the inflow of water with low N2O concentration from the central basin of the BS. In autumn, N2O distributions were still similar in the three layers, with average concentrations of 23.6 ± 8.1, 23.1 ± 3.1, and 22.7 ± 4.4 nmol L-1 in the surface, middle, and bottom layers, respectively. Unlike summer, besides the Hai River estuary and coastal waters adjacent to the Caofeidian, high N2O concentrations were found at the center of BHB.
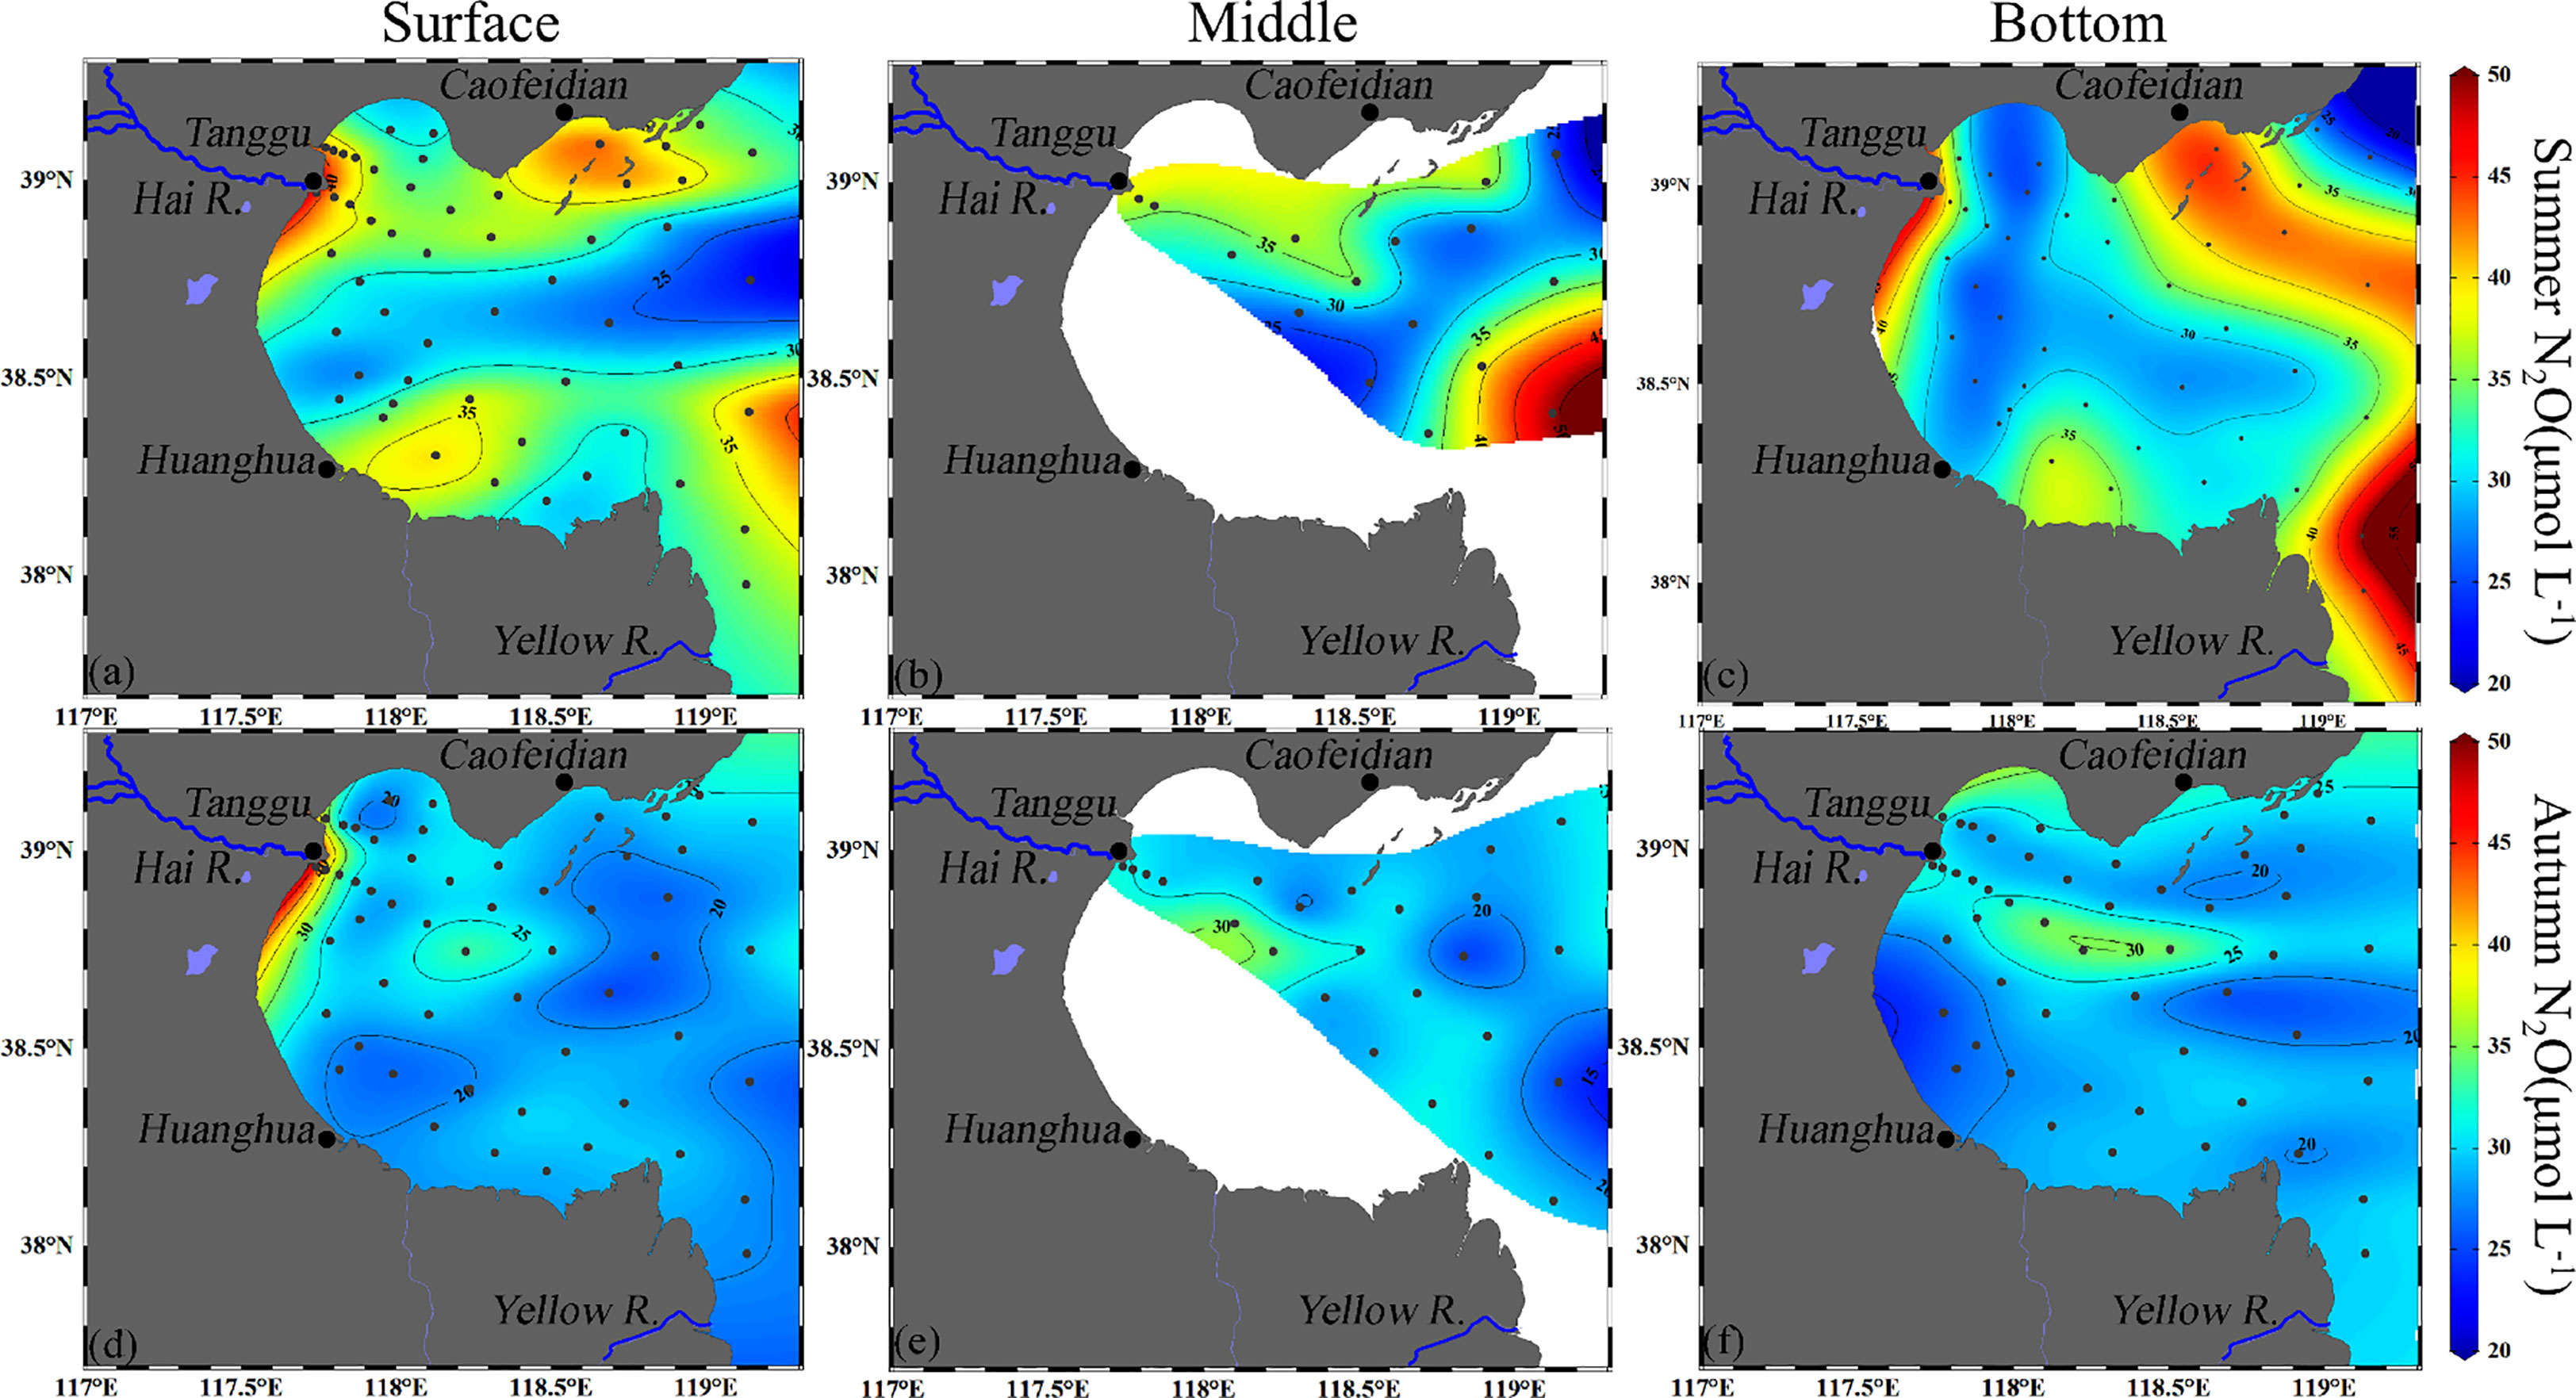
Figure 4 Horizontal distribution of N2O (nmol L-1) at the surface, middle and bottom of BHB during summer (A–C) and autumn (D–F) 2020.
Vertical distribution of N2O and other parameters
A section in BHB was chosen to study the seasonal and spatial variations in the vertical distributions of N2O as well as temperature, salinity, DO, and (Figures 5, S1). The transect spans the entire BHB from the Hai River estuary to the Yellow River estuary (Figure 5). The temperature decreased from the Hai River estuary (summer: 27.1 ± 1.2 °C; autumn: 16.0 ± 0.4 °C) to the Yellow River estuary (summer: 24.2 ± 0.6 °C; autumn: 15.3 ± 0.02 °C), while salinity decreased from the Hai River estuary (28.5 ± 3.1 pus) and the Yellow River estuary (29.7 ± 0.2 pus) to the offshore sea (31.4 ± 0.8 pus) in the two seasons. Low DO concentrations were found in the Hai River estuary with the lowest DO concentrations observed in the bottom layer. Elevated concentrations occurred in the Hai River estuary with higher concentration observed in autumn than in summer. In addition, the vertical profiles of N2O in BHB exhibited a higher variation in summer than in autumn. In summer, the highest N2O concentrations occurred at the bottom of the Yellow River and the Hai River estuary, whereas low N2O concentrations were found far from the estuaries. In autumn, except for a N2O hotspot in the surface water of Hai River estuary, the transect showed relatively uniform vertical distribution, likely due to strong vertical mixing generated by high wind speeds (up to 10.4 m s-1) and shallow water depths.
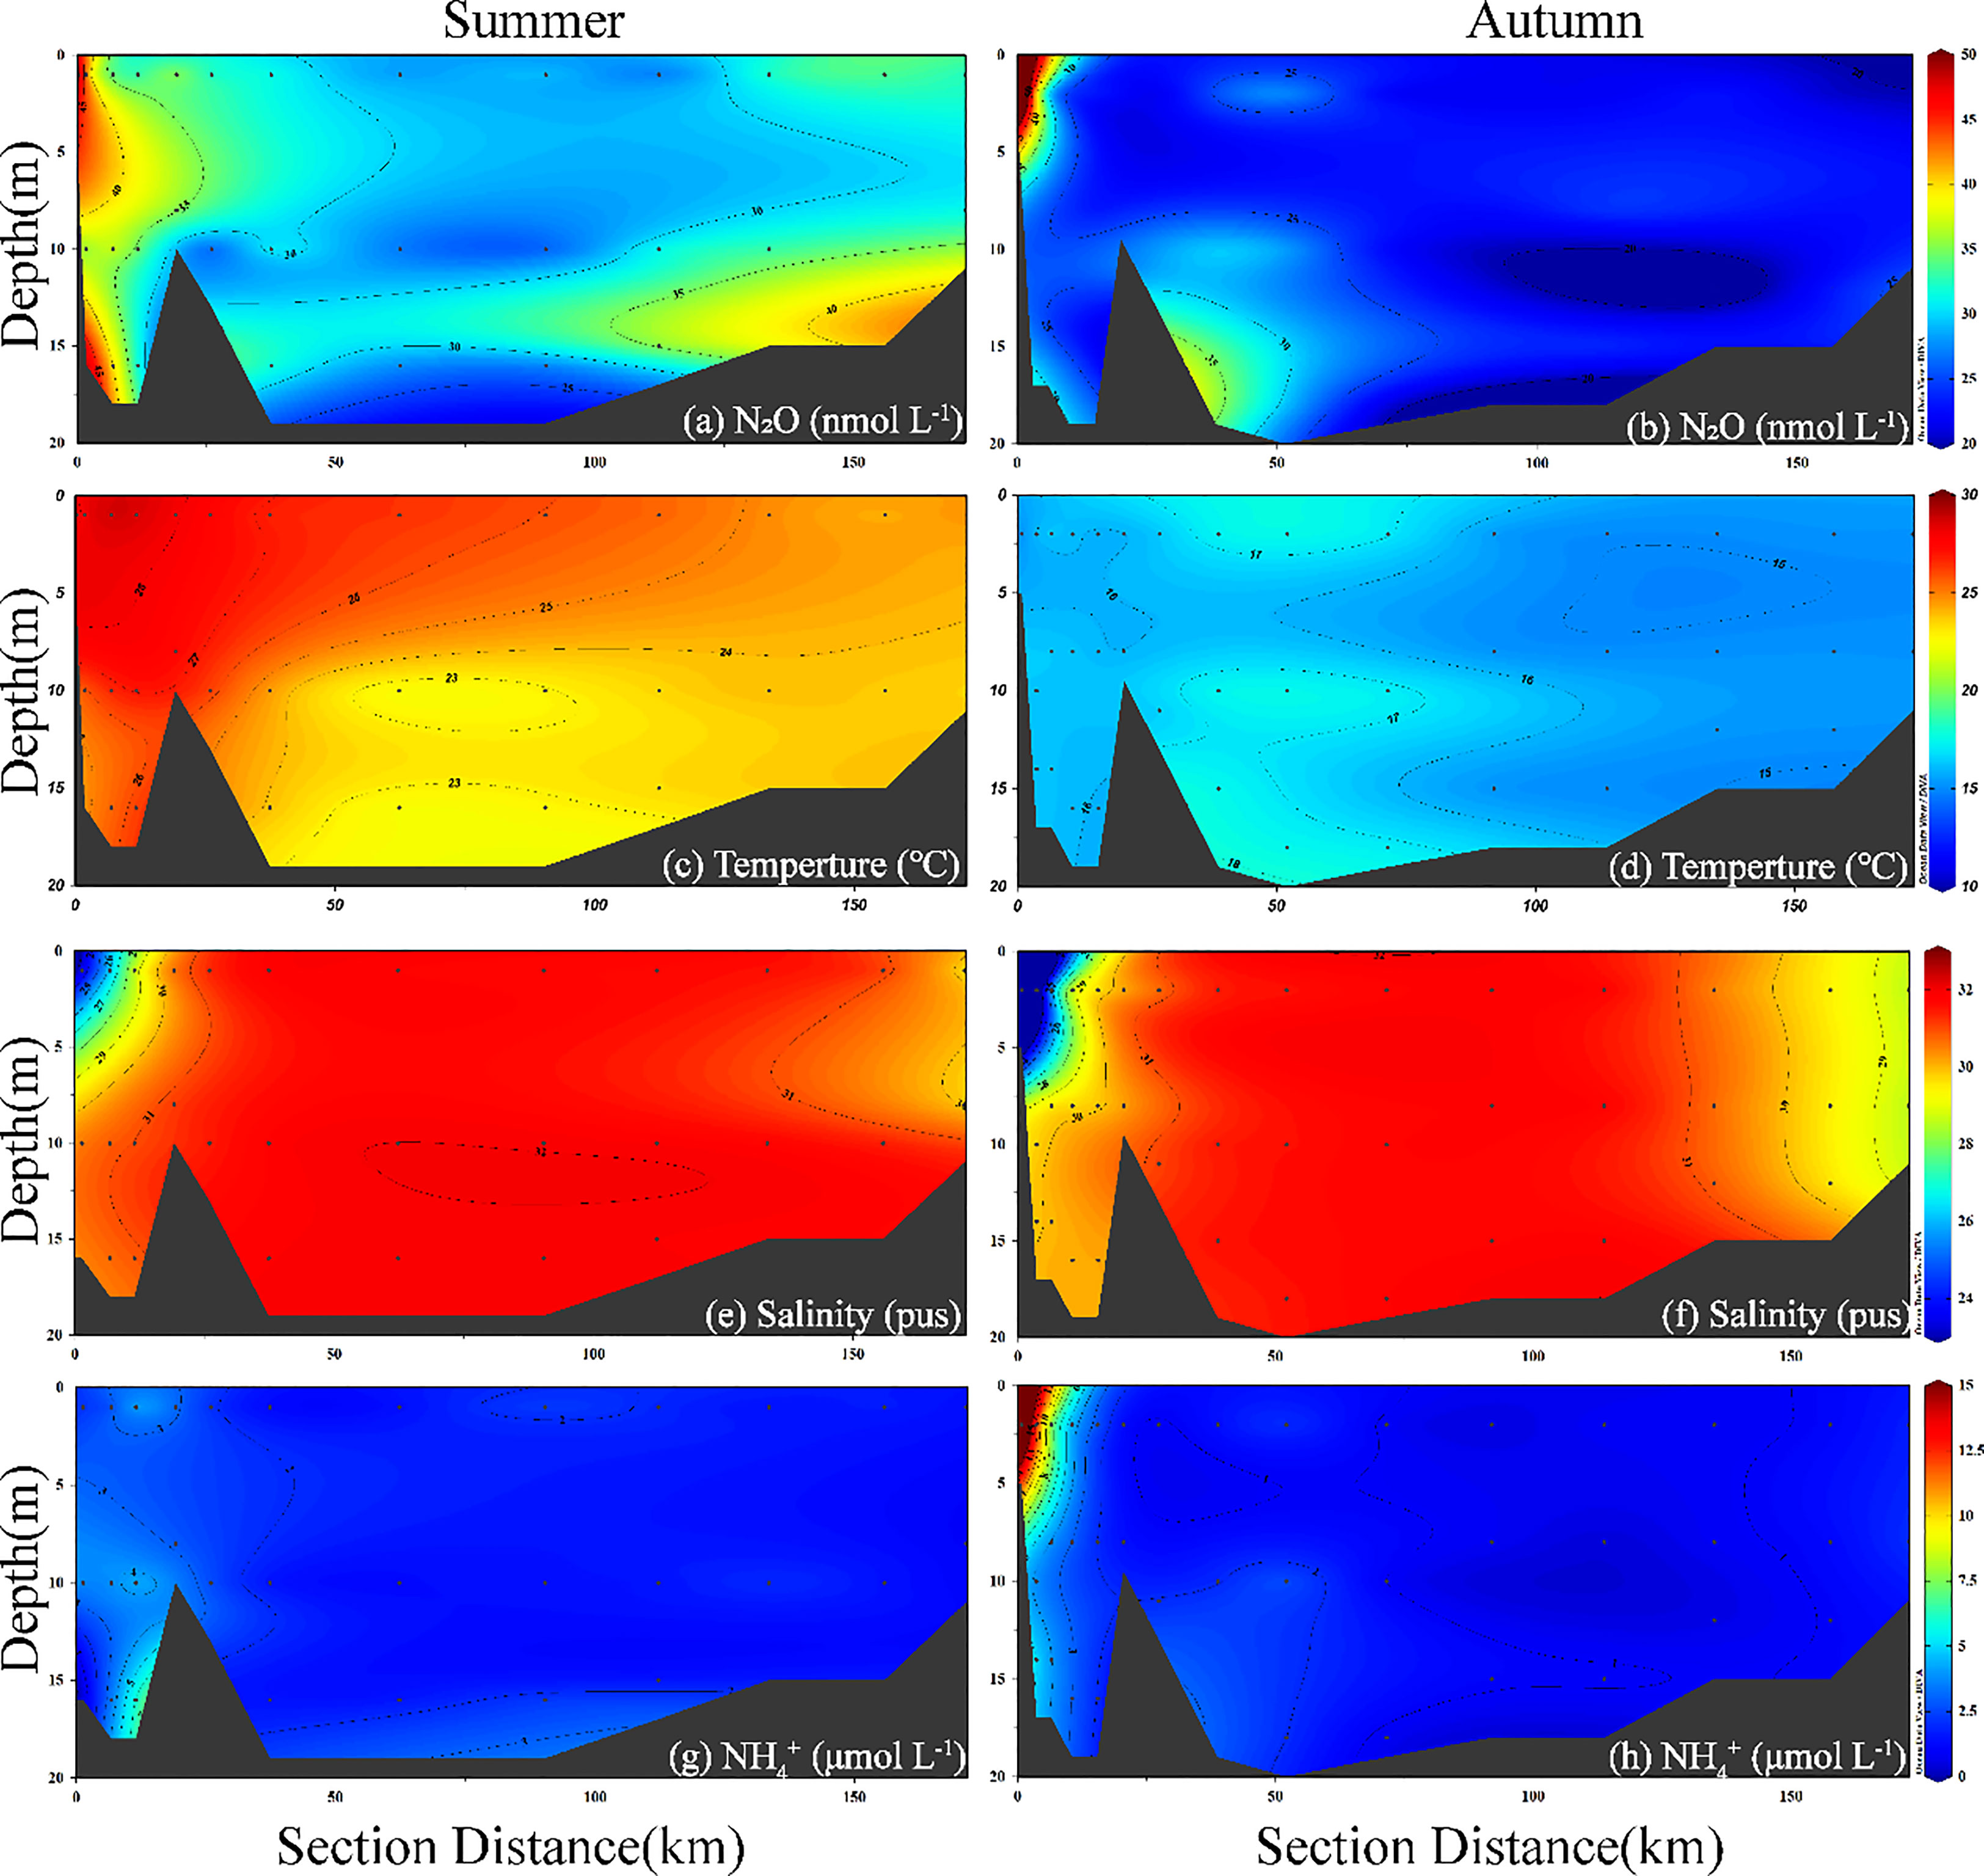
Figure 5 Vertical distribution of the selected transect in BHB (see green line in Figures 1B, C) for N2O (nmol L-1) (A, B), temperature (°C) (C, D), salinity (E, F), (μmol L-1) (G, H), during summer and autumn 2020.
Sea-air flux
In general, N2O saturations in the surface layer were found to be higher in summer than in autumn, with a mean value of 495.1 ± 101.0% and 249.8 ± 80.4% in summer and autumn, respectively (Table 1; Figure S2). Figure 6 and Table 1 show the N2O emissions from the two seasons. We found that fluxes estimated by the equations of Nightingale were on average 93.9% of fluxes estimated by Wanninkhof. Figure 6 shows that all fluxes of N2O were observed to be positive for the two seasons in BHB, with average fluxes in summer (32.0 ± 8.3 μmol m-2 d-1) higher than in autumn (19.1 ± 11.5 μmol m-2 d-1).
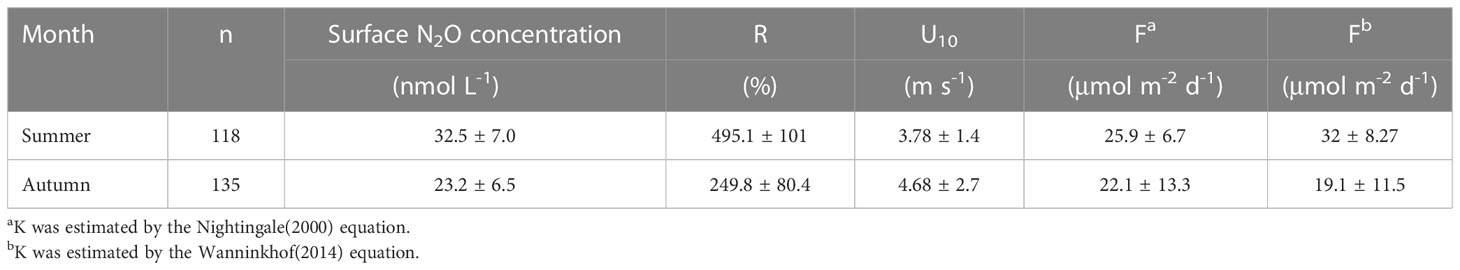
Table 1 Mean values and standard deviations of surface N2O concentration, saturation (R), and sea-air fluxes (F) of N2O in BHB during summer and autumn 2020.
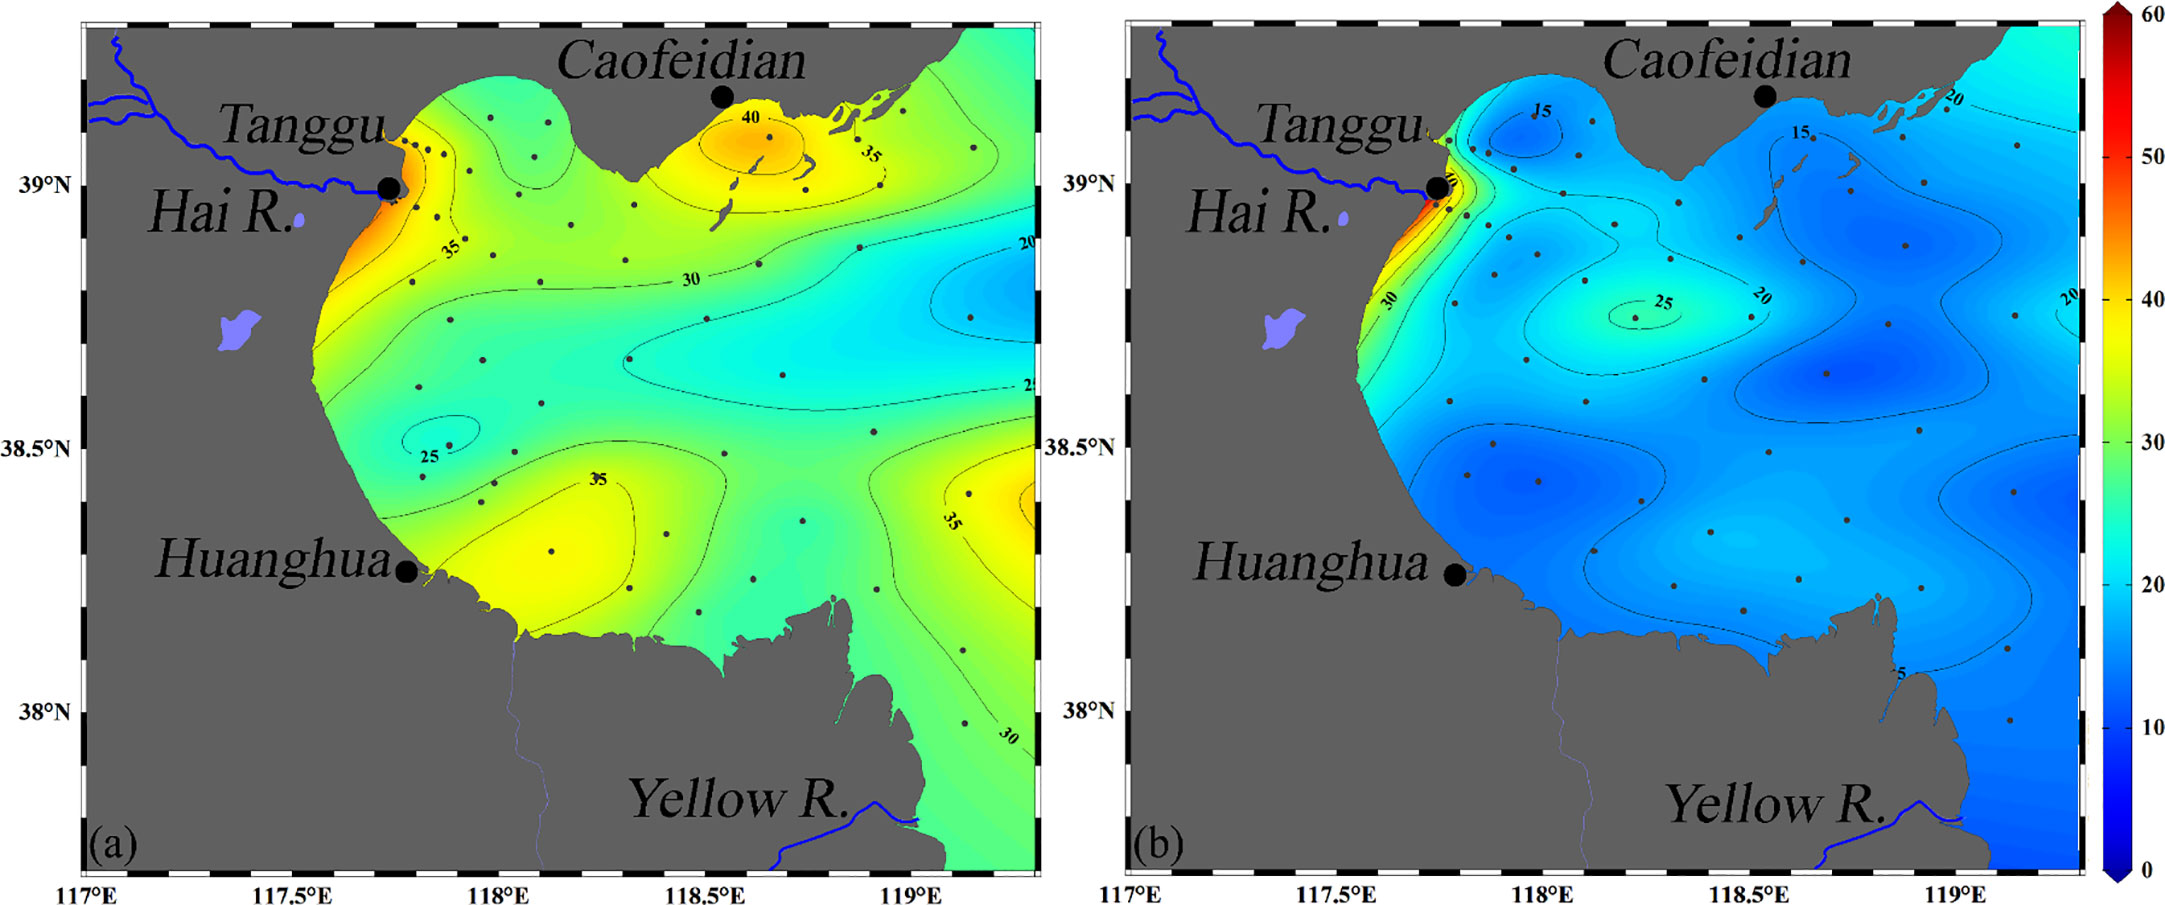
Figure 6 Horizontal distribution of air-sea N2O flux (μmol m-2 d-1) based on the equation of Wanninkhof (2014) during summer (A) and autumn (B) in BHB.
Discussion
Spatial and temporal changes in N2O
Variations of N2O concentrations in different seasons were evident and average N2O concentrations were observed to be higher in summer than in autumn, which was similar to results reported in the central BS, the East China Sea, and the Yellow Sea (Chen et al., 2021; Gu et al., 2021). As the main substrate of nitrification in N2O production (Katipoglu-Yazan et al., 2012), average concentrations of were higher in summer than in autumn, which is beneficial for the promotion of N2O. Moreover, owing to the development of the monsoon in July and August, rainfall and heat become abundant in summer. On one hand, high temperature in summer supports high N2O production; on the other hand, due to high precipitation and riverine runoff, the diluted water with high N2O concentrations, e.g., the Yellow River (Ma et al., 2016), elevates N2O input from rivers in summer. However, since the nutrients and organic matter in the water column and sediment are largely consumed in summer at high temperatures, the activities of microbes decline in autumn (Liu et al., 2016), which limits in situ production of N2O from nitrification and denitrification in the water and sediment in autumn.
The horizontal distribution of N2O was not uniform. N2O hotspots mainly occurred in the estuarine and coastal areas due to riverine and coastal discharge, mixing of water masses, and in situ N2O production, which is discussed in the following section of “main sources of N2O”. Wind and shallow depths in BHB led to well vertical mixing in summer and autumn, with a similar spatial distribution of N2O concentrations found in the three water layers (Figure 4).
Main sources of N2O
River input
As a typical semi-enclosed inner bay, BHB is influenced by riverine discharge, particularly from the Yellow River and the Hai River. In our study, N2O distribution decreased from estuarine regions to the offshore areas (Figures 4, 5), indicating the key role of riverine N2O input. This phenomenon was also observed in other bays and shelf seas, such as the eastern shelf of the bay of Cadiz (Sierra et al., 2017), the seasonally upwelling shelf waters of the southern British Columbia coastal system (Capelle and Tortell, 2016), and the shelf sea of the East China Sea and the South Yellow Sea (Chen et al., 2021). On one hand, riverine water with abundant N2O has generally been considered the main source contributing to the high N2O concentrations in many estuaries and coasts (Sierra et al., 2017; Bange et al., 2019). On the other hand, nutrient and organic matter from rivers cannot also be ignored, as they can change the nitrogen biogeochemical processes and indirectly promote N2O production by stimulating the N2O bio-production, which will be discussed in detail in Section of “In situ N2O production”.
The Yellow River, the second-largest river in China, is well-known for its high sediment load (Milliman and Farnsworth, 2013). At Stn Kenli, which is within low reaches of the Yellow River, approximately 72 km far from the estuary, Ma et al. (2016) observed that N2O was oversaturated (107.5% to 345.5%, with a mean of 154.1 ± 68.3%) and N2O concentration ranged between 8.78 – 24.26 nmol L−1 with an average of 17.80 ± 4.90 nmol L-1 during all 14 months of the observation period. In addition, N2O concentrations were slightly higher in summer than in autumn due to lower temperatures (Ma et al., 2016). N2O annual discharge from the Yellow River to the sea was approximately 2.27 × 10⁵ mol yr-1. Compared to adjacent offshore regions, the N2O concentrations of the Yellow River estuary were observed to be relatively higher in summer (Figures 4, 5). Ma et al. (2016) also found a high N2O concentration of the surface water in the Yellow River estuary during the summer of 2009 (Ma et al., 2016). Therefore, we infer that diluted water from the Yellow River with high N2O concentrations contributed to the high N2O concentrations of the Yellow River coastal current —this was also indicated by increasing salinity along the southwest bank of Bohai Bay in the Yellow River estuary (Figure 5). Nevertheless, in autumn, the N2O concentrations in the Yellow River estuary were similar or even slightly lower than in the adjacent areas, which indicated poor in-situ production and low N2O riverine input due to relatively low riverine runoff.
Hai River is one of the most heavily polluted rivers in China flowing 650 km from Beijing through an industrial city Tianjin, to BHB. It is a typical water-gate-controlled river. Previous research points out, oversaturated N2O water was found to discharge from coastal rivers into the northwest bank of BHB, with ranges of 12.70–115.69 nmol L-1 and 164–1502% for N2O concentration and saturation, respectively (Tang et al., 2022). Among the investigated rivers, the highest concentrations were found in Hai River (Tang et al., 2022). Because the opening/closing of water gates was controlled manually, the variations of N2O discharge also were stochastic. Hence, because sampling in autumn was during a period of opening of the water gate, higher N2O concentrations and larger ranges of diluted water (deduced from the salinity gradient) from the Hai River in the surface were found in autumn than in summer (Figure 5). Therefore, the variation of N2O discharge from the water-gate-controlled rivers is complex and more detailed investigation is needed.
In situ N2O production
In situ microbial production by denitrification and nitrification has been generally considered to be the dominant paths of N2O bio-production in the shelf sea and open ocean (Burgos et al., 2017; Sierra et al., 2017; Yang et al., 2020; Chen et al., 2021; Gu et al., 2021), with nitrification as the major process. Except for the Hai River and adjacent areas in the summer, the minimum concentration of DO in the water column of BHB (5.12 mg L-1) surpassed the oxygen threshold of denitrification (≤2 mg L-1 = 62.5 μmol L-1 (Codispoti et al., 2000)). Hence, the production of N2O from denitrification in the water column may have been neglected according to previous researches in the adjacent sea of the central BS, the East China Sea, and the Yellow Sea (Chen et al., 2021; Gu et al., 2021). However, high concentrations of N2O were also found at the water-sediment interface, particularly in the coastal and estuarine regions, which may be related to suspended particulate matter (SPM) in the water column and sediment denitrification.
Tidal currents resuspend particulates from the sediment, resulting in SPM becoming an important component in BHB (Bolin and Cook, 1983). The Yellow River is also well known for its high SPM, which is one of the most important SPM sources in BHB (Ma et al., 2016). Accordingly, the SPM concentration of BHB is relatively higher compared to other parts of the BS. The average concentration of SPM in BHB has been reported to be 45.5 mg L-1 (Qin and Li, 1982), with higher concentrations of SPM found in coastal regions and the Yellow River estuary (Cui et al., 2009). Moreover, the particle size of SPM in BHB is in the range of 4–250 µm and the average particle size is 44 µm (Wang et al., 2017). In addition, nirk and nirS genes, which code nitrite reductases in denitrification, were detected by real-time quantitative PCR in the water column of BHB, indicating that both of them played important roles during the denitrification in the water column in BHB (Wang et al., 2019). Based on these results, we suggest that SPM due to the relatively high turbidity water of BHB could potentially provide redox conditions for CND to occur in oxic water and stimulate the release of N2O, which is similar to the result about CND of SPM in Hangzhou Bay (Zhu et al., 2018). Further, the emission of N2O from sediment denitrification could contribute to the increase of N2O in BHB. Chen et al. (2021) showed that the fluxes of N2O emission in sediments of the adjacent South Yellow Sea could reach 0.14 μmol m−2 d−1. An investigation of denitrifying bacterial communities indicated that nosZ gene-encoded denitrifying bacteria was found in the sediment of the BS and nosZ sequences were mainly from Alpha-, Beta-, and Gammaproteo bacteria (Cai et al., 2019). Hence, the emission of N2O from the denitrification of sediment and SPM in the water column may potentially increase N2O in BHB.
Nitrification can be verified by a positive linear correlation between ΔN2O and AOU. Moreover, as an end product of nitrification, is also negatively related to DO, which has been generally used to identify N2O nitrification production processes (Sierra et al., 2017; Ji et al., 2019). Hence, to identify the N2O production process in BHB, the correlation between ΔN2O versus AOU and ΔN2O versus was computed (Figure 7). In summer, ΔN2O was positively (but not strongly) related to AOU, whereas showed no significant relationship with AOU, possibly because the linear relationship from the in-situ nitrification may be interrupted by the transport of N2O and nutrients from the coast and central BHB. In autumn, ΔN2O showed a positive (but still not strong) correlation with AOU, whereas showed a positive linear relationship with AOU. However, even though the evidence is not strong, part of the in-situ N2O production appears to be from nitrification. First, as mentioned above, DO concentrations in most areas in BHB were above the threshold for denitrification. Second, as the dominant substrate in nitrification (Katipoglu-Yazan et al., 2012), was positively related to N2O (Figure 8). Third, the slope of the ΔN2O–AOU relationship is considered as the dissolved N2O production of nitrification, implying the amount of N2O yield per amount of O2 expended (Grundle et al., 2012; Han et al., 2013). N2O from nitrification was estimated from a linear relationship of ΔN2O versus AOU in this study, ranging from 0.029 - 0.079 nM N2O/μM O2 in BHB, which falls in the range (0.025–0.090 nM N2O/μM O2) in the central BS where N2O production was dominated by nitrification (Gu et al., 2021). So, these results re-confirm that N2O production in BHB is partly through nitrification in the water column, especially in offshore sea.
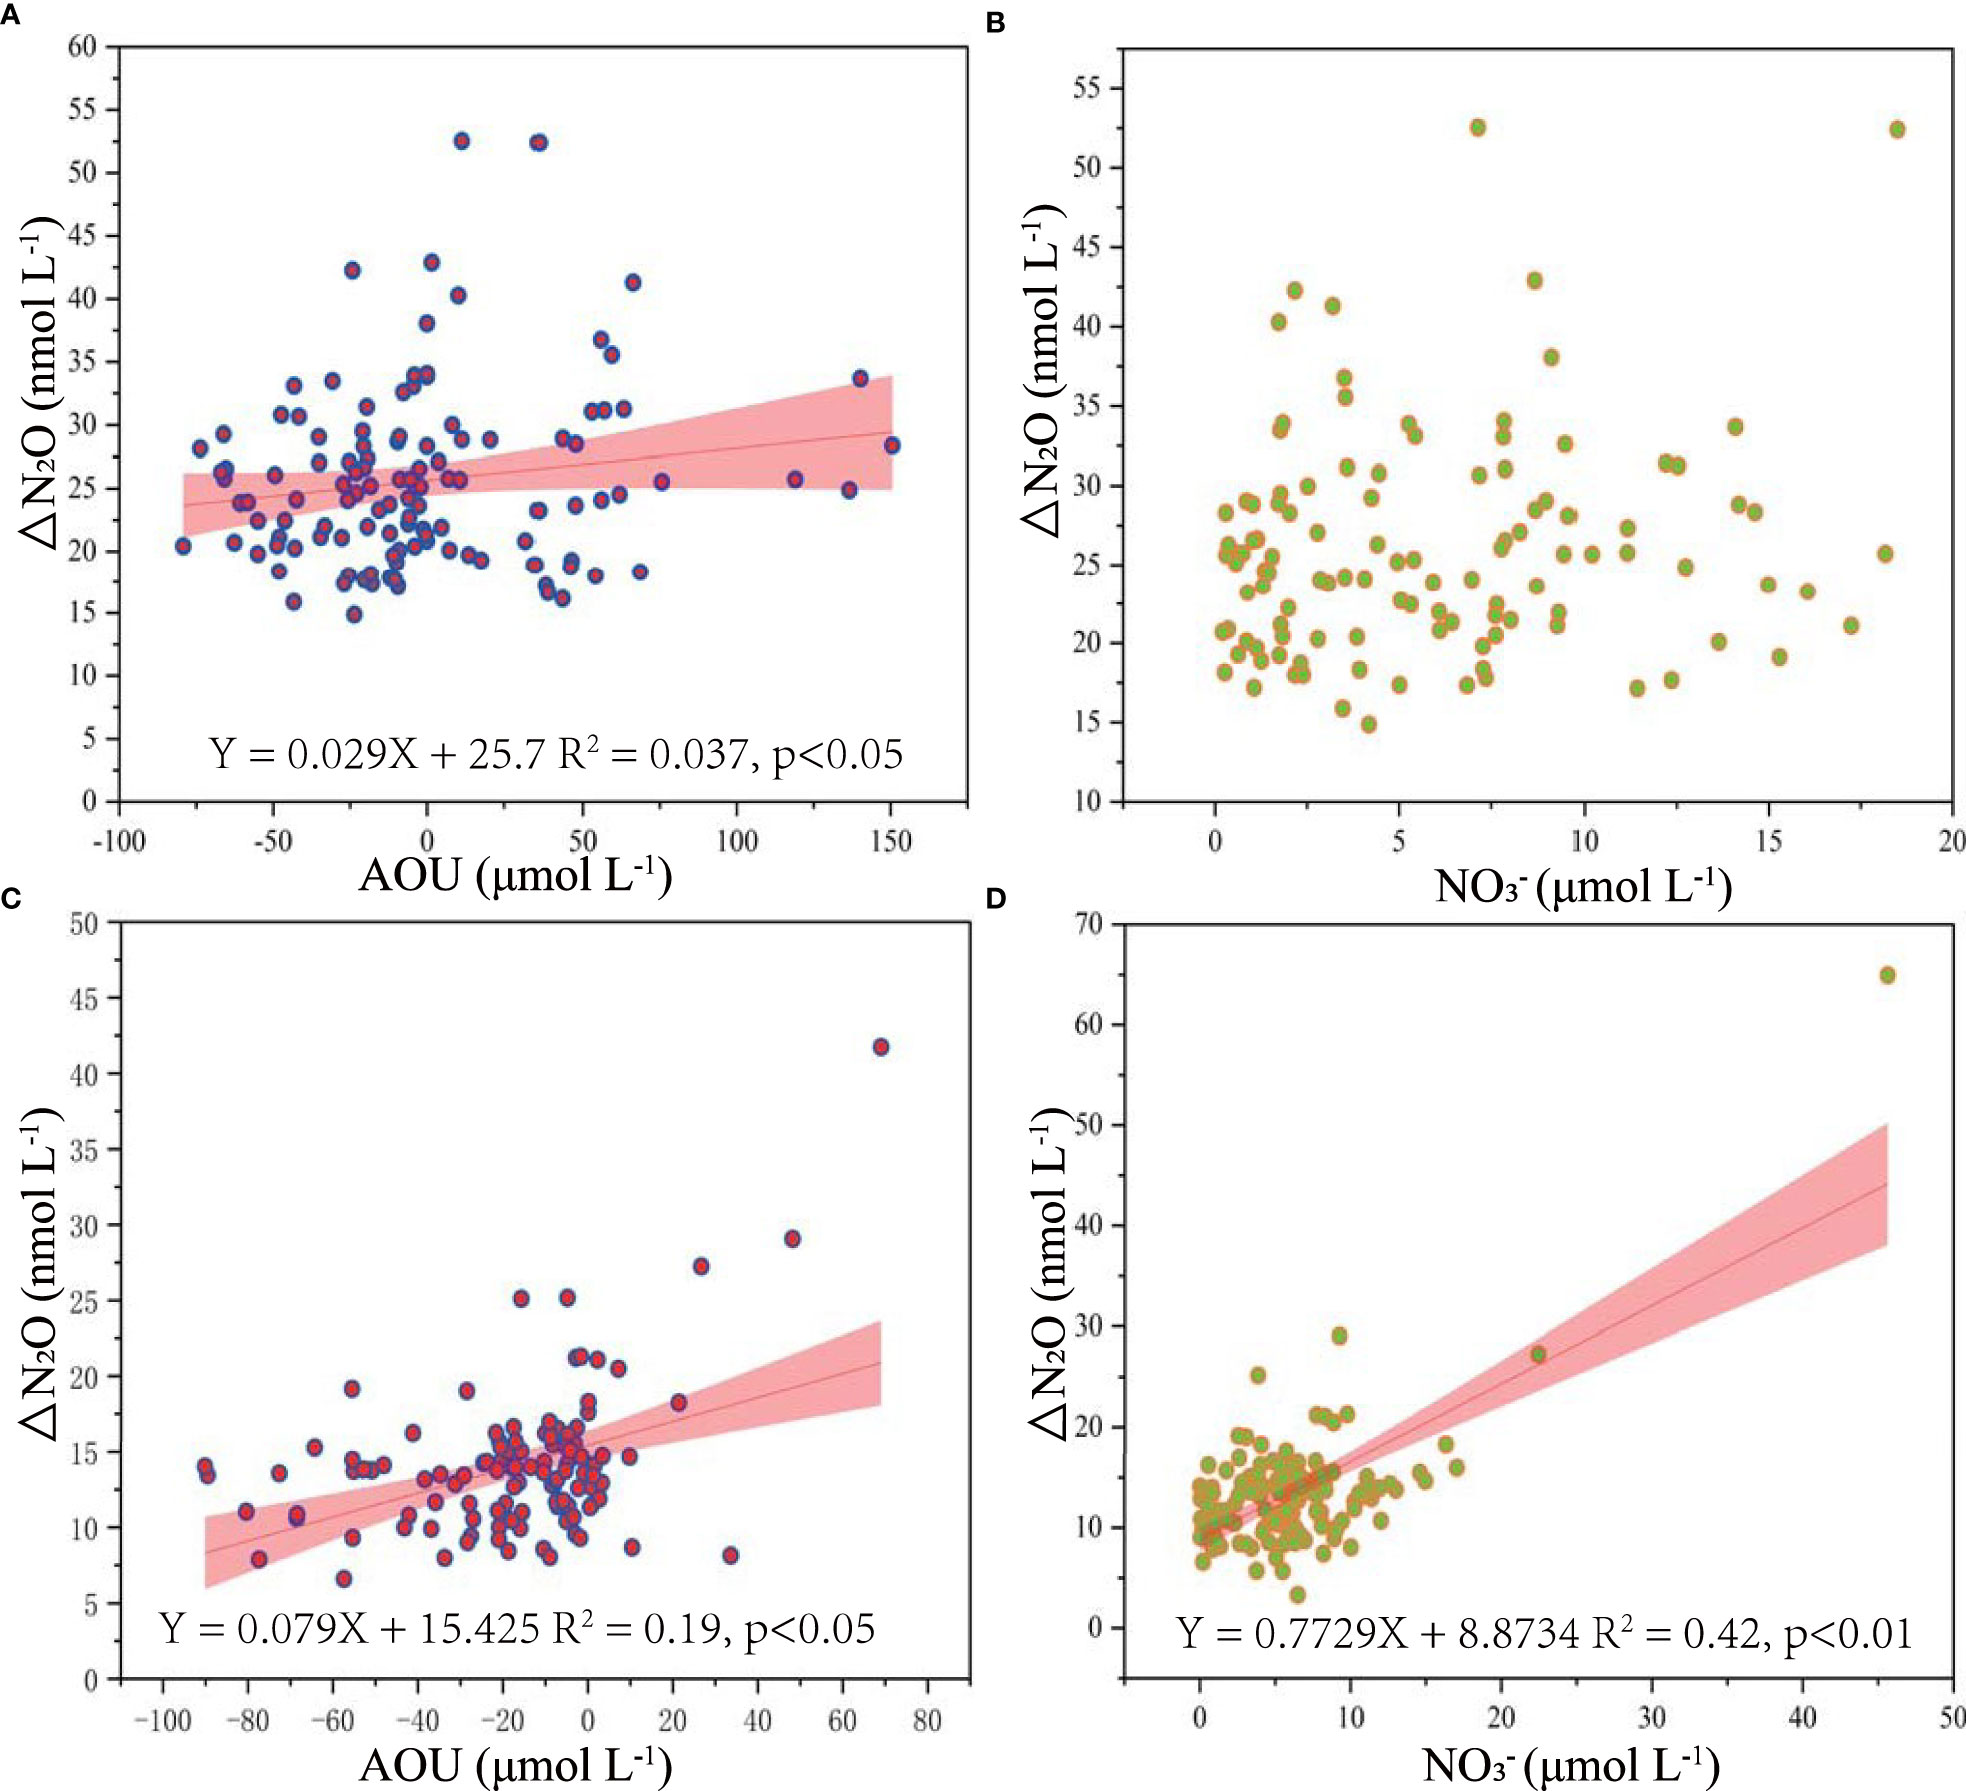
Figure 7 Correlation of ΔN2O (nmol L−1) with AOU (μmol L−1) and (μmol L−1) in BHB during summer (A, B) and autumn (C, D) 2020.
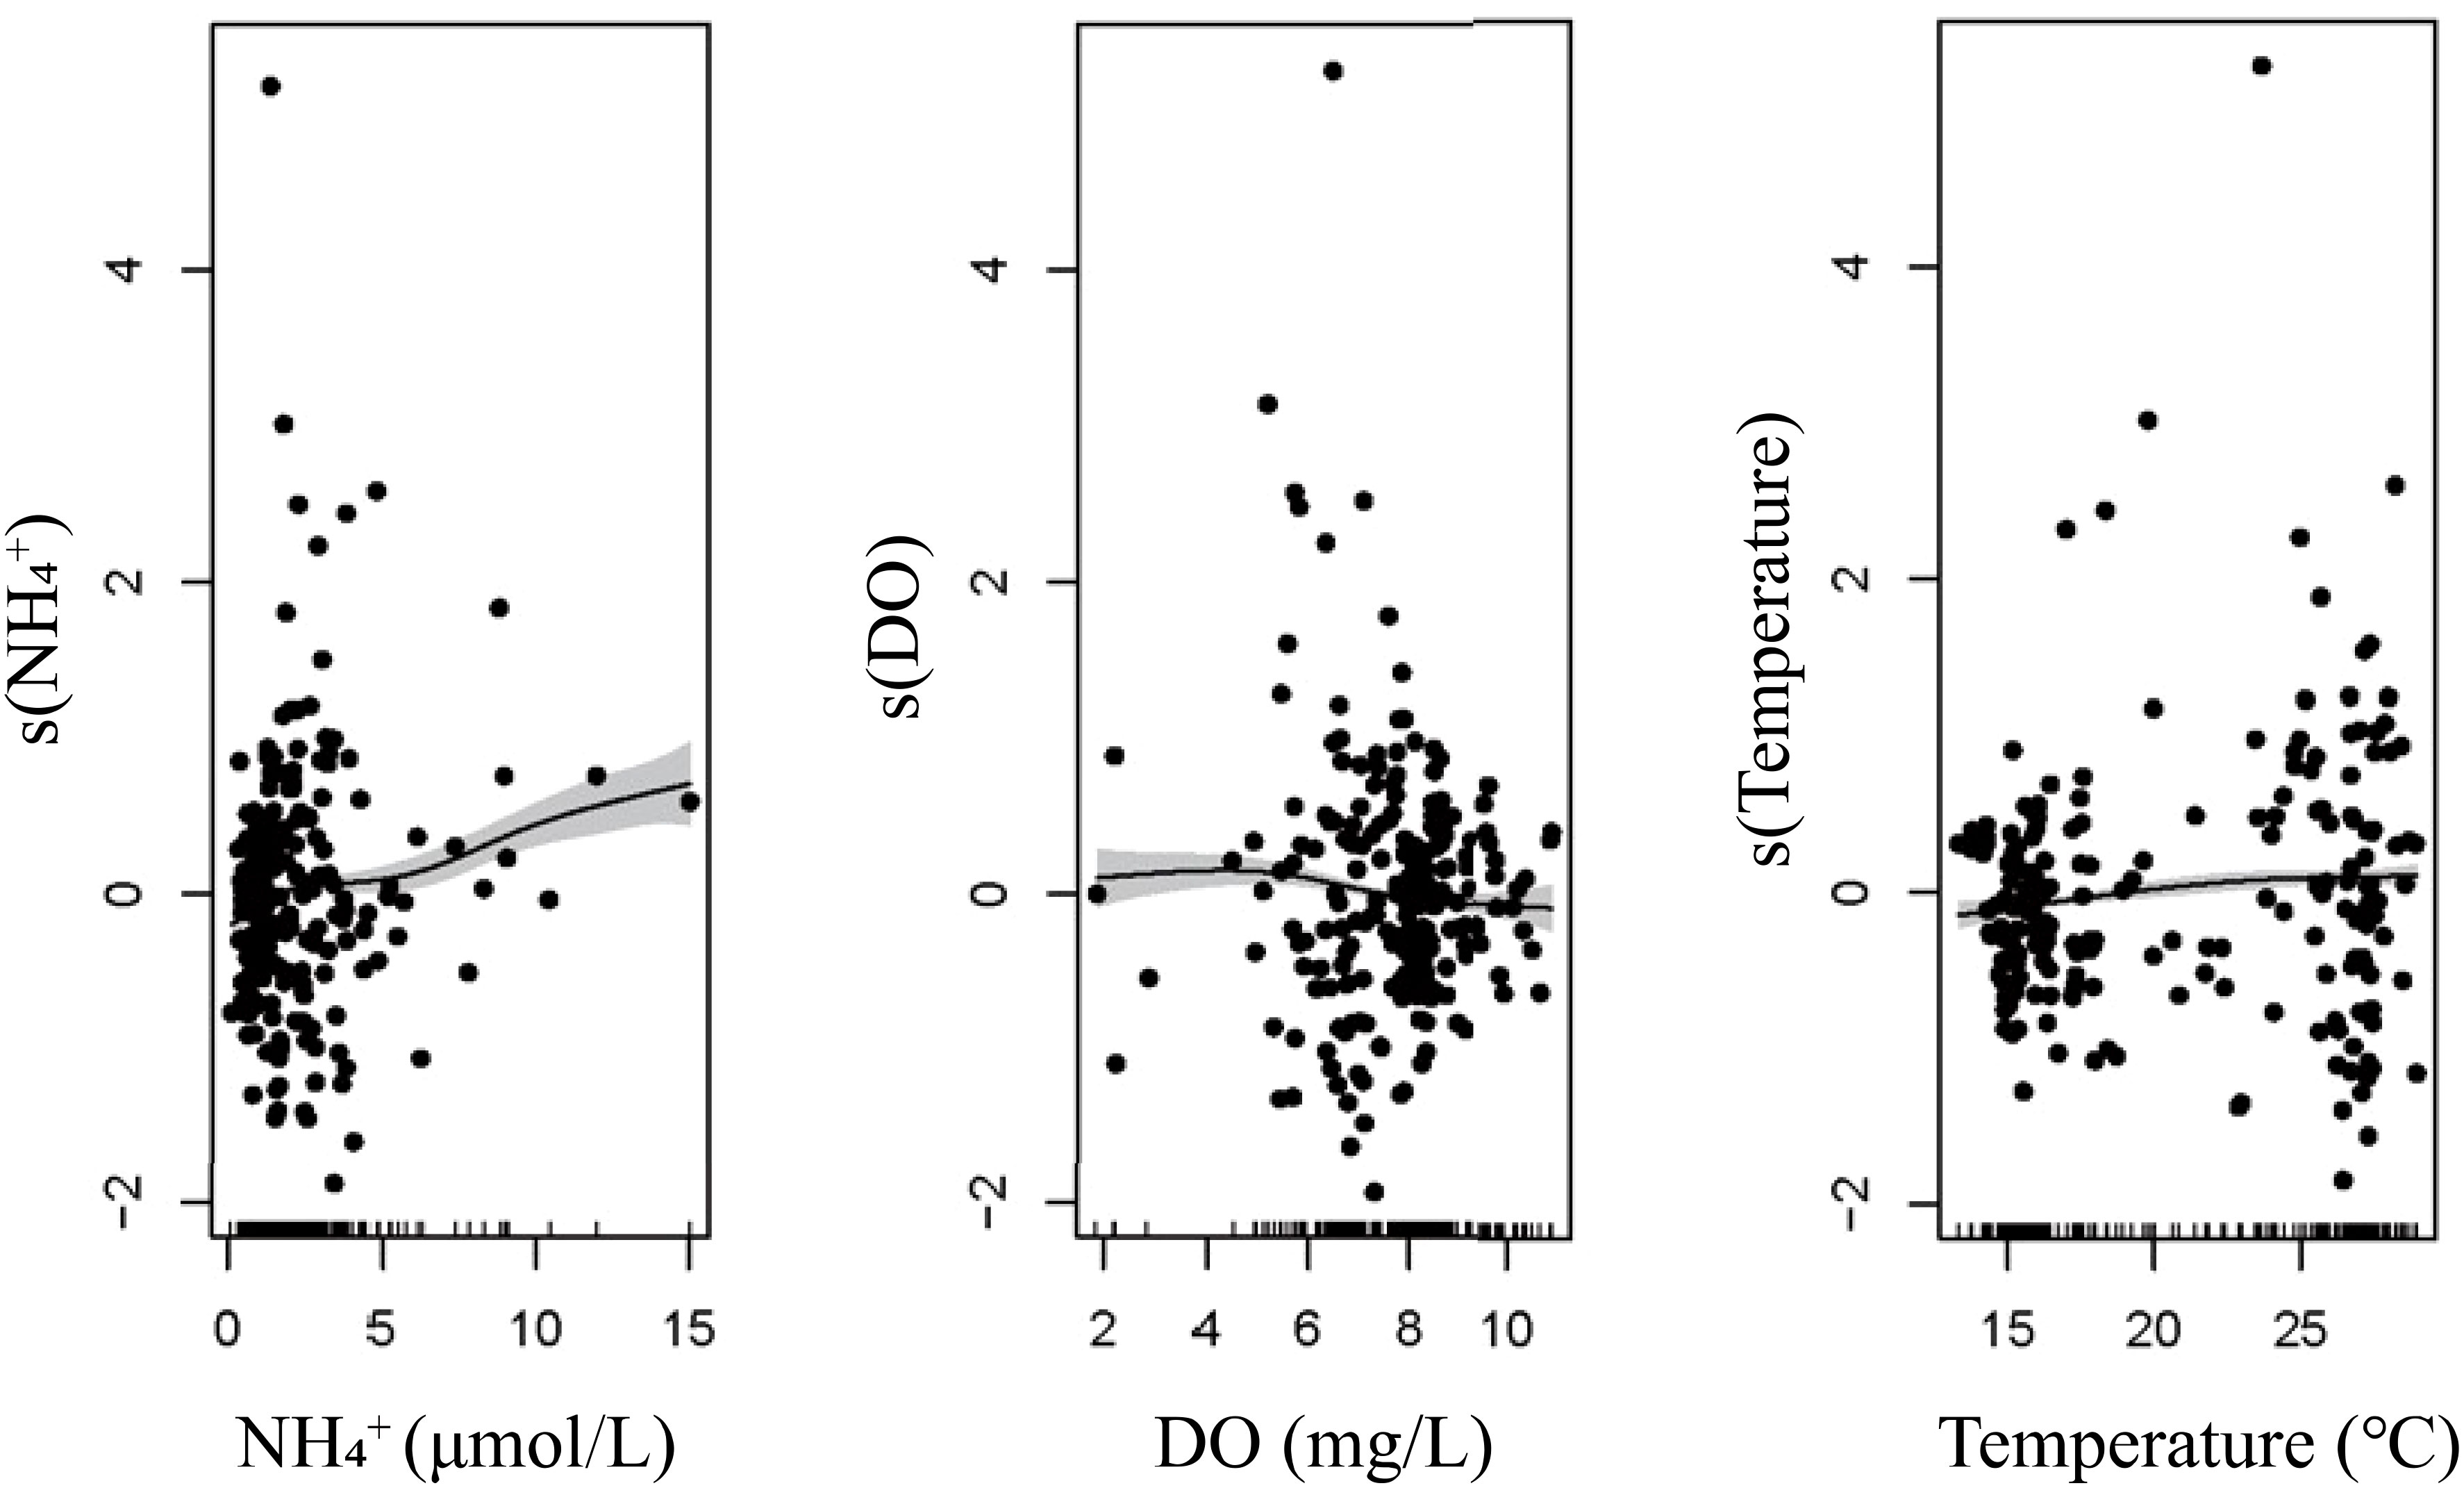
Figure 8 Relationship of N2O and environmental parameters of (μmol L-1) (A), temperature (°C) (B), and DO (mg L-1) (C) based on generalized additive models. The black dots represent residual concentrations. The inward tick marks on the horizontal axes show data distributions. The model R2 concentration was 0.61, and the model explained 65.3% of the response variable.
Chen et al. (2021) pointed out that the ΔN2O/AOU or ΔN2O/ ratio can be considered as an appropriate index of N2O production from nitrification mainly in the slope area of the shelf. Nevertheless, it is not suitable to be applied in the estuary areas owing to the impact of riverine discharge according to research in the estuarine areas of shelf seas (Chen et al., 2021). The main processes for N2O production in these regions may be CND on SPM. Overall, in situ N2O production processes in estuarine areas may be multifaceted because of high turbidity, the input of organic pollutants and nutrients from rivers and complex topographic features. We infer that the main processes for N2O production in the water are CND on SPM and nitrification in BHB.
Except for direct N2O input from rivers, relatively high N2O concentrations in the Yellow River and Hai River estuary may also result from nitrogen biogeochemical processes which affect the in situ N2O production. First, to transport silt from the large reservoirs and downstream river channel of the Yellow River to the BS, the Yellow River Conservancy Commission conducted water-sediment regulation (WSR) from June to July since 2002 (Yu, 2006). During the period of artificial flood peak discharge from June 19 to July 8 in 2009, approximately 34.3 million tons of sediment and 3488 million m3 of water were emptied into the BS (Ma et al., 2016). In the Yellow River estuary, the highest N2O concentrations occurred in summer at the bottom layer (Figure 5) with high DO concentrations and low concentrations. Hence, we inferred that N2O production of denitrification in sediments in the Yellow River estuary favored the high N2O concentrations in summer because enormous amounts of suspended solids and nutrients were discharged and accumulated on the seabed after WSR (Ma et al., 2016). Second, the microenvironments formed by SPM due to high turbidity water from the Yellow River may also lead to the high N2O concentrations (Liu et al., 2013; Xia et al., 2017a). Zhu et al. (2018) found that SPM in Hangzhou Bay is predominantly composed of fine and medium silt, the grain size of over 90% of the SPM is less than 20 μm and CND was found to occur on the SPM. The particle size of 4–20 μm also dominated the SPM in Yellow estuary and adjacent area (Wang et al., 2017). Hence, we suspect that the CND may happen in these regions and drive N2O production. However, nutrients and organic matter were mainly consumed during summer and thus high N2O concentrations were not found in autumn.
Additionally, N2O hotspots in the Hai River estuary occurred with low DO and pH concentrations. Hence, the in-situ N2O production is mainly controlled by denitrification or coupled nitrification-denitrification based on the low DO concentrations ranging between 1.8 and 4.6 mg L-1. Previous research has pointed out that oxygen-depleted areas, which are widely distributed in shelf waters, especially estuaries, are hotspots of N2O concentrations and fluxes (Naqvi et al., 2010). According to previous research in the water column with oxygen-depletion in the BS, nosZ gene-encoded denitrification bacteria increased (Wang et al., 2022), while reduction (first step of denitrification) and the later steps of denitrification (stepwise reduction of to NO, N2O, and N2) were also enhanced based on function changes of 16S rRNA gene-based high-throughput sequencing (Wu et al., 2022). In addition, when pH is reduced, the N2O production rate during nitrification significantly increases (Breider et al., 2019). The combination of ocean acidification and hypoxia further promotes N2O yield. Hence, low DO and pH support high N2O production in the summer of the Hai River estuary. However, in the autumn, DO increased and a high DO level (>6 mg L-1) indicated nitrification became the main N2O production process. N2O decreased from coast to offshore in the surface layer of the Hai River estuary, and the trend was consistent with the trend of and (Figure S1), which are the end and intermediate products of nitrification and can be considered as the indicators of N2O production (Sierra et al., 2017; Ji et al., 2019).
Mixing of water masses
Nitrification and denitrification have been utilized to remove nitrogen in wastewater treatment plants. Nevertheless, N2O can be produced from the two microbial processes and thus the treated wastewater input is also considered a potential source of N2O (Hashimoto et al., 1999; Kong et al., 2017). Previous researches have shown that treated sewage discharge affects the distribution of N2O concentrations in Jiaozhou Bay and Tokyo Bay (Hashimoto et al., 1999; Zhang et al., 2006; Ma et al., 2016). Thus, the water masses with high N2O from coastal sewage treatment plants cannot be ignored in BHB, since there are more than 310 wastewater treatment factories in the vicinity according to the statistical data from the management information platform of the National Pollutant Discharge Permit (Ministry of Ecology and Environment, 2022).
As an important path connecting land and sea, submarine groundwater discharge transports considerable nutrients and N2O. Previous research pointed out that groundwater contains N2O and is an important N2O source in the sea, especially on the coast (Lamontagne et al., 2003). Recent studies have shown that groundwater also could be a dominant source of nutrients to bays and adjacent areas, stimulating N2O production (Reading et al., 2021). The flux of submarine groundwater discharge into BHB was estimated to be 2.58 × 10⁹ m3/d and the flux of inorganic nitrogen associated with the groundwater was 4.78×10⁸ mol/d (Zhang, 2018). A survey of groundwater discharge in the Jiaozhou Bay along the South Yellow Sea coast of China showed that the annual N2O discharge from groundwater was estimated to be 4.42 × 10³ mol. Hence, we inferred that in BHB, the effect of groundwater discharge on N2O cannot be neglected.
Based on the results from a numerical hydrodynamic model coupled with geochemical analysis, the contamination from the coast could be transported to entire areas of BHB by currents, aggregated within vortexes under the driving of residual circulation (Li et al., 2019). In our study, high N2O concentrations occurred on the Caofeidian coast and Huanghua coast in summer, and Caofeidian coast and the center of BHB in autumn. Caofeidian coast is located in NCV, while Huanghua coast and the center of BHB are within NACV, which is consistent with the contamination distribution of Li et al. (2019). Therefore, we infer that water masses with high N2O concentrations from rivers and sewage treatment plants or submarine groundwater may be transported to N2O hotspots within the vortexes by the currents. Moreover, low concentrations were found in the two top layers at the northern mouth of BHB (Figures 4A, B) in summer. Under the residual circulation, the inflow of water with relatively low N2O concentrations from the central basin of the BS (Gu et al., 2021) may decrease the N2O concentrations in MACV (Figure 1). Furthermore, coastal inputs, such as those form rivers, coastal sewage outlets (e.g., factories, aquaculture farms, and harbors), and submarine groundwater discharges could be transported to the entire BHB by the currents and aggregated within the vortexes. Except for the Yellow River estuary, high concentrations consistently occurred at N2O hotspot areas (Figures 3, 4). As the indicators of both contaminants and nitrification, the water with relatively higher from the coastal discharge was transported to these hotspots, consequently promoting N2O production from nitrification.
Environmental factors controlling N2O
The dominant environmental factors that influence N2O concentrations in the water column of BHB were , DO, and temperature base on ABT analysis over different seasons and regions in BHB. According to the multiple linear regression, N2O was also mainly controlled by the three factors and the relationship can be described as: [N2O] =1.5 × []-1.4 × [DO] + 0.4 × Temperature +26.4 (P< 0.0001, R2 = 0.74).
The ABT analysis shows that the influence of on the N2O concentrations surpassed other factors (Figure 9). concentration, a good indicator of pollution, was positively related to N2O concentrations. This is reasonable because the high -N level may increase N2O accumulation via nitrification, which also had been demonstrated in high population density areas (Xia et al., 2013; Hu et al., 2016). According to the results of the non-linear GAM, N2O concentrations increased with increasing concentration, and rates of /N2O were higher when exceeded approximately 8 μmol L-1. In addition, the stations with high (> 8 μmol L-1) are generally in the estuaries in summer. Therefore, in addition to in-situ production, riverine N2O input could also contribute to the positive relationship between and N2O. Based on the ABT model, DO was the second most important controlling factor, and N2O concentrations increased with decreasing DO. The temperature was the third important factor and had a dual effect on the N2O concentrations. With higher temperatures, the N2O solubility decreases, whereas the microbial activity of nitrification and denitrification are promoted, increasing N2O production (Bo et al., 2018). Figure 8 points out that the N2O concentrations in BHB were positively related to temperature, indicating the promotion of microbial activity exceeded the influence of lower solubility of the gas in the water column.
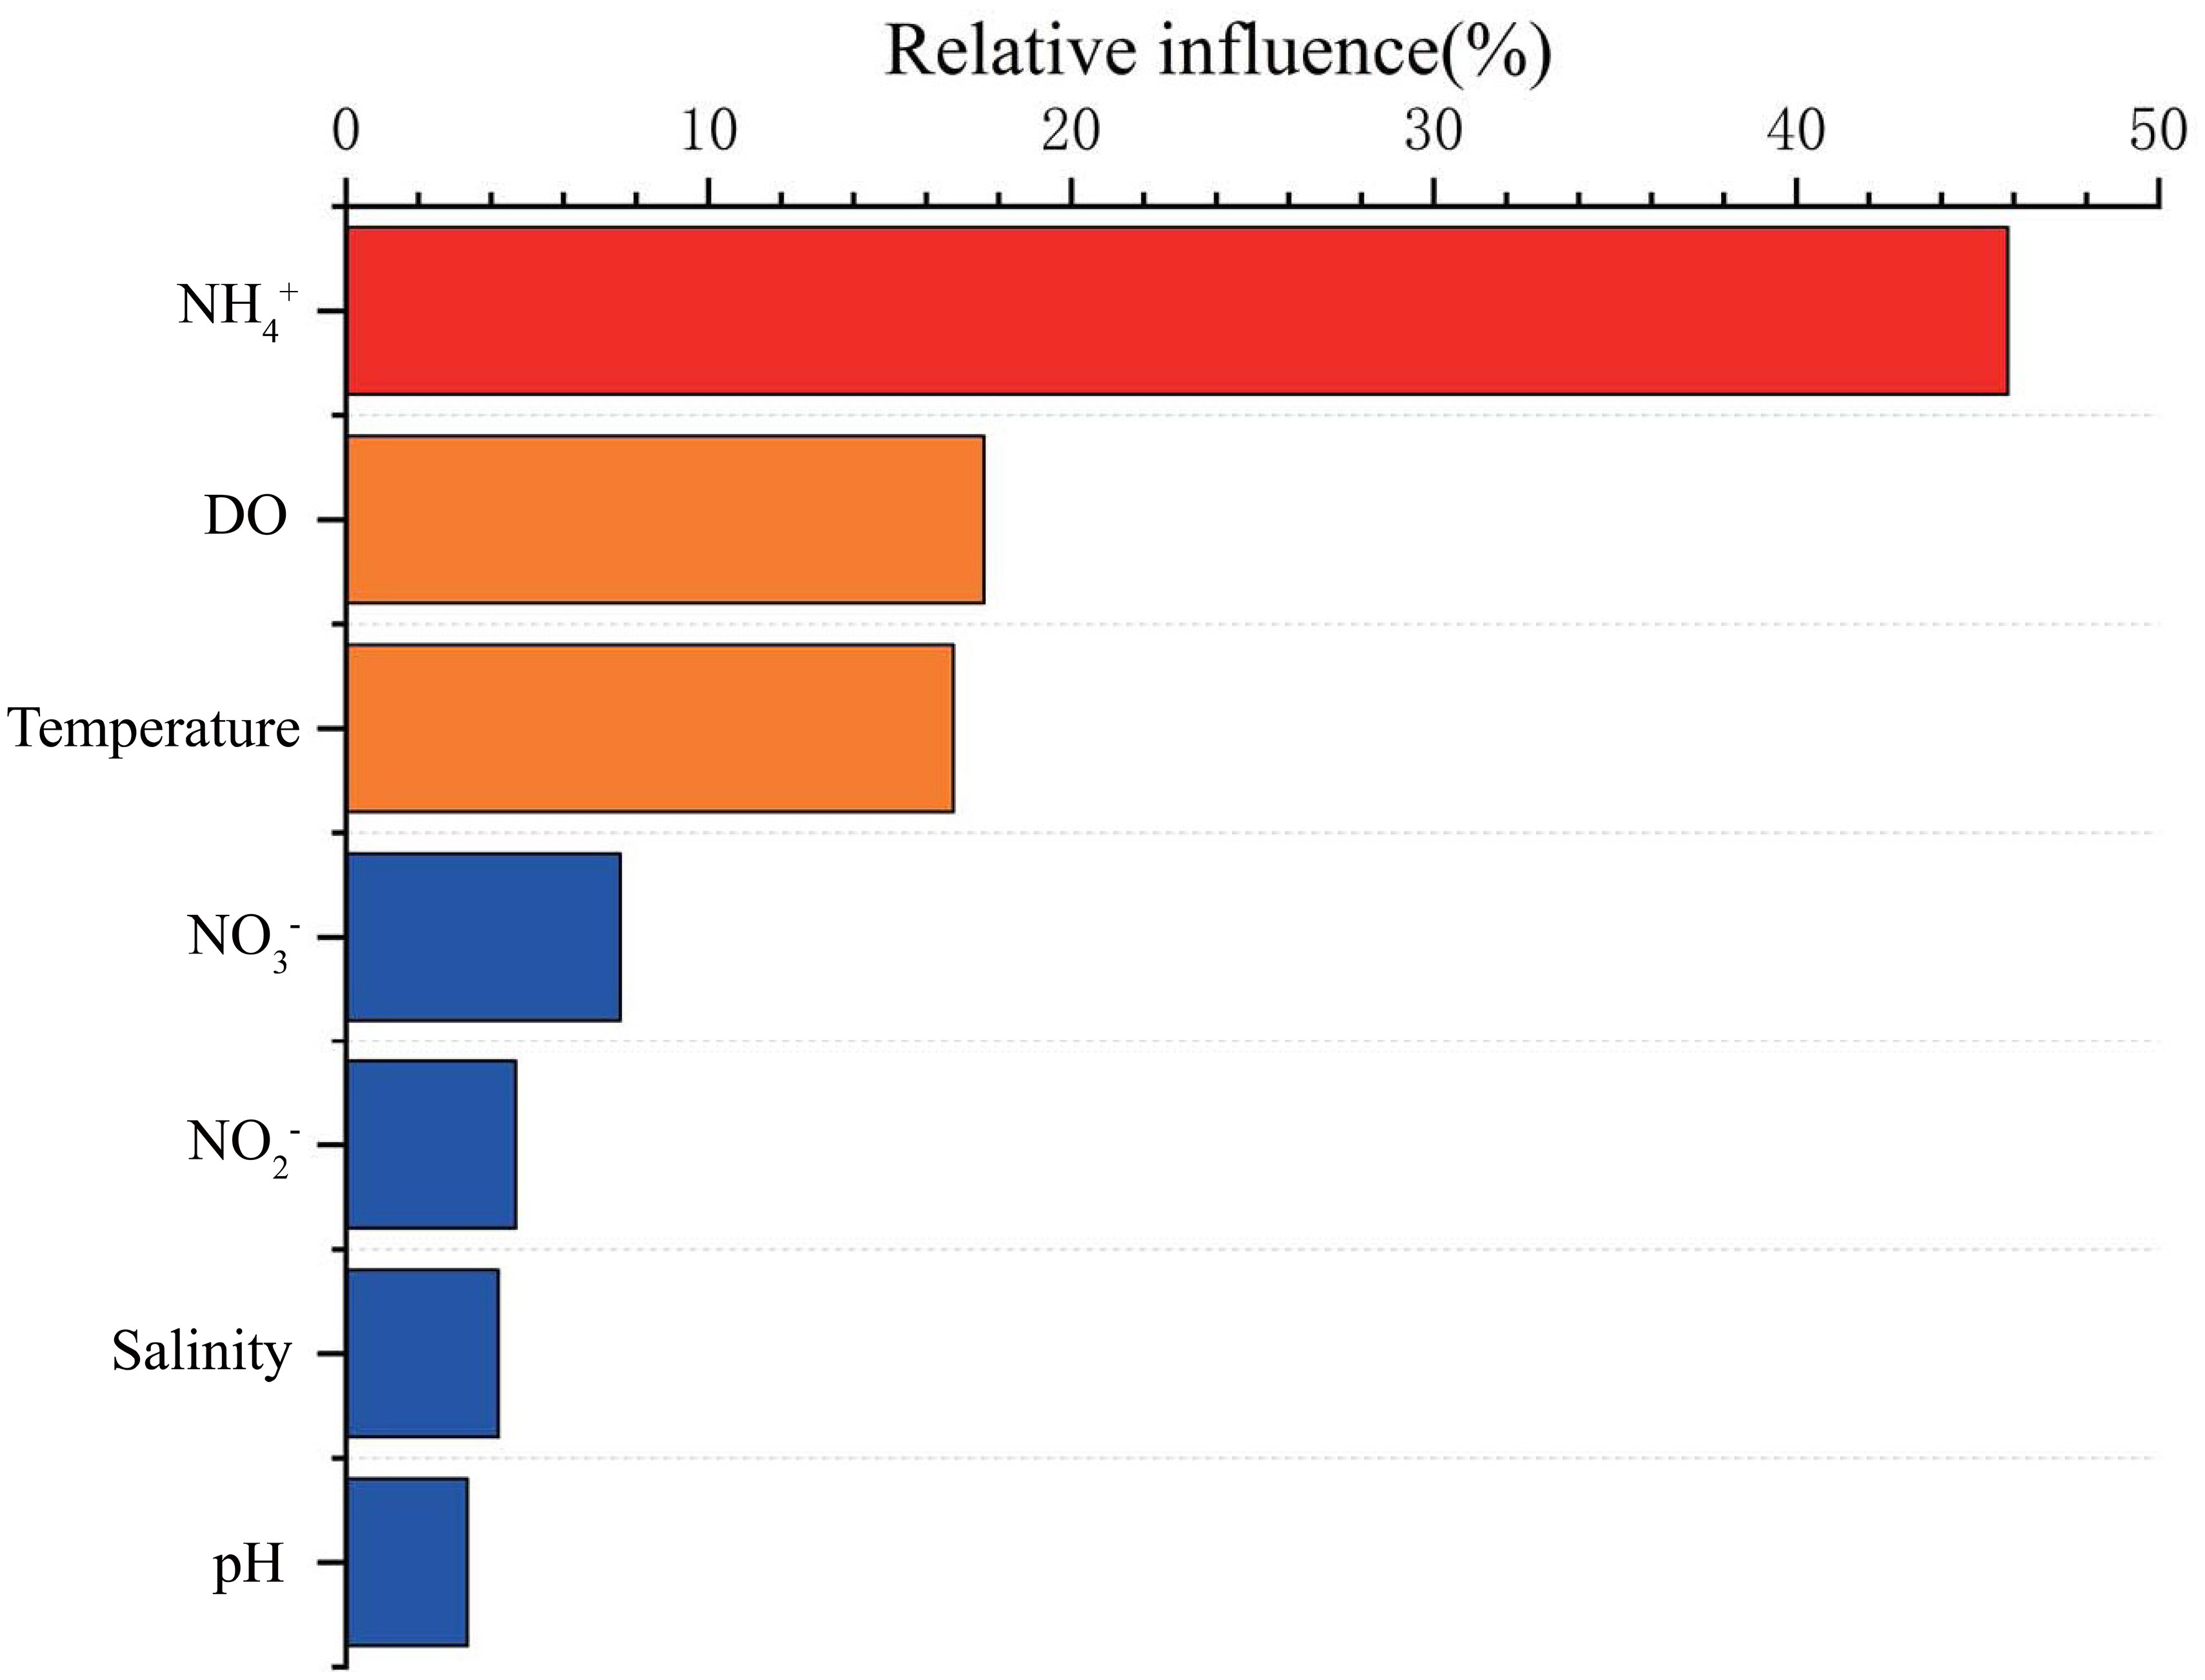
Figure 9 Relative influences of the related environmental parameters on N2O according to an aggregated boosted tree (ABT).
N2O emission
All N2O air-sea fluxes were positive in the two seasons and the average fluxes in both seasons indicated that the BHB region was an evident source of N2O to the atmosphere. High spatiotemporal variability of N2O emission fluxes was observed in BHB. N2O fluxes were calculated based on ΔN2O and the gas transport velocity which is positively related with the wind speed in the surface layer. The mean wind speeds in summer (3.8 ± 1.4 m s-1) were a bit lower than in autumn (4.7 ± 2.7 m s-1); however, the fluxes still reached their peak in the summer. Therefore, the wind speed was not the major factor driving the higher N2O flux in summer. In summer, N2O concentration was higher, while the lower [N2O]eq also occurred due to the higher surface temperature and consequently lower N2O solubility. Thus, the combination of the two factors above leads to higher ΔN2O in summer, which is the main reason for seasonal variation of N2O flux in BHB. Previous researches have shown a relatively higher flux in summer compared to autumn in Jiaodong Bay, the central BS and East China Sea (Zhang et al., 2006; Chen et al., 2021; Gu et al., 2021), which is consistent with our results.
High fluxes were observed in the estuaries, along the coast, and in central BHB, which coincided with the N2O hotspots in BHB. Because the emissions have been estimated from the average wind speed for each cruise, wind speeds cannot account for intra-season spatial variability. In summer, surface temperatures were relatively similar in terms of spatial distribution, and thus N2O concentration dominated the pattern of N2O flux distribution. In autumn, because of the high temperatures and N2O concentrations in central BHB, the flux of N2O was relatively high.
Based on the N2O fluxes of summer and autumn, the annual mean N2O flux was 25.5 ± 11.8 μmol m-2 d-1. The total area of BHB is 1.6 × 10⁴ km², which is about 0.0044% of the total global ocean area, and the corresponding area-integrated flux was 1.5 × 10⁸ mol yr-1 (6.5 Gg yr-1), accounting for about 0.15% of the world marine N2O emission (4.2 × 10³ Gg yr−1) (Yang et al., 2020). Results are comparable to the N2O fluxes observed in the bays with high human pollution (Table 2), e.g., Tokyo Bay and Jiaozhou Bay (Hashimoto et al., 1999; Zhang et al., 2006), but they are higher than those reported for open oceans (Han and Zhang, 2015; Ma et al., 2020; Heo et al., 2021), an unpolluted bay (Prydz Bay, Antarctica) (Zhan et al., 2015) and two continental shelf seas (the BS and the Yellow Sea) (Gu et al., 2021). Although we reported relatively high annual fluxes in BHB based on summer and autumn data, the fluxes could be overestimated due to relatively higher fluxes in summer compared to other seasons (Chen et al., 2021; Gu et al., 2021). Therefore, more studies covering all four seasons are needed to improve the flux estimates.
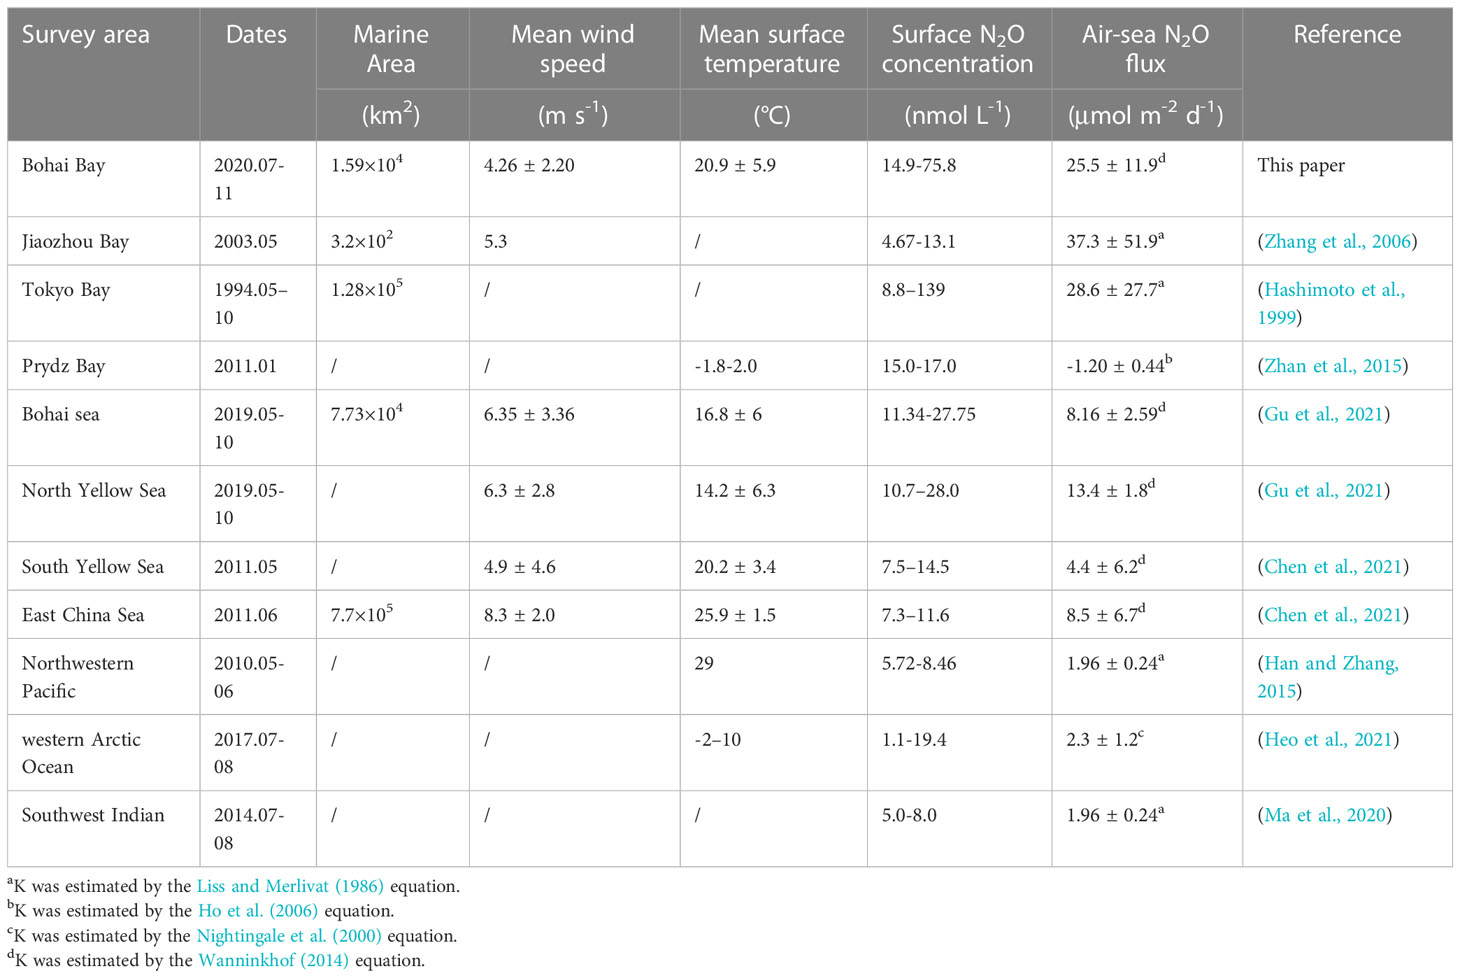
Table 2 Surface N2O concentrations, saturations, and seawater–air fluxes reported in different marine ecosystems.
Conclusion
The distributions of N2O concentrations and fluxes in BHB during the summer and autumn of 2020 showed high spatiotemporal variability. The average concentration of N2O was higher in summer than in autumn. The seaward declining N2O concentration from the Hai River and the Yellow River estuaries, particularly in summer, demonstrates the effect of riverine runoff on N2O distribution in BHB. The horizontal distribution of N2O was also impacted by coastal water discharge (including rivers, sewage treatment plants and submarine groundwater) and water currents (residual circulation). The vertical distribution of N2O was uniform, except for the estuarine areas, owing to the effective vertical mixing, whereas high N2O concentrations were generally present at the bottom of estuarine areas during summer. Similar to the distribution of the N2O concentrations, the highest saturation ratios and fluxes of surface N2O also occurred in summer. All fluxes were positive in the two seasons. The annual flux of N2O was evaluated to be 6.5 Gg in BHB, contributing to 0.15% of annual total oceanic N2O emissions with 0.0044% of the global marine area.
Riverine discharge had a vital impact on the high N2O concentrations in the estuaries, especially during summer. In-situ production of N2O in the water column was likely dominated by nitrification and CND on the SPM. Additionally, the offshore transport of waters from rivers and coastal sewage outlets, and submarine groundwater could provide high N2O for the entire BHB, particularly in summer. Nutrient and organic matter input from the coast could also indirectly facilitate N2O production by stimulating microbial activities of nitrification and denitrification.
The ABT models and multiple linear regression indicated that , DO, and temperature were the dominant environmental factor controlling N2O distributions in BHB. The influence of on N2O concentrations surpassed the other two variables. However, different bays may differ in geographic environments, hydrology, and other driving factors. More investigations are, therefore, needed to identify the principal mechanisms for controlling N2O concentrations and fluxes in different bays. Overall, our research improves the understanding of the distribution patterns of N2O concentrations and sea-air fluxes in highly polluted bays.
Data availability statement
The original contributions presented in the study are included in the article/Supplementary Material. Further inquiries can be directed to the corresponding authors.
Author contributions
JS: Conceptualization, Methodology, Project administration, Resources, Supervision, Visualization, Review & editing. DJ: Conceptualization, Methodology, Supervision, Visualization, Review & editing. ZW, TG, DJ and YW tested samples. DJ, ZW and TG analyzed the data. XC provides the wind.
Funding
This research was financially supported by the National Key RD Program of China (2019YFC1407800), the National Nature Science Foundation of China grants (41876134 and 42006174), the State Key Laboratory of Biogeology and Environmental Geology, China University of Geosciences (GKZ22Y656), and the Changjiang Scholar Program of the Chinese Ministry of Education (T2014253) to JS.
Acknowledgments
We are grateful to all laboratory colleagues for their help with this study and the writing of this paper. We give our great appreciation to the editors and reviews for revising and improving our paper.
Conflict of interest
The authors declare that the research was conducted in the absence of any commercial or financial relationships that could be construed as a potential conflict of interest.
Publisher’s note
All claims expressed in this article are solely those of the authors and do not necessarily represent those of their affiliated organizations, or those of the publisher, the editors and the reviewers. Any product that may be evaluated in this article, or claim that may be made by its manufacturer, is not guaranteed or endorsed by the publisher.
Supplementary material
The Supplementary Material for this article can be found online at: https://www.frontiersin.org/articles/10.3389/fmars.2023.1105016/full#supplementary-material
Supplementary Figure 1 | Vertical distribution of the selected transects in BHB (see green line in ) for (A, B), (C, D), pH (E, F), and DO (mg L-1) (G, H) during summer and autumn 2020.
Supplementary Figure 2 | Horizontal distribution of N2O saturation (%) during summer (A) and autumn (B) in BHB.
References
Anderson J. H. (1964). The metabolism of hydroxylamine nitrite by nitrosomonas. Biochem. J. 91 (1), 8. doi: 10.1042/bj0910008
Bange H. W., Sim C. H., Bastian D., Kallert J., Kock A., Mujahid A., et al. (2019). Nitrous oxide (N2O) and methane (CH4) in rivers and estuaries of northwestern Borneo. Biogeosciences 16 (22), 4321–4335. doi: 10.5194/bg-16-4321-2019
Bo W., Liu F., Weiser M., Ning D., Okie J. G., Shen L., et al. (2018). Temperature determines the diversity and structure of N2O-reducing microbial assemblages. Funct. Ecol. 32 (7), 1867–1878. doi: 10.1111/1365-2435.13091
Bolin B., Cook R. B. (1983). The major biogeochemical cycles and their interactions (Scope report 21) (United States: Wiley).
Breider F., Yoshikawa C., Makabe A., Toyoda S., Wakita M., Matsui Y., et al. (2019). Response of N2O production rate to ocean acidification in the western north pacific. Nat. Climate Change 9 (12), 954–958. doi: 10.1038/s41558-019-0605-7
Burgos M., Ortega T., Forja J. M. (2017). Temporal and spatial variation of N2O production from estuarine and marine shallow systems of cadiz bay (SW, Spain). Sci. Total Environ. 607, 141–151. doi: 10.1016/j.scitotenv.2017.07.021
Cai L., Yang L., Liu S., Lei K. (2014). Emission flux of N2O in 16 rivers flowing into bohai Sea during dry season. Environ. Sci. Technol. 37 (12), 89–95. doi: CNKI:SUN:FJKS.0.2014-12-020
Cai Y., Zhang X., Guihao L. I., Dong J., Yang A., Wang G., et al. (2019). Spatiotemporal distributions and environmental drivers of diversity and community structure of nosZ-type denitrifiers and anammox bacteria in sediments of the bohai Sea and north yellow Sea, China. J. Oceanology Limnology 37 (4), 1211–1228. doi: 10.1007/s00343-019-8200-3
Capelle D. W., Tortell P. D. (2016). Factors controlling methane and nitrous-oxide variability in the southern British Columbia coastal upwelling system. Mar. Chem. 179, 56–67. doi: 10.1016/j.marchem.2016.01.011
Chen X., Ma X., Gu X., Liu S., Song G., Jin H., et al. (2021). Seasonal and spatial variations of N2O distribution and emission in the East China Sea and south yellow Sea. Sci. Total Environ. 775, 145715. doi: 10.1016/j.scitotenv.2021.145715
Codispoti L. A., Brandes J. A., Christensen J. P., Devol A. H., Yoshinari T. (2000). The oceanic fixed nitrogen and nitrous oxide budgets: moving targets as we enter the anthropocene? Scientia Marina 65 (S2), 85–105. doi: 10.3989/scimar.2001.65s285
Codispoti L. A., Christensen J. P. (1985). Nitrification, denitrification and nitrous oxide cycling in the eastern tropical south pacific ocean. Mar. Chem. 16 (4), 277–300. doi: 10.1016/0304-4203(85)90051-9
Cui T., Zhang J., Ma Y., Zhao W., Sun L. (2009). The study on the distribution of suspended particulate matter in the bohai Sea by re mote sensing. Acta Oceanologica Sin. 31 (5), 10–18.
De’ath G. (2001). Multivariate regression trees: a new technique for modeling species-environment relationships. Ecology 83, 1105–1117. doi: 10.2307/3071917
Duan R., Yang K., Ma Y., Hu T. (2012). A study of the mixed layer of the south China Sea based on the multiple linear regression. Acta Oceanologica Sin. 31 (6), 19–31. doi: 10.1007/s13131-012-0250-8
Elith J., Leathwick J. R., Hastie T. (2008). A working guide to boosted regression trees. J. Anim. Ecol. 77 (4), 802–813. doi: 10.1111/j.1365-2656.2008.01390.x
Forster G., Upstill-Goddard R. C., Gist N., Robinson C., Uher G., Woodward E. (2009). Nitrous oxide and methane in the Atlantic ocean between 50°N and 52°S: latitudinal distribution and sea-to-air flux. Deep Sea Res. Part II Topical Stud. Oceanography 56 (15), 964–976. doi: 10.1016/j.dsr2.2008.12.002
Grasshoff K., Kremling K., Ehrhardt M. (2009). Methods of seawater analysis, 3rd completely revised and enlarged edition (Weinheim: Wiley-VCH Verlag GmbH).
Grundle D. S., Maranger R., Juniper S. K. (2012). Upper water column nitrous oxide distributions in the northeast subarctic pacific ocean. Atmosphere-ocean 50 (4), 475–486. doi: 10.1080/07055900.2012.727779
Gu T., Jia D., Wang Z., Guo Y., Xin Y., Guo C., et al. (2021). Regional distribution and environmental regulation mechanism of nitrous oxide in the bohai Sea and north yellow Sea: a preliminary study. Sci. Total Environ. 818, 151718. doi: 10.1016/j.scitotenv.2021.151718
Hahn J. (1974). The north Atlantic ocean as a source of atmospheric N2O. Tellus 26 (1-2), 160–168. doi: 10.3402/tellusa.v26i1-2.9765
Han Y., Zhang G. (2015). Distribution fluxes of methane and nitrous oxide in the western north racific ocean in spring. Oceanolohia Limnologia Sin. 46 (2), 321–328. doi: 10.11693/hyhz20140500143
Han Y., Zhang G.-L., Zhao Y.-C., Liu S.-M. (2013). Distributions and sea-to-air fluxes of nitrous oxide in the coastal and shelf waters of the northwestern south China Sea. Estuarine Coast. Shelf Sci. 133, 32–44. doi: 10.1016/j.ecss.2013.08.001
Hashimoto S., Gojo K., Hikota S., Sendai N., Otsuki A. (1999). Nitrous oxide emissions from coastal waters in Tokyo bay. Mar. Environ. Res. 47 (3), 213–223. doi: 10.1016/S0141-1136(98)00118-4
Heo J.-M., Kim S.-S., Kang S.-H., Yang E. J., Park K.-T., Jung J., et al. (2021). N2O dynamics in the western Arctic ocean during the summer of 2017. Sci. Rep. 11 (1), 1–12. doi: 10.1038/s41598-021-92009-1
Ho D. T., Law C. S., Smith M. J., Schlosser P., Harvey M., Hill P. (2006). Measurements of air-sea gas exchange at high wind speeds in the southern ocean: implications for global parameterizations. Geophysical Res. Lett. 33 (16), 1–6. doi: 10.1029/2006GL026817
Hu M., Chen D., Dahlgren R. A. (2016). Modeling nitrous oxide emission from rivers: a global assessment. Global Change Biol. 22 (11), 3566–3582. doi: 10.1111/gcb.13351
Ipcc (2019). Climate change and land 2019: an IPCC special report on climate change, desertification, land degradation, sustainable land management, food security, and greenhouse gas fluxes in terrestrial ecosystems (Cambridge, United Kingdom and New York, NY, USA: Cambridge Univerisity).
Ji Q., Altabet M. A., Bange H. W., Graco M. I., Ma X., Arevalo-Martinez D. L., et al. (2019). Investigating the effect of El nino on nitrous oxide distribution in the eastern tropical south pacific. Biogeosciences 16 (9), 2079–2093. doi: 10.5194/bg-16-2079-2019
Katipoglu-Yazan T., Cokgor E. U., Insel G., Orhon D. (2012). ). is ammonification the rate limiting step for nitrification kinetics? Bioresource Technol. 114, 117–125. doi: 10.1016/j.biortech.2012.03.017
Kong D., Miao C., Wu J., Borthwick A. G. L., Duan Q., Zhang X. (2017). Environmental impact assessments of the xiaolangdi reservoir on the most hyperconcentrated laden river, yellow river, China. Environ. Sci. pollut. Res. 24 (5), 4337–4351. doi: 10.1007/s11356-016-7975-4
Lamontagne M. G., Duran R., Valiela I. (2003). Nitrous oxide sources and sinks in coastal aquifers and coupled estuarine receiving waters. Sci. Total Environ. 309 (1-3), 139–149. doi: 10.1016/S0048-9697(02)00614-9
Li P. (2010). Methane and nitrous oxide in the yellow river estuary, the yellow Sea and the bohai Sea (Ocean University of China).
Li Y., Feng H., Yuan D., Guo L., Mu D. (2019). Mechanism study of transport and distributions of trace metals in the bohai bay, China. Chin. Ocean Eng. 33 (1), 73–85. doi: 10.1007/s13344-019-0008-6
Li X., Yue F., Zhou B., Wang X., Hu J., Chen S., et al. (2022). N2O release from the water bodies of typical gate controlling tributaries of bohai bay. China Environ. Sci. 42 (1), 356–366. doi: 10.19674/j.cnki.issn1000-6923.2022.0006
Liss P. S., Merlivat L. (1986). Air-Sea gas exchange rates: introduction and synthesis,” in the role of air-Sea exchange in geochemical cycling. Ed. Buat-Ménard. P. (Dordrecht: Springer Netherlands), 113–127.
Liu S. M., Qi X. H., Li X., Ye H. R., Wu Y., Ren J. L., et al. (2016). Nutrient dynamics from the changjiang (Yangtze river) estuary to the East China Sea. J. Mar. Syst. 154, 15–27. doi: 10.1016/j.jmarsys.2015.05.010
Liu T., Xia X., Liu S., Mou X., Qiu Y. (2013). Acceleration of denitrification in turbid rivers due to denitrification occurring on suspended sediment in oxic waters. Environ. Sci. Technol. 47 (9), 4053–4061. doi: 10.1021/es304504m
Ma X., Bange H. W., Eirund G. K., Arévalo-Martínez D. L. (2020). Nitrous oxide and hydroxylamine measurements in the southwest Indian ocean. J. Mar. Syst. 209, 103062. doi: 10.1016/j.jmarsys.2018.03.003
Ma X., Zhang G.-L., Liu S., Wang L., Li P.-P. (2016). Distributions and fluxes of nitrous oxide in lower reaches of yellow river and its estuary: impact of water-sediment regulation. Estuar. Coast. Shelf Sci. 168, 22–28. doi: 10.1016/j.ecss.2015.10.001
Milliman J. D., Farnsworth K. L. (2013). River discharge to the coastal ocean: a global synthesis (Cambridge University Press).
Ministry of Ecology and Environment (2022) Management information platform of the national pollutant discharge permit (Ministry of Ecology and Environment of the People’s Republic of China). Available at: http://permit.mee.gov.cn/perxxgkinfo/syssb/xkgg/xkgg!licenseInformation.action (Accessed November 10, 2022).
Naqvi S., Bange H. W., Farías L., Monteiro P., Scranton M. I., Zhang J. (2010). Marine hypoxia/anoxia as a source of CH4 and N2O. Biogeosciences 6 (5), 9455–9523. doi: 10.5194/bg-7-2159-2010
Nightingale P. D., Malin G., Law C. S., Watson A. J., Liss P. S., Liddicoat M. I., et al. (2000). In situ evaluation of air-sea gas exchange parameterizations using novel conservative and volatile tracers. Global Biogeochemical Cycles 14 (1), 373–387. doi: 10.1029/1999GB900091
Qin Y., Li F. (1982). Study on the suspended matter of the sea water of the bohai gulf. Acta Oceanologica Sin. 2), 191–200.
Quick A. M., Reeder W. J., Farrell T. B., Tonina D., Benner S. G. (2019). Nitrous oxide from streams and rivers: a review of primary biogeochemical pathways and environmental variables. Earth-Science Rev. 191, 224–262. doi: 10.1016/j.earscirev.2019.02.021
Reading M. J., Tait D. R., Maher D. T., Jeffrey L. C., Correa R. E., Tucker J. P., et al. (2021). Submarine groundwater discharge drives nitrous oxide source/sink dynamics in a metropolitan estuary. Limnology Oceanography 66 (5), 1665–1686. doi: 10.1002/lno.11710
Sierra A., Jimenez-Lopez D., Ortega T., Ponce R., Bellanco M. J., Sanchez-Leal R., et al. (2017). Distribution of N2O in the eastern shelf of the gulf of cadiz (SW Iberian peninsula). Sci. Total Environ. 593, 796–808. doi: 10.1016/j.scitotenv.2017.03.189
Tang M., Hu X., Wang H., Wang Y., Chang S., Wang S., et al. (2022). Diffusive fluxes and controls of N2O from coastal rivers in tianjin city. Environ. Sci. 43 (3), 1481–1491. doi: 10.13227/j.hjkx.202106144
Tao L., Sun J., Liu H., Li Y., Shang J., Lin B., et al. (2020). Study on water exchange in bohai bay under effects of tides and seasonal winds. J. Hydroelectric Eng. 39 (5), 99–107.
Tian H., Xu R., Canadell J. G., Thompson R. L., Yao Y. (2020). A comprehensive quantification of global nitrous oxide sources and sinks. Nature 586 (7828), 248–256. doi: 10.1038/s41586-020-2780-0
Turner A., Millward G. (2002). Suspended particles: their role in estuarine biogeochemical cycles. Estuarine Coast. Shelf Sci. 55 (6), 857–883. doi: 10.1006/ecss.2002.1033
Valverde J. (2009). Nitrous Oxide Expected to Dominate Ozone-Depleting Emissions in 21st Century. International Environment Reporter 32(18), 804–804.
Wang J., Guo X., Li Y., Song G., Zhao L. (2022). Understanding the variation of bacteria in response to summertime oxygen depletion in water column of bohai Sea. Front. Microbiol. 13. doi: 10.3389/fmicb.2022.890973
Wang X., Jiang W., Zhang X., Zhou Z., Bian C. (2017). A study on particle size and volume concentration distributions of suspended particulate matters in bohai Sea in summer. Trans. Oceanology Limnology 5), 7. doi: 10.13984/j.cnki.cn37-1141.2017.05.017
Wang L., Liu R., Meng Q., Li Z., Gong J. (2019). “Bacterial community characteristics and detection of denitrifying functional genes nirS, nirk in the coastal water of bohai bay, China bacterial and denitrifying functional genes in bohai,” in Proceedings of the 2019 2nd international conference on sustainable energy, environment and information engineering (SEEIE 2019) (Atlantis Press), 119–127.
Wanninkhof R. (2014). Relationship between wind speed and gas exchange over the ocean revisited. Limnology Oceanography: Methods 12 (6), 351–362. doi: 10.4319/lom.2014.12.351
Weiss R. F. (1970). The solubility of nitrogen, oxygen and argon in water and seawater. Deep-Sea Res. Oceanographic Abstracts 17 (4), 721–735. doi: 10.1016/0011-7471(70)90037-9
Weiss R. F., Price B. A. (1980). Nitrous oxide solubility in water and seawater. Mar. Chem. 8 (4), 347–359. doi: 10.1016/0304-4203(80)90024-9
Wu C., Kan J., Narale D. D., Liu K., Sun J. (2022). Dynamics of bacterial communities during a seasonal hypoxia at the bohai Sea: coupling and response between abundant and rare populations. J. Environ. Sci. (China) 111, 324–339. doi: 10.1016/j.jes.2021.04.013
Xia X., Jia Z., Liu T., Zhang S., Zhang L. (2017a). Coupled nitrification-denitrification caused by suspended sediment (SPS) in rivers: importance of SPS size and composition. Environ. Sci. Technol. 51 (1), 212–221. doi: 10.1021/acs.est.6b03886
Xia Y., Li Y., Li X. (2013). Diurnal pattern in nitrous oxide emissions from a sewage-enriched river. Chemosphere 92 (4), 421–428. doi: 10.1016/j.chemosphere.2013.01.038
Xia X., Liu T., Yang Z., Michalski G., Liu S., Jia Z., et al. (2017b). Enhanced nitrogen loss from rivers through coupled nitrification-denitrification caused by suspended sediment. Sci. total Environ. 579, 47–59. doi: 10.1016/j.scitotenv.2016.10.181
Yang S., Chang B. X., Warner M. J., Weber T. S., Bianchi D. (2020). Global reconstruction reduces the uncertainty of oceanic nitrous oxide emissions and reveals a vigorous seasonal cycle. Proc. Natl. Acad. Sci. 117 (22), 11954–11960. doi: 10.1073/pnas.1921914117
Yu L. (2006). The huanghe (Yellow) river: recent changes and its countermeasures. Continental Shelf Res. 26 (17-18), 2281–2298. doi: 10.1016/j.csr.2006.07.026
Zhan L., Chen L., Zhang J., Yan J., Li Y., Wu M., et al. (2015). Austral summer N2O sink and source characteristics and their impact factors in prydz bay, Antarctica. J. Geophysical Research: Oceans 120 (8), 5836–5849. doi: 10.1002/2015JC010944
Zhang X. (2018). Using radium isotopes to assess submarine groundwater discharge and its nutrient input in bohai bay (China University of Geosciences).
Zhang H., Li Y., Tang C., Zou T., Yu J., Guo K. (2016). Spatial characteristics and formation mechanisms of bottom hypoxia zone in the bohai Sea during summer. China Sci. Bull. 61, 1612–1620. doi: 10.1360/N972015-00915
Zhang G., Zhang J., Xu J., Feng (2006). Distributions, sources and atmospheric fluxes of nitrous oxide in jiaozhou bay. Estuar. Coast. Shelf Sci. 68 (3-4), 557–566. doi: 10.1016/j.ecss.2006.03.007
Zhao Z., Kong L. (2000). Environmental status quo and protection countermeasures in bohai marine areas. Res. Environ. Sci. 13 (2), 23–27. doi: 10.13198/j.res.2000.02.26.zhaozhy.008
Zhu W., Wang C., Hill J., He Y., Tao B., Mao Z., et al. (2018). A missing link in the estuarine nitrogen cycle?: coupled nitrification-denitrification mediated by suspended particulate matter. Sci. Rep. 8 (1), 1–10. doi: 10.1038/s41598-018-20688-4
Zhuang W., Gao X. (2013). Acid-volatile sulfide and simultaneously extracted metals in surface sediments of the southwestern coastal laizhou bay, bohai Sea: concentrations, spatial distributions and the indication of heavy metal pollution status. Mar. Pollut. Bull. 76 (1-2), 128–138. doi: 10.1016/j.marpolbul.2013.09.016
Keywords: nitrous oxide, sea-air flux, nitrification, Bohai Bay, season variation
Citation: Wang Z, Gu T, Wen Y, Cui X, Jia D and Sun J (2023) Distributions, sources, and air-sea fluxes of nitrous oxide in Bohai Bay, China. Front. Mar. Sci. 10:1105016. doi: 10.3389/fmars.2023.1105016
Received: 22 November 2022; Accepted: 24 April 2023;
Published: 16 May 2023.
Edited by:
Huixiang Xie, Université du Québec à Rimouski, CanadaReviewed by:
Wangwang Ye, State Oceanic Administration, ChinaHaiyan Ji, Ministry of Natural Resources, China
Copyright © 2023 Wang, Gu, Wen, Cui, Jia and Sun. This is an open-access article distributed under the terms of the Creative Commons Attribution License (CC BY). The use, distribution or reproduction in other forums is permitted, provided the original author(s) and the copyright owner(s) are credited and that the original publication in this journal is cited, in accordance with accepted academic practice. No use, distribution or reproduction is permitted which does not comply with these terms.
*Correspondence: Jun Sun, phytoplankton@163.com; Dai Jia, jia-d11@tust.edu.cn