Contrasting life cycles of Southern Ocean pteropods alter their vulnerability to climate change
 Jessie Gardner
 Victoria L. Peck
 Dorothee C. E. Bakker
 Geraint A. Tarling
 Clara Manno
- 1Ecosystems, British Antarctic Survey, Cambridge, United Kingdom
- 2Department of Arctic and Marine Biology, UiT – The Arctic University of Norway, Tromsø, Norway
- 3Centre for Ocean and Atmospheric Sciences, School of Environmental Sciences, University of East Anglia, Norwich, United Kingdom
Pteropods are a key part of biogeochemical cycling and epipelagic food webs in the Southern Ocean. However, shelled pteropods are vulnerable to climate change, due to their aragonite shells being particularly sensitive to ocean acidification. Currently our understanding of pteropod responses to environmental change is hindered by uncertainties surrounding their life cycles and population dynamics. In this study, we describe polar shelled pteropod diversity in the north-eastern Scotia Sea, inferring life history and population structures of the dominant pteropod species, Limacina rangii (formerly Limacina helicina antarctica) and Limacina retroversa. An annual timeseries of Limacina shell morphometrics was derived from individuals collected in a moored sediment trap at 400 m depth. We found that L. rangii and L. retroversa have contrasting life history strategies. L. rangii has a continuous spawning and recruitment period from November to March and can overwinter as juveniles and adults. L. retroversa has discrete spawning events from November to May, producing non–overlapping cohorts of juveniles and adults. Their development to the adult stage takes between two and five months, upon which they overwinter as adults. Our findings suggest different vulnerabilities of L. rangii and L. retroversa to a changing ocean. For example, since all life stages of L. rangii co-exist, vulnerability of one cohort is not detrimental to the stability of the overall population whereas, if one L. retroversa cohort fails to recruit, the entire population is threatened. Changes in pteropod populations could have cascading ramifications to Antarctic ecosystems and carbon cycling.
1 Introduction
Thecosome (shelled) pteropods are holoplanktonic gastropods with a cosmopolitan distribution throughout the world’s oceans. In the Southern Ocean, pteropods can occur in high densities (Bednaršek et al., 2017; Burridge et al., 2017), especially in regions characterized by high phytoplankton concentrations (Hunt et al., 2008; Ward et al., 2008) where they play a key role in the marine ecosystem. Pteropods are efficient omnivorous grazers (Hopkins and Torres, 1989; Bernard and Froneman, 2009), are prey for higher trophic levels (Hunt et al., 2008) and form an important contribution to organic and inorganic carbon cycling (Bednaršek et al., 2012c; Manno et al., 2018).
Despite extensive research into pteropods there remains considerable uncertainty in estimates of their growth rate, longevity, spawning season(s), and seasonal population structures within and between species (i.e. Kobayashi, 1974; Fabry, 1990; Gannefors et al., 2005; Hunt et al., 2008; Bednaršek et al., 2012a; Thibodeau et al., 2020). Such uncertainties arise from differences in sampling protocols (McGowan John and Fraundorf Vernie, 1966; Cermeño et al., 2014) and geographical ranges and scales (Wiens, 1989) between studies. For example, sampling net mesh sizes may select or exclude certain cohorts, biasing the size distribution of sampled populations (Hunt et al., 2008). Furthermore, each pteropod species inhabits specific geographical ecoregions, such that life cycles tend to be species-specific in response to local environmental conditions. Certain life stages, such as the high growth veliger phase (the immature pteropod stages that have yet to develop wings), which demand high energy budgets, often coincide with local phytoplankton blooms (Maas et al., 2011). Acclimation and adaptation of pteropods to localized conditions therefore leads to inter- and intra-species differences in environmental tolerances (Bednaršek et al., 2017). Variation in life history may also occur within taxonomic sub-units, for example, Limacina helicina comprises of several morphotypes (not classed as separate species) in the Arctic Ocean (acuta, helicina, and pacifica). Similarly, several L. retroversa formae are found in the Arctic (balea and retroversa) and the Southern Ocean (australis) (Hunt et al., 2010; Jennings et al., 2010).
Shell morphometric analyses are an effective tool to assess age structure and spawning events of pteropods (Wang et al., 2017) based on the assumption that the rate of shell extension is linear throughout Limacinidae life cycles (Hsiao, 1939; Lalli and Wells, 1978; Lalli and Gilmer, 1989). Thibodeau et al. (2020) and Weldrick et al. (2021) estimated L. rangii phenology using shell morphometrics of specimens collected from sediment traps deployed along the Western Antarctic Peninsula and the Indian sector of the Southern Ocean, respectively. While sediment traps primarily record the vertical flux of passive particulate matter from the upper ocean (Turner, 2015), Makabe et al. (2016) showed that the abundance of live pteropods entering the sediment trap (active “swimmers”, likely in search of prey) correlates well with their relative abundance in corresponding net samples. Identifying swimmers within sediment trap samples can therefore be considered representative of the seasonal population structure. Moored sediment traps allow year-round sampling at a fixed geographical location at user-defined temporal intervals. Sediment trap sampling is particularly valuable in remote and difficult to access areas, such as in the Southern Ocean. Furthermore, sediment traps do not select for specific size cohorts, making sediment traps an effective tool to estimate pteropod life history and population dynamics (Makabe et al., 2016).
In this study, we estimate the abundance and seasonal variability of thecosome pteropod species collected within a sediment trap moored for one year downstream of South Georgia in the northeast region of the Scotia Sea. We investigate life history and population structures (i.e., spawning, growth rates, cohort and life stage dynamics and longevity) by assessing the shell morphometrics of the two dominant pteropod species L. rangii and L. retroversa australis (hereafter L. retroversa) through December 2014 to November 2015. Characterizing local life history and population structures of pteropods is critical to forecast potential cascading impacts on biogeochemical cycling and epipelagic food webs in the face of anthropogenic climate change. The Scotia Sea is undergoing some of the fastest rates of climatic change in the Southern Ocean (Henson et al., 2017). Due to their aragonite shells being particularly sensitive to ocean acidification (Manno et al., 2017), and the rapidity of change in this region, there is an urgency to better understanding and monitoring the ecology of this sentinel species.
2 Materials and methods
2.1 Sample collection
A McLane PARFLUX sediment trap (0.5 m2 capture area, McLane Labs, Falmouth, MA, USA) was deployed at 400 m water depth (sea floor depth of 3787 m) on a bottom-tethered mooring line for 350 days (12 December 2014-28 November 2015) at the sustained observation location P3 in the north eastern Scotia Sea (52°48.7” S, 40°06.7” W) (Figure 1). The site P3 is bounded by the Polar Front to the north and the Southern Antarctic Circumpolar Current Front to the south and east and is situated in an area of high biological productivity, with extensive and prolonged phytoplankton blooms (Borrione and Schlitzer, 2013). In December 2014 the chlorophyll-a max was 2.7 μg l−1 at ∼30 m (Liszka et al., 2019).
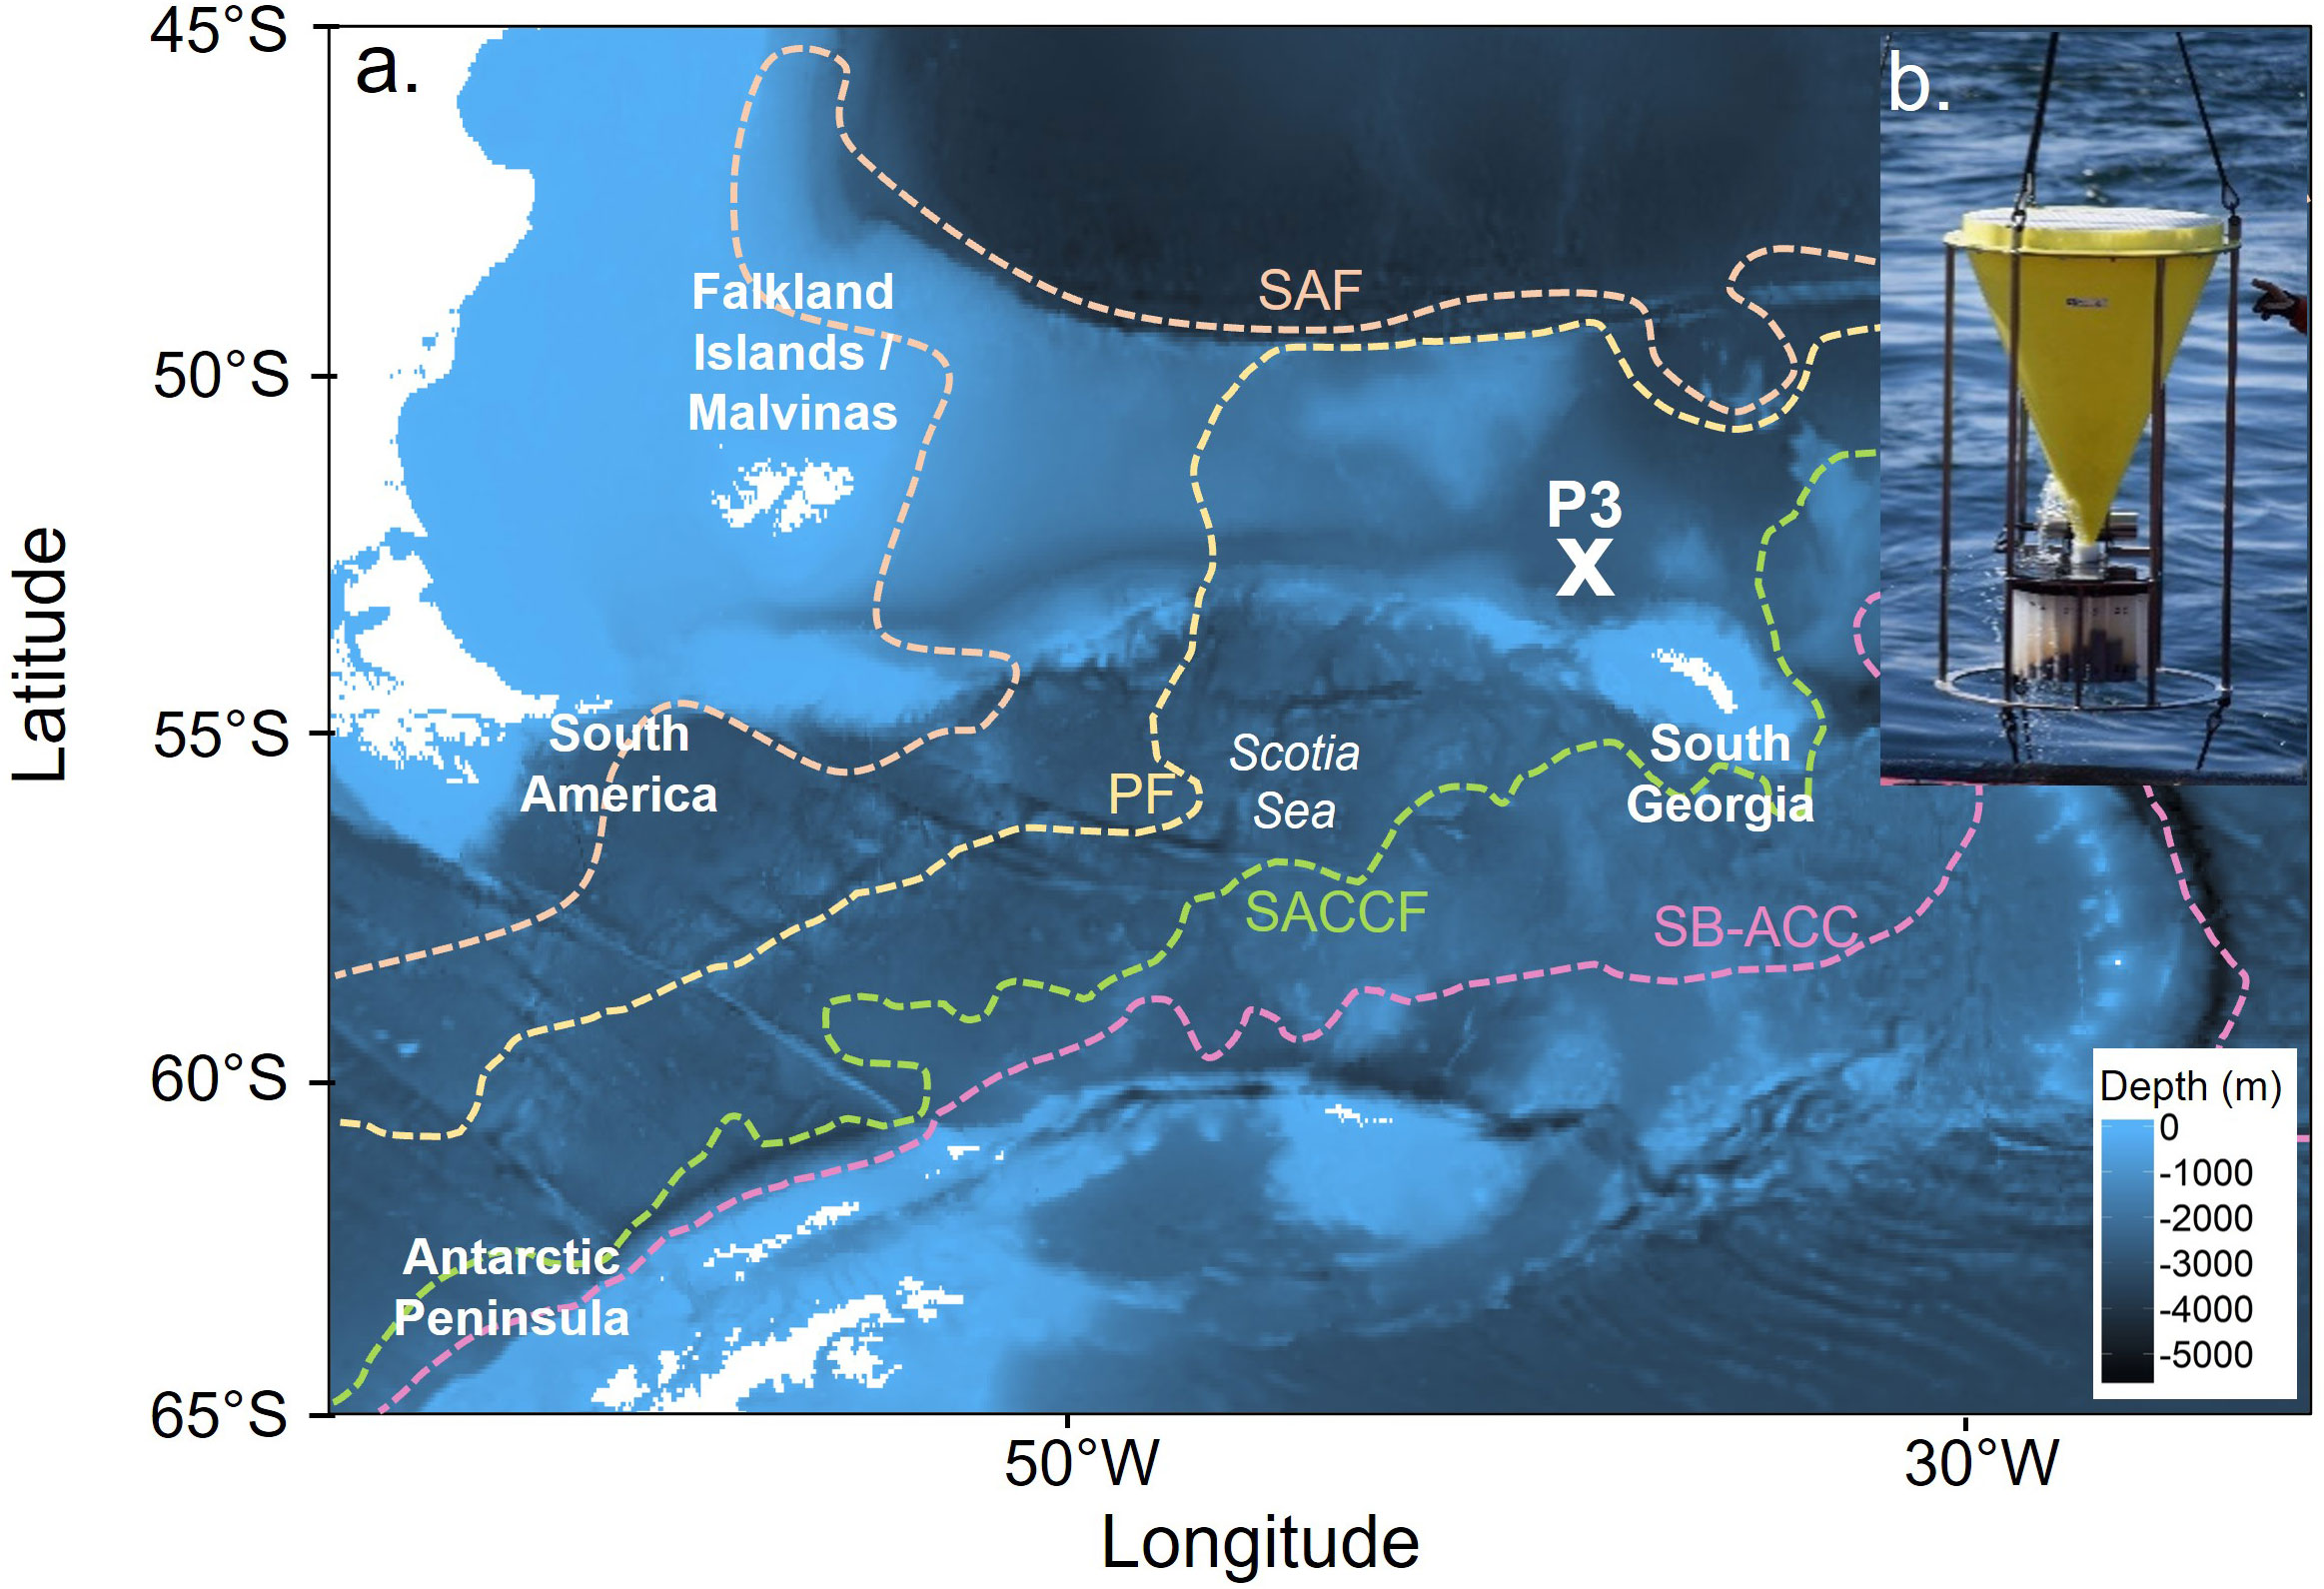
Figure 1 (A). The location of the sediment trap mooring (P3: 52°48.7” S, 40°06.7” W) sampling site and (B). An image of the sediment trap as it was recovered in November 2015. The blue shading indicates the seafloor depth, while the white represents the land. Dashed lines indicate the position of the Sub-Antarctic Front (SAF), Polar Front (PF), Southern Antarctic Circumpolar Current Front (SACCF) and the Southern Boundary of the Antarctic Circumpolar Current (SB-ACC). Positions of the SAF, PF and SB-ACC were taken from Orsi et al. (1995), while the position of the SACCF was from Thorpe et al. (2002).
The sediment trap was equipped with 21 x 500 ml collection cups filled with 4% formaldehyde buffered with excess sodium tetraborate (borax). These preservatives poison swimmers swiftly, minimising physical damage to the sample caused by opportunistic scavengers, arresting biological degradation and stopping pteropod shell dissolution (Goto et al., 2016). Cups rotated on a 14-17 (spring and summer) and 30-31 (autumn and winter) day schedule with 15 cups being utilised within the sampling period (Supplementary Material 1).
Sensors attached to the mooring line measured temperature (°C, SAMI) and pH (total scale, SAMI) were measured at 200 m depth and oxygen (µM, optode within the Aquadopp current meter) at 400 m depth. Chlorophyll-a data (mg m-3) from Aqua MODIS with a 4 km resolution, (NASA Ocean Biology) from a 12 x 12 km box centered on P3. A current meter 1 m underneath the sediment trap recorded mean current speeds of 0.05 (range: 0-0.22) cm/s (SeaGuard TD262a). Current speed measurements were taken adjacent to the sediment trap every 15 minutes and averaged over a 1 minute intervals. Hydrodynamic bias was negligible since current speeds over the sampling period were below the level where trapping efficiency is considered to decrease (Supplementary Material 2), and where considerable lateral advection might occur (10-12 cm/s) (Baker et al., 1988; Whitehouse et al., 2012).
2.2 Pteropod identification
The sediment trap samples were analysed in their entirety to avoid splitting biases and to maximize morphometric information (Gerhardt et al., 2000; Chiarini et al., 2013). Specimens were identified, counted and photographed dorsoventrally for shell morphometric characteristics under a dissection microscope (Olympus SZX16 fitted with a Canon EOS 60D DSLR camera).
Identification of unbroken specimens was to species and formae level as described by Van der Spoel and Dadon (1999) and Hunt et al. (2008). Pteropods generally had shells fully intact, however, some shell fragments were found. Shell fragments were only counted as an individual if a protoconch was present. Damaged shells were excluded from morphometric analyses. Unbroken pteropod shells were classed into three categories (Figures 2E–H) to reflect their condition, being 1. Well preserved, retracted soft body with a transparent shell, 2. Signs of degradation of the relaxed soft body with the shell being uniformly frosted or 3. The soft body missing but the shell intact and completely transparent. All pteropods fitting category 1 were assumed to have been alive upon entering the trap (swimmers) and representative of the living cohort present within the area at that time. Those in category 2 were most likely dead when entering the trap (passive sinkers) since uniform shell dissolution is an indicator of post-mortem decay (Oakes et al., 2019). Pteropods in category 3 are most likely to have been predated, i.e. the shells entered the trap empty after the soft body was removed and there was no internal dissolution by decaying tissue. Gymnosomes are specialized predators on thecosome pteropods, grasping the shell and inserting their modified mouth parts inside the aperture to extract the soft body within (Lalli and Gilmer, 1989). Damaged apertures on many of the category 3 shells is consistent with gymnosomes discarding the shell after predation.
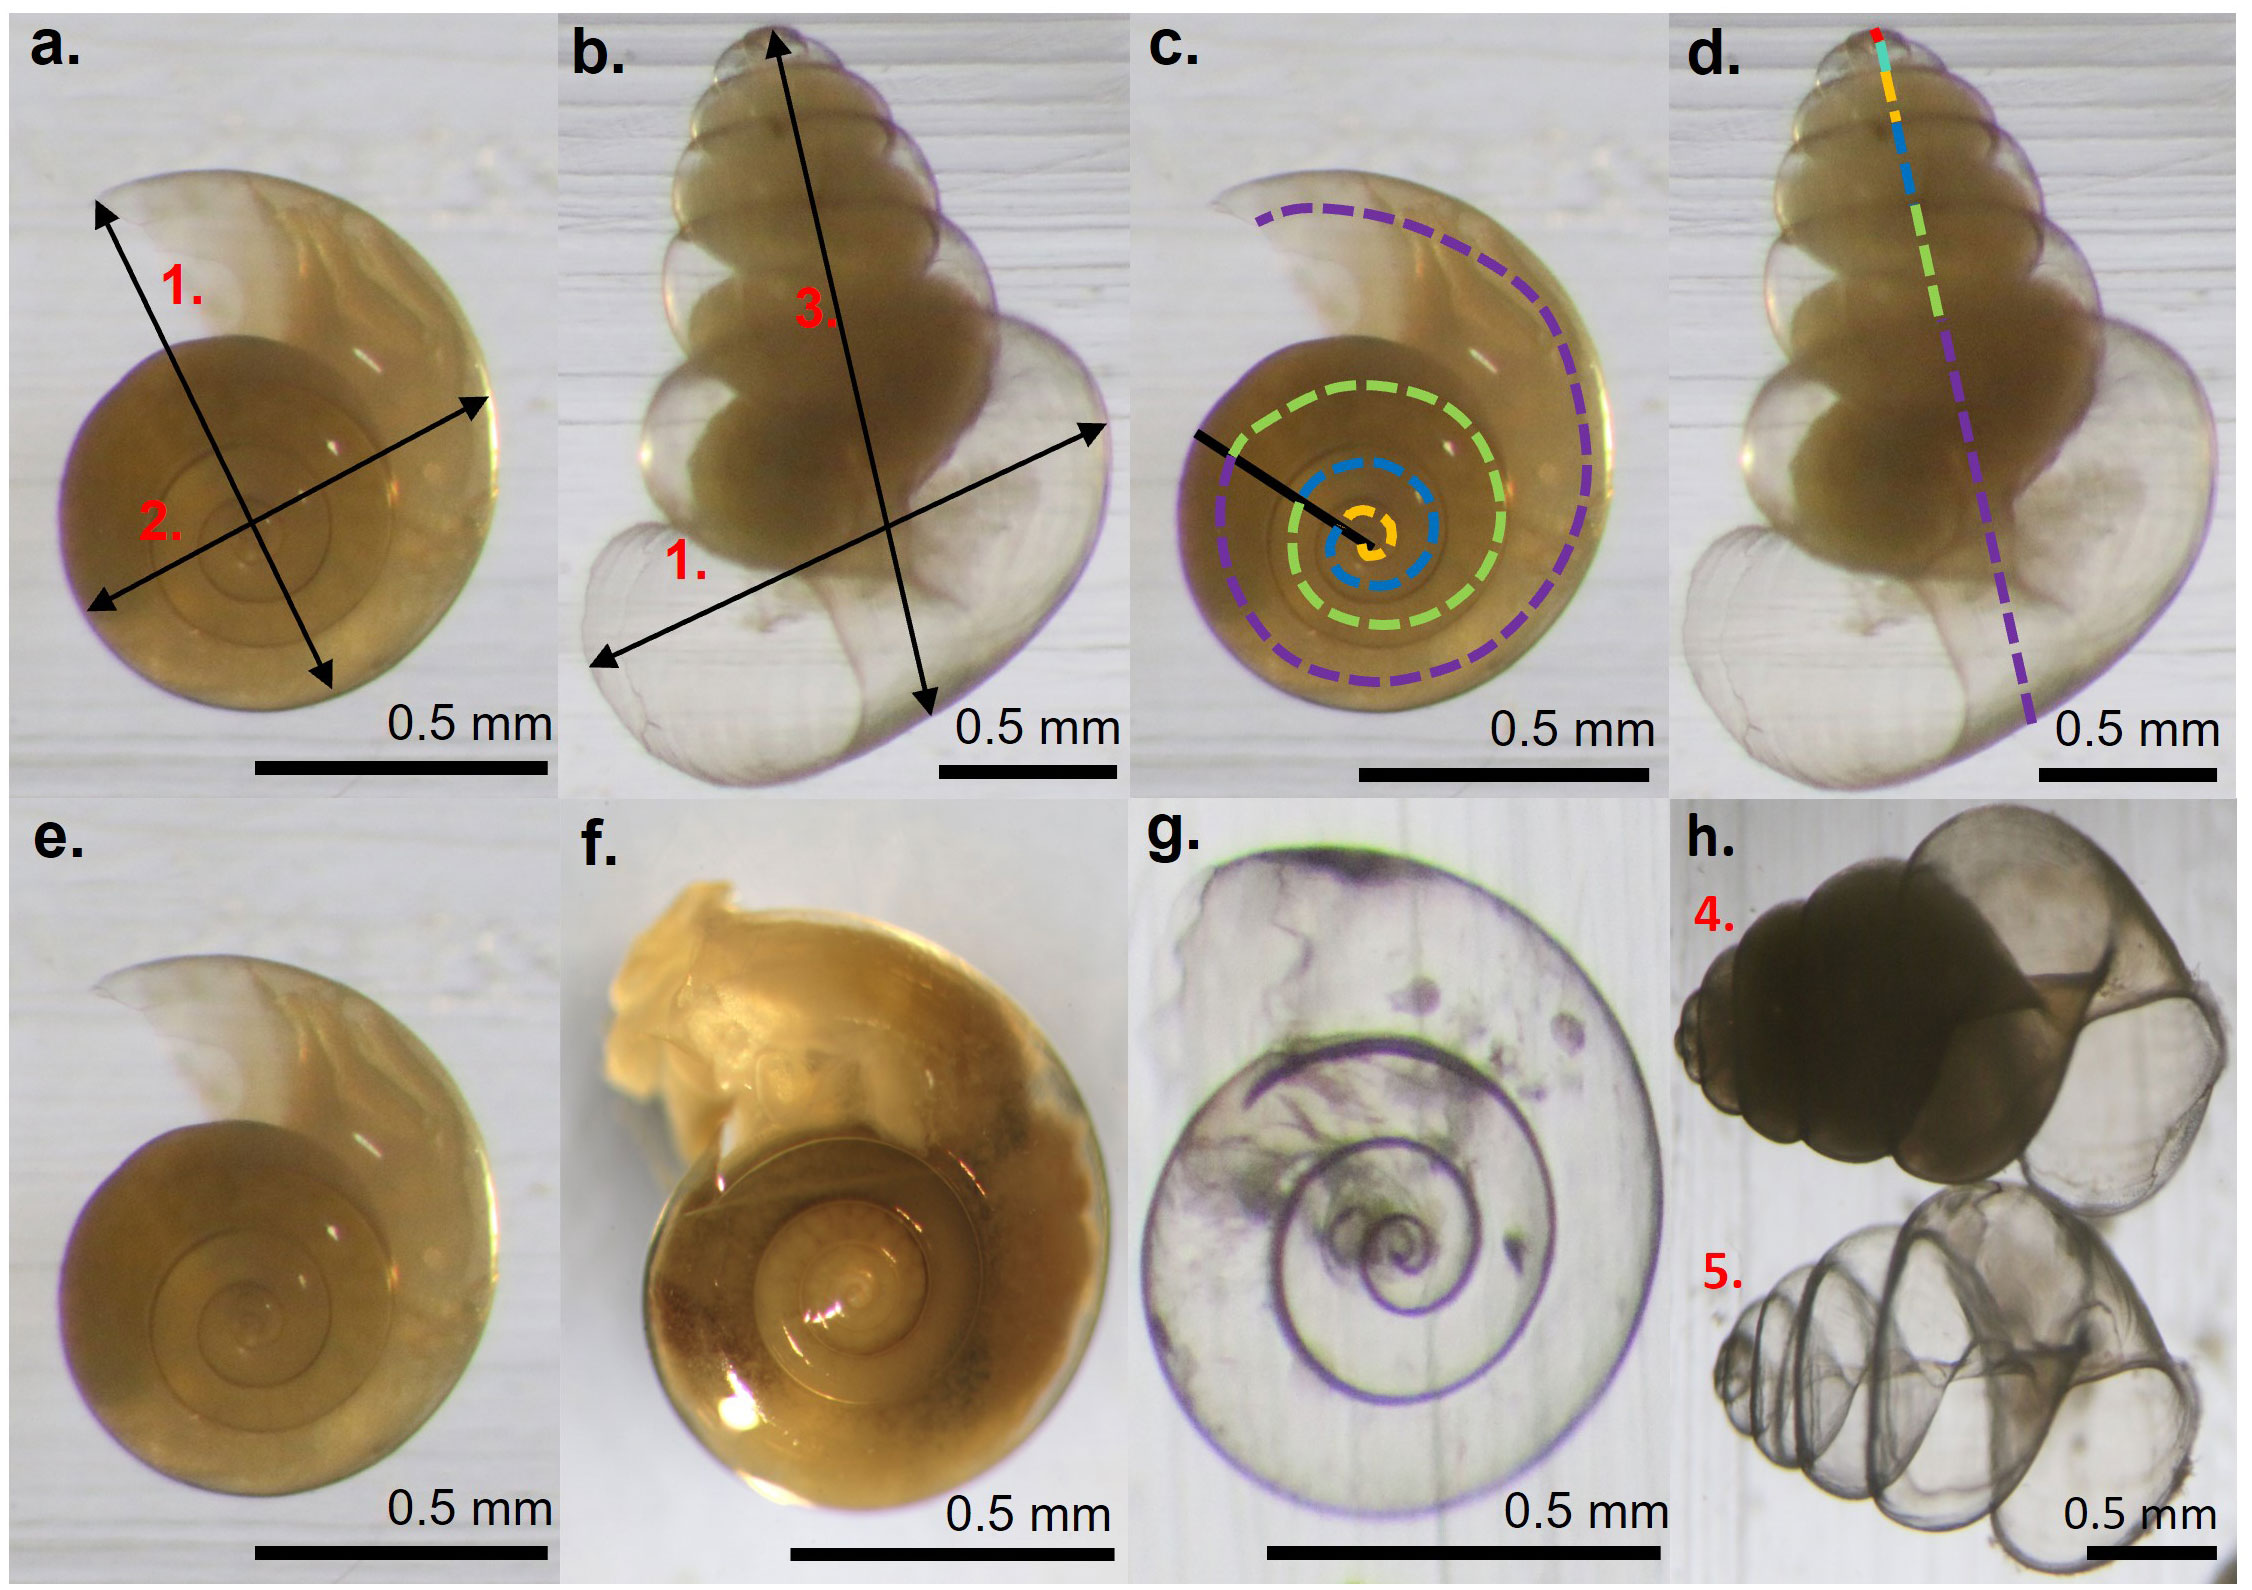
Figure 2 Shell morphometrics used to define pteropod cohorts of (A) L. rangii and (B), L. retroversa where 1. is the shell width (otherwise known as the line of aperture), 2. the shell diameter and 3. the spire height (for L. retroversa). Insets (C, D). indicate how the number of whorls was measured on L. rangii and L. retroversa, respectively, where each colour corresponds to one whorl. (E–H) indicate pteropod shell conditions being category 1/swimmers (E): L. rangii, (H)4: L. retroversa), category 2/passive sinkers (F): L. rangii) or category 3/predated (G): L. rangii, (H)5: L. retroversa).
2.3 Assessment of shell morphometrics
Shell diameter, shell width (otherwise called the line of aperture or aperture length), spire height and the number of whorls of L. rangii, L. retroversa and Limacina spp were measured using ImageJ software (Schindelin et al., 2012) (Figure 2). A Principal Component Analysis (PCA; run in R using prcomp{base}) determined that any of the shell morphometrics are adequate for representing pteropod shell size throughout the sampling period. Hereafter, shell width for L. rangii and Limacina veligers and spire height for L. retroversa will be used since these are common measures in the literature. Full details of the shell morphometric assessment are given in Supplementary Material 3.
2.4 Cohort and group identification
L. rangii with a shell width of <0.3 mm were classed as veligers, 0.3 - 4 mm as juveniles and >4 mm as adults. Similarly, L. retroversa individuals with a spire height of <0.3 mm, 0.3 - 1 mm and >1 mm were classified as veligers, juveniles and adults, respectively (Lalli and Wells, 1978; Lalli and Gilmer, 1989). Veligers have only a single shell whorl and cannot be distinguished to species level and are therefore classed as Limacina spp.
Mixture models of shell morphometrics were fitted using normal, lognormal, gamma and Weibull distributions to one, two and three components extracted based on peaks observed on the size-frequency histograms using the R package ‘mixdist’ (MacDonald and Juan, 2012). The best-fitting distribution type and number of components were selected based on a combination of chi-square goodness of fit and visual inspection of histograms.
2.5 Shell growth, spawning behaviour and longevity
Groups of similarly sized specimens with the sample population were identified by the mixture analysis and tracked throughout the year, from the time of recruitment to when they no longer appear within the population (due to die-off or migration out of the sample area). It was assumed these subgroups represented cohorts. Tracking cohorts across sediment trap samples enables estimation of the mean increase in shell width per day (the growth rate) for each cohort. The difference in mean shell width between the two dates of observation was divided by the intervening time. This cohort definition assumes sampling was representative of a static population and that growth was continuous and linear between each sample interval.
We assumed modal peaks in the mixdist analysis below <0.3 mm signify a hatching event of Limacina individuals. Continuous spawning can be detected by the persistent presence of this smaller size class. Previous studies on Limacina species have indicated that hatching occurs between 1- 10 days after spawning (Paranjape, 1968; Kobayashi, 1974; Lalli and Wells, 1978; Gannefors et al., 2005; Howes et al., 2014; Akiha et al., 2017) with rapid growth and development of parapodia (wings) within 30 days (Van der Spoel and Dadon, 1999). Therefore, spawning events can be assumed to have occurred within 10 days of the capture of veligers in the samples.
Longevity was estimated from the date of a cohort’s recruitment until its disappearance from size-frequency histograms assuming a static population that did not migrate in or out of the sampling region. Since some life stages were not observed with the sediment trap (e.g. adult L. rangii) our study has limitations. To anticipate longevity of this species we extrapolated the growth rates determined in younger life stages of the cohort to estimate the amount of time it would take to reach the maximum adult sizes recorded within the literature.
3 Results
3.1 Pteropod abundance and seasonal trends
Six species of thecosome pteropod were identified within the sediment trap: Limacina rangii, formerly L. helicina antarctica (LH), Limacina retroversa f. australis (LR), Clio pyramidata f. sulcata, and Clio pyramidata f. excise. Over the entire sampling period, four Clio piatkowski and three Peraclis cf. valdiviae were also collected (Supplementary Material 4).
3.1.1 Limacina rangii
The total abundance of L. rangii per month peaked in austral summer, January (6696 ind.), February (5258 ind.) and March (5466 ind.) and did not exceed 201 individuals (November) in the remaining months. No adult L. rangii were collected during the sampling period. The majority of L. rangii collected each month were swimmers, with the highest proportion of swimmers in February (94% of February LH abundance, 4921 ind.) and the lowest in April (56% of April LH abundance, 98 ind.) (Figures 3A; 4A). Passively sinking L. rangii were most abundant in January (718 ind.), and proportionally most abundant in April (37% of April LH abundance, 64 ind.) (Figures 3B; Supplementary Material 5). The highest abundance of predated L. rangii was collected in January (1%, 64 ind.) while the highest proportion of predated individuals was collected in September (8% of September LH abundance, 4 ind.) and April (7% April LH abundance, 12 ind.) (Figure 3C).
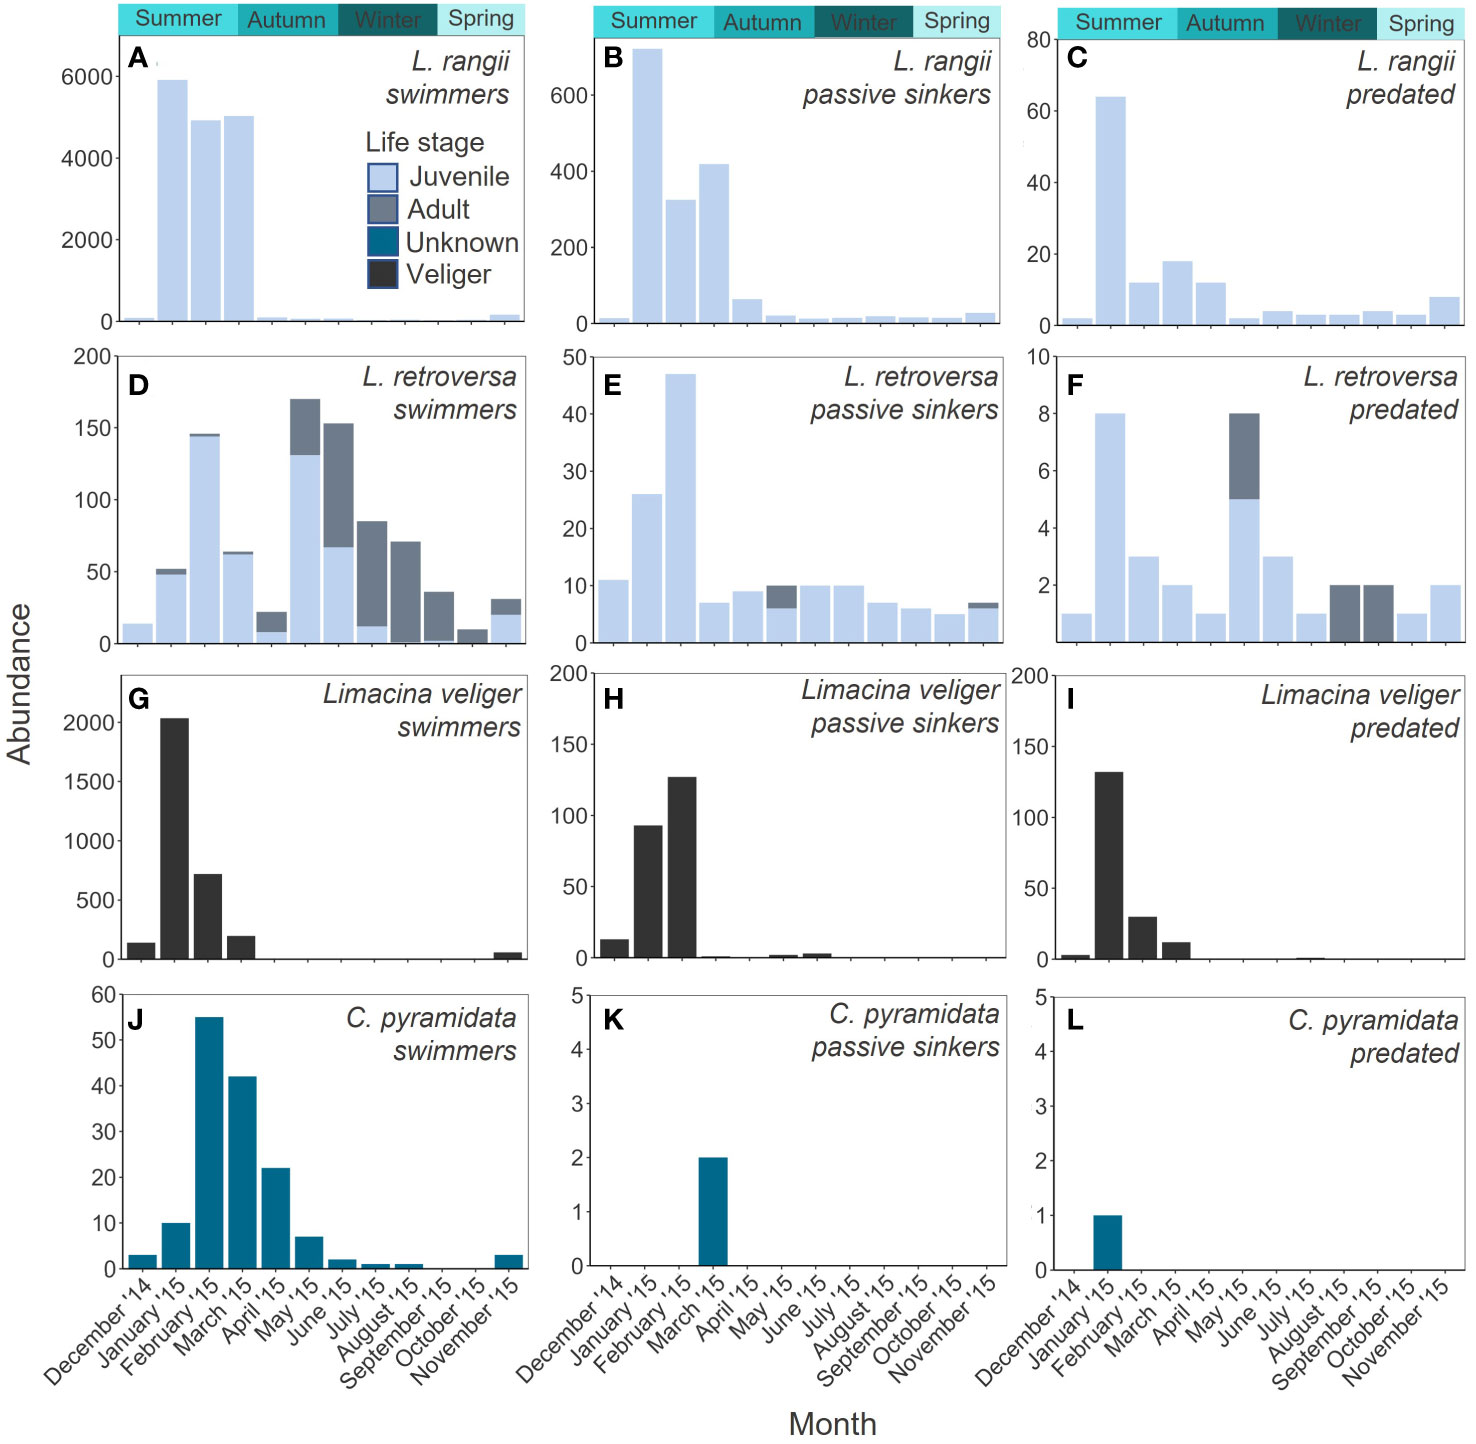
Figure 3 Monthly abundance of L. rangii (A–C), L. retroversa (D–F), Limacina spp (G–I) and C. pyramidata (J–L) collected in a sediment trap at site P3 (Scotia Sea, Southern Ocean) at 400 m depth between December 2014 and November 2015.
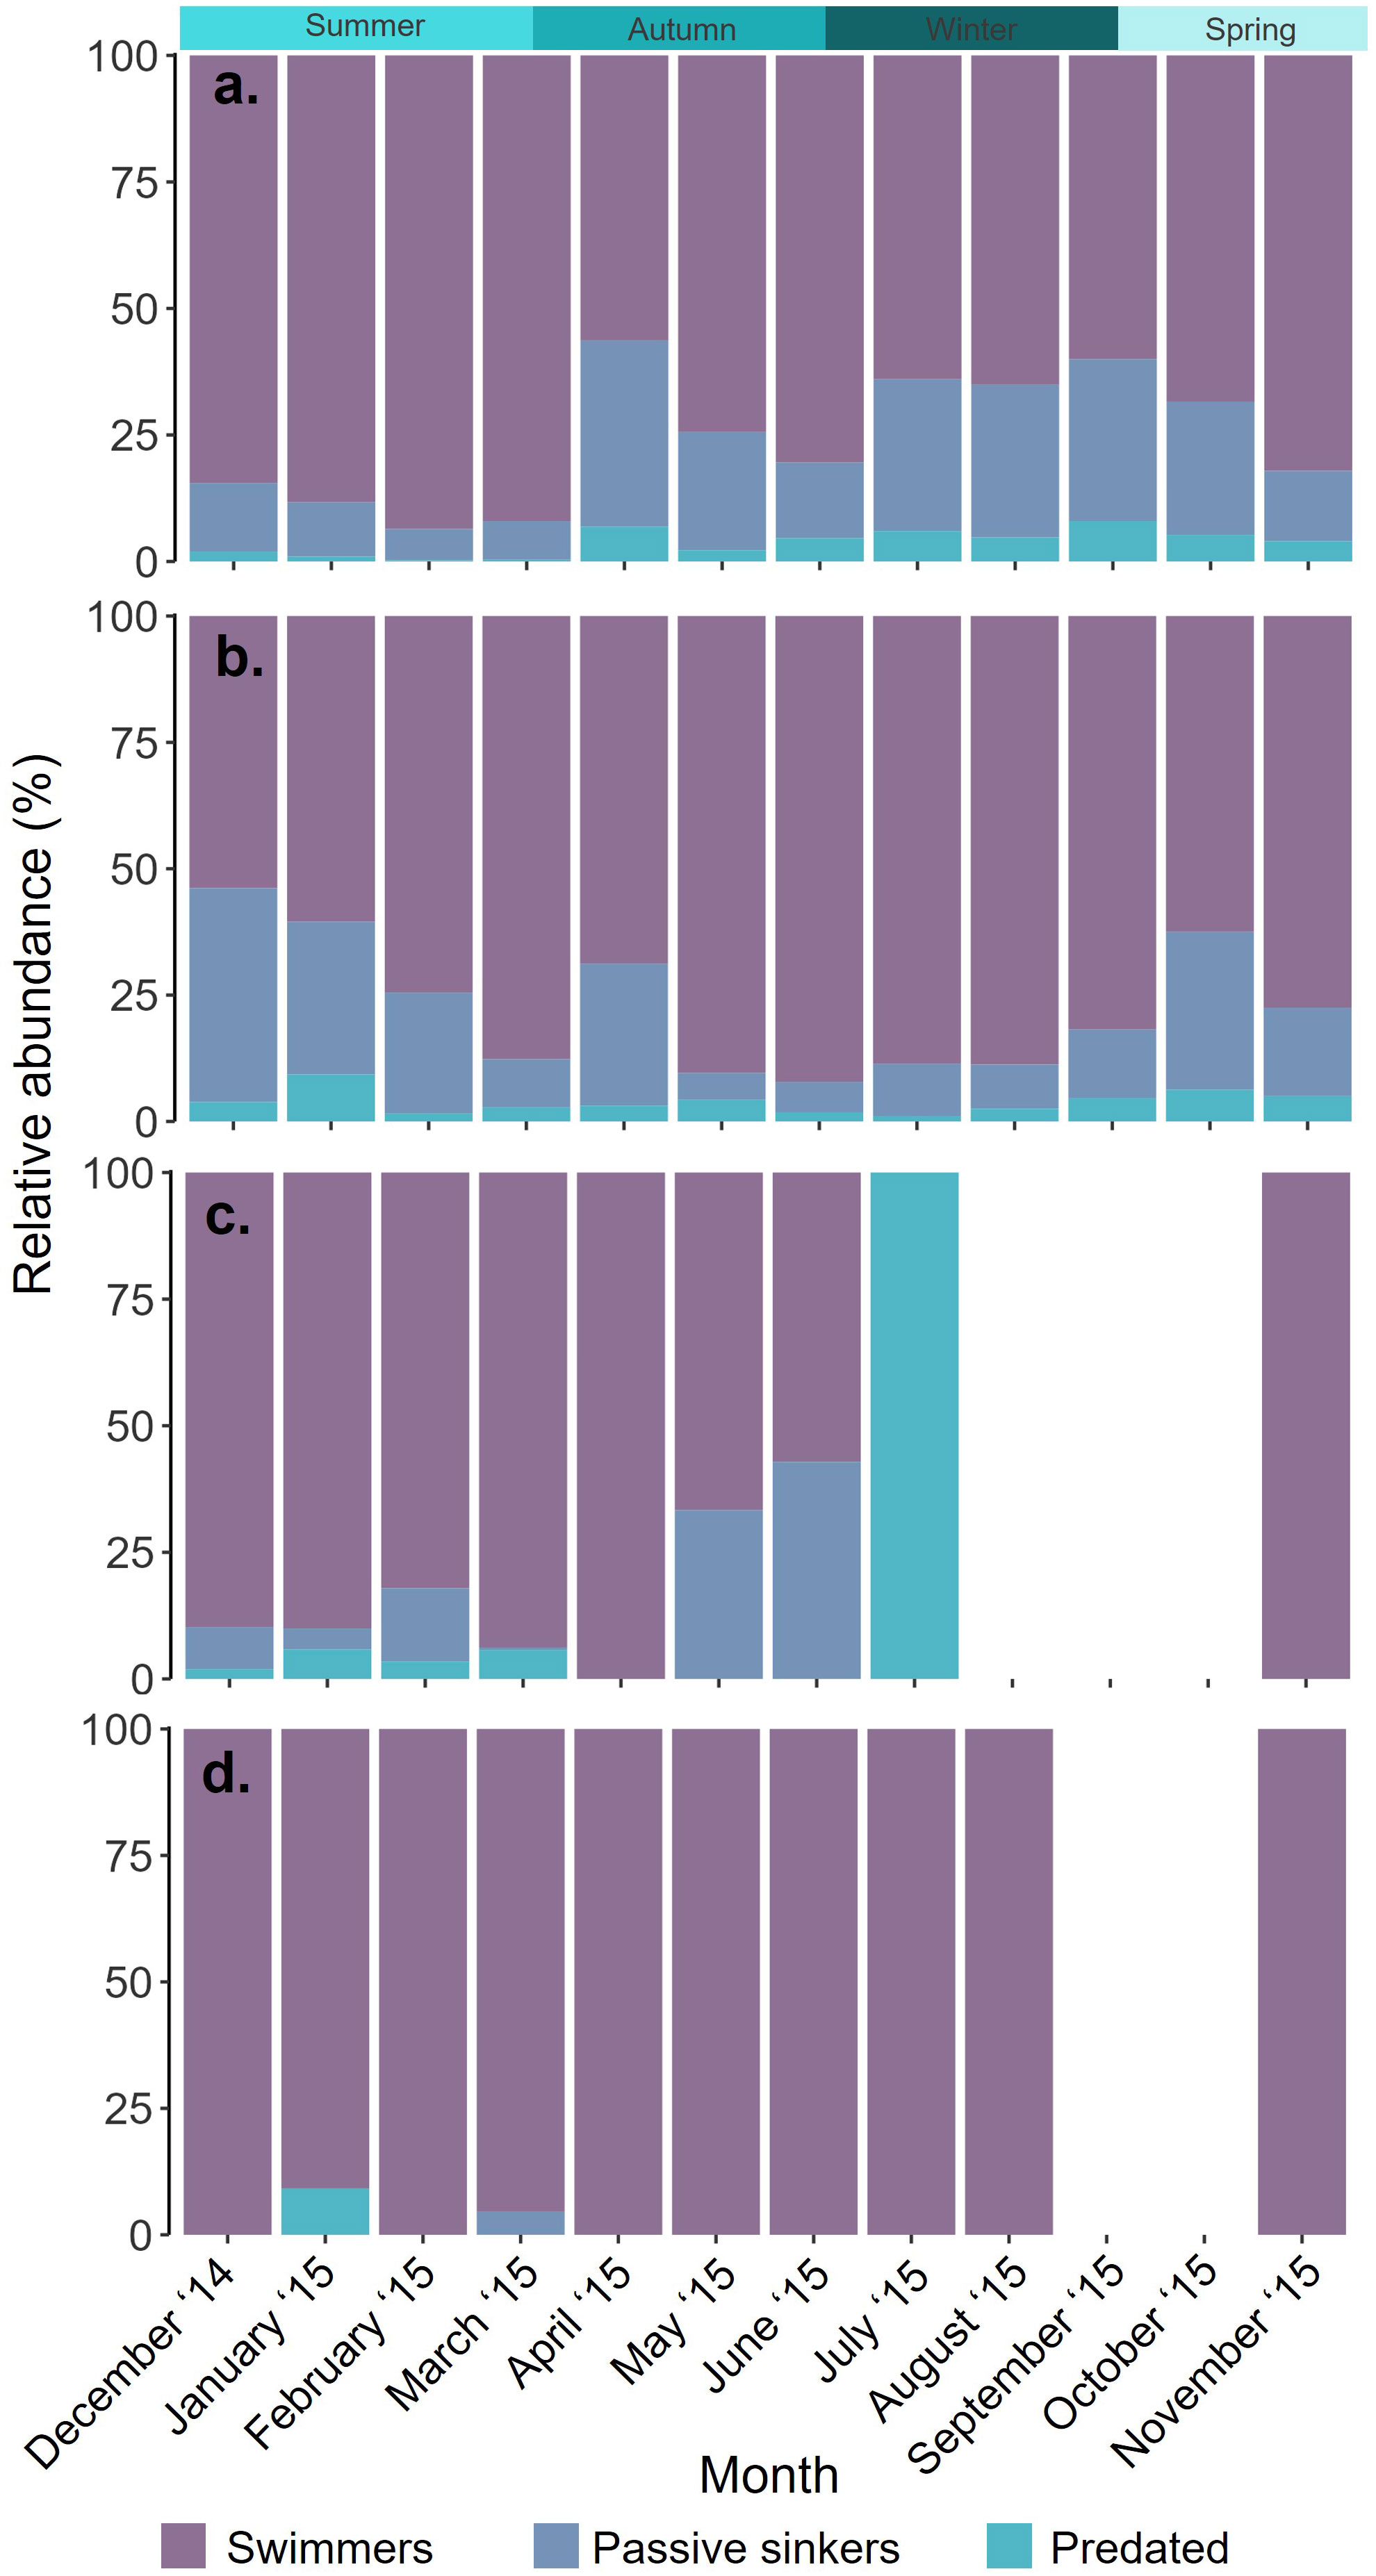
Figure 4 Proportional abundance (%) of the number of swimming, passively sinking and predated (A). Limacina rangii, (B). Limacina retroversa, (C). Limacina veliger and (D). Clio pyramidata each month between December 2014 and November 2015 in a sediment trap deployed at 400 m depth at site P3 (Scotia Sea, Southern Ocean).
3.1.2 Limacina retroversa
L. rangii were more abundant than L. retroversa between September and April (Total monthly abundance range for LH: 50-6,696 ind. and LR: 32-44 ind.), however, L. retroversa were more abundant than L. rangii between May and August (Total monthly abundance range for LR: 80-188 ind. and LH: 63-90 ind.). Both adult and juvenile L. retroversa were identified, with adults making up the majority of specimens collected from June to October (52-90% of monthly LR abundance, 16-166 ind.), and juveniles from November to May (56-100% of monthly LR abundance, 26-196 ind.). Most L. retroversa collected each month were swimmers, with the highest proportion in June (92% of June LR abundance, 153 ind.) and the lowest in December (54% of December LR abundance, 14 ind.) (Figures 3D, 4B; Supplementary Material 5). The greatest proportion of passively sinking L. retroversa was collected in December (42% of December LR abundance, 11 ind.) and the lowest proportion in May (5% of May LR abundance, 10 ind.) (Figure 3E). The highest abundance of predated L. retroversa was collected in January (9% of January LR abundance, 8 ind.) and lowest in July (1% of July LR abundance, 1 ind.) (Figure 3F).
3.1.3 Limacina veligers
Limacina veligers were only collected between November and July, with total abundance peaking in January (2260 ind.), February (877 ind.) and March (210 ind.) (Figure 3C). The majority of Limacina veligers collected were swimmers between November and June (57- 100% of veliger monthly abundance) (Figures 3G, 4C; Supplementary Material 5). Passively sinking Limacina veligers were most abundant in February (14% of veliger February abundance, 127 ind.) and proportionally most abundant in June (43% of veliger June abundance, 3 ind.) (Figure 3H). No passively sinking Limacina veligers were collected in April or July-November. The highest abundance of predated Limacina veligers was collected in January (132 ind.) accounting for 6% of total abundance in January (Figure 3I).
3.1.4 Clio pyramidata
The total abundance of C. pyramidata peaked in February (55 ind.), March (46 ind.) and April (22 ind.). Almost all C. pyramidata collected were swimmers (Figures 3J, 4D; Supplementary Material 5), with two passively sinking individuals being collected in March and one predated individual being collected in January (Figures 3K, L).
3.2 Limacina rangii population structure and growth rates
The recruitment of L. rangii veligers into the juvenile life stage and the similarly-sized subgroups LH1 - 5 can be deduced from the mean shell sizes identified by the Mixture analysis (Figures 5.1, 6A; Supplementary Materials 6-7). However, the entire life cycle of L. rangii was not captured by the Mixture analysis since no L. rangii adults were collected. We do not consider LH1 - LH5 to represent discrete cohorts given their wide and overlapping distributions (Figures 5.1, 6A). LH1 represents young, newly recruited juveniles with a mean shell width range of 0.34-0.37 mm and were collected between December and March 2014. LH2 is comprised of larger, older juveniles than LH1 (mean shell width range 0.47-1.01 mm) and was collected between December and April. LH3 (mean shell width 0.5 mm) and LH4 (mean shell width 0.38 mm) were collected in May and June, respectively. Finally, LH5 was collected between June and November (monthly mean shell width 0.52-1.79 mm) and represents overwintering juveniles.
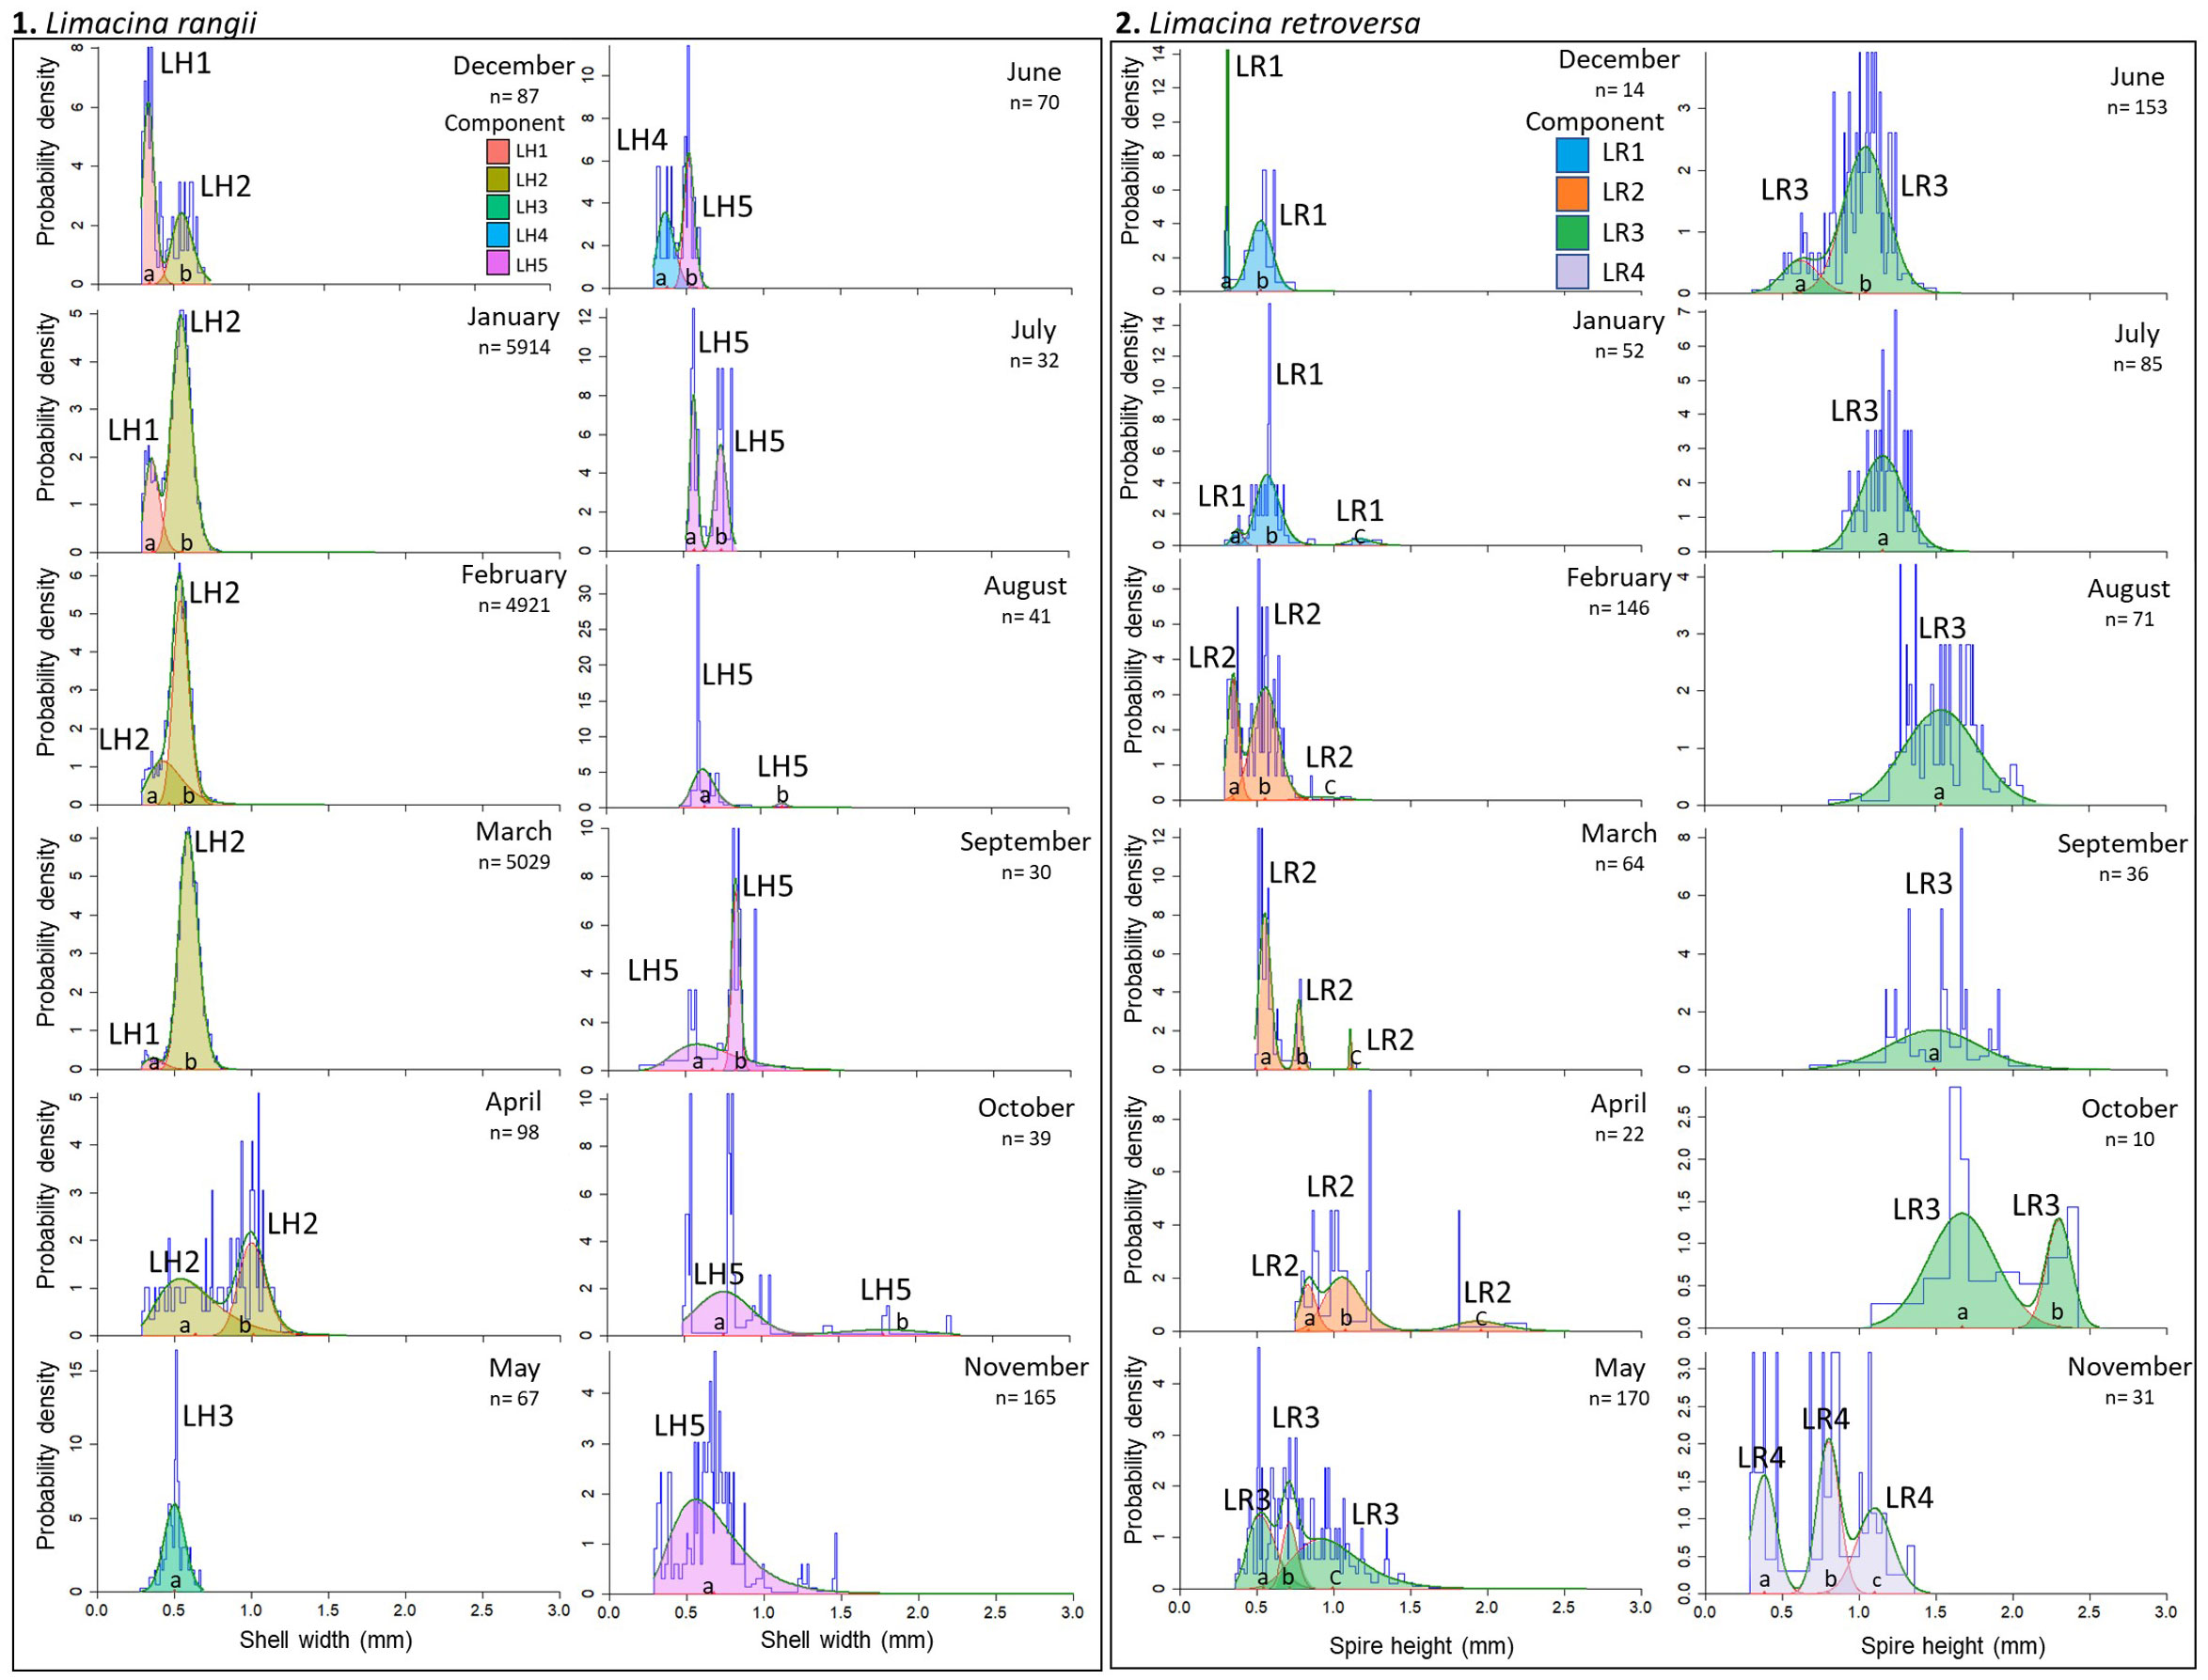
Figure 5 Components identified by the mixture analysis on shell width data of 1. L. rangii (L.H.) swimmers and 2. L. retroversa (L.R.) swimmers for each month of a year-long sampling period. Mixture analysis was performed by the R package Mixdist. Tracking components through the course of the year provides an estimate of growth rate. Blue lines represent the original length-frequency distribution representing the shell heights/widths, red lines are the individual fitted distributions (a-c) and green lines are the sum of fitted distributions.
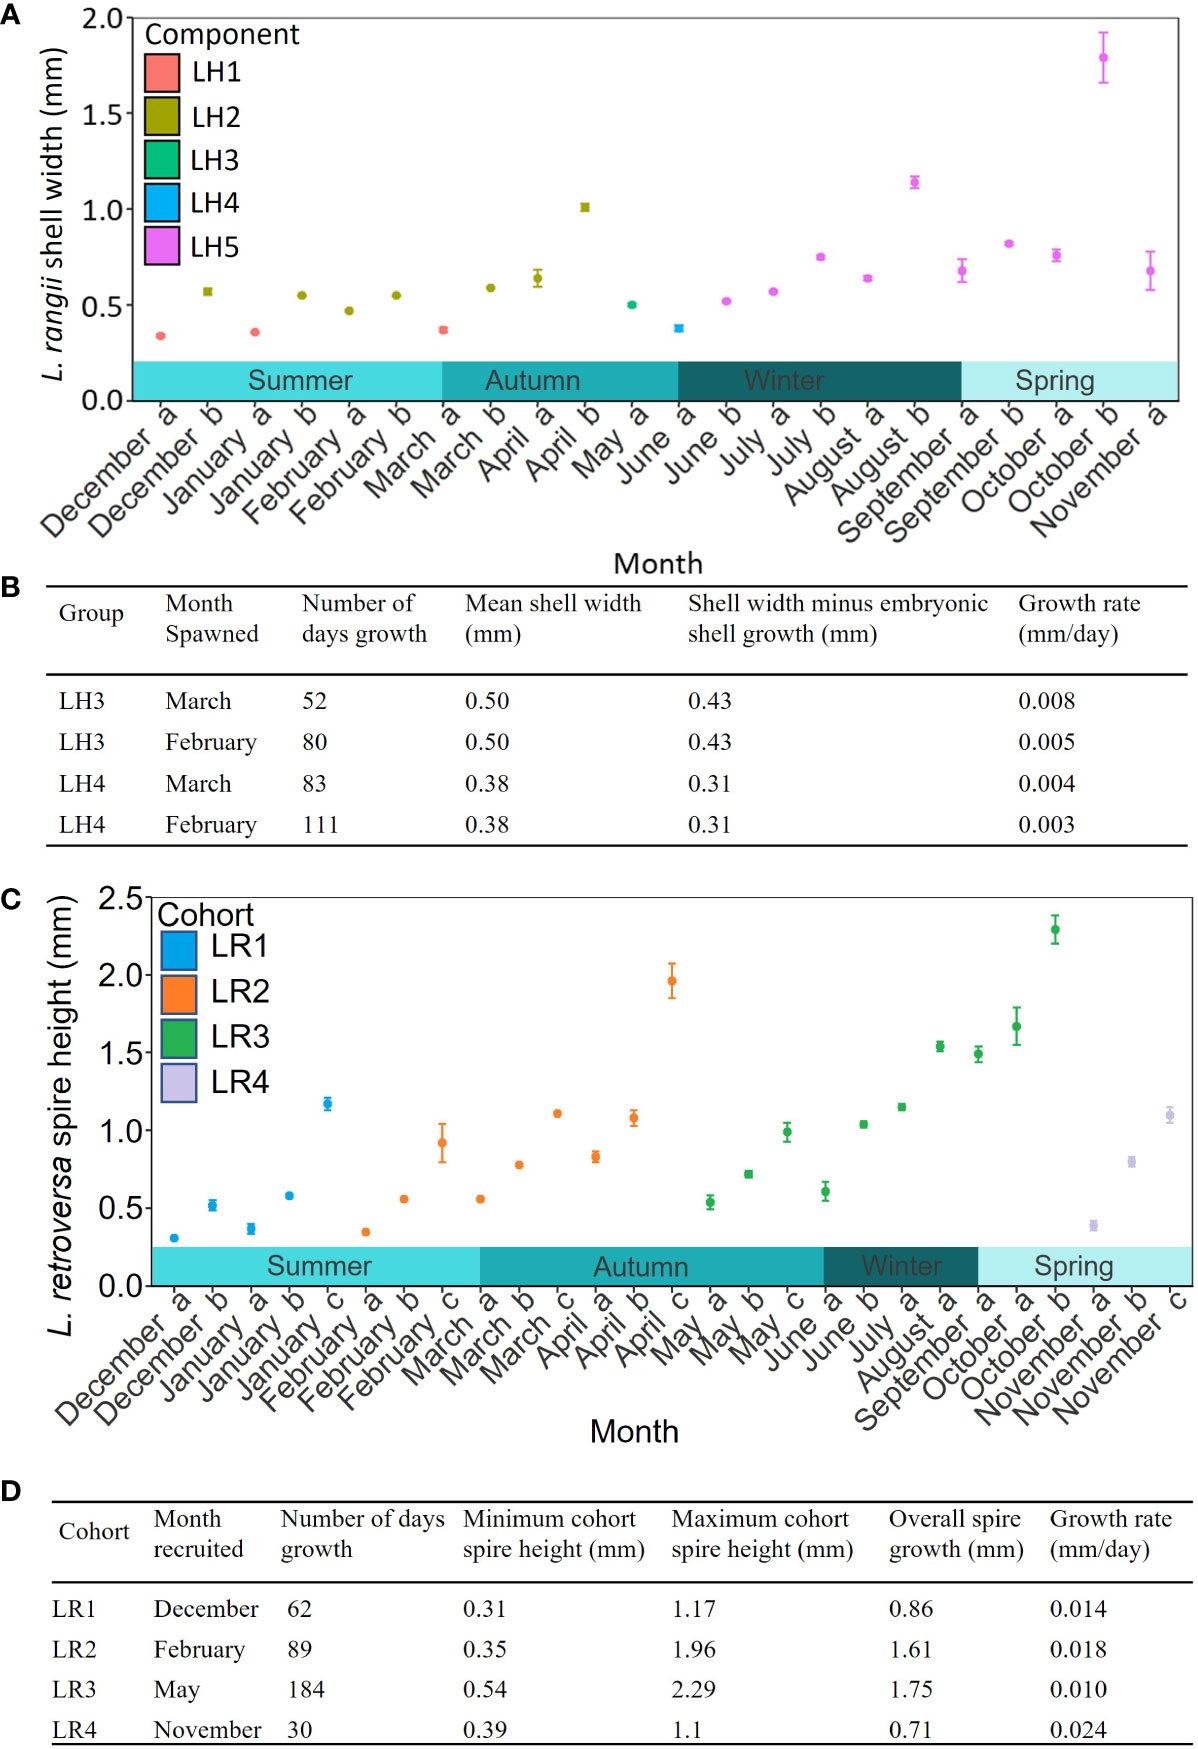
Figure 6 The temporal sequence of mean shell width from the mixture analysis of (A) Limacina rangii (LH) with standard error of each component. (B) Growth rates of L. rangii for LH3 and LH4. Two calculations were made for each component to capture uncertainty on whether spawning was in February or March. (C) The temporal sequence of mean spire height of L. retroversa australis (LR) with standard error of each component computed by the mixture analysis (a-c). (D). Growth rates of LR are based on tracking each of the four components over time. Individuals were collected in a sediment trap deployed at P3 (Scotia Sea, Southern Ocean) at 400 m depth between December 2014 and November 2015.
The prolonged presence of LH1 and LH4, which contain small juveniles (mean shell width 0.34 and 0.38 mm), as well as the presence of veligers between December and March, indicates protracted spawning by L. rangii. Growth rates can only be estimated for LH3 and LH4, as they were present after the last spawning event in March. Since it is unclear when LH1, LH2 or LH5 were spawned, growth rates could not be calculated for these subgroups. If LH3 individuals were spawned in February or March, the shell growth rate of LH3 would be 0.005-0.008 mm d-1 to reach a shell width 0.50 mm by May (Figure 6B). The growth rate of LH4 would be 0.003-0.004 mm d-1 to reach a shell width of 0.38 mm by June. These growth rate calculations assume that L. rangii veligers emerged from the egg-sac 10 days after spawning with a shell size of 0.07 mm.
3.3 Limacina retroversa population structure and growth rates
Four non-overlapping cohorts of L. retroversa juveniles and adults were identified, spawning in December (cohort LR1), February (cohort LR2), May (cohort LR3) and November (cohort LR4) (Figures 5.2, 6C). Each cohort can be observed to increase in size to achieve adulthood (>1 mm) over two to five months with rates of shell spire height increase averaging LR1: 0.014 mm d-1, LR2: 0.018 mm d-1, LR3: 0.010 mm d-1 and LR4: 0.24 mm d-1 (Figure 6D). Adult individuals were not collected in samples containing veligers of the subsequent cohort, suggesting L. retroversa have a longevity of one to seven months.
The veligers recruited into cohort LR1 in December (mean spire height 0.31 mm) likely hatched in November, making the growth rate 0.006 mm d-1. Veligers recruited into LR2 in February (mean spire height 0.35 mm) hatched in January and grew 0.007 mm d-1. Because juvenile LR3 were first recorded in May (mean spire height of 0.54 mm), the growth rate of LR3 veligers was 0.005 mm d-1 or 0.006 mm d-1 assuming they hatched in February or March, respectively. LR4 individuals hatched in November, with veligers growing at 0.016 mm d-1 and becoming juveniles in the same month (mean shell size 0.39 mm).
3.3.1 Environmental data
Mean temperature ranged from 0.73°C (± 0.03 S.E.) in October to 1.15°C (± 0.01 S.E.) in May with the greatest intra-month variability occurring in November (1.03°C) (± 0.03 S.E.) (Figure 7). pH reached a maximum of 8.13 (± 0.00 S.E.) in November and a minimum of 7.95 in December (± 0.01 S.E.) with the greatest variation in December (7.95 ± 0.01 S.E.). The highest oxygen concentration occurred in November and 200.1 µM (± 0.02 S.E.) while the lowest mean values occurred in December and January (191.3 µM (± 0.02 S.E.) and 192.6 µM (± 0.01 S.E.), respectively). The greatest mean chlorophyll-a concentrations were in December 2014 (2.07 mg m-3 ± 0.02 S.E.), November 2015 (2.03 mg m-3 ± 0.03 S.E.) and February 2015 (2.32 mg m-3 ± 0.05 S.E.). Cloud cover was too dense from May to July to allow satellite chlorophyll-a measurements. An initial bloom started to form in October (1.32 mg m-3 ± 0.02 S.E.), which expanded and intensified around P3 through November and December (Supplementary Material 8). The minimum chlorophyll-a concentration was recorded in August (0.01 mg m-3 ± 0.00 S.E.).
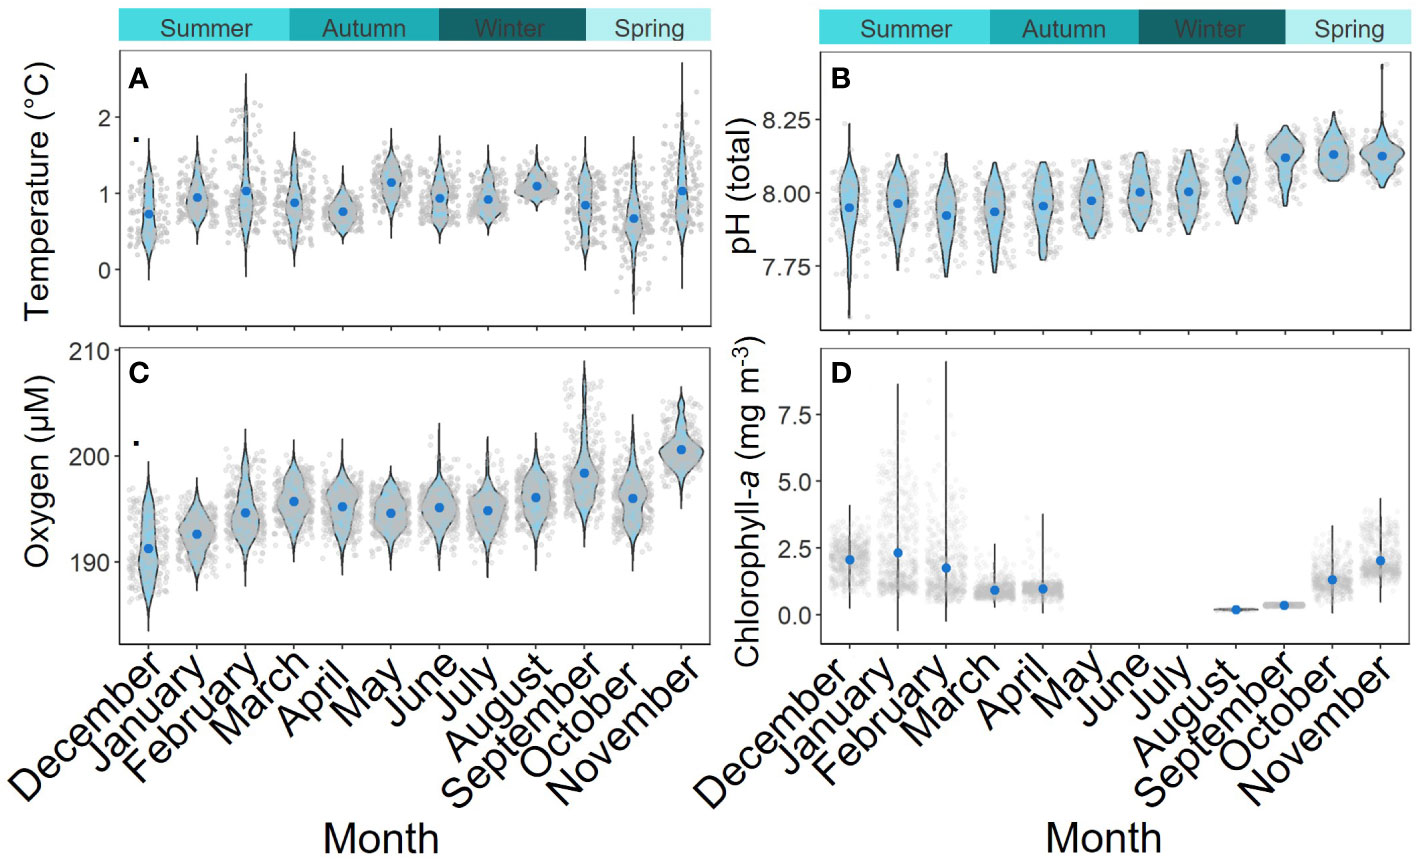
Figure 7 Monthly environmental conditions associated with the sediment trap deployed at P3 (Scotia Sea; Southern Ocean) between December 2014- November 2015. Temperature (A) and pH (B) were measured in-situ at 200 m. Oxygen (C) (µM) was measured in-situ at 400 m. Chlorophyll-a (D) measurements were taken from Aqua MODIS at 4 km resolution satellite data (NASA; Ocean Biology). Grey dots are individual data points, Blue dots are the means and the thickness of the violin plot represents data probability density.
4 Discussion
4.1 Pteropod diversity
True polar species L. rangii was the most abundant pteropod collected at P3, consistent with similar observations made south of the Polar Front (Dadon, 1990; Ward et al., 2004; Hunt et al., 2008; Bernard and Froneman, 2009; Akiha et al., 2017). Subpolar species L. retroversa was the second most abundant species, as it is typically most abundant north of the Polar Front (Chen and Bé, 1964; Van der Spoel, 1967; Van der Spoel, 1976).
C. pyramidata forma sulcata is commonly captured in small numbers alongside Limacina species throughout the Southern Ocean (Hunt et al., 2008). No records could be found of the thecosome pteropods Clio piatkowskii, Peraclis cf. valdiviae and C. pyramidata f. excise in the Scotia Sea. C. piatkowskii have been documented in the Weddell Sea (Van der Spoel et al., 1992; Van der Spoel and Dadon, 1999), Lazarev Sea (Flores et al., 2011) and near Bouvetøya (Hunt et al., 2008) at 300-1000 m water depth. Peraclis cf. valdiviae has previously been recorded south of Tasmania, within the Sub-Antarctic Zone down to 150 m water depth (Van der Spoel and Dadon, 1999; Howard et al., 2011; Roberts et al., 2011). C. pyramidata f. excise has been recorded in the Lazarev Sea (MSIP, 2017). The high diversity and abundance of pteropods collected in this study highlights that sediment traps are effective at long-term, remote sampling of pteropods in regions that are difficult to access.
4.2 Environmental conditions
The chlorophyll-a observations indicate that high primary productivity persisted north of South Georgia from October until February, peaking in November, as is typical for this region (Korb and Whitehouse, 2004; Korb et al., 2005; Atkinson et al., 2012). The high oxygen concentrations observed from September to November likely reflects deep wind-driven mixing entraining surface water down to 200 m depth. The lowest mean oxygen concentrations between December and January likely reflect a reduction in surface mixing, and increased respiration and remineralisation following the bloom.
4.3 The life cycle of Limacina rangii in the Scotia Sea
Five similarly-sized subgroups of juvenile L. rangii were identified (LH1 - 5) as being recruited into the population between November 2014 and December 2015. L. rangii is inferred to have continuously spawned between November and March and with concurrent recruitment of juveniles into LH1 - 2. The spawning and early growth period of LH1 - 2 was coincident with the warmest temperatures and peak of the of the South Georgia bloom, providing sufficient food for these energetically expensive life stages (Seibel et al., 2012; Bednaršek et al., 2016; Manno et al., 2017).
The absolute abundance of L. rangii juveniles collected in the sediment trap dropped by 97% at the end of the productive period (April). This dramatic decline in abundance is a phenomenon observed by numerous studies (Gilmer and Harbison, 1986; Seibel and Dierssen, 2003; Maas et al., 2011) and has been attributed to: 1. a fatal environmental perturbation, 2. a die-off event, 3. a change in current speed or direction transporting the population away or 4. active migration (Gilmer and Harbison, 1986; Collier et al., 2000; Accornero et al., 2003; Seibel and Dierssen, 2003; Maas et al., 2011). Current activity did not change, suggesting that the population was not physically transported away, ruling out scenario 3. Swimmers remained the dominant classification of specimens collected in the trap, suggesting that this was not a mass mortality event affecting the entire population. However, the relative abundance of type 2 (passive, dead) specimens of L. rangii did increase somewhat in April, as did the number of predated shells. There are no notable anomalies within the environmental parameters beyond the natural, seasonal decline in chlorophyll-a at the end of the bloom. It would seem that the decline in the population is related closely to the cessation of the phytoplankton bloom. As food resources became scarce the incidence of natural and predated deaths increased. It may be possible that the population migrated laterally, possibly following food availability elsewhere, however we have no evidence to support or dispute this. Another possibility is that once juveniles had matured enough to perform their diurnal migrations, the end of the bloom meant that there was no longer any incentive to migrate into the shallow waters. That is, once the phytoplankton bloom had ceased and the remaining organic matter sank through the water column, there was no reason for L. rangii to migrate vertically above the depth of the sediment trap. L. helicina are known to enter a diapause at depth during the winter in the Arctic when food is scarce (Gannefors et al., 2005). Our findings here suggest that L. rangii may well do the same outside of the bloom season in the Scotia Sea (Figures 3, 7; Supplementary Material 2, respectively). The specimens of L. rangii collected during the winter months (LH5) were all juveniles. This overwintering population appears to have adopted two different growth patterns, with some entering diapause (a state of suspended growth) and others continuing to grow. Such contrasting growth patterns likely reflect the patchiness of food sources during the winter, meaning not all juveniles had the available resources to invest into growth (Meyer et al., 2017). As Akiha et al. (2017), we collected no adult L. rangii in the sediment trap. The absence of adults may reflect the tendency of more mature specimens to dwell below the depth of the sediment trap by day, reducing the potential incidence of adult L. rangii entering the trap passively (dead). The absence of adult L. rangii entering the trap as swimmers may reflect a survival instinct and ability to swim out of danger (Adhikari et al., 2016; Gilmer and Harbinson, 1986).
The current study found that L. rangii has a protracted spawning period, ending at the end of the productive period in March. After March individuals continued growing and some overwintered as juveniles. Hunt et al. (2008) and Van der Spoel (1967) postulated that L. rangii could spawn twice in a year, with the first occurring during the summer, and the second in the autumn, where these late comers enter a diapause and overwinter without growth. The autumnal spawning theory was based on observations of L. helicina helicina in the Arctic (Kobayashi, 1974; Gannefors et al., 2005) and limited winter net samples in the Southern Ocean (Hunt et al., 2008). Bednaršek et al. (2012b) inferred from net samples in the Scotia Sea that the spawning of L. rangii was a discrete event, occurring predominantly during the summer. While the timing of the discrete spawning event identified by Bednaršek et al. (2012b) corresponds to the peak of spawning at P3 in the current study, the continuous recruitment of small L. rangii juveniles evidence in the sediment trap at P3 indicates that spawning occurred over a much longer period (summer to early autumn). It is likely that the difference in spawning period estimates arises from differences in the scale of the respective studies. Bednaršek et al. (2012b) considered spawning across the entire Scotia Seaand did not have the time series of data afforded by the sediment trap.
The rate of growth for veligers to reach the small juvenile size-bins (LH3 and LH4) was calculated as between 0.005 and 0.008 mm d-1 (LH3) or 0.003 and 0.004 mm d-1 (LH4) in the current study, depending on whether spawning occurred in February or March. Bednaršek et al. (2012b) also calculated the growth rate of L. rangii using a cohort analysis from plankton net samples in the Scotia Sea between October and March (1996-2005). L. rangii in the current study are mainly comparable to their group “G2”, which had a growth rate of 0.007 mm d-1 (after conversion of shell diameter to shell width (Supplementary Material 3). The growth rates estimated for LH3 (0.005- 0.008 mm d-1) largely in agreement Bednaršek et al. (2012b), however, LH4 growth rates are about half (0.003 - 0.004 mm d-1) those estimated by Bednaršek et al. (2012b). The lower growth rates for LH4 may reflect the scarcity of food towards the end of the bloom for this subgroup that spawned later (Figure 7; Supplementary Material 8). Since we have established that growth rates are not continuous or linear, rather dependent on life stage and environmental conditions we were unable to calculate the amount of time to reach maturity or longevity for L. rangii.
4.4 The life cycle of Limacina retroversa in the Scotia Sea
Four generations of L. retroversa were collected that included all life stages and no overlapping of cohorts. These distinct cohorts were identified as juveniles and adults between December and January (LR1), February and April (LR2), May and October (LR3) and in November (LR4). Individuals that reach adulthood in late summer/autumn appear to stay in the upper 400 m of the water column and overwinter as adults until the spring, when they spawn. The veligers then hatch and undergo a rapid period of growth to reach adulthood in the summer and then spawn themselves. Veligers that hatch in late summer reach adulthood in the autumn and overwinter before spawning in the spring.
L. retroversa adults in autumn (LR2) and winter (LR3) were larger (mean spire height: 2.19 - 2.42 mm) in comparison to the spring (LR4) and summer (LR1) cohorts (mean spire height: 1.15 - 1.19 mm). This growth strategy was also observed in L. retroversa of the Argentine Sea, where the mean spire height of wintertime cohorts measured 1.99 - 3.20 mm while the summer mean spire heights measured 1.25 - 1.80 mm (Dadon and de Cidre, 1992). In many gastropods, fecundity is directly related to gonad volume, which increases with shell size (Ghiselin, 1969; Dillon, 2000). Therefore, investing in shell growth and delaying spawning until conditions are favourable for early life stages increases reproductive output and veliger survival rate (Lalli and Wells, 1978; Lalli and Gilmer, 1989).
The greatest rate of shell growth in L. retroversa (LR4: 0.024 mm d-1) occurred during the spring when juveniles, fueled by the parallel phytoplankton bloom, reached maturity. This same cohort spawned during the summer, when food supply remained sufficient to support another generation of veligers (LR1). Dadon and de Cidre (1992) also observed that growth rates were highest during springtime in the Argentine Sea, although, growth rates were lower than in the Scotia Sea, at 0.008 - 0.012 mm d-1 (Dadon and de Cidre, 1992). However, the autumn to winter L. retroversa growth rates in the Scotia Sea were similar (LR3: 0.010 mm d-1) to those in the Argentine Sea (0.009 - 0.015 mm d-1). Higher growth rates in the Scotia Sea are likely due to the abundant food supplied by the phytoplankton bloom north of South Georgia being more prolonged and stable between spring and autumn in comparison to the small, discrete blooms of the Argentine Sea (Dadon, 1990; Dadon and de Cidre, 1992; Lutz et al., 2009) (Figure 7; Supplementary Material 8). The longer productive season in the Scotia Sea means spawning and veliger growth of L. retroversa occur between November and March, supporting a four-generation per year life cycle. In comparison, L. retroversa in the Argentine Sea have discrete spawning events in February and September, in parallel to discrete phytoplankton bloom events, supporting a two-generation a year life cycle (Dadon, 1990; Dadon and de Cidre, 1992). During the winter, L. retroversa in both the Scotia Sea and Argentine Sea continue to grow, but at much lower rates than in the rest of the year due to reduced and poorer quality food supplies and/or reliance on lipid reserves (Dadon and de Cidre, 1992; Lischka and Riebesell, 2012; Lischka and Riebesell, 2016)
At the end of each growth period, adult individuals ‘disappeared’ from the sediment trap. This ‘disappearance’ was also observed in samples from the Argentine Sea, which Dadon and de Cidre (1992) concluded was due to a die-off based upon observations of L. retroversa retroversa in the Arctic. However, in the Scotia Sea there is no evidence for adult L. retroversa dying-off as no passive sinking or predated adults were found in any month except May. Therefore, it is most probable that adult L. retroversa, like many other Limacina species worldwide (Van der Spoel and Heyman, 2013; Almogi-Labin et al., 1988), undergo an ontogenic migration to deeper water after spawning. Based on the cohort identification, it took between one (LR4) and seven (LR3) months for L. retroversa australis to transition from the small juvenile stage to adult stage. However, since there was no clear die-off of adults, it is unclear what their longevity was. Dadon and de Cidre (1992) concluded that L. retroversa in the Argentine Sea lived for a year, while in the northern hemisphere, L. retroversa retroversa has a longevity of between 0.5 years (Thabet et al., 2015) and 1 year (Lebour, 1932; Hsiao, 1939), which is similar to longevity estimates in the current study.
4.5 The implications of contrasting life cycle strategies in a changing Southern Ocean
Thecosome pteropods are functionally important components in the Scotia Sea ecosystem, being central to food webs, organic carbon fluxes and calcium carbonate exports (Collier et al., 2000; Hunt et al., 2008; Manno et al., 2018). However, warming and ocean acidification are environmental perturbations affecting this region that are potentially deleterious to their viability. Limacina populations in the northern Scotia Sea (e.g. at P3) are especially sensitive to climatic changes since L. rangii are at the northern limit of their polar distribution, and L. retroversa are at the southern limit of their boreal distribution (Hunt et al., 2008). The capacity of pteropods to maintain a viable population in the Southern Ocean depends on their capability to recruit successfully. Shallow undersaturation with respect to aragonite in the Scotia Sea is expected to occur episodically from 2030 onwards, first during the winter before becoming more prolonged and intense with time (McNeil and Matear, 2008; Hauri et al., 2016; Landschützer et al., 2018). If exposed to undersaturation events, thecosome pteropod populations in the Scotia Sea may experience higher mortality, shell dissolution and more energetic demands to maintain their shell (Manno et al., 2017; Peck et al., 2018). Pteropods that overwinter are most vulnerable to undersaturation, since undersaturation with respect to aragonite is expected to commence in the winter months before extending to other seasons (McNeil and Matear, 2008; Hauri et al., 2016; Landschützer et al., 2018). We have shown that L. retroversa and L. rangii at P3 overwinter as juveniles and adults, meaning that these life stages are most likely to be the first to be exposed to undersaturated conditions. These later life stages are potentially more capable of tolerating exposure to undersaturated waters than early developmental stages. Their higher tolerance is not just due to their established life stage, but also the likelihood that during the winter months they tend to dwell deeper in the water column, likely below the shallow saturation horizon. Overwintering pteropods appear to enter a diapause stage during the food scarcity of the winter months, where their metabolism and calcification rates drop allowing them to focus energy on egg production in the spring (Ghiselin, 1969; Dillon, 2000). This ‘hibernation’ strategy likely reduces their exposure to environmental perturbations in the surface waters, however as the intensity and duration of these stressors increase in the future of these factors will likely begin to impact Limacina. Laboratory incubations suggest that veligers of L. rangii are susceptible to shell malformation, dissolution, and high mortality when exposed to increased temperature and aragonite undersaturation (Comeau et al., 2010; Thabet et al., 2015; Gardner et al., 2018). When, as predicted, the duration of winter undersaturation events begin to overlap with the onset of the South Georgia bloom and spawning time of Limacina, vulnerable veligers restricted to surface waters will become exposed.
This study shows the population of L. rangii at P3 comprises several overlapping cohorts with a life cycle of over a year. Therefore, since all life stages of L. rangii co-exist, vulnerability of one cohort is not detrimental to the stability of the overall population. Conversely, there is no overlap in juvenile and adult stages in the life cycle of L. retroversa meaning that, if one cohort is removed, the entire population may be vulnerable. If deleterious conditions impacted a cohort of L. retroversa prior to sexual maturity, a population bottleneck or local extinction may result. Therefore, based on the assumption of a static population which is not advected into or out of the sampling area, L. retroversa populations are more likely to be impacted than L. rangii on exposure to episodes of undersaturation. Regardless of cohort structure, repeated or prolonged exposure to unfavourable conditions is likely to impact all cohorts across both species if rates of spawning and survival to sexual maturity decline. Such a progressive population decline was observed in the Ross Sea, where long-term food shortages due to reduced primary productivity eventually led to the short-term localized extinction of L. rangii (Seibel and Dierssen, 2003; Maas et al., 2011).
In conclusion, we indicate contrasting life history strategies of the dominant Southern Ocean pteropod species, L. rangii and L. retroversa (Figure 8), suggesting that L. retroversa populations in the Scotia Sea may be particularly vulnerable to exposure to deleterious conditions. Declines in pteropod populations in the Southern Ocean will have cascading implications on regional biogeochemical cycling and epipelagic food webs.
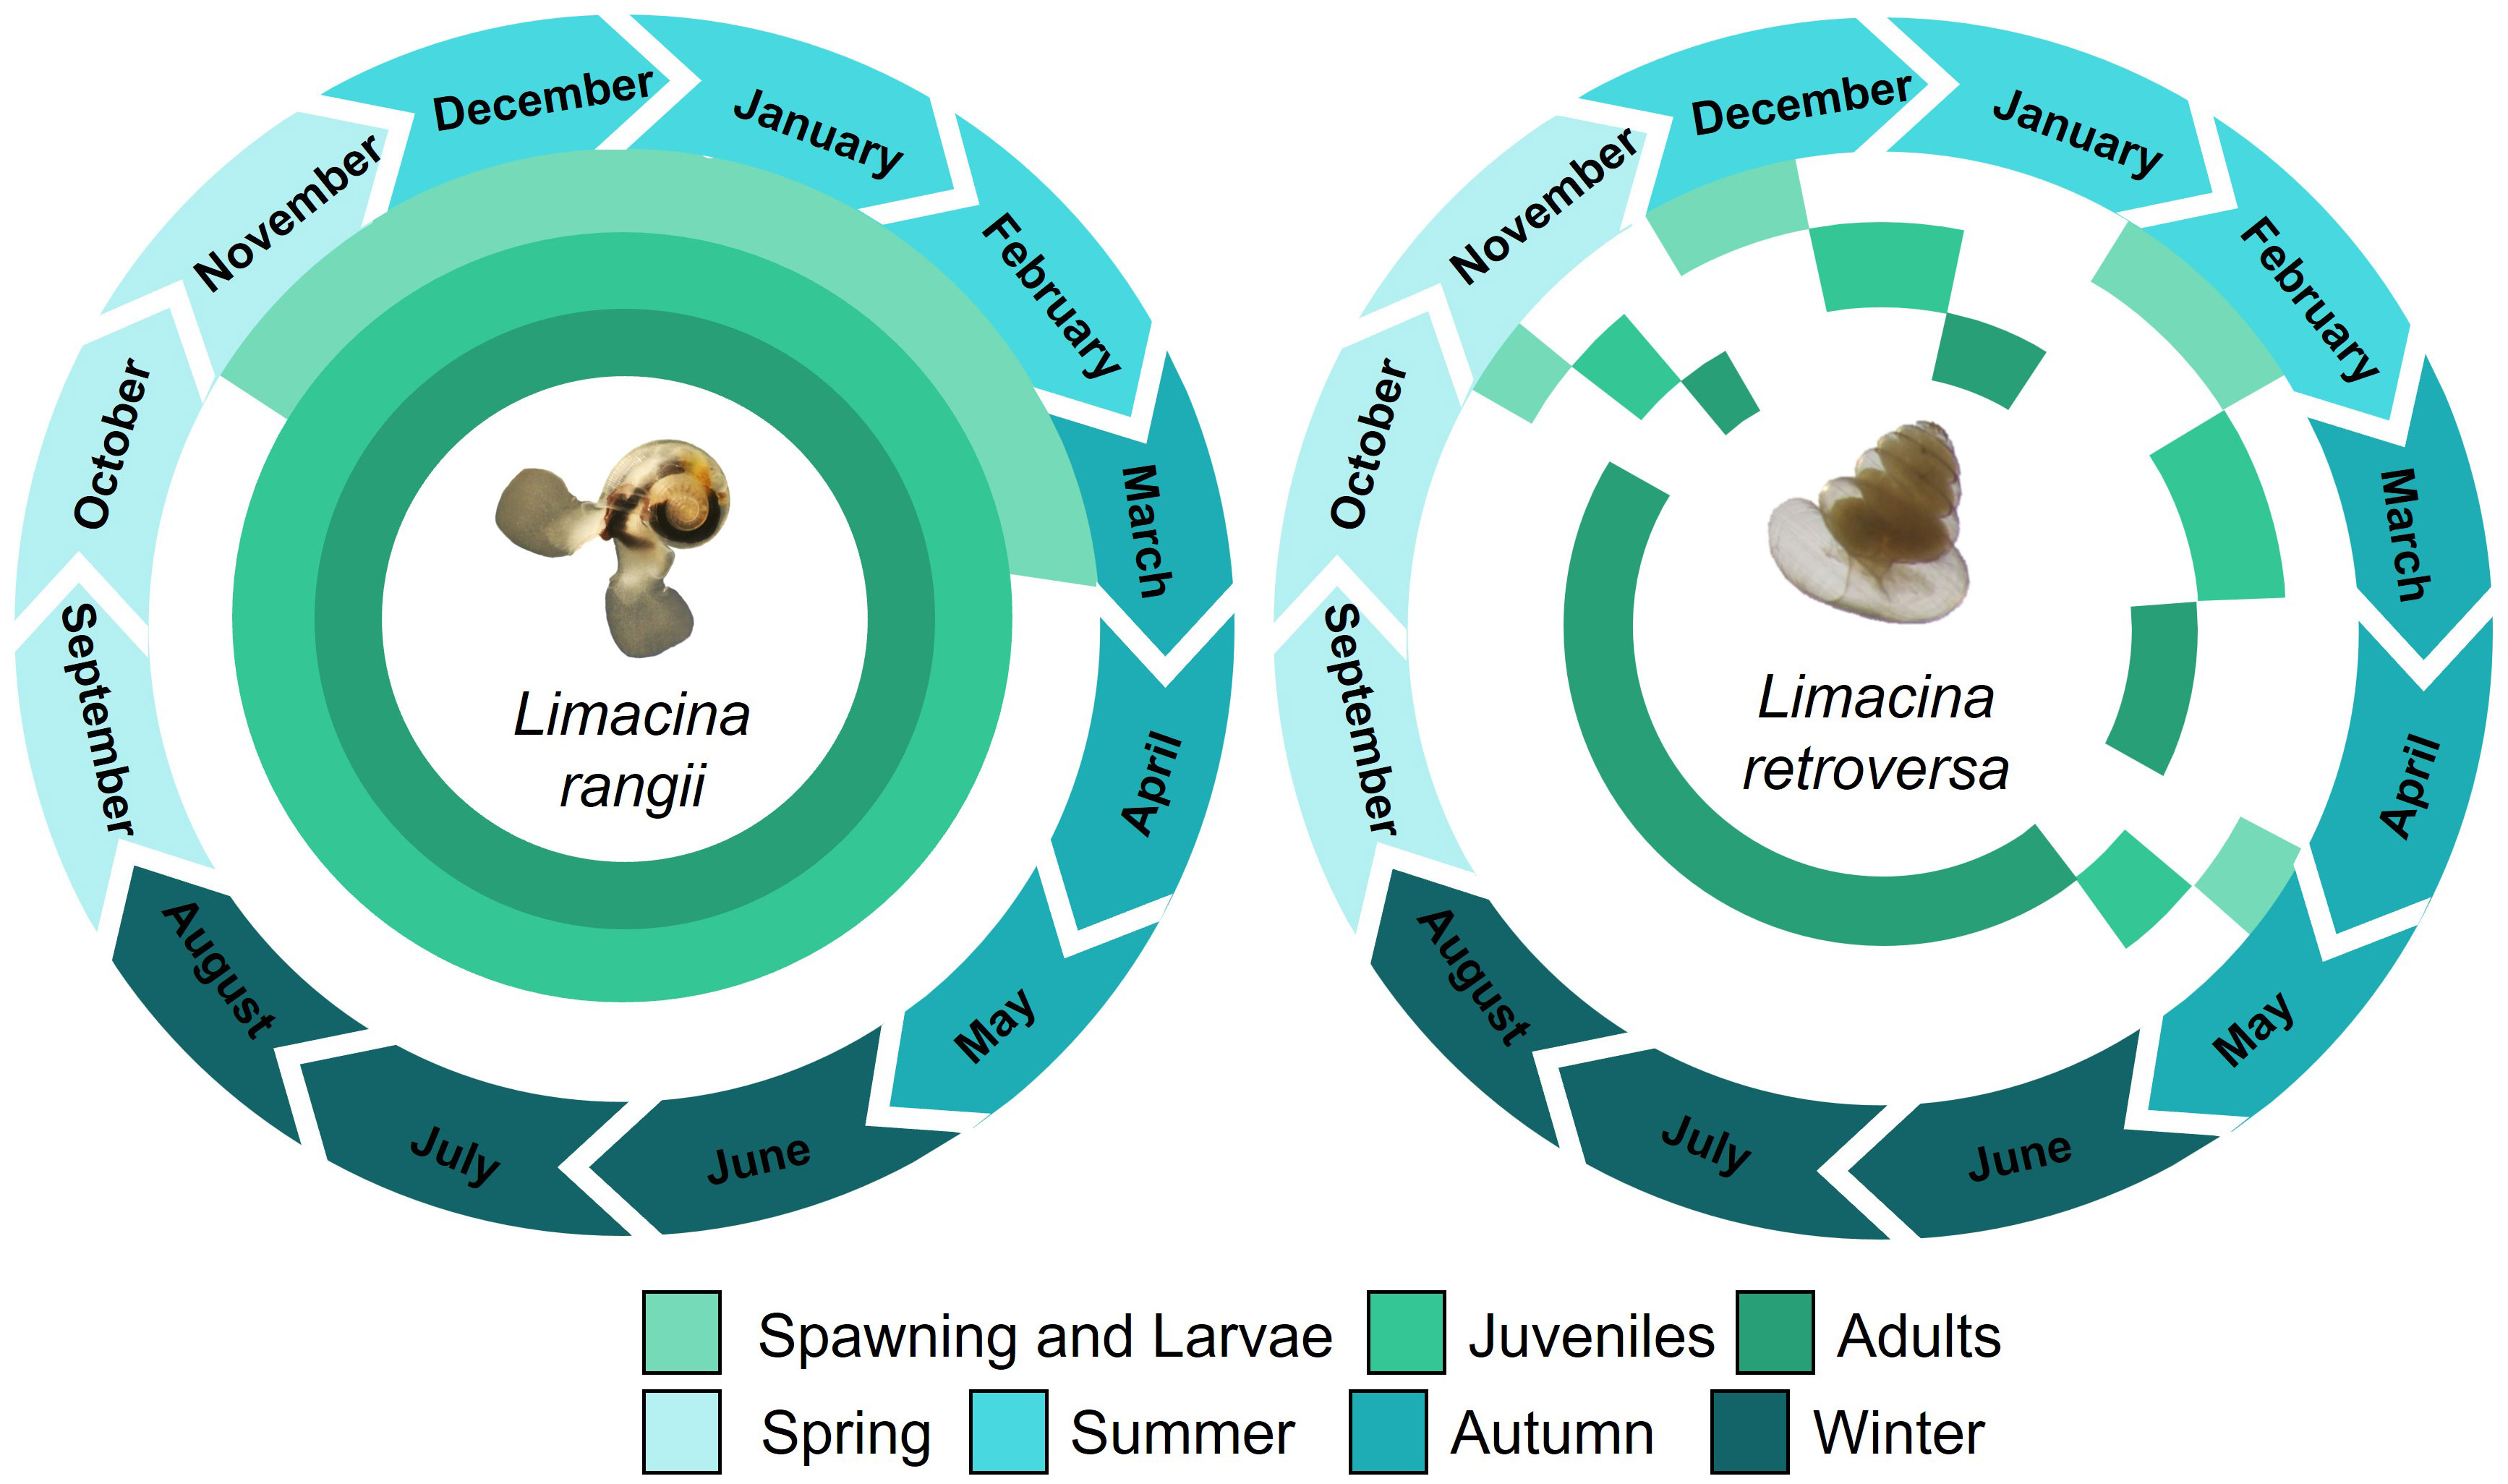
Figure 8 A conceptual schematic illustrating the seasonal and monthly presence of veliger, juvenile and adult Limacina rangii and Limacina retroversa, as well as their spawning period. The schematic is based on shell morphometrics of individuals collected in a sediment trap deployed at P3 (Scotia Sea, Southern Ocean) at 400 m depth between December 2014 and November 2015.
Data availability statement
The datasets analyzed for this study can be found in the Supplementary Material and in the UK Polar Data Centre.
Author contributions
JG, CM, VP and GT carried out the fieldwork and sample collection with support from other scientists on board cruise JR304 and JR15002. JG carried out the sample and statistical analysis with support from CM and GT. JG wrote the manuscript with support from CM, GT, VP and DB. All authors contributed to the article and approved the submitted version.
Funding
This work was funded by a NERC studentship granted through the EnvEast Doctoral Training Partnership (Grant No. NE/L002582/1) at the University of East Anglia. This work was carried out as part of the Ecosystems programme at the British Antarctic Survey and the Scotia Sea Open Ocean Laboratories (SCOOBIES) sustained observation programme during the Western Core Box survey cruises on board the RRS James Clark Ross.
Acknowledgments
We would like to acknowledge the captain, officers, crew, and scientists aboard the RRS James Clark Ross during cruises JR304 and JR15002 for their support in all the logistical operations on board. We also thank Peter Enderlein, Scott Polfrey, Sophie Fielding and Gabriele Stowasser for their support during deployment and recovery of the sediment trap mooring.
Conflict of interest
The authors declare that the research was conducted in the absence of any commercial or financial relationships that could be construed as a potential conflict of interest.
Publisher’s note
All claims expressed in this article are solely those of the authors and do not necessarily represent those of their affiliated organizations, or those of the publisher, the editors and the reviewers. Any product that may be evaluated in this article, or claim that may be made by its manufacturer, is not guaranteed or endorsed by the publisher.
Supplementary material
The Supplementary Material for this article can be found online at: https://www.frontiersin.org/articles/10.3389/fmars.2023.1118570/full#supplementary-material
References
Accornero A., Manno C., Esposito F. G. M. C., Gambi M. C. (2003). The vertical flux of particulate matter in the polynya of Terra Nova bay. part II. Biol. components. Antarctic Sci. 15 (2), 175–188. doi: 10.1017/S0954102003001214
Adhikari D., Webster D. R., Yen J. (2016). Portable tomographic PIV measurements of swimming shelled Antarctic pteropods. Experiments Fluids 57 (12), 180–189. doi: 10.1007/s00348-016-2269-7
Akiha F., Hashida G., Makabe R., Hattorid H., Sasaki H. (2017). Distribution in the abundance and biomass of shelled pteropods in surface waters of the Indian sector of the Antarctic ocean in mid-summer. Polar Sci. 12, 12–18. doi: 10.1016/j.polar.2017.02.003
Almogi-Labin A., Hemleben C., Deuser W. G. (1988). Seasonal variation in the flux of euthecosomatous pteropods collected in a deep sediment trap in the Sargasso Sea. Deep Sea Res. Part A. Oceanographic Res. Papers 35 (3), 441–464. doi: 10.1016/0198-0149(88)90020-9
Atkinson A., Ward P., Hunt B. P. V., Pakhomov E. A., Hosie G. W. (2012). An overview of southern ocean zooplankton data: abundance, biomass, feeding and functional relationships. CCAMLR Sci. 19, 171–218.
Baker E. T., Milburn H. B., Tennant D. A. (1988). Field assessment of sediment trap efficiency under varying flow conditions. J. Mar. Res. 46 (3), 573–592.
Bednaršek N., Harvey C. J., Kaplan I. C., Feely R. A., Moz J. (2016). Pteropods on the edge: Cumulative effects of ocean acidification, warming and deoxygenation. Prog. Oceanogr. 145, 1–24. doi: 10.1016/j.pocean.2016.04.002
Bednaršek N., Klinger T., Harvey C. J., Weisberg S., McCabe R. M., Feely R. A., et al. (2017). New ocean, new needs: Application of pteropod shell dissolution as a biological indicator for marine resource management. Ecol. Indic. 76, 240–244. doi: 10.1016/j.ecolind.2017.01.025
Bednaršek N., Mozina J., Vuckovic M., Vogt M., O'Brien C., Tarling G. A. (2012c). Global distribution of pteropods representing carbonate functional type biomass. Earth System Sci. Data Discussions 5, 317–350.
Bednaršek N., Tarling G. A., Bakker D. C. E., Fielding S., Cohen A., Kuzirian A., et al. (2012a). Description and quantification of pteropod shell dissolution: A sensitive bioindicator of ocean acidification. Global Change Biol. 18 (7), 2378–2388. doi: 10.1111/j.1365-2486.2012.02668.x
Bednaršek N., Tarling G. A., Bakker D. C. E., Fielding S., Jones E. M., Venables H. J., et al. (2012b). Extensive dissolution of live pteropods in the southern ocean. Nat. Geosci. 5 (12), 881–885. doi: 10.1038/NGEO1635
Bernard K. S., Froneman P. W. (2009). The sub-Antarctic euthecosome pteropod, limacina retroversa: Distribution patterns and trophic role. Deep Sea Res. Part I: Oceanographic Res. Papers 56 (4), 582–598. doi: 10.1016/j.dsr.2008.11.007
Borrione I., Schlitzer R. (2013). Distribution and recurrence of phytoplankton blooms around south Georgia, southern ocean. Biogeosciences 10 (1), 217–231. doi: 10.5194/bg-10-217-2013
Burridge A. K., Hörnlein C., Janssen A. W., Hughes M., Bush S. L., Marlétaz F., et al. (2017). Time-calibrated molecular phylogeny of pteropods. PloS One 12 (6), e0177325. doi: 10.1371/journal.pone.0177325
Cermeño P., Teixeira I. G., Branco M., Figueiras F. G., Marañón E. (2014). Sampling the limits of species richness in marine phytoplankton communities. J. Plankton Res. 36 (4), 1135–1139. doi: 10.1093/plankt/fbu033
Chen C., Bé A. W. (1964). Seasonal distributions of euthecosomatous pteropods in the surface waters of five stations in the Western north Atlantic. Bull. Mar. Sci. 14 (2), 185–220.
Chiarini F., Capotondi L., Dunbar R. B., Giglio F., Mammì I., Mucciarone D. A., et al. (2013). A revised sediment trap splitting procedure for samples collected in the Antarctic sea. Methods Oceanography 8, 13–22. doi: 10.1016/j.mio.2014.05.003
Collier R., Dymond J., Honjo S., Manganini S., Francois R., Dunbar R. (2000). The vertical flux of biogenic and lithogenic material in the Ross Sea: moored sediment trap observations 1996–1998. Deep Sea Res. Part II: Topical Stud. Oceanography 47 (15), 3491–3520. doi: 10.1016/S0967-0645(00)00076-X
Comeau S., Jeffree R., Teyssié J. L., Gattuso J. P. (2010). Response of the Arctic pteropod Limacina helicina to projected future environmental conditions. PloS One 5 (6), e11362. doi: 10.1371/journal.pone.0011362
Dadon J. R. (1990). Annual cycle of Limacina retroversa in Patagonian waters. Am. Malacological Bull. 8 (1), 77–84. doi: 10.1007/BF00350035
Dadon J. R., de Cidre L. L. (1992). The reproductive cycle of the thecosomatous pteropod limacina retroversa in the western south Atlantic. Mar. Biol. 114 (3), 439–442. doi: 10.1007/BF00350035
Fabry V. J. (1990). Shell growth rates of pteropod and heteropod molluscs and aragonite production in the open ocean: implications for the marine carbonate system. J. Mar. Res. 48 (1), 209–222. doi: 10.1357/002224090784984614
Flores H., van Franeker J. A., Cisewski B., Leach H., Van de Putte A. P., Meesters E. H., et al. (2011). Macrofauna under sea ice and in the open surface layer of the lazarev Sea, southern ocean. Deep Sea Res. Part II: Topical Stud. Oceanography 58 (19-20), 1948–1961. doi: 10.1016/j.dsr2.2011.01.010
Gannefors C., Böer M., Kattner G., Graeve M., Eiane K., Gulliksen B., et al. (2005). The Arctic sea butterfly Limacina helicina: lipids and life strategy. Mar. Biol. 147 (1), 169–177. doi: 10.1007/s00227-004-1544-y
Gardner J., Manno C., Bakker D. C., Peck V. L., Tarling G. A. (2018). Southern ocean pteropods at risk from ocean warming and acidification. Mar. Biol. 165 (1), 8–18. doi: 10.1007/s00227-017-3261-3
Gerhardt S., Groth H., Rühlemann C., Henrich R. (2000). Aragonite preservation in late quaternary sediment cores on the Brazilian continental slope: implications for intermediate water circulation. Int. J. Earth Sci. 88 (4), 607–618. doi: 10.1007/s005310050291
Ghiselin M. T. (1969). The evolution of hermaphroditism among animals. Q. Rev. Biol. 44, 189–208. doi: 10.1086/406066
Gilmer R. W., Harbison G. R. (1986). Morphology and field behaviour of pteropod molluscs: feeding methods in the families cavoliniidae, limacinidae and peraclididae (Gastropoda: Thecosomata). Mar. Biol. 91 (1), 47–57. doi: 10.1007/BF00397570
Goto N., Hisamatsu K., Yoshimizu C., Ban S. (2016). Effectiveness of preservatives and poisons on sediment trap material in freshwater environments. Limnology 17 (1), 87–94. doi: 10.1007/s10201-015-0467-2
Harbison G. R., Gilmer R. W. (1986). Effects of animal behavior on sediment trap collections: implications for the calculation of aragonite fluxes. Deep Sea Res. Part A. Oceanographic Res. Papers 33 (8), 1017–1024. doi: 10.1016/0198-0149(86)90027-0
Hauri C., Friedrich T., Timmermann A. (2016). Abrupt onset and prolongation of aragonite undersaturation events in the southern ocean. Nat. Climate Change. 6, 172–176. doi: 10.1038/nclimate2844
Henson S. A., Beaulieu C., Ilyina T., John J. G., Long M., Séférian R., et al. (2017). Rapid emergence of climate change in environmental drivers of marine ecosystems. Nat. Commun. 8, 14682. doi: 10.1038/ncomms14682
Hopkins T. L., Torres J. J. (1989). Midwater food web in the vicinity of a marginal ice zone in the western weddell Sea. Deep Sea Res. Part A. Oceanographic Res. Papers 36 (4), 543–560. doi: 10.1016/0198-0149(89)90005-8
Howard W. R., Roberts D., Moy A. D., Lindsay M. C. M., Hopcroft R. R., Trull T. W., et al. (2011). Distribution, abundance and seasonal flux of pteropods in the Sub-Antarctic zone. Deep Sea Res. Part II: Topical Stud. Oceanography 58 (21-22), 2293–2300. doi: 10.1016/j.dsr2.2011.05.031
Howes E. L., Bednaršek N., Büdenbender J., Comeau S., Doubleday A., Gallager S. M., et al. (2014). Sink and swim: a status review of thecosome pteropod culture techniques. J. Plankton Res. 36 (2), 299–315. doi: 10.1093/plankt/fbu002
Hsiao S. C. (1939). The reproductive system and spermatogenesis of Limacina (Spiratella) retroversa (Flem.). Biol. Bull. 76 (1), 7–25. doi: 10.2307/1537632
Hunt B. P. V., Pakhomov E. A., Hosie G. W., Siegel V., Ward P., Bernard K. (2008). Pteropods in southern ocean ecosystems. Prog. Oceanography 78 (3), 193–221. doi: 10.1016/j.pocean.2008.06.001
Hunt B., Strugnell J., Bednaršek N., Linse K., Nelson R. J., Pakhomov E., et al. (2010). Poles apart: the “bipolar” pteropod species Limacina helicina is genetically distinct between the Arctic and Antarctic oceans. PloS One 5 (3), e9835. doi: 10.1371/journal.pone.0009835
Jennings R. M., Bucklin A., Ossenbrügger H., Hopcroft R. R. (2010). Species diversity of planktonic gastropods (Pteropoda and heteropoda) from six ocean regions based on DNA barcode analysis. Deep Sea Res. Part II: Topical Stud. Oceanogr. 57 (24), 2199–2210. doi: 10.1016/j.dsr2.2010.09.022
Kobayashi H. A. (1974). Growth cycle and related vertical distribution of the thecosomatous pteropod Spiratella (“Limacina”) helicina in the central Arctic ocean. Mar. Biol. 26 (4), 295–301. doi: 10.1007/BF00391513
Korb R. E., Whitehouse M. (2004). Contrasting primary production regimes around south Georgia, southern ocean: large blooms versus high nutrient, low chlorophyll waters. Deep Sea Res. Part I: Oceanographic Res. Papers 51 (5), 721–738. doi: 10.1016/j.dsr.2004.02.006
Korb R. E., Whitehouse M. J., Thorpe S. E., Gordon M. (2005). Primary production across the Scotia Sea in relation to the physico-chemical environment. J. Mar. Syst. 57 (3), 231–249. doi: 10.1016/j.jmarsys.2005.04.009
Lalli C. M., Gilmer R. W. (1989). Pelagic snails: the biology of holoplanktonic gastropod mollusks. (California: Stanford University Press).
Lalli C. M., Wells F. E. (1978). Reproduction in the genus Limacina (Opisthobranchia: Thecosomata). J. Zoology 186, 95–108. doi: 10.1111/j.1469-7998.1978.tb03359.x
Landschützer P., Gruber N., Bakker D. C., Stemmler I., Six K. D. (2018). Strengthening seasonal marine CO2 variations due to increasing atmospheric CO2. Nat. Climate Change 8, 146–150. doi: 10.1038/s41558-017-0057-x
Lebour M. V. (1932). Limacina retroversa in Plymouth waters. J. Mar. Biol. Assoc. United Kingdom 18 (1), 123–126. doi: 10.1017/S0025315400051341
Lischka S., Riebesell U. (2012). Synergistic effects of ocean acidification and warming on overwintering pteropods in the Arctic. Global Change Biol. 18 (12), 3517–3528. doi: 10.1111/gcb.12020
Lischka S., Riebesell U. (2016). Metabolic response of Arctic pteropods to ocean acidification and warming during the polar night/twilight phase in kongsfjord (Spitsbergen). Polar Biol. 40 (6), 1211–1227. doi: 10.1007/s00300-016-2044-5
Liszka C. M., Manno C., Stowasser G., Robinson C., Tarling G. A. (2019). Mesozooplankton community composition controls fecal pellet flux and remineralization depth in the southern ocean. Front. Mar. Sci. 6, 230. doi: 10.3389/fmars.2019.00230
Lutz V. A., Segura V., Dogliotti A. I., Gagliardini D. A., Bianchi A. A., Balestrini C. F. (2009). Primary production in the Argentine Sea during spring estimated by field and satellite models. J. Plankton Res. 32 (2), 181–195. doi: 10.1093/plankt/fbp117
Maas A. E., Elder L. E., Dierssen H. M., Seibel B. A. (2011). Metabolic response of Antarctic pteropods (Mollusca: Gastropoda) to food deprivation and regional productivity. Mar. Ecol. Prog. Ser. 441, 129–139. doi: 10.3354/meps09358
Macdonald P., Juan D. (2012) Mixdist: Finite mixture distribution models. Available at: https://CRAN.R-project.org/package=mixdist (Accessed 03/05/16).
Makabe R., Hattori H., Sampei M., Darnis G., Fortier L., Sasaki H. (2016). Can sediment trap-collected zooplankton be used for ecological studies? Polar Biol. 39 (12), 2335–2346. doi: :10.1007/s00300-016-1900-7
Manno C., Bednaršek N., Tarling G., Peck V., Comeau S., Adhikari D., et al. (2017). Shelled pteropods in peril: Assessing vulnerability in a high CO2 ocean. Earth-Science Rev. 169, 132–145. doi: 10.1016/j.earscirev.2017.04.005
Manno C., Giglio F., Stowasser G., Fielding S., Enderlein P., Tarling G. A. (2018). Threatened species drive the strength of the carbonate pump in the northern Scotia Sea. Nat. Commun. 9 (1), 1–7. doi: 10.1038/s41467-018-07088-y
McGowan John A., Fraundorf Vernie J. (1966). The relationship between size of net used and estimates of zooplankton diversity. Limnology Oceanography 11 (4), 456–469. doi: 10.4319/lo.1966.11.4.0456
McNeil B. I., Matear R. J. (2008). Southern ocean acidification: a tipping point at 450 ppm atmospheric CO2. Proc. Natl. Acad. Sci. United States America 105 (48), 18860–18864. doi: 10.1073/pnas.0806318105
Meyer B., Freier U., Grimm V., Groeneveld J., Hunt B. P., Kerwath S., et al. (2017). The winter pack-ice zone provides a sheltered but food-poor habitat for larval Antarctic krill. Nat. Ecol. Evol. 1 (12), 1853–1861. doi: 10.1038/s41559-017-0368-3
MSIP (2017) Marine species identification portal. Available at: http://species-identification.org/index.php (Accessed 08/07/2017).
Oakes R. L., Peck V. L., Manno C., Bralower T. J. (2019). Degradation of internal organic matter is the main control on pteropod shell dissolution after death. Global Biogeochemical Cycles 33 (6), 749–760. doi: 10.1029/2019GB006223
Orsi A. H., Whitworth T. III, Nowlin W. D Jr. (1995). On the meridional extent and fronts of the Antarctic Circumpolar Current. Deep Sea Res. Part I: Oceanograph. Res. Papers 42 (5), 641–673. doi: 10.1016/0967-0637(95)00021-W
Peck V. L., Oakes R. L., Harper E. M., Manno C., Tarling G. A. (2018). Pteropods counter mechanical damage and dissolution through extensive shell repair. Nat. Commun. 9 (1), 264.
Roberts D., Howard W. R., Moy A. D., Roberts J. L., Trull T. W., Bray S. G., et al. (2011). Inter-annual pteropod variability in sediment traps deployed above and below the aragonite saturation horizon in the Sub-Antarctic southern ocean. Polar Biol. 34 (11), 1739–1750. doi: 10.1007/s00300-011-1024-z
Schindelin J., Arganda-Carreras I., Frise E., Kaynig V., Longair M., Pietzsch T., et al. (2012). Fiji: An open-source platform for biological-image analysis. Nat. Methods 9 (7), 676–682. doi: 10.1038/nmeth.2019
Seibel B. A., Dierssen H. M. (2003). Cascading trophic impacts of reduced biomass in the Ross Sea, Antarctica: Just the tip of the iceberg? Biol. Bull. 205 (2), 93–97. doi: 10.2307/1543229
Seibel B. A., Maas A. E., Dierssen H. M. (2012). Energetic plasticity underlies a variable response to ocean acidification in the pteropod, Limacina helicina antarctica. PloS One 7 (4), e30464. doi: 10.1371/journal.pone.0030464
Thabet A. A., Maas A. E., Lawson G. L., Tarrant A. M. (2015). Life cycle and early development of the thecosomatous pteropod Limacina retroversa in the gulf of Maine, including the effect of elevated CO2 levels. Mar. Biol. 162 (11), 2235–2249. doi: 10.1007/s00227-015-2754-1
Thibodeau P. S., Steinberg D. K., McBride C. E., Conroy J. A., Keul N., Ducklow H. W. (2020). Long-term observations of pteropod phenology along the Western Antarctic peninsula. Deep Sea Res. Part I: Oceanographic Res. Papers 166, 103363. doi: 10.1016/j.dsr.2020.103363
Thorpe S. E., Heywood K. J., Brandon M. A, Stevens D. P. (2002). Variability of the southern Antarctic Circumpolar Current front north of South Georgia. J. Mar. Syst. 37 (1-3), 87–105. doi: 10.1016/S0924-7963(02)00197-5
Turner J. T. (2015). Zooplankton fecal pellets, marine snow, phytodetritus and the ocean’s biological pump. Prog. Oceanography 130, 205–248. doi: 10.1016/j.pocean.2014.08.005
Van der Spoel S. (1967). Euthecosomata: A group with remarkable developmental Stages. (Gastropoda, pteropoda). Ed. Noorduijn J. PhD thesis. University of Amsterdam.
Van der Spoel S. (1976). Finer sculptures in euthecosomatous shells, and their value for taxonomy (Mollusca, pteropoda). Beaufortia 24 (314), 105–121.
Van der Spoel, Dadon S. (1999). “Pteropoda,” in South Atlantic zooplankton. Ed. Boltovskoy D. (Leiden: Backhuys Publishers, Leiden), 649–706.
Van der Spoel S., Heyman R. P. (2013). A comparative atlas of zooplankton: biological patterns in the oceans. (Berlin: Springer Science & Business Media), 161p.
Van der Spoel S., Schalk P. H., Bleeker J. (1992). Clio piatkowskii, a mesopelagic pteropod new to science (Gastropoda, opisthobranchia). Beaufortia 43 (1), 1–6.
Wang K., Hunt B. P., Liang C., Pauly D., Pakhomov E. A. (2017). Reassessment of the life cycle of the pteropod limacina helicina from a high resolution interannual time series in the temperate north pacific. ICES J. Mar. Sci. 74 (7), 1906–1902. doi: 10.1093/icesjms/fsx014
Ward P., Grant S., Brandon M., Siegel V., Sushin V., Loeb V., et al. (2004). Mesozooplankton community structure in the Scotia Sea during the CCAMLR 2000 survey: January–February 2000. Deep Sea Res. Part II: Topical Stud. Oceanography 51 (12-13), 1351–1367. doi: 10.1016/j.dsr2.2004.06.016
Ward P., Meredith M. P., Whitehouse M. J., Rothery P. (2008). The summertime plankton community at south Georgia (Southern ocean): Comparing the historica /1927) and modern (post 1995) records. Prog. Oceanography 78 (3), 241–256. doi: 10.1016/j.pocean.2008.05.003
Weldrick C. K., Makabe R., Mizobata K., Moteki M., Odate T., Takao S., et al. (2021). The use of swimmers from sediment traps to measure summer community structure of southern ocean pteropods. Polar Biol. 44 (3), 457–472. doi: 10.1007/s00300-021-02809-4
Keywords: pteropod life history, sediment trap, Scotia Sea, Limacina helicina antarctica, marine ecology, Antarctic, population dynamics, zooplankton
Citation: Gardner J, Peck VL, Bakker DCE, Tarling GA and Manno C (2023) Contrasting life cycles of Southern Ocean pteropods alter their vulnerability to climate change. Front. Mar. Sci. 10:1118570. doi: 10.3389/fmars.2023.1118570
Received: 07 December 2022; Accepted: 28 March 2023;
Published: 11 May 2023.
Edited by:
Kieng Soon Hii, University of Malaya, MalaysiaReviewed by:
Teruaki Yoshida, University Malaysia Sabah, MalaysiaFatimah Atirah Mohamad, Universiti Malaysia Sarawak, Malaysia
Copyright © 2023 Gardner, Peck, Bakker, Tarling and Manno. This is an open-access article distributed under the terms of the Creative Commons Attribution License (CC BY). The use, distribution or reproduction in other forums is permitted, provided the original author(s) and the copyright owner(s) are credited and that the original publication in this journal is cited, in accordance with accepted academic practice. No use, distribution or reproduction is permitted which does not comply with these terms.
*Correspondence: Clara Manno, clanno@bas.ac.uk