Monitoring and assessing the species diversity and abundance of marine teleost around the Yellow River estuary in June using environmental DNA
 Ding Lyu
 Tangyi Qian
 Fan Li3
  Song Sun
 Weiji Wang
 Xiujuan Shan
- 1Key Laboratory of Sustainable Development of Marine Fisheries, Ministry of Agriculture and Rural Affairs, Yellow Sea Fisheries Research Institute, Chinese Academy of Fishery Science, Qingdao, China
- 2Laboratory for Marine Fisheries Science and Food Production Processes, Pilot National Laboratory for Marine Science and Technology (Qingdao), Qingdao, China
- 3Shandong Marine Resources and Environment Research Institute, Shandong Provincial Key Laboratory of Restoration for Marine Ecology, Yantai, China
The Yellow River estuary is an important feeding, reproduction, and development ground for a variety of marine economic species, and understanding the changes in species composition and abundance around the Yellow River estuary is of great significance. In this study, a trawl survey and seawater eDNA survey were carried out simultaneously around the Yellow River estuary with the objective of both understanding the composition of marine teleost around the Yellow River estuary and providing a reference for the application of eDNA in fishery resources surveys. The results showed that 31 species of marine teleost in total were detected using the trawl survey, and 33 species were detected using eDNA technology. The number of species detected by both methods was 21. In these 21 species, the Pearson’s correlation coefficients between their eDNA relative abundance and catch per unit effort (CPUE) were very high (0.993 for weight and 0.993 for quantity), while the Spearman’s correlation coefficients were 0.659 and 0.595, respectively. There were significant positive correlations between the biomass of specific species and their eDNA relative abundance. Species composition difference analysis based on eDNA showed that the species compositions of two low-salinity and low-water-depth survey stations were distinctly different from the others. This study not only scientifically monitors and evaluates the species diversity and abundance of teleost around the Yellow River estuary but also provides a reference for the application of eDNA in fishery resources surveys.
1 Introduction
The Yellow River is the second largest river in China. Its runoff input brings rich nutrients to the estuary and the surrounding sea areas and provides a sufficient material basis for the prosperity of various phytoplankton and food organisms. Therefore, the Yellow River estuary has become an important place for the feeding, reproduction, and development of a variety of marine economic species, and its neighboring Laizhou Bay is an important fishing ground in the Bohai Sea. In recent years, with the influence of climate change, environmental pollution, and overfishing, the fishery resources in the Bohai Sea have declined continuously. The species with low economic value, such as Setipinna taty and Engraulis japonicus, have gradually replaced those with high economic value, such as Trichiurus haumela and Cynoglossus semilaevis, as the dominant species (Jin and Dong, 2000; Shan et al., 2012; Zhai et al., 2015). Understanding the species composition and abundance changes of teleost in the Yellow River estuary and its adjacent waters is of great significance in evaluating the impact of human activities and carrying out the restoration of fishery resources and ecological protection.
At present, the main means of fishery resources investigation in China are still based on bottom trawling (Li et al., 2012; Shan et al., 2012). The advantages of the trawl survey include the direct acquisition of samples and the intuitive evaluation of biological resources in the survey area. However, its shortcomings are also prominent, such as its high requirements for equipment and operators, its potential to cause harm to the environment, and its lack of coverage (i.e., unable to cover the reef area). Therefore, new technology is urgently needed to make up for the shortcomings of existing survey methods.
The emergence of environmental DNA (eDNA) technology has provided a new method of investigating fishery resources. eDNA refers to the ubiquitous free DNA molecules or fragments released from the skin, mucus, saliva, sperm, egg, feces, urine, and decaying bodies of organisms into the external environmental media (Bohmann et al., 2014). eDNA technology refers to the qualitative and quantitative analysis of eDNA extracted from environmental samples, through quantitative PCR and high-throughput sequencing, in order to speculate on and evaluate the presence, species, abundance, and distribution of organisms in the target environment (Adams et al., 2019; Williams et al., 2019; Barrenechea Angeles et al., 2020). With the advantages of convenient sampling, no limitations on environmental conditions, environmental friendliness, and high sensitivity, eDNA technology has been widely used since it was first established.
In the investigation of fishery resources, Miya et al. (2015) designed a pair of universal primers for the mitochondrial 12S rRNA gene partial sequence (163-185bp) of marine teleost. Combined with high-throughput sequencing technology, it can identify a variety of marine teleost species at one time. With the help of this technology, 168 species were identified from 180 species of marine fish in the aquarium environment (Miya et al., 2015). In the marine fishery resources survey, Stoeckle et al. (2020) used both bottom trawling and eDNA to investigate fish resources on the New Jersey coast, in the United States, and found that these two methods were highly consistent in their detection of resource abundance, fish composition, and seasonal distribution. In the monthly survey, 70-87% of species decected by the trawl survey were detected by eDNA. However, 92-100% of the species detected by eDNA were found in the trawl surveys (Stoeckle et al., 2020). Even in polar and deep-sea areas with harsh conditions, the results of the eDNA analysis were also highly consistent with the results of the trawl survey in terms of fish species identification and biomass assessment (Thomsen et al., 2016). Furthermore, eDNA technology can also monitor the distribution of large marine mammals (Juhel et al., 2021).
In this study, a trawl survey and seawater sampling were carried out simultaneously around the Yellow River estuary. Through comparing the results of the trawl survey with eDNA analysis, the variation rules of species and the abundance of marine teleost were revealed. The results provide a reference for the scientific assessment of the dynamic changes in the teleost population around the Yellow River estuary.
2 Methods
2.1 Trawl survey
The trawl survey was conducted from June 15 to 20, 2022. The survey sea area was around the Yellow River estuary, specifically including 15 stations between E119.100 and E119.686 and N37.500 and N38.220 (Figure 1 and Table 1). A single trawler with a power of 45.78 kW was used in the survey. The bottom trawl net port had a height of 3.0 m, a width of 10 m, and a circumference of 800 m, and the mesh size of the cod end was 20 mm. The average trawling speed was 2 knots, and the trawling time varied from 30 to 50 min at each station. The final catch per unit effort (CPUE) was converted into . An SD204 conductivity temperature depth (CTD) profiler and a handheld GPS locator were used to record the water depth, salinity, latitude, and longitude data of each station (Table 1). After trawling at each station, species identification of teleost fish was conducted based on morphological characteristics, and body weight and body length were measured. The species found in large numbers were sampled for measuring, and those with a small number were all measured.
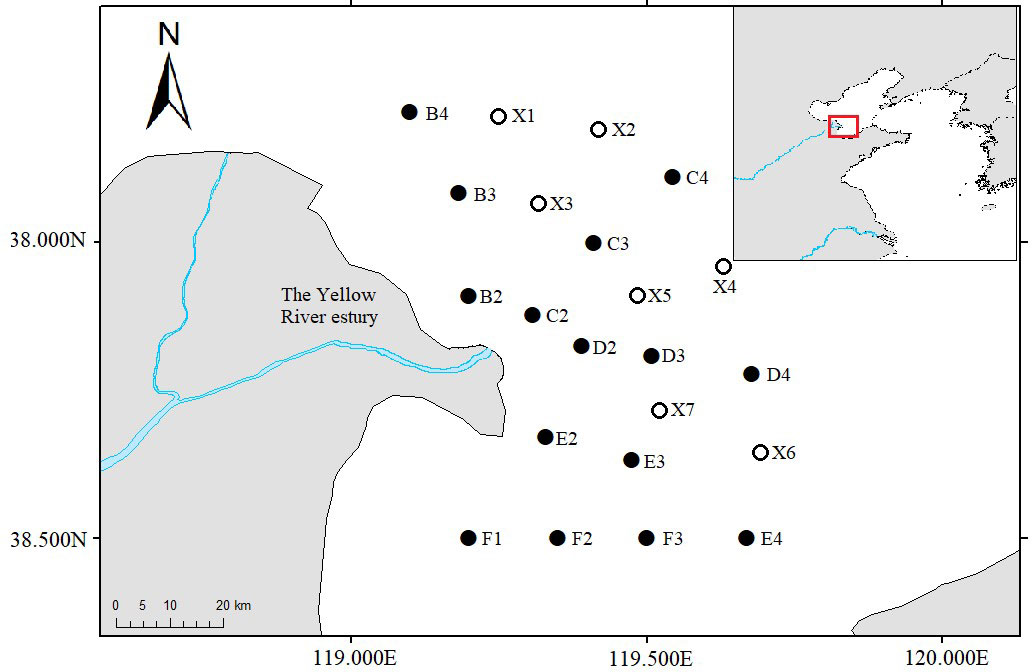
Figure 1 Distribution of survey stations in the Yellow River estuary. Empty circles mean these survey stations only collected water samples.
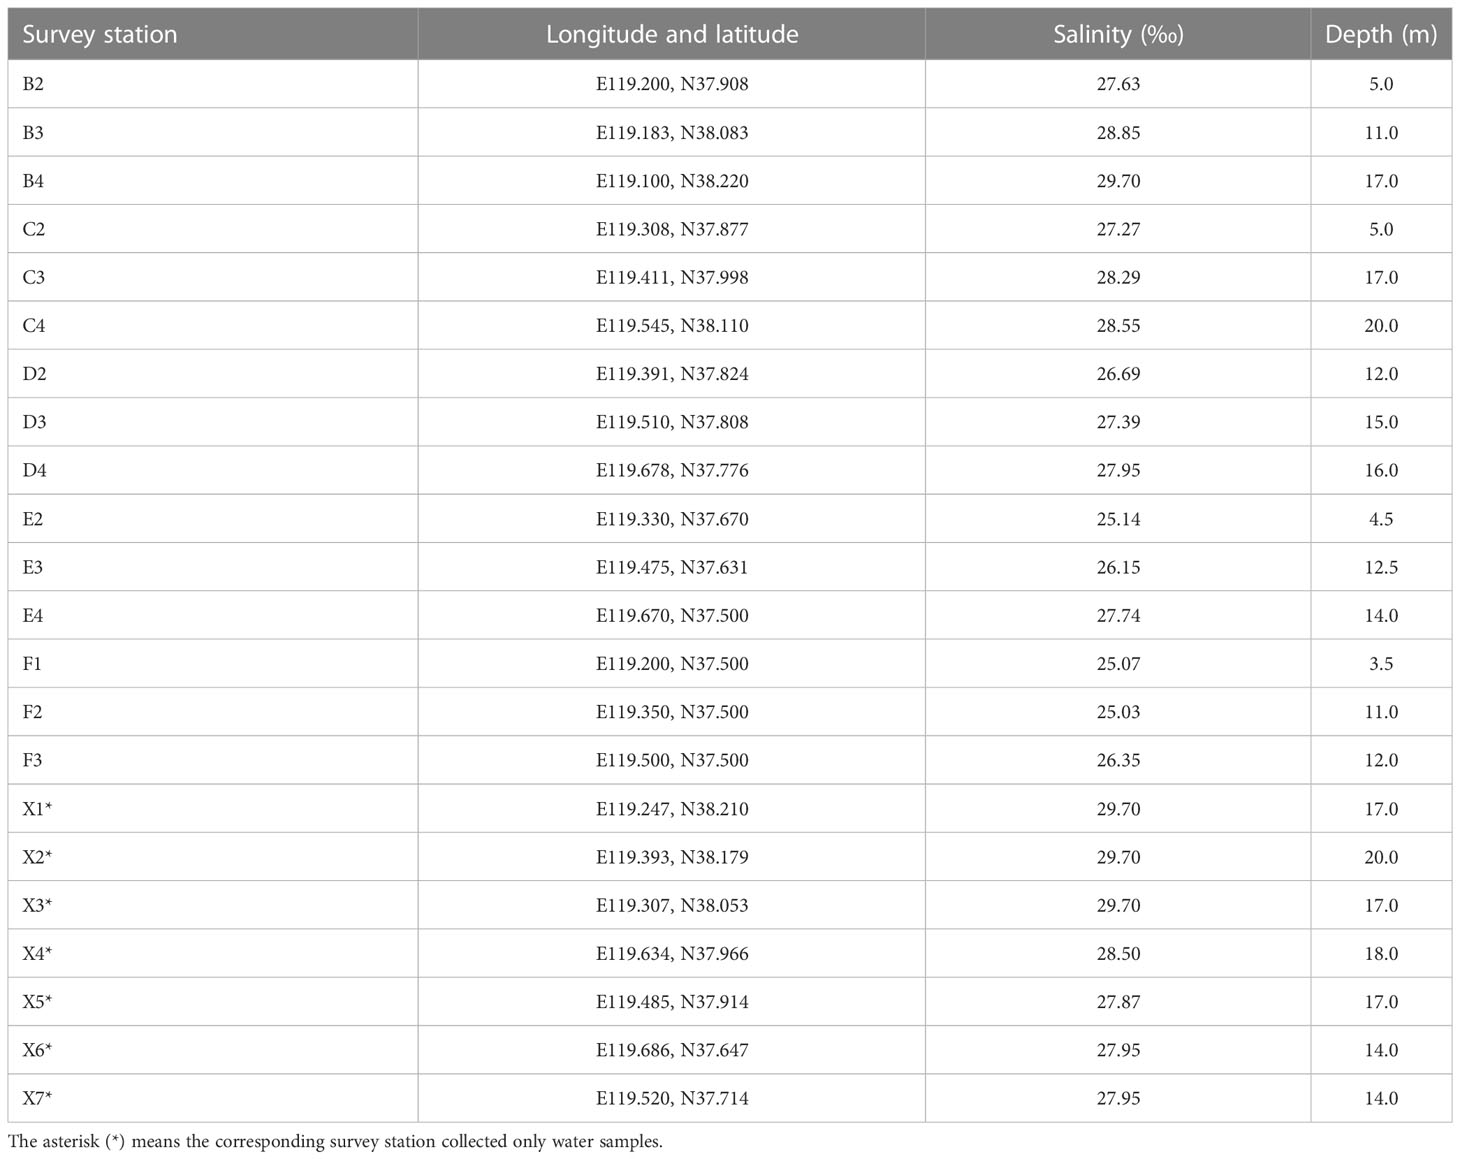
Table 1 Longitude, latitude, salinity, and depth of 22 survey stations.
2.2 Water sample collection and eDNA extraction
The water sample collection stations consisted of all 15 trawl survey stations and the other 7 stations (Figure 1 and Table 1). A 2L organic glass hydrophore was used to collect intermediate water, and the water collection at each station was repeated three times. After each collection, the hydrophore was thoroughly washed twice using deionized water. The water samples were filtered through a 0.45μm Glass fiber filter membrane. The filter membrane with enriched eDNA was folded, wrapped with sterile tin foil, stored in the RNA/DNA preservation solution (Vazyme) at -20°C, and transported back to the laboratory. The eDNA was extracted using the DNeasy Blood and Tissue Kit (Qiagen).
2.3 High-throughput sequencing
The universal primers of marine teleost mitochondrial 12S rRNA gene partial sequence were used for PCR amplification of eDNA (Miya et al., 2015). Primer sequences are as follows: MiFish-F, 5’-GTYGGTAAAWCTCGTGCCAGC and MiFish-R, 5’-CATAGTGGGGTATCTAATCCYAGTTTG (Miya et al., 2015). PCR was repeated three times using the TransStart® FastPfu DNA Polymerase kit (TransGen). In order to ensure the accuracy and reliability of subsequent data analysis, two conditions should have been met in PCR: 1) Low cycle number amplification should be used as far as possible; 2) The number of cycles amplified for each sample should be consistent. The random selection of representative samples for pre-experiment would ensure that the majority of the samples in the lowest number of cycles could be amplified with an appropriate concentration of products. In this study, the specific PCR conditions were as follows: an initial denaturing at 95°C for 5 min, followed by 30 cycles including 30 s denaturing at 95°C, 30 s annealing at 55°C, 20 s extension at 72°C, and then a final extension at 72°C for 5 min. Triplicate PCR products were pooled, purified, and used for library construction according to Illumina’s genomic DNA library preparation procedure and sequenced using the Illumina MiSeq PE 250 platform (Shanghai Biozeron). All raw sequences were analyzed using QIIME (Caporaso et al., 2010). After filtering out the high-quality reads, the remaining sequences were clustered into operational taxonomic units (OTUs) with a 97% similarity identity cutoff. Classification of the representative sequences of each OTU was performed against the NCBI and the Mitofish database (http://mitofish.aori.u-tokyo.ac.jp/). The corresponding species were then compared with those native to the Bohai Sea and annotated as known native fish as possible.
3 Results
3.1 High-throughput sequencing data
Due to sample preservation and eDNA extraction failure, among 22 water survey stations, eDNA was successfully extracted from 16 stations, and high-throughput analyses were performed (Table 2). After quality control and screening, the number of sequences obtained from each station varied from 555,030 to 695,056, with an average of 619,009. The average length of the sequences was 167.96 bp (Table 2).
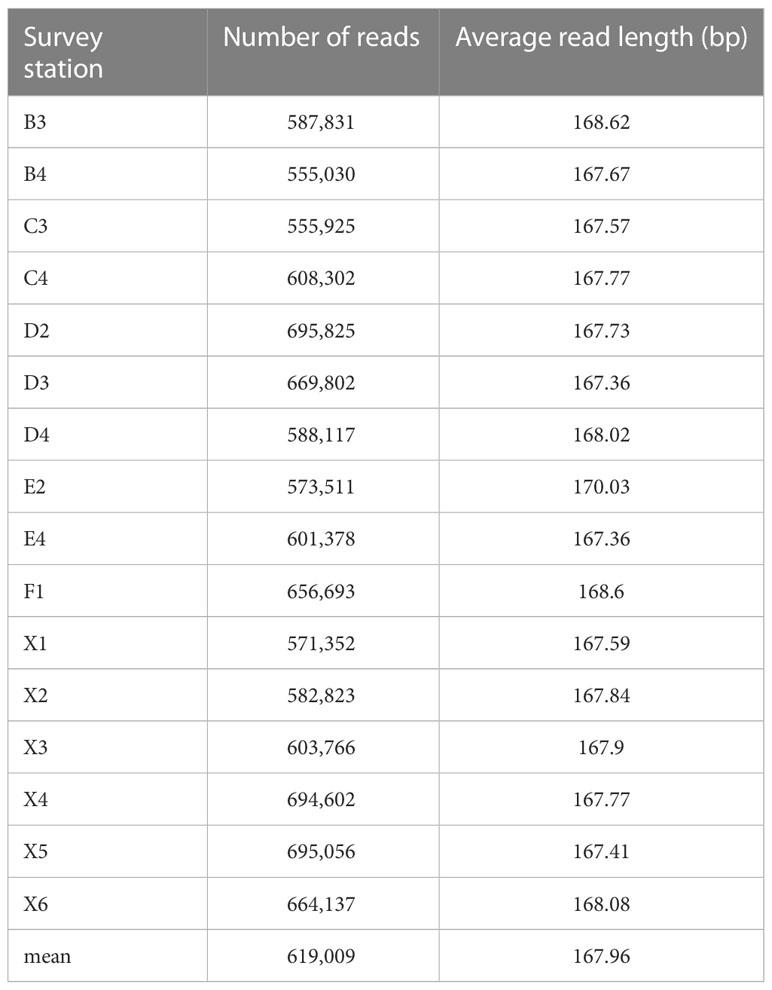
Table 2 Simple statistics of high-throughput sequencing results of water samples from 16 survey stations.
3.2 Comparison of species revealed by trawl survey and eDNA
A total of 31 species of marine teleost were detected in 15 survey stations using the trawl survey, and 33 species (including 1 unidentified species, Sebastes spp.) were detected in 16 survey stations using eDNA technology. The number of species detected by both the trawl survey and eDNA was 21 (Table 3). The 21 species included benthic fishes: Amblychaeturichthys hexanema, Cynoglossus joyneri; swimming predatory fishes: Planiliza haematocheilus, Lateolabrax japonicusg; and low economic value fishes: Clupanodon thrissa, S. taty, etc. Combined with the trawl survey and eDNA analysis results, the number of marine teleost species around the Yellow River estuary in June should be no less than 43. Excluding Sebastes spp., eDNA detected 67.74% of trawling species.
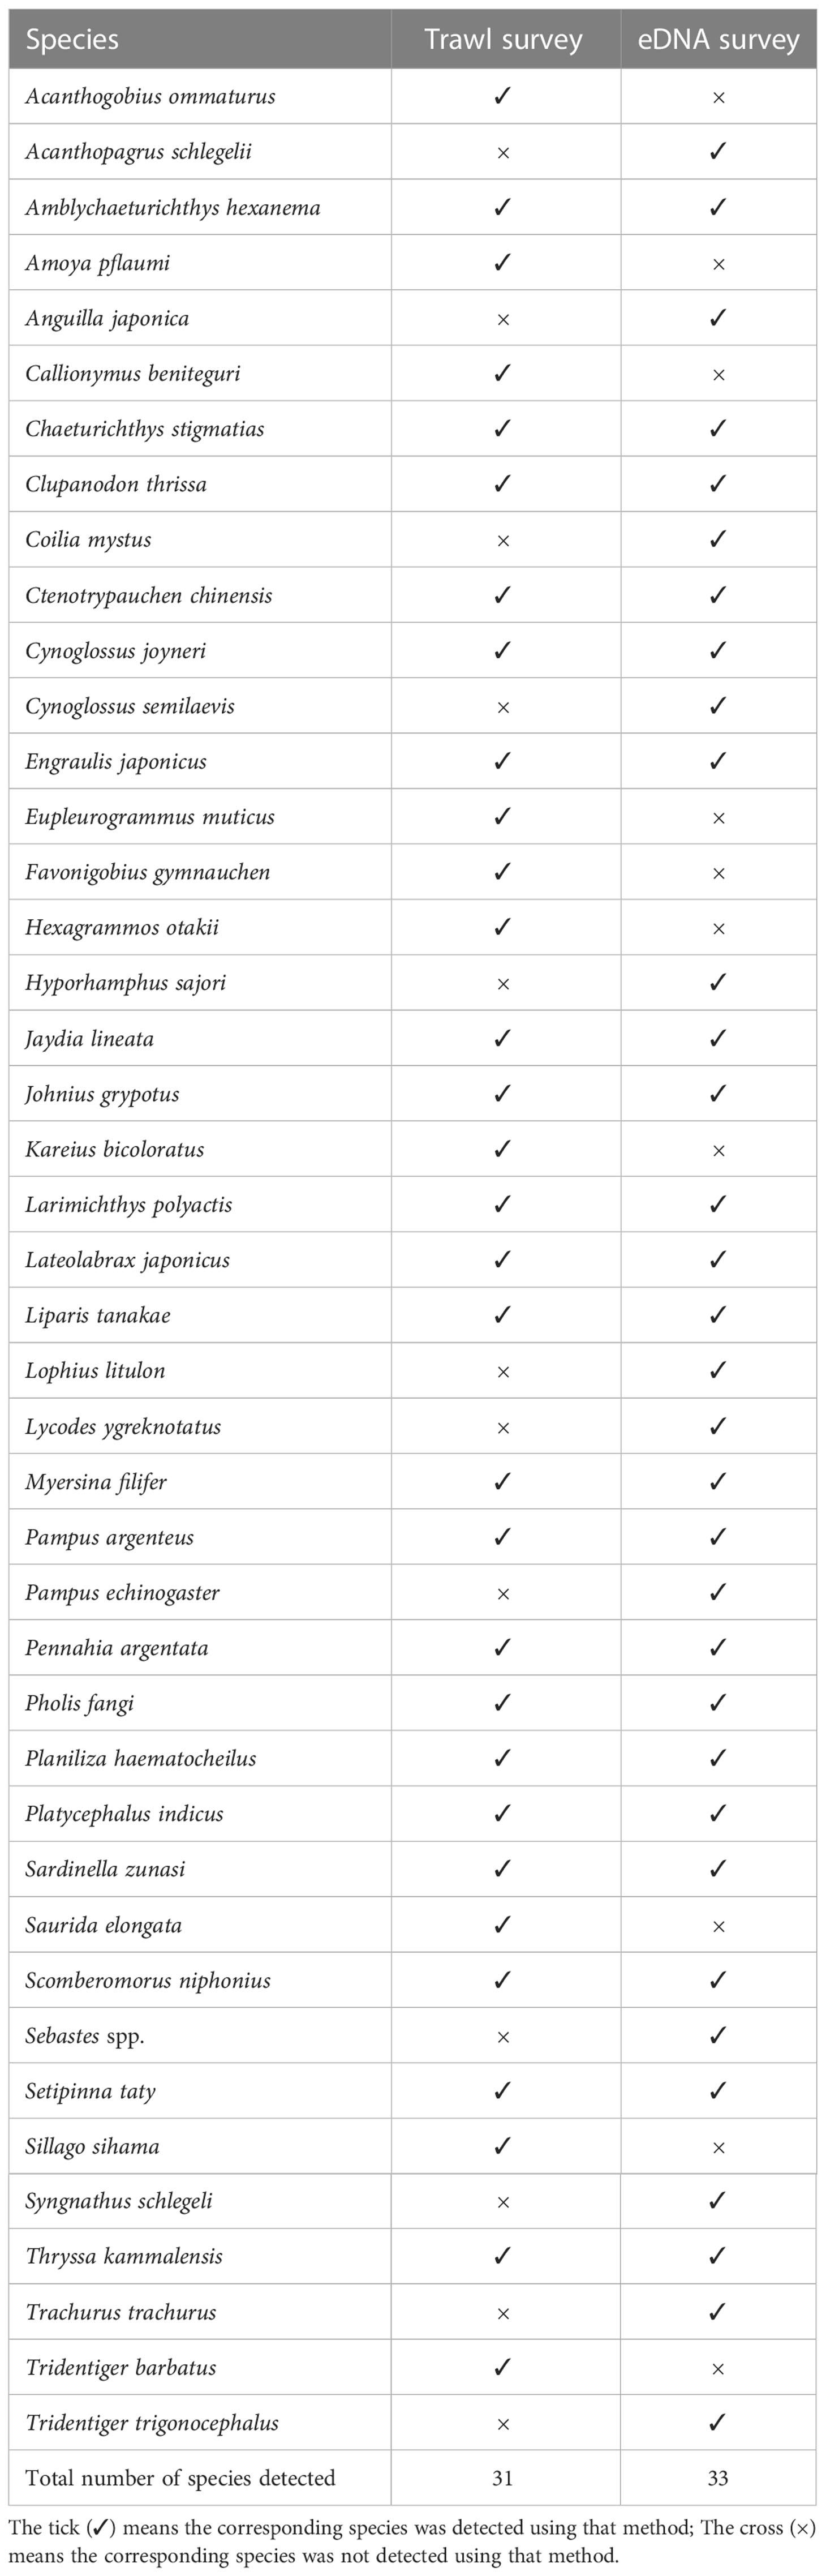
Table 3 Comparison species detection results of the trawl survey and the eDNA survey.
3.3 Comparison of biomass and eDNA relative abundance
Among all 22 survey stations, 10 stations produced both trawling survey data and eDNA high-throughput sequencing results. In this study, the average biomass of each species of these 10 stations was compared with the corresponding average eDNA abundance. The number of species involved in the comparison was 21, i.e., those detected by both the trawl survey and eDNA. The species with the largest catch per hour in the trawl survey was Chaeturichthys stigmatias. Furthermore, this species also had the greatest relative sequence abundance in the water samples (Table 4).
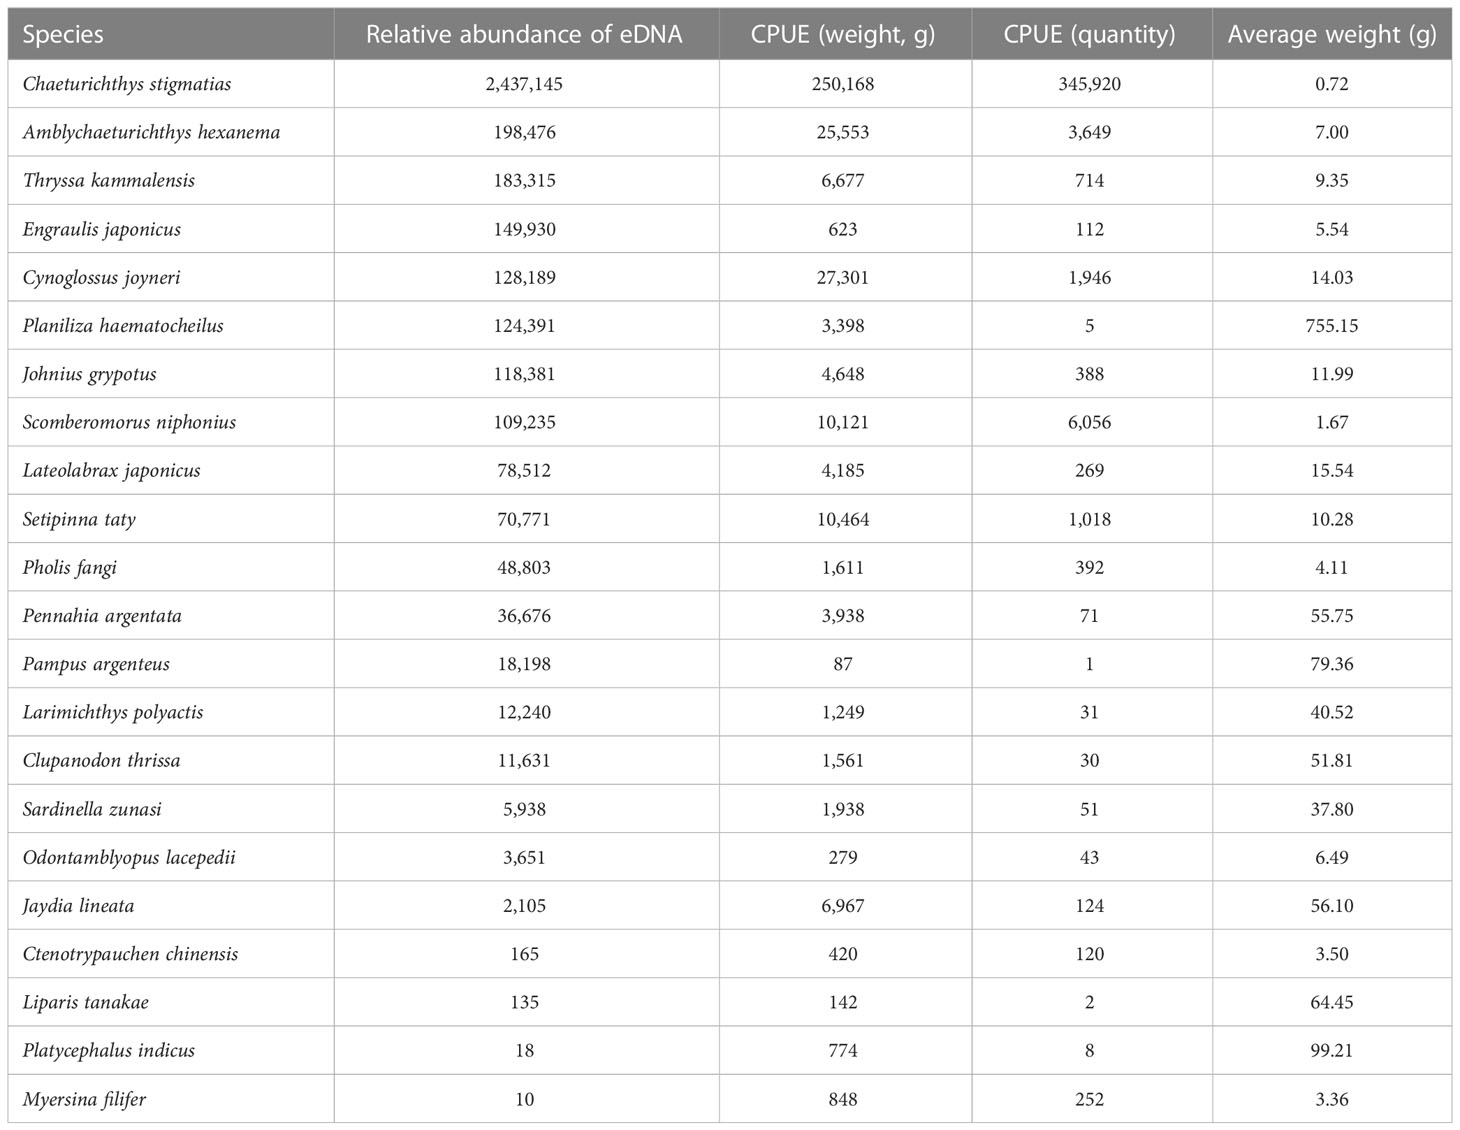
Table 4 Comparison of eDNA relative abundance and catch per unit effort (CPUE) of 21 marine teleost species (based on 10 survey stations).
The Pearson’s correlation coefficients between eDNA relative abundance and CPUE (weight and quantity) were both very high (0.993 and 0.993, Table 5), and the corresponding determination coefficients (R2) were 0.986 and 0.987, respectively. Furthermore, the Spearman’s correlation coefficients were 0.659 and 0.595, respectively (Table 5). All of the aforementioned correlations were highly significant (p<0.01). There was a clear correlation between biomass and eDNA relative abundance, while there was no significant relationship between relative abundance and average individual body weight (Table 5).
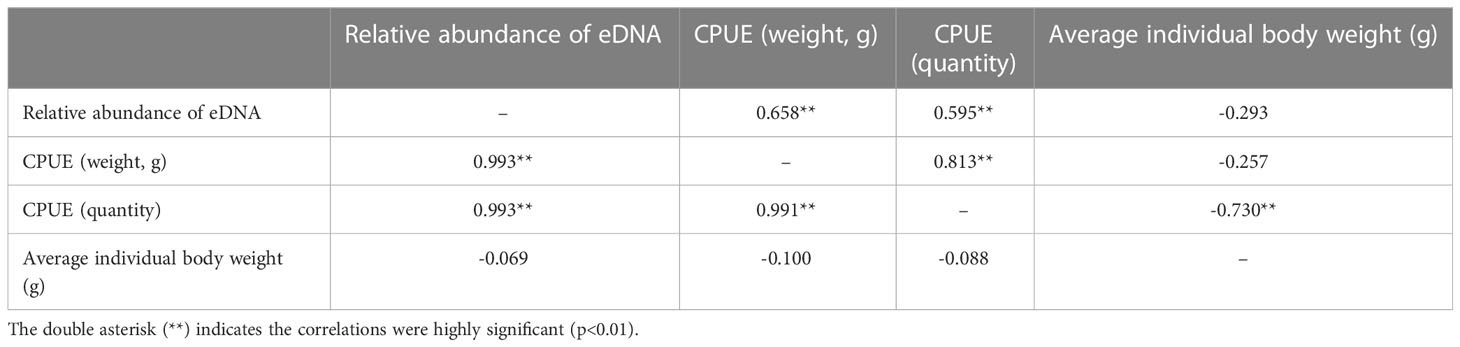
Table 5 Relationship between relative abundance of eDNA, catch per unit effort (CPUE), and average weight (g).
3.4 Comparison of species diversity based on eDNA
The species composition of 16 survey stations was compared based on the eDNA high-throughput sequencing data of water samples. The results showed that the E2 station had the biggest species composition difference when compared with the other stations, followed by the F1 station, and its β diversity index ranged from 0.326 to 0.555. The β diversity index of the other 15 stations varied from 0.276 to 0.476 (Figure 2). The water depths of E2 and F1 were 4.5m and 3.5m respectively, meaning they were the shallowest of all the 22 stations. Correspondingly, the salinity of the two stations was 25.14 and 15.07, respectively, meaning they also had the lowest salinity levels.
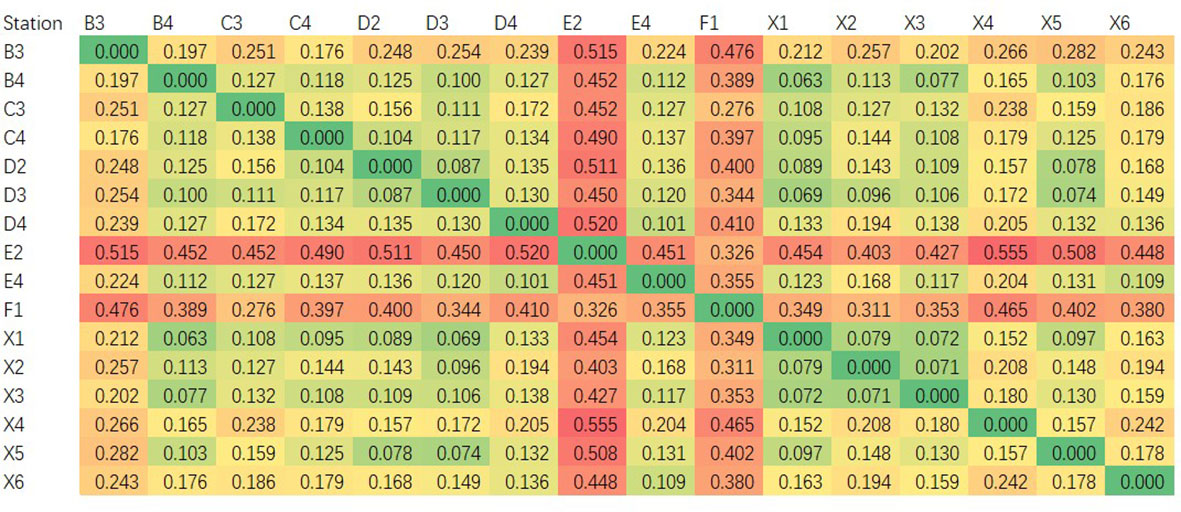
Figure 2 Teleost species composition differences (β diversity) among 16 stations revealed by eDNA.
4 Discussion
4.1 Species biodiversity assessment using trawling and eDNA
As mentioned above, traditional fishery investigation methods, such as trawling, can obtain first-hand data (species, abundance, and distribution) on fishery species. Although many limitations have emerged in the process of practical application, the trawl survey is the most popular method in fishery investigation at present (Li et al., 2012; Stoeckle et al., 2020; Hongo et al., 2021). Furthermore, due to its inherent uncertainty (Jerde, 2021), eDNA cannot yet replace traditional methods completely; a more accurate fishery resource assessment could be achieved based on a combination of trawl survey and eDNA methods.
In our research, 11 teleost fish species and one genus (Sebastes spp.) were monitored using eDNA but with the trawling method. Conversely, ten species were collected using trawling but with eDNA (Table 3). The discrepancies in fish species assessment between the trawling and eDNA methods should be attributable to the following reasons: the target species is relatively sparse and escaped from trawling, or the special habitats (such as the reef area) where the target species live impeded trawling conduct. In such cases, the target species could be monitored only using eDNA but with the trawling method. For example, the genus Sebastes was mainly distributed in the reef area, where trawling investigation could not be carried out but its eDNA could be monitored. Other potential reasons are that eDNA could have drifted horizontally or vertically with the ocean current (Qian et al., 2021; Wang et al., 2021), or 12S rRNA sequences of some target species may have still been lacking in the databases (such as the NCBI). In these cases, the trawling method could collect living samples but the eDNA result was negative.
Certain measures could be considered to improve the efficiency of eDNA monitoring: 1) Supplementing mitochondrion sequence information on target species in the databases or constructing a special database of native species, thereby increasing the chances of more species being monitored using eDNA technology. 2) In some teleost species within the same genus, such as genus Sebastes in the present study, or genus Takifugu, 12S rRNA sequences are very conservative. In this case, to achieve more accurate discrimination power from eDNA, other genes from the mitochondrion, for example, COI or 18S, or from nuclear genes, might be alternative methods. 3) Due to the “inherent uncertainty” of eDNA (Jerde, 2021), many factors, including temperature, ocean current, water flow, life history, and metabolism, should be considered comprehensively to improve the accuracy of eDNA technology.
4.2 Biomass assessment based on eDNA
Effective fishery management depends on accurate fishery animal biomass assessment. In recent decades, many studies have revealed the correlation between eDNA concentration and biomass or catch, whether using the species-specific eDNA PCR technique (Ct value) or the eDNA high-throughput sequencing (reads abundance) platform. In most cases, the higher the biomass, the higher the eDNA concentration detected (Takahara et al., 2012; Knudsen et al., 2018; Levi et al., 2019; Stoeckle et al., 2020; Wang et al., 2021). The same phenomenon also appeared in the present study; the most abundant OTU was from C. stigmatias, a type of benthic marine fish in the Bohai Sea. Correspondingly, the two measures of biomass (weight and quantity) of C. stigmatias were also ranked the top among all 33 types of fish detected by trawling (Table 4). The second abundant OTU was from A. hexanema, another type of benthic marine fish in the Bohai Sea. Its CPUE (weight) and CPUE (quantity) were both ranked third (Table 4). The CPUE (weight) and CPUE (quantity) of C. joyneri were ranked second and fourth, respectively, and its OTU abundance was ranked fifth (Table 4). In one study, when species-specific eDNA qPCR was involved, significant positive correlations between biomass and eDNA concentration and between CPUE (weight and quantity) and eDNA concentration were detected in Atlantic cod (Gadus morhua) (Salter et al., 2019). In another study in the sea area of New Jersey (USA), in which the eDNA abundance of different marine fishes was calculated using a high-throughput sequencing platform, high positive correlations between OTU abundance and catch were confirmed in more than 70% of the investigated fish species, and these patterns were confirmed in several different fishing seasons (Stoeckle et al., 2020).
In the present study, positive correlations between eDNA abundance and CPUE were confirmed in most of the 21 fish species that were detected by both the trawling method and eDNA (Table 4). Disagreement between eDNA and trawling was found in a few fish species, such as P. haematocheilus, E. japonicas, and Jaydia lineata (Table 4). Interestingly, P. haematocheilus showed a high abundance of eDNA concentration, but few samples were collected (Table 4). A similar result was also revealed in another report (Thomsen et al., 2016), indicating that the trawling method might not be suitable for some large or fast-swimming fish species. Furthermore, although biomass may affect eDNA concentration directly, many other factors may affect it indirectly as well. It is possible that two individuals of the same species and weight can release different eDNA if they feed differently (Klymus et al., 2015). In the future, many factors (such as temperature, development phase, degradation, feeding, and nutrition level) should be considered in order to better understand the correlation between eDNA and biomass.
4.3 Biodiversity comparison among different water sampling stations
Using a high-throughput sequencing platform, not only were more fish species able to be monitored than when using the trawling method but the relative abundance or biomass could also be assessed. Furthermore, differences in species composition between the different stations could also be analyzed (Stoeckle et al., 2020). In this study, we also compared the species composition differences among 16 investigation stations based on the composition of marine teleost fish species from the OTU annotation results in each station, from which, stations E2 and F1 displayed the most significant species composition differences when compared with the other 14 stations (Figure 2). Furthermore, we explored the potential environmental factors that might cause these differences: the depths of stations E2 and F1 were the shallowest (4.5 m and 3.5 m, respectively) of the 22 stations, and the lowest salinity levels were also detected in these two stations (25.14‰ and 25.07‰, respectively, Table 1). Station E2 lies in the Yellow River estuary and the direction of freshwater flow was to the Southwest and South and into the Bohai Sea. The abundance of freshwater caused sediment deposition and diluted the seawater around stations E2, F1, and F2 (the eDNA sample from station F2 was lost during the experiment) (Figure 1). It is clear that depth and salinity played key roles in affecting the distribution of marine teleost fish distribution in this study. Our findings demonstrate the possibility of using the eDNA technique to trace the effect of circumstances and physical and chemical factors on fish distribution.
It is undeniable, at least at present, that compared with living sample collection, eDNA, to a certain extent, is still not free of uncertainty. However, with continuous improvement and the gradual development of techniques, eDNA could become a robust and precise technique for use in fishery resource research fields (Jerde, 2021).
Data availability statement
Raw reads from the high throughput sequencing are deposited in NCBI sequence read archive (SRA) under the accession number PRJNA933970.
Ethics statement
The animal study was reviewed and approved by the Institutional Animal Care and USE Committee of Yellow Sea Fisheries Research Institute.
Author contributions
DL, SS and WW contributed to statistical analysis and prepared the manuscript. FL and TQ collected samples and data. XS and WW conceived and supervised the project. All authors contributed to the article and approved the submitted version.
Funding
Central Public-Interest Scientific Institution Basal Research Fund, YSFRI, CAFS (No. 20603022021002) and Marine S & T Fund of Shandong Province for Pilot National Laboratory for Marine Science and Technology (Qingdao) (No. 2021QNLM050103-3).
Conflict of interest
The authors declare that the research was conducted in the absence of any commercial or financial relationships that could be construed as a potential conflict of interest.
Publisher’s note
All claims expressed in this article are solely those of the authors and do not necessarily represent those of their affiliated organizations, or those of the publisher, the editors and the reviewers. Any product that may be evaluated in this article, or claim that may be made by its manufacturer, is not guaranteed or endorsed by the publisher.
References
Adams C. I. M., Knapp M., Gemmell N. J., Jeunen G. J., Bunce M., Lamare M. D., et al. (2019). Beyond biodiversity: can environmental DNA (eDNA) cut it as a population genetics tool? Genes 10(3), 192. doi: 10.3390/genes10030192
Barrenechea Angeles I., Lejzerowicz F., Cordier T., Scheplitz J., Kucera M., Ariztegui D., et al. (2020). Planktonic foraminifera eDNA signature deposited on the seafloor remains preserved after burial in marine sediments. Sci. Rep. 10(1), 20351. doi: 10.1038/s41598-020-77179-8
Bohmann K., Evans A., Gilbert M. T. P., Carvalho G. R., Creer S., Knapp M., et al. (2014). Environmental DNA for wildlife biology and biodiversity monitoring. Trends Ecol. Evol. 29 (6), 358–367. doi: 10.1016/j.tree.2014.04.003
Caporaso J. G., Kuczynski J., Stombaugh J., Bittinger K., Bushman F. D., Costello E. K., et al. (2010). QIIME allows analysis of high-throughput community sequencing data. Nature Methods 7 (5), 335–336.
Hongo Y., Nishijima S., Kanamori Y., Sawayama S., Yokouchi K., Kanda N., et al. (2021). Fish environmental DNA in Tokyo bay: a feasibility study on the availability of environmental DNA for fisheries. Reg. Stud. Mar. Sci. 47, 101950. doi: 10.1016/j.rsma.2021.101950
Jerde C. L. (2021). Can we manage fisheries with the inherent uncertainty from eDNA? J. Fish Biol. 98, 341–353. doi: 10.1111/jfb.14218
Jin X., Dong J. (2000). Variations in community structure of fishery resources and biodiversity in the laizhou bay, Shandong. Biodiversity Sci. 8 (1), 65–72.
Juhel J. B., Marques V., Fernández A. P., Borrero‐Pérez G. H., Martinezguerra M. M., Valentini A., et al. (2021). Detection of the elusive dwarf sperm whale (Kogia sima) using environmental DNA at malpelo island (Eastern pacific, Colombia). Ecol. Evol. 11, 2956–2962. doi: 10.1002/ece3.7057
Klymus K. E., Richter C. A., Chapman D. C., Paukert C. (2015). Quantification of eDNA shedding rates from invasive bighead carp Hypophthalmichthys nobilis and silver carp Hypophthalmichthys molitrix. Biol. Conserv. 183, 77–84. doi: 10.1016/j.biocon.2014.11.020
Knudsen S. W., Ebert R. B., Hesselsøe M., Kuntke F., Hassingboe J., Mortensen P. B., et al. (2018). Species-specific detection and quantification of environmental DNA from marine fishes in the Baltic Sea. J. Exp. Mar. Biol. Ecol. 510, 31–45. doi: 10.1016/j.jembe.2018.09.004
Levi T., Allen J. M., Bell D., Joyce J., Russell J. R., Tallmon D. A., et al. (2019). Environmental DNA for the enumeration and management of pacific salmon. Mol. Ecol. Resour. 19 (3), 597–608. doi: 10.1111/1755-0998.12987
Li Z., Wang J., Zhao Z., Zhou J., Lv Z., Dong J., et al. (2012). Resources enhancement of Fenneropenaeus orientalis in the bohai Sea. Prog. Fishery Sci. 33 (3), 1–7.
Miya M., Sato Y., Fukunaga T., Sado T., Poulsen J. Y., Sato K., et al. (2015). MiFish, a set of universal PCR primers for metabarcoding environmental DNA from fishes: detection of more than 230 subtropical marine species. R. Soc. Open Sci. 2 (7):150088. doi: 10.1098/rsos.150088
Qian T., Wang W., Li M., Shan S., Jin X. (2021). A preliminary study on the vertical distribution of Fenneropenaeus chinensis environmental DNA in the yellow Sea and its influencing factors. Prog. Fishery Sci. 42 (2), 01–09.
Salter I., Joensen M., Kristiansen R., Steingrund P., Vstergaard P. (2019). Environmental DNA concentrations are correlated with regional biomass of Atlantic cod in oceanic waters. Commun. Biol. 2, 461. doi: 10.1038/s42003-019-0696-8
Shan X., Jin X., Li Z., Chen Y., Dai F. (2012). Fish community structure and stock dynamics of main releasing fish species in the bohai Sea. Prog. Fishery Sci. 33 (6), 1–9.
Stoeckle M. Y., Adolf J., Charlop-Powers Z., Dunton K. J., Hinks G., VanMorter S. M. (2020). Trawl and eDNA assessment of marine fish diversity, seasonality, and relative abundance in coastal new Jersey, USA. ICES J. Mar. Sci. 78 (1), 293–304. doi: 10.1093/icesjms/fsaa225
Takahara T., Minamoto T., Yamanaka H., Doi H., Kawabata Z. I. (2012). Estimation of fish biomass using environmental DNA. PloS One 7 (4), e35868. doi: 10.1371/journal.pone.0035868
Thomsen P. F., Møller P. R., Sigsgaard E. E., Knudsen S. W., Jørgensen O. A., Willersleve E. (2016). Environmental DNA from seawater samples correlate with trawl catches of subarctic, deepwater fishes. PloS One 11 (11), e0165252. doi: 10.1371/journal.pone.0165252
Wang X., Lu G., Zhao L., Du X., Gao T. (2021). Assessment of fishery resources using environmental DNA: the large yellow croaker (Larimichthys crocea) in the East China Sea. Fisheries Res. 235, 105813. doi: 10.1016/j.fishres.2020.105813
Williams M.-A., O’Grady J., Ball B., Carlsson J., de Eyto E., McGinnity P., et al. (2019). The application of CRISPR-cas for single identification from environmental DNA. Mol. Ecol. Resour. 19 (5), 1106–1114. doi: 10.1111/1755-0998.13045
Keywords: environmental DNA, Yellow River, teleost, species diversity, estuary
Citation: Lyu D, Qian T, Li F, Sun S, Wang W and Shan X (2023) Monitoring and assessing the species diversity and abundance of marine teleost around the Yellow River estuary in June using environmental DNA. Front. Mar. Sci. 10:1123831. doi: 10.3389/fmars.2023.1123831
Received: 14 December 2022; Accepted: 17 April 2023;
Published: 02 May 2023.
Edited by:
Wei Huang, Ministry of Natural Resources, ChinaReviewed by:
Chi-Ying Hsieh, National Pingtung University of Science and Technology, TaiwanAlaa El-Din Hamid Sayed, Assiut University, Egypt
Daniel Liu, Da-Yeh University, Taiwan
Xia Lu, Yantai Institute of Coastal Zone Research (CAS), China
Copyright © 2023 Lyu, Qian, Li, Sun, Wang and Shan. This is an open-access article distributed under the terms of the Creative Commons Attribution License (CC BY). The use, distribution or reproduction in other forums is permitted, provided the original author(s) and the copyright owner(s) are credited and that the original publication in this journal is cited, in accordance with accepted academic practice. No use, distribution or reproduction is permitted which does not comply with these terms.
*Correspondence: Xiujuan Shan, shanxj@ysfri.ac.cn; Weiji Wang, wangwj@ysfri.ac.cn
†These authors have contributed equally to this work