Biologically Important Areas II for cetaceans within U.S. and adjacent waters – Gulf of Alaska Region
 Lauren A. Wild1*
  Heather E. Riley2
  Heidi C. Pearson1
  Christine M. Gabriele3
  Janet L. Neilson3 Andy Szabo4 John Moran5
  Janice M. Straley1
  Sarah DeLand6
- 1Applied Fisheries, University of Alaska Southeast, Sitka, AK, United States
- 2Arts and Sciences, Integrated Statistics Inc., Woods Hole, MA, United States
- 3Resource Management Division, Glacier Bay National Park & Preserve, United States National Park Service, Gustavus, AK, United States
- 4Alaska Whale Foundation, Petersburg, AK, United States
- 5Ted Stevens Marine Research Institute, NOAA Fisheries, Juneau, AK, United States
- 6Nicholas School of the Environment, Duke University, Durham, NC, United States
We delineated and scored Biologically Important Areas (BIAs) for cetacean species in the Gulf of Alaska region. BIAs represent areas and times in which cetaceans are known to concentrate for activities related to reproduction, feeding, and migration, and also the known ranges of small and resident populations. This National Oceanic and Atmospheric Association (NOAA)-led effort uses structured expert elicitation principles to build upon the first version of NOAA’s BIAs for cetaceans. Supporting evidence for these BIAs came from aerial-, land-, and vessel-based surveys; satellite-tagging data; passive acoustic monitoring; Indigenous knowledge; photo-identification data; and/or prey studies. A total of 20 BIAs were identified, delineated, and scored for six species: beluga whale (Delphinapterus leucas), fin whale (Balaenoptera physalus), gray whale (Eschrichtius robustus), humpback whale (Megaptera novaeangliae), North Pacific right whale (Eubalaena japonica), and sperm whale (Physeter macrocephalus). Of the 20 total BIAs, there were two small and resident populations, one migratory, and 17 feeding areas; no reproductive BIAs were identified. An additional five watch list areas were identified, a new feature to the second version of BIAs. In addition to more comprehensive narratives and maps, the BIA II products improve upon the first version by creating metadata tables and incorporating a scoring and labeling system which improves quantification and standardization of BIAs within and across regions. BIAs are compilations of the best available science and have no inherent regulatory authority. They have been used by NOAA, other federal agencies, and the public to support planning and marine mammal impact assessments, and to inform the development of conservation measures for cetaceans.
1 Introduction
Cetaceans in the Gulf of Alaska (GOA) overlap with numerous anthropogenic activities, including offshore energy exploration, development, and extraction; commercial fisheries; shipping; recreational vessels; and military operations. The GOA ecosystem is also changing rapidly due to climate change, as evidenced by shifts (both increases and decreases) in species-specific biomass and potential decreases in the productivity of organisms at lower trophic levels (Cavole et al., 2016; Ferriss and Zador, 2021). To inform area-based marine assessment, conservation and management efforts in the region, we identified and scored biologically important areas (BIAs) for cetaceans as part of the BIA II nationwide process led by the National Oceanic and Atmospheric Administration (NOAA).
BIAs represent places and periods (months or seasons) that are important to cetacean species, stocks, or populations for feeding, migration, activities related to reproduction, as well as known ranges or core areas of small and resident populations (Ferguson et al., 2015; Harrison et al. submitted to this issue). This effort builds on NOAA’s inaugural BIA process (Van Parijs, 2015) by revising existing BIAs in the GOA from 2015 (Ferguson et al., 2015), creating new BIAs based on new information from the last seven years, and scoring each BIA based on intensity of use, data support, importance, spatiotemporal variability, and boundary certainty (Harrison et al. submitted to this issue). This effort was undertaken across all seven regions in the United States: the Arctic, Aleutian Islands & Bering Sea, Gulf of Alaska, US West Coast, Hawaii, Gulf of Mexico, and US East Coast (Harrison et al. submitted to this issue). The interactive BIA map on the NMFS website (https://oceannoise.noaa.gov/biologically-important-areas) is the source of the most recent publicly available BIA data for all regions.
The GOA is located along the southern coast of Alaska and lies within the northern portion of the Pacific Ocean (Figure 1). More specially, the GOA is confined to the west, north, and east by Alaskan topography, and opens to the south into the larger body of the Pacific Ocean. Circulation in the Gulf of Alaska is counterclockwise and is dominated by the Alaska Current and Alaska Stream flowing along the continental slope and the Alaska Coastal Current flowing over the continental shelf. The Alaska Current narrows and intensifies as it enters the GOA from the southeast, becoming the Alaska Stream. The Alaska Stream continues along the peninsula and Aleutian Islands with some of its waters recirculating into the Gulf as part of the Alaska Gyre (Stabeno et al., 2004; Weingartner et al., 2009).
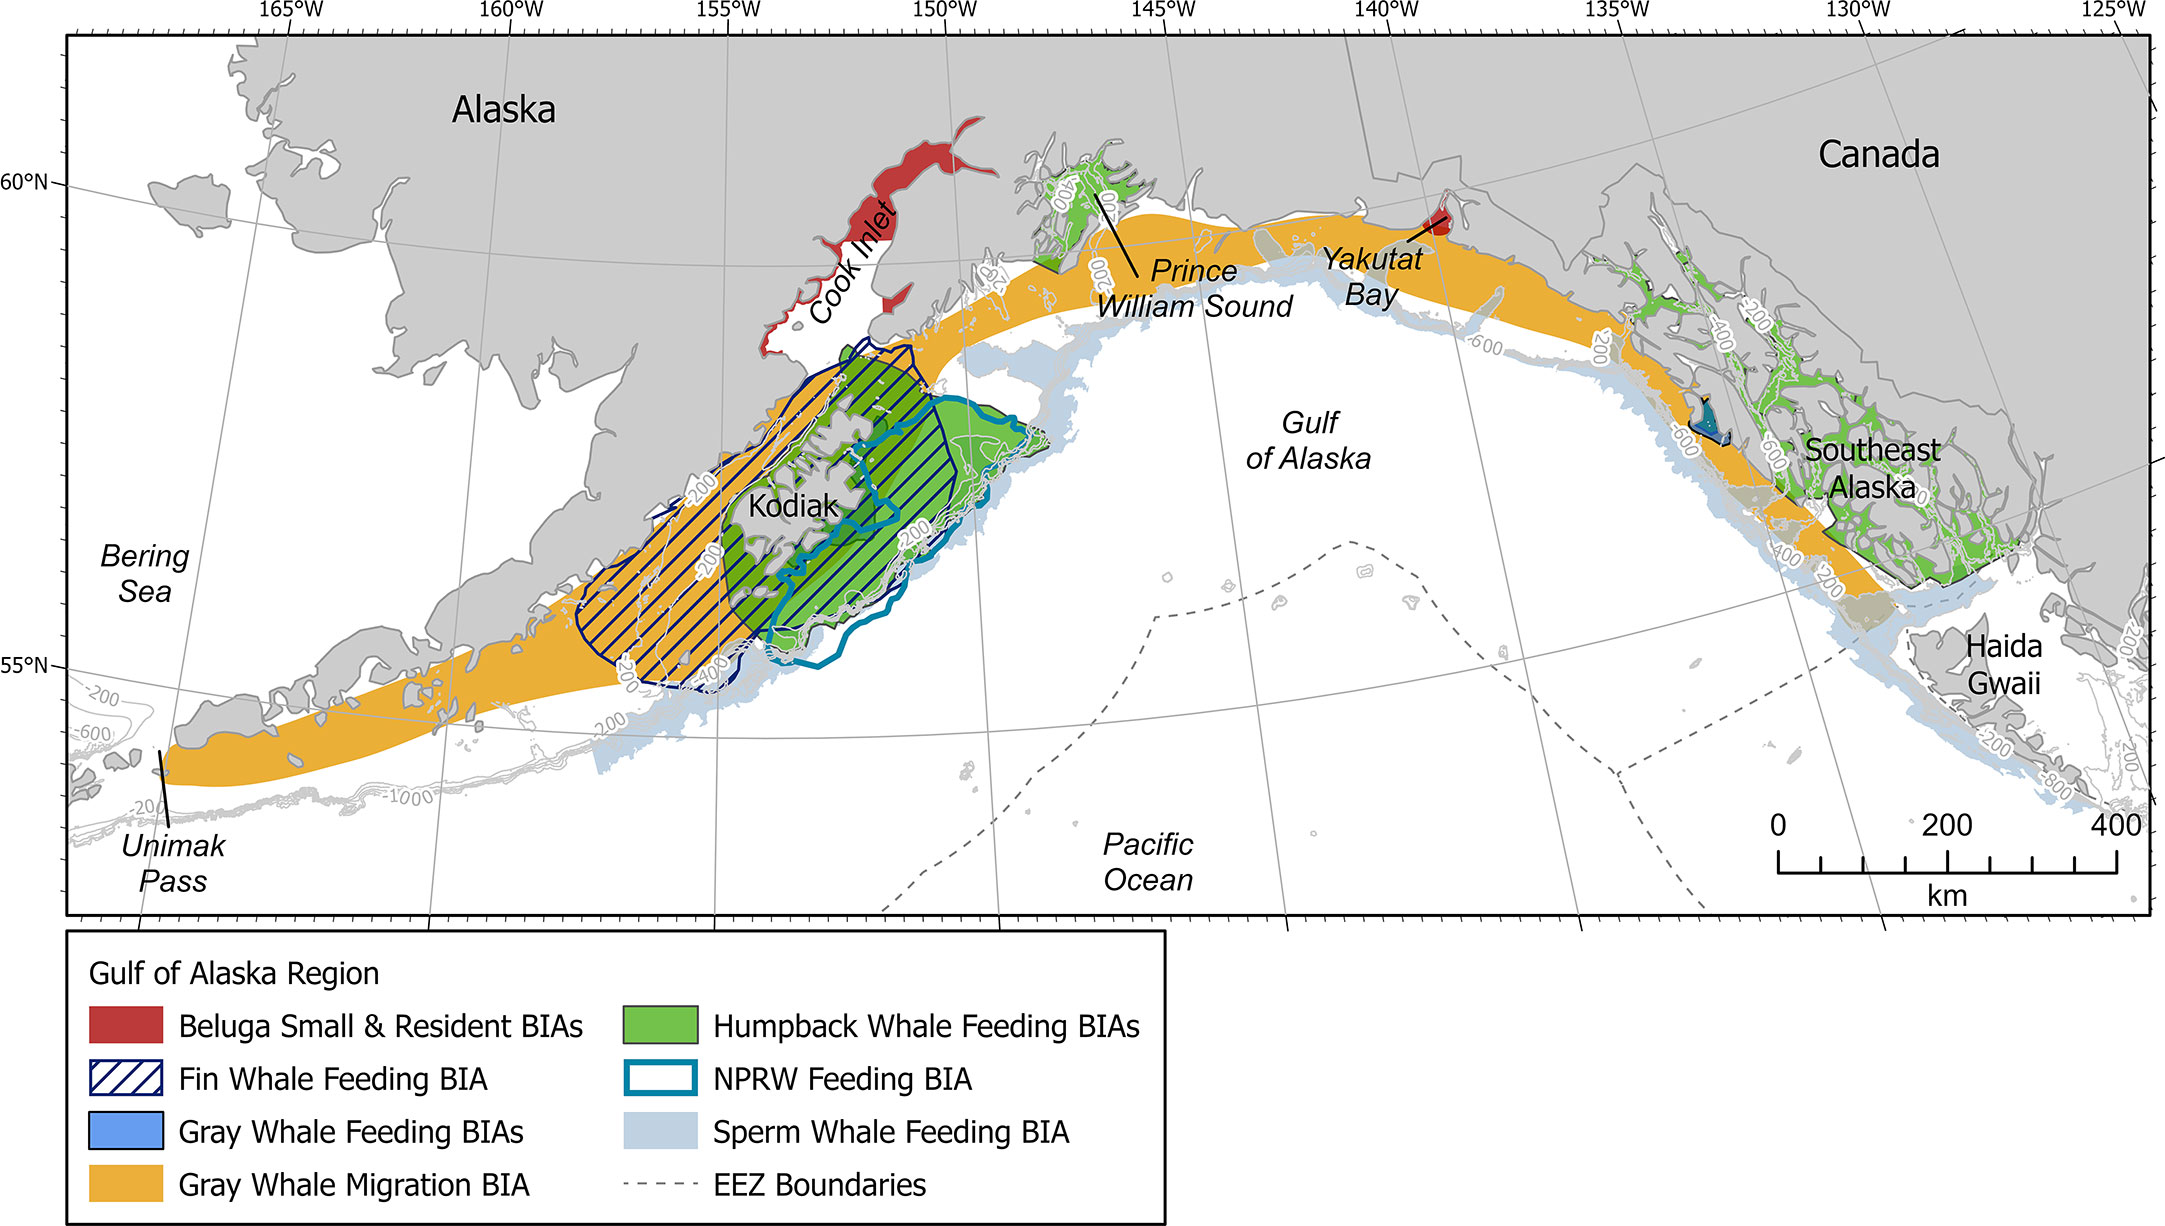
Figure 1 Gulf of Alaska map showing all BIAs. Contour lines shown at 200, 400, 600, 800, and 1000 m depths where relevant. EEZ refers to the US Exclusive Economic Zone, defined as 200 nm from shore.
The GOA encompasses a variety of habitats, including shallow continental shelf, steep shelf break, deep offshore waters, and deep-water seamounts, all of which are important to a diverse array of marine mammal species (Ferriss and Zador, 2021; Rice et al., 2021). Most notably, the continental shelf region supports a productive ecosystem, which includes numerous species of fishes, marine mammals, and seabirds (Stabeno et al., 2004). Unfortunately, many GOA marine mammals have been severely depleted by historical whaling and continue to face other challenges due to the impacts to marine ecosystems caused by climate change (Stabeno et al., 2004). Most notably, a historic heat wave within the GOA from late 2013 through 2016 resulted in the weakening of wind and winter storm patterns, affecting the timing of up- and down- welling while increasing ocean stratification, and impacting food availability for many large whale species (Cavole et al., 2016; Suryan et al., 2021; Gabriele et al., 2022).
The type, quantity, and quality of information available to assess large whales in the GOA is affected by the region’s remote location and vast area (around 1.5 million km2). The GOA can be a very challenging and difficult place to conduct research due to logistics and the frequency of strong storms (Stabeno et al., 2004). The cost of conducting research in the GOA can be measured both in terms of time and money. Our ability to assess, delineate, and score BIAs in the GOA is confined by these constraints for certain species, areas, and times.
The rich and dynamic environment of the GOA is important for many species of large whales that are known from extensive historical whaling records and decades of scientific research (Danner et al., 2006; Ivashchenko and Clapham, 2014a; Ivashchenko et al., 2014b; Rocha et al., 2014). In this paper we will focus on the following six cetacean species: beluga whale (Delphinapterus leucas), fin whale (Balaenoptera physalus), gray whale (Eschrichtius robustus), humpback whale (Megaptera novaeangliae), North Pacific right whale (Eubalaena japonica), and sperm whale (Physeter macrocephalus). It is important to note that these are not the only cetaceans found in the GOA. Rather, these species were prioritized because they were either included in the original BIA effort (BIA I) for this region (Ferguson et al., 2015) or have been the focus of recent and ongoing research efforts. For all other species in the GOA, subject matter experts (SMEs) were either unaware of sufficient information that would support BIAs at this time (e.g., Risso’s dolphin (Grampus griseus), or there was enough data to score at least one BIA in some or all parts of the GOA, but there was insufficient time and resources within the scope of this project (e.g., harbor porpoises (Phocoena phocoena), killer whales (Orcinus orca), and minke whales (Balaenoptera acutorostrata)).
Our overarching goals for this paper are to delineate and score BIAs in the GOA region, provide insight into the process used to delineate and score BIAs in the GOA region, provide a summary of the results, and provide direction on where to find detailed information (Supplementary Information tables, online access with user-friendly BIA viewer shapefiles, and metadata). The objectives are the same across all BIA regions:
● Present summary information and scores for all of the BIAs for the region
● Present detailed information on the data sources and decision-making process used to delineate and score a sample of exemplar BIAs in the region. The example BIAs were selected to span a range of BIA types, intensities, data availability, and spatiotemporal variability.
● List the Watch List areas - areas where some information was available to suggest a BIA might exist, but the scoring matrix gave them an importance score of 0 (see Harrison et al. submitted to this issue)
● Provide recommendations to facilitate future assessment, conservation, and management efforts
We begin with a brief summary of the standardized methods used across all regions to delineate and score BIAs (see Harrison et al. submitted to this issue for complete details). Then, we focus sequentially on each of the six whale species mentioned above. This paper builds upon and updates the original BIAs for beluga, fin, gray, humpback, and North Pacific right whales (Ferguson et al., 2015) and defines BIAs for sperm whales, which were not included in BIA I. For each species, we present detailed descriptions of one or more BIA types. For each BIA, we provide: 1) brief background information about the species in the region; 2) a written narrative describing information, assumptions, and logic used to delineate the BIA; 3) a map of the BIA; 4) a list of references used; and 5) a metadata table that details the type and quantity of information used to define the BIA. Comprehensive details and metadata for all GOA BIAs are included in the Supplementary Information Tables and are fully accessible on the BIA website (https://oceannoise.noaa.gov/biologically-important-areas).
2 Methods
BIAs for all seven regions around the US were delineated and scored using consistent methodology (see Harrison et al., submitted to this issue). Here we briefly describe the methods outlined in Harrison et al. (submitted to this issue). Four types of BIAs were defined across all regions: reproductive (R-BIA), feeding (F-BIA), migratory (M-BIA), and small resident population (S-BIA). Reproductive BIAs represent areas and times where a species, stock or population selectively mates, gives birth, or is found with neonates or calves. Feeding BIAs represent areas and times where an aggregation of a species, stock, or population preferentially feeds. Migratory BIAs represent areas and times within which a substantial portion of a species is known to migrate. Small and resident population BIAs are areas and times within which a small and resident population occupy a limited geographic context (under 35,000km2). For more detail on descriptions of the BIA categories please see Harrison et al. (submitted to this issue). For the BIA processes, regional leads attended national meetings with workshops with other area leads, NOAA and US Navy project sponsors, and other subject matter experts (SMEs) to solidify BIA definitions and scoring and labeling protocols. Check-in meetings were arranged with NOAA project sponsors and regional leads throughout the process to ensure understanding and consistency of protocols and assessments. Finally, expert elicitation was used in the form of SMEs, Indigenous and local knowledge holders.
The GOA is a broad region with the majority of research occurring in Southeast Alaska (SEAK), Prince William Sound (PWS), and Cook Inlet, and a lack of dedicated research outside of these hubs. Kodiak Island used to have dedicated cetacean research, but this has declined substantially since 2016 due to declines in funding and SMEs leaving the area. Outside of these areas, most of the recent data used to contribute to our understanding of cetacean presence in the GOA come from broad-scale line transect surveys with observational and acoustic data collected on multiple species of marine mammals (e.g., Rone et al., 2015; Matsuoka et al., 2020). Most SMEs we were able to contact and work with on this effort conduct research on humpback whales, gray whales, and killer whales in SEAK and PWS, sperm whales offshore in the eastern GOA, and beluga whales in Cook Inlet. We held multiple meetings with SMEs that work in SEAK to discuss how humpback whale BIAs would be arranged and scored in the area.
In the GOA, regional leads and SMEs used all available information to assess, delineate, and score candidate BIAs, including the older information sources documented in Ferguson et al. (2015), recent (2015-present) scientific publications, survey reports, technical memorandums, unpublished visual sighting data, line transect surveys, citizen science data, Indigenous knowledge, tagging data, acoustic recordings, and local knowledge from regional SMEs. Each candidate BIA was scored for Intensity, Data Support, Importance, Boundary Certainty, and Spatiotemporal Variability (see Harrison et al. submitted to this issue for more detail and description on scoring categories). Importance scores were given for R-, F-, and M-BIAs based on matrices of Intensity and Data Support scores, while the Importance score for S-BIAs was based on a matrix of Intensity (given by range & abundance metrics) and the Data Support score (Harrison et al. submitted to this issue). Geographic boundaries were delineated using a variety of categories such as geographic features, hydrographic features, minimum convex polygons around observation points (e.g., sightings, acoustic detections, or tag locations), and polygons drawn around a percentage of individuals engaged in an activity (e.g., feeding, migrating, reproducing, etc.). Precautionary buffers and predictions of potential habitat were excluded from boundary delineation. Boundaries were drawn in U.S. waters, but if a BIA extended past the U.S. Exclusive Economic Zone the boundary was not truncated or cut off. If the boundary moved into another region, the regional leads worked together to score and delineate the BIA and the region containing the larger area of the BIA generally took responsibility for the metadata of that BIA. Scoring for Intensity, Data Support, Importance, and Boundary Certainty was listed numerically from 1 to 3, with 1 being a low score (e.g., limited data to support the BIA, or low certainty in the boundary delineation), and 3 being a high score (e.g., extensive data to support the BIA or a high certainty in the boundary delineation). Spatiotemporal variability was categorized into Static, Ephemeral, and Dynamic (see Harrison et al. submitted to this issue for more detail and description on scoring categories). BIAs could also be hierarchically structured if detailed information was available to support areas with different scores across a single BIA (Harrison et al., submitted to this issue). Any candidate BIA with an Importance score of zero was added to a “Watch List” of areas for future consideration and to identify information gaps. The scores and narratives for each category were then summarized and forwarded to GOA SMEs for review.
We first present an overall regional summary of BIAs for the GOA region, as well as Watch List areas. We then present four detailed example BIAs that represent a variety of species, BIA types (Feeding, Migrating, and Small and Resident), and scores.
3 Regional summary
In total, 20 BIAs were identified for six cetacean species within the GOA region, with a geographic extent of approximately 315,313 km2 (range 240-174,404 km2; Figure 1; Table 1; for detailed information see Supplementary Information, or BIA website https://oceannoise.noaa.gov/biologically-important-areas). Three of the four BIA types were represented within the region, although not for all six cetacean species considered. Feeding BIAs were identified for gray, humpback, North Pacific right, and sperm whales. One migratory BIA was identified for gray whales. Two small and resident population BIAs were identified for beluga whales. The BIAs were active in the GOA from March to December, with a majority being active between May or June and September or October (Table 1; Figure 2).
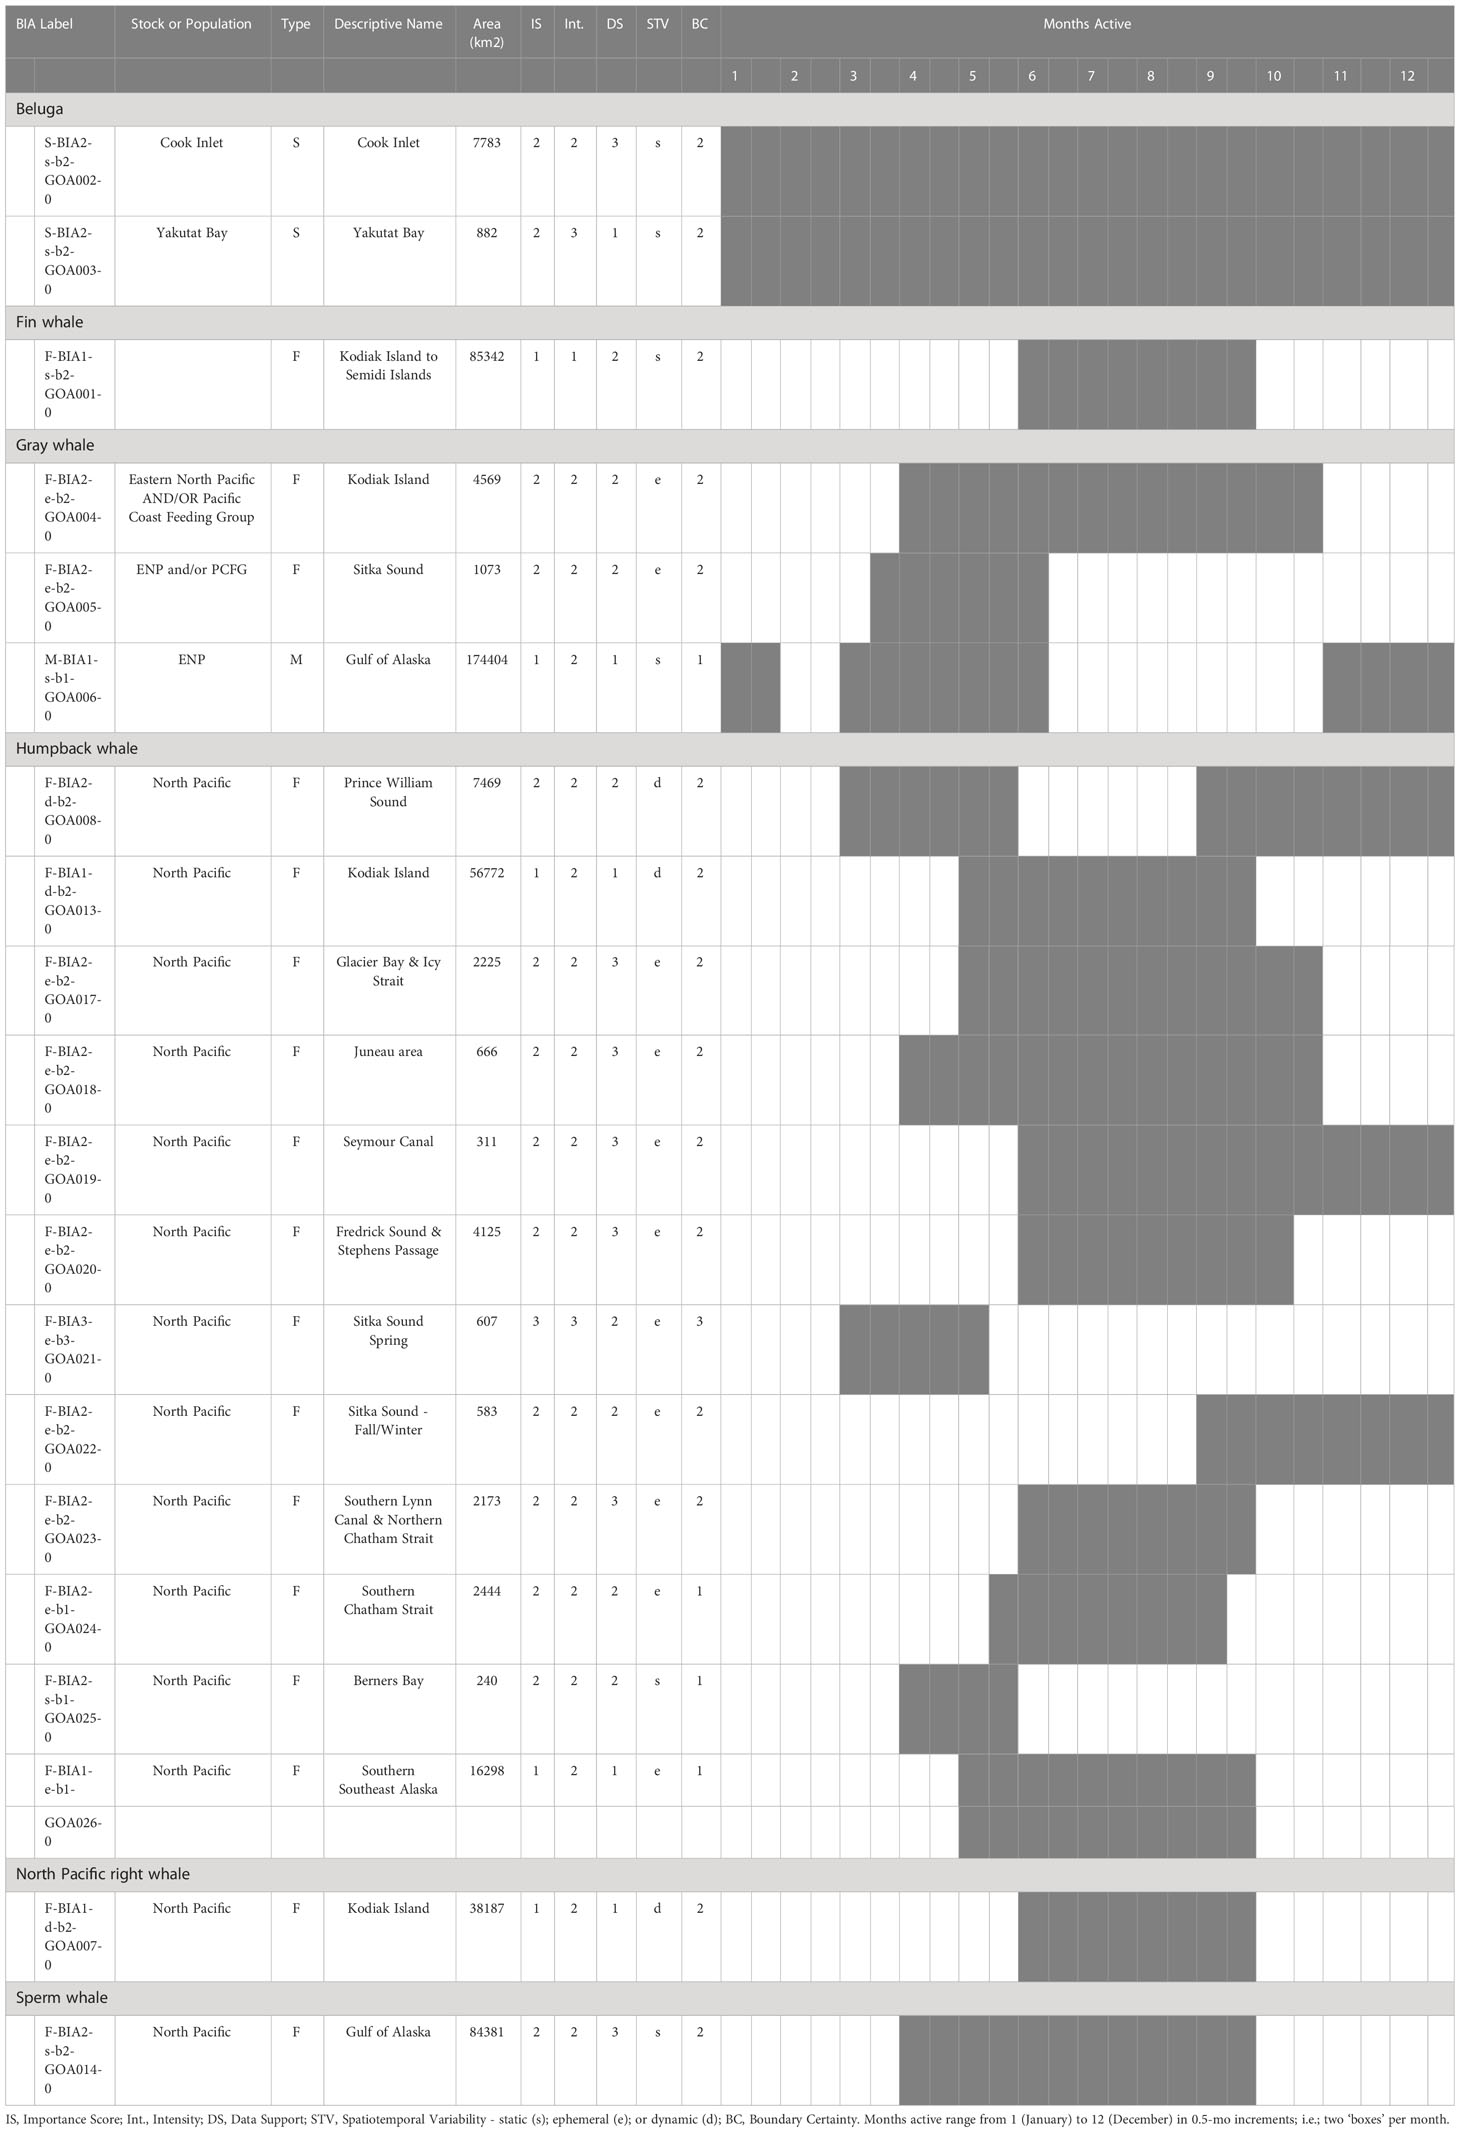
Table 1 All 20 Gulf of Alaska region BIAs by species and BIA type (feeding (F-BIA), migratory (M-BIA), and small resident population (S-BIA)), with general locations, scores, and designated months.
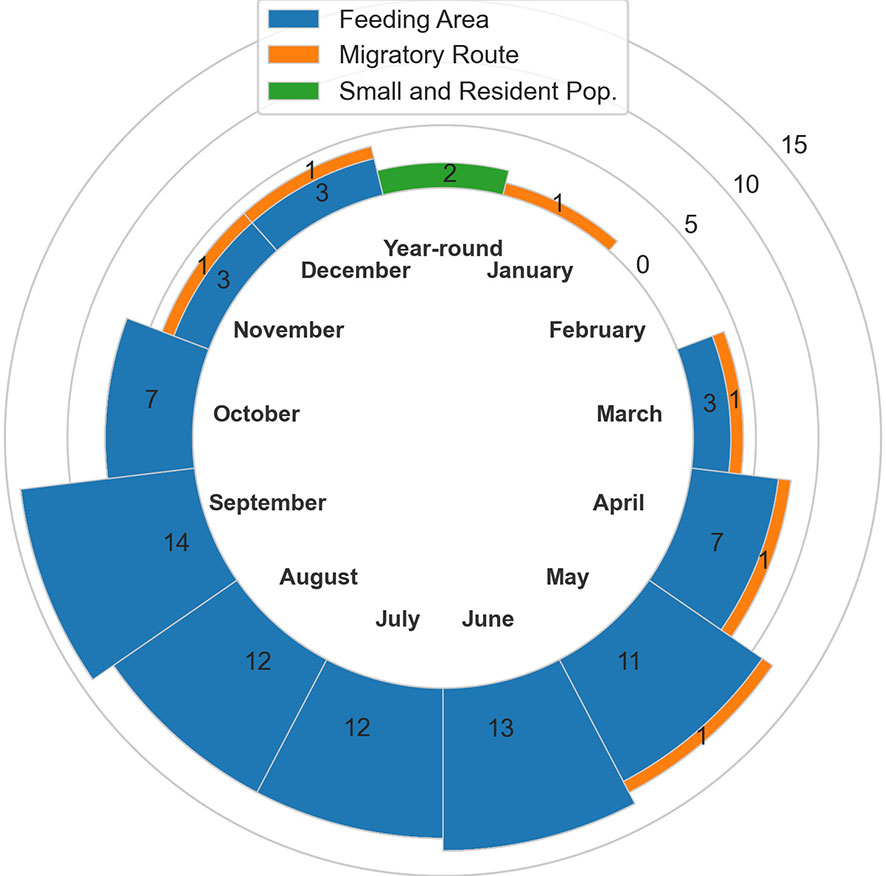
Figure 2 Number of BIAs by month and BIA type.
The BIA I project identified 14 BIAs (Ferguson et al., 2015), which were modified, split, and updated to result in the 20 BIAs for this assessment. One new species was added, with a sperm whale F-BIA (Supplemental description 4.25). The humpback whale BIA in the Shumagin Islands was removed and listed instead as a Watch List area (Supplemental description 4.23) due to lack of data support or any information that could be added since BIA I (Ferguson et al., 2015). Two BIAs were split into multiple BIAs: humpback whales in Southeast Alaska were split from one overall BIA with three seasonal occurrences to 10 BIAs (Supplemental descriptions 4.9 – 4.13, 4.15-4.18, 4.20) and two Watch List areas (Supplemental descriptions 4.21, 4.22) with their own temporal delineation (see example 4 below); and gray whales in Sitka Sound were split from one larger area into a summer feeding Watch List area in Shelikof Bay (Supplemental description 4.7) and a spring F-BIA focused on herring (see Example 2 below, and Supplemental description 4.5) (Tables 1, 2; Figure 1). For four BIAs (Cook Inlet and Yakutat belugas, as well as the gray whale migratory BIA and gray whale Kodiak Island F-BIA) the boundaries remained the same and supporting data only was updated (Supplemental descriptions 4.1-4.2, 4.8, and 4.4 respectively). For four BIAs, the boundaries were redrawn and supporting data were updated: fin whales and humpback whales near Kodiak Island (Supplemental descriptions 4.3, 4.19), humpback whales in Prince William Sound (Supplemental description 4.14), and North Pacific right whales (Supplemental description 4.24). Additionally, we added five Watch List areas not previously delineated (Table 2; Supplemental descriptions 4.6 and 4.21-4.23). In order to better evaluate these watch list areas, more time and effort are needed in the field.
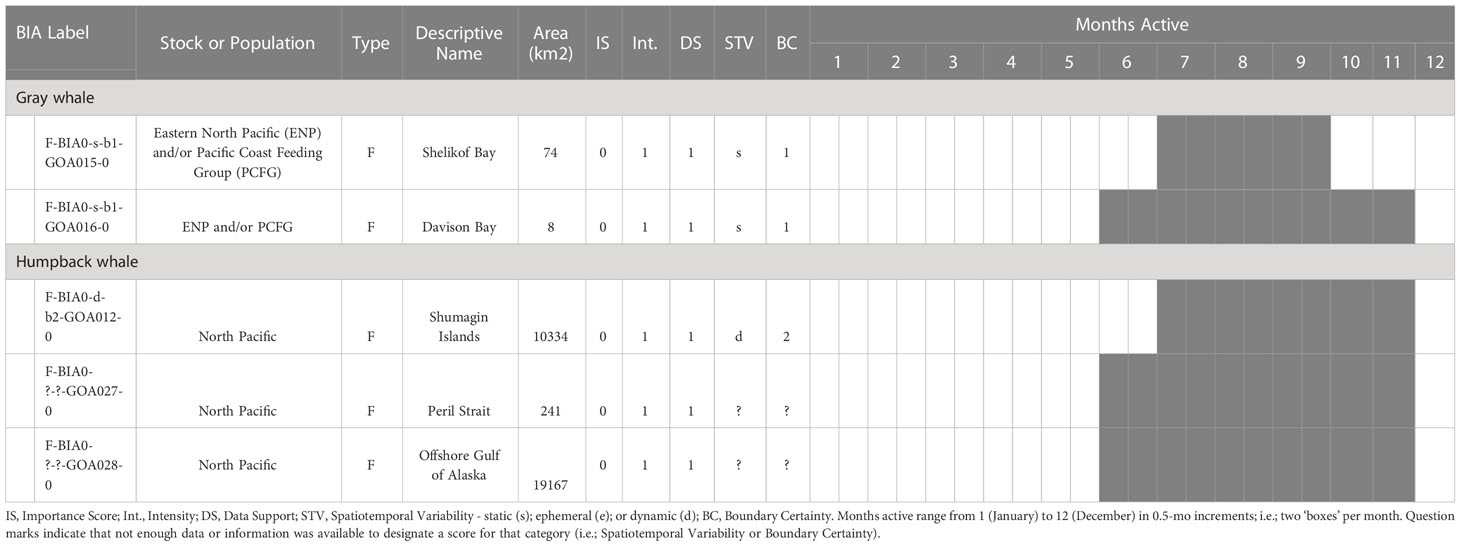
Table 2 All 5 Gulf of Alaska region Watch List areas by species and BIA type (feeding (F-BIA), migratory (M-BIA), and small resident population (S-BIA)), with general locations, scores, and designated months.
4 Examples of biologically important areas in the Gulf of Alaska
4.1 Example 1 – Beluga whale (Delphinapterus leucas) small and resident population BIA in Yakutat Bay
Importance: 2, Intensity: 3, Data support: 1, Boundary certainty: 2, Spatiotemporal variability: static (s).
4.1.1 Background information
The following five stocks of belugas are recognized by NOAA Fisheries in U.S. waters and they are named after the summering areas in which they are found in Alaska (O’Corry-Crowe et al., 2006; O’Corry-Crowe et al., 2009; Muto et al., 2021; O’Corry-Crowe et al., 2021): 1. Cook Inlet, 2. Bristol Bay, 3. Eastern Bering Sea, 4. Eastern Chukchi Sea, and 5. Beaufort Sea. Genetic evidence supports an additional small population located in Yakutat Bay (SEAK) (O’Corry-Crowe et al., 2006; O’Corry-Crowe et al., 2009). Only the Cook Inlet and the Yakutat Bay belugas are found within the GOA (Figure 3). This example describes the S-BIA identified for the Yakutat Bay belugas, but we note that a S-BIA was also identified for Cook Inlet belugas and the supporting information can be found in the Supplemental Materials for this manuscript.
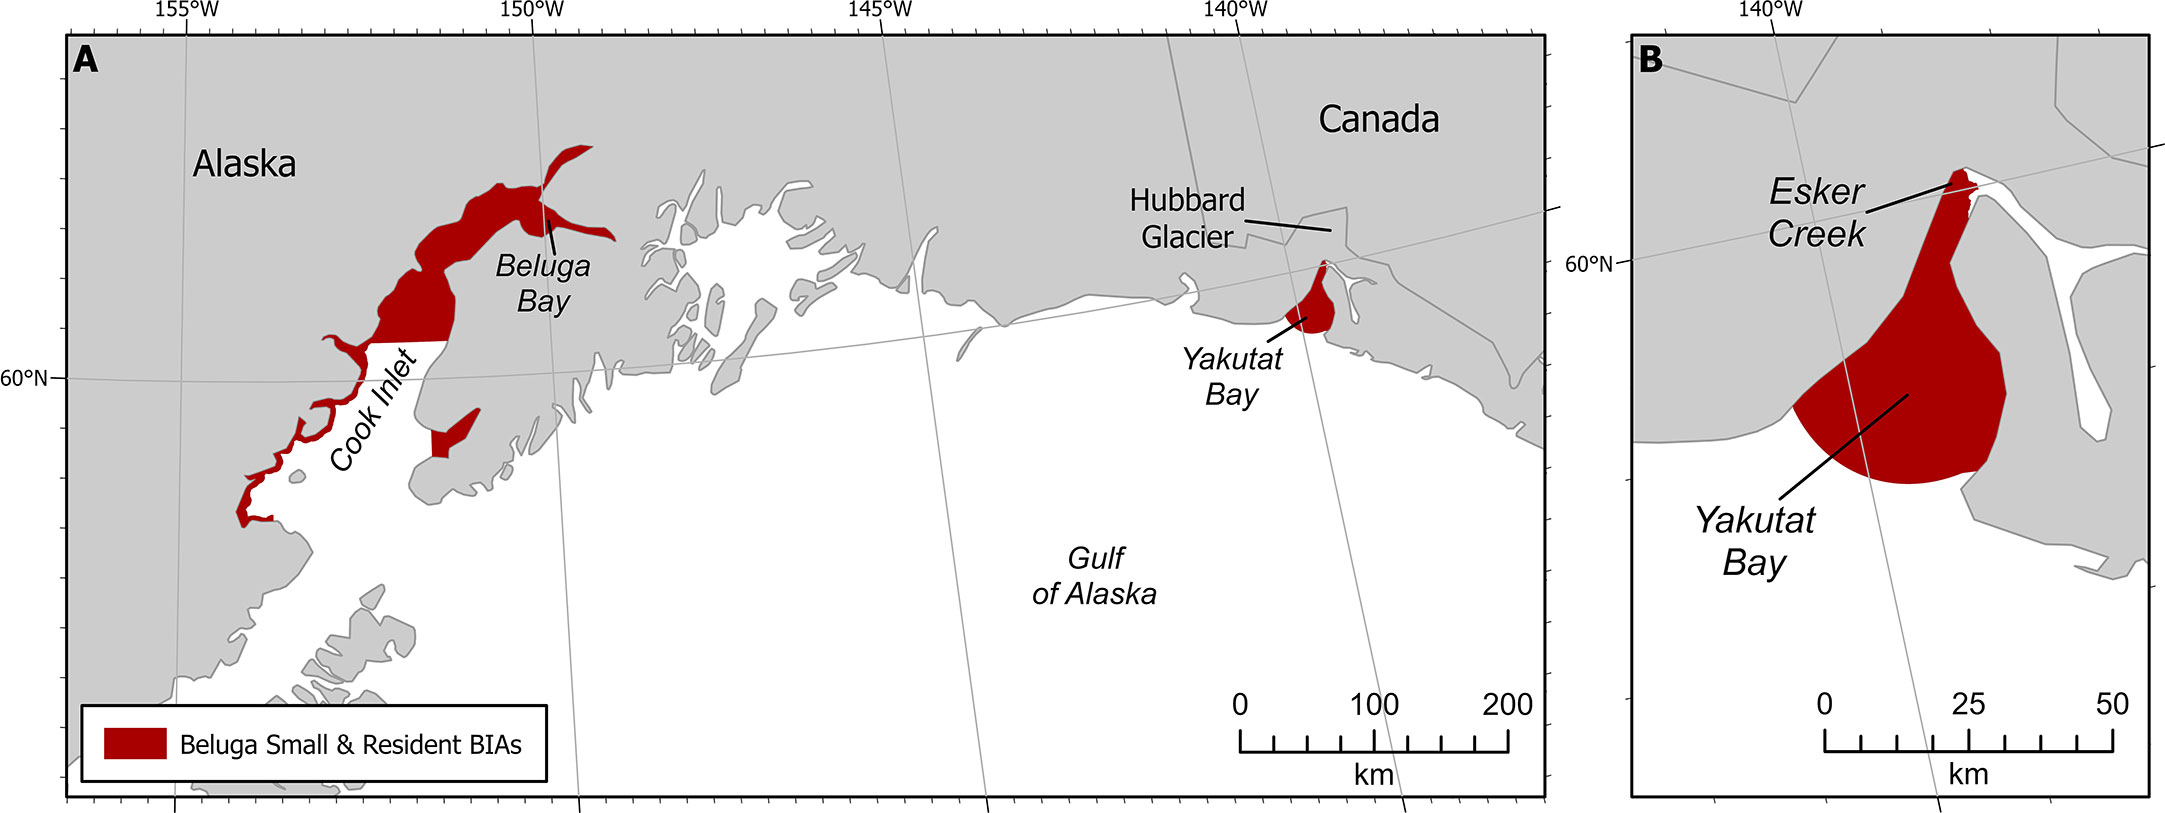
Figure 3 Beluga small and resident population BIAs. (A) Both GOA S-BIAs. (B) Yakutat S-BIA zoomed in.
NOAA Fisheries regulations under MMPA (50 CFR 216.15) include Yakutat Bay belugas as part of the Cook Inlet Stock (75 FR 12498). However the Yakutat belugas are not considered part of the Cook Inlet Distinct Population Segment (DPS) (ESA, 73 Fr 62919). Genetic work suggests that while Yakutat Bay belugas may have come from the Cook Inlet population, their genetics are distinct enough now from the Cook Inlet belugas that they have “limited genetic exchange with Cook Inlet” (O’Corry-Crowe et al., 2015).
4.1.2 Intensity
The Intensity score (3) was based on the explicit quantitative criteria for S-BIAs, which are based on the population’s estimated abundance and range size (Harrison et al., submitted to this issue). The size of the population is uncertain, though approximately 10 individuals were counted in 2008 (O’Corry-Crowe et al., 2009; O’Corry-Crowe et al., 2015) as well as 2011 (Lucey et al., 2015). Recent information available after 2015 was based on three personal communications: one group of five whales seen in northwest Yakutat Bay in August 2017 (S. Oehlers pers comm 2021); a single whale moving towards the mouth of Esker Creek in mid-August 2020 (J. Capra pers comm 14 May 2021); and some groups of 2-3 whales from the air in Beluga Bay located on the west side of the Hubbard Glacier face in 2020 (J. Capra pers comm 14 May 2021). The range size of the beluga whales in Yakutat Bay is less than 2,000 km2. From the available information, the abundance of this population is fewer than 125 individuals. These abundance and range size estimates result in an overall Intensity score of 3 (Harrison et al., submitted to this issue).
4.1.3 Data support
Data support for this BIA was scored low (1) based on the limited new data in the last 10 years. The original BIAs (Ferguson et al., 2015) were based on data from 1976-2008. Here, we considered all available new information, which included data from dedicated research up to 2013 (Lucey et al., 2015) and three separate community science sightings in 2017 and 2020 (Supplementary Information).
4.1.4 Spatiotemporal variability indicator
Spatiotemporal variability of this BIA is characterized by static properties of the bay such as bathymetric features and food availability at river mouths, etc. It is a small and resident population that stays within the boundaries of the bay.
4.1.5 Boundary delineation
Boundary certainty was scored 2. The boundary was drawn to include all of the bay within which sightings have been observed (Laidre et al., 2000; O’Corry-Crowe et al., 2006; O’Corry-Crowe et al., 2009). It is important to point out that we are not certain that these belugas still use the entire area of Yakutat Bay because the last known records have all been near Esker Creek and Beluga Bay.
4.2 Example 2 - Gray whale (Eschrichtius robustus) feeding BIA in Sitka sound
Importance: 2, Intensity: 2, Data support: 2, Boundary certainty: 2, Spatiotemporal variability: ephemeral (e)
4.2.1 Background information
Once common throughout the Northern Hemisphere, gray whales are now mostly concentrated in the North Pacific Ocean where there are two main population stocks: the western North Pacific population (WNP) which feeds in the coastal waters of Sakhalin Island, Russia, with little known about migratory routes and breeding areas; and the eastern North Pacific population (ENP) which migrates along the West coast of North America between breeding areas in Baja California, Mexico and feeding areas between California and the Bering, Beaufort, and Chukchi seas. (LeDuc et al., 2002; Lang et al., 2011; Weller et al., 2012; Lang et al., 2014 and Weller et al., 2013). Additionally, there is a small but important feeding aggregation known as the Pacific Coast Feeding Group (PCFG) (Calambokidis et al., 2002). Genetic studies have shown that the ENP and WNP populations are distinct, while mitochondrial DNA has identified the PCFG as a subgroup of the ENP population (Lang, 2010; Lang et al., 2011). The most recent estimates of abundance are 16,650 ENP gray whales (95% CI = 15,170-18,335) in 2021/22 (Eguchi et al., 2022), 271-311 WNP gray whales in 2018 (Cooke et al., 2018), and 243 PCFG gray whales (SE=18.9; CV=0.08) in 2015 (Calambokidis et al., 2017).
A majority of the ENP gray whales migrate along the US west coast and the GOA as they transit between winter breeding areas in Baja California and Mexico, along the central California coast (Eguchi et al., 2022), and across the GOA to summer feeding areas in the Bering and Chukchi seas. The GOA portion of the northbound migration generally occurs between March and May (Braham, 1984). While a majority of gray whales migrate to the Bering and Chukchi seas, some whales spend summer months in feeding aggregations between northern California and throughout the GOA (Pike, 1962; Calambokidis et al., 2002). In these feeding aggregations they primarily feed on amphipods, gastropods, polychaetes, decapods, and cumaceans (Nerini, 1984; Darling et al., 1998; Moore et al., 2007; Witteveen and Wynne, 2016).
In Sitka Sound, local knowledge indicates that gray whales arrive in late March, coinciding with the herring spawning, and are typically seen in areas where spawning has occurred. Since the 1990s, at least 20-30 gray whales have regularly come through the area after herring spawn in the spring. Since 2014 and 2015 that number has grown, with an estimated 150-200 gray whales in 2021 and 2022 (Straley & Wild unpublished data). It is unclear what has triggered this phenomenon, but researchers in the area believe it has to do with prey availability elsewhere in their range, and are beginning studies using photographic-identification (photo-ID), tissue sampling, and body condition analysis. While feeding activity is the most common behavior seen, photographic and video documentation has also shown active surface social behavior and a variety of feeding strategies. Photo-ID and genetic analysis of the gray whales that come to Sitka Sound in the spring has not been done, so baseline studies are needed, and the Alaska Department of Fish and Game (ADF&G) herring biologists are also interested in learning more about how these exponential increases in gray whale numbers are impacting the predation on herring eggs and larvae. ADF&G conducted herring spawn deposition dive surveys, which have documented troughs of bottom substrate and kelp beds disturbed by gray whales throughout the spawning habitat (J. Jones pers comm 26 April 2022).
4.2.2 Intensity
This F-BIA received an Intensity score of 2 based on the significance of the Sitka Sound spring herring resource, in the context of their long migratory pathway between breeding and feeding grounds and the short-term window of this feeding opportunity. While this region is data-limited, expert elicitation from SMEs indicates that a large and increasing number of gray whales use the Sitka Sound area as a feeding BIA in the spring during the herring spawning season (Figure 4). This area is a consistent and important feeding area, given the short 1-2 month window and time of year it is active (spring) and the lack of other gray whale feeding areas in the GOA during that time. The fact that Sitka Sound is a potential stopover location to forage along a roughly 8000 km migration corridor highlights the significance of this F-BIA. Additionally, the prey resource of herring eggs and larvae is fairly unique for this population of gray whales and it has been suggested that the ability to exploit a variety of prey resources may be important to this species’ survival (Darling et al., 1998).
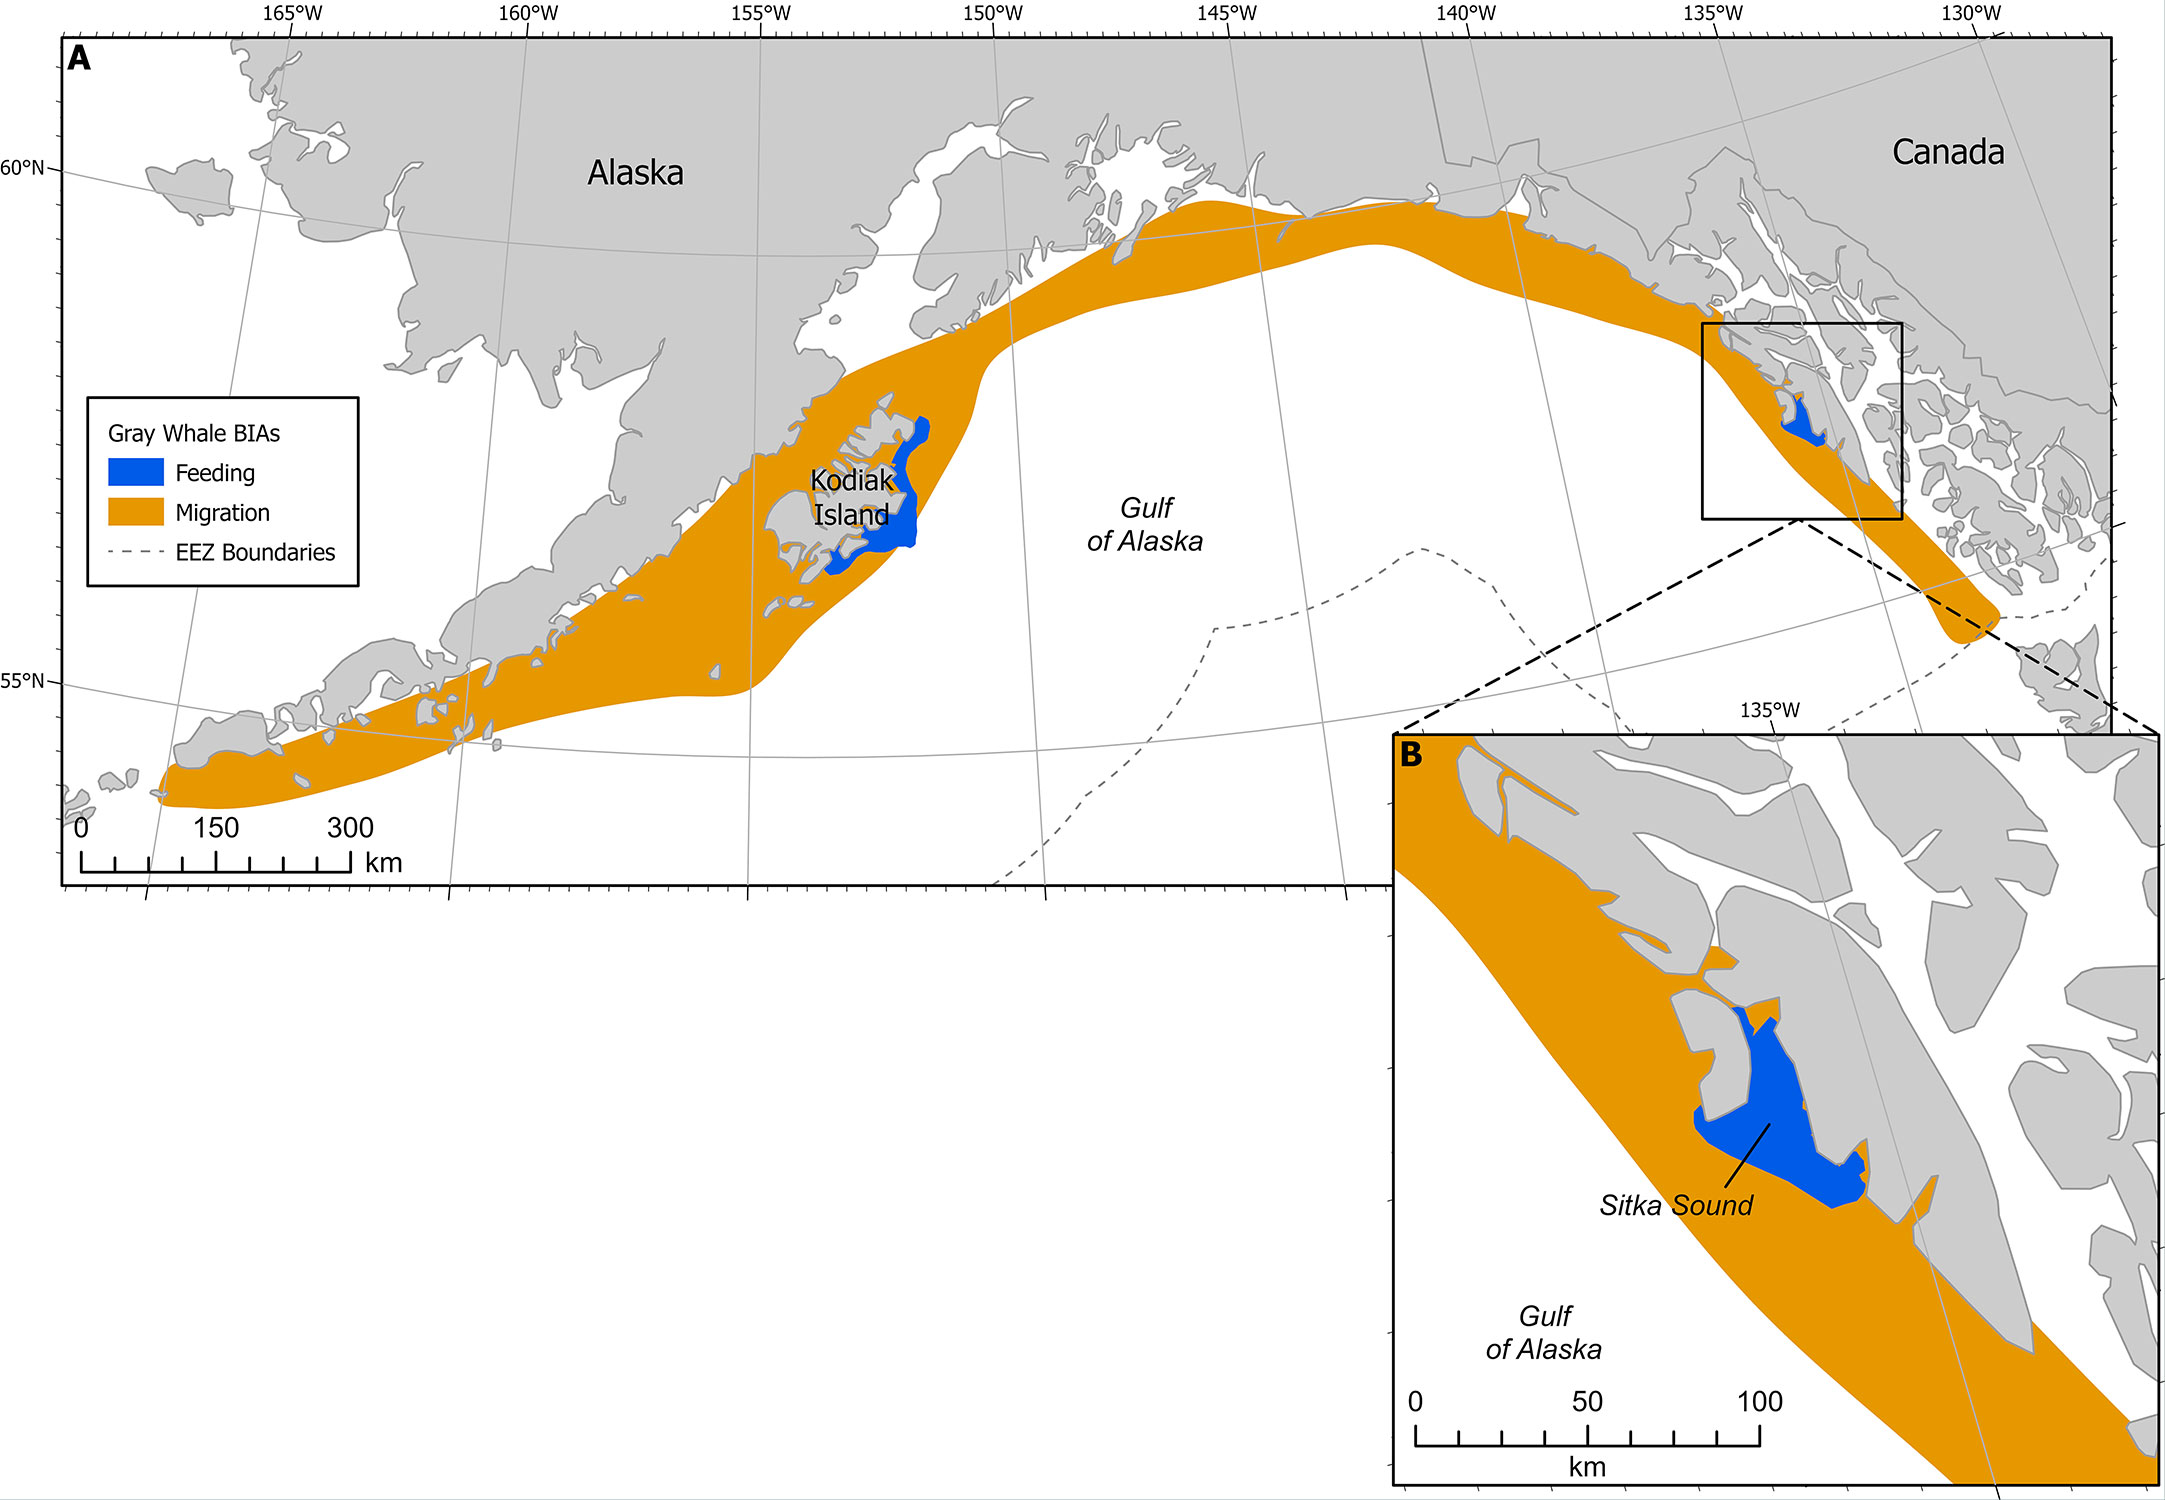
Figure 4 (A) Gray whale BIAs with migratory BIA (M-BIA) shown in orange. Inset (B) shows Sitka Sound F-BIA. EEZ refers to the US Exclusive Economic Zone, defined as 200 nm from shore.
4.2.3 Data support
This F-BIA received a data support score of 2. There have not been any dedicated count, behavior, acoustic, or tag data collected in this feeding area. Photo-ID data was collected in Sitka Sound by J. Straley in the 1980s, 1990s, and early 2000s, though individuals were photographed during summer and fall months, rather than during the spring herring feeding (J. Straley, unpublished data). Overall, this BIA is based primarily on thousands of observations, photographs, and videos from members of the public, whale watching companies, ADF&G biologist surveys, and local researchers. The lack of dedicated photo-ID, abundance estimates, and tagging studies in the area suggest a lower Data Support score. However, the volume of testimonies from researchers, tour operators, state biologists, and members of the public provide very strong support for a Data Support score of 2.
4.2.4 Spatiotemporal variability indicator
This F-BIA is ephemeral, characterized by a habitat mosaic including coastline areas that have large quantities of suitable habitat for herring spawn, including macrocystis kelp (Macrocystis pyrifera), seagrass, and other seaweeds. Herring spawning locations (and thus gray whale concentrations) within this BIA shift from year to year and within a year, and boundaries have been drawn around the broad area where herring typically spawn and thus where gray whales could occur to feed on eggs. The larger Sitka Sound has been a consistent and large spawning ground for pacific herring for hundreds, if not thousands, of years, according to Tlingit stories and traditional ecological knowledge. Tribal elders say spawn on Kruzof Island in the northern and northwestern part of the BIA boundaries is not historically common and has increased in the past 5-10 years due to fishing pressure. In the mid 2000s to 2010s there were gray whales feeding along the road system of the town of Sitka more frequently. Thus, with rapidly shifting environmental conditions and changes in herring spawning activity being less predictable recently, the entire region can be seen as potential foraging habitat during the spring for gray whales.
4.2.5 Boundary delineation
Boundaries have been drawn around the broad area where herring typically spawn and thus where gray whales may feed on eggs on an annual basis. The larger Sitka Sound has been a consistent and large spawning ground for pacific herring for hundreds, if not thousands, of years, according to Alaska Native (Tlingit) stories and traditional ecological knowledge. Tribal elders say spawn on Kruzof Island in the northern and northwestern part of the BIA boundaries is not historically common and has increased in the past 5-10 years due to fishing pressure. In the mid 2000s to 2010s there were gray whales feeding along the road system of the town of Sitka more frequently. Surveys are only conducted within a limited area, near Sitka Sound, and where local guides, nature enthusiasts, and local researchers can access with relative ease during the time of year that animals are in this region; thus the boundary may not be fully comprehensive in reaching the outer limits of the area in which gray whales feed on herring. With rapidly shifting environmental conditions and changes in herring spawning activity being less predictable recently, this boundary delineation was scored as a 2, to account for uncertainty in spawning locations and thus gray whale foraging occurrence. It is possible gray whales aggregate in other areas feeding on herring eggs during this time, but that they are not captured on opportunistic sightseeing, whale watching, state herring management surveys, or on other marine mammal surveys that are centered around herring spawn and proximity to Sitka. We suggest researchers monitor other areas that herring spawn within Southeast Alaska and the GOA to potentially inform future boundaries and potentially other F-BIAs that focus on herring.
4.3 Example 3 - Sperm whale (Physeter macrocephalus) feeding BIA in the Gulf of Alaska
Importance: 2, Intensity: 2, Data support: 3, Boundary certainty: 2, Spatiotemporal variability: static (s).
4.3.1 Background information
Sperm whales (Physeter macrocephalus) are a cosmopolitan species inhabiting all of the world’s major oceans. Females and calves are thought to inhabit low-latitude equatorial waters while mature males move between higher latitude foraging grounds and return to low latitudes to breed (Best, 1979; Rice, 1989; Whitehead, 2003). While these north-south movements are largely assumed to be seasonal, movement of male sperm whales worldwide has been identified as a major knowledge gap in sperm whale population dynamics (Whitehead, 2003). The GOA is one of these high-latitude feeding grounds, and while it is frequented by sperm whales in the spring, summer, and fall, acoustic data indicate that they are present in the region year-round (Mellinger et al., 2004; Straley et al., 2015; Diogou et al., 2019; Rice et al., 2021). Genetic studies have indicated that the GOA is predominantly used by males (Mesnick et al., 2011).
Sperm whale populations worldwide were severely fragmented and decimated by commercial whaling. Overall abundance is not known, but the size of the population was thought to be reduced from around 1.3 million individuals to approximately 938,000 individuals by the late 1970s due to commercial whaling (Rice, 1989). Whitehead and Shin (2022) estimates the current global population to be 736,053 sperm whales (CV = 0.218). However, no current estimates exist for sperm whale abundance in the North Pacific, or in the GOA (Muto et al., 2021). Straley et al. (2015) estimated an abundance of 150 individuals in one section of the eastern GOA, between Cape Ommaney and Cross Sound (approximately 56.15 N, 134.67 W) from data collected between 2003-2015. A vessel-based standardized line-transect survey conducted in the U.S. Navy’s Temporary Maritime Activities Area (TMAA; 144,560 square km) located east of Kodiak Island from 23 June to 18 July 2013 used visual observers during daytime hours and a 24-hr towed array hydrophone to estimate abundance and density of a variety of marine mammals (Rone et al., 2014). Visual data from photo-ID resulted in an estimated abundance of 296 sperm whales (CV(N) = 0.57). A second abundance estimate of 215 sperm whales (CV(N) = 0.18) was estimated using acoustic localizations from the towed-hydrophone array (Rone et al., 2014).
Sperm whale occurrence and movement is largely impacted by prey resources (Rice, 1989; Watwood et al., 2006). In general, they primarily forage on bathypelagic and mesopelagic prey, at average depths of 200-1,000 m (Rice, 1989; Watwood et al., 2006; Guerra et al., 2017). Worldwide, sperm whales mainly consume cephalopods, though fish are an important part of their diet in some regions (Pike, 1950; Berzin, 1959; Gaskin and Cawthorn, 1967; Kawakami, 1980; Abe and Iwami, 1989; Whitehead, 2003). In the GOA, groundfish (i.e., bottom fish) and squid are the primary prey of sperm whales, and are available year-round in the region (Okutani and Nemoto, 1964; Flinn et al., 2002; Nichol et al., 2002; Wild et al., 2020). Additionally, male sperm whales in the GOA are known to remove sablefish (i.e., black cod, Anoplopoma fimbria) from commercial longline fishing gear, a behavior known as depredation. Prey consumption rates and caloric intake varies between depredating and non-depredating individuals, with acoustic research indicating that depredating sperm whales potentially consume three to four times the caloric intake per unit time as non-depredating whales (Mathias et al., 2012).
4.3.2 Intensity
This F-BIA received an Intensity score of 2 based on the significance of the GOA area to sperm whales in the context of their range and population size. While the GOA is a highly productive feeding area for sperm whales, population size and structure is poorly understood, and their range is expansive with foraging occurring in all portions of their range.
It is unknown what role this feeding area plays to the larger sperm whale population. Based on commercial whaling records, sperm whales are also known to feed in the Bering Sea and Aleutian Islands region, as well as off the British Columbia coast and off the coast of Washington state (Okutani and Nemoto, 1964; Kawakami, 1980). Sperm whales also feed in low-latitude breeding grounds, primarily on cephalopods (Whitehead, 2003).
4.3.3 Data support
The Data Support score was high (3) because of the breadth of data available to analyze movement, foraging ecology, presence, and habitat use in the GOA. There are a wide variety of data available since 2003, including satellite tag, acoustic tag, tissue samples, dietary analysis, photo-ID research, marine mammal survey observations, acoustic detections from towed arrays, sonobuoys, and autonomous recorders, and independent knowledge from commercial fishermen.
Information sources for this BIA included photo-ID records, satellite and acoustic tag records, genetic samples, dietary data from tissue samples, and acoustic recordings. In the eastern GOA, the Southeast Alaska Sperm Whale Avoidance Project (SEASWAP) data include hundreds of hours of photo-ID and field observations from trained researchers (122 individual whales in photo-ID catalog); 35 satellite tag records placed between 2007 and 2017 that had an average deployment period of 45 days; 11 acoustic tag records placed in 2007 and 2009 that yielded 146 hours of acoustic and movement data from a 2-axis accelerometer; 33 tissue samples taken between 2007 and 2018 for dietary analysis; nine tissue samples taken between 2004-2009 used in genetic analysis; thousands of hours of acoustic recordings from autonomous recorders and towed arrays between 2003 and 2019; and hundreds of fishermen testimonials. SEASWAP focuses efforts in the eastern GOA, roughly between Cape Ommaney and Cross Sound (approximately 56.15 N, 134.67 W), with very little dedicated sperm whale research or SMEs working outside of that area in the GOA. However, NOAA collects observational data on sperm whale interactions on both their federal longline sablefish survey and through logbook data with the commercial longline fishing fleet throughout the GOA, Bering Sea, and Aleutian Islands.
Throughout the central and western portions of the GOA, data include 4,586 km of line transects surveyed on an International Whaling Commission Pacific Ocean Whale and Ecosystem Research (IWC-POWER) cruise from mid-July to mid-September 2019, where visual observations of marine mammals were recorded, and 229 sonobuoys were deployed. This cruise resulted in 47 visual observations of sperm whales, no photo-ID or biopsies, and acoustic detection of sperm whales on 52.8% (n=112) of the sonobuoys. In addition to the ICW-POWER cruise, NOAA funded a Collaborative Large Whale Survey (CLaWS) which was conducted from mid-July to mid-September 2015 in the GOA (Rone et al., 2015). The second leg of the survey departed and returned to Kodiak, AK, and encountered sperm whales both visually on line transect surveys and acoustically on sonobuoys. Visually, 3,117 km of line transects were surveyed, with 46 individual sperm whales sighted. Additionally, 191 sonobuoys were deployed, with 107 (56%) detecting sperm whales acoustically. Finally, in 2013 a NOAA-led GOA Line-Transect Survey (GOALS II) was conducted for marine mammal occurrence in the Temporary Maritime Activities Area (TMAA) of the US Navy (Rone et al., 2014). Of the 4,504 km line transects conducted visually, 22 individual sperm whales were sighted. Of the 6,304 km of line-transect effort with towed array hydrophones, there were 241 sperm whale detections acoustically out of 379 total acoustic detections (64%). Out of the 181 sonobuoys deployed, 47 (26%) detected sperm whales (Rone et al., 2014).
4.3.4 Spatiotemporal variability indicator
This F-BIA is static (s), characterized by the continental slope region, a fixed region defined by bathymetry, which is thought to be the primary habitat for sperm whales in the GOA based on whaling records, visual and acoustic surveys, tagging records, and SEASWAP analysis (Thode et al., 2007; Sigler et al., 2008; Ivashchenko et al., 2014b; Rone et al., 2014; Schakner et al., 2014; Straley et al., 2014; Rone et al., 2015; Matsuoka et al., 2020; Wild, unpublished data).
4.3.5 Boundary delineation
This F-BIA covers the entire GOA offshore waters of depths 200-2,000m, which is generally considered the outer continental shelf and the continental slope habitat (Figure 5). This delineation is based on satellite tag records, acoustic data, stable isotope diet analysis, sighting data, and conversations with fishermen, scientists, and fisheries managers finding distributions of sperm whales throughout the GOA across the slope habitat (Thode et al., 2007; Sigler et al., 2008; Schakner et al., 2014; Straley et al., 2014; Wild et al. In Review). Satellite tag data from animals tagged on the shelf edge in the eastern GOA show that tagged whales do not move out into the central GOA or off the shelf edge after tagging (Straley et al., 2014, Wild et al. In Review). Acoustic and visual line transect surveys near Kodiak Island that extended off the shelf edge and into the deep ocean also found that sperm whales were predominantly located over the continental slope habitat (Rone et al., 2014; Rone et al., 2015; Matsuoka et al., 2020; Rice et al., 2021). Matsuoka et al. (2020) noted that sperm whales were widely distributed throughout the GOA on a line transect survey where the water depth was over 1,000 m. Most sightings from fishermen accounts, acoustic moorings, and dedicated vessel-based research trips occurred on the continental slope habitat. Preliminary work using spatial modeling suggests that sperm whales are distributed widely across the GOA slope habitat (Wild et al., In Review). Additional tag work, genetic analysis, and movement modeling could help determine whether the overall BIA should be broken down into smaller areas, or if a hierarchical framework might fit the population better. A majority of the data has been collected in the eastern GOA, and there is a lack of in-depth research in the central and western GOA. Additionally, a majority of sightings are geographically biased because observation effort is primarily on the continental slope, where the fishing activity that funds much of the existing sperm whale research occurs. Thus with high quality data in only one portion of the GOA region, and the other regions needing additional data, the boundary certainty score was determined to be a 2.
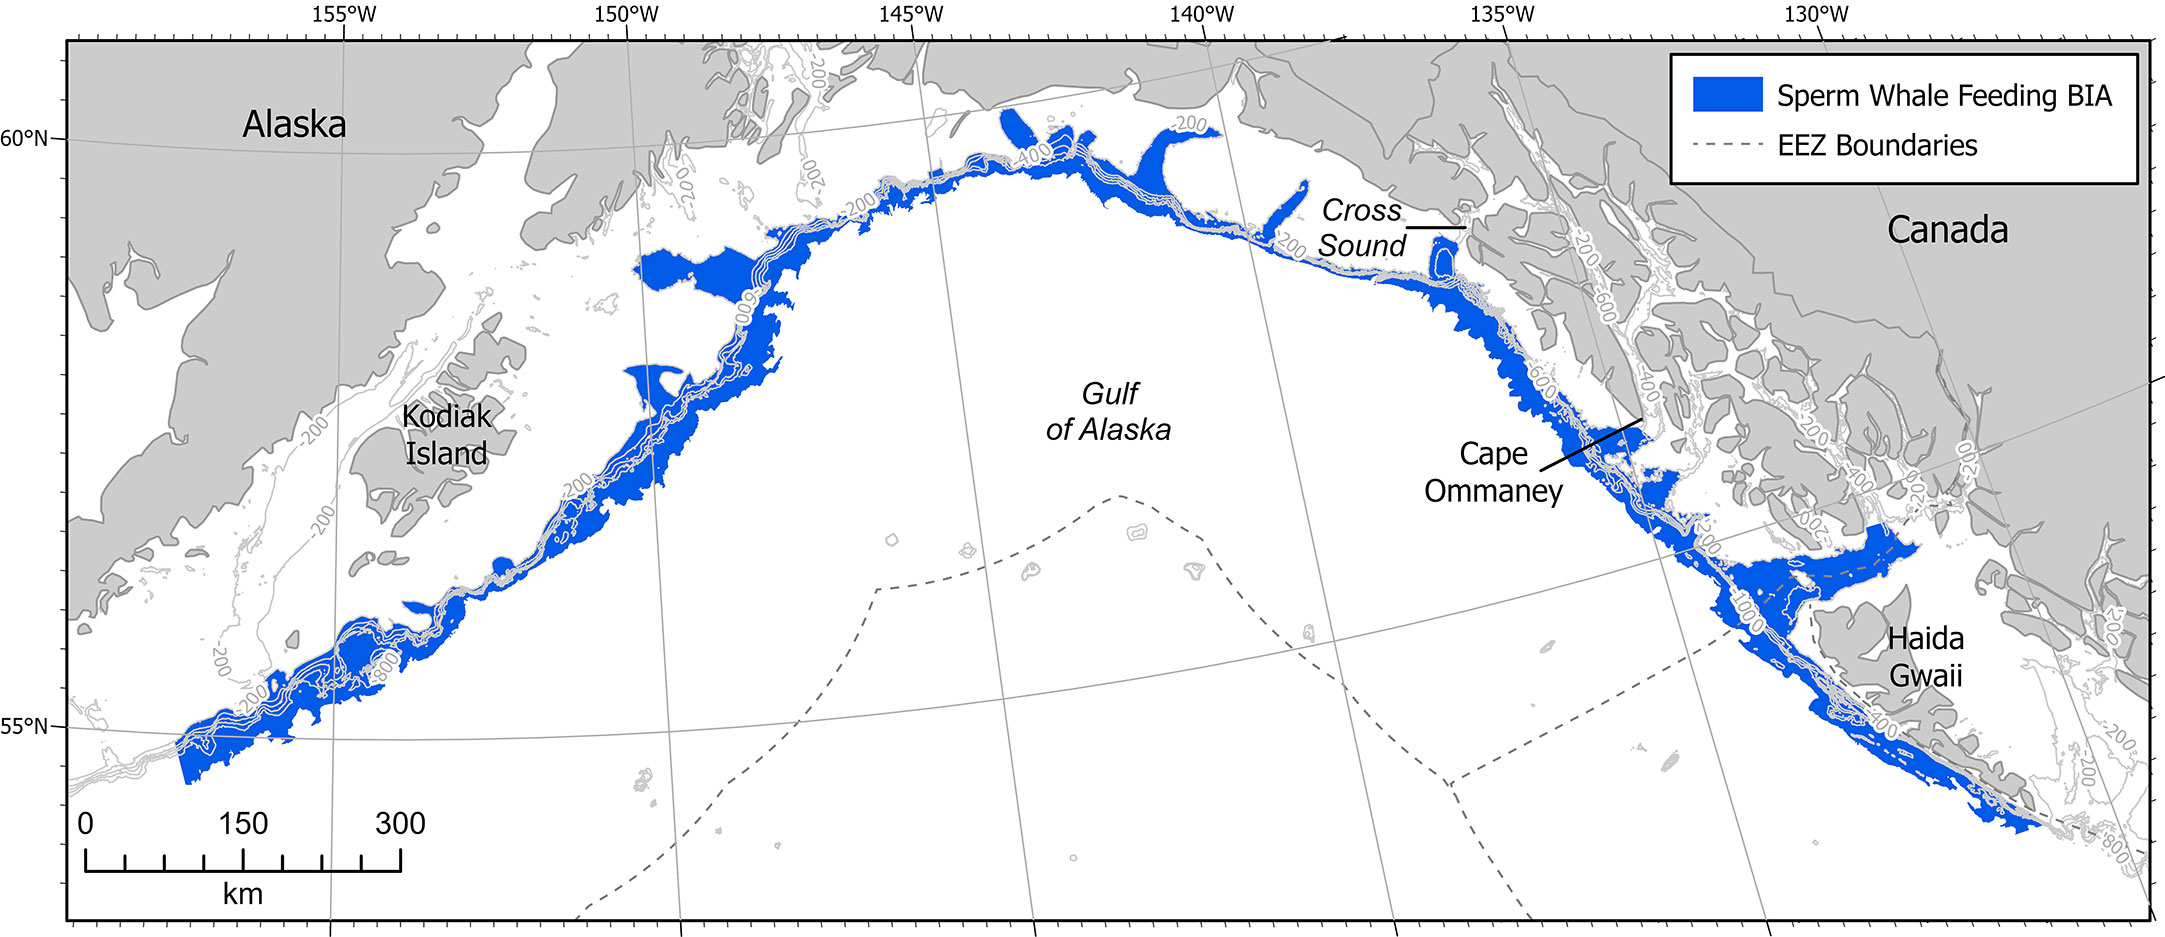
Figure 5 Sperm whale F-BIA in the GOA. Contour lines are at 200m intervals from 200 - 1000 m. EEZ refers to the US Exclusive Economic Zone, defined as 200 nm from shore.
4.4 Example 4 - Humpback whale (Megaptera novaeangliae) feeding BIAs in Southeast Alaska
Importance: 1-3, Intensity: 2-3, Data support: 1-3, Boundary Certainty: 1-3, Spatiotemporal Variability: ephemeral (e).
4.4.1 Background information
In the North Pacific Ocean, humpback whales undergo long-range annual migrations between breeding and feeding grounds. The GOA feeding grounds cover an expansive and remote coastline, with numerous gaps in research and data collection, resulting in uncertainty in the extent of feeding areas within the overall region. Therefore, known feeding areas listed as BIAs may appear fragmented, which could be due to actual breaks between feeding hotspots for humpback whales, and/or simply due to limited knowledge in areas not in close proximity to towns and cities where researchers and tour operators are based. Populations of humpback whales have been designated by breeding rather than feeding areas. In 2016 NOAA delineated 14 distinct population segments (DPSs) for humpback whale breeding areas throughout the world (Federal Register, 2016). Humpback whales from four DPSs (Western North Pacific, Hawaii, Mexico, and Central America) have been documented feeding in the GOA. The Mexico DPS is listed as threatened and both the Central American and the Western North Pacific DPSs are listed as endangered under the U.S. Endangered Species Act; the Hawaii DPS is not listed. Whales from the Hawaii and Mexico DPSs mix on the Southeast Alaskan feeding grounds (Federal Register, 2016) and a very small number of Central American DPS individuals have been identified in SEAK as well (Happywhale, unpublished data).
In SEAK, several SMEs focus efforts on humpback whale research. For the region of SEAK, SMEs considered delineating feeding BIAs in several ways. These included labeling the entire region as one hierarchical BIA with different smaller areas that were active at different times; breaking the entire region into temporal BIAs; and breaking the region into smaller BIAs based on space, time, and primary prey. The consensus was that the best method to use was the latter, breaking the overall region into smaller areas based on temporal, spatial, environmental, and foraging differences. The primary process used to delineate these SEAK BIAs was through meetings with the main SMEs (listed below) in the region, and analyzing data from research databases. During meetings, SMEs identified the primary areas that whales use for foraging, prey that are targeted in each area, months or seasons each area is used, and how each area is separated or distinct from neighboring areas. These were cross-referenced with sighting data from researcher databases and citizen science data. A total of 10 Feeding BIAs were identified in SEAK, with an additional two watch list areas.
4.4.2 Intensity
On SEAK feeding grounds, humpback whales primarily feed on mixed zooplankton (primarily euphausiids) and small schooling fish (e.g., Pacific herring (Clupea pallasii), capelin (Mallotus villosus), and Pacific sand lance (Ammodytes hexapterus)) (Witteveen et al., 2011; Witteveen et al., 2012; Szabo, 2015; Boswell et al., 2016; Moran et al., 2018; Straley et al., 2018). The region attracts thousands of humpback whales to forage each year. Humpback whales are also known to feed elsewhere in the GOA region (e.g., Prince William Sound & Kodiak Island), the Bering Sea and Aleutian Islands region, as well as off of British Columbia and the US West coast.
Humpback whales make long (>5,000 km) seasonal migrations to access these feeding areas, and feeding is believed to be uncommon during the migration to and/or on the low-latitude winter breeding areas. This makes humpback whales highly dependent on foraging success in SEAK and lends itself to increased Intensity scores. However, there are many other feeding areas available within the GOA and other regions (e.g., Bering Sea & Aleutian Islands, as well as the US West Coast and British Columbia coast), which tempers the individual significance or Intensity of a single BIA. Short-term availability of herring in the Sitka Sound Spring BIA, combined with the fact that few other feeding opportunities have been identified in the region at that time (primarily March and April) highlight an increased importance of that feeding area and resulted in a higher Intensity score of 3 for that BIA (Figure 6). While eulachon (Thaleichthys pacificus) in Berners Bay also represents a short-term food source, the score remained a 2 due to the close proximity of other feeding areas at the same time available to humpbacks in the area (Figure 6). Most other BIAs in the region offer a variety of prey types (e.g. Glacier Bay & Icy Strait, Juneau area, S. Lynn Canal & N. Chatham Strait, S. Chatham Strait, Frederick Sound & Stephens Passage, and Southern SEAK) and/or prey that are available elsewhere at the same time (i.e., Sitka Sound Fall, Seymour Canal) and were all scored with an Intensity of 2 (Figure 6).
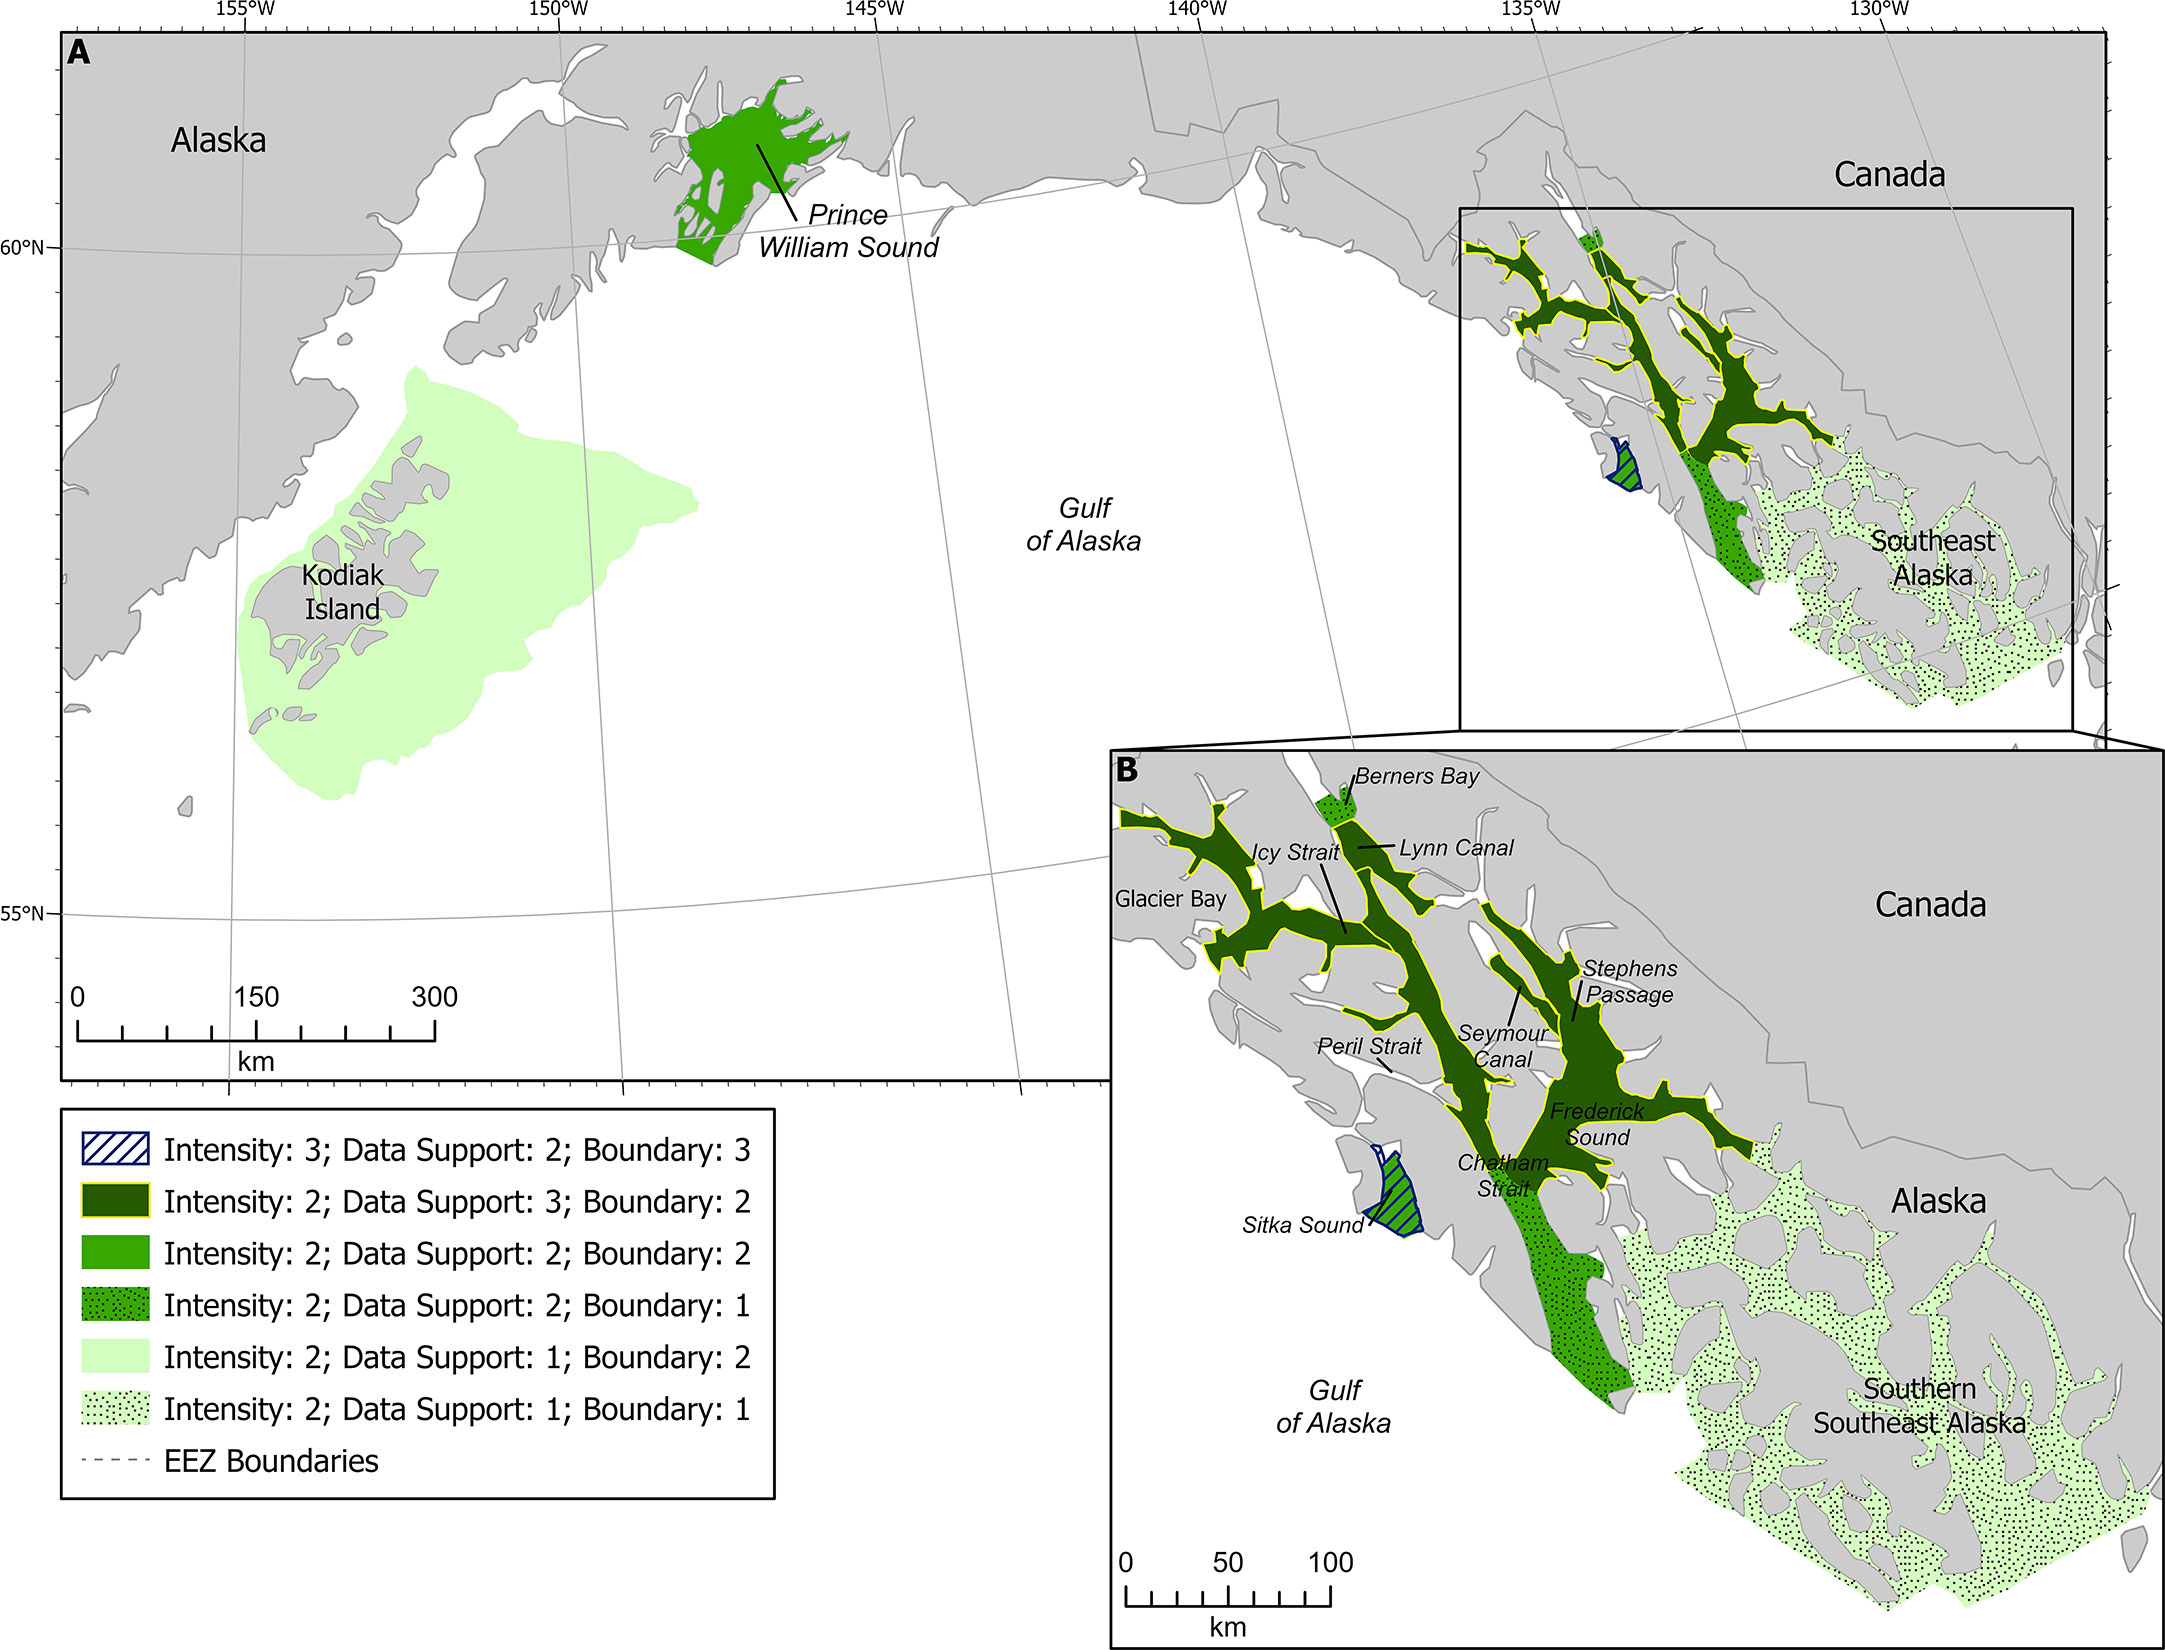
Figure 6 Humpback whale F-BIAs in the GOA (A). Inset (B) shows the SEAK BIAs, shading reflecting data support scores (lighter shades are lower data support and darker shades are higher data support) and patterns reflecting boundary certainty (dots for score of 1, solid for score of 2, and stripes for score of 3).
4.4.3 Data support
Historical information published prior to 2014 was used in BIA I (Ferguson et al., 2015) for SEAK and reviewed for this round of BIA II. However, data collected after 2014 were the focus of this BIA II assessment. Information sources included published works, unpublished reports, raw data, and personal observations and knowledge from SMEs that do extensive work in the region. Long-term datasets exist throughout the region, and within SEAK as a whole a minimum of 54 individual whales have a sighting history of 30 years or more (Gabriele et al., 2022).
The primary data source for humpback whale BIAs in the GOA was the Happywhale photo-ID database (Cheeseman et al., 2017; Cheeseman et al., 2021). Sightings and photos used were contributed by research groups led by Christine Gabriele, Janet Neilson, Jan Straley, Heidi Pearson, John Moran, and Andy Szabo, with permission from researchers. Additional data in Happywhale came from members of the public and were used to enhance the researcher data. The Happywhale database, when accessed on 21 August 2021, contained over 22,000 sightings in SEAK between 2010 and 2021. To reduce the effort bias of sightings collected more consistently in certain areas where researchers are based or with larger human populations, we reduced the entire sighting spreadsheet to one sighting per individual whale per month, resulting in just under 13,000 sightings used in our delineation of BIAs. Heat maps were built from this sighting data to better understand hotspots on a monthly and yearly basis.
In addition to Happywhale, there was limited data available from deep implant satellite tags deployed on humpback whales in Hawai’i and northern SEAK between 1995-2019. These resulted in kernel density home range estimation in a small portion of northern SEAK (Palacios et al., 2019; Palacios et al., 2020). Data from a NOAA-led harbor porpoise survey conducted in July 2019 that transited line transects throughout a majority of major waterways in SEAK and documented observations of humpback whales were also used (Goetz and Zerbini, 2023).
The photographs submitted to Happywhale by members of the public have the potential to provide a wealth of information on abundances and sighting history for individual BIAs within SEAK. However, at the time of this publication, these data were not available in a format conducive to this analysis. The information from Happywhale is valuable, and more in-depth analysis could provide better insight into site fidelity and specific sighting histories of individuals within each of the BIAs in SEAK.
In SEAK, a majority of available humpback whale data were collected in the northern part of the region (from Chatham Strait and Frederick Sound northward, see Figure 6) and from the inside passage, which is a network of marine passages that weave through the islands of SEAK. This geographic bias directly impacted how BIAs were identified and scored. Few data have been collected on the outer coast of the region or offshore waters, except for the Sitka Sound area. Within the southern SEAK region, lack of dedicated research and expert knowledge results in a poor understanding of the areas that are biologically important. A majority of sighting data from Southern SEAK came from citizen contributions, with bias in major waterways that cruise ships and major tour boats transit and near communities and ports from which tour boats come and go. More research needs to be done in southern SEAK and offshore SEAK year-round to understand humpback whale presence, prey preferences, environmental drivers and movement of prey, boundaries of hotspots, and timing of whale presence throughout the region.
Southern SEAK was scored with a Data Support of 1 due to the lack of dedicated researcher data collected in the area (Figure 6). Most of the data available in this area are from community science contributions to Happywhale, which are biased by where tour boats and cruise ships transit. In northern SEAK, data support scores of 3 were given in areas where consistent and systematic surveys were conducted (e.g., Glacier Bay is surveyed five times a week June-Aug, 1-2 days a week in May and September, and opportunistically less than once per week in April and October; the Juneau area is surveyed approximately weekly between May and September) (Figure 6). A Data Support score of 2 was given where there was a variety of data sources and subject matter knowledge, but no consistent weekly or monthly survey activity in the area (e.g., Sitka Sound in the fall). Figure 6 shows each of the BIAs in SEAK with shading representing the different data support scores.
4.4.4 Spatiotemporal variability indicator
All spatiotemporal variability indicators for SEAK BIAs were classified as ephemeral. In this region, the prey are associated with persistent but dynamic features of the ecosystem, such as currents and eddies. Whales are typically found feeding in numerous locations within the BIA at any given time. These “hotspots” appear and disappear seasonally, and are likely based primarily on environmental drivers, such as water temperature, currents, and upwelling that influence the abundance and distribution of prey.
4.4.5 Boundary delineation
Boundary certainty scores in SEAK ranged from 1-3, with most receiving a score of 2 (Figure 6). The lowest score of 1 was given to the Berners Bay and southern SEAK BIAs, due to the uncertainty in how the areas were used and lack of data to solidify boundaries. The lack of dedicated research and expert knowledge in southern SEAK resulted in a poor understanding of how to delineate areas that are biologically important. More research needs to be done in southern SEAK year-round to understand humpback whale presence, prey preferences, environmental drivers and movement of prey, boundaries of hotspots, and timing of whale presence. This region was therefore scored with the caveat that it will likely be delineated into smaller areas when more temporal and spatial data are available. Thus, boundary certainty was scored as 1.
The highest score of 3 was given to the spring BIA for Sitka Sound, where humpback whales forage on herring. For Sitka Sound, there is very detailed information and maps from researchers, community scientists, tribal members, and state fisheries managers who spend hundreds of hours on the water and in the air documenting herring and their predators throughout the time when the BIA is active. The boundaries are defined by consistent herring presence in the same overall area year after year, and thus the SMEs felt the boundaries for the spring BIA in Sitka Sound should be given a higher score than those for the rest of the region.
For the rest of the SEAK feeding BIAs, boundaries were drawn around areas where sightings were most prevalent, and around major confluences of water bodies, with input from SMEs. We also relied on bathymetric features that potentially separate different prey fields, impact whale behavior in those areas, or affect temporal aspects of humpback whale presence. SMEs noted the uncertainty in this method in that the majority of sightings are near the bases for research activities, and that sighting gaps could be due to either lack of effort or lack of humpback whale use.
4.5 Watch list feeding areas
Two areas in this region were labeled as watch list areas (see Harrison et al. submitted to this issue for a description of watch list areas), receiving an importance score of 0 from both Data Support and Intensity scores of 1. The first was for offshore waters in the GOA, where a lack of dedicated research to better understand timing, hotspots, and prey preferences resulted in an inability to define the temporal and spatial boundaries of the area. Historic data between 2002-2005 have shown that humpback whales use offshore waters throughout the GOA (Witteveen et al., 2011). Additionally, anecdotal observations from marine mammal and fisheries surveys within the last 10 years suggests use of offshore areas during the summer months, with expert elicitation indicating humpbacks likely primarily use the edge of the continental shelf between approximately 100-300 m (Straley, unpublished data). While there are likely hotspots along the GOA for offshore habitat use, we do not know where those might be, and thus the boundaries are unknown for this watch list area.
The second watch list area was designated in Peril Strait, a waterway connecting Sitka Sound to the inside passage. This area is transited frequently by personal watercraft, Alaska Marine Highway transportation ferries, and tour vessels; there is some community science data documenting presence of humpback whales, and SMEs believe whales likely spend some time in the area during certain times of the year, but data are so limited that it was not scored with the other BIAs in SEAK.
Increasing the research and survey efforts in these two areas, as well as throughout the entire GOA, would improve our understanding of humpback whale population dynamics and habitat use in both the nearshore and offshore waters of the GOA.
5 Conclusions/recommendations
The BIA II project resulted in delineation of 20 BIAs in the GOA region, including feeding areas for gray, humpback, North Pacific right, and sperm whales; a migratory route for gray whales; and two small and resident populations of beluga whales (Figure 1). This represents an increase from the 14 BIAs identified in the BIA I process (Ferguson et al., 2015) and includes the addition of a scoring system (see Harrison et al. submitted to this issue for details), and temporal and spatial structure to the BIAs, with additional information and data made available since the last effort. Together this process allows a more comprehensive evaluation of the areas used by cetaceans in the GOA for purposes of feeding, migrating, reproducing, and of small and resident populations.
NOAA’s biologically important areas intentionally focus sharply on identifying areas and times in which cetaceans preferentially concentrate for feeding, migrating, and activities related to reproduction, and also the full range of small resident populations. This spatiotemporal information about a species’ ecology is fundamentally important to consider when analyzing impacts to the species from existing or future changes in the ecosystem, including anthropogenic activities. However, comprehensive impact analyses should also consider additional information that was not explicitly incorporated into the BIA delineation and scoring process, such as the presence and intensity of anthropogenic noise and other types of disturbance; and realized or predicted effects of climate change, which may manifest as changes in the spatiotemporal distribution of predators or prey, ultimately affecting cetacean habitat. For example, factors that likely affect the gray whale F-BIA in Sitka Sound include increased predation pressure by killer whales, shifting (or lack of) food availability in other parts of their range, and the recent (2019-present) gray whale unusual mortality event (NOAA Fisheries News Release, 2021). Similarly, the Pacific marine heatwave has contributed to shifts and changes not yet understood in humpback whale feeding areas in the GOA.
Marine heatwaves (periods of extreme warming in the ocean) can last for days to months to years, and can cover thousands of kilometers. These oceanographic events are projected to increase in duration, spatial extent, and intensity due to climate change (Frölicher et al., 2018). The NE Pacific marine heatwave in 2014-2016 had a significant effect on cetacean (e.g., humpback whale and gray whale) population dynamics throughout this region in ways that are still being studied or need to be studied (Arimitsu et al., 2021; Suryan et al., 2021; Gabriele et al., 2022). It will be important to reassess and make changes to these BIAs where necessary at least every 4-5 years, as the effects of climate change increasingly impact marine ecosystems and are cause for significant conservation concern.
The GOA region borders international waters at its southern end along the coast of British Columbia (BC). As a result, there exists a gap in our assessment of BIAs between southern SEAK and the northern US west coast region (see Calambokidis et al., submitted to this issue). While BIAs in Canadian waters may not be of interest to US management organizations, they are important areas to some, if not all, of these species and have ecological implications. For example, there have been sightings of North Pacific right whales consistently off the coast of Haida Gwaii island in BC, and including those waters as a BIA would be biologically relevant and was recommended by SMEs. Additionally, there are thousands of humpback whales that feed along the coast of BC. Many of these individuals move into SEAK waters during the summer, and there is significant overlap between feeding areas for humpback whales in this region. A dedicated effort to explore the population dynamics of cetaceans between BC and SEAK would be extremely beneficial to the BIA effort and cetacean research in general, but was not possible for this round due to time and funding constraints. In the future, BIA work should aim to include BC waters in either the west coast region or the GOA region, whichever is more biologically relevant to each species.
The use of watch list areas is important because they highlight cases that local knowledge suggests may warrant receiving BIA status if additional information becomes available. For example, humpback whale foraging is known to occur in offshore waters in the eastern GOA in the summertime, but data is lacking to pinpoint the spatial extent of this feeding area as well as the spatiotemporal variability. Without dedicated research in offshore waters, the watch list was created based on local and traditional ecological knowledge (TEK). Even with the use of watch list areas, there are still some obvious gaps in knowledge of species assessed in this project, especially the open or offshore GOA waters that have a lack of research and local knowledge. Consistent line transect surveys could provide additional understanding of the cetaceans more comprehensively throughout the GOA. Information on cetacean migratory routes is lacking in the GOA, but this information may be attained through photo-ID efforts and satellite tag deployments.
It is important to note that this BIA assessment was not inclusive of all cetaceans in the GOA. Most notably, we did not include, assess, or score BIAs for Dall’s porpoise (Phocoenoides dalli), Pacific white-sided dolphins (Lagenorhynchus obliquidens), Risso’s dolphin, killer whales, beaked whales (Ziphiidae sp.), minke whales, sei whales (Balaenoptera borealis), or harbor porpoise. Minke whale, killer whale, and harbor porpoise areas were discussed with SMEs at initial meetings, and enough data likely exist to score BIAs for these species within SEAK and PWS at a minimum, but there was not enough time or resources available to gather and analyze the existing data and identify and score these areas. For all other species, there simply was not time or resources available to assess their presence within the GOA area, nor were SMEs aware of enough information available that could be used to score BIAs. It would take a large effort of time and resources to comb through data and adequately assign BIAs to score for the species not included here or to determine if enough data exists to score BIAs for these species by compiling agency reports and tracking down observational data from regional biologists and/or tribal entities. However, given more dedicated time to this project and interviewing potential SMEs across the broad and remote GOA, integrating these species into the next BIA assessment would help to magnify the areas in which data gaps are present and identify whether or not BIAs do exist for all of these species in the GOA region. Overall, our awareness and understanding of BIAs in the GOA region would be strengthened by more research and funding, with BIA assessments updated at least every 4-5 years in order to be useful.
Data availability statement
Publicly available datasets were analyzed in this study. Datasets accessed were: www.happywhale.com and https://www.ncei.noaa.gov/access/metadata/landing-page/bin/iso?id=gov.noaa.nodc:0277244. All other data in the manuscript can be found in the publications cited in the text.
Ethics statement
Ethical review and approval was not required for the animal study because this is a data and literature summary of existing research and knowledge on vertebrate animals. No actual fieldwork or interaction with the animals was done for this manuscript.
Author contributions
LW and HR identified BIAs, compiled information sources, and wrote up the manuscript. HP, CG, JN, AS, JM and JS provided data, consulted, reviewed, and edited the manuscript. SD provided all mapping for the manuscript. All authors contributed to the article and approved the submitted version.
Funding
This work was completed through a collaboration between NOAA and the U.S. Navy to better describe areas and time periods in which cetacean populations are known to concentrate for breeding, feeding, and migration, and areas within which small and resident populations occupy a limited geographic extent.
Acknowledgments
We would like to thank subject matter experts that consulted and spent time helping provide data for this manuscript, specifically Bree Witteveen, Ted Cheeseman (Happywhale), and Olga Von Ziegesar. Sofie Van Parijs, Jolie Harrison, and Megan Ferguson provided comments, edits, and feedback throughout the entire process. Ei Fujioka provided assistance with the BIA online tool, Figure 2, and feedback with regards to creating boundaries, building BIAs, and entering data into the online tool.
Conflict of interest
Author HR was employed by company Integrated Statistics Inc.
The remaining authors declare that the research was conducted in the absence of any commercial or financial relationships that could be construed as a potential conflict of interest.
Publisher’s note
All claims expressed in this article are solely those of the authors and do not necessarily represent those of their affiliated organizations, or those of the publisher, the editors and the reviewers. Any product that may be evaluated in this article, or claim that may be made by its manufacturer, is not guaranteed or endorsed by the publisher.
Supplementary material
The Supplementary Material for this article can be found online at: https://www.frontiersin.org/articles/10.3389/fmars.2023.1134085/full#supplementary-material
References
Abe T., Iwami T. (1989). Notes on fishes from the stomachs of whales taken in the antarctic. Proc. NIPR Symp. Polar Biol. 2, 78–82.
Arimitsu M. L., Piatt J. F., Hatch S., Suryan R. M., Batten S., Bishop M. A., et al. (2021). Heatwave-induced synchrony within forage fish portfolio disrupts energy flow to top pelagic predators. Global Change Biol. 27 (9), 1859–1878. doi: 10.1111/gcb.15556
Berzin A. A. (1959). On the feeding of sperm whales (Physeter catdon) in the bering sea. Bull. Pacific Ocean Sci. Res. Instituted Fisheries Oceanography 47, 9.
Best P. B. (1979). “Social organization in sperm whales, physeter macrocephalus,” in Behavior of marine animals. Eds. Winn H. E., Olla B. L. (Boston, MA: Springer), 227–289.
Boswell K. M., Rieucau G., Vollenweider J. J., Moran J. R., Heintz R. A., Blackburn J. K., et al. (2016). Are spatial and temporal patterns in Lynn canal overwintering pacific herring related to top predator activity? Can. J. @ Fish. Aq. Sci. 73 (9), 1307–1318. doi: 10.1139/cjfas-2015-0192
Braham H. W. (1984). “Distribution and migration of gray whales in Alaska,” in The gray whale, eschrichtius robustus. Eds. Jones M. L., Swartz S. L., Leatherwood S. (New York: Academic Press), 249–266. doi: 10.1016/B978-0-08-092372-7.50017-0
Calambokidis J., Darling J. D., Deecke V., Gearin P., Gosho M., Megill W., et al. (2002). Abundance, range and movements of a feeding aggregation of gray whales (Eschrichtius robustus) from California to southeastern Alaska in 1998. J. @ Cetace Res. Mgmt. 4 (3), 267–276.
Calambokidis J., Laake J., Perez. A. (2017). Updated analysis of abundance and population structure of seasonal gray whales in the Pacific Northwest (International Whaling Commission).
Cavole L. M., Demko A. M., Diner R. E., Giddings A., Koester I., Pagniello C. M., et al. (2016). Biological impacts of the 2013–2015 warm-water anomaly in the northeast pacific: winners, losers, and the future. Oceanography 29 (2), 273–285. Available at: http://www.jstor.org/stable/24862690.
Cheeseman T., Johnson T., Southerland K., Muldavin N. (2017). Happywhale: globalizing marine mammal photo identification via a citizen science web platform (Bled, Slovenia: Scientific Committee of the International Whaling Commission).
Cheeseman T., Southerland K., Park J., Olio M., Flynn K., Calambokidis J., et al. (2021). Advanced image recognition: a fully automated, high-accuracy photo-identification matching system for humpback whales. Mamm. Biol. 102, 1–15. doi: 10.1007/S42991-021-00180-9
Cooke J. G., Taylor B. L., Reeves R., Brownell R. L. Jr. (2018). “Eschrichtius robustus (western subpopulation),” in The IUCN red list of threatened species 2018. doi: 10.2305/IUCN.UK.2018-2.RLTS.T8097A50353881.en
Danner E. M., Kauffman M. J., Brownell J. R.L. (2006). “Industrial whaling in the North Pacific Ocean 1952-1978: spatial patterns of harvest and decline,” in Whales, whaling and ocean ecosystems. Eds. Estes J. A., DeMaster D. P., Doak D. F., Williams T. M., Brownell R. L. (Berkeley, CA: University of California Press), 134–144.
Darling J. D., Keogh K. E., Steeves T. E. (1998). Gray Whale (Eschrichtius robustus) habitat utilization and prey species off Vancouver island, B.C. Mar. Mamm. Sci. 14 (4), 692–720. doi: 10.1111/j.1748-7692.1998.tb00757.x
Diogou N., Palacios D. M., Nystuen J. A., Papathanassiou E., Katsanevakis S., Klinck H. (2019). Sperm whale (Physeter macrocephalus) acoustic ecology at ocean station PAPA in the Gulf of Alaska – part 2: oceanographic drivers of interannual variability. Deep-Sea Res. Part I: Oceanog. Res. Pap. 150, 103044. doi: 10.1016/j.dsr.2019.05.004
Eguchi T., Lang A. R., Weller D. W. (2022). “Abundance and migratory phenology of eastern north pacific gray whales 2021/2022,” in U.S. Department of Commerce, NOAA Technical Memorandum NMFS-SWFSC-668. doi: 10.25923/x88y-8p07
Federal Register (2016). Endangered and threatened species; identifica:on of 14 distinct population segments of the humpback whale (Megaptera novaeangliae) and revision of species-wide listing. (U.S. Natl. Oceanic Atmospheric Administration: Federal Register) 81 (174), 62260–62319.
Ferguson M. C., Curtice C., Harrison J. (2015). Biologically important areas for cetaceans within U.S. waters – Gulf of Alaska region. Aqua. Mamm. 41 (1), 65–78. doi: 10.1578/AM.41.1.2015.39
Ferriss B. E., Zador S. (2021). Ecosystem status report 2021 for the Gulf of Alaska, stock assessment and fishery evaluaAon report (Anchorage, AK: North Pacific Fishery Management Council), 99501.
Flinn R. D., Trites A. W., Gregr E. J. (2002). Diets of fin, sei, and sperm whales in british Columbia: an analysis of commercial whaling records, 1963-1967. Mar. Mamm. Sci. 18 (3), 663–679.
Frölicher T. L., Fischer E. M., Gruber N. (2018). Marine heatwaves under global warming. Nature 560, 360–364. doi: 10.1038/s41586-018-0383-9
Gabriele C. M., Amundson C. L., Neilson J. L., Straley J. M., Baker C. S., Danielson S. L. (2022). Sharp decline in humpback whale (Megaptera novaeangliae) survival and reproductive success in southeastern Alaska during and after the 2014–2016 northeast pacific marine heatwave. Mamm. Biol. 102, 19. doi: 10.1007/s42991-021-00187-2
Gaskin D. E., Cawthorn M. W. (1967). Diet and feeding habits of the sperm whale (Physeter catadon l.) in the cook strait region of new zealand. New Z. J. Mar. Freshw. Res. 1 (2), 156–179.
Goetz K., Zerbini A. (2023) Harbor porpoise (Phocoena phocoena) abundance survey conducted during visual observations from a vessel platform in the coastal waters of southeast alaska by the alaska fisheries science center cetacean assessment and ecology program from 2019-07-19 to 2019-08-12 (NCEI accession 0277244) (NOAA National Centers for Environmental Information. Dataset). Available at: https://www.ncei.noaa.gov/archive/accession/0277244 (Accessed Apr 2023).
Guerra M., Hickmott L., van der Hoop J., Rayment W., Leunissen E., Slooten E., et al. (2017). Diverse foraging strategies by a marine top predator: Sperm whales exploit pelagic and demersal habitats in the kaikōura submarine canyon. Deep Sea Res. Part II: Oceanographic Res. Papers. 128, 98–108.
Ivashchenko Y. V., Brownell R. L. Jr., Clapham. P. J. (2014b). Distribution of soviet catches of sperm whales Physeter macrocephalus in the north pacific. Endanger. Species Res. 25, 249–263. doi: 10.3354/esr00641
Ivashchenko Y. V., Clapham P. J. (2014a). Too much is never enough: the cautionary tale of soviet illegal whaling. Mar. Fish. Rev. 76, 1–21. doi: 10.7755/MFR.76.1_2.1
Laidre K. L., Shelden K. E., Rugh D. J., Mahoney B. (2000). Beluga, delphinapterus leucas, distribution and survey effort in the Gulf of Alaska. Mar. Fish. Rev. 62 (3), 27–36.
Lang A. R. (2010). The population genetics of gray whales (Eschrichtius robustus) in the north pacific (San Diego: University of California), 222.
Lang A. R., Calambokidis J., Scordino J., Pease V. L., Klimek A., Burkanov V. N., et al. (2014). Assessment of genetic structure among eastern north pacific gray whales on their feeding grounds. Mar. Mamm. Sci. 30 (4), 1473–1493. doi: 10.1111/mms.12129
Lang A. R., Taylor B. L., Calambokidis J. C., Pease V. L., Klimek A., Scordino J., et al. (2011). Assessment of stock structure among gray whales utilizing feeding grounds in the Eastern north pacific. (International Whaling Commission).
LeDuc R. G., Weller D. W., Hyde J., Burdin A. M., Rosel P. E., Brownell R. L., et al. (2002). Genetic differences between western and eastern gray whales (Eschrichtius robustus). J. @ Cetace Res. Mgmt. 4, 1–5.
Lucey W. G., Henniger E., Abraham E., O’Corry-Crowe G., Stafford K. M., Castellote M. (2015). Traditional knowledge and historical opportunistic sightings of beluga whales, delphinapterus leucas, in Yakutat Bay, Alaska 1938-2013. Mar. Fish. Rev. 77 (1), 41–46. doi: 10.7755/MFR.77.1.4
Mathias D., Thode A. M., Straley J., Calambokidis J., Schorr G. S., Folkert K. (2012). Acoustic and diving behavior of sperm whales (Physeter macrocephalus) during natural and depredation foraging in the Gulf of Alaska. J. Acoust. Soc Am. 132, 518–532. doi: 10.1121/1.4726005
Matsuoka K., Crance J., Gilpatrick J. W. Jr., Yoshimura I., Okoshi C. (2020). “Cruise report of the 2019 IWC-pacific ocean whale and ecosystem research (IWC-POWER),” in (Virtual Meeting: Report to the Int. Whaling Comm.). paper SC/68B/ASI/20, 59pp.
Mellinger D. K., Stafford K. M., Fox C. G. (2004). Seasonal occurrence of sperm whale (Physeter macrocephalus) sounds in the Gulf of Alaska 1999-2001. Mar. Mamm. Sci. 20, 48–62. doi: 10.1111/j.1748-7692.2004.tb01140.x
Mesnick S. L., Taylor B. L., Archer F. I., Martien K. K., Trevi S. E., Hancock-Hanser B. L., et al. (2011). Sperm whale population structure in the eastern and central north pacific inferred by the use of single-nucleotide polymorphisms, microsatellites and mitochondrial DNA. Mol. Ecol. Res. 11, 278–298. doi: 10.1111/j.1755-0998.2010.02973.x
Moore S. E., Wynne K. M., Kinney J. C., Grebmeier J. M. (2007). Gray Whale occurrence and forage southeast of Kodiak, Island, Alaska. Mar. Mamm. Sci. 23 (2), 419–428. doi: 10.1111/j.1748-7692.2007.00102.x
Moran J. R., Heintz R. A., Straley J. M., Vollenweider J. J. (2018). Regional variation in the intensity of humpback whale predation on pacific herring in the Gulf of Alaska. Deep Sea Res. Part II: Top. Stud. Oceanog. 147, 187–195. doi: 10.1016/j.dsr2.2017.07.010
Muto M. M., Helker V. T., Delean B. J., Young N. C., Freed J. C., Angliss R. P., et al. (2021). Alaska Marine mammal stock assessment. (Seattle, WA, United States: NOAA Tech. Memo. NMFSAFSC-421, 398p. U.S. Dep. Commer., 398.
Nerini M. (1984). A review of gray whale feeding ecology. The gray whale, Eschrichtius robustus, pp.423–450.
Nichol L. M., Gregr E. J., Flinn R., Ford J. K. B., Gurney R., Michaluk L., et al. (2002). British columbia commercial whaling catch data 1908 too 1967: A detailed description of the B.C. historical whaling database. Can. Tech. Rep. Fisheries Aquat. Sci. 2396, Viii + 76.
NOAA Fisheries News Release (2021) 2019-2022 Gray whale unusual mortality event along the West coast and Alaska. Available at: https://www.fisheries.noaa.gov/national/marine-life-distress/2019-2020-gray-whale-unusual-mortality-event-along-west-coast-and (Accessed 7/15/2022).
O’Corry-Crowe G., Ferrer T., Citta J. J., Suydam R., Quakenbush L., Burns J. J., et al. (2021). Genetic history and stock identity of beluga whales in Kotzebue Sound. Polar Res. 40 (S1). doi: 10.33265/polar.v40.7623
O’Corry-Crowe G., Lucey W., Archer F. I., Mahoney B. (2015). The genetic ecology and population origins of the beluga whales, delphinapterus leucas, of yakutat bay. Mar. Fish. Rev. 77 (1), 47–58. doi: 10.7755/MFR.77.1.5
O’Corry-Crowe G., Lucey W., Bonin C., Henniger E., Hobbs R. (2006). “The ecology, status, and stock identity of beluga whales, Delphinapterus leucas, in Yakutat bay, Alaska.,” in Report to Marine Mammal Commission. 4340 East-West Highway, Suite 700. Bethesda Towers, Bethesda, MD 20814.
O’Corry-Crowe G., Lucey W., Castellote M., Stafford K. (2009). “Abundance, habitat use and behavior of beluga whales in yakutat bay, may 2008; as revealed by passive acoustic monitoring, visual observations and photo-ID,” in Report to the national marine fisheries service’s Alaska regional office, 17109 Point Lena Loop Rd., Juneau, AK 99801.
Okutani T., Nemoto T. (1964). Squids as the food of sperm whales in the Bering Sea and alaskan gulf. Sci. Rep. Whales Res. Inst. 18, 111–121.
Palacios D. M., Mate B. R., Baker C. S., Hayslip C. E., Follett T. M., Steel D., et al. (2019). “Tracking north pacific humpback whales to unravel their basin-wide movements. final technical report. prepared for pacific life foundation,” in Marine mammal institute, Oregon state university (Oregon, USA: Newport), 58 pp. Available at: https://ir.library.oregonstate.edu/concern/technical_reports/z890s0924. doi: 10.5399/osu/1117
Palacios D. M., Mate B. R., Baker C. S., Lagerquist B. A., Irvine L. M., Follett T., et al. (2020). “Humpback whale tagging in support of marine mammal monitoring across multiple navy training areas in the pacific ocean: final report for the Hawaiian breeding area in spring 2019, including historical data from previous tagging efforts. prepared for Commander, US pacific fleet, and Commander, naval Sea systems command,” in Naval facilities engineering command southwest (San Diego, California: Cooperative Ecosystem Studies Unit, Department of the Navy Cooperative Agreement), 122 pp.
Pike G. C. (1962). Migration and feeding of the Gray whale (Eschrichtius gibbosus). J. Fish. Board Canada. 19, 815–838. doi: 10.1139/f62-051
Pike G. (1950). Stomach contents of whales caught off the coast of british columbia. Prog. Rep. Pacific Coast. Stations. 83, 27–28.
Rice D. W. (1989). Sperm whale: physeter macrocephalus linnaeu. Handbook of marine mammals 4, 177–233.
Rice A., Širović A., Trickey J. S., Debich A. J., Gottleib R. S., Wiggins S., et al. (2021). Cetacean occurrence in the Gulf of Alaska from long-term passive acoustic monitoring. Mar. Biol. 168, 72. doi: 10.1007/s00227-021-03884-1
Rocha R. C., Clapham P. J., Ivashchenko Y. V. (2014). Emptying the oceans: a summary of industrial whaling catches in the 20th century. Mar. Fish. Rev. 76 (4), 37–48. doi: 10.7755/MFR.76.4.3
Rone B. K., Clapham P. J., Weller D. W., Crance J. L., Lang. A. R. (2015). North pacific right whale visual and acoustic survey in the northwestern Gulf of Alaska. (Bethesda, Maryland: Marine Mammal Commission).
Rone B. K., Douglas A. B., Yack T. M., Zerbini A. N., Norris T. N., Ferguson E., et al. (2014). Final Report for the Gulf of Alaska Line-Transect Survey (GOALS) II: Marine Mammal Occurrence in the Temporary Mari:me Activities Area (TMAA). (Honolulu: Naval Facilities Engineering Command (NAVFAC) Pacific).
Schakner Z. a., Lunsford C., Straley J., Eguchi T., Mesnick S. L. (2014). Using models of social transmission to examine the spread of longline depredation behavior among sperm whales in the Gulf of Alaska. PloS One 9, e109079. doi: 10.1371/journal.pone.0109079
Sigler M. F., Lunsford C. R., Straley J. M., Liddle J. B. (2008). Sperm whale depredation of sablefish longline gear in the northeast pacific ocean. Mar. Mammal Sci. 24, 16–27. doi: 10.1111/j.1748-7692.2007.00149.x
Stabeno P., Bond N., Hermann A., Kachel N., Mordy C., Overland J. (2004). Meteorology and oceanography of the northern Gulf of Alaska. Continental Shelf Res. 24, 859–897. doi: 10.1016/j.csr.2004.02.007
Straley J. M., Moran J. R., Boswell K. M., Vollenweider J. J., Heintz R. A., Quinn T. J. II, et al. (2018). Seasonal presence and potential influence of humpback whales on wintering pacific herring populations in the Gulf of Alaska. Deep Sea Res. Part II: Top. Stud. Oceanog. 147, 173–186. doi: 10.1016/j.dsr2.2017.08.008
Straley J., O’Connell V., Liddle J., Thode A., Wild L., Behnken L., et al. (2015). Southeast Alaska sperm whale avoidance project (SEASWAP): a successful collaboration among scientists and industry to study depredation in alaskan waters. ICES J. @ Mar. Sci. 72, 1598–1609. doi: 10.1093/icesjms/fsv090
Straley J. M., Schorr G. S., Thode A. M., Calambokidis J., Lunsford C., Chenoweth E., et al. (2014). Depredating sperm whales in the Gulf of Alaska: local habitat use and long distance movements across putative population boundaries. Endangered Species Res. 24, 125–135. doi: 10.3354/esr00595
Suryan R. M., Arimitsu M. L., Coletti H. A., Hopcroft R. R., Lindeberg M. R., Barbeaux S. J., et al. (2021). Ecosystem response persists after a prolonged marine heatwave. Nature 11, 6235. doi: 10.1038/s41598-021-83818-5
Szabo A. (2015). Immature euphausiids do not appear to be prey for humpback whales (Megaptera novaeangliae) during spring and summer in southeast Alaska. Mar. Mamm. Sci. 31 (2), 677–687. doi: 10.1111/mms.12183
Thode A. M., Straley J., Tiemann C. O., Folkert K., O’Connell V. (2007). Observations of potential acoustic cues that attract sperm whales to longline fishing in the Gulf of Alaska. J. Acoust. Soc America 122, 1265–1277. doi: 10.1121/1.2749450
Van Parijs S. (2015). Letter of introduction to the biologically important areas issue. Aquat. Mammals. 41, 1–1. doi: 10.1578/AM.41.1.2015.1
Watwood S. L., Miller P. J. O., Johnson M., Madsen P. T., Tyack P. L. (2006). Deep-diving foraging behaviour of sperm whales (Physeter macrocephalus). J. Anim. Ecol. 75 (3), 814–825.
Weingartner T., Eisner L., Eckert G. L., Danielson S. (2009). Southeast Alaska: oceanographic habitats and linkages. J. Biogeogr. 36, 387–400. doi: 10.1111/j.1365-2699.2008.01994.x
Weller D. W., Bettridge S., Brownell R. L. Jr., Laake J. L., Moore J. E., Rosel P. E., et al. (2013). Report of the national marine fisheries service gray whale stock identification workshop. (La Jolla, CA, United States: U.S. Dep. Commer) NOAA Tech. Memo. NMFS-SWFSC-507, 62 p.
Weller D. W., Klimek A., Bradford A. L., Calambokidis J., Lang A. R., Gisborne B., et al. (2012). Movements of gray whales between the western and eastern north pacific. End. Sp. Res. 18, 193–199. doi: 10.3354/esr00447
Whitehead H., Shin M. (2022). Current global population size, post-whaling trend and historical trajectory of sperm whales. Sci. Rep. 12 (1), 1–12. doi: 10.1038/s41598-022-24107-7
Wild L. A., Mueter F. J., Witteveen B. H., Straley J. M. (2020). Exploring variability in the diet of depredating sperm whales in the Gulf of Alaska through stable isotope analysis. R. Soc. Open Sci. 7, 191110. doi: 10.1098/rsos.191110
Witteveen B. H., Straley J. M., Chenoweth E., Baker C. S., Barlow J., Matkin C., et al. (2011). Using movements, genetics and trophic ecology to differentiate inshore from offshore aggregations of humpback whales in the Gulf of Alaska. Endang. Species Res. 14, 217–225. doi: 10.3354/esr00351
Witteveen B. H., Worthy G. A. J., Foy R. J., Wynne K. M. (2012). Modeling the diet of humpback whales: an approach using stable carbon and nitrogen isotopes in a Bayesian mixing model. Mar. Mamm. Sci. 28 (3), E233–E250. doi: 10.1111/j.1748-7692.2011.00508.x
Witteveen B. H., Wynne K. (2016). GAP12: a synthesis of findings (Final comprehensive report, submitted to University of Alaska Fairbanks Alaska Sea Grant program), 1–134. Available at: https://seagrant.uaf.edu/map/gap/reports/GAP-final-report-2016.pdf.
Keywords: feeding area, migration, gray whale, beluga whale, humpback whale, sperm whale, fin whale, North Pacific right whale
Citation: Wild LA, Riley HE, Pearson HC, Gabriele CM, Neilson JL, Szabo A, Moran J, Straley JM and DeLand S (2023) Biologically Important Areas II for cetaceans within U.S. and adjacent waters – Gulf of Alaska Region. Front. Mar. Sci. 10:1134085. doi: 10.3389/fmars.2023.1134085
Received: 29 December 2022; Accepted: 17 April 2023;
Published: 05 May 2023.
Edited by:
Sofie Van Parijs, Northeast Fisheries Science Center (NOAA), United StatesReviewed by:
Ally Rice, University of California, San Diego, United StatesCortney Watt, Fisheries and Oceans Canada (DFO), Canada
Copyright © 2023 Wild, Riley, Pearson, Gabriele, Neilson, Szabo, Moran, Straley and DeLand. This is an open-access article distributed under the terms of the Creative Commons Attribution License (CC BY). The use, distribution or reproduction in other forums is permitted, provided the original author(s) and the copyright owner(s) are credited and that the original publication in this journal is cited, in accordance with accepted academic practice. No use, distribution or reproduction is permitted which does not comply with these terms.
*Correspondence: Lauren A. Wild, lawild@alaska.edu