Phytoplankton dynamics in nearshore regions of the western Antarctic Peninsula in relation to a variable frontal zone in the Gerlache Strait
 Martina Mascioni
 Gastón O. Almandoz1,2
  B. Jack Pan
 Maria Vernet
- 1División Ficología, Facultad de Ciencias Naturales y Museo, Universidad Nacional de La Plata, La Plata, Argentina
- 2Consejo Nacional de Investigaciones Científicas y Técnicas (CONICET), Ciudad Autónoma de Buenos Aires, Argentina
- 3Integrative Oceanography Division, Scripps Institution of Oceanography, University of California San Diego, La Jolla, CA, United States
- 4Jet Propulsion Laboratory, California Institute of Technology, Pasadena, CA, United States
The Gerlache Strait is a narrow channel that separates the western coast of the Antarctic Peninsula (WAP) from the Palmer Archipelago. This area is characterized by the presence of interconnected fjords, bays, islands, and channels that serve as a refuge for megafauna during summer. Through the framework of FjordPhyto – a citizen science collaboration with the International Association of Antarctica Tour Operators (IAATO) vessels – we assessed phytoplankton biomass and composition in surface waters of six under-explored nearshore areas connected to the Gerlache Strait (between 64° and 65° S) during three consecutive seasons, from November to March (2016–2019). During the first two seasons, we found significant differences in the phytoplankton community distribution and successional patterns to the north and south of the sampling area; the greatest differences were evidenced mainly in the months of high biomass, December and January. During December, cryptophytes bloomed in the north, while microplanktonic diatoms dominated in the south, and during January, small centric diatoms dominated in the north, while prasinophytes bloomed in the south. This spatial distinction in phytoplankton communities were mainly associated with the occurrence of a surface thermal front in the Gerlache Strait around 64.5° S. The presence of the front separating warm waters to the north and colder waters to the south, during the months of December to February, was confirmed by the analysis of 10 years of remote sensing data. By contrast, during the third season, low biomass prevailed, and no differences in the phytoplankton composition between the north and south areas were observed. The third season was the coldest of the series, with smaller differences in water temperature north and south of the usual front location. This study shows for the first time a complete overview of the phytoplankton composition throughout the entire growth season (November through March) in the nearshore areas of the WAP between 64° and 65° S. The results of this work contribute to the understanding of the phytoplankton community in relation to small scale physical features during the Antarctic austral summer.
1 Introduction
The Gerlache Strait is a narrow channel about 200 km long that separates the western coast of the Antarctic Peninsula (WAP) from the Palmer Archipelago (between ~63.5° and 65° S). This is a highly productive coastal area with a significant abundance of krill-feeding predators that ultimately rely on phytoplankton (Ducklow et al., 2013). The depth in the Gerlache Strait can reach up to 1,000 m, but it is mainly characterized by the presence of numerous small, interconnected fjords, islands, coves, embayments, and channels (Kerr et al., 2018). The reduced mixing processes characteristic of protected coastal areas favor the development of several phytoplankton blooms of different composition during the spring and summer months (Vernet et al., 1991; Ferrario and Sar, 1992; Rodriguez et al., 2002; Mendes et al., 2018; Costa et al., 2021, among others).
The surface water in the Gerlache Strait is influenced from the south by waters from the Bellingshausen Sea entering the Bismarck Strait and between the islands of the Palmer Archipelago, and by waters from the north by way of the Bransfield Strait – Weddell Sea (García et al., 2002). The main surface circulation pattern within the Gerlache Strait is driven by a current flowing northeastward (Zhou et al., 2002; Su et al., 2022). As a result of air-sea temperature fluxes, including heat advection by currents in the area, a thermal front forms during summer months represented by the 1°C surface isotherm near the Schollaert Channel around 64.5° S (Torres Parra et al., 2020). This front separates colder water to the south from warmer water to the north within the surface mixed layer (Torres Parra op. cit.). Several studies mention these water temperature differences during different years and summer months, December and/or January (Anadón and Estrada, 2002; Rodriguez et al., 2002), and February (Kerr et al., 2018; Mendes et al., 2018; Torres Parra et al., 2020).
Marine fronts are characterized by high biological activity; seabirds and marine mammals tend to congregate and feed in and around the fronts. Frontal regions are also sites of pronounced exchange between deep and surface layers of the ocean (Acha et al., 2015; Chapman et al., 2020). Because the Gerlache Strait front is found during the summer months in the upper mixed layer, it likely has several implications for phytoplankton biology and ecology in the euphotic zone, since phytoplankton are the base of the Antarctic food web. da Cunha et al. (2018) proposed that this front promotes the export of organic carbon produced at the surface to deeper layers, associated with high biological productivity in the area. Concurrently, Mendes et al. (2018) hypothesized that this front separated different phytoplankton communities during February, with cryptophyte dominance to the north of the front in warmer waters and small diatoms and flagellates in colder southern waters. However, few studies investigate the interannual variability or the seasonal development of the front, needed to understand the role such a front can play in determining phytoplankton distribution.
Large summer phytoplankton blooms have been previously reported in the Gerlache Strait, composed by diatoms (Costa et al., 2020), cryptophytes (Ferrario and Sar, 1992; Mendes et al., 2018), and prasinophytes (Pyramimonas sp.) (Bird and Karl, 1991; Rodriguez et al., 2002). However, studies in nearshore environments are scarce and the dynamics between phytoplankton blooms there and the waters of the Strait are poorly understood. A recent study suggests that these coastal areas of central Antarctic Peninsula present blooms of cryptophytes, prasinophytes, and unarmored dinoflagellates, with diatoms being less abundant (Mascioni et al., 2019), however, still dominating the primary production (Mascioni et al., 2021). Diatoms are the main food for Antarctic krill, a key Antarctic species, and any decrease in this group with a replacement by other taxa could represent up to 40%-60% of energy loss in these ecosystems (Moline et al., 2004). Therefore, the study of phytoplankton composition and seasonal dynamics is crucial to understand how the food web in these nearshore areas is sustained as they are important refuge and nesting areas for the megafauna. In order to understand the phytoplankton communities of the nearshore WAP areas and the influence of the surface thermal front of the Gerlache Strait on them, we assessed surface phytoplankton biomass, cell abundance, composition, and succession through the summer months (November to March) of the growth season.
1.2 Brief description of the study area
Sampling opportunities available to FjordPhyto depended on locations visited by the International Association of Antarctica Tour Operators (IAATO) expedition vessels. In this study we present results from stations visited throughout the austral summer, in six nearshore areas of the WAP between 64° and 65° S that generated a time series (Figure 1). We clustered those areas according to the estimated front location (64.5°S by Torres Parra et al., 2020) into northern areas (2 sites): Cierva Cove and Wilhelmina Bay; and southern areas (4 sites): Cuverville and Danco Islands, Neko Habor, and Paradise Bay.
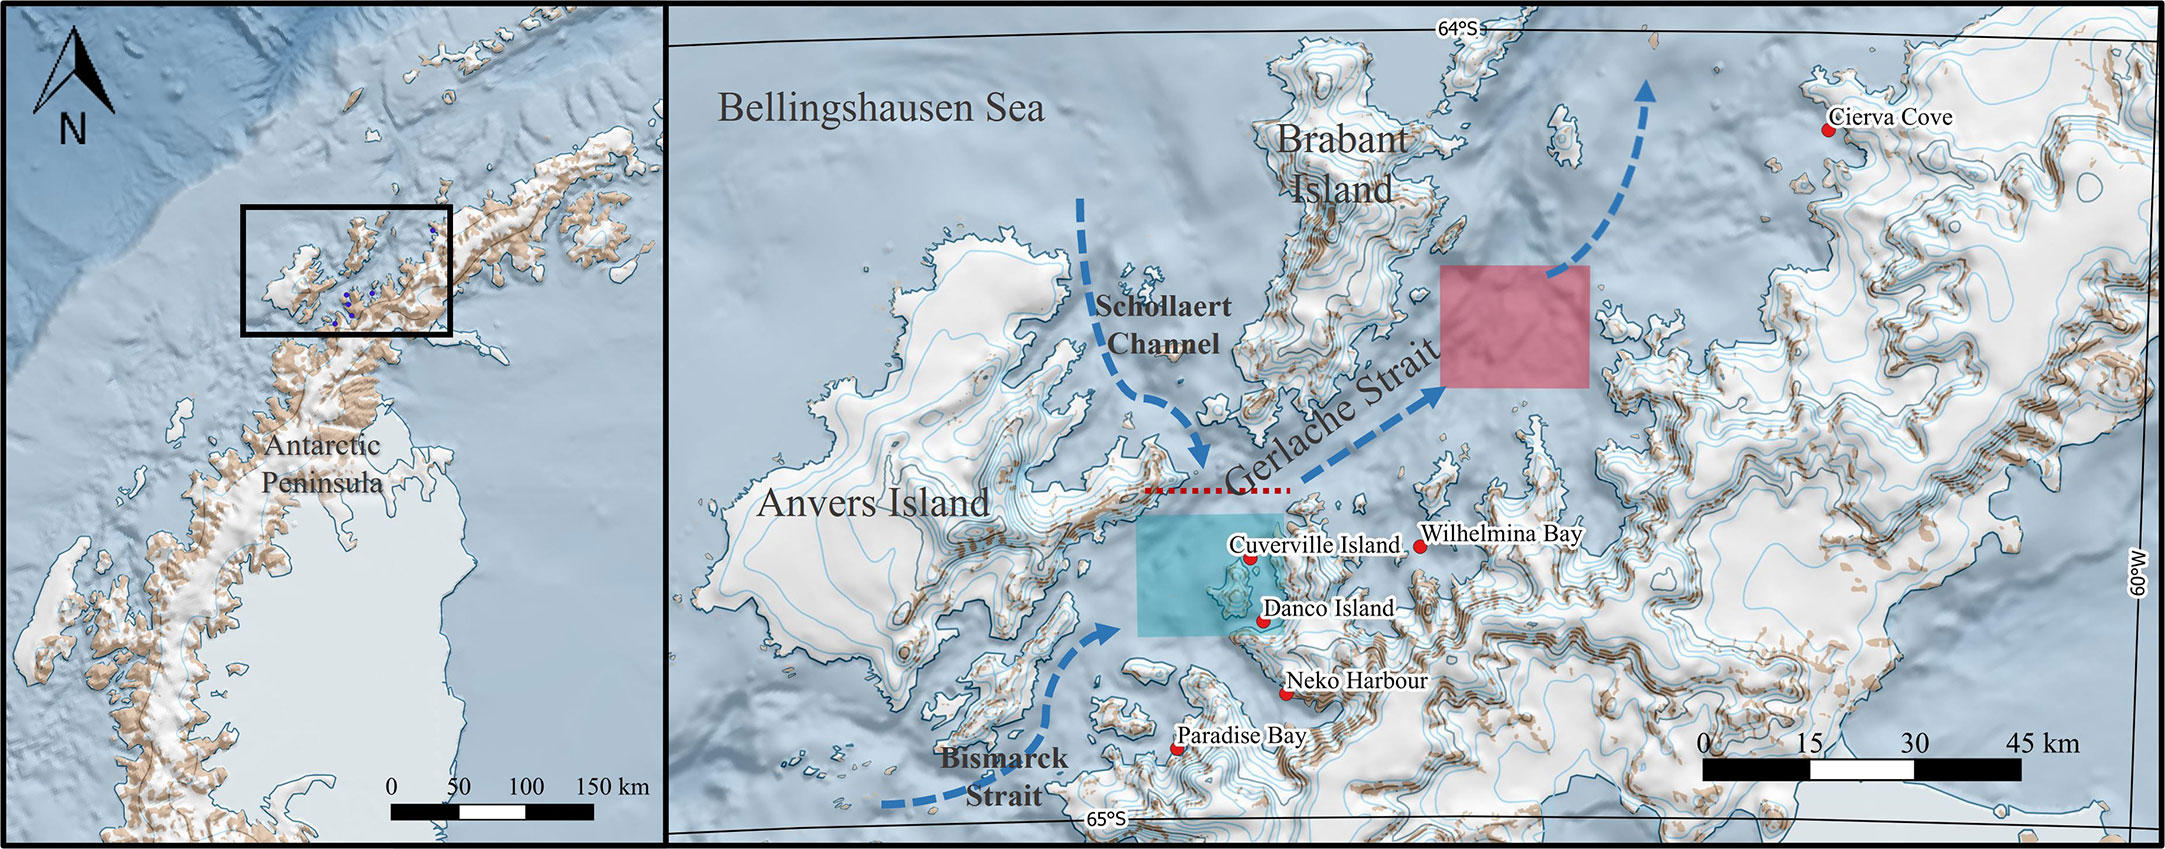
Figure 1 Map showing the six sampling sites on the WAP coast between 64° and 65° S. The front is marked with a red dashed line at the location proposed from observations in previous studies (i.e., around 64.5° S, Torres Parra et al., 2020). The areas are clustered to the estimated front location into northern areas (2 sites): Cierva Cove and Wilhelmina Bay; and southern areas (4 sites): Cuverville and Danco Islands, Neko Harbor, and Paradise Bay. The blue arrows show the directions of surface currents. The squares show where satellite data was extracted from the northern region (red) and southern region (light-blue) of the Gerlache Strait.
Cierva Cove is an embayment located in the Danco Coast (64° 7.41’ S – 60° 56.79’ W, Figure 1), connected with the northern Gerlache Strait. It is close to a Specially Protected Antarctic Area, (ASPA N° 134) “Punta Cierva and littoral islands, Danco Coast, Antarctic Peninsula”, proposed and under the conservation of Argentina (Pertierra and Hughes, 2013). Numerous bird species nest in this area, and large mammals feed and search for refuge there. On its coast, three glaciers, Sikorsky, Breguet, and Gregory discharge together and are stable according to Seehaus et al. (2018).
Wilhelmina Bay is a large embayment with an area of ~600 km2 placed in the Danco Coast (64° 39.41’ S – 62° 8.14’ W, Figure 1). The mean depth of the channel is ~300 m while the deepest depth is over 600 m (Espinasse et al., 2012). Nine glaciers discharge from its coast (Woodbury, Montgolfier, Rozier, Blanchard, DGC25, Leonardo, DGC23, Bayly, and DGC31), and according to Seehaus et al. (2018) more than 60% of them are in retreat.
Both Danco and Cuverville Islands are located within the Errera Channel, that separates the Rongé Island from the west coast of the Antarctic Peninsula (Figure 1). Danco Island is at the southern side of the channel (64° 45.03’ S – 62° 36.19’ W) while Cuverville island is at the northern side of the channel (64° 40.2’ S – 62° 38.4’ W). In the summer, the islands serve as a refuge for the largest colony of gentoo penguin in the WAP (Lynch et al., 2010). These areas only have three glaciers nearby without any direct glacial discharge in the area (Deville, Orel Ice Fringe, and Wheatstone glaciers, Ferrigno et al., 2006)
Neko Harbor is located in the northeast coast of Andvord Bay (64° 50.57’ S – 62° 33.22’ W, Figure 1). Five glaciers discharge in this fjord (Bagshawe, Grubb, Arago, Moser, and Rudolph), and none of them are currently retreating (Seehaus et al., 2018; Lundesgaard et al., 2020).
Paradise Bay is a wide embayment behind Lemaire and Bryde Islands (64° 54.66’ S – 62° 51.94’ W, Figure 1). It has six glaciers discharging from its coast (Toro Mazote, Vivallos, Astudillo, Avalanche, Petzval or Suárez, and Miethe), there is no recent study that assesses their current state of these glaciers.
2 Materials and methods
2.1 Sampling
Phytoplankton sampling was conducted according protocols established for the Citizen Science project, FjordPhyto (www.fjordphyto.org, Cusick et al., 2020) and explained in this section. Sampling took place from November through March in 2016-2017 (from now on season 1 or S1), 2017-2018 (season 2 or S2), and 2018-2019 (season 3 or S3) aboard multiple tour expedition vessels in the six nearshore areas depicted in Figure 1 (for more information see Supplementary Table 1). Surface samples were collected aboard small inflatable boats by submerging 120-mL bottles in the water by hand to approximately 25 cm depth, to avoid sampling the superficial layer. Subsequently, samples were fixed with Lugol’s solution at 4% (Edler and Elbrächter, 2010) and kept in a cool dark location. Expedition ship staff (i.e., polar expedition guides) received in-person training from FjordPhyto project researchers on appropriate sampling methods before the start of each season (Cusick et al., 2020). At the end of the season, samples were sent to the lab at División Ficología in Facultad de Ciencias Naturales y Museo (Universidad Nacional de La Plata, Argentina) for analysis.
2.2 Microscopy analysis
A total of 143 samples from the six areas were analyzed, from three consecutive austral summers: 2016-2017 (n = 31, included in Mascioni et al., 2019), 2017-2018 (n = 51), and 2018-2019 (n = 61). Cell counts were performed according to Utermöhl (1958) using an inverted optical microscope Leica DMIL LED and an Iroscope SI-PH. Subsamples of 50 mL were left to settle for 24 h in a composite sedimentation chamber. At least 100 cells of the dominant taxa were counted at the maximum amplification (400X) (Lund et al., 1958). The whole chamber bottom was also scanned at 200X to count large and sparse species. Five main phytoplankton groups were considered: cryptophytes, prasinophytes, small unidentified flagellates < 5 µm (referred herein as small flagellates), diatoms, and autotrophic dinoflagellates (dinoflagellates herein). The differentiation between autotrophic and heterotrophic dinoflagellate taxa was made by observation of chloroplasts, although in cases where these could not be observed, the literature was consulted to determine the feeding type of the different taxa.
Biomass (carbon content) of cells was also estimated following Menden-Deuer and Lessard (2000), calculating cell biovolumes by approximation to the nearest geometric shapes as proposed by Hillebrand et al. (1999) and Sun and Liu (2003). The size, shape, biovolume, and cell biomass of the main taxa included in this study can be found in Supplementary Table 2.
2.3 Satellite data
MODIS-Aqua level 3 remotely sensed Sea Surface Temperature (SST) data from 2011 to 2021 were retrieved from the NASA Ocean Biology Distributed Active Archive Center (DOI: 10.5067/AQUA/MODIS/L3M/RRS/2018); more detailed analyses focused on 2016-2017, 2017-2018, and 2018-2019. Satellite SST data was extracted from two places north and south of the estimated front location (64.5°S, Figure 1) in order to confirm temperature differences (satellite SST data can be found in Supplementary Table 3). Data were analyzed with geemap (Wu, 2020), a Python package for interactive mapping with Google Earth Engine (GEE). MODIS-Aqua level 3 SST dataset was compiled and visualized in GEE using its NASA/OCEANDATA/MODIS-Aqua/L3SMI image collection (DOI: 10.5067/AQUA/MODIS/L3M/RRS/2018).
2.4 Statistical analysis
In order to assess differences between the northern and southern areas of the Strait, we performed a non-metric multidimensional scaling analysis (NMDS). NMDS was calculated on Bray-Curtis dissimilarities retrieved from the relative biomass of phytoplankton taxa per station using vegan package (Oksanen, 2015). Samples from December, January, and February were considered for this analysis (n = 114), because these were the months when we observed the thermal gradient (see Results). Difference among NMDS groups were tested by applying ANOSIM (ANalysis Of SIMilarities) to the resulting dissimilarity matrix using vegan package. All the statistical analyses were performed in R and Rstudio (R Core Team, 2021).
3 Results
3.1 A thermal gradient in the Gerlache Strait
Through an analysis of 10 years of remote sensing data, we detected a consistent North-South temperature gradient during mid-summer (December - February) with warm waters to the north and colder waters to the south (Figure 2A). Although the transition line of the thermal front is diffuse and hardly detectable with these images, the observed thermal gradient is attributed to the presence of a frontal zone, previously identified by field measurements (Torres Parra et al., 2020). The thermal gradient was evident during the three seasons included in our study (Figures 2B–D). In addition to the temperature gradient observed, a cooling pattern can be observed within the three seasons sampled (Figures 2B–D), where S1 (Figure 2B) is the warmest and S3 (Figure 2D) the coldest.
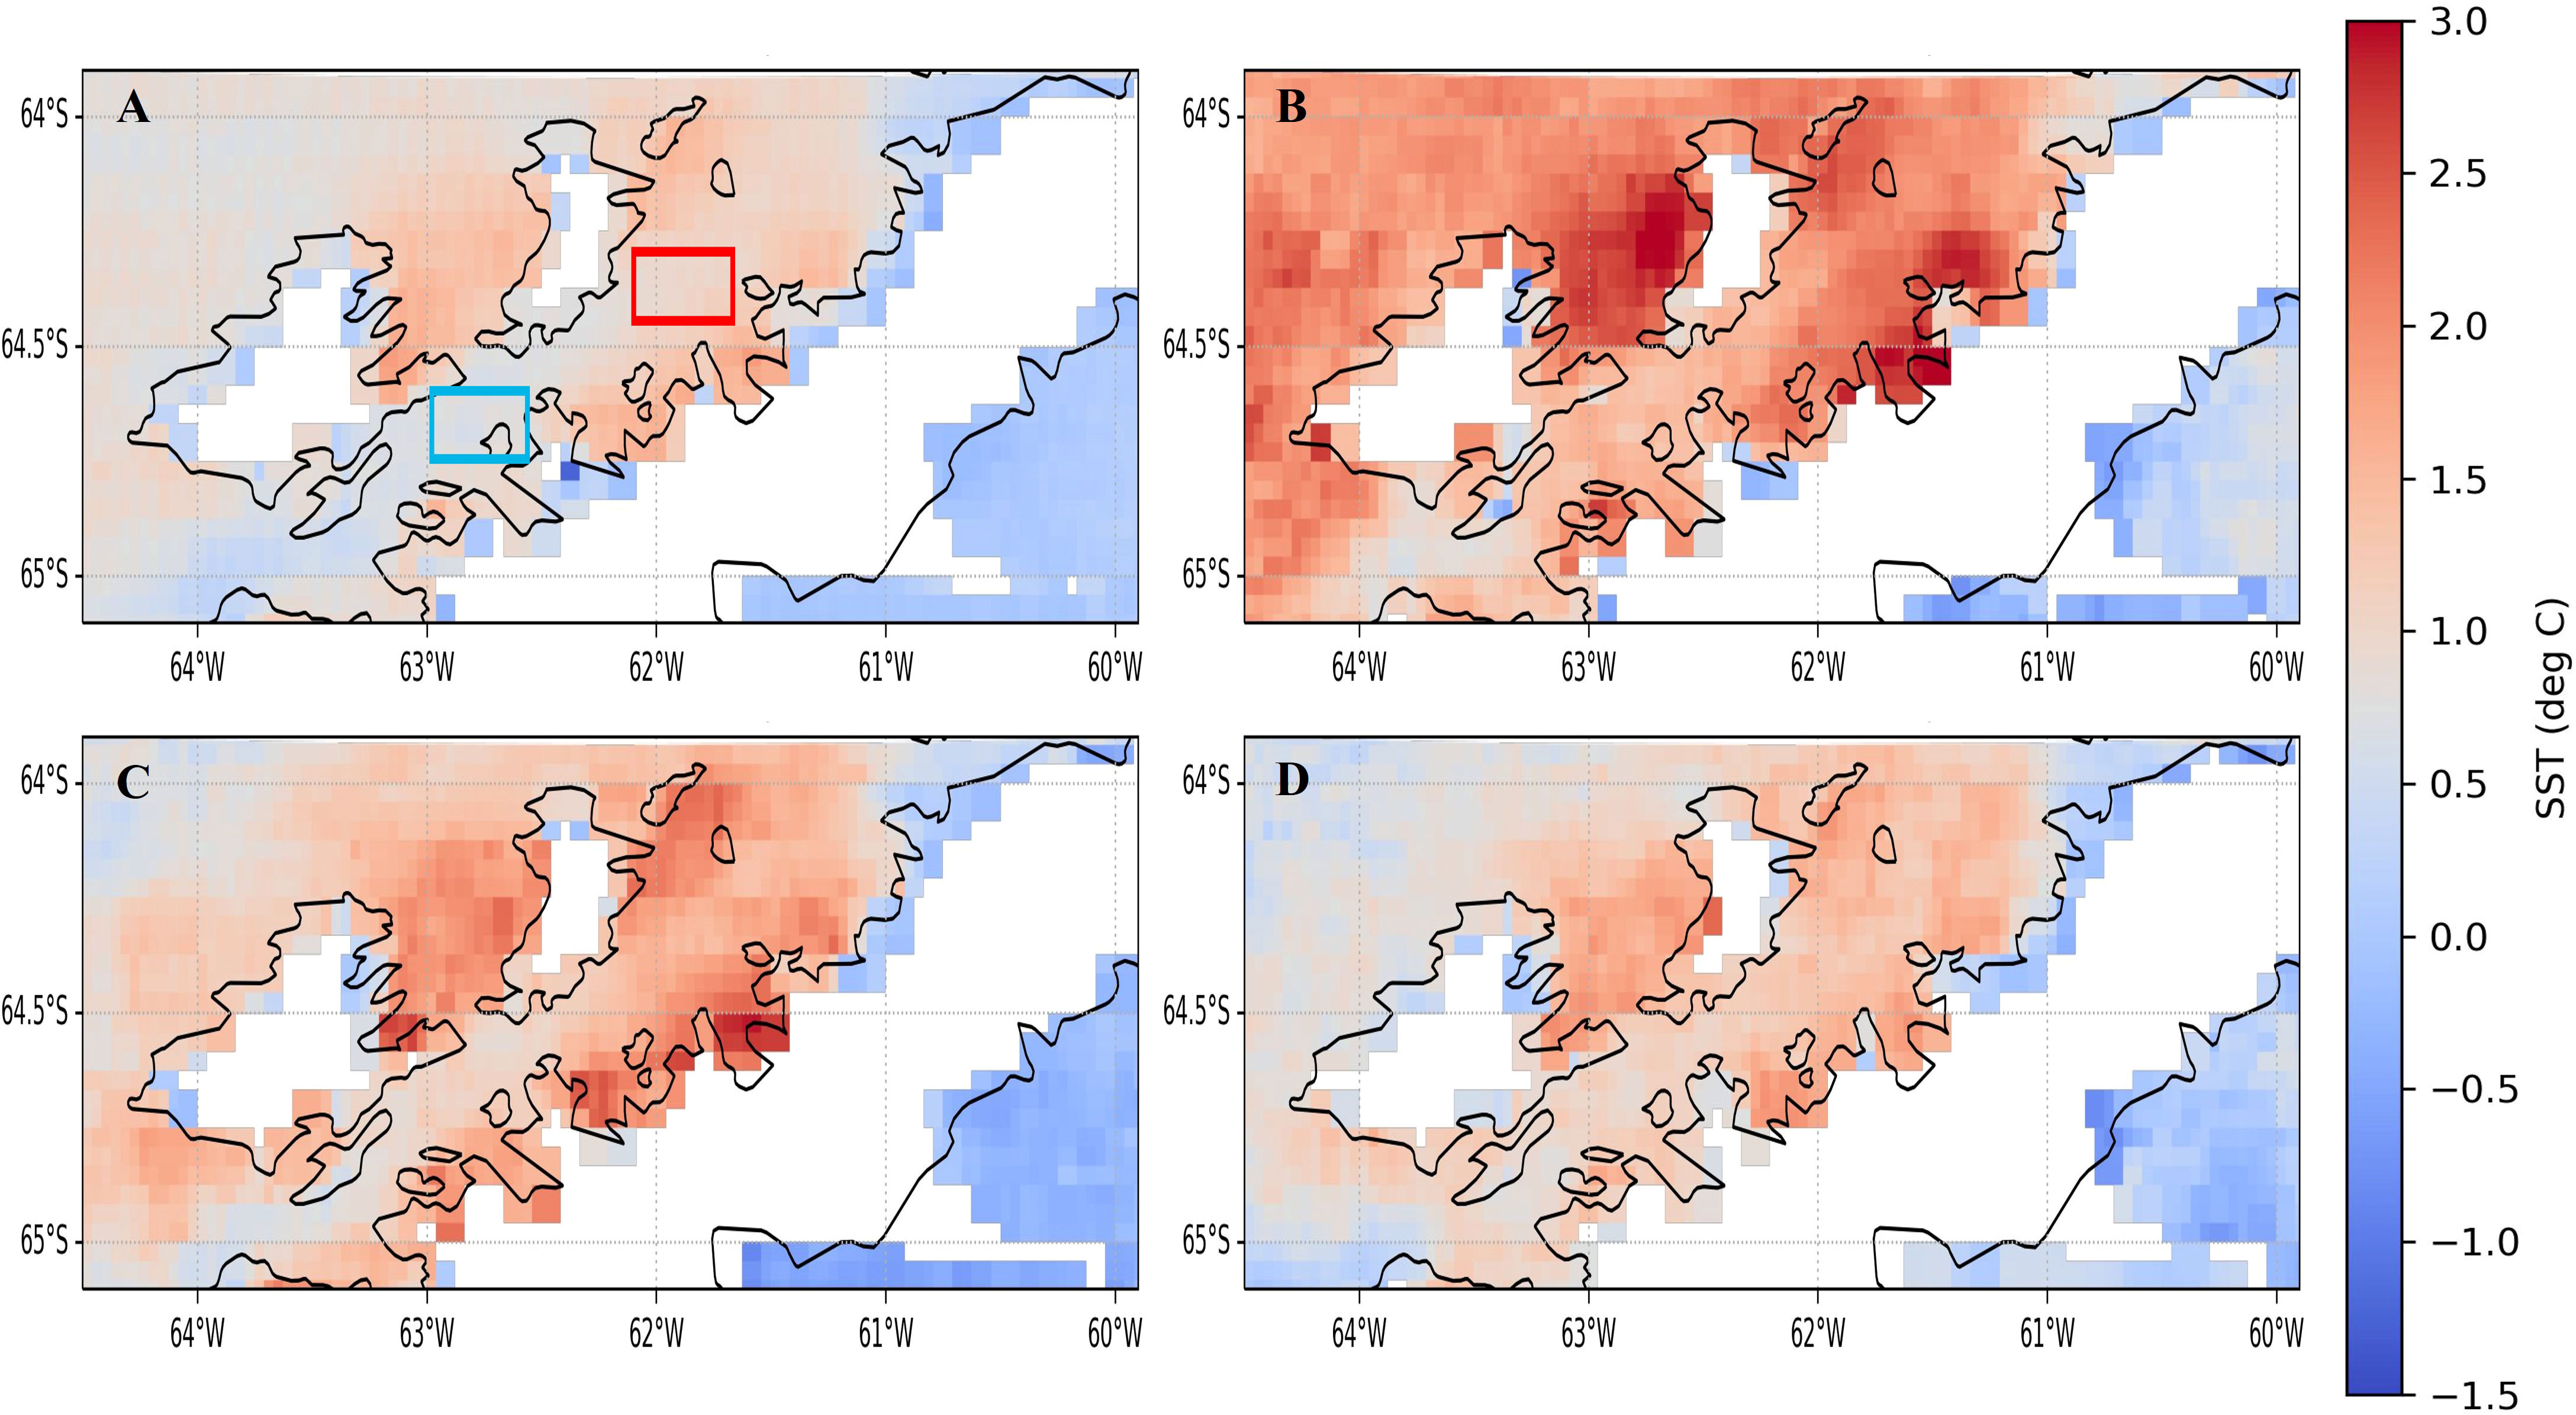
Figure 2 Sea surface temperature (SST) average maps created with Aqua/MODIS data for consecutive summers (December-February): (A) decadal observations, 2011-2021, (B) S1, 2016-2017, (C) S2, 2017-2018, and (D) S3, 2018-2019. December-February were chosen for SST data coverage because they coincide with the growth season and also due to clouds and light availability. In panel A the squares show where satellite data was extracted and averaged to characterize northern (red) and southern (light-blue) Gerlache Strait SST.
In order to verify the presence of a front, we extracted SST from remote sensing in northern and southern Gerlache Strait (see position in Figures 1, 2A). When plotted these data for the spring-summer months (November to March) for the three sampled seasons, we observed differences in the average temperatures in northern and southern Gerlache Strait, which differ by up to 1°C during January but are lower in November and March (Figure 3). During S3, differences in temperature averages were smaller than in previous years, particularly in December when no difference was detected (Figure 3). During this season a delay in the front development was observed, with, differences still greater than 0.5°C in January and February (Figure 3), as defined by Torres Parra et al. (2020).
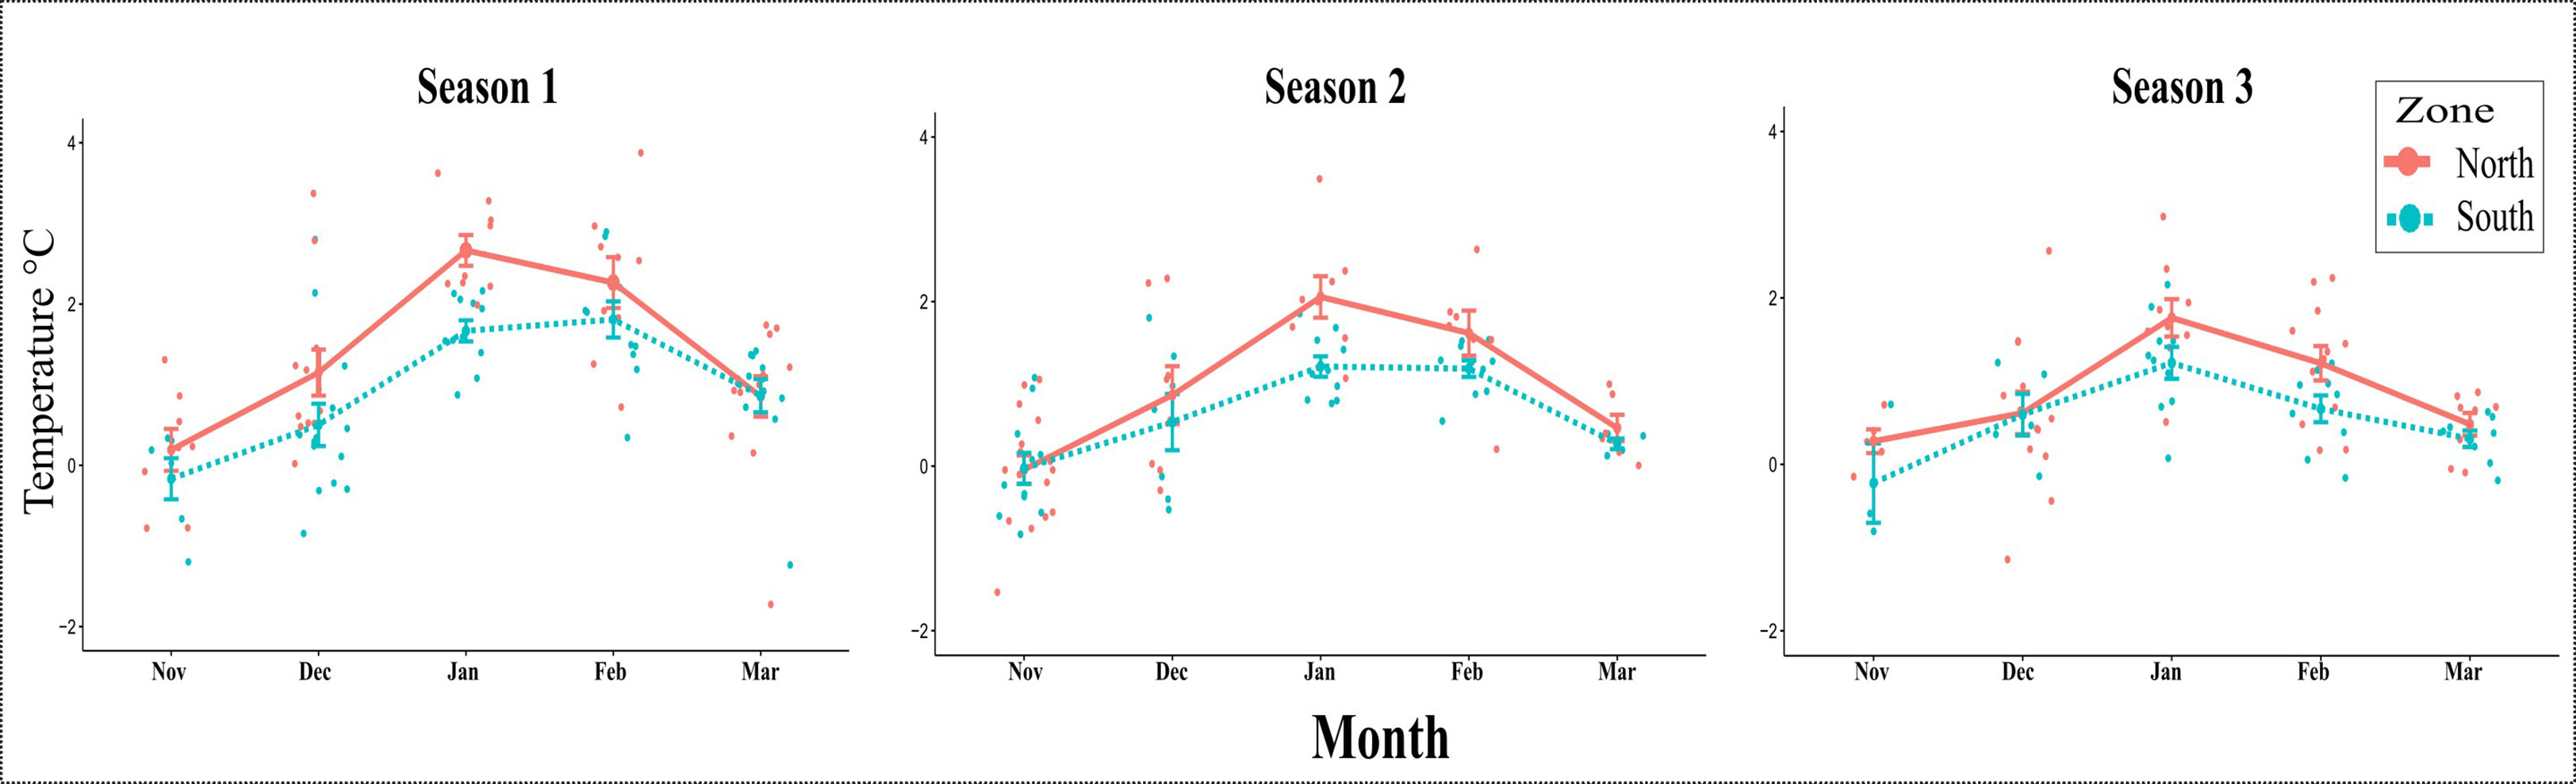
Figure 3 Sea surface temperature (SST): average and standard deviation for the three consecutive summers from November to March (northern region in red and southern region in light-blue). Satellite data extracted from two places in northern and southern Gerlache Strait according to squares shown in Figures 1, 2A.
3.2 Phytoplankton variability in the Gerlache Strait nearshore region
3.2.1 Interannual and spatial variability in phytoplankton biomass and cell abundance
Biomass and cell abundance showed high interannual variability with different patterns between zones (i.e., north vs south, Figure 4). During the first two seasons, total biomass for the northern and southern zones were similar in the months of low abundance (i.e., November and February), but were notably higher in the southern zone during the summer months (i.e., December and January). In the northern zone, maximum biomass was found in December (113.5 µgC L-1 in S1 and 16.8 µgC L-1 in S2) with biomass in January similar to the ones in December (up to 79.8 µgC L-1 in S1 and 15.3 µgC L-1 in S2). In the southern zone, phytoplankton biomass increased (>50 μgC L-1) during December and January, with peaks up to 1,687 μgC L-1 and 800 μgC L-1 during S1 and S2, respectively (the first value is off scale and not shown in Figure 4) with a marked decrease in February, and a slight increase in cell abundance in March (Figure 4). During S3, the average cell abundance and biomass to the north and south of the front were quite similar and did not resemble those of previous years, with biomass markedly low overall. The seasonal progression was maintained, with minimum values in November, a slight increase in December and January, followed by a maximum peak of abundance in February, and a final decrease in March (in the southern zone).
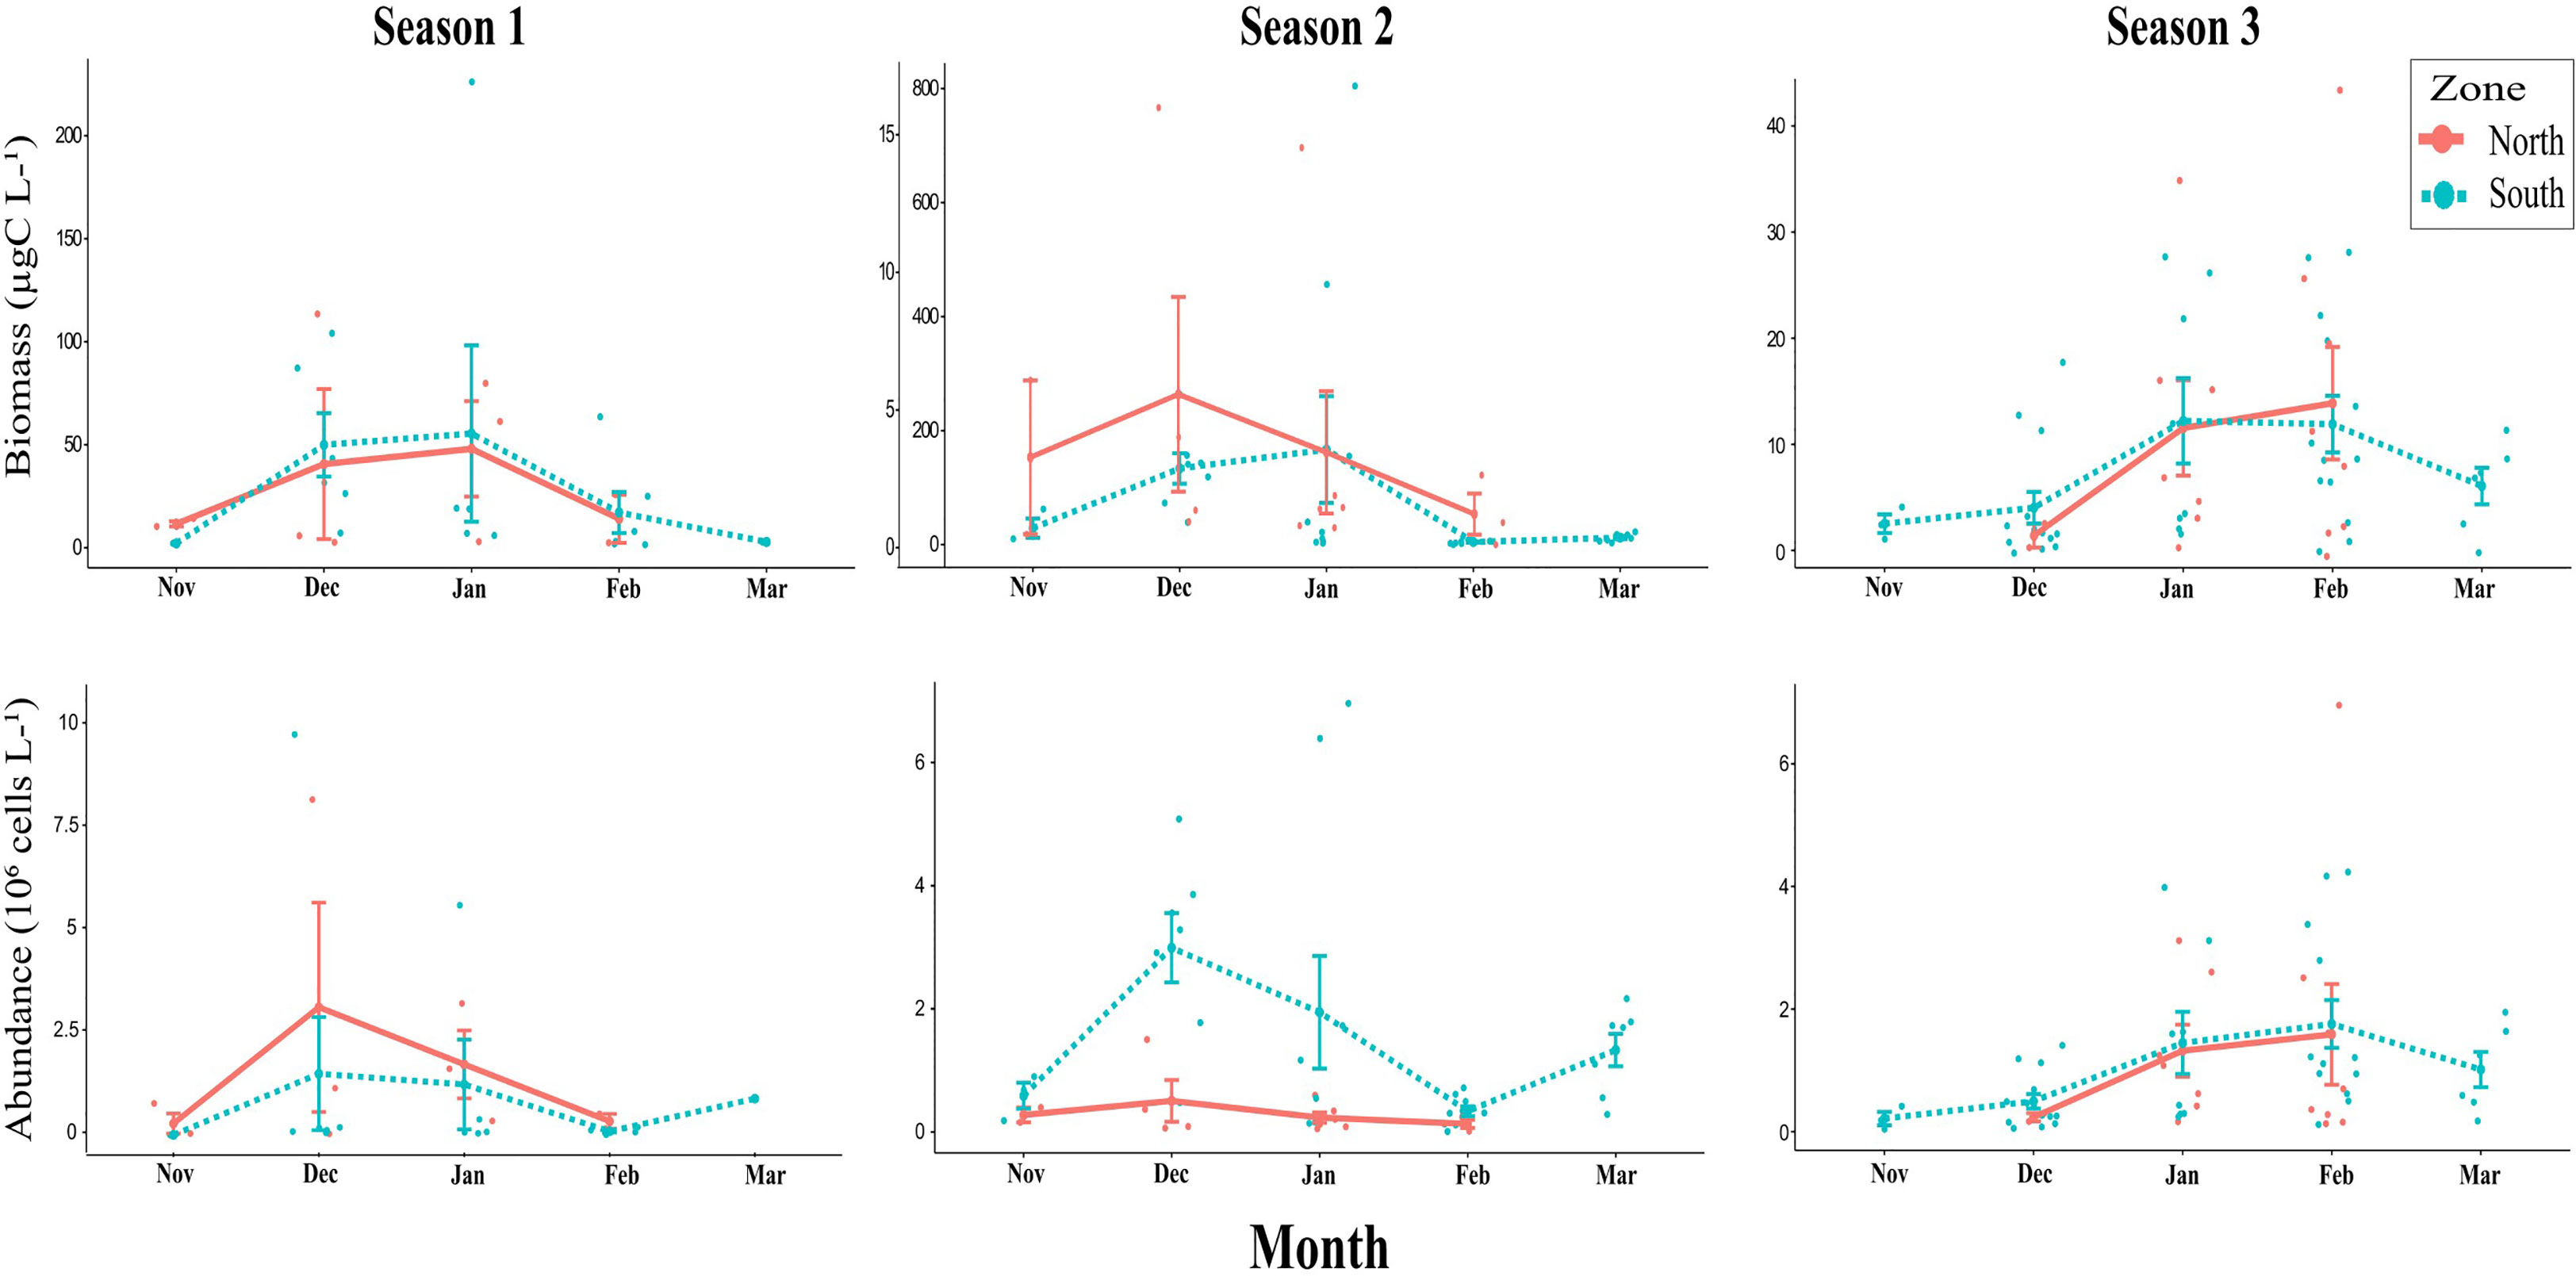
Figure 4 Biomass (µgC L-1) and abundance (cells L-1): monthly averages and standard deviation for the three consecutive summers from November to March in North and South zones, the exact values are depicted by colored points. Note that the y axes values varied between years and that biomass in Season 2 has two different y axes, the one to the left for the northern zone and the right one for the southern zone.
We found a close relationship between total biomass and phytoplankton composition. In the northern sites sampled, consistently over the three seasons, small flagellates and cryptophytes were the most important groups in term of cell abundance, representing on average 44.7%–58.0% and 26.3%–42.2% of total phytoplankton respectively (Table 1). In terms of biomass, cryptophytes and diatoms were equally important, representing on average 31.6%–49.6% and 26.9%–49.0% of total phytoplankton biomass, respectively (Table 1). Each summer, cryptophytes dominated the blooms, which were repeatedly observed in Wilhelmina Bay, in December during S1 (6.4 x 10⁶ cells L-1 and 97.5 µgC L-1), in December during S2 (1.5 x 10⁶ cells L-1 and 16.8 µgC L-1), and in February during S3 (7 x 10⁶ cells L-1 and 42.3 µgC L-1).
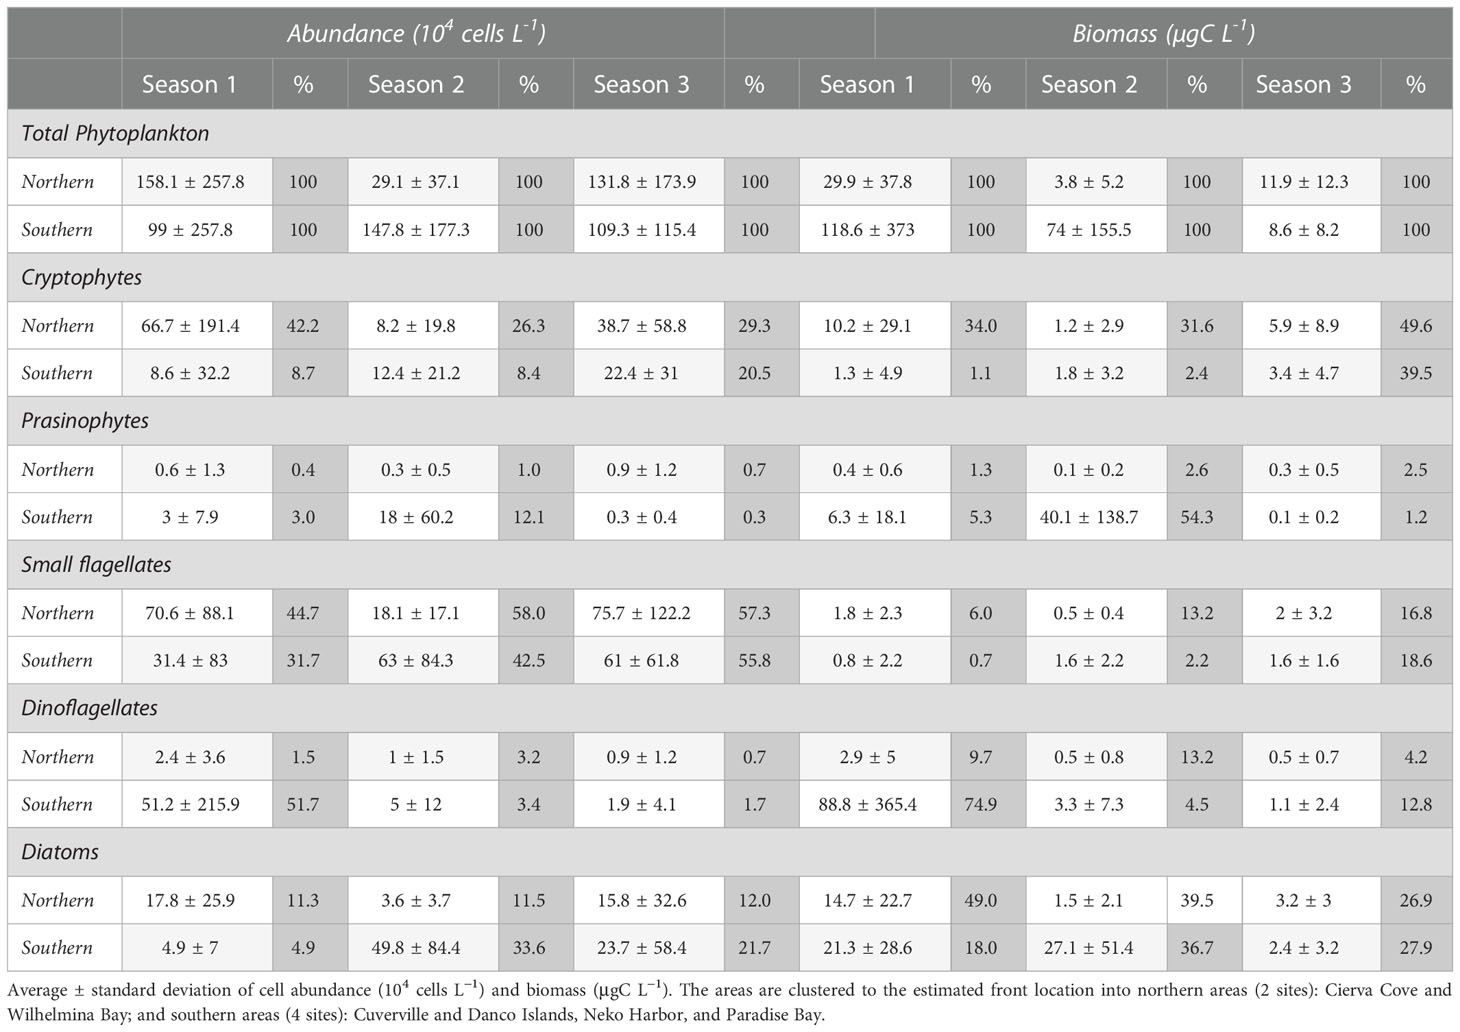
Table 1 Abundance and biomass average values and relative percentages of major phytoplankton groups during three consecutive summer seasons.
In the southern sites, phytoplankton composition differed among seasons (Table 1). During S1, dinoflagellates, and small flagellates were the most important groups in term of abundance, representing on average 51.7% and 31.7% of the total phytoplankton abundance, respectively. In terms of biomass, dinoflagellates, and diatoms were the most important contributors, representing on average 74.9% and 18% of total phytoplankton biomass, respectively. The highest abundance and biomass values during this summer were observed during December during S1 in Danco Island when an unarmored dinoflagellate bloom reached 10.4 x 10⁶ cells L-1 and 1686.9 µgC L-1. During S2, small flagellates and diatoms were the most important groups in term of abundance, representing on average 42.5% and 33.6% of total phytoplankton abundance, respectively. In terms of biomass, prasinophytes and diatoms were the most important contributors, representing on average 54.3% and 36.7% of the total phytoplankton biomass, respectively. The highest peak of cell abundance and biomass was found in January during S2 in Paradise Bay when a Pyramimonas sp. (prasinophyte) bloom reached 7 x 10⁶ cells L-1 and 804.6 µgC L-1. During S2, a Chaetoceros spp. bloom (diatom) took place in December, the highest peak was registered in Cuverville at 3.9 x 10⁶ cells L-1 and 146 µgC L-1. During S3, small flagellates, diatoms, and cryptophytes were the most important groups, representing on average 55.8%, 21.7% and 20.5% of total phytoplankton abundance, respectively. In terms of biomass, cryptophytes and diatoms were the most important contributors, representing on average 39.5% and 27.9% of the total phytoplankton biomass, respectively. The highest peak, similar to the patterns identified in the northern area, occurred in February during S3 in Cuverville Island when cryptophytes reached 4.2 x 10⁶ cells L-1 and 27.8 µgC L-1.
In order to statistically assess the differences in the composition of phytoplankton between the northern and southern areas, we performed an NMDS analysis based on the Bray-Curtis dissimilarity in the relative biomass from December to February. This analysis showed two clearly differentiated groups (tested by ANOSIM): (Group A) represents the southern sites in December and January during S1 and S2 and February during S1; and (Group B) represents the northern sites in December, January, and February during S1 and S2, southern sites in February during S2, and every sample during S3 (Figure 5).
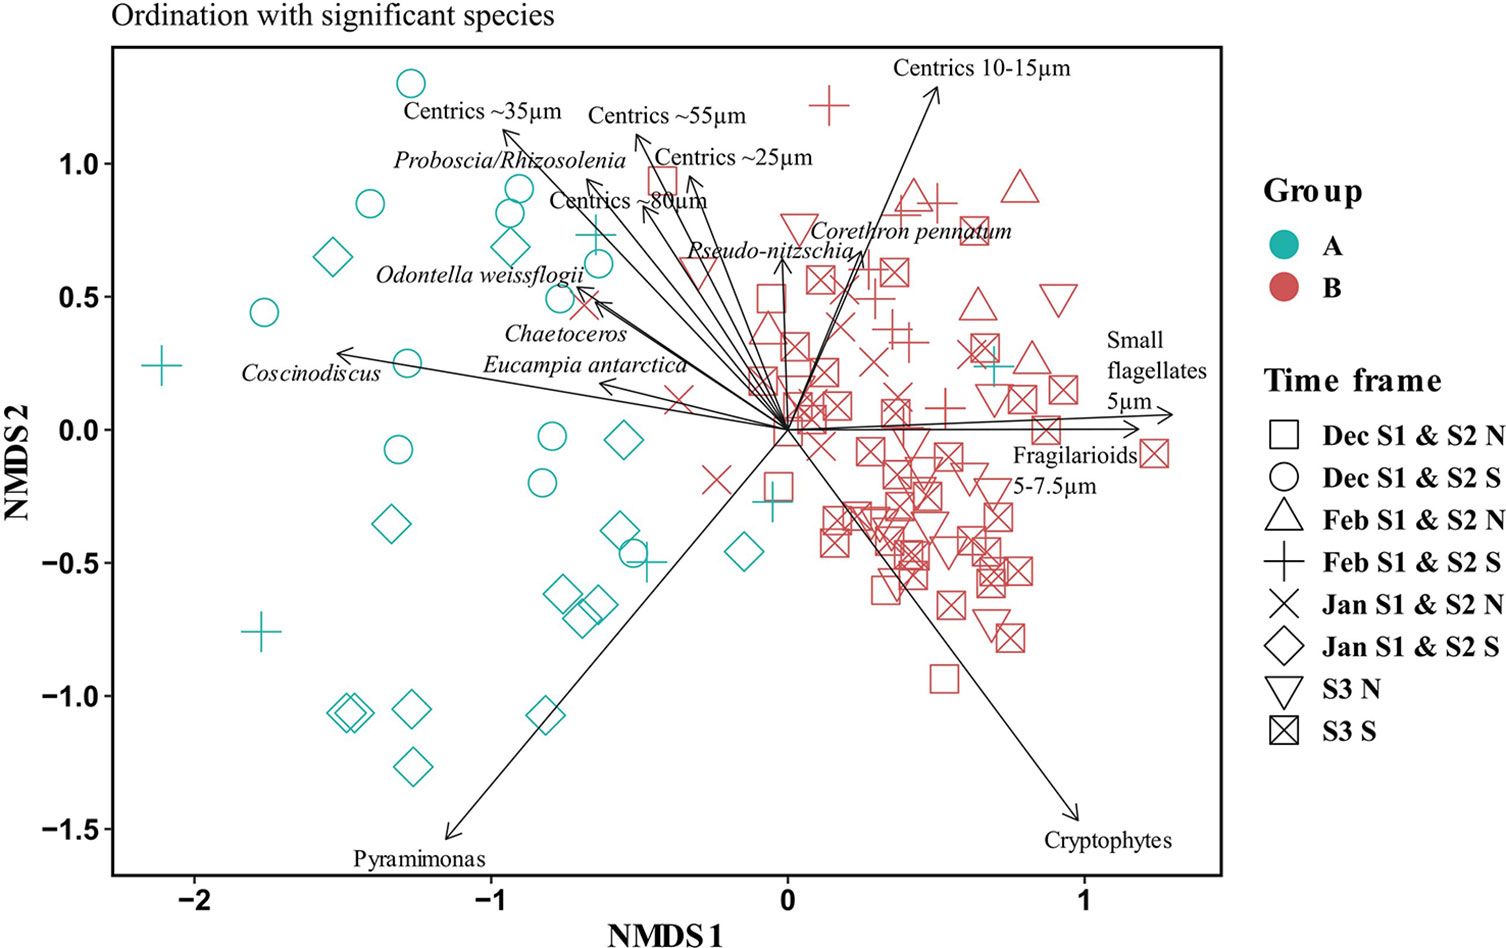
Figure 5 Non-metric multidimensional scale analysis (NMDS) based on the Bray-Curtis dissimilarities of the phytoplankton community composition (each taxa represented by their relative contribution to total biomass). The samples are colored according to group (A, light-blue or B, red) and labeled by time frame: Month (if applicable, Dec, Jan, Feb), Season (S1, S2, S3), and area (N, North or S, South). The black arrows show the main taxa that were significant in the statistical analysis. ANOSIM R = 0.7, p <0.001.
The two groups were differentiated by their specific composition. The samples in group A were mainly dominated by large microplanktonic diatoms (>20 µm) such as Eucampia antarctica, Odontella weissflogii, Proboscia spp., large centric diatoms from the genus Coscinodiscus; other medium-size centric diatoms (20-60 µm) that form chains such as Porosira spp., Thalassiosira spp., Shionodiscus spp. that were grouped according to their size as centrics ~25µm, centrics ~35µm, and centrics ~55µm; Chaetoceros spp., and flagellates from the genus Pyramimonas. Samples in group B were characterized by the predominance of small flagellates <5 µm, cryptophytes, nanoplanktonic diatoms (between 2-20 µm) such as Fragilariopsis spp., small centrics (10-15 µm) from the genus Thalassiosira and Shionodiscus; and the large diatom Corethron pennatum.
3.2.2 Phytoplankton successional patterns north and south of the Gerlache Strait
In order to describe the successional patterns of phytoplankton in the surface waters of the coastal areas of the Gerlache Strait, we explore in detail how the specific composition of the species (or taxa) varied along the spring-summer months (November to March) in northern and southern Gerlache Strait during the three studied seasons (Figure 6).
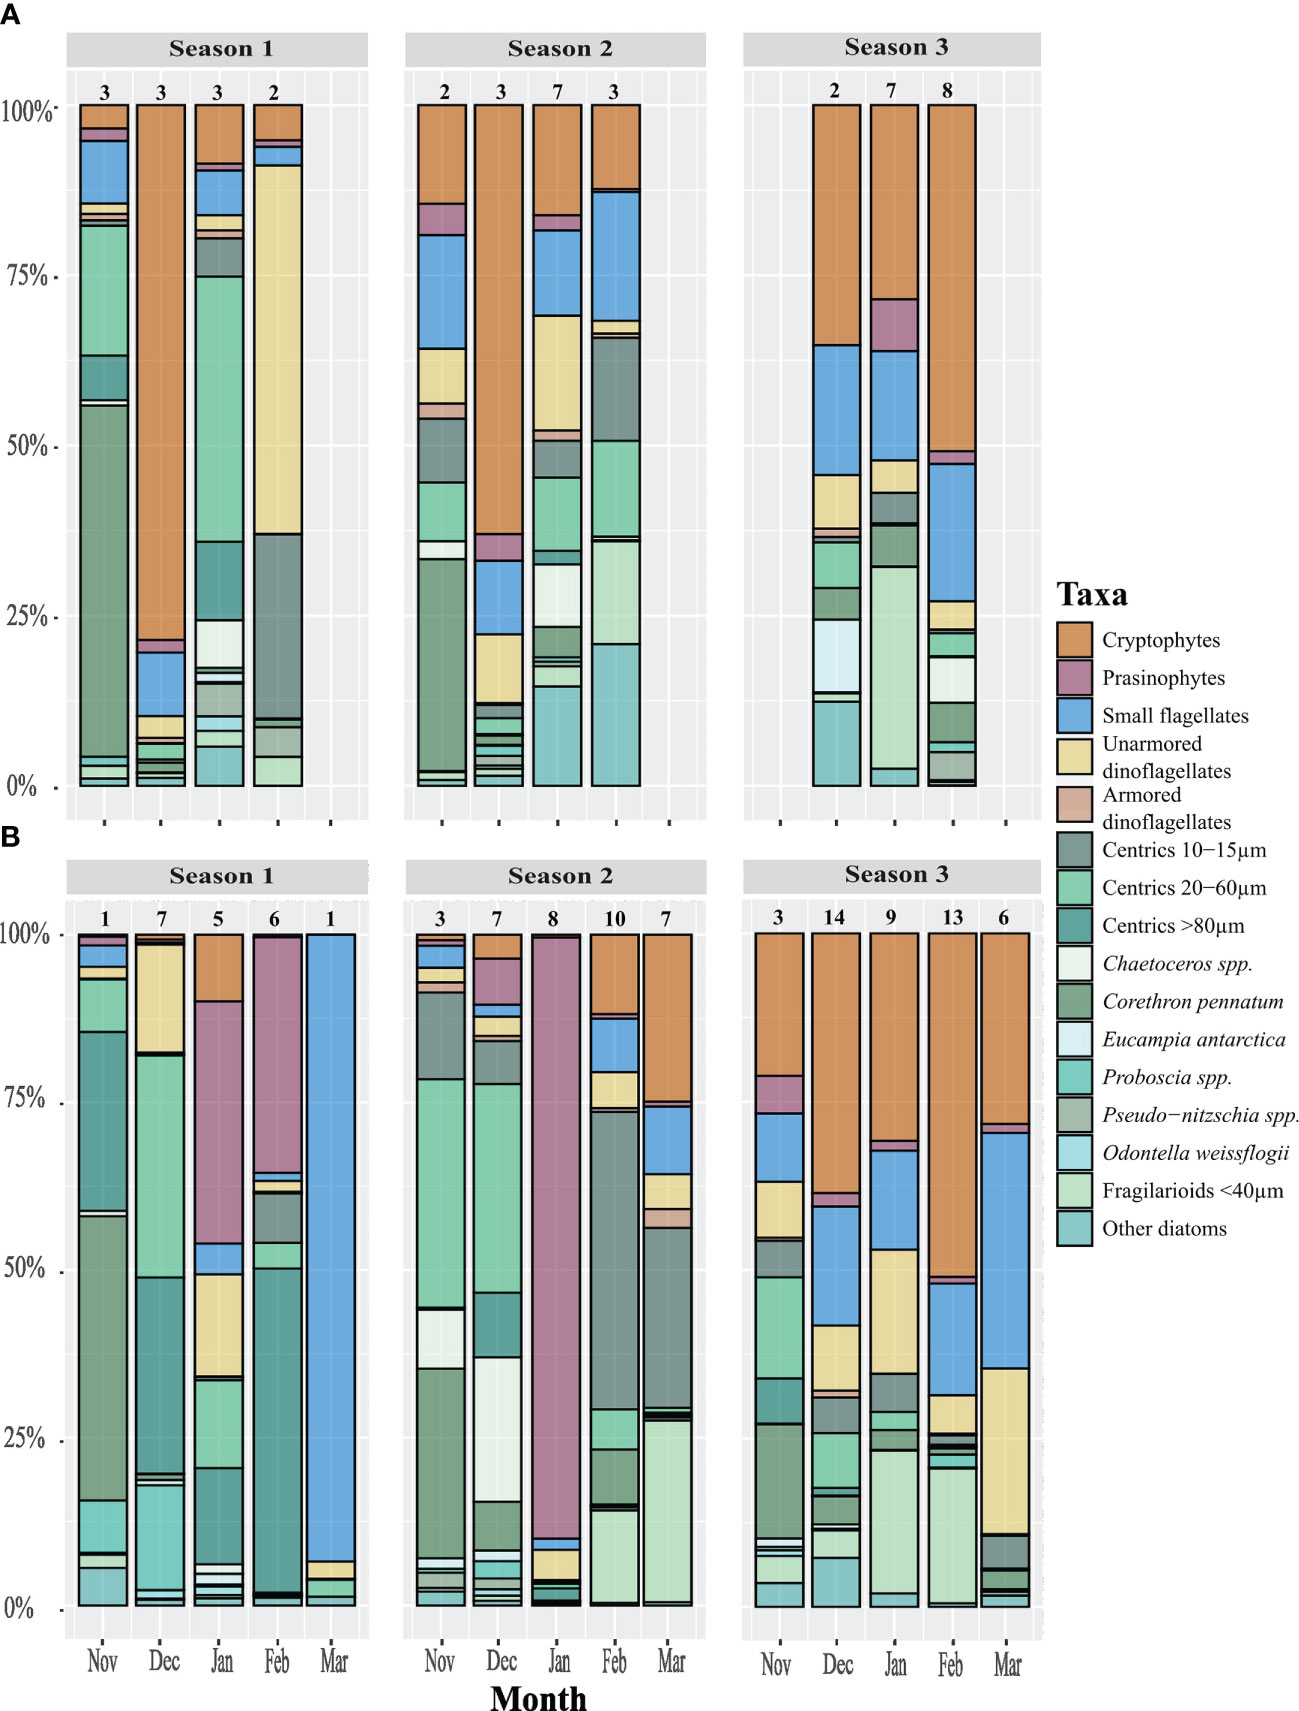
Figure 6 Bar plot of relative biomass specific composition of representative taxa in (A) North and (B) South zones of the Gerlache Strait from November to March 2016-2017, 2017-2018, and 2018-2019. This graph was constructed by averaging the samples obtained in each zone during that month and season, the n of the averaged samples can be seen above each bar. Note that this is a percentage graph and that the changes in biomass are relative. All diatoms are colored in shades of green.
The phytoplankton composition during November was similar in both areas during the first two years, represented mainly by the diatoms Corethron pennatum, centrics between 20 and 60 µm (mostly Thalassiosira spp. and Shionodiscus spp.), small centrics < 15 µm, and Chaetoceros spp. (Figure 6).
Between December and February during S1 and S2, phytoplankton composition differed to the north and south of the thermal front in the Gerlache Strait (Figure 6). In the northern sites during December, the phytoplankton community was dominated by cryptophytes (Figure 6). During January, the diatoms were the most important group, in particular, centrics between 20 and 60 µm (e.g., Actinocyclus actinochilus, Thalassiosira spp., Porosira spp.), and Chaetoceros spp. During February, small diatoms dominated, small centrics (Thalassiosira spp.) and small fragilarioids (e.g., Fragilariopsis nana), and particularly during S2 small naked dinoflagellates were also important.
In the southern areas, during December the phytoplankton community was dominated by diatoms. Centric diatoms between 20 and 60 µm dominated both years, followed by large centrics (>80 µm, Coscinodiscus spp.), Proboscia sp., and Odontella weissflogii during S1, and Chaetoceros spp. on S2. During January, prasinophytes from the genus Pyramimonas dominated. In February during S1, prasinophytes were also accompanied by large centric diatoms, however during S2 the composition was similar to the northern areas’ composition, there was an absence of prasinophytes with a dominance of small fragilarioid and small centric diatoms. During March, the phytoplankton community was similar during the three seasons, dominated by small flagellates, followed by cryptophytes, small centric diatoms <15 µm, fragilarioid diatoms <40 µm, and small naked dinoflagellates (Figure 6).
S3 showed a different successional pattern than previous seasons since phytoplankton composition was similar between both areas and months (Figure 6). Cryptophytes dominated during the entire period, followed by small fragilarioid and small centric diatoms (10-15 µm), Chaetoceros spp., Corethron pennatum, and small flagellates.
4 Discussion
4.1 Gerlache Strait physical oceanographic features influence on the nearshore waters’ phytoplankton community
During the summer months in surface waters of the Gerlache Strait a thermal gradient is usually established, with warmer waters to the north and cold waters to the south, towards Bismarck Strait. When analyzing satellite data from summers in a decade (2011-2021), we found that the temperature gradient was noticeable during the summer months from December to February, with the greatest temperature differences in January, reaching up to 1°C. We consider this gradient to be the manifestation of a thermal front previously reported in the Gerlache Strait around 64.5° S (García et al., 2002; Kerr et al., 2018; Torres Parra et al., 2020). SST in the sites of phytoplankton sampling, measured in situ (see Supplementary Table 1 and Supplementary Figure 1) also showed a temperature gradient between northern and southern sites, where the temperature in the nearshore sites was related to the SST detected by satellites in the Gerlache Strait (Supplementary Table 3). During the three seasons sampled, differences were also detected in our SST observations from month to month, suggesting an interannual variation in the moment of establishment of the gradient. Likewise, Torres Parra et al. (2020) found two different scenarios (February 2015 and February 2017), a first year with a more defined front, and a second year when it was less defined. However, in both scenarios they found differences greater than ~0.5°C in northern and southern Gerlache Strait. The differences in temperatures to the north and south found in our study were always greater than 0.5°C from December to February, except for December 2018 (S3), suggesting that the front might have been established later in that summer.
Analysis of the satellite data also detected a cooling pattern during the three summers studied that would be related to an extreme El Niño event in 2015. The anomalous temperatures recorded during the 2016-2017 summer were probably given by a strong El Niño that started in April/May 2015, lasted until May 2016 and followed by a weak La Niña (Stuecker et al., 2017). Locally, in the Gerlache Sound, Torres Parra et al. (2020) suggested that the elevated temperatures observed during 2016-2017 were probably caused by the inflow of warm water from the north, resulting from northeasterly surface winds around the northern Antarctic Peninsula, forced by a negative phase of the Southern Annular Mode (SAM) that came after the 2015 El Niño from October 2016 to March 2017. Several studies have highlighted the effects of this extraordinary El Niño event during 2015 in Antarctica on water temperature, winds, sea ice retreat, among other factors, ultimately affecting phytoplankton (Costa et al., 2021; Meredith et al., 2021; Trifoglio et al., 2022). While the long-term effects of this event are still being understood, this event would likely explain the high temperatures recorded in the study area in our first summer.
The results of this work suggest that the close relationship of adjacent nearshore areas may be due to processes occurring in the open waters of the Gerlache Strait. Although we were not able to sample in the Strait, the high similarity in phytoplankton composition found in adjacent nearshore areas that may be up to 40 km apart suggests a high connection of the surrounding surface waters and the main Strait. The waters of the Gerlache Strait are characterized by long residence times that can range from weeks to months and it is estimated that within coastal areas this residence time may be longer (Zhou et al., 2002), which may explain this interconnectedness between coastal areas and the long persistence of phytoplankton assemblages. Studies from Andvord Bay can explain the interconnectedness between the Strait and the coastal areas affecting inshore phytoplankton assemblages (Ekern, 2017; Lundesgaard et al., 2019; Hahn-Woernle et al., 2020; Lundesgaard et al., 2020; Ziegler et al., 2020; Forsch et al., 2021). Modeling by Hahn-Woernle et al. (2020) found a significant exchange of surface waters between Andvord Bay and the Gerlache Strait, which causes the fjord to lose or gain heat, mainly driven by winds. In addition, both planktonic organisms (larvae), chlorophyll a, and macro- and micronutrients originating within the fjords can be exported to the Gerlache Strait within a month, an exchange strongly enhanced by recurrent katabatic winds (Ekern, 2017; Ziegler et al., 2020; Forsch et al., 2021). Similar processes have been reported for Arthur Harbor in Anvers Island and Southeast Greenland, suggesting wind-driven exchange of surface waters is a common process in high-latitude nearshore areas (Moline and Prezelin, 1996; Spall et al., 2017). As winds affect primarily surface waters, analysis of surface waters can be considered the most sensitive way to detect the effect of the thermal front in phytoplankton composition. In this way, results from this study provide more in-depth information on the exchange of phytoplankton between surface waters of the fjords and embayments and the Gerlache Strait, which are still poorly understood (Ferreira et al., 2020).
Our results suggest that there is a relationship between the phytoplankton composition and the establishment of the thermal gradient in the Gerlache Strait, as we found that summer phytoplankton composition differed between the sites in the northern and southern Gerlache Strait during S1 and S2. Particularly during December and January, when the highest SST differences and the highest phytoplankton biomass values were observed, the composition were markedly dissimilar north and south. Furthermore, our records can be related to in situ SST data in the Gerlache Strait– in February 2017, there was a predominance of prasinophytes in the southern zone, while in the northern zone dinoflagellates dominated, and there is evidence that the front was present during that time (Torres Parra et al., 2020). During other months, as in November, the lack of compositional difference in the northern and southern sites (i.e., the same phytoplankton assemblage was found in both zones), is consistent with similar temperature averages north and south of the Strait (Figures 2, 6). The lack of difference in the third summer in phytoplankton assemblages could be related to the delay in the front’s formation during December probably combined with overall lower temperatures. Although with lower temperatures we could have expected the southern assemblage to be dominated by diatoms and Pyramimonas, other factors, beyond SST and the presence of the front in the Gerlache Strait, not measured in this study, are expected to have influenced the phytoplankton composition during S3.
Spatial variability in phytoplankton composition of the Gerlache Strait has been recorded over 30 years ago. Vernet (1992) found that during December 1991-January 1992, there were two different assemblages north and south of the Gerlache Strait – with cryptophytes dominating to the north, and diatoms and Pyramimonas-like cells to the south – although this author did not relate these differences to any physical phenomenon. During December 1995 and January 1996, Rodriguez et al. (2002) found two different assemblages north and south of the Gerlache Strait, also probably affected by the surface front (Anadón and Estrada, 2002). Mendes et al. (2018) found that different phytoplankton assemblages were found north and south of the Strait during February 2013, 2014, and 2015, agreeing with the February results in our study for the nearshore areas (see following section). These previous records also demonstrate that, despite the complexity and seasonal variability of the area, the patterns of spatial phytoplankton distribution seem to occur often, or to be stable and recurrent, summer after summer, suggesting that the observations during S3 are more of an anomaly. The results from this study add to previous records in the literature and are consistent with the concept of frontal zones co-ocurring with changes in biological community composition (Acha et al., 2015). Furthermore, this work extends the influence of physical features in coastal embayments and fjords. In addition, Giraldo et al. (2019) found two different copepod assemblages in the northern and southern Gerlache Strait, meaning the frontal area may have several implications for the rest of the food web.
4.2 Summer phytoplankton succession in northern vs southern coastal areas
Our analysis of three consecutive seasons from November to March allowed us to assess the phytoplankton succession during late spring through the duration of the austral summer in surface waters. Like other studies that have evaluated the phytoplankton composition for several consecutive years in coastal areas of the WAP, we found a high interannual variability (Garibotti et al., 2005; Rozema et al., 2017; Kim et al., 2018). Nevertheless, we observed a consistent pattern in phytoplankton community succession between the first two seasons. Based on results from the first two seasons, we propose two different successional patterns in the surface waters of the nearshore areas in northern and southern Gerlache Strait (Figure 7).
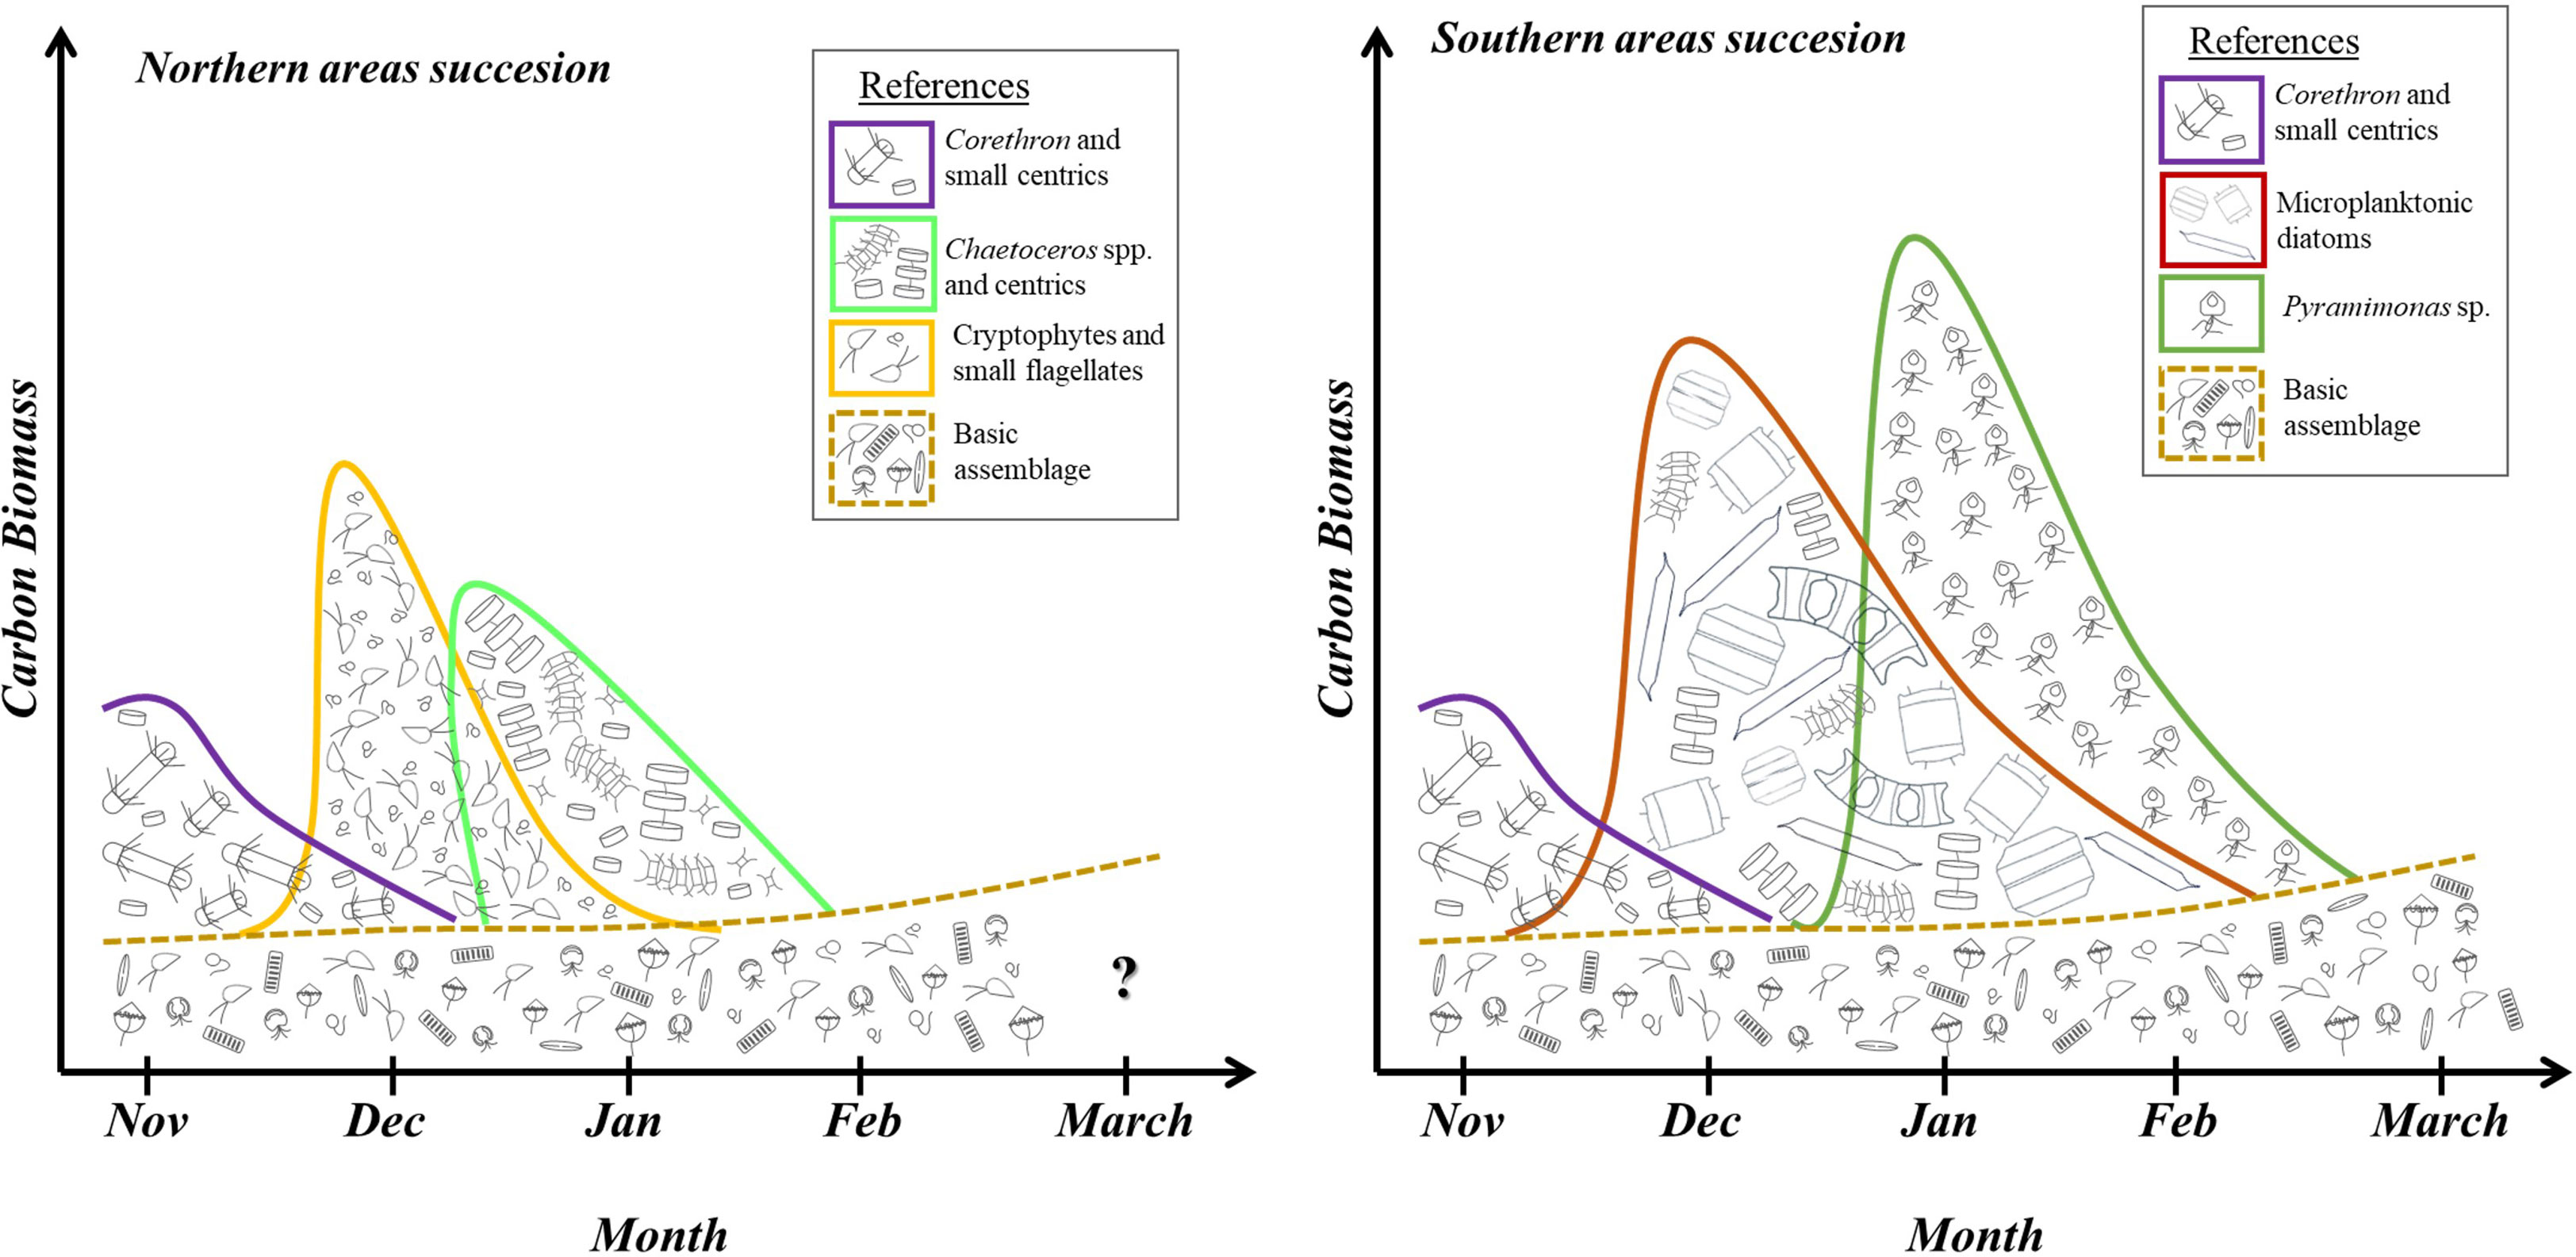
Figure 7 Conceptual model diagram illustrating the phytoplankton summer succession from November to March in northern and southern areas of the Gerlache Strait during seasons 1 and 2, constructed from the average of the biomass data found in the northern and southern areas for each season. The main assemblages described here are: 1) an assemblage composed of Corethron pennatum and small centric diatoms < 15 µm (in violet); 2) an assemblage of medium-size centric diatoms between 20 and 60 µm (e.g. Actinocyclus actinochilus, Thalassiosira spp., Porosira spp.) and Chaetoceros spp (in light green); 3) an assemblage dominated by cryptophytes and small flagellates (in orange); 4) a basic assemblage composed by small unidentified flagellates, cryptophytes, small naked dinoflagellates, small prasinophytes, haptophytes, and small fragilarioid and naviculoid diatoms (in brown); 5) an assemblage composed of large microplanktonic diatoms (e.g. Odontella weissflogii; Proboscia spp., Eucampia antarctica, Coscinodiscus bouvet) (in red); 6) an assemblage dominated by prasinophytes from the genus Pyramimonas (in green).
Underlying any successional patterns observed in the seasons, months, and locations sampled, there is a basic assemblage composed by small unidentified flagellates, cryptophytes, small naked dinoflagellates, small prasinophytes, haptophytes, and small fragilarioid and naviculoid diatoms (Figure 7, in brown). These phytoplankton taxa were repeatedly found in low abundance in all the samples analyzed, accompanying the dominant taxa, if present. This ‘basic’ assemblage forms the background in which different assemblages are immersed and transition over time. The basic composition is observed during periods of low biomass, like November and March. This concept agrees with several studies in the WAP that mention the nanoplankton dominates the basic phytoplankton composition, particularly evidenced during autumn and winter months (Garibotti et al., 2005; Clarke et al., 2008; Annett et al., 2010; Rozema et al., 2017; Mascioni et al., 2021). In addition, previous studies in one of the sampled sites, in a WAP fjord (Neko Harbor in Andvord Bay) describe a similar assemblage during a period with low productivity during autumn, but also present during late spring (Mascioni et al., 2019; Pan et al., 2020; Mascioni et al., 2021).
In accordance with the results from three seasons, the phytoplankton community at the end of November, both in northern and southern Gerlache Strait, is mainly represented by a mix of Corethron pennatum and small centric diatoms < 15 µm (Figure 7, in violet), together with the basic assemblage. This coincides with other studies that record Corethron pennatum as an important diatom at the beginning of the season, e.g., in King George Island’s embayment at the northern Antarctic Peninsula (Lange et al., 2018); however, in WAP coastal southern areas near Marguerite Bay, C. pennatum seems to be an uncommon species during spring months (Annett et al., 2010). This species, apart from dominating the November assemblage in the nearshore waters of the Gerlache Strait, is a well-known component of the phytoplankton community throughout the summer on the WAP continental shelf (Garibotti et al., 2005).
After November, the successional patterns to the north and south of the thermal front differ (Figure 7). In the northern areas during December, there is an assemblage dominated by cryptophytes and small flagellates (orange). Then, during January, there is an assemblage dominated by Chaetoceros spp. and centric diatoms < 50 µm (light green, Figure 7). Towards the end of the summer season, during the month of February, the composition is similar to January but there is a clear decrease in total carbon biomass. By contrast, in the southern areas, during December, the phytoplankton assemblage is dominated by microplanktonic diatoms, such as Odontella weissfloggii, Proboscia spp., Eucampia antarctica, Coscinodiscus spp., Thalassiosira spp., Porosira spp., and Chaetoceros spp. among others (Figure 7 in red). During mid-summer season, in January develops an assemblage dominated by Pyramimonas sp. that stays until late February. In late summer/early autumn, around March, the basic assemblage is dominant (Figure 7, in brown) and enriched in small fragilarioid and naviculoid diatoms, with low biomass. We were not able to sample during March in the northern areas, however, as the thermal gradient is not present during March (Figure 3), we predict a similar assemblage may be present in the northern areas as well as a biomass decline due to the reduction of light availability (Vernet et al., 2012).
Studies evaluating phytoplankton succession in this area are scarce. Pan et al. (2020) suggested a phytoplankton succession for Andvord Bay, a fjord located in the southern Gerlache Strait, in relation to glacial meltwater and nutrient supply. The succession pattern we propose for the southern areas is similar, although the authors suggested that the diatom bloom would occur in January-February, and we observed it earlier, during December-January. In these WAP coastal areas, assemblages can be sustained for extended periods of time, so an incipient diatom assemblage during the month of December could well have spread and remained stable until February, having a peak in January (Costa et al., 2020; Mascioni et al., 2021). Pan et al. (2020) also found low prasinophyte abundance during January-February, likely due to Pyramimonas appearing only in late February that summer (Mascioni et al., 2019), probably delayed by the substantial diatom bloom that took place in the area during January-February (Costa et al., 2020).
The lack of other studies on successional patterns for the area highlights the importance of this first description that can be considered foundational to future studies. Further studies relating the phytoplankton composition with environmental variables, in consecutive years, and even in other coastal areas related to the Gerlache Strait, would help to better understand the patterns here described. The collection of data from IAATO vessels preclude any complex filtration or storage system, limiting the type and number of variables that can be collected, as well as the depths sampled. This limitation is balanced by the ability to generate a time series during the phytoplankton growth season (Cusick et al., 2020). Future studies involving sampling throughout the euphotic zone could test whether the models presented in Figure 7 for surface waters apply to the rest of the water column. There is evidence that in nearshore waters of the WAP the upper layer is well mixed due to the recurrent presence of katabatic winds (Supplementary Figure 1; Vernet et al., 2012; Christensen, 2017; Ekern, 2017; Höfer et al., 2019; Pan et al., 2019; Pan et al., 2020). Moreover, in one of the sampled fjords, Mascioni et al. (2021) demonstrated that the phytoplankton composition was similar throughout the euphotic zone. In this context, our results could be potentially applicable to the upper mixed layer.
Our conceptual model has little or no overlap with other successional patterns that have been suggested in the literature. To the southernmost region of the WAP, van Leeuwe et al. (2020) suggested a phytoplankton succession for Rothera station by evaluating five consecutive years of sampling. Here, microplanktonic diatoms play a key role forming two diatom blooms, one when the sea ice breaks up in November-December, and one in late summer, February-March. Garibotti et al. (2005) suggested a successional pattern for the WAP continental shelf extending from southern Anvers Island to Marguerite Bay but did not include nearshore areas. These authors suggested that the successional patterns were closely related to sea ice retreat and that the variability in the timing of sea ice retreat influenced the interannual differences observed. At the beginning of the season, they found a diatom bloom associated with the sea ice edge together with Phaeocystis, followed by assemblages enriched with cryptophytes, and at the end of the season an assemblage dominated by unidentified phytoflagellates and small-sized diatoms. In comparison with our pattern, we did not find diatom blooms at the beginning of the season in the three years sampled, and although cryptophytes were important north of the Gerlache Strait, they were less important to the south where prasinophytes dominated.
In addition to the successional patterns, in the WAP some studies have also evaluated what happens in high vs low biomass summers. Garibotti et al. (2005) suggested that low biomass summers, with sampling constraint to January, are dominated by cryptophytes and high biomass summers are dominated by diatoms. In Marguerite Bay, Rozema et al. (2017) similarly suggested that low biomass summers are dominated by cryptophytes and chlorophytes and high and medium biomass summers are dominated by diatoms. We also observed biomass variability during our sampling period, with high biomass during the first two seasons (maximum of 1.7 x 10⁴ cells L-1 and 804.6 µgC L-1 respectively) and a S3 with low biomass (maximum of 42.3 µgC L-1). In this study, high biomass was associated with a clear successional pattern, while the third season, with low biomass, did not present a successional pattern and was dominated by a nanoflagellate- and small diatoms-assemblage. However, the dominance by diatoms in the sampled nearshore areas was not as clear as in those other studies; moreover, in the northern zone, cryptophytes dominated most of the time with the exception of January. Therefore, we consider that our conceptual model explains the phytoplankton succession in surface waters of the coastal areas of the Gerlache Strait between 64° and 65° S during years with high biomass, when microplanktonic diatoms are more abundant in the southern part of the Strait.
4.3 Diatoms vs nanoflagellates in coastal ecosystems
Our results suggest that the surface waters of the coastal areas of the Gerlache Strait are dominated by nanoflagellates, and diatoms, although present and ubiquitous, not always dominate. Different nanoflagellate taxa form important blooms during the summer months, making large contributions to carbon biomass. Further south, in Marguerite Bay Rozema et al. (2017) observed that, on average, 75% of the chlorophyll-a (Chl a) stock was comprised to the microphytoplankton fraction of the assemblage sampled. This contrasts markedly with our results, where even in the southern part of the Gerlache Strait – where more diatoms were observed during December to February in our samples – microphytoplankton represented on average only 46% of the total biomass. Although we cannot know what happened in the rest of the water column, the records in the literature of diatom blooms in the Gerlache Strait are rather scarce, with only two large diatom blooms recorded in the last 30 years (Holm-Hansen and Vernet, 1990; and Costa et al., 2020, see Mascioni et al., 2019Table 3). Costa et al. (2021) mention these blooms would be more the exception than the rule and probably become more and more rare in the upcoming years.
As suggested by Costa et al. (2021) the low sea ice conditions could be a major deterrent of large diatom blooms in WAP, which is consistent with our observations in the field between 2016 and 2019. The marked decrease in sea ice extent in the WAP in the last three decades has been more noticeable in the central and northern WAP (Stammerjohn et al., 2008; Meredith et al., 2021). If this trend of sea ice retreat continues, we might expect diatom blooms to become increasingly infrequent (Costa et al., 2021a) and blooms of other flagellates such as cryptophytes to remain recurrent. However, there is not enough evidence that the recurrence of the flagellate blooms are increasing. Our observations show that a large bloom of cryptophytes -that can last several days/weeks- repeatedly occurs in surface waters during summer related to higher temperatures north of the Gerlache Strait, a phenomenon that has been commonly observed in the area for the last 30 years (Vernet, 1992; Rodriguez et al., 2002; Mendes et al., 2013; Mascioni et al., 2019; Mascioni et al., 2021). It has recently been proposed that the cryptophytes that form these blooms would be a novel species endemic of WAP waters (Hamilton et al., 2021).
Alongside cryptophytes, prasinophytes blooms seem to be a persistent phenomenon in the southern part of the Gerlache Strait (Vernet, 1992; Rodriguez et al., 2002; Mascioni et al., 2019). Prasinophytes made important contribution to the phytoplankton biomass during January-March in the surface waters of the southern part of the Gerlache Strait. Particularly, in January S2, a bloom of Pyramimonas sp. (Prasinophyte) took place in the southern area, with the highest peak of abundance and biomass in Paradise Bay. The first known record of a Pyramimonas bloom was north of the Gerlache Strait in 1987 (Bird and Karl, 1991); however, in 1996 (10 years later), Rodriguez et al. (2002) found it south of the Gerlache, as in this study and in 2015 (Mascioni et al., 2019). We have no record of these prasinophytes at northern stations, suggesting that these flagellates may be adapted to lower temperatures, although Pyramimonas do not seem to be important south of the WAP (Garibotti et al., 2003; Rozema et al., 2017; Mascioni et al., 2019; van Leeuwe et al., 2020). It is also noteworthy that the bloom forming Pyramimonas species is still unknown, and although it is suggested that it could be Pyramimonas cf. gelidicola its morphological characteristics do not agree with that species and its distribution suggests something rather endemic, although more studies in the subject would be necessary (Mascioni et al., 2019).
Diatoms are an important component in the surface waters of the southern area of the Gerlache Strait, but they do not reach high biomass values. During S2, as happened in S1, we did not find a large microplanktonic diatom bloom. However, we did find a Chaetoceros spp. bloom during December 2017 S2 in Neko Harbor (up to 3.9 x 10⁶ cells L-1 and 146 µgC L-1), although the biomass in this bloom did not reach previous values recorded for WAP diatom blooms, e.g., 2.1 × 10⁶ cells L-1 and 1,563 µgC L−1 (Garibotti et al., 2003); the lower biomass values are explained due to the small size of the Chaetoceros spp. found (~10 µm, Supplementary Table 2). Garibotti et al. (2005) found that Chaetoceros socialis was the characteristic species of the coastal region between Anvers Island and Marguerite Bay, contributing between 29% - 62% of the diatom abundance during 1996, 1997, and 1999 summers. However, due to the small size of this species, it contributed less than 17% of diatom biomass during those summers. Concurrently with our sampling, Höfer et al. (2019) recorded a diatom bloom in a nearby coastal area south of Anvers Island in the South Bay during February 2017. No such bloom was found in our study area during S1 because the surface waters surrounding Anvers Island do not enter the Gerlache Strait (Zhou et al., 2002).
Despite the absence of large microplanktonic diatom blooms, the Gerlache is a highly productive area. It has already been seen that microplanktonic diatom assemblages in the Gerlache Strait are highly productive with high growth rates (Mandelli and Burkholder, 1966; Isla et al., 2004; Mascioni et al., 2021). Mascioni et al. (2021) recently demonstrated that the diatom assemblage that dominates in the southern Strait is highly productive despite not reaching high biomass values. This assemblage persists in the area for a month (Figure 7) suggesting a highly productive region in the surface waters south of the Gerlache Strait front. The waters of the Gerlache are also important as seed the major blooms in the Bransfield Strait (Basterretxea and Arístegui, 1999). There is a high krill recruitment in the Gerlache Strait, yet krill aggregations are even greater within the nearshore waters than in the Strait (Nowacek et al., 2011; Espinasse et al., 2012; Cleary et al., 2016; Cleary et al., 2018). As krill graze selectively on microplanktonic diatoms, large aggregations of krill could exert high grazing pressure on the microplanktonic diatom assemblages, controlling diatom proliferation and favoring the development of small flagellates’ blooms (Cavan et al., 2019).
5 Conclusion
This is the first study to assess phytoplankton composition throughout the entire growth season (November through March) in the surface waters of nearshore areas of the WAP between 64° and 65° S, that based on previous studies are considered representative of communities in the upper mixed layer and the majority of the euphotic zone. Overall, our results suggest that phytoplankton composition and carbon biomass within the surface waters of the nearshore areas of the WAP can be closely related with mesoscale features created by physical oceanographic characteristics, such as a surface thermal front. Winds are suggested by the literature as major players in the surface water exchange between the nearshore areas and the Gerlache Strait. Although we consider the thermal gradient can be a major determinant of the phytoplankton composition in the nearshore areas connected to the Gerlache Strait, there are other known factors that control the phytoplankton community that we did not analyze, such as glacial and sea ice meltwater. Continuing to monitor these areas with the FjordPhyto project, by combining biological and physical measurements in consecutive years is needed to further understand the complex dynamics of the Antarctic phytoplankton community in nearshore areas. These coastal areas are important locations for phytoplankton biomass accumulation during the summer months, especially during December and January in the southern areas of the Gerlache Strait where microplanktonic diatoms and prasinophytes dominate in surface waters. Alongside, cryptophytes form important blooms during the summer months, making large contributions to carbon biomass in surface waters of the region north of the thermal front.
Data availability statement
The original contributions presented in the study are included in the article/Supplementary Material. Further inquiries can be directed to the corresponding author.
Author contributions
MM performed all the microscopy analyses. BJP provided the satellite data. AC performed part of the field sampling and trained the polar tour guides to carry on the citizen science project in Antarctica. MM and GA performed all the data analysis. MM, BJP, and MV performed the satellite data analysis. MM, GA, and MV conceptualized the manuscript. All authors contributed to the article and approved the submitted version.
Funding
This research was carried out with support by Grant PIP 1195 from Consejo Nacional de Investigaciones Científicas y Técnicas (CONICET, Argentina) to GA, a doctoral fellowship from CONICET to MM, Public Participation in STEM Research (PPSR) awarded to MV. NSF PLR-1443705 “Collaborative Research: Fjord Ecosystem Structure and Function on the West Antarctica Peninsula—Hotspots of Productivity and Biodiversity? (FjordEco).,” NASA’s Citizen Science for Earth Systems Program (CSESP) award # 20-CSESP2020-0039 (2021) to MV. Additional funding was received through the Hurtigruten Foundation, and generous donors.
Acknowledgments
We want to specially thank to IAATO-member vessels, operators, captains, crew, guides, and travelers who participated through the 2016-2019 seasons in FjordPhyto citizen science program: Antarctica 21, Belgica 121 Expedition, Cheesemans’ Ecological Safaris, G Adventures, Hanse Explorer, Hurtigruten Expeditions, Lindblad Expeditions, Ocean Expeditions, Polar Collective, Polar Latitudes, and Quixote Expeditions, without whom our research would not be possible. We would also like to thank Dr. Rick Reynolds, who reviewed an earlier version of the manuscript and provided important comments. Finally, we want to thank the reviewers for their comments, which have substantially improved the manuscript. This research was also carried out at the Jet Propulsion Laboratory, California Institute of Technology, under a contract with the National Aeronautics and Space Administration and Oak Ridge Associated Universities. The views and conclusions contained in this document are those of the authors and should not be interpreted as representing the official policies, either expressed or implied, of NASA or the U.S. Government. The U.S. Government is authorized to reproduce and distribute reprints for Government purposes notwithstanding any copyright notation herein.
Conflict of interest
The authors declare that the research was conducted in the absence of any commercial or financial relationships that could be construed as a potential conflict of interest.
Publisher’s note
All claims expressed in this article are solely those of the authors and do not necessarily represent those of their affiliated organizations, or those of the publisher, the editors and the reviewers. Any product that may be evaluated in this article, or claim that may be made by its manufacturer, is not guaranteed or endorsed by the publisher.
Supplementary material
The Supplementary Material for this article can be found online at: https://www.frontiersin.org/articles/10.3389/fmars.2023.1139293/full#supplementary-material
Supplementary Table 1 | FjordPhyto phytoplankton sampling stations during seasons 2016-2017, 2017-2018, and 2018-2019.
References
Acha E. M., Piola A., Iribarne O., Mianzan H. (2015). Ecological processes at marine fronts oases in the ocean. Springer. New York.
Anadón R., Estrada M. (2002). The FRUELA cruises. a carbon flux study in productive areas of the Antarctic peninsula (December 1995-February 1996). Deep Sea Res. 2 Top. Stud. Oceanogr 49, 567–583. doi: 10.1016/S0967-0645(01)00112-6
Annett A. L., Carson D. S., Crosta X., Clarke A., Ganeshram R. S. (2010). Seasonal progression of diatom assemblages in surface waters of Ryder bay, Antarctica. Polar Biol. 33, 13–29. doi: 10.1007/s00300-009-0681-7
Basterretxea G., Arístegui J. (1999). Phytoplankton biomass and production during late austral spring, (1991) and summer, (1993) in the bransfield strait. Polar Biol. 21, 11–22. doi: 10.1007/s003000050328
Bird D. F., Karl D. M. (1991). Massive prasinophyte bloom in northern gerlache strait. Antarct J. US 26, 152–154.
Cavan E. L., Belcher A., Atkinson A., Hill S. L., Kawaguchi S., McCormack S., et al. (2019). The importance of Antarctic krill in biogeochemical cycles. Nat. Commun. 10, 1–13. doi: 10.1038/s41467-019-12668-7
Chapman C. C., Lea M.-A., Meyer A., Sallée J.-B., Hindell M. (2020). Defining southern ocean fronts and their influence on biological and physical processes in a changing climate. Nat. Clim Chang 10, 209–219. doi: 10.1038/s41558-020-0705-4
Christensen K. (2017). The upper layer structure and variability of an Antarctic glacio-marine fjord: andvord bay, Western Antarctic peninsula. University of Hawaii at Manoa
Clarke A., Meredith M. P., Wallace M. I., Brandon M. A., Thomas D. N. (2008). Seasonal and interannual variability in temperature, chlorophyll and macronutrients in northern Marguerite bay, Antarctica. Deep Sea Res. 2 Top. Stud. Oceanogr 55, 1988–2006. doi: 10.1016/j.dsr2.2008.04.035
Cleary A., Durbin E., Casas M. (2018). Feeding by Antarctic krill Euphausia superba in the West Antarctic peninsula: differences between fjords and open waters. Mar. Ecol. Prog. Ser. 595, 39–54. doi: 10.3354/meps12568
Cleary A. C., Durbin E. G., Casas M. C., Zhou M. (2016). Winter distribution and size structure of Antarctic krill Euphausia superba populations in-shore along the West Antarctic peninsula. Mar. Ecol. Prog. Ser. 552, 115–129. doi: 10.3354/meps11772
Costa R. R., Mendes C. R. B., Ferreira A., Tavano V. M., Dotto T. S., Secchi E. R. (2021). Large Diatom bloom off the Antarctic peninsula during cool conditions associated with the 2015/2016 El niño. Commun. Earth Environ. 2, 252. doi: 10.1038/s43247-021-00322-4
Costa R. R., Mendes C. R. B., Tavano V. M., Dotto T. S., Kerr R., Monteiro T., et al. (2020). Dynamics of an intense diatom bloom in the northern Antarctic peninsula, February 2016. Limnol Oceanogr. 65, 2056–2075. doi: 10.1002/lno.11437
Cusick A., Gilmore R., Bombosch A., Mascioni M., Almandoz G., Vernet M. (2020). Polar tourism as an effective research tool: citizen science in the Western Antarctic peninsula. Oceanography 33, 50–61. doi: 10.5670/oceanog.2020.101
da Cunha L. C., Hamacher C., Farias C., de O., Kerr R., Mendes C. R. B., et al. (2018). Contrasting end-summer distribution of organic carbon along the gerlache strait, northern Antarctic peninsula: bio-physical interactions. Deep Sea Res. 2 Top. Stud. Oceanogr 149, 206–217. doi: 10.1016/j.dsr2.2018.03.003
Ducklow H., Fraser W., Meredith M., Stammerjohn S., Doney S., Martinson D., et al. (2013). West Antarctic Peninsula: an ice-dependent coastal marine ecosystem in transition. Oceanography 26, 190–203. doi: 10.5670/oceanog.2013.62
Edler L., Elbrächter M. (2010). “The utermöhl method for quantitative phytoplankton analysis,” in Microscopic and molecular methods for quantitative phytoplankton analysis, 13–20. Intergovernmental Oceanographic Commission of Unesco. IOC Manuals and Guides, vol. 55.
Ekern L. (2017). Assessing seasonal primary production in andvord bay, Antarctica. (San Diego: University of California) doi: 10.1111/j.1469-7610.2010.02280.x
Espinasse B., Zhou M., Zhu Y., Hazen E. L., Friedlaender A. S., Nowacek D. P., et al. (2012). Austral fall-winter transition of mesozooplankton assemblages and krill aggregations in an embayment west of the Antarctic peninsula. Mar. Ecol. Prog. Ser. 452, 63–80. doi: 10.3354/meps09626
Ferrario M., Sar E. (1992). RACER: phytoplankton populations in the gerlache strait. Antarct J. US 27, 158–159.
Ferreira A., Costa R. R., Dotto T. S., Kerr R., Tavano V. M., Brito A. C., et al. (2020). Changes in phytoplankton communities along the northern Antarctic peninsula: causes, impacts and research priorities. Front. Mar. Sci. 7. doi: 10.3389/fmars.2020.576254
Ferrigno B. J. G., Cook A. J., Foley K. M., Williams R. S., Swithinbank C., Fox A. J., et al. (2006). Coastal-change and glaciological map of the Trinity Peninsula area and South Shetland Islands, Antarc-tica—1843–2001: U.S. Geological Survey Geologic Investigations Series Map I–2600–A, 1 map sheet, 32-p. text
Forsch K. O., Hahn-Woernle L., Sherrell R. M., Roccanova V. J., Bu K., Burdige D., et al. (2021). Seasonal dispersal of fjord meltwaters as an important source of iron and manganese to coastal Antarctic phytoplankton. Biogeosciences 18 (23), 6349–6375. doi: 10.5194/bg-18-6349-2021
García M. A., Castro C. G., Ríos A. F., Doval M. D., Rosón G., Gomis D., et al. (2002). Water masses and distribution of physico-chemical properties in the Western bransfield strait and gerlache strait during austral summer 1995/96. Deep Sea Res. 2 Top. Stud. Oceanogr 49, 585–602. doi: 10.1016/S0967-0645(01)00113-8
Garibotti I. A., Vernet M., Ferrario M. E. (2005). Annually recurrent phytoplanktonic assemblages during summer in the seasonal ice zone west of the Antarctic peninsula (Southern ocean). Deep Sea Res. 1 Oceanogr Res. Pap 52, 1823–1841. doi: 10.1016/j.dsr.2005.05.003
Garibotti I., Vernet M., Ferrario M., Smith R., Ross R., Quetin L. (2003). Phytoplankton spatial distribution patterns along the western Antarctic peninsula (Southern ocean). Mar. Ecol. Prog. Ser. 261, 21–39. doi: 10.3354/meps261021
Giraldo A., Criales Hernández M. I., Jerez Guerrero M., Mojica Moncada D. F. (2019). Epipelagic copepod assemblage in the gerlache strait (Antarctica) during the 2015 austral summer. Bull. Mar. Coast. Res. 48, 9–26. doi: 10.25268/bimc.invemar.2019.48.1.754
Hahn-Woernle L., Powell B., Lundesgaard Ø., van Wessem M. (2020). Sensitivity of the summer upper ocean heat content in a Western Antarctic peninsula fjord. Prog. Oceanogr 183, 102287. doi: 10.1016/j.pocean.2020.102287
Hamilton M., Mascioni M., Hehenberger E., Bachy C., Yung C., Vernet M., et al. (2021). Spatiotemporal variations in Antarctic protistan communities highlight phytoplankton diversity and seasonal dominance by a novel cryptophyte lineage. mBio 12. doi: 10.1128/mBio.02973-21
Hillebrand H., Claus-Dieter D., Kirschtel D., Pollinger U., Zohary T. (1999). Biovolume calculation for pelagic and benthic microalgae. J. Phycol 35, 403–424.
Höfer J., Giesecke R., Hopwood M. J., Carrera V., Alarcón E., González H. E. (2019). The role of water column stability and wind mixing in the production/export dynamics of two bays in the Western Antarctic peninsula. Prog. Oceanogr 174, 0–1. doi: 10.1016/j.pocean.2019.01.005
Holm-Hansen O., Vernet M. (1990). RACER: phytoplankton distribution and rates of primary production during the austral spring bloom. Antarctic J. 25, 141–144.
Isla E., Masqué P., Palanques A., Guillén J., Puig P., Sanchez-Cabeza J. A. (2004). Sedimentation of biogenic constituents during the last century in western bransfield and gerlache straits, Antarctica: a relation to currents, primary production, and sea floor relief. Mar. Geol 209, 265–277. doi: 10.1016/j.margeo.2004.06.003
Kerr R., Mata M. M., Mendes C. R. B., Secchi E. R. (2018). Northern Antarctic peninsula: a marine climate hotspot of rapid changes on ecosystems and ocean dynamics. Deep Sea Res. 2 Top. Stud. Oceanogr 149, 4–9. doi: 10.1016/j.dsr2.2018.05.006
Kim H., Ducklow H. W., Abele D., Ruiz Barlett E. M., Buma A. G. J., Meredith M. P., et al. (2018). Inter-decadal variability of phytoplankton biomass along the coastal West Antarctic peninsula. Philos. Trans. R. Soc. A: Mathematical Phys. Eng. Sci. 376, 20170174. doi: 10.1098/rsta.2017.0174
Lange P. K., Ligowski R., Tenenbaum D. R. (2018). Phytoplankton in the embayments of king George island (Antarctic peninsula): a review with emphasis on diatoms. Polar Rec. 54, 158–175. doi: 10.1017/S0032247418000232
Lund J. W. G., Kipling C., le Cren E. D. (1958). The inverted microscope method of estimating algal numbers and the statistical basis of estimations by counting. Hydrobiologia 11, 143–170. doi: 10.1007/BF00007865
Lundesgaard Ø., Powell B., Merrifield M., Hahn-Woernle L., Winsor P. (2019). Response of an Antarctic peninsula fjord to summer katabatic wind events. J. Physic Oceanogr 49 (6), 1485–1502. doi: 10.1175/JPO-D-18-0119.1
Lundesgaard Ø., Winsor P., Truffer M., Merrifield M., Powell B., Statscewich H., et al. (2020). Hydrography and energetics of a cold subpolar fjord: andvord bay, western Antarctic peninsula. Prog. Oceanogr 181, 102224. doi: 10.1016/j.pocean.2019.102224
Lynch H. J., Fagan W. F., Naveen R. (2010). Population trends and reproductive success at a frequently visited penguin colony on the western Antarctic peninsula. Polar Biol. 33, 493–503. doi: 10.1007/s00300-009-0726-y
Mandelli E. G., Burkholder P. R. (1966). Primary productivity in the gerlache and bransfield straits of Antarctica. J. Mar. Res. 24, 15–27.
Mascioni M., Almandoz G. O., Cefarelli A. O., Cusick A., Ferrario M. E., Vernet M. (2019). Phytoplankton composition and bloom formation in unexplored nearshore waters of the western Antarctic peninsula. Polar Biol. 42, 1859–1872. doi: 10.1007/s00300-019-02564-7
Mascioni M., Almandoz G. O., Ekern L., Pan B. J., Vernet M. (2021). Microplanktonic diatom assemblages dominated the primary production but not the biomass in an Antarctic fjord. J. Mar. Syst. 224, 103624. doi: 10.1016/j.jmarsys.2021.103624
Menden-Deuer S., Lessard E. J. (2000). Carbon to volume relationships for dinoflagellates, diatoms, and other protist plankton. Limnol Oceanogr 45, 569–579. doi: 10.4319/lo.2000.45.3.0569
Mendes C. R. B., Tavano V. M., Dotto T. S., Kerr R., de Souza M. S., Garcia C. A. E., et al. (2018). New insights on the dominance of cryptophytes in Antarctic coastal waters: a case study in gerlache strait. Deep Sea Res. 2 Top. Stud. Oceanogr 149, 161–170. doi: 10.1016/j.dsr2.2017.02.010
Mendes C. R. B., Tavano V. M., Leal M. C., de Souza M. S., Brotas V., Garcia C. A. E. (2013). Shifts in the dominance between diatoms and cryptophytes during three late summers in the bransfield strait (Antarctic peninsula). Polar Biol. 36, 537–547. doi: 10.1007/s00300-012-1282-4
Meredith M. P., Stammerjohn S. E., Ducklow H. W., Leng M. J., Arrowsmith C., Brearley J. A., et al. (2021). Local- and Large-scale drivers of variability in the coastal freshwater budget of the Western Antarctic peninsula. J. Geophys Res. Oceans 126, 1–22. doi: 10.1029/2021jc017172
Moline M. A., Claustre H., Frazer T. K., Schofield O., Vernet M. (2004). Alteration of the food web along the Antarctic peninsula in response to a regional warming trend. Glob Chang Biol. 10, 1973–1980. doi: 10.1111/j.1365-2486.2004.00825.x
Moline M. A., Prezelin B. B. (1996). Long-term monitoring and analyses of physical factors regulating variability in coastal Antarctic phytoplankton biomass, In situ productivity and taxonomic composition over subseasonal, seasonal and interannual time scales. Mar. Ecol. Prog. Ser. 145, 143–160.
Nowacek D. P., Friedlaender A. S., Halpin P. N., Hazen E. L., Johnston D. W., Read A. J., et al. (2011). Super-aggregations of krill and humpback whales in Wilhelmina bay, Antarctic peninsula. PloS One 6, 2–6. doi: 10.1371/journal.pone.0019173
Oksanen J. (2015). Multivariate analysis of ecological communities in r. Vegan tutorial. 1–43. doi: 10.1016/0169-5347(88)90124-3
Pan B. J., Vernet M., Manck L., Forsch K., Ekern L., Mascioni M., et al. (2020). Environmental drivers of phytoplankton taxonomic composition in an Antarctic fjord. Prog. Oceanogr 183, 102295. doi: 10.1016/j.pocean.2020.102295
Pan B. J., Vernet M., Reynolds R. A., Mitchell B. G. (2019). The optical and biological properties of glacial meltwater in an Antarctic fjord. PloS One 14 (2), e0211107. doi: 10.1371/journal.pone.0211107
Pertierra L., Hughes K. (2013). Management of Antarctic specially protected areas: permitting, visitation and information exchange practices. Antarctic Sci. 25 (4), 553–564. doi: 10.1017/S0954102012001204
R Core Team (2021). R: a language and environment for statistical computing (Vienna, Austria: R Foundation for Statistical Computing). Available at: https://www.R-project.org/.
Rodriguez F., Varela M., Zapata M. (2002). Phytoplankton assemblages in the gerlache and bransfield straits (Antarctic peninsula) determined by light microscopy and CHEMTAX analysis of HPLC pigment data. Deep Sea Res. 2 Top. Stud. Oceanogr 49, 723–747. doi: 10.1016/S0967-0645(01)00121-7
Rozema P. D., Venables H. J., van de Poll W. H., Clarke A., Meredith M. P., Buma A. G. J. (2017). Interannual variability in phytoplankton biomass and species composition in northern Marguerite bay (West Antarctic peninsula) is governed by both winter sea ice cover and summer stratification. Limnol Oceanogr 62, 235–252. doi: 10.1002/lno.10391
Seehaus T., Cook A. J., Silva A. B., Braun M. (2018). Changes in glacier dynamics in the northern Antarctic peninsula since 1985. Cryosphere 12, 577–594. doi: 10.5194/tc-12-577-2018
Spall M. A., Jackson R. H., Straneo F. (2017). Katabatic wind-driven exchange in fjords. J. Geophys Res: Oceans 122 (10), 8246–8262. doi: 10.1002/2017JC013026
Stammerjohn S. E., Martinson D. G., Smith R. C., Yuan X., Rind D. (2008). Trends in Antarctic annual sea ice retreat and advance and their relation to El niño–southern oscillation and southern annular mode variability. J. Geophys Res. 113, C03S90. doi: 10.1029/2007JC004269
Stuecker M. F., Bitz C. M., Armour K. C. (2017). Conditions leading to the unprecedented low Antarctic sea ice extent during the 2016 austral spring season. Geophysical Res. Lett. 44 (17), 9008–9019. doi: 10.1002/2017GL074691
Su Z., Zhang Z., Zhu Y., Zhou M. (2022). Long-term warm–cold phase shifts in the gerlache strait, Western Antarctic peninsula. Front. Mar. Sci. 9. doi: 10.3389/fmars.2022.877043
Sun J., Liu D. (2003). Geometric models for calculating cell biovolume and surface area for phytoplankton. J. Plankton Res. 25, 1331–1346. doi: 10.1093/plankt/fbg096
Torres Parra R. R., Caicedo Laurido A. L., Iriarte Sánchez J. D. (2020). Hydrographic conditions during two austral summer situations, (2015 and 2017) in the gerlache and Bismarck straits, northern Antarctic peninsula. Deep Sea Res. 1 Oceanogr Res. Pap 161, 103278. doi: 10.1016/j.dsr.2020.103278
Trifoglio N. L., Olguín Salinas H. F., Franzosi C. A., Alder V. A. (2022). Annual cycle of phytoplankton, protozoa and diatom species from Scotia bay (South Orkney islands, antarctica): community structure prior to, during and after an anomalously low sea ice year. Prog. Oceanogr 204, 102807. doi: 10.1016/j.pocean.2022.102807
Utermöhl H. (1958). Zur Vervollkommnung der quantitativen Phytoplankton-Methodik (Mitteilungen: Internationale Vereinigung für Theoretische und Angewandte Limnologie) 9(1), 1–38. doi: 10.1080/05384680.1958.11904091
van Leeuwe M. A., Webb A. L., Venables H. J., Visser R. J. W., Meredith M. P., Elzenga J. T. M., et al. (2020). Annual patterns in phytoplankton phenology in Antarctic coastal waters explained by environmental drivers. Limnol Oceanogr 65, 1–18. doi: 10.1002/lno.11477
Vernet M. (1992). RACER: predominance of cryptomonads and diatoms in the gerlache strait. Antarct J. US 27, 157–158.
Vernet M., Kozlowski W., Yarmey L., Lowe A., Ross R., Quetin L., et al. (2012). Primary production throughout austral fall, during a time of decreasing daylength in the western Antarctic peninsula. Mar. Ecol. Prog. Ser. 452, 45–61. doi: 10.3354/meps09704
Vernet M., Letelier R. M., Karl D. M. (1991). RACER: phytoplankton growth rates in northern gerlache strait during the spring bloom of 1989. Antarct J. US 26, 154–156.
Wu Q. (2020). Geemap: a Python package for interactive mapping with Google earth 875 engine. J. Open Source Software 5, 2305.
Zhou M., Niiler P. P., Hu J. H. (2002). Surface currents in the bransfield and gerlache straits, Antarctica. Deep Sea Res. 1 Oceanogr Res. Pap 49, 267–280. doi: 10.1016/S0967-0637(01)00062-0
Keywords: thermal front, diatoms, cryptophytes, prasinophytes, phytoplankton succession, Citizen Science
Citation: Mascioni M, Almandoz GO, Cusick A, Pan BJ and Vernet M (2023) Phytoplankton dynamics in nearshore regions of the western Antarctic Peninsula in relation to a variable frontal zone in the Gerlache Strait. Front. Mar. Sci. 10:1139293. doi: 10.3389/fmars.2023.1139293
Received: 06 January 2023; Accepted: 17 April 2023;
Published: 02 May 2023.
Edited by:
Ibon Galparsoro, Technological Center Expert in Marine and Food Innovation (AZTI), SpainReviewed by:
Sarat Chandra Tripathy, National Centre for Polar and Ocean Research (NCPOR), IndiaTristan Biggs, Royal Netherlands Institute for Sea Research (NIOZ), Netherlands
Copyright © 2023 Mascioni, Almandoz, Cusick, Pan and Vernet. This is an open-access article distributed under the terms of the Creative Commons Attribution License (CC BY). The use, distribution or reproduction in other forums is permitted, provided the original author(s) and the copyright owner(s) are credited and that the original publication in this journal is cited, in accordance with accepted academic practice. No use, distribution or reproduction is permitted which does not comply with these terms.
*Correspondence: Martina Mascioni, marmascioni@gmail.com; martinamascioni@fcnym.unlp.edu.ar