The influence of sources and solid phase extraction criteria on dissolved organic matter optical properties in aquatic systems
 Chia-Ying Anderin Chuang*
  Yun-Hsuan Ho
- Research Center for Environmental Changes, Academia Sinica, Taipei, Taiwan
The integrity of studies investigating the composition of dissolved organic matter (DOM) is heavily dependent on the sampling and instrumental techniques employed. In this study, we aimed to assess the impacts of both the source of the DOM and the solid phase extraction (SPE) criteria on changes to the optical properties of DOM. Samples were collected from various aquatic environments, ranging from headwaters to the open ocean. The extraction kinetics of DOM were monitored throughout the SPE process, with alterations to the DOM verified using optical properties derived from chromophoric dissolved organic matter (CDOM), including absorbance and fluorescence measurements. The fluorescence excitation-emission matrices (EEMs) were further analyzed using PARAllel FACtor analysis (PARAFAC) to resolve the underlying chemical components. Results indicate that the reaction of DOM to acidification required for polystyrene-divinylbenzene polymer sorbent SPE varies across samples. And this variability may stem from differences in functional groups and DOM sources. The maximum carbon loading observed was 9.7 mg C per 1 g PPL, which is a widely used styrene-divinylbenzene polymer sorbent, and no overloading was noted. The dissolved organic carbon (DOC) extraction efficiency (EE) ranged from 51.5-61.5% and 27.6-40.0% for post- and extract- calculations, respectively, with no significant differences in DOC EE observed among different initial DOC concentrations, salinities, and flowrates. The differences in DOC EE across diverse sources and changes in optical proxies resulting from PPL extraction were mainly due to the heterogeneity of DOM. PPL extraction altered the overall molecular characteristics of DOM from more labile to more refractory or degraded in the open ocean and headwater source samples. Notably, high and low flowrates yielded identical SPE-DOM extraction and alterations. The results indicate that DOM sources primarily control SPE EE rather than methodological or other environmental factors. PPL SPE results in a convergence of DOM variability. These findings provide crucial insights into inter-study comparisons and the interpretability of SPE-derived DOM data from samples across diverse aquatic environments.
1 Introduction
The aquatic dissolved organic matter (DOM) contains tens of thousands of organic molecules that support food webs in aquatic systems. Since Krogh and Keys (1934) developed the method to determine dissolved organic carbon (DOC) in seawater, we have made significant strides in understanding the global perspective of DOC in the oceans (Hansell et al., 2021). While the concentration of DOC is regularly measured from environmental samples to enhance our understanding of global organic carbon biogeochemical cycles, the effect of DOM composition on its reactivity is not yet fully comprehended (Hansell et al., 2009, and references therein). The heterogeneity of DOM is inherited from its original sources. The source of DOM is dependent on the surrounding environment and the organic matter present. For instance, rivers might have mostly terrestrial sources from forests and agricultural lands and are comprised of plant-derived organic matter. Open ocean water may have mostly aquatic sources from algae and aquatic plants and is mostly composed of algal-derived organic matter. The source of DOM also varies with water depth in the ocean. The surface water is often influenced by atmospheric inputs, like precipitation and deposition, and is rich in easily degradable, low molecular weight compounds. In contrast, deeper waters receive inputs of organic matter from sinking particles and the remineralization of dead phytoplankton and zooplankton. This results in a more complex mixture of DOM with a higher molecular weight and greater resistance to degradation. Ocean currents and mixing also play a role in the distribution of DOM in the water column, with some areas acting as sinks and others as sources. The processing and degradation of DOM may also affect its composition. The typical method of identifying the source of DOM involves using various analytical techniques, such as isotopic analysis (e.g., Benner et al., 1997), UV-Vis and fluorescence spectroscopy (e.g., Kruger et al., 2011), and molecular-level characterization (e.g., Kaiser et al., 2003). These techniques allow researchers to differentiate between DOM originating from different sources, including terrestrial or aquatic vegetation, soils, and microbial activity. Combining multiple techniques can provide a more comprehensive understanding of the sources and transformation pathways of DOM in natural systems.
Since the reactivity of DOM is primarily determined by its origins and thus compositions, and the comprised compounds exist in different aquatic environments in only trace amounts, it is necessary to enlarge the extraction volume and advance instrumentation detection limits to improve signal resolution and avoid alternation from sampling methods. The sorbent-based solid phase extraction (SPE) technique developed by Leenheer (1981) has long been used for DOM extractions in natural water, wastewater, and reclaimed water samples, with several adaptations over time (Liška, 2000, and references therein). Various types of commercially available sorbents, e.g., C18 (octadecyl carbon chain bonded silica) (Dittmar et al., 2008; Spencer et al., 2010; Kruger et al., 2011), XAD (cross-linked polystyrene, polyacrylate) (Aiken et al., 1979; Spencer et al., 2010; Perminova et al., 2014), PPL (styrene-divinylbenzene copolymer) (Adou et al., 2001; Dittmar et al., 2008; Wünsch et al., 2018), and HLB (hydrophilic/lipophilic balance) (Raeke et al., 2016; Arellano et al., 2018; Zou et al., 2020), are applied to extract hydrophobic/hydrophilic DOM from different aquatic samples for further compositional analyses.
However, the extent to which the extracted materials are representative of the original DOM and the specific properties that may have been altered during the extraction process remain important questions. DOM commonly contains various heteroatoms with different functionality and hydrophobicity. Recovery thus strongly depends on the sorbent materials and DOM compositions in water samples. While the C18 sorbent tends to retain non-polar compounds, polystyrene-functionalized divinylbenzene-based sorbent extracts DOM with a broader range of hydrophobicity. Since its introduction by Dittmar et al., 2008, the use of PPL sorbent has been widely accepted as a more effective method for extracting DOM in terms of recovery, when compared to C18 cartridges (Repeta, 2015; Arellano et al., 2018). Some efforts have also been made to compare the structural and compositional changes in the DOM pool through SPE. For example, Chen et al. (2016) found a decrease of aromaticity after the extraction, suggesting a preferential exclusion of aromatic DOM structures via fluorescence spectroscopy, FT-ICR-MS, and size exclusion chromatography with organic carbon detector (SEC-OCD); Arellano et al. (2018) also observed DOM fractionation through SPE. Three types of sorbents (C-18, HLB, and PPL) showed comparable extraction efficiencies of lignin-oxidized products for coastal samples. PPL obtained the highest DOC recoveries both in the river and coastal waters.
In this study, water samples from various aquatic environments, including headwaters, downriver water, estuary, and open ocean water at the surface (SSW), the depth of fluorescence maximum (FMSW), as well as deep sea (DSW) were used to test the source and compositional effect on DOM extraction. UV-Vis and fluorescence measurements were applied to demonstrate differences in DOM sources among the six distinct environments studied. The effects of critical SPE variables such as loading mass, elution solvent, extraction efficiency (EE), flowrates, pH adjustment, and PPL sorbent selectivity on optical properties were also systematically reviewed. The extraction kinetics of DOM were monitored throughout the SPE process, with alterations to the DOM verified using optical properties derived from chromophoric dissolved organic matter (CDOM), including absorbance and fluorescence measurements. The fluorescence excitation-emission matrices (EEMs) were further analyzed using PARAllel FACtor analysis (PARAFAC) to resolve the underlying chemical components (Murphy et al., 2013). We examined the impact of frequently utilized PPL sorbent extraction on optical indices, aiming to offer valuable insights for interpreting optical data obtained from DOM extracted from water samples in diverse aquatic environments.
2 Methodology
2.1 Sample collection and preparation
The sampling map and the scheme of the experimental process are shown in (Figures 1, 2). Samples were collected using acid-cleaned GoFlo bottles on-site or Niskin bottles onboard from different aquatic environments as follows: (1) Upstream Headwater samples were collected in the Fei-Tsui Dam at a depth of 2 m in January 2020; (2) River water samples were collected at about a 0.5 m depth in Tamsui River in January 2020, with the downriver site being in the populated area in Taipei, the capital of Taiwan, while the Estuary samples were collected at high tide; and (3) Open ocean samples were collected onboard at the sea surface with the depth of fluorescence maximum and deep ocean set at 10 m (SSW), 62 m (FMSW) and 3000 m (DSW) respectively, over a 10-day cruise in September 2019 in the South China Sea. Six water source samples were thereafter classified as Headwater, downriver, estuary, SSW, FMSW and DSW. All water samples were prefiltered through capsule filters (1 µm, GWV, Pall), and aliquots of this filtrate, representing the original water properties (hereafter referred to as “Bulk”), were taken during capsule filtration and subsequently stored at -20 °C for further analyses. The remaining permeate samples were immediately acidified to pH 2-2.5 (HCl, 36.5 - 38.0%, J.T.Baker®) and stored in acid-cleaned polypropylene carboys for PPL SPE. DOC concentrations, absorbance, and fluorescence were measured for all aliquots and SPE subsamples.
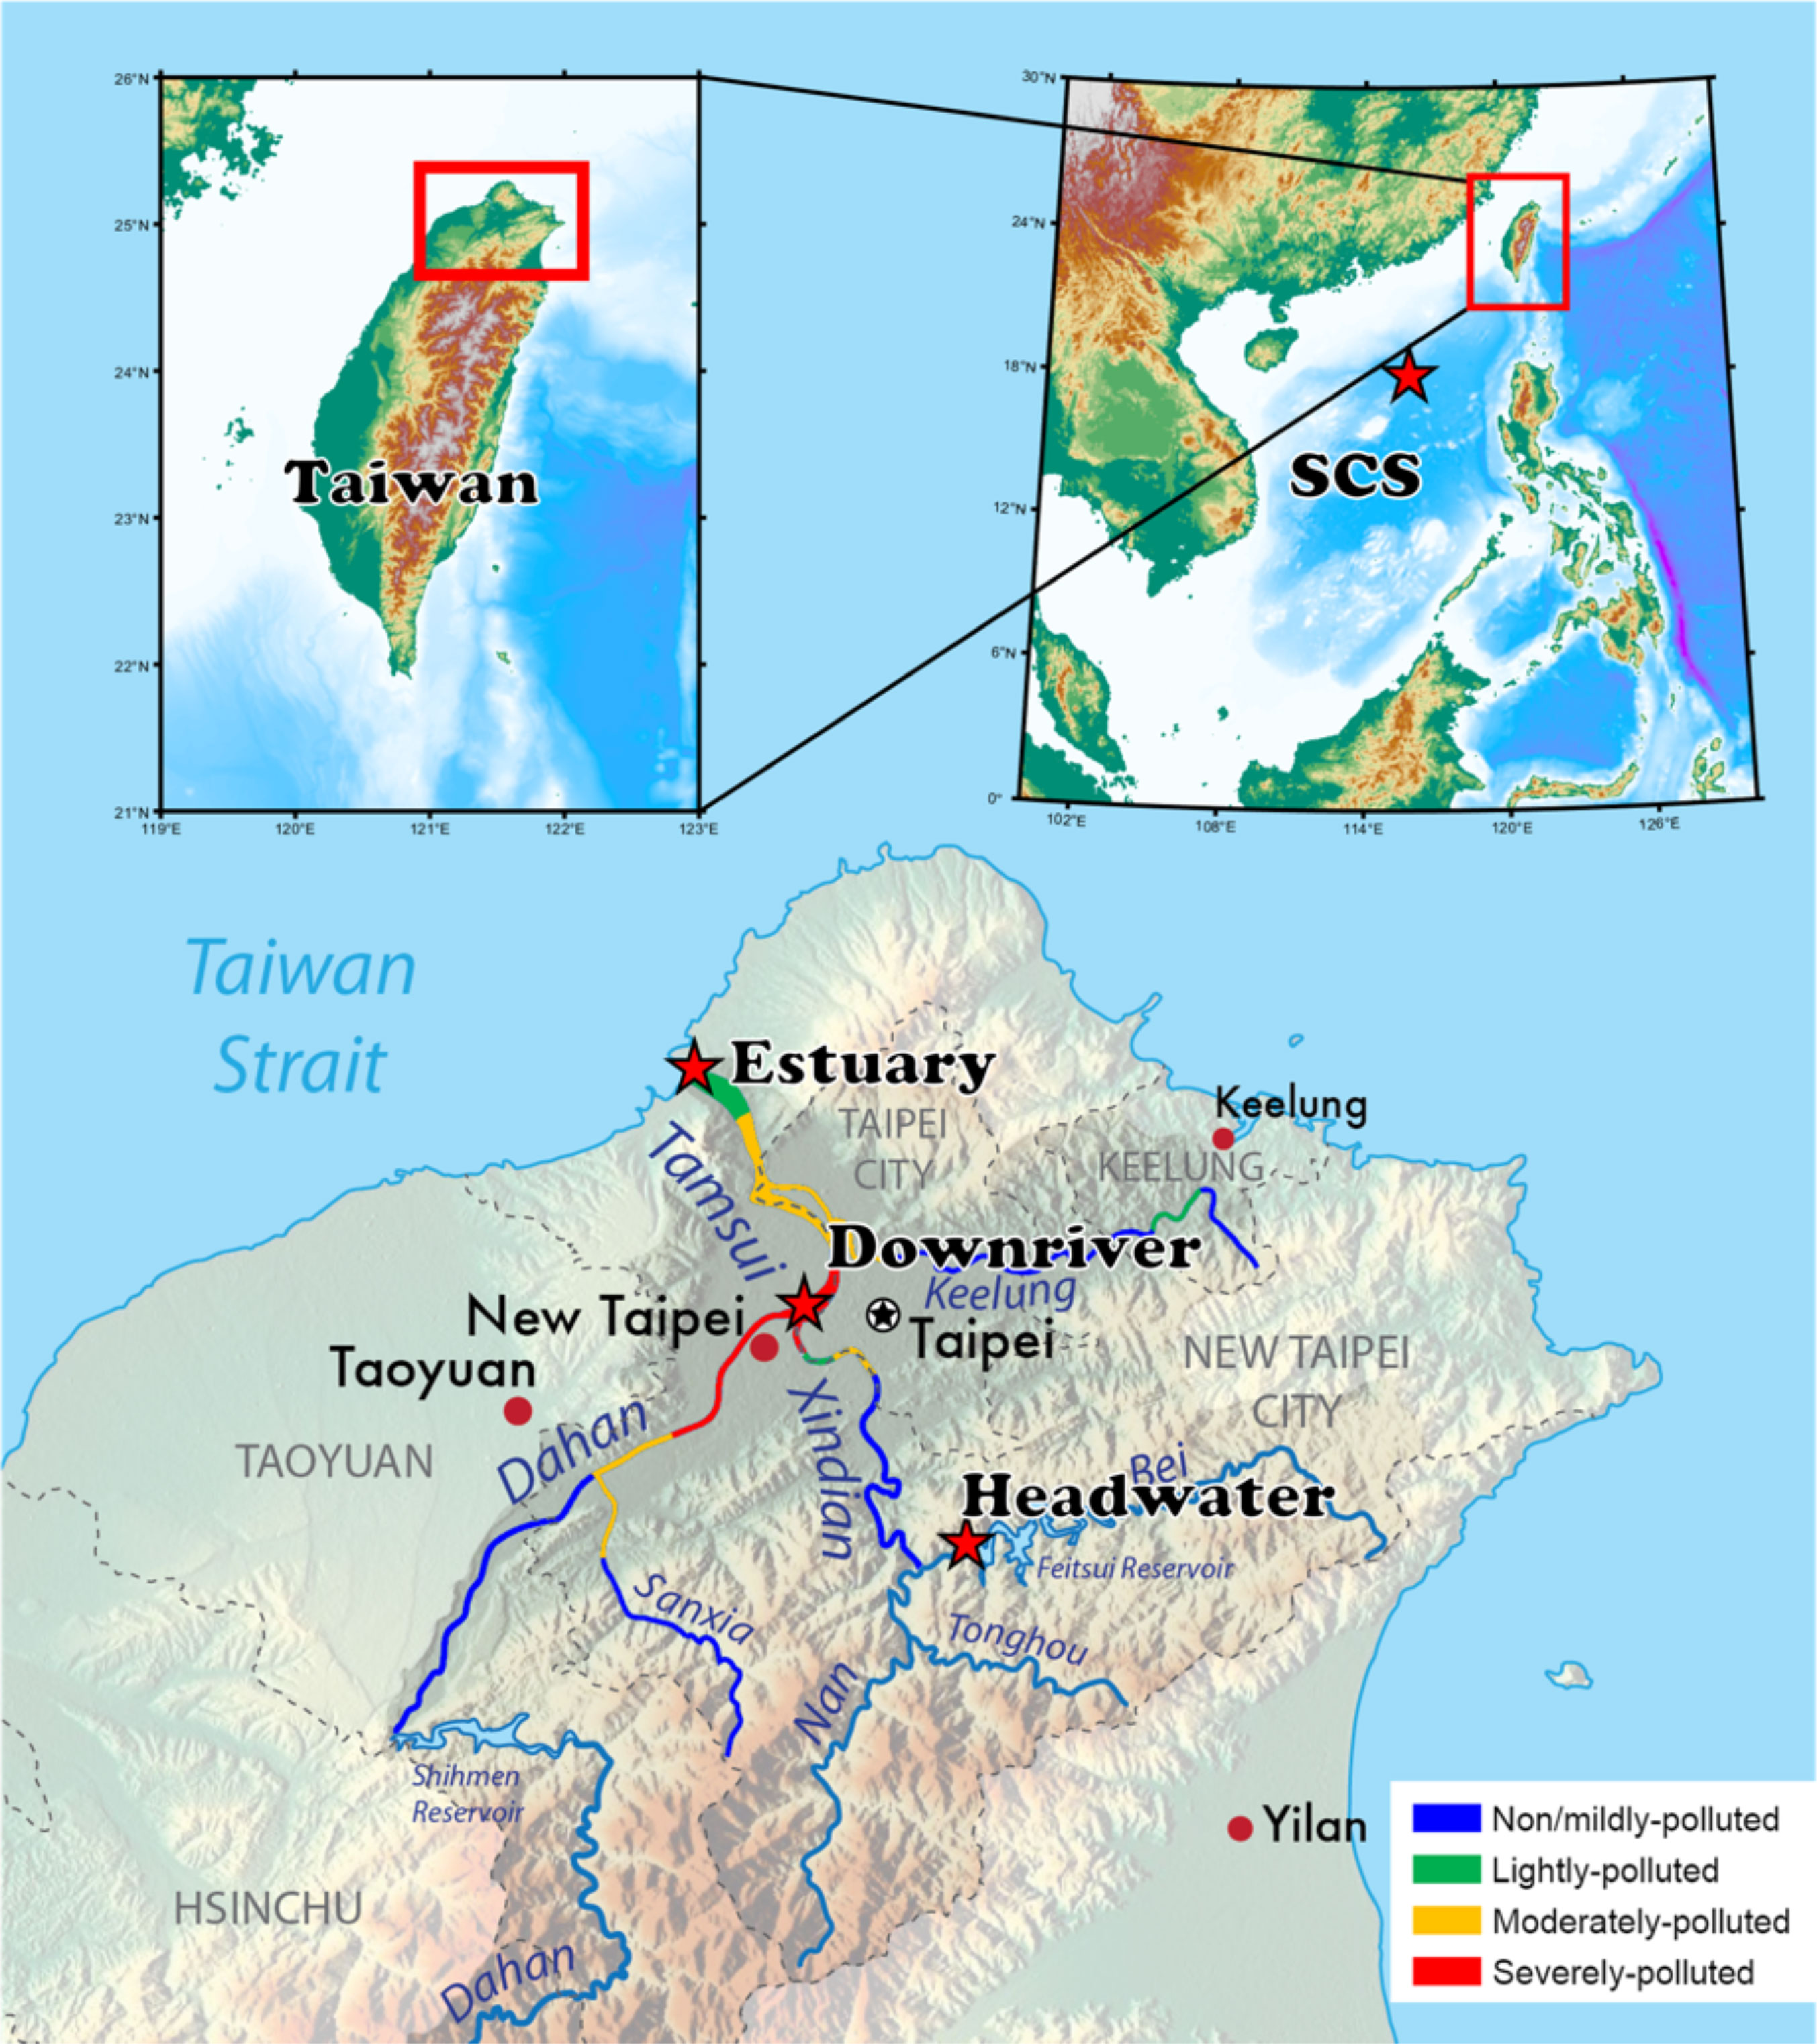
Figure 1 Map showing locations of sampling sites (red stars) and the River Pollution Index (RPI) of Tamsui River in 2019 December (colored river cource). RPI data was obtained directly from the quality monitoring system of the Environmental Protection Administration, Taiwan (https://wq.epa.gov.tw/EWQP/en/Default.aspx).
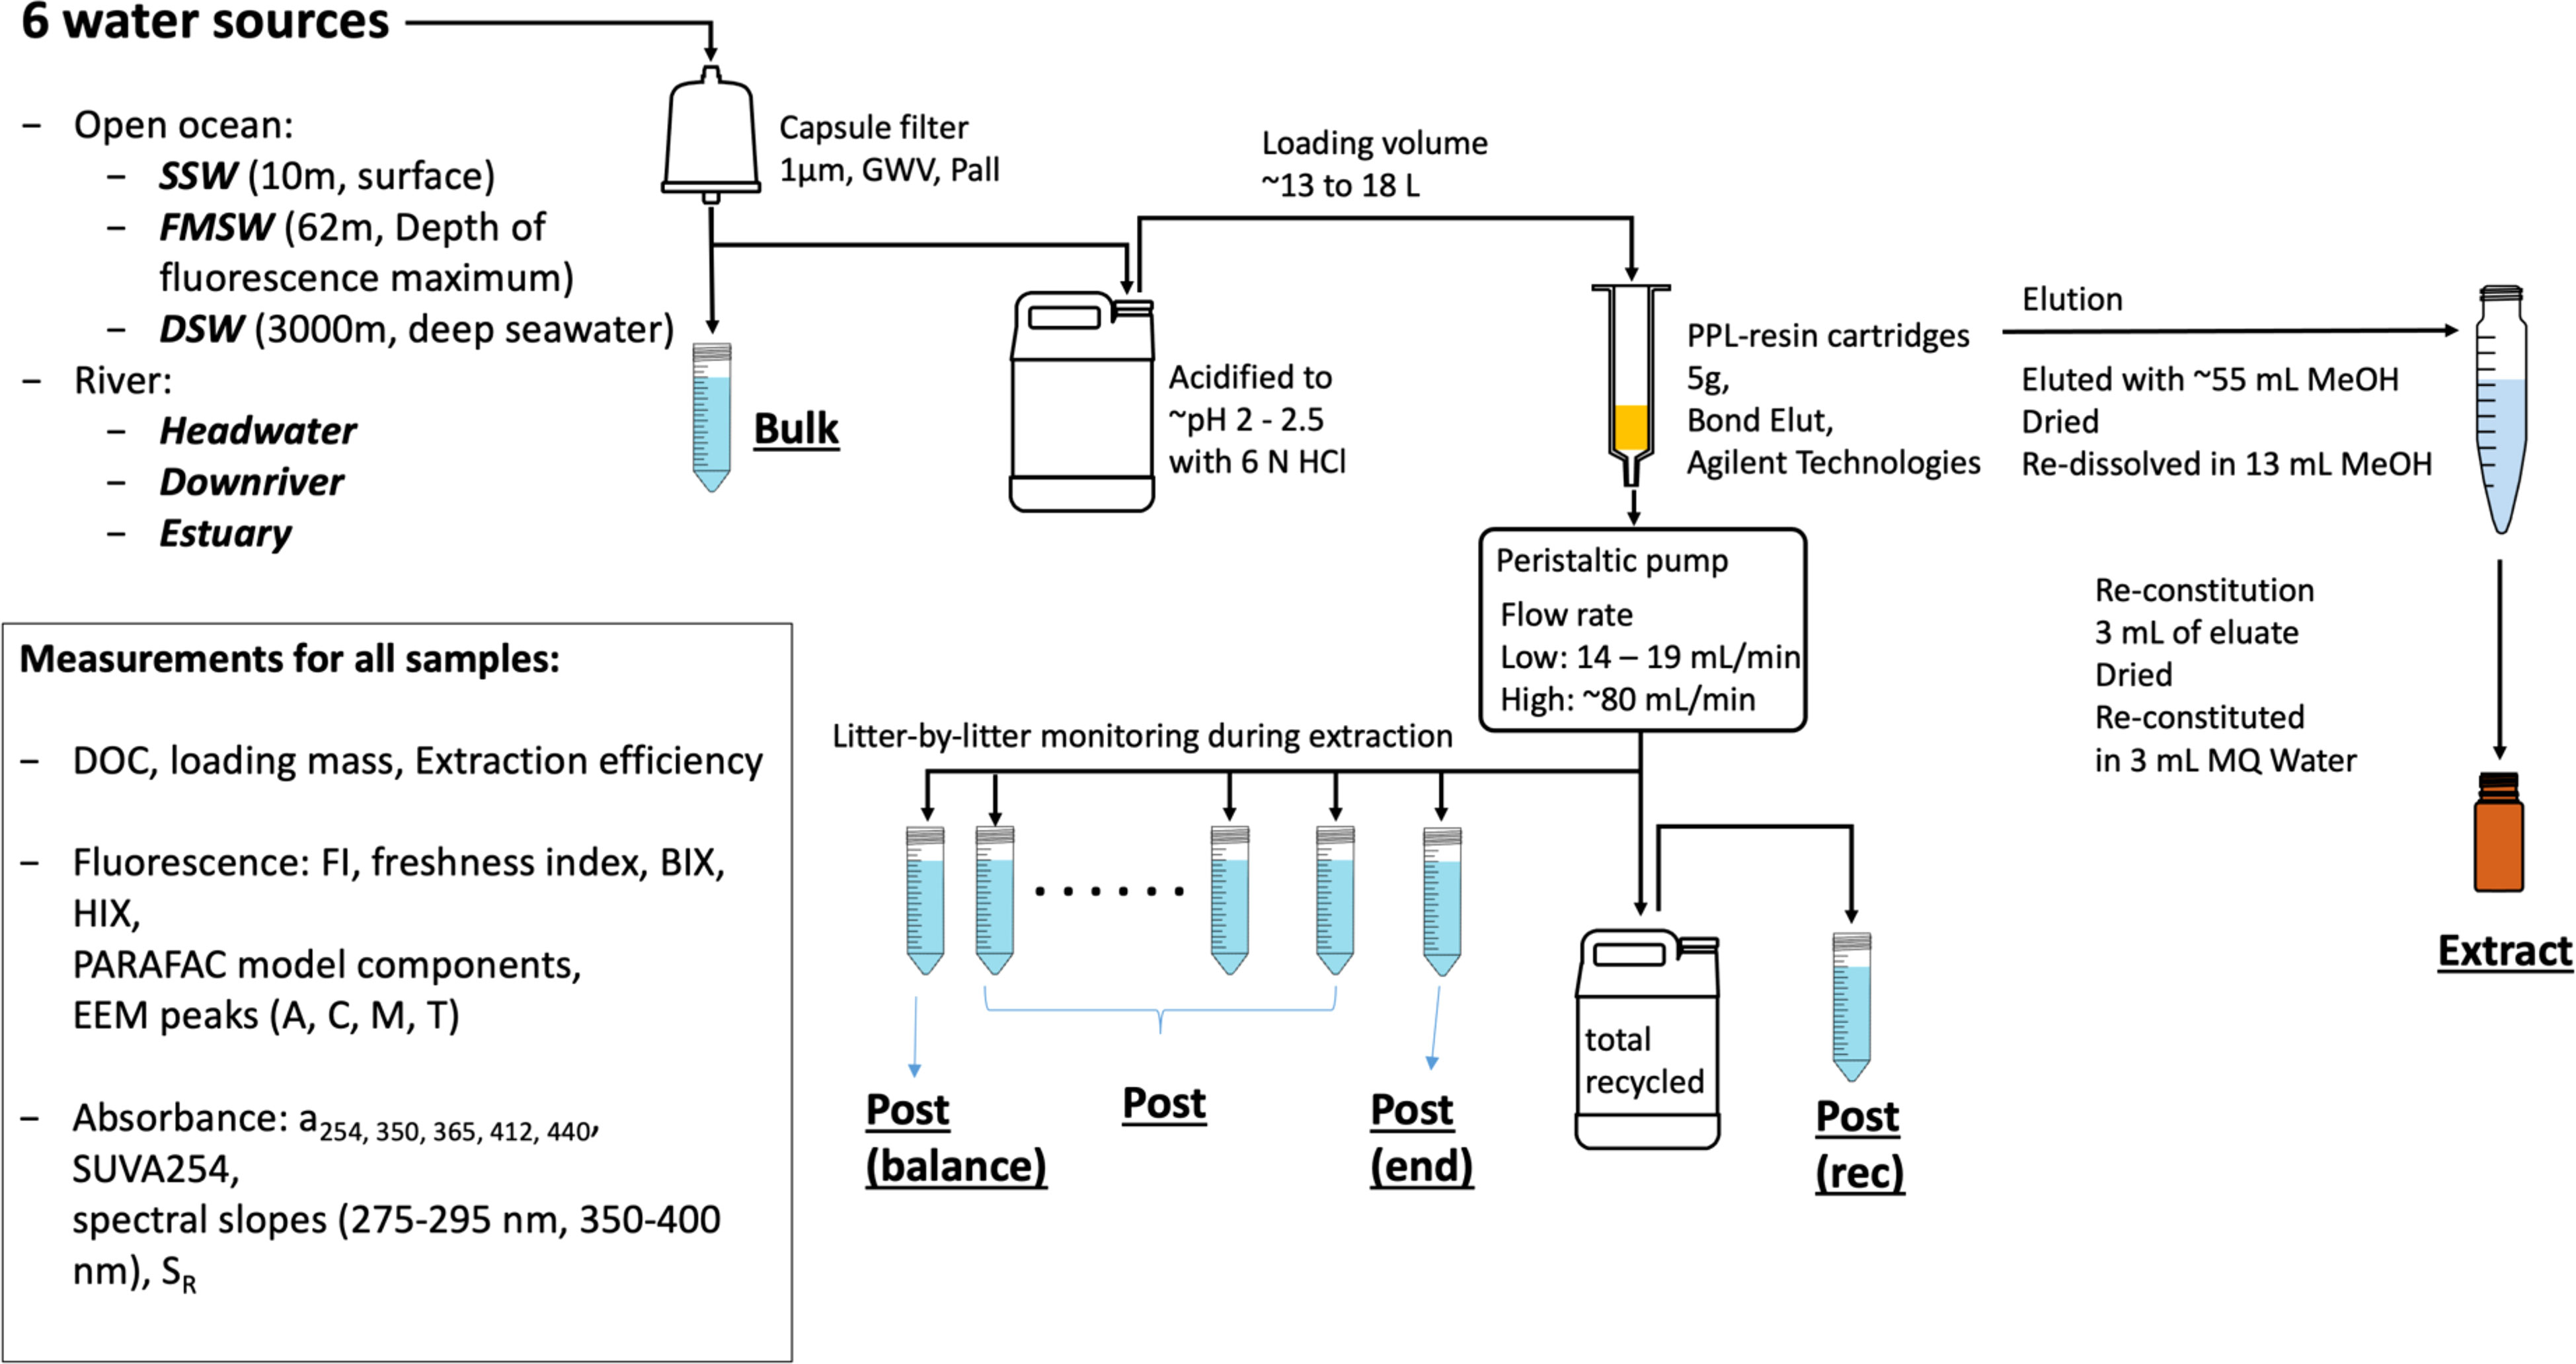
Figure 2 Experimental scheme of this study.
2.2 Acidification effects
As the PPL SPE method requires acidification (Dittmar et al., 2008), we conducted a parallel experiment using six identical source water samples to assess the impact of pH on optical proxies. Prefiltered samples with a volume of approximately 50 mL each (<1 µm, GWV, Pall) were acidified from their original pH of ~8 to pH 2-2.5 (36.5 - 38.0% HCl, J.T.Baker®). DOC concentrations, absorbance, and fluorescence were measured both before and after acidification. PARAllel FACtor analysis (PARAFAC, details described in 2.5) and split-half analysis were applied to 12 acquired excitation emission matrices (EEMs) to validate the effect of acidification on optical properties.
2.3 Solid phase extraction
The DOM SPE procedure followed the methodology described in Dittmar et al. (2008) and is illustrated in Figure 2. Bond Elut PPL cartridges (5 g, Agilent Technologies) were used for the SPE and were initially rinsed with reagent-grade methanol (1x cartridge volume) followed by Milli-Q water (5x cartridge volume) and acidified Milli-Q water (pH ~2 with hydrochloric acid). Six water source samples, which were pre-filtered and acidified (detailed in Table 1), with total volumes ranging from approximately 13 to 18 L, were applied onto the PPL cartridges using a peristaltic pump at a low flowrate of approximately 15 mL/min. An additional set of three replicated riverine water samples (headwater, downstream, and estuary) were extracted at a high flowrate of approximately 80 mL/min to investigate the effect of flowrate.
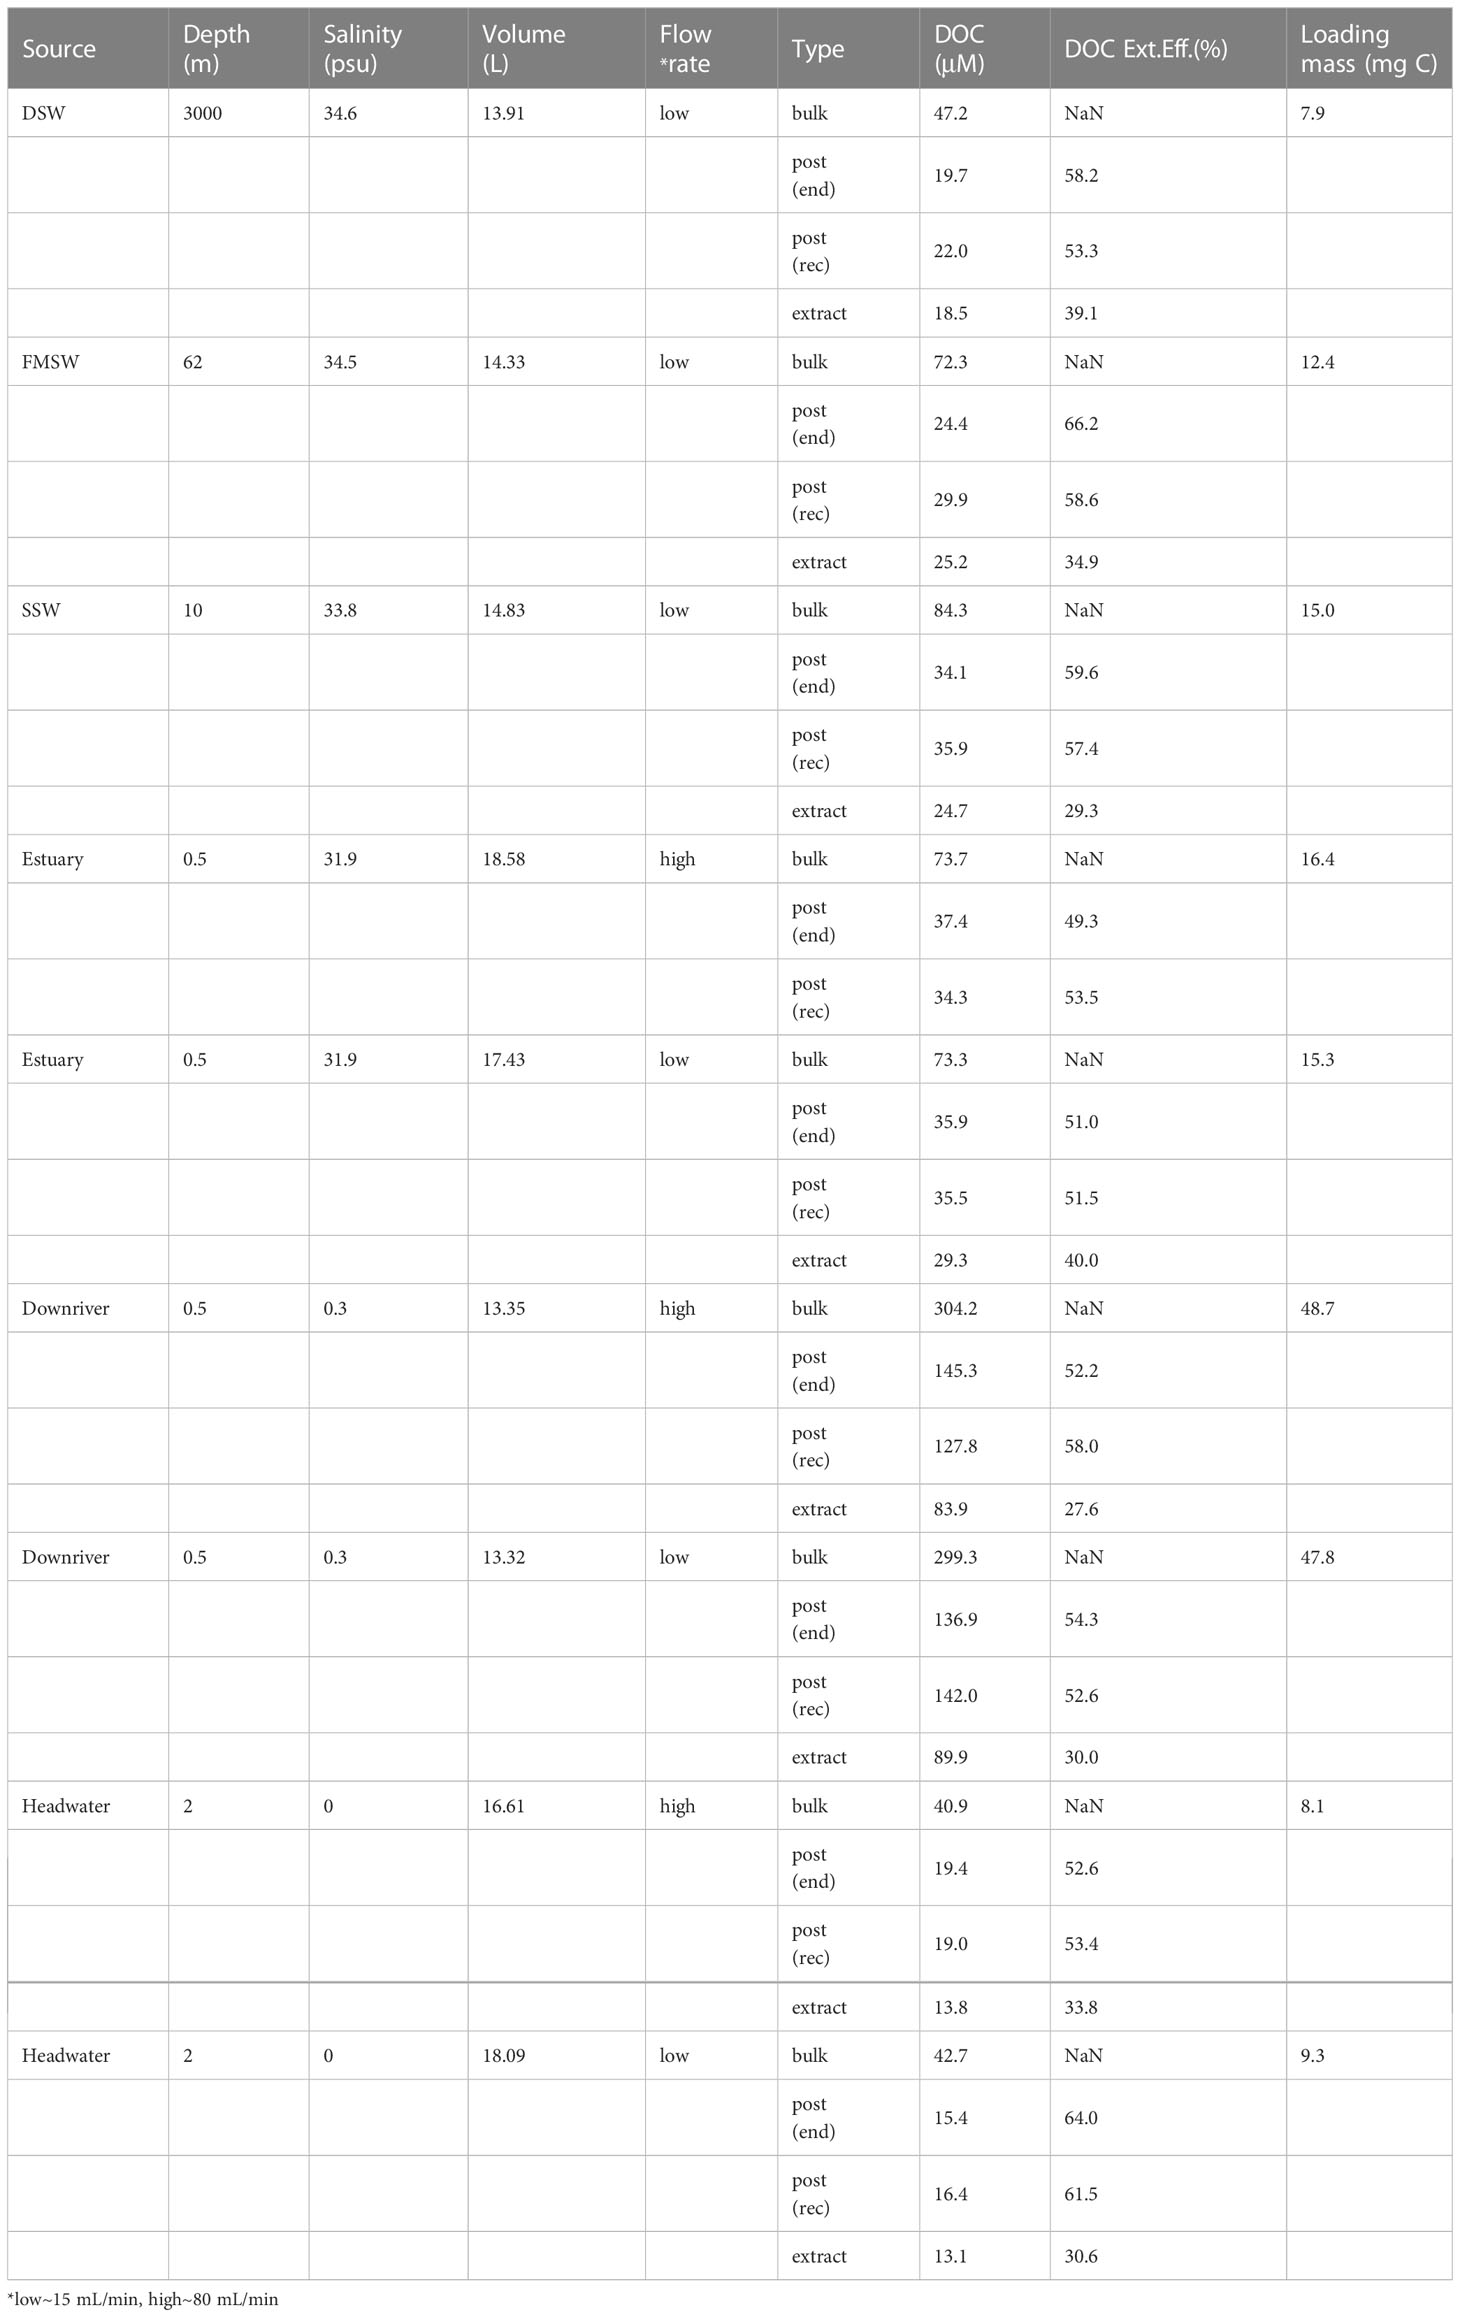
Table 1 Extraction and DOC information of six source samples.
For each water source sample, permeates were transferred to an acid-cleaned carboy (Figure 2), and subsamples were taken directly from the PPL cartridge outflow at approximately every liter interval to monitor sorbent performance and DOM compositional changes during the extraction process (post-PPL collecting order: post(balance), posts, and post(end)). Post(rec) was collected from the total recycled carboy after extraction to represent the overall post-extraction water properties. Inorganic residues such as salts were removed by flushing the cartridges with a 5x-cartridge-volume of acidified Milli-Q water immediately after extraction. The cartridges were then stored at 4°C until further processing. The DOM extracts were eluted using approximately 1x-cartridge-volume of methanol (~55 mL).
We also conducted elution in triplicate using methanol, acetonitrile, and acetone to confirm the adequacy of methanol for elution. The elutes were first evaporated at room temperature under a gentle stream of N2, following the methods of Dittmar et al. (2008), and then dried in an oven at 65 °C as described by Chen et al. (2016). The dried DOM extracts were then re-dissolved in 13 mL of methanol. For optical and DOC measurements, 3 mL of the re-dissolved extracts in methanol were dried again with N2 stream, and reconstituted in MQ water as per Chen et al. (2016).
2.4 DOC and spectroscopic measurements of CDOM
DOC concentrations were measured using the 680°C combustion catalytic oxidation method with a Shimadzu TOC-L analyzer. Before combustion, inorganic carbon (IC) was removed through acidification and sparging processes. To measure absorbances between 250 and 800 nm (increment 1 nm), a PerkinElmer Lambda 35 UV/VIS spectrophotometer was used with a 10 cm quartz cuvette. The baseline was calculated as the mean absorbance above 700 nm subtracted from the absorption spectrum, as described by Helms et al. (2008). The specific absorbances obtained were then converted to absorption coefficients, (m-1), for further calculation of indices, also following Helms et al. (2008). The absorption coefficients were expressed as
where A is absorbance at specific wavelength Λ, and l is the path length (m).
The fluorescence measurements were acquired using a HORIBA FluoroMax-4 fluorometer equipped with a 1 cm quartz cuvette. The instrument detected fluorescence emission between wavelengths of 290 and 599 nm (in increments of 3 nm) with an integration time of 1 s at excitation wavelengths ranging from 240 to 500 nm (in increments of 5 nm). The instrument automatically performed signal correction during the measurement. To mitigate and correct for the inner filter effect (IFE), the extracts were diluted prior to the measurements (Ohno, 2002).
2.5 Optical indices and extraction efficiency
PARAFAC analysis was applied on 167 EEMs using the drEEM (v.0.6.2) toolbox for Matlab to resolve the underlying components of fluorescent DOM (Murphy et al., 2013). IFE correction, Raman normalization, scatter bands removal and faulty parts excision were preprocessed following Kothawala et al. (2013). Fluorescence indices included EEM peaks (A, C, M, and T), peak ratios (Coble, 1996; Parlanti et al., 2000), fluorescence index (FI) (McKnight et al., 2001), fluorescence freshness index (Parlanti et al., 2000; Gabor et al., 2014), biological index (BIX) (Huguet et al., 2009; Gabor et al., 2014), humification index (HIX) (Ohno, 2002), fluorescence intensity maxima (FMax) of PARAFAC model resolved components (Murphy et al., 2013). Absorbance indices included absorption coefficients at specific wavelengths (250, 254, 350, 365, 412, and 440 nm), spectral slopes (S275-295 and S350-400), slope ratio (SR) (Helms et al., 2008), and SUVA254 (Weishaar et al., 2003). Detailed definitions of these indices are provided in Table 2.
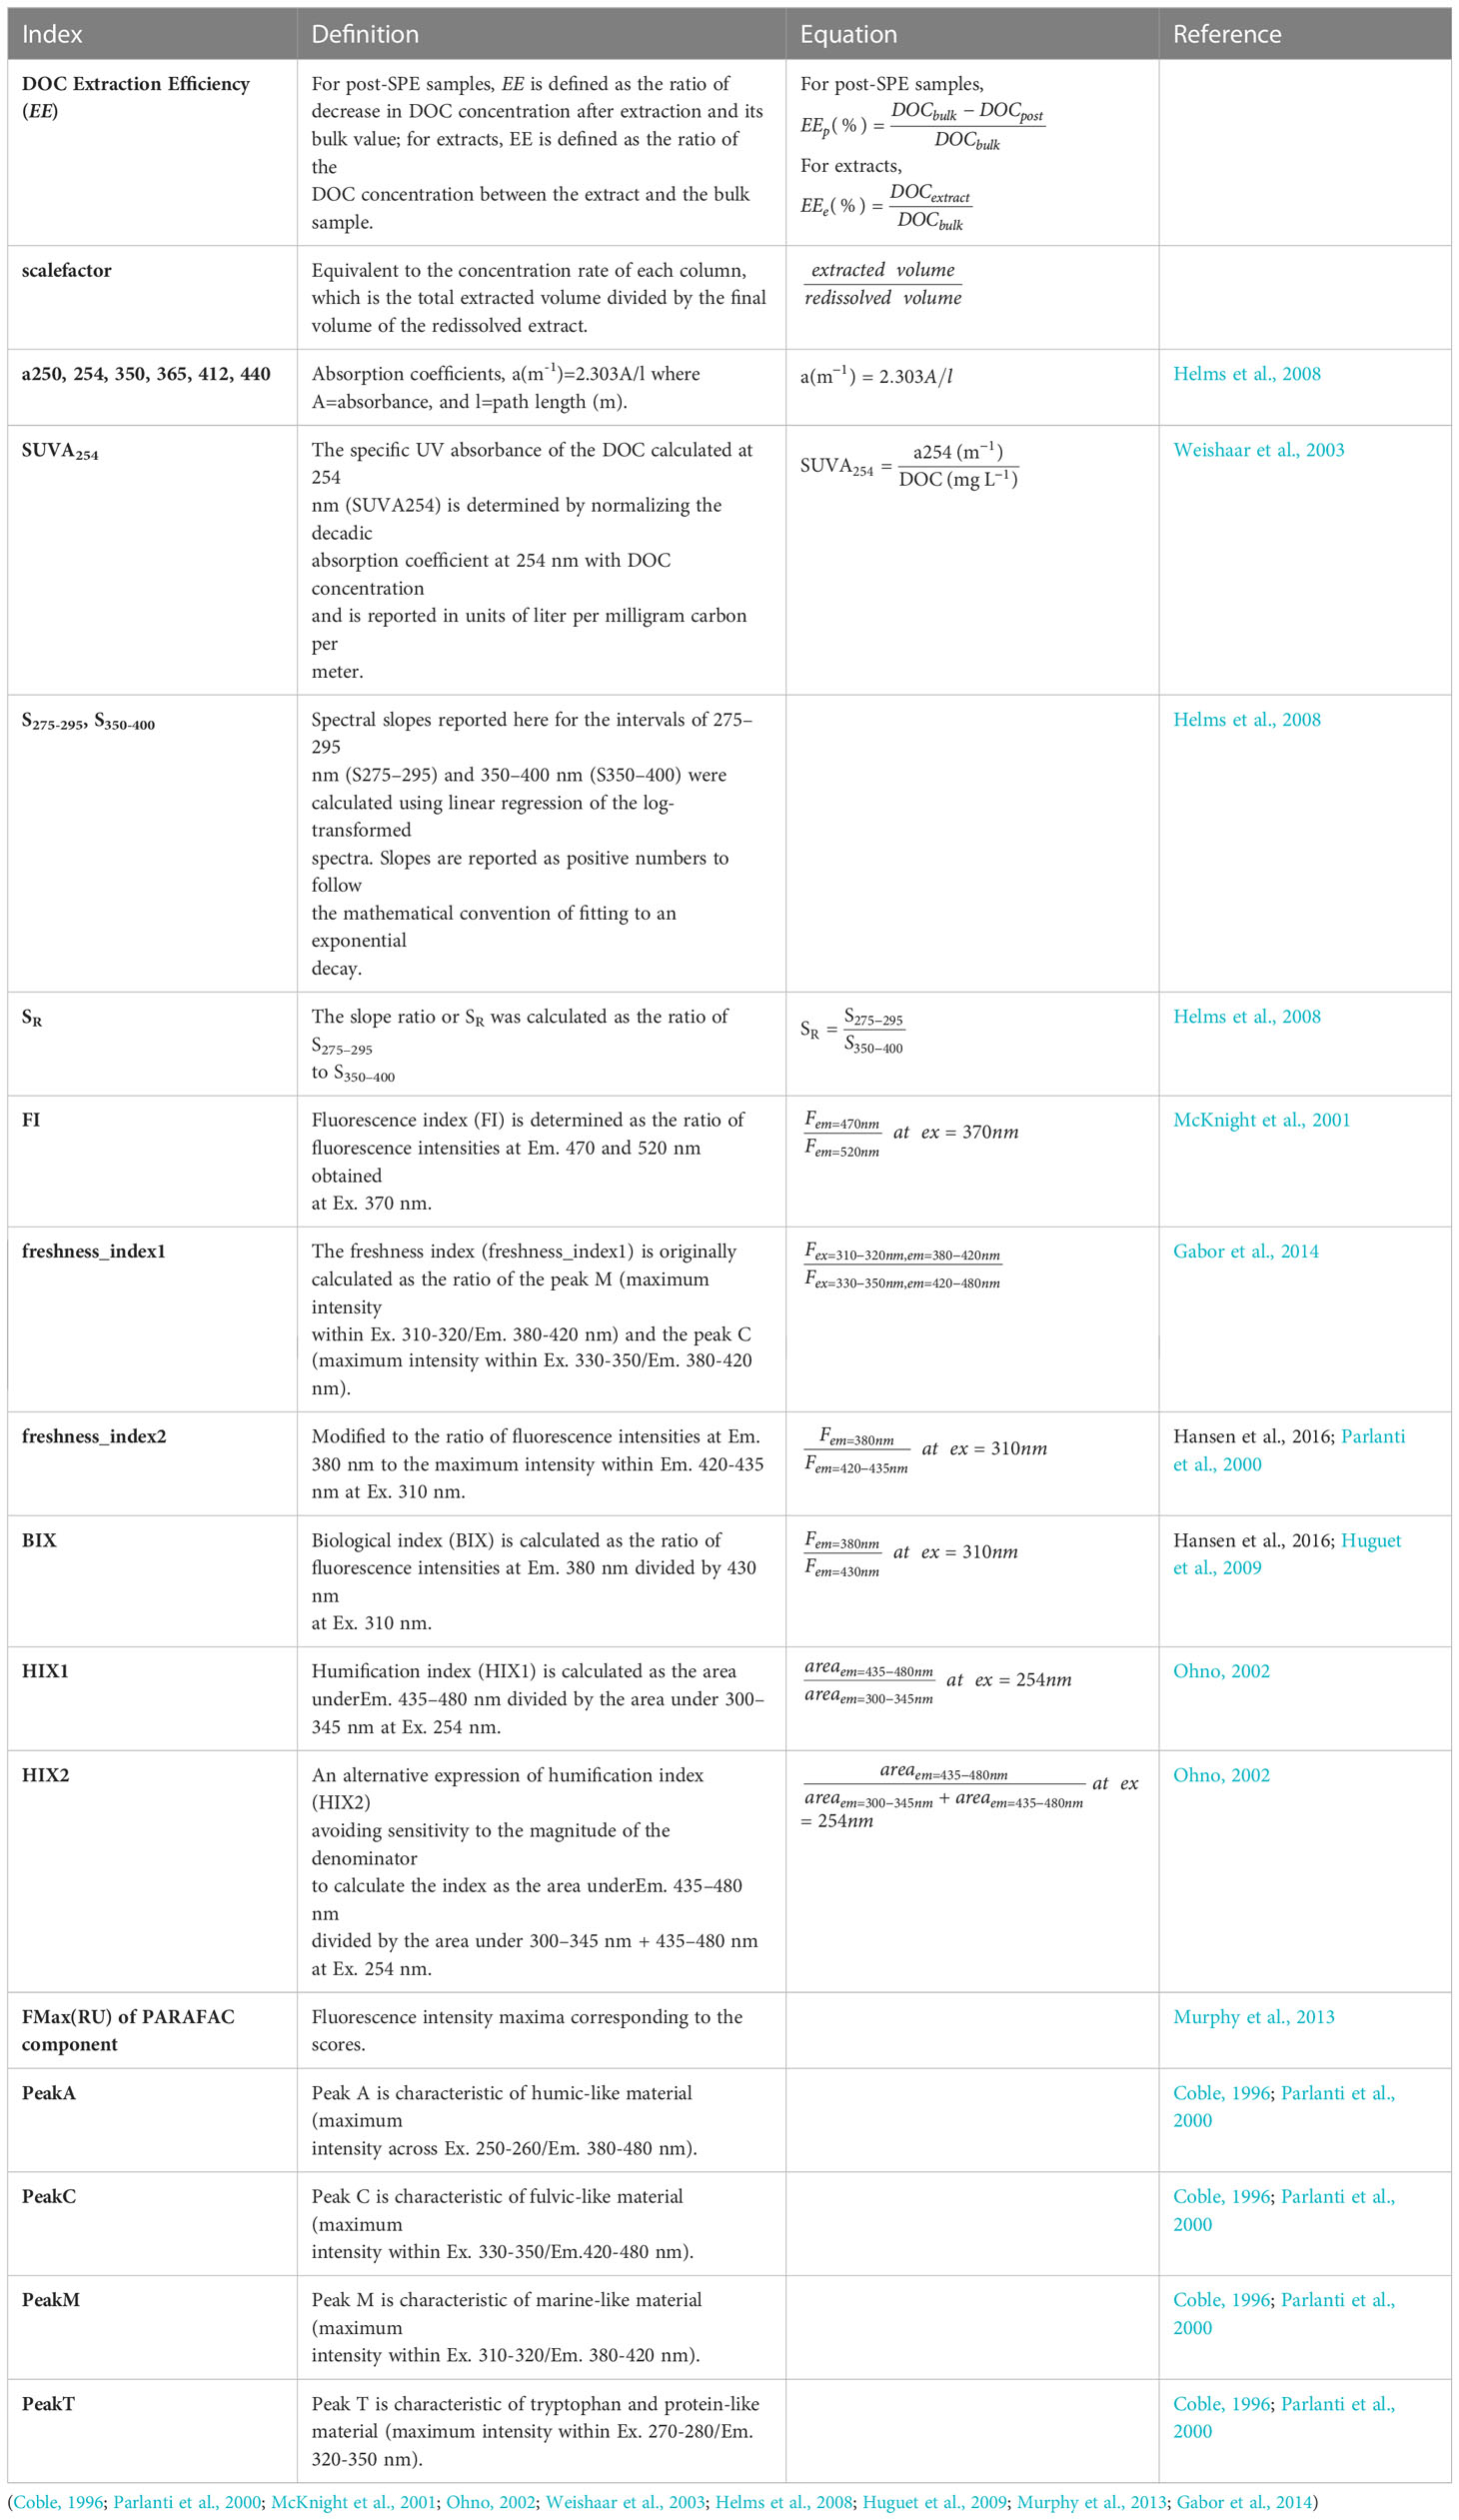
Table 2 Definition for referenced optical indices.
To compare the bulk, all post-SPE, and the extracts, as well as estimate the extraction efficiency (EE), all measured results of the extracts were divided by the scale factor, defined as
where Vbulk is the volume of the bulk water that was applied to the PPL column, and Vextract is the final volume of the re-dissolved extracts. In all types of samples, only extracts were diluted, and we used the criteria of Ohno (2002) who identified an upper threshold absorbance at 254 nm (A254) of 0.3 in a 1 cm cuvette for accurately correcting the humification index (HIX). HIX is a ratio of peak areas across emission spectra (435-480 nm/300-345 nm) at a single excitation wavelength (254 nm).
Extraction efficiencies (EE) of DOC were assessed by comparing each post-SPE (post-balance, post, post-end, and post-rec) sample and the extract with its corresponding bulk one, respectively. For post-SPE samples, EEis defined as the ratio of decrease in the DOC contents after extraction and its bulk value, and is expressed as
For the extracts, EE is defined as the ratio of the DOC contents between the extract and the bulk, and is expressed as
where denotes the measured DOC concentrations, and the subscripts represent the corresponding types of samples.
2.6 Statistical analyses
The sample t-test, ANOVA, discriminant and principal component analyses (PCA) were performed using IBM® SPSS 28, JMP® 16, and MATLAB R2018b. Significant differences were considered with a p-value of<0.05.
3 Results and discussion
3.1 Sample storage and pH effects
Aliquots were taken after filtration and frozen for DOC and optical properties analyses. It is well known that environmental factors such as pH and storage condition (freeze/thew) might may change DOM properties to a different extent, mainly due to its heterogeneous nature as stated in Spencer et al., 2007 and many other studies, e.g., Nachimuthu et al. (2020); Peacock et al. (2015); Wünsch et al. (2018). In particular, Spencer et al. (2007) tested samples frozen for up to 1 year to assess the impact of freeze/thew with significant changes being observed on optical proxies. In a later study, Peacock et al. (2015) showed that the loss of DOC resulting from freezing is strongly dependent on storage time, with ~5% being lost within 3 months. Additionally, Nachimuthu et al. (2020) further investigated the method of storage, refrigeration (4°C) versus freezing (-18°C), and found storage time affected DOC and TOC fractions in runoff water. Based on these findings, it is suggested that runoff water samples should be frozen immediately after collection for DOC measurements although to date, there is no consensus on having a universal applied storage condition. In this study, all experiments and measurements were completed within three months of sample collection to minimize possible freezing effects.
As for pH, Spencer et al. (2007) collected 35 fresh water DOM samples in a United Kingdom study and found that “at the typical pH levels observed in freshwater systems, little change was observed on the spectrophotometric parameters measured … thus highlighting that changes in DOM concentration and composition measured by these techniques are typically due to other processes and are not merely a function of pH change.” Moreover, analyses from Wünsch et al. (2018) indicated that changes in pH (mostly from 8 to 7) did not lead to significant changes in PARAFAC spectra of a Suwannee River NOM extract (IHSS standard 2R101N).
It is crucial to consider the impact of acidification on the comparison of bulk and extracted DOM to evaluate the effect of extraction protocols on DOM properties. This is particularly relevant given that acidification is a necessary step for PPL to extract DOM from samples. In this study, water samples collected from six diverse sources were used to investigate the effects of pH adjustments (from their original pH ~8 to pH ~2.5) on SPE-DOM optical proxies. Changes in absorbance and fluorescence EEMs from acidification are shown in (Figures 3, 4) respectively, with absorbances at the lower wavelength ranging from 250 to 300 nm being slightly increased after samples were acidified (Figure 3). For fluorescence, changes of traditional peaks (A, C, M, and T, marked in the black box in each EEM) were mostly between ± 20% (as illustrated in Figure 4). Furthermore, twelve EEMs (6 before pH adjustments and 6 after pH adjustments) were split into two groups (original vs. acidified) to test if the same model could be obtained when modelling different groups (original, acidified, and as a whole). Results indicated that split-half analysis was achieved (p=0.95; % p criterion for the spectral match) (Murphy et al., 2013) and a four-component PARAFAC model was resolved (Figure 5), explaining 99.87% of the dataset variability. Overall, with such extensive pH changes (from pH~8 to 2~2.5), the response of DOM to acidification varied across samples. This variability may stem from differences in functional groups and DOM sources.
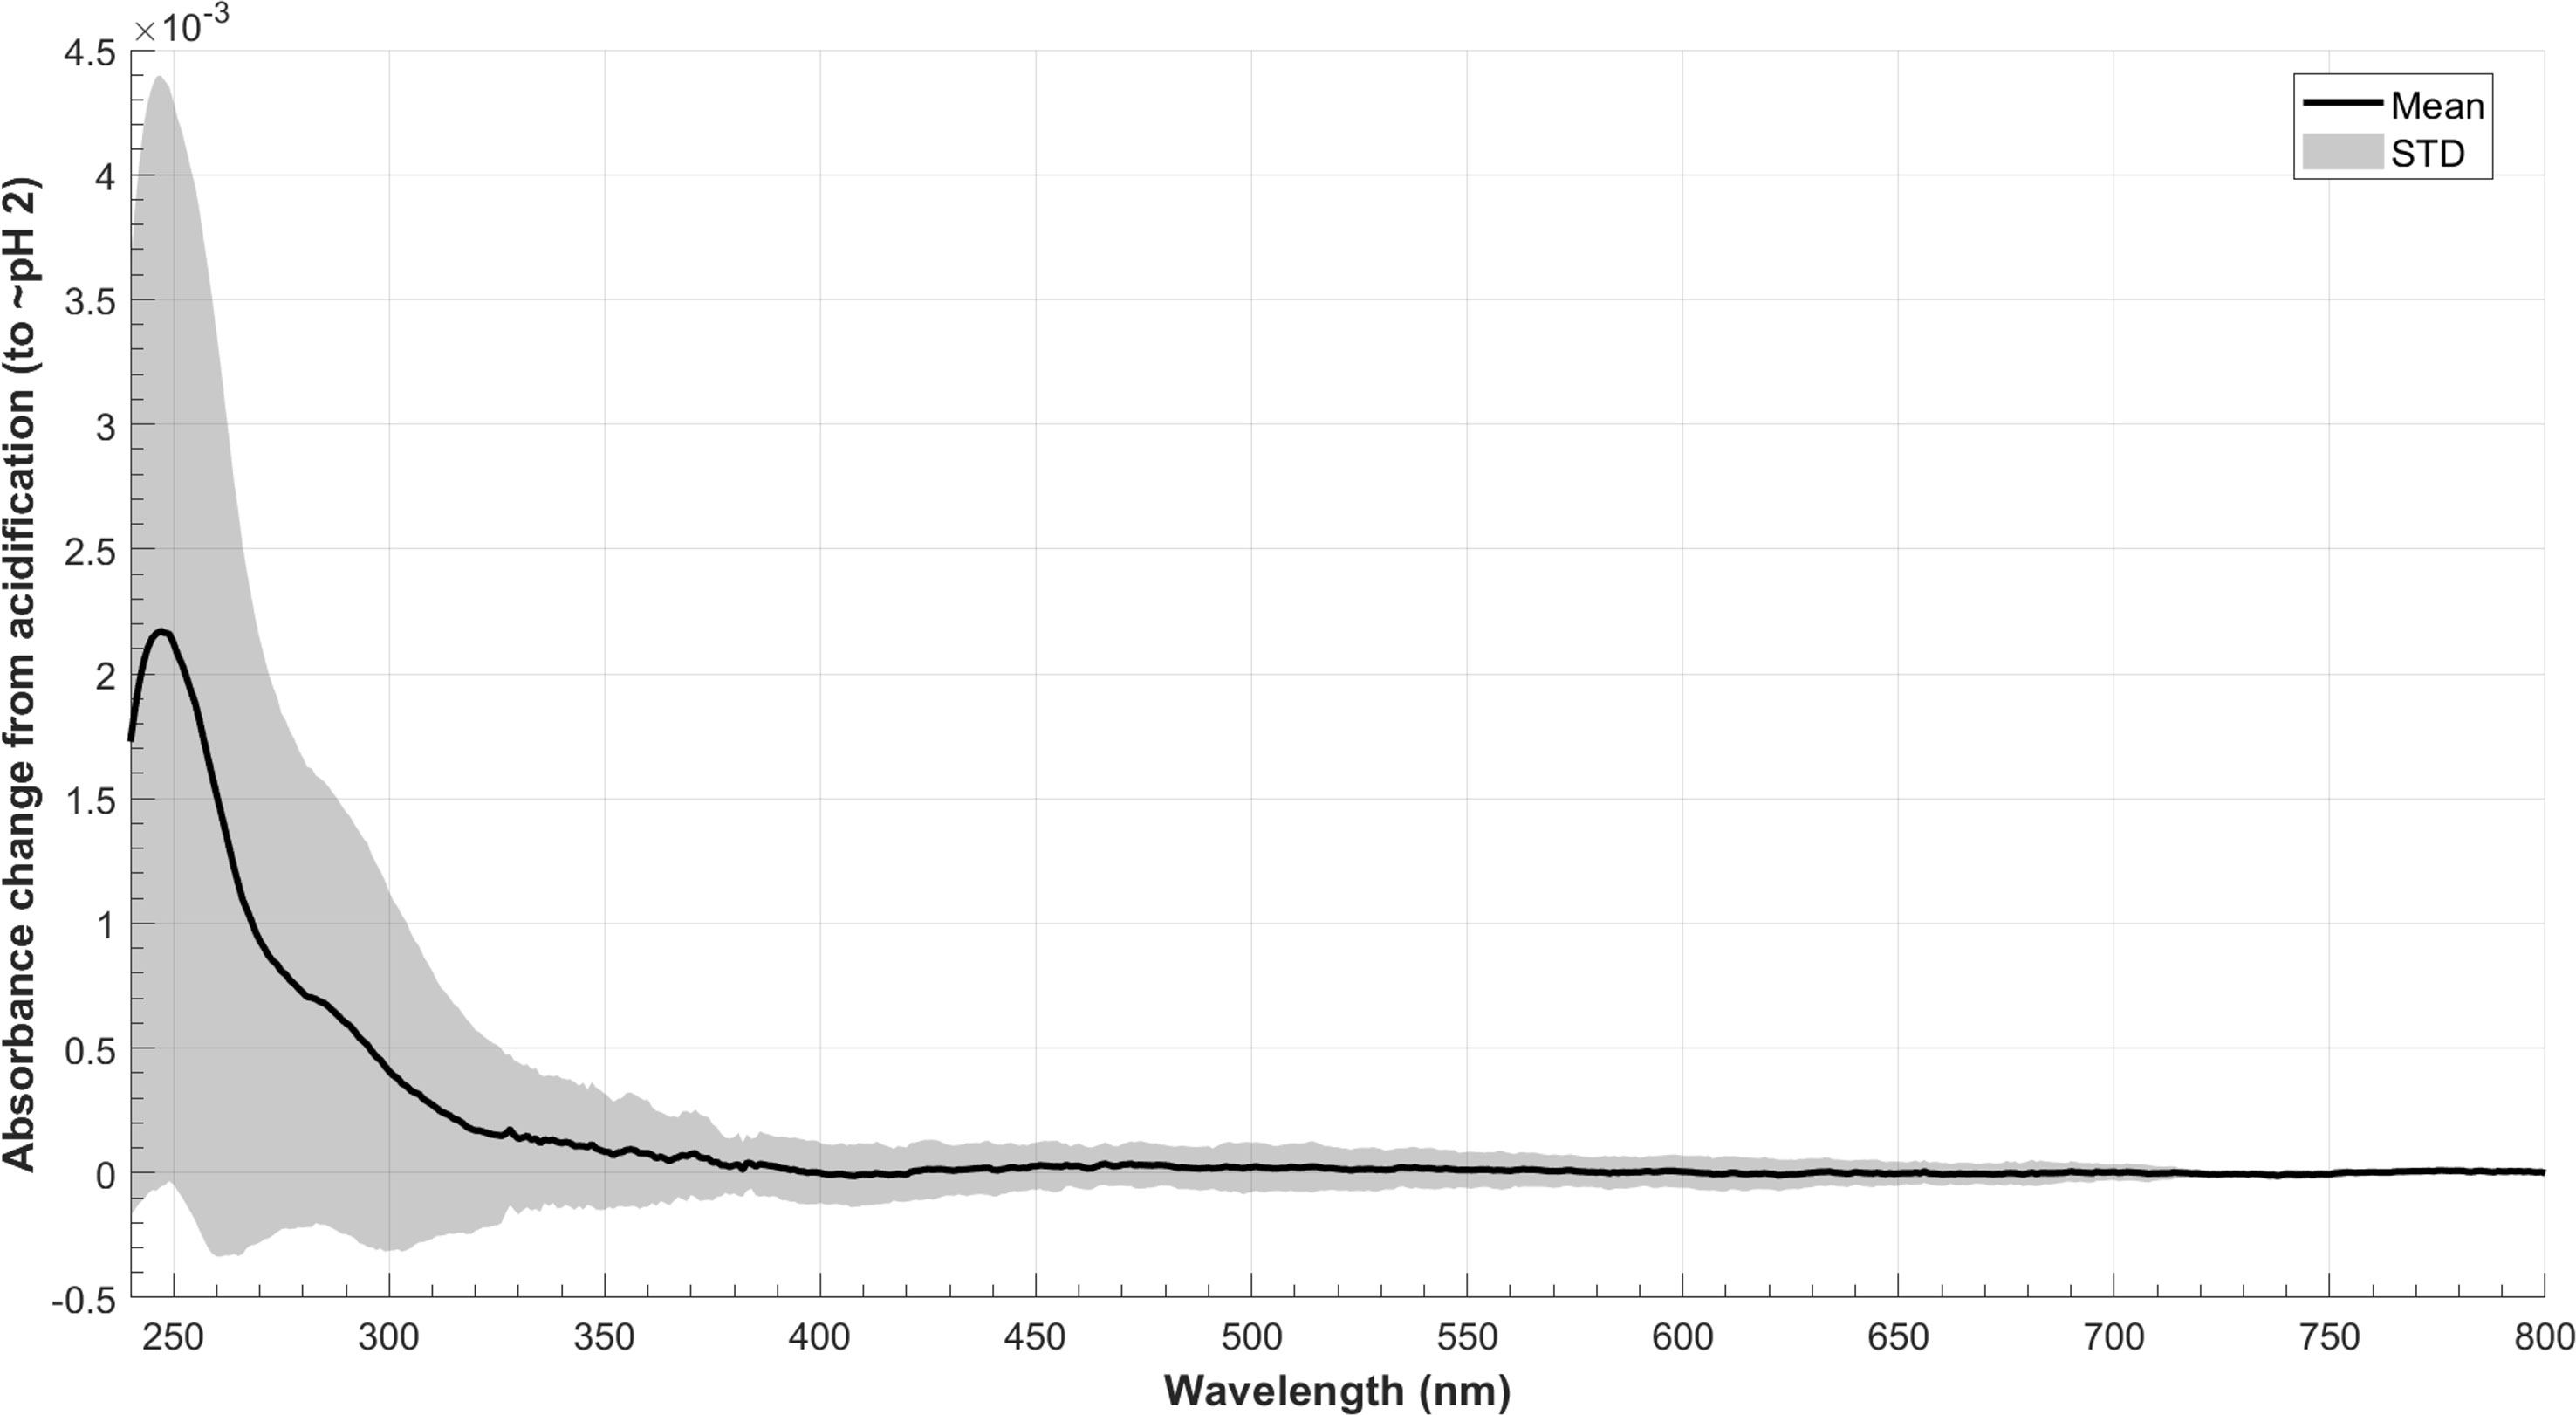
Figure 3 Average changes in absorbance of six source waters from acidification (n=6; acidified minus original; solid line shows the average; grey area shows the standard deviation).
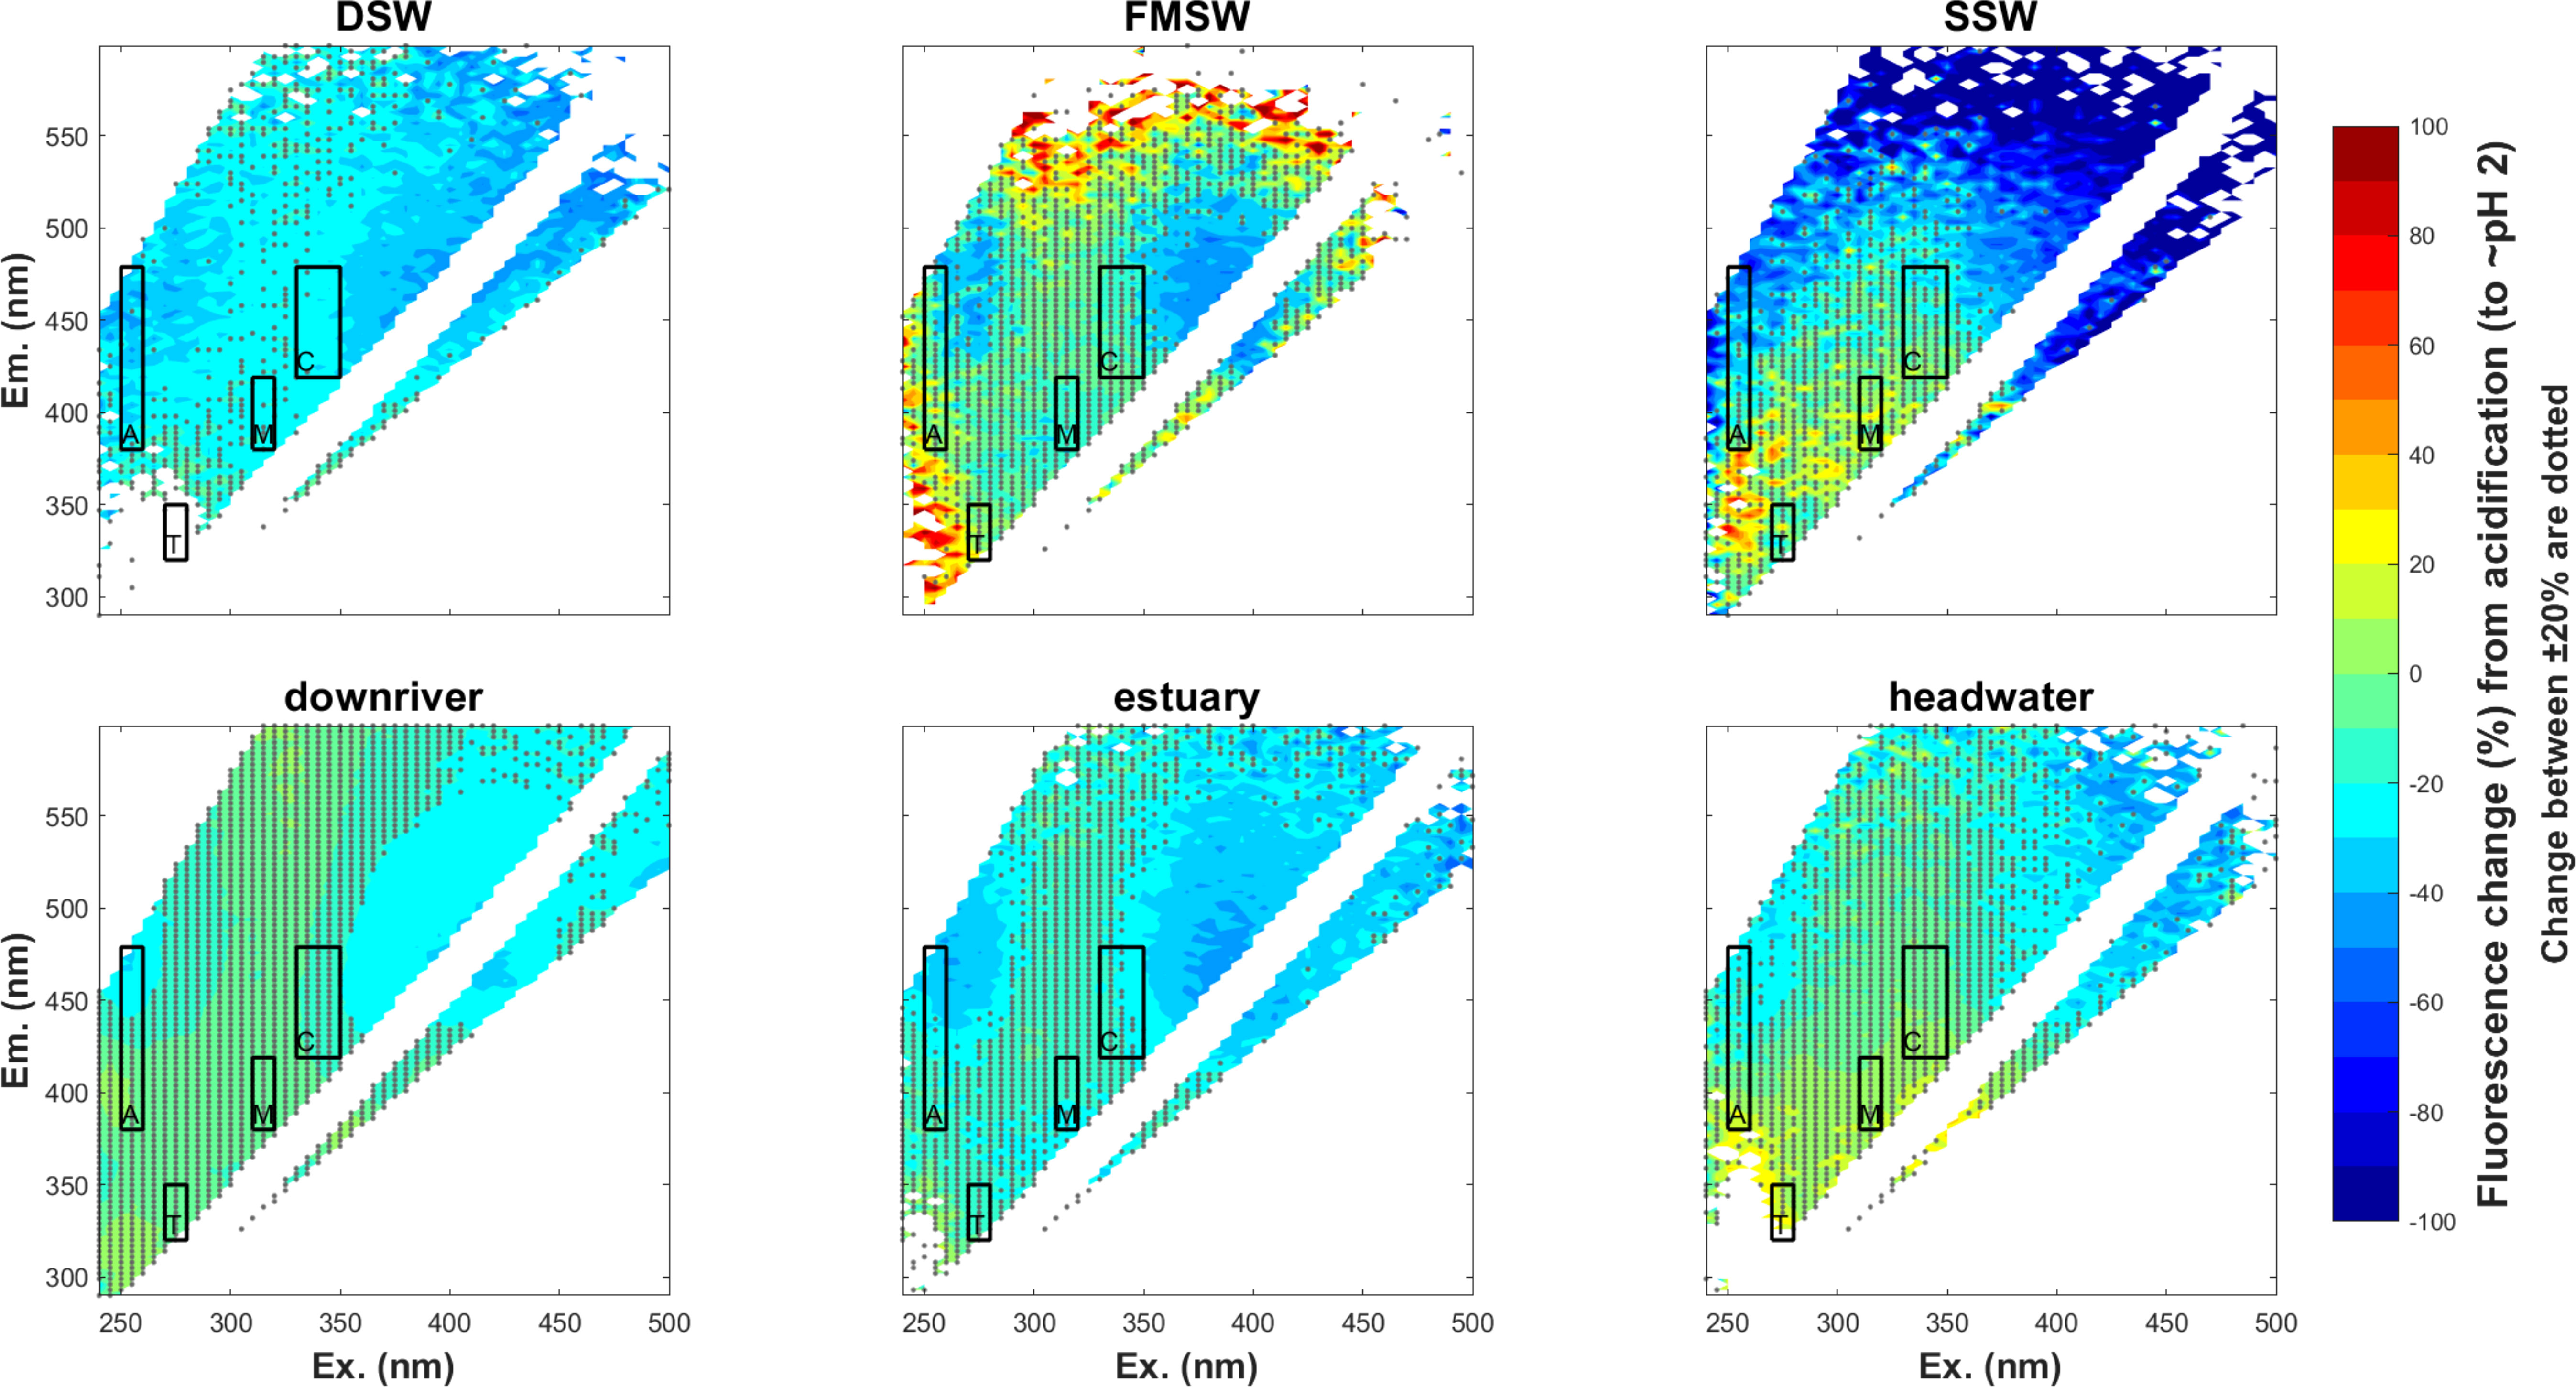
Figure 4 Percentage change in fluorescene intensities of six source waters from acidification (n=6;% change at specific emission/excitation ; changes within ±20% are dotted).
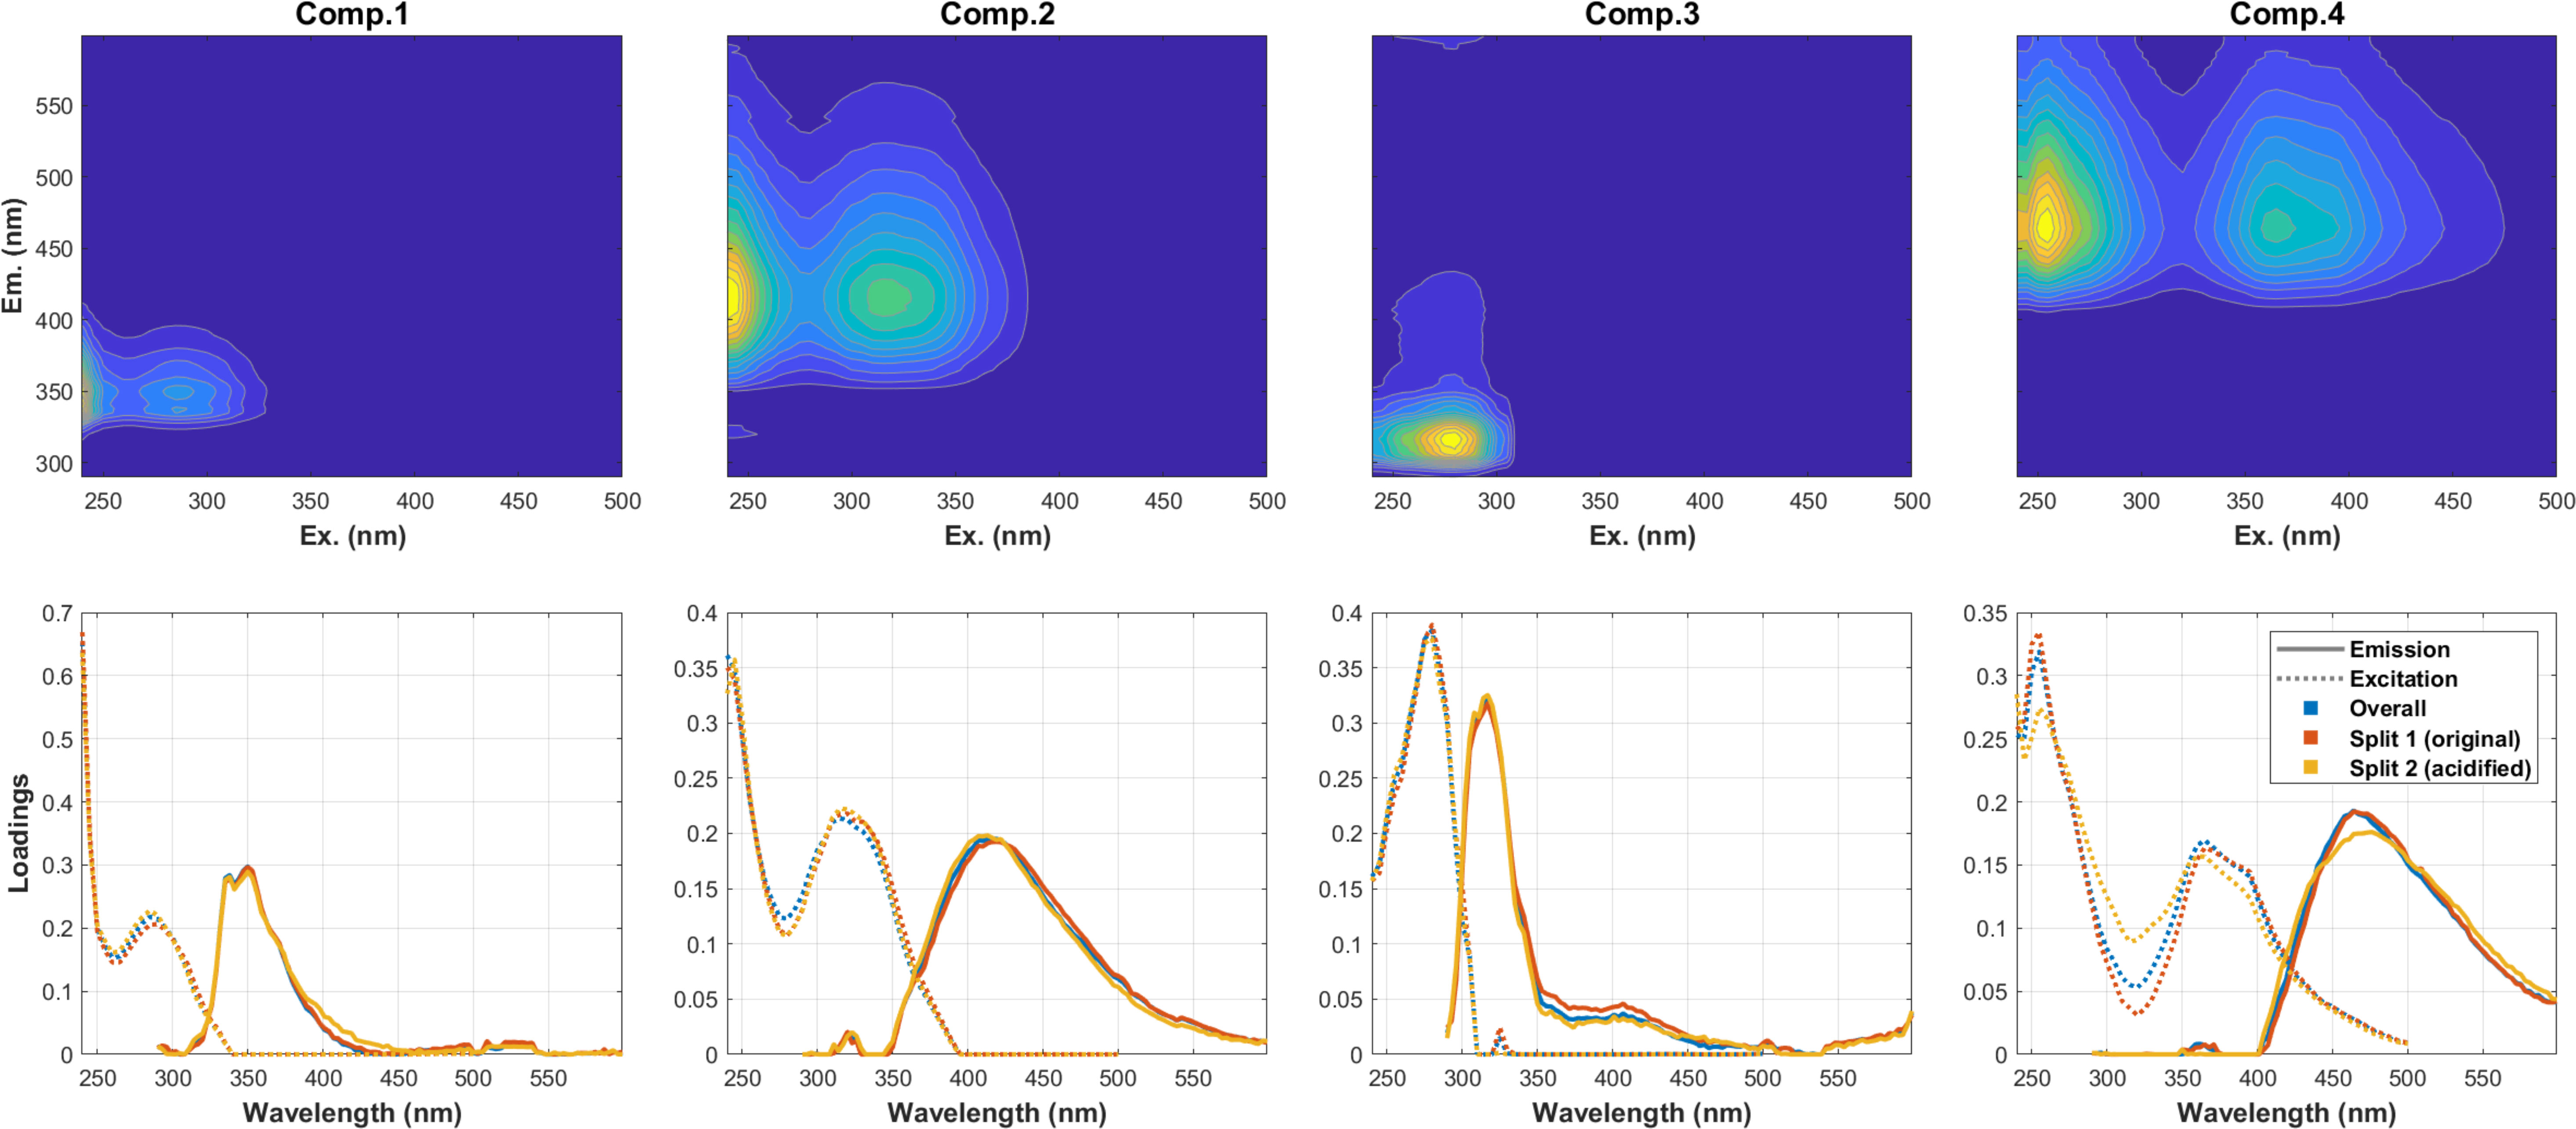
Figure 5 The upper panel : EEMs of four resolved EEM-PARAFAC components from 12 samples (6 original & 6 acidified); and the lower panel: Emission and excitation spectra of each component (p=0.95: % p criterion for spectral match; split 1: six source samples before pH adjustment, split 2: six source samples after pH adjustment).
3.2 DOC loadings
Bulk DOC concentrations were measured in six different water sources and ranged from 40.9 to 304.2 µM (Table 1). Replicate samples were collected from headwater, downriver, and estuary locations for SPE under high and low flowrates. The elevated DOC concentration observed at the downriver site was likely due to untreated or semi-treated industrial sewage and municipal loads, as indicated by the River Pollution Index in Figure 1. The loading mass of each PPL cartridge varied from 7.9 to 48.7 mg C among the six source waters (~13-18 L), with the maximum carbon loading in these nine samples being 9.7 mg C per g PPL sorbent. DOC extraction kinetics can be seen in Figure 6, and all extraction curves, except for FMSW, increased at the first 20% of sample loading; most of these remained relatively steady until the end, except for SSW, indicating that the extraction was completed, and the maximum loading capacity of the PPL cartridge had not been reached. In all three riverine waters (headwater, downriver, and estuary), the curves between replicate samples extracted under high and low flowrates were perfectly identical (Figure 6), providing robust evidence that the DOC extraction was not significantly affected by the flowrate, which ranged from ~15 to 80 mL/min. Svahn and Björklund (2019) had also applied a flowrate window from 10 to 40 mL/min to test the recoveries of organic traces for an SPE in-line filter method using HLB resin, with the results supporting that comparable or even better recoveries were found with a higher flowrate (reduced contact time) applied. It is important that a high flowrate can be executed unreservedly to extract trace amounts of DOM from large volumes of water in the field while on the cruise RV ship. Further molecule level analyses are needed to disentangle and explain these results in a mechanistic way.
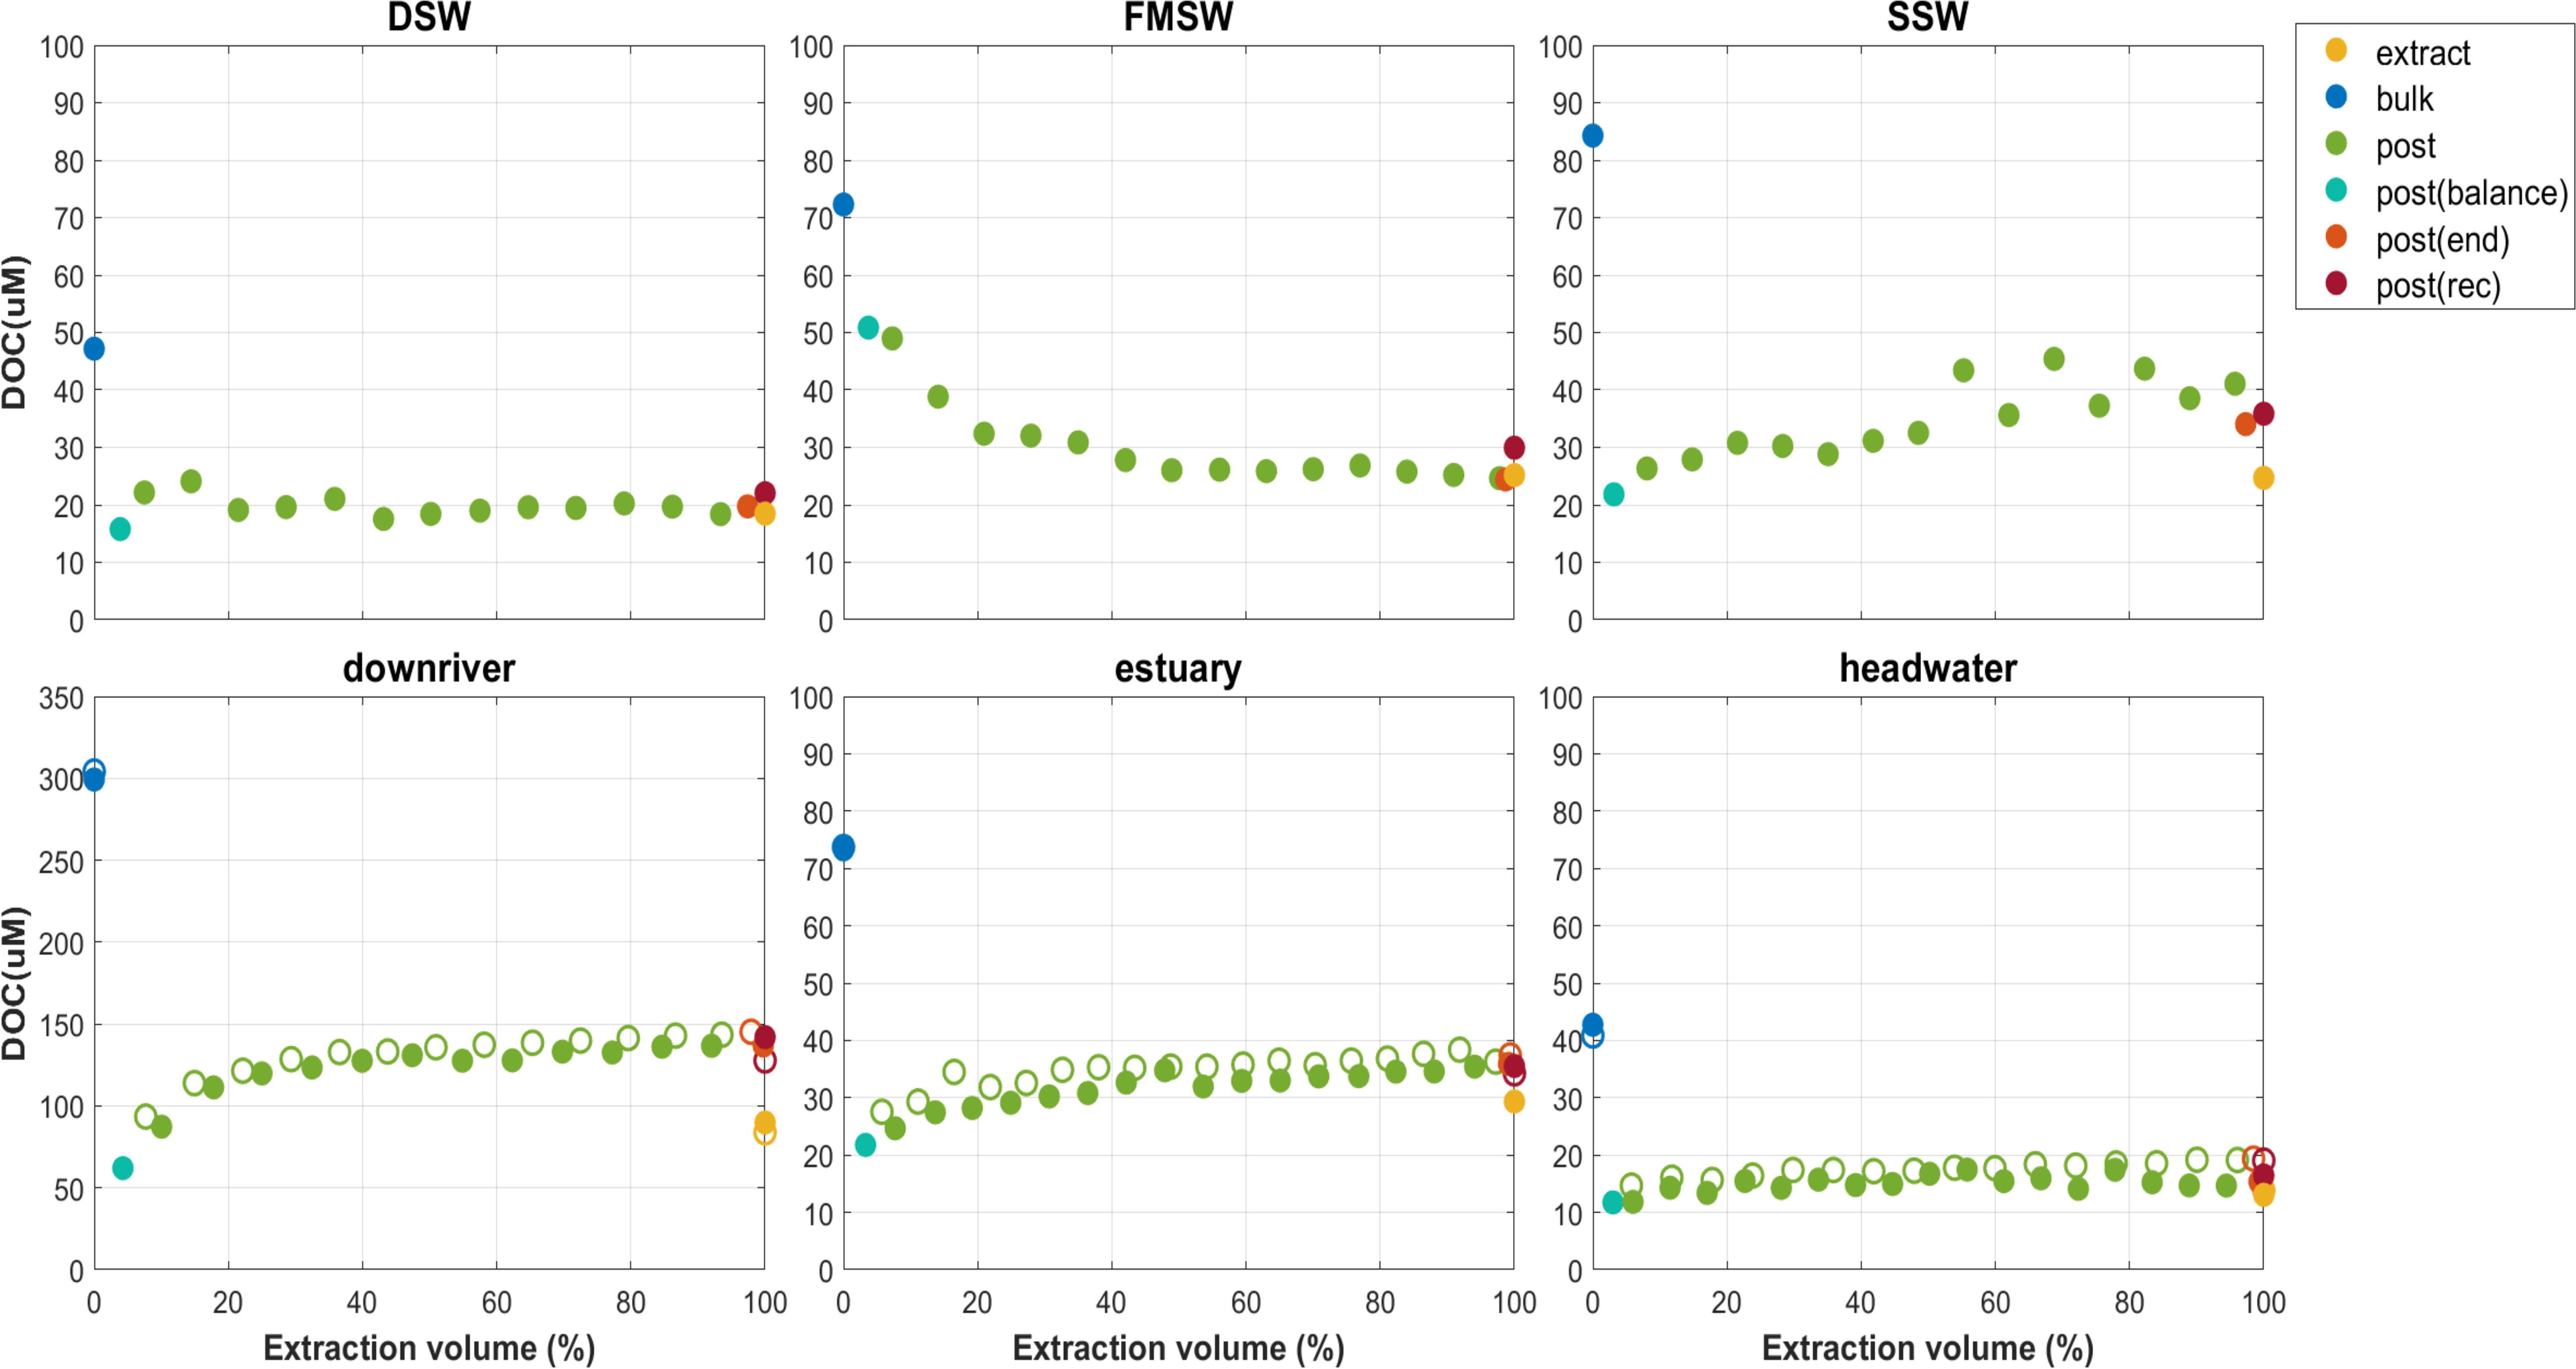
Figure 6 DOC extraction curve of six sources samples under low or high extraction flowrate (solid circle denoted samples extracted via low flowrate, ~15 ml/min; empty circle denoted its replicate samples extracted via high flowrate,~80 ml/min).
3.3 DOM extraction efficiency
To measure DOC concentration in extracts, reconstitution in water is necessary. However, most of the following steps for SPE-DOM composition analyses are derived from solvent-based instrumentation methods. Therefore, in most SPE-DOM studies, DOC concentrations of extracts are not routinely measured to calculate DOC EEe. To perform meaningful intercomparisons among studies from the literature, EEp and EEe were calculated to derive comparisons with the numbers found in such literature. These “differences” between EEp and EEe represent not just the portion absorbed onto the resin but also the portion lost in all processing steps, including a non-negligible portion in the dried extracts where an insoluble fraction sometimes occurs and cannot be redissolved in water or with chosen buffers. As a result, both EEp and EEe contain a portion of “missing” DOM.
Among samples from the six sources, DOC started with a slightly higher value of about 70-80% at the beginning of the extraction but rapidly declined and stabilized at about 50-60% until the end of the process, except for FMSW, which showed a totally reverse trend (Figure 6). Overall, EEp(rec) exhibited a level of 51.5-61.5%, whereas EEe ranged from 27.6 to 40.0% (Table 1). In general, 18 to 82% of DOC could be recovered by commercial SPE cartridges (Table 3). In these previous studies, there were also inconsistencies in DOC EE calculations, with the reported numbers varying from 48-54% using ultrafiltration as the extraction method; 18-69%, 31-74%, 44-54%, 47-50% and ~82% using C18, PPL, ENV, XAD and DEAD as SPE sorbents, respectively. Our EEp(rec) was in line with the reported data, whereas numbers from the extracts (EEe) were at the lower range end. The 2nd, 3rd, and 4th-time elutions using methanol, acetonitrile, and acetone only contributed an average of 1.81%, 0.43%, and 0.69%, respectively, to additional EEe. The average difference between EEp(rec) and EEe was 22.6%, with a range of 11.5 to 31.0%.
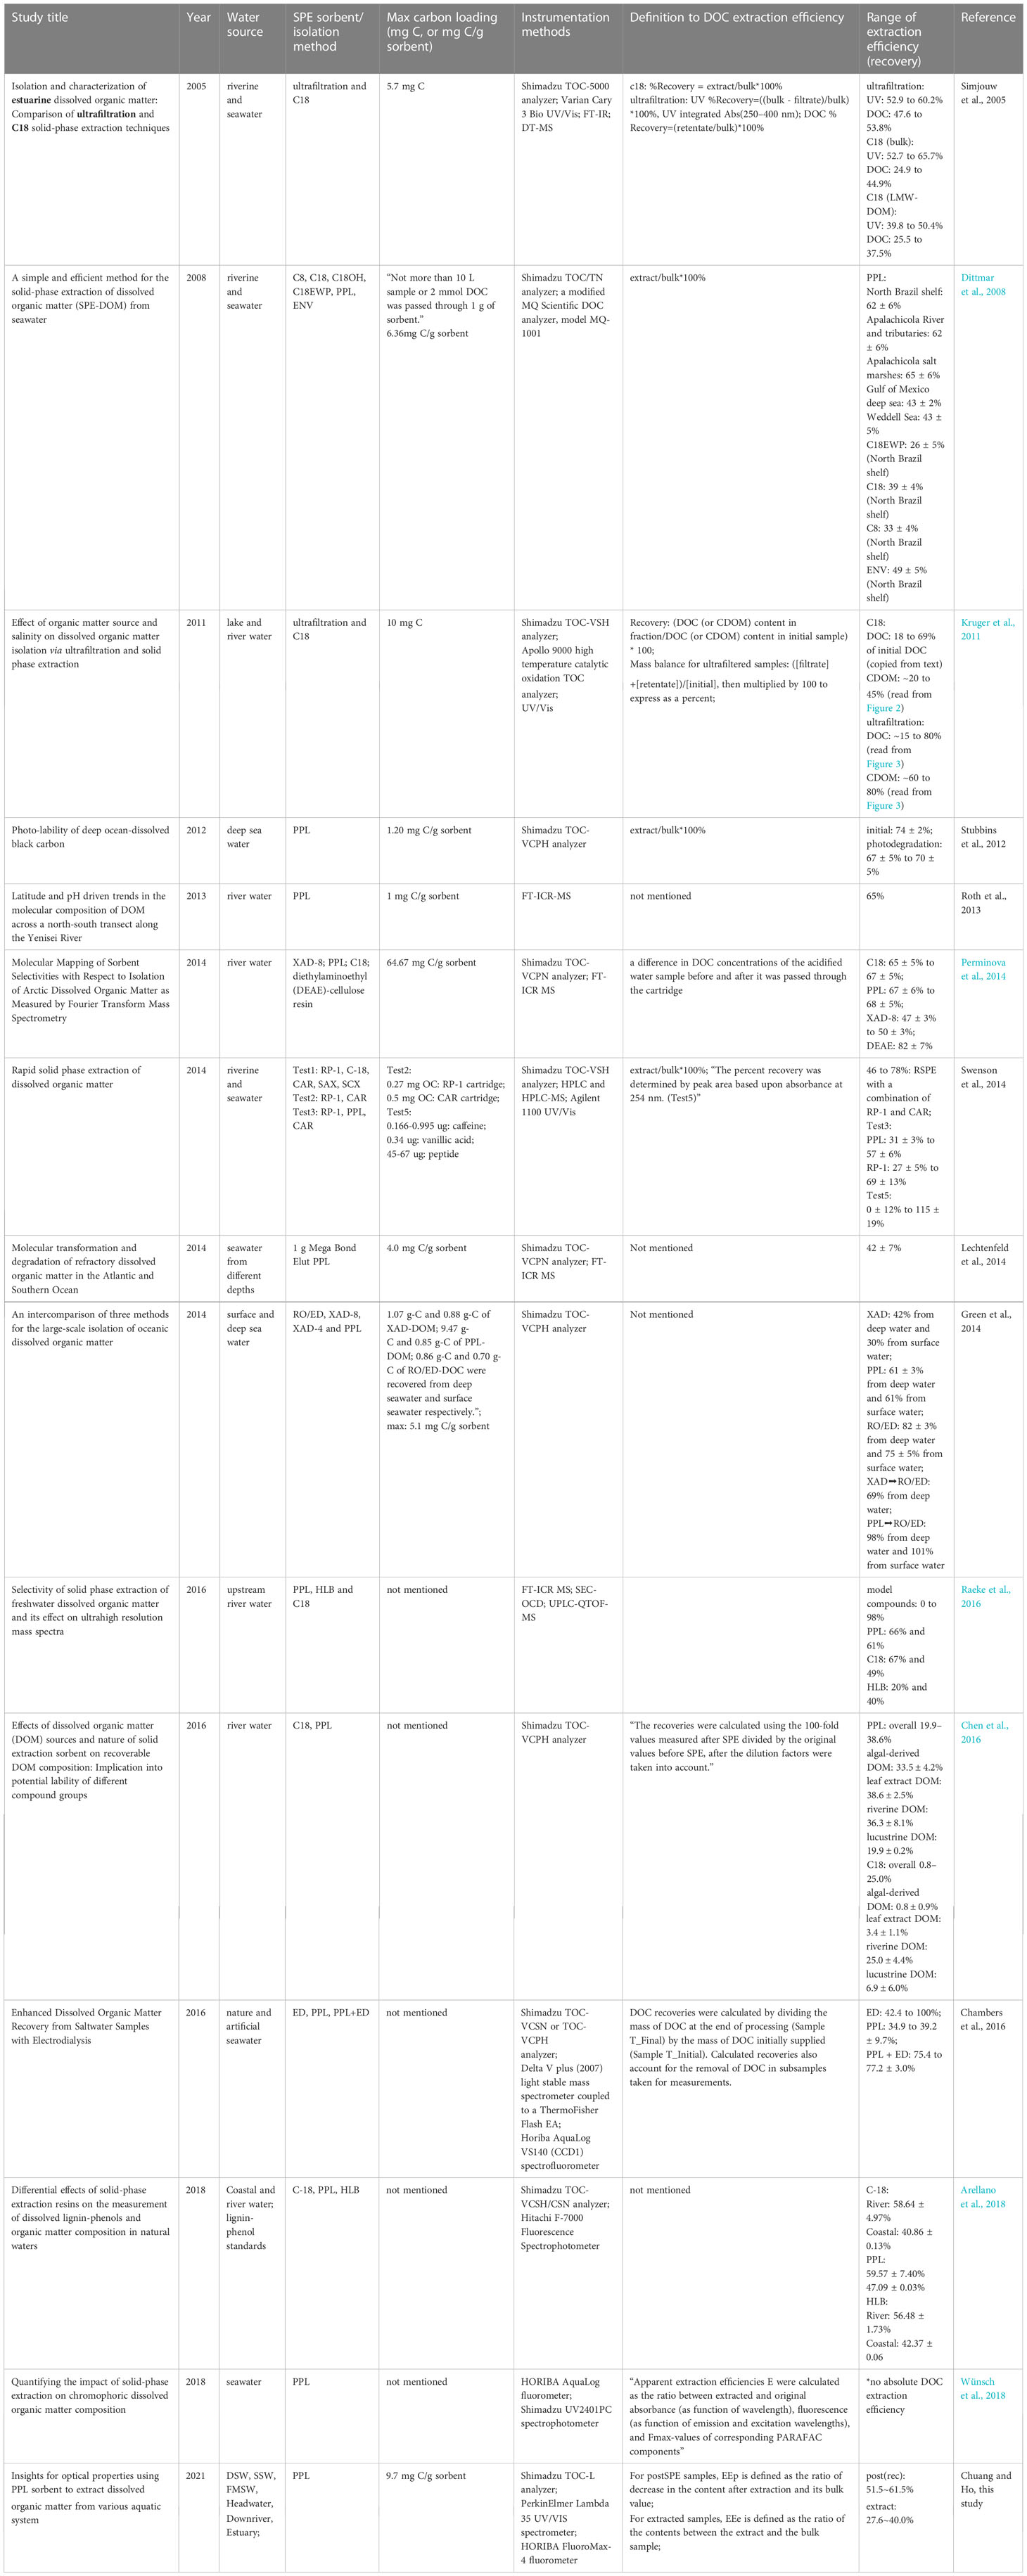
Table 3 DOM extraction conditions and EE results.
The maximum difference (31%) was observed at the highly polluted downriver site. This gap was likely increased by the insoluble fractions formed during the reconstitution step in nano-pure waters (refer to the reconstitution step in Figure 2) and/or by the fractions that could not be eluted with methanol/acetone on PPL sorbent. However, the insoluble fractions will not exist if the extracts are used for further molecular-level examination, such as FT-ICRMS (Li et al., 2016; Li et al., 2017), as the solvent extracts can be directly applied in this type of mass spectrometric analysis.
DOC EE varied significantly between sources (ANOVA, p<0.001), indicating substantial diversification of DOM compound pools from their natural and anthropogenic origins. Regression and t-test were conducted to investigate the effects of initial DOC concentrations, salinity and flowrate on DOC EE. No significant effects were observed. These findings are consistent with the results of the DOC extraction curve shown in Figure 6, where flowrate did not significantly affect the DOC EE in replicates from the same source water, while efficiencies differed considerably between sources. Salinity effects were assessed by Kruger et al. (2011) using ultrafiltration techniques and C18 sorbent to isolate DOM from freshwater with added salt, and the results showed that increasing ionic strength reduced the extraction of high molecular weight DOC, while the C18 SPE recoveries were highly variable, indicating that ionic strength effects varied considerably depending on the DOM source and composition. Theories of molecule coiling/contraction or dissociation of weakly bonded molecule aggregates were proposed as potential explanations for changes in molecule shape resulting from alterations in pH and ionic strength of humic solutions (Engebretson and von Wandruszka, 1994; Gosh and Schnitzer 1980; Conte and Piccolo, 1999; Piccolo, 2001; Myneni et al., 1999). These changes in molecule shape could potentially affect the ability to extract and concentrate DOM from solution via solid phase extraction and ultrafiltration. These observations, along with our results, strongly support that DOM heterogeneity from sources primarily drove EE. Although ionic strength may not be the primary factor affecting DOM isolation, freshwater and seawater exhibited different responses to PPL extraction.
3.4 Optical properties
Previous studies have mainly focused on compositional changes between bulk and extracts, such as those conducted by Chen et al. (2016); Li et al. (2016); Li et al. (2017), and Wünsch et al. (2018), as well as elution kinetics, as reported by Lewis et al. (2020). While molecular-level mass spectrometric analyses, such as FT-ICRMS, have been used to investigate these changes, optical (CDOM) measurements are relatively feasible for screening water samples on a large spatial and temporal scale. In this study, changes in optical properties between bulk, post, and extracts have been revealed for the first time, providing insights into DOM distributions throughout the extraction process.
3.4.1 Fluorescence EEMs measurement and PARAFAC modeling
In this study, we resolved a 6-component model (Figure S1) from a total of 167 EEMs, which explained 99.8% of the dataset variability. These components, hereafter referred to as C1 to C6, were categorized as protein-like (C1 to C4) and terrestrial humic-like (C5 and C6) through comparison with Coble Peaks (Coble, 1996) and the OpenFluor database (Murphy et al., 2014). C1, C4, C5 and C6 (with 8, 41, 47, and 32 matches, respectively) were commonly observed in previous studies, while C2 and C3 (with 4 and 1 matches, respectively) were rarely encountered. Among all the samples, both C1 and C3 were found to be correlated with peak T. C2 and C5 were well-regressed with peaks C and M as well as all selected absorption coefficients (p<0.0001). The EEM peaks A, C, M, and T were all positively correlated with DOC concentrations (with r ranging from 0.88 to 0.97, p<0.0001). Peak C showed a good correlation with peak M and both were positively regressed with all selected absorption coefficients (with r>0.9, p<0.0001). The changes in the six components throughout the PPL extraction are shown in Figure S2. In particular, the labile components C1, C2, and C3, but not C4, were noticeably removed after the extraction in open ocean (SSW, FMSW, and DSW) and headwater samples. This change would alter the overall SPE-DOM molecular characteristics from being more labile and original to more refractory/degraded, challenging the understanding of DOM reactivities of SPE-derived samples that span gradients of sources.
3.4.2 UV/Vis measurements and proxies
The absorption coefficients at specific wavelengths (250, 254, 350, 365, 412, and 440 nm) were highly correlated with each other and with DOC concentrations (r ranged from 0.88 to 0.97, p<0.0001). SUVA254 is a widely used parameter that reflects the aromaticity of DOM (Traina et al., 1990). In this study, freshwater samples (headwater and downriver) showed higher SUVA254 values (Figure S3) in bulk waters compared to post and extracts (p<0.05), indicating that the PPL SPE process reduces the aromaticity of terrestrial DOM extracts. This observation is consistent with previous studies (i.g., Chen et al., 2016; Arellano et al., 2018). SR is the ratio of two distinct spectral slopes (S275–295 and S350–400), and Helms et al. (2008) proposed that changes in SR values were related to DOM molecular weight (MW), which could be affected by photochemical processes and microbial degradation. Figure S4 shows the changes in the slope information throughout the PPL extraction for all source samples, and among all water sources, SR values decreased after extraction (extracts<bulk) and were highest in post samples, indicating the PPL resin might have low affinity to higher MW DOM. Lower SR values indicate either a decrease in the short wavelength (275–295 nm) or an increase in the long wavelength (350–400 nm) slopes. Besides, seawater (SSW, FMSW, and DSW) usually had extremely low absorbance (in this study, a 10cm cuvette had already been used to intensify the spectrometer signal). This could be seen in the relatively low regressions (~0.9) and impractical high SR values from open ocean source waters, especially at the long wavelength section.
3.4.3 Overall changes in optical properties
A total of 167 samples, comprising 6 sources (headwater, downriver, estuary, DSW, SSW, FMSW), 2 flowrates (15 and 80 mL/min), and 3 major types (bulks, extracts, and posts), were subjected to principal component analysis (PCA) using DOC concentrations and 28 calculated optical properties. PCA identifies the principal components of the data, which are linear combinations of the original variables that account for the maximum variance in the data. The scores plot in PCA illustrates the scores of each sample on the first two principal components, enabling visualization of the data in a lower dimensional space. However, the scores plot does not provide any information about group separation or classification.
In our PCA findings (Figure 7), the first two components explained 60.1% and 12.5% of the total variance, respectively, with loadings and distributions of the total 29 variables for these two components shown in Figures 7A, B. Most post samples were grouped together in the score plot (Figure 7C), regardless of their source differences, indicating the convergence of DOM properties in the permeates. In contrast, bulk and extracts were situated in two separate areas, suggesting that the SPE-DOM properties were altered. Furthermore, the flowrates, represented by replicate points of bulk and extracts in each water source, did not significantly influence the DOM properties.
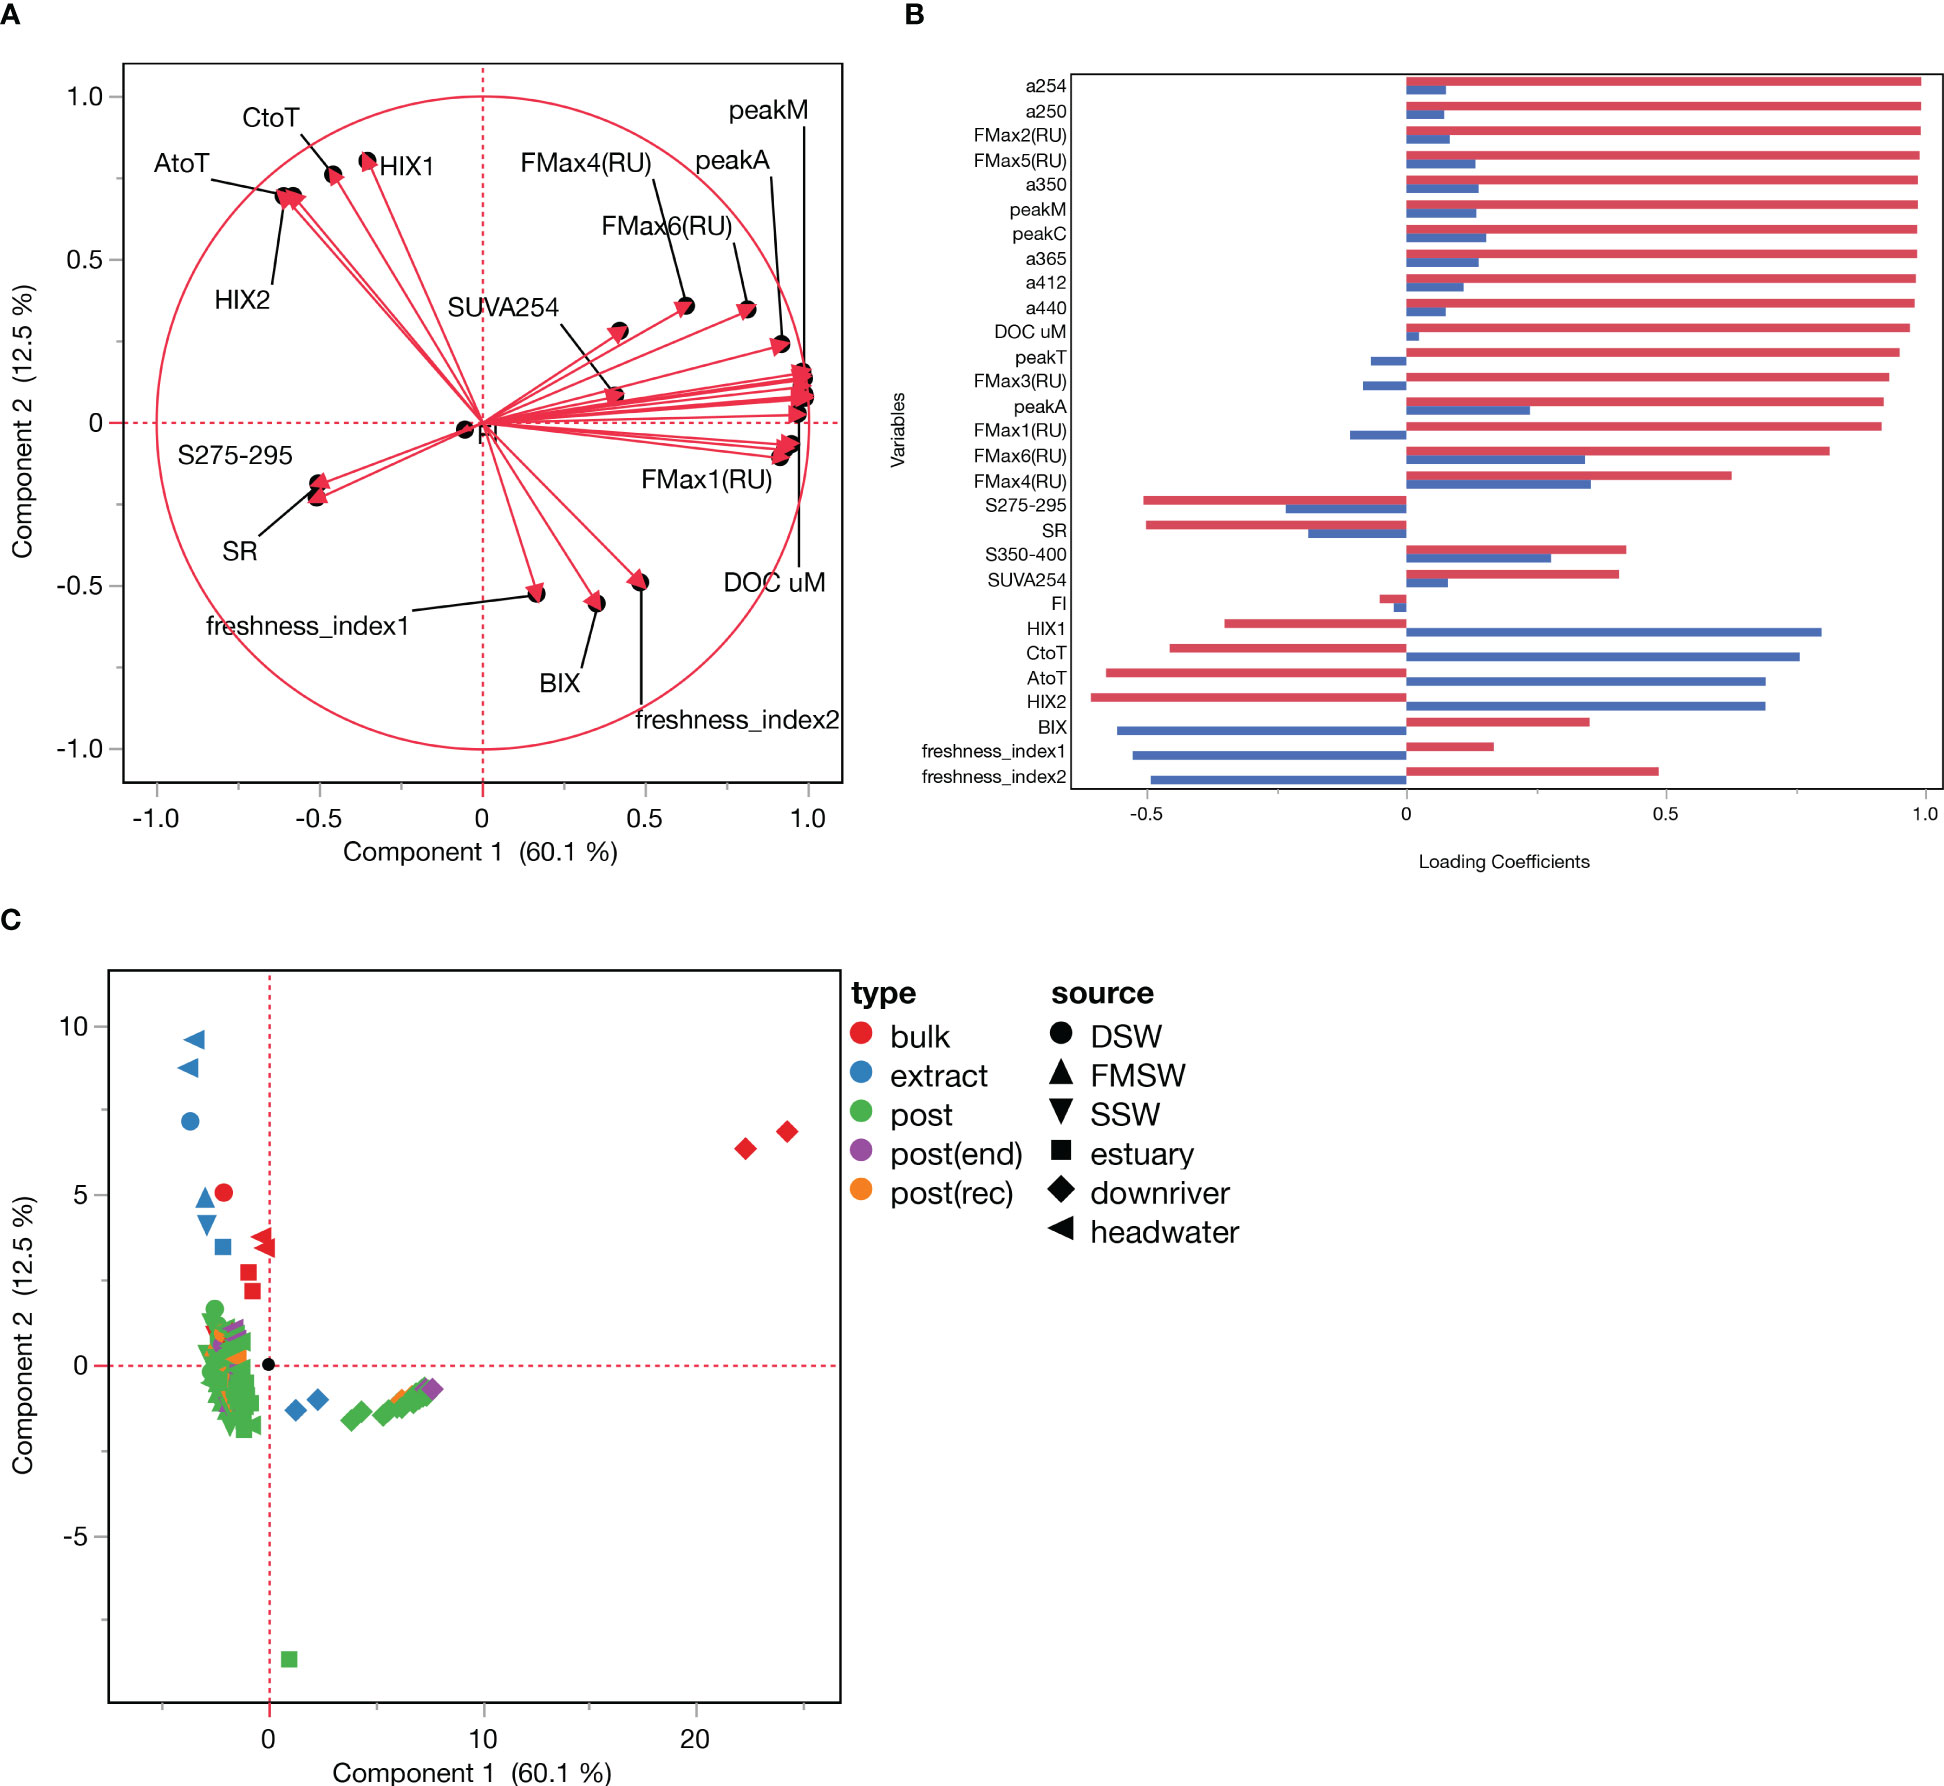
Figure 7 Principle Component Analysis result derived from all 167samples with their corresponding DOC concentration and 28 optical proxies. (A) Loading plot; (B) Plot of loading matrix; (C) Score plot.
Furthermore, we utilized DOC concentrations and all measured optical properties of 9 bulks and 8 extracts (as listed in Table 1) to conduct discriminant analysis. While PCA and discriminant analysis are both multivariate statistical techniques used to analyze a dataset with multiple variables, they serve different purposes and generate distinct results. PCA is used to delve into the underlying structure of the data, whereas discriminant analysis is employed to classify or differentiate between groups using a set of measured variables.
Discriminant analysis identifies linear discriminant functions that maximize the separation between groups and minimize within-group variance. The canonical plot resulting from discriminant analysis displays the scores of each sample on the first two discriminant functions, providing a visualization of the data in a lower-dimensional space. This plot demonstrates how effectively the samples are separated by the discriminant functions and can be utilized to categorize new samples based on their position. Our findings revealed that bulk samples could be distinctly identified based on their sources (Figure 8A). However, most extracts, except for downriver samples, were clustered together (Figure 8B), indicating that the convergence of SPE-DOM resulted from sorbent selectivity.
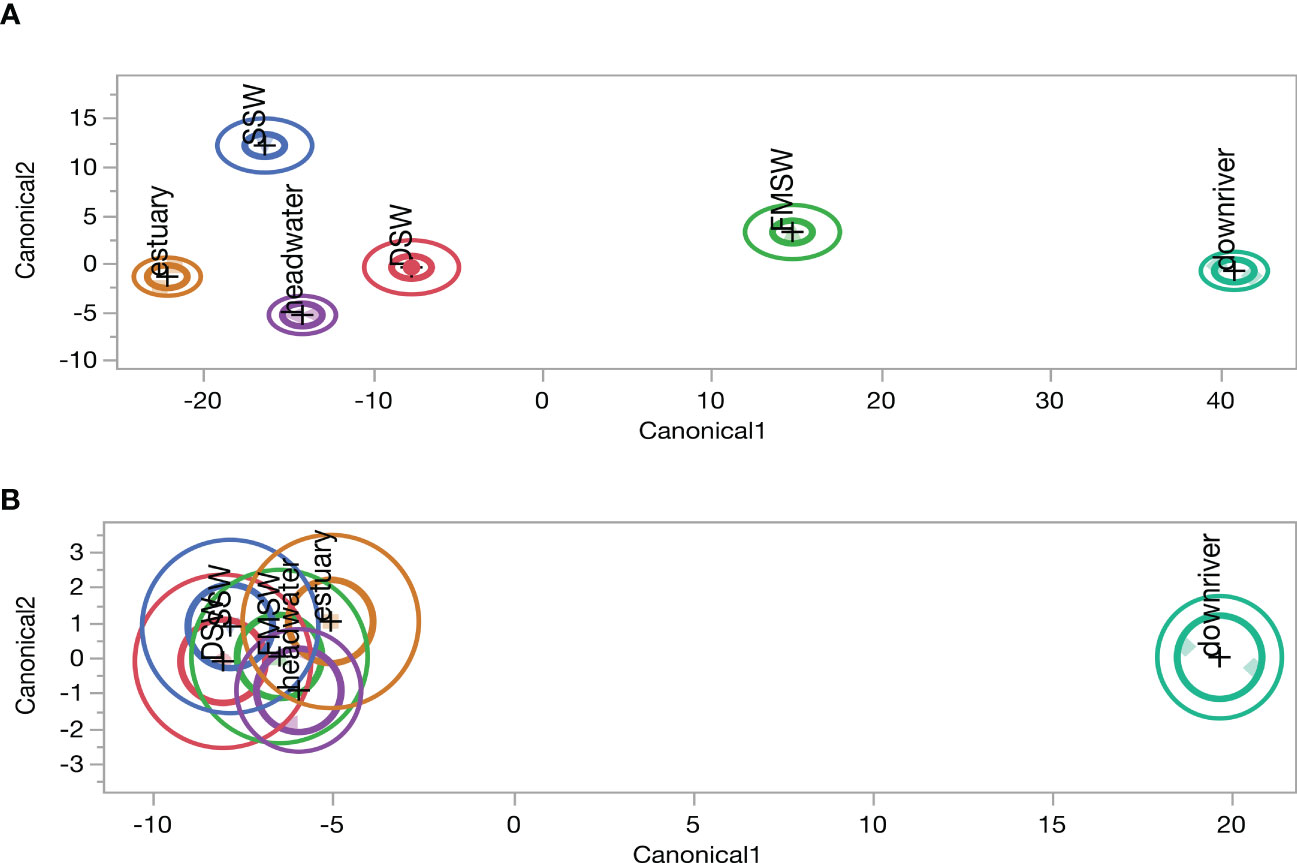
Figure 8 Canonical plots of discriminant Analysis results derived from (A) bulk (n=9), and (B) extract (n=8), samples as listed in Table 1, with their corresponding DOC concentration and all reported optical proxies in this study.
4 Conclusions
The fluxes of reactive DOC between different carbon reservoirs are crucial to project the impacts of ongoing climatic changes. Compared to molecular level mass spectrometric analysis, optical (spectroscopic) measurements are relatively feasible to investigate large spatial and temporal scale waters. However, even now, PARAFAC resolved components are still mainly described in broad terms with incomplete chemical information. We believe further molecular level analyses and constant input from studies linked to more diverse DOM sources and processes will enrich data banks such as the OpenFluor, thereby assisting in a comprehensive understanding of global DOM biogeochemical fluxes.
Recently, Jerusalen-Lleo et al. (2023) also investigated the efficiency and selectivity of PPL for oceanic DOM from various water masses. They found that the extraction efficiency varied for different DOM pools, with the humic-like fraction having a higher extraction efficiency compared to the colored fraction of DOM (CDOM) and dissolved organic nitrogen (DON). In contrast, our study focused on the impacts of both DOM source and SPE criteria on changes to the optical properties of DOM. We found that the reaction of DOM to acidification required for SPE varied across samples, and that the differences in SPE efficiency and optical proxies were mainly due to the heterogeneity of DOM sources rather than methodological or environmental factors. Our study and Jerusalen-Lleo et al. (2023) both highlight the importance of understanding the impact of SPE on DOM properties and the need to carefully evaluate the representativeness of the extracted DOM fraction.
In conclusion, our results disentangle various controls on DOM extraction efficiency from the commonly used SPE method and the impact of extractions on DOM optical properties. The key findings are 1) with extensive pH changes (from pH~8 to 2~2.5) required by the PPL SPE method, the reaction of DOM to acidification varies across samples. And this variability may stem from differences in functional groups and DOM sources; 2) DOM source and its original composition are the primary control on extraction efficiency; 3) PPL extraction alters headwater and marine source DOM from more labile to more refractory characteristics; 4) flowrates from 15 to 80 mL can be unreservedly applied in large-volume field sample collection while not significantly impacting SPE-DOM properties and extraction efficiency; and 5) PPL SPE results in a convergence of DOM variability. The outcomes here raise further concerns about inter-studies comparisons and the interpretability of SPE-derived DOM data from samples across various aquatic environments.
Data availability statement
The original contributions presented in the study are included in the article/Supplementary Material. Further inquiries can be directed to the corresponding author.
Author contributions
C-YAC contributed to conception and design of the study. Y-HH performed the experiments and organized the database. C-YAC performed the statistical analysis and wrote the draft of the manuscript. All authors contributed to the article and approved the submitted version.
Funding
This work was supported in part by grants from the Research Center for Environmental Changes, Academia Sinica, and the National Science and Technology Council, Taiwan (OCE#106-2611-M-001-010-MY3, 109-2611-M-001 -005 -, and 111-2611-M-001-007- to C.-Y. A.C.).
Acknowledgments
We thank all research assistants and crew members of the R/V Taiwan Ocean Research I and FT reservoir for their assistance in cruise execution and water sampling. We are also grateful to the associate editor and all reviewers for their invaluable feedback and suggestions, which have significantly improved the quality of our work.
Conflict of interest
The authors declare that the research was conducted in the absence of any commercial or financial relationships that could be construed as a potential conflict of interest.
Publisher’s note
All claims expressed in this article are solely those of the authors and do not necessarily represent those of their affiliated organizations, or those of the publisher, the editors and the reviewers. Any product that may be evaluated in this article, or claim that may be made by its manufacturer, is not guaranteed or endorsed by the publisher.
Supplementary material
The Supplementary Material for this article can be found online at: https://www.frontiersin.org/articles/10.3389/fmars.2023.1140702/full#supplementary-material
References
Adou A. F. Y., Muhandiki V. S., Shimizu Y., Matsui S. (2001). A new economical method to remove humic substances in water: adsorption onto a recycled polymeric material with surfactant addition. Water Sci. Technol. 43 (11), 1–7. doi: 10.2166/wst.2001.0660
Aiken G. R., Thurman E. M., Malcolm R. L., Walton H. F. (1979). Comparison of xad macroporous resins for the concentration of fulvic-acid from aqueous-solution. Analytical Chem. 51 (11), 1799–1803. doi: 10.1021/ac50047a044
Arellano A. R., Bianchi T. S., Hutchings J. A., Shields M. R., Cui X. (2018). Differential effects of solid-phase extraction resins on the measurement of dissolved lignin-phenols and organic matter composition in natural waters. Limnology Oceanography: Methods 16 (1), 22–34. doi: 10.1002/lom3.10224
Benner R., Biddanda B., Black B., McCarthy M. (1997). Abundance, size distribution, and stable carbon and nitrogen isotopic compositions of marine organic matter isolated by tangential-flow ultrafiltration. Mar. Chem. 57, 243–263. doi: 10.1016/S0304-4203(97)00013-3
Chambers L. R., Ingall E. D., Saad E. M., Longo A. F., Takeuchi M., Tang Y., et al. (2016). Enhanced dissolved organic matter recovery from saltwater samples with electrodialysis. Aquat. Geochemistry 22 (5), 555–572.
Chen M., Kim S., Park J.-E., Jung H.-J., Hur J. (2016). Structural and compositional changes of dissolved organic matter upon solid-phase extraction tracked by multiple analytical tools. Analytical Bioanalytical Chem. 408 (23), 6249–6258. doi: 10.1007/s00216-016-9728-0
Coble P. G. (1996). Characterization of marine and terrestrial DOM in seawater using excitation-emission matrix spectroscopy. Mar. Chem. 51 (4), 325–346. doi: 10.1016/0304-4203(95)00062-3
Conte P., Piccolo A. (1999). Conformational arrangement of dissolved humic substances. influence of solution composition on association of humic molecules. Environ. Sci. Technol. 33, 1682–1690. doi: 10.1021/es9808604
Dittmar T., Koch B., Hertkorn N., Kattner G. (2008). A simple and efficient method for the solid-phase extraction of dissolved organic matter (SPE-DOM) from seawater. Limnology Oceanography: Methods 6 (6), 230–235. doi: 10.4319/lom.2008.6.230
Engebretson R. R., von Wandruszka R. (1994). Microorganization in dissolved humic acids. Environ. Sci. Technol. 28, 1934–1941. doi: 10.1021/es00060a026
Gabor R., Baker A., McKnight D., Miller M. (2014). Fluorescence indices and their interpretation. Aquatic Organic Matter Fluorescence Coble P.G., Lead J., Baker A., Reynolds D.M., Spencer R.G.M. (ambridge University Press), 303–339.
Green N. W., Perdue E. M., Aiken G. R., Butler K. D., Chen H., Dittmar T., et al. (2014). An intercomparison of three methods for the large-scale isolation of oceanic dissolved organic matter. Mar. Chem. 161, 14–19.
Hansell D. A., Carlson C. A., Repeta D. J., Schlitzer R. (2009). Dissolved organic matter in the ocean: a controversy stimulates new insights. Oceanography 22 (4), 202–211. doi: 10.5670/oceanog.2009.109
Hansell D. A. C., Craig A., Amon R. M.W., Álvarez-Salgado X.Antón, Yamashita Y., Romera-Castillo C., et al. (2021). “Compilation of dissolved organic matter (DOM) data obtained from the global ocean surveys from 1994 to 2021 (NCEI accession 0227166),” in NOAA National Centers for Environmental Information. doi: 10.25921/s4f4-ye35
Hansen A. M., Kraus T. E. C., Pellerin B. A., Fleck J. A., Downing B. D., Bergamaschi B. A. (2016). Optical properties of dissolved organic matter (DOM): Effects of biological and photolytic degradation. Limnology Oceanography 61 (3), 1015–1032.
Helms J. R., Stubbins A., Ritchie J. D., Minor E. C., Kieber D. J., Mopper K. (2008). Absorption spectral slopes and slope ratios as indicators of molecular weight, source, and photobleaching of chromophoric dissolved organic matter. Limnology Oceanography 53 (3), 955–969. doi: 10.4319/lo.2008.53.3.0955
Huguet A., Vacher L., Relexans S., Saubusse S., Froidefond J. M., Parlanti E. (2009). Properties of fluorescent dissolved organic matter in the gironde estuary. Organic Geochemistry 40 (6), 706–719. doi: 10.1016/j.orggeochem.2009.03.002
Jerusalen-Lleo E., Nieto-Cid M., Fuentes-Santos I., Dittmar T., Alvarez-Salgado X. A. (2023). Solid phase extraction of ocean dissolved organic matter with PPL cartridges: efficiency and selectivity. Front. Mar. Sci. 10. doi: 10.3389/fmars.2023.1159762
Kaiser E., Simpson A. J., Dria K. J., Sulzberger B., Hatcher P. G. (2003). Solid-state and multidimensional solution-state NMR of solid phase extracted and ultrafiltered riverine dissolved organic matter. Environ. Sci. Technol. 37, 2929–2935. doi: 10.1021/es020174b
Kothawala D., Murphy K., Stedmon C., Weyhenmeyer G., Tranvik L. (2013). Inner filter correction of dissolved organic matter fluorescence: correction of inner filter effects. Limnology oceanography Methods 11, 616–630. doi: 10.4319/lom.2013.11.616
Krogh A., Keys A. (1934). Methods for the determination of dissolved organic carbon and nitrogen in sea water. Biol. Bull. 67 (1), 132–144. doi: 10.2307/1537488
Kruger B. R., Dalzell B. J., Minor E. C. (2011). Effect of organic matter source and salinity on dissolved organic matter isolation via ultrafiltration and solid phase extraction. Aquat. Sci. 73 (3), 405–417. doi: 10.1007/s00027-011-0189-4
Lechtenfeld O. J., Kattner G., Flerus R., McCallister S. L., Schmitt-Kopplin P., Koch B. P. (2014). Molecular transformation and degradation of refractory dissolved organic matter in the Atlantic and southern ocean. Geochimica Cosmochimica Acta 126, 321–337.
Leenheer J. A. (1981). Comprehensive approach to preparative isolation and fractionation of dissolved organic carbon from natural waters and wastewaters. Environ. Sci. Technol. 15 (5), 578–587. doi: 10.1021/es00087a010
Lewis C. B., Walker B. D., Druffel E. R. M. (2020). Isotopic and optical heterogeneity of solid phase extracted marine dissolved organic carbon. Mar. Chem. 219, 103752. doi: 10.1016/j.marchem.2020.103752
Li Y., Harir M., Lucio M., Kanawati B., Smirnov K., Flerus R., et al. (2016). Proposed guidelines for solid phase extraction of suwannee river dissolved organic matter. Analytical Chem. 88 (13), 6680–6688. doi: 10.1021/acs.analchem.5b04501
Li Y., Harir M., Uhl J., Kanawati B., Lucio M., Smirnov K. S., et al. (2017). How representative are dissolved organic matter (DOM) extracts? a comprehensive study of sorbent selectivity for DOM isolation. Water Res. 116, 316–323. doi: 10.1016/j.watres.2017.03.038
Liška I. (2000). Fifty years of solid-phase extraction in water analysis – historical development and overview. J. Chromatogr. A 885 (1), 3–16. doi: 10.1016/s0021-9673(99)01144-9
McKnight D. M., Boyer E. W., Westerhoff P. K., Doran P. T., Kulbe T., Andersen D. T. (2001). Spectrofluorometric characterization of dissolved organic matter for indication of precursor organic material and aromaticity. Limnology Oceanography 46 (1), 38–48. doi: 10.4319/lo.2001.46.1.0038
Murphy K. R., Stedmon C. A., Graeber D., Bro R. (2013). Fluorescence spectroscopy and multi-way techniques. PARAFAC. Analytical Methods 5 (23), 6557–6566. doi: 10.1039/c3ay41160e
Murphy K. R., Stedmon C. A., Wenig P., Bro R. (2014). OpenFluor– an online spectral library of auto-fluorescence by organic compounds in the environment. Analytical Methods 6 (3), 658–661. doi: 10.1039/C3AY41935E
Myneni S. C. B., Brown J. T., Martinez G. A., Meyer-Ilse W. (1999). Imaging of humic substance macromolecular structures in water and soils. Science 286, 1335–1337. doi: 10.1126/science.286.5443.1335
Nachimuthu G., Watkins M. D., Hulugalle N., Finlay L. A. (2020). Storage and initial processing of water samples for organic carbon analysis in runoff. MethodsX 7, 101012. doi: 10.1016/j.mex.2020.101012
Ohno T. (2002). Fluorescence inner-filtering correction for determining the humification index of dissolved organic matter. Environ. Sci. Technol. 36 (4), 742–746. doi: 10.1021/es0155276
Parlanti E., Wörz K., Geoffroy L., Lamotte M. (2000). Dissolved organic matter fluorescence spectroscopy as a tool to estimate biological activity in a coastal zone submitted to anthropogenic inputs. Organic Geochemistry 31 (12), 1765–1781. doi: 10.1016/S0146-6380(00)00124-8
Peacock M., Freeman C., Gauci V., Lebron I., Evans C. D. (2015). Investigations of freezing and cold storage for the analysis of peatland dissolved organic carbon (DOC) and absorbance properties. Environ. Science: Processes Impacts 17 (7), 1290–1301. doi: 10.1039/C5EM00126A
Perminova I. V., Dubinenkov I. V., Kononikhin A. S., Konstantinov A. I., Zherebker A. Y., Andzhushev M. A., et al. (2014). Molecular mapping of sorbent selectivities with respect to isolation of Arctic dissolved organic matter as measured by Fourier transform mass spectrometry. Environ. Sci. Technol. 48 (13), 7461–7468. doi: 10.1021/es5015423
Raeke J., Lechtenfeld O. J., Wagner M., Herzsprung P., Reemtsma T. (2016). Selectivity of solid phase extraction of freshwater dissolved organic matter and its effect on ultrahigh resolution mass spectra. Environ. Science-Processes Impacts 18 (7), 918–927. doi: 10.1039/C6EM00200E
Repeta D. J. (2015). “Chapter 2 - chemical characterization and cycling of dissolved organic matter,” in Biogeochemistry of marine dissolved organic matter, 2nd ed. Eds. Hansell D. A., Carlson C. A. (Boston: Academic Press), 21–63.
Roth V.-N., Dittmar T., Gaupp R., Gleixner G. (2013). Latitude and pH driven trends in the molecular composition of DOM across a north south transect along the yenisei river. Geochimica Cosmochimica Acta 123, 93–105.
Simjouw J.-P., Minor E. C., Mopper K. (2005). Isolation and characterization of estuarine dissolved organic matter: Comparison of ultrafiltration and C18 solid-phase extraction techniques. Mar. Chem. 96 (3), 219–235.
Spencer R. G. M., Ahad J. M. E., Baker A., Cowie G. L., Ganeshram R., Upstill-Goddard R. C., et al. (2007). The estuarine mixing behaviour of peatland derived dissolved organic carbon and its relationship to chromophoric dissolved organic matter in two north Sea estuaries (UK). Estuar. Coast. Shelf Sci. 74 (1-2), 131–144. doi: 10.1016/j.ecss.2007.03.032
Spencer R. G. M., Aiken G. R., Dyda R. Y., Butler K. D., Bergamaschi B. A., Hernes P. J. (2010). Comparison of XAD with other dissolved lignin isolation techniques and a compilation of analytical improvements for the analysis of lignin in aquatic settings. Organic Geochemistry 41 (5), 445–453. doi: 10.1016/j.orggeochem.2010.02.004
Stubbins A., Niggemann J., Dittmar T. (2012). Photo-lability of deep ocean dissolved black carbon. Biogeosciences 9 (5), 1661–1670.
Svahn O., Björklund E. (2019). High flow-rate sample loading in Large volume whole water organic trace analysis using positive pressure and finely ground sand as a SPE-column in-line filter. Molecules (Basel Switzerland) 24 (7), 1426. doi: 10.3390/molecules24071426
Swenson M. M., Oyler A. R., Minor E. C. (2014). Rapid solid phase extraction of dissolved organic matter. Limnology Oceanography: Methods 12 (10), 713–728.
Traina S. J., Novak J., Smeck N. E. (1990). An ultraviolet absorbance method of estimating the percent aromatic carbon content of humic acids. J. Environ. Qual. 19 (1), 151–153. doi: 10.2134/jeq1990.00472425001900010023x
Weishaar J. L., Aiken G. R., Bergamaschi B. A., Fram M. S., Fujii R., Mopper K. (2003). Evaluation of specific ultraviolet absorbance as an indicator of the chemical composition and reactivity of dissolved organic carbon. Environ. Sci. Technol. 37 (20), 4702–4708. doi: 10.1021/es030360x
Wünsch U. J., Geuer J. K., Lechtenfeld O. J., Koch B. P., Murphy K. R., Stedmon C. A. (2018). Quantifying the impact of solid-phase extraction on chromophoric dissolved organic matter composition. Mar. Chem. 207, 33–41. doi: 10.1016/j.marchem.2018.08.010
Keywords: sources, chromophoric dissolved organic matter (CDOM), excitation emission matrices (EEMs), solid phase extraction (SPE), priority pollutant (PPL), parallel factor analysis (PARAFAC)
Citation: Chuang C-YA and Ho Y-H (2023) The influence of sources and solid phase extraction criteria on dissolved organic matter optical properties in aquatic systems. Front. Mar. Sci. 10:1140702. doi: 10.3389/fmars.2023.1140702
Received: 09 January 2023; Accepted: 27 April 2023;
Published: 10 May 2023.
Edited by:
Marc Tedetti, UMR7294 Institut Méditerranéen d’Océanographie (MIO), FranceReviewed by:
Elfrida Carstea, National Institute for Research and Development in Optoelectronics, RomaniaChi-Shuo Chen, National Tsing Hua University, Taiwan
Copyright © 2023 Chuang and Ho. This is an open-access article distributed under the terms of the Creative Commons Attribution License (CC BY). The use, distribution or reproduction in other forums is permitted, provided the original author(s) and the copyright owner(s) are credited and that the original publication in this journal is cited, in accordance with accepted academic practice. No use, distribution or reproduction is permitted which does not comply with these terms.
*Correspondence: Chia-Ying Anderin Chuang, anderinchuang@gate.sinica.edu.tw