Bringing in the experts: application of industry knowledge to advance catch rate standardization for northern shortfin squid (Illex illecebrosus)
 Anna J. M. Mercer1*
  John P. Manderson2
  Brooke A. Lowman3 Sarah L. Salois1,4 Kimberly J. W. Hyde1 Jeffrey Pessutti5
  Andrew W. Jones1 Robert Ruhle6 Bill Bright7 Troy Sawyer8 Meghan Lapp9 Jeff Kaelin10 Katie Almeida11 Greg DiDomenico10
- 1Northeast Fisheries Science Center, National Oceanic and Atmospheric Administration (NOAA), Narragansett, RI, United States
- 2Open Ocean Research, Philadelphia, PA, United States
- 3ERT, Inc. under contract to National Oceanic and Atmospheric Administration, Narragansett, RI, United States
- 4School for Marine Science and Technology, University of Massachusetts Dartmouth, New Bedford, MA, United States
- 5Northeast Fisheries Science Center, National Oceanic and Atmospheric Administration (NOAA), Highlands, NJ, United States
- 6F/V Darana R, Wanchese, NC, United States
- 7F/V Retriever, Cape May, NJ, United States
- 8F/V Debbie Sue, Narragansett, RI, United States
- 9SeaFreeze Shoreside, Narragansett, RI, United States
- 10Lunds Fisheries, Cape May, NJ, United States
- 11The Town Dock, Narragansett, RI, United States
Sources of fisheries information outside of fishery-independent surveys (e.g. fishery-dependent data) are especially valuable for species that support productive fisheries and lack reliable biological information, such as the northern shortfin squid (Illex illecebrosus). Fishery-dependent data streams are available for most species, however collaboration with industry members is critical to ensure that these fishery-dependent data are collected, applied, and interpreted correctly. Despite the need for collaboration and the frequency that fishery data are used in scientific research, there is limited literature on the structure of interactions and knowledge sharing that inform the analysis and application of fishery data. Between 2019 and 2022, a group of researchers collaborated with members of the northern shortfin squid fishing industry to bring together research data sets and knowledge from harvesters and processors to better describe the fishery dynamics, distribution, life history, and oceanographic drivers of the species. The collaboration focused on developing custom standardized fishery catch per unit effort (CPUE) indices to provide indicators of population trends that accounted for the impacts of technical and economic aspects of harvesting, processing and marketing on fishing effort, selectivity and landings of northern shortfin squid. We describe the methods used to inform and interpret the CPUE analyses, focusing on novel structure of interactions we had with industry members, and suggest best practices for integrating industry knowledge into CPUE standardization. The information shared and research products produced through this science-industry research collaboration advanced understanding of northern shortfin squid population and fishery dynamics, and contributed directly to the 2022 stock assessment and management process. Given the complex and stochastic nature of the northern shortfin squid population and fishery, we found it critical to maintain open communication and trust with processors and harvesters, who have unique insight into the factors that may be driving changes in catch, landings, and productivity of the valuable resource species.
1 Introduction
For many marine resource species, it is infeasible to collect comprehensive fishery-independent data due to mismatches between survey scope and species distribution, phenology, or life history (short lived). For these species, fisheries science and management rely heavily on fishery-dependent data collected by harvesters, processors, and dealers, commonly included in the form of catch per unit effort (CPUE) indices in stock assessments (Hilborn and Walters, 1992; Maunder et al., 2006). These data sets contain valuable information about resource species, but are also influenced by the socioeconomic and technical aspects of fishing (Walters, 2003; Quirijns et al., 2008). Thus, it is essential to collaborate with the fishing industry to understand these data, inform analytical approaches, and interpret results (Steins et al., 2022; Calderwood et al., 2023). The statistical methods used for CPUE standardizations are well described (Maunder and Punt, 2004; Bishop et al., 2004; Bishop, 2006; Bentley et al., 2012; Cheng et al., 2023), however, the methods for effectively engaging with industry to identify relevant explanatory variables and interpret CPUE indices are rarely implemented and not well documented. Fishery data are used extensively in scientific research, but there is limited literature on the science-industry research collaborations that are key to informing the analysis and application of fishery data (Mangi et al., 2018; Steins et al., 2022; Calderwood et al., 2023). In this manuscript, we present recent research on the northern shortfin squid (Illex illecebrosus) that sought to establish best practices for gathering information from the fishing industry and integrating that information in CPUE standardizations.
Northern shortfin squid is a semi-pelagic squid with a lifecycle of less than a year that occupies Slope Sea and continental shelf habitats from Florida to northern Canada (Dawe and Hendrickson, 1998; Hendrickson, 2004; Jackson and O'Dor 2001). Their distribution and growth are highly variable, largely due to the impact of oceanographic dynamics on physiology and movements (Dawe and Warren, 1993; Boyle and Rodhouse, 2005; Salois et al., 2023). Northern shortfin squid are semelparous, with females dying shortly after they mate. Research suggests that they spawn throughout the year and produce multiple cohorts, but recruitment dynamics of northern shortfin squid are poorly understood (Hendrickson, 2004). Northern shortfin squid inhabit the Slope Sea (water mass between the Gulf Stream and the continental shelf) during the winter months and migrate onto the continental shelf during the late spring and early summer months (Dawe and Beck, 1985; Hatanaka et al., 1985; Perez and O'Dor, 1998). Spring and fall fishery-independent bottom trawl surveys of the continental shelf from Cape Hatteras, U.S. to Nova Scotia, Canada sample a portion of the population; however, these surveys do not occur during periods of peak northern shortfin squid abundance on the continental shelf (Hendrickson, 2004).
In the northeastern United States, northern shortfin squid are targeted by a bottom trawl fishery during summer months (May-September), with landings ranging from approximately 2,000 to 28,000 metric tons (Arkhipkin et al., 2015; Doubleday et al., 2016; Northeast Fisheries Science Center (NEFSC), 2021). Vessels targeting northern shortfin squid range from approximately 15 to 45 meters in length and harvest northern shortfin squid on the outer continental shelf at depths of 109-365 m (Lowman et al., 2021). The Mid-Atlantic Fishery Management Council sets an annual quota for northern shortfin squid that is shared by all permitted vessels.
Because of the species’ variable abundance and its use of habitats beyond the range of fishery independent surveys, northern shortfin squid are difficult to assess and manage, as are many squid stocks around the world (Arkhipkin et al., 2021; Northeast Fisheries Science Center (NEFSC), 2006). In the absence of comprehensive survey data, many squid assessments rely upon fishery-dependent data to develop indicators of fishery and population dynamics and population condition (Pierce and Guerra, 1994; McAllister et al., 2004; Roa-Ureta, 2012; Arkhipkin et al., 2021). The interpretation of fishery CPUE as an indicator of population trend, however, is potentially confounded by global market drivers, management measures, technical constraints of fishing, and gear selectivity, among other factors (Maunder and Punt, 2004; Maunder et al., 2006). In order to identify the social and economic factors impacting catch rates and account for them in CPUE standardization, it is necessary to assimilate the experiential knowledge of harvesters and processors (Steins et al., 2020; Mackinson, 2022; Steins et al., 2022). Novel modeling tools, such as spatiotemporal delta-generalized linear mixed models, structured additive distributional regression, and simulations further enable researchers to identify bias in and derive population trends from fishery dependent data (Mamouridis et al., 2017; Clegg et al., 2022; Ducharme-Barth et al., 2022; Karp et al., 2022).
Over the years, researchers have developed collaborations with the northern shortfin squid industry to address specific research needs including biological data collection (Johnson, 2011). Several recent research efforts associated with the 2021 Northern Shortfin Squid Research Track Stock Assessment focused on developing science-industry research collaborations (SIRC) to increase our understanding of the species and inform science-based management of the fishery (Northeast Fisheries Science Center (NEFSC), 2021). These recent collaborations are rooted in a mutual recognition of, and appreciation for, the valuable knowledge that the northern shortfin squid industry has accumulated over many decades. The research collaboration we describe here leveraged industry knowledge to better understand the dynamics of the northern shortfin squid population, fishery, and associated environment. Specifically, this paper details a SIRC that integrated the technical and economic knowledge of northern shortfin squid harvesters and processors into the development of standardized CPUE indices as measures of abundance for northern shortfin squid. We describe the approaches to industry collaboration that were utilized to inform the CPUE standardization process, including a northern shortfin squid summit with both industry and scientists, as well as a series of semi-structured conversations. We also discuss how the information shared by industry was integrated in the stock assessment process. In the absence of a model-based stock assessment, the management of northern shortfin squid is informed by other research products, including the work presented in this manuscript. By describing this SIRC process and the strategies used, we hope to provide a model for bringing industry knowledge into assessments of other stocks.
2 Phases and outcomes of northern shortfin squid science-industry research collaboration (SIRC)
2.1 Overview
Here we describe four layers of collaboration with the northern shortfin squid industry that helped to facilitate the development of robust and high-resolution CPUE series: 1) an initial summit with industry, scientists, and managers, 2) a subsequent series of structured conversations with individual processors and harvesters, 3) quantitative application of industry knowledge to CPUE standardizations, and 4) sustained communication throughout the stock assessment process. These interactions occurred in sequence, and represented an organized framework for developing scientific products from fishery-dependent knowledge and data sources.
2.2 Initiating collaborations through northern shortfin squid summit
A two-day “Northern Shortfin Squid Population Ecology and Fishery Summit” hosted by members of the northern shortfin squid fishing industry was held in November 2019 to discuss current understanding of the northern shortfin squid and its fishery, and to identify research priorities leading up to the 2022 stock assessment. The Summit brought together over 30 harvesters, processors, academic scientists, government scientists, and fishery managers to discuss the ecology, population dynamics, and management of northern shortfin squid. The summit was sponsored by the fishing industry and was held outside of formal stock assessment and management proceedings. The goal was to develop a framework for establishing collaborative research products in the near term that could reduce scientific uncertainties limiting responsive fishery management (Manderson, 2020). The priorities identified and relationships formed during this summit kickstarted several science-industry collaborations that ultimately informed northern shortfin squid stock assessment and management. The information detailed below was obtained explicitly through the Northern Shortfin Squid Population Ecology and Fishery Summit, which exemplifies the value of such forums for sharing knowledge and data, and building relationships.
One major summit product was the definition of the different fleets participating in the northern shortfin squid fishery and description of fishing operations characteristic of each fleet. Specifically, northern shortfin squid processors and harvesters emphasized that fleet type is a critical factor influencing fishing behavior and catch rates, with the freezer trawler fleet that catches and freezes squid at sea operating significantly differently than the “wet boat” fleet that temporarily stores squid in Refrigerated Seawater Systems (RSW) or on ice before offloading fresh squid at shoreside processing plants. While it is rare for vessels to switch from one fleet to another, two freezer vessels have been retrofitted with RSW systems since 2010 to enable operational flexibility. This information is well known by the fishing industry, but is not well documented in the scientific literature or previous stock assessments. While the hold type of individual vessels could not be documented during the summit, general differences between fleet types were discussed. Since the late 1990s, the wet boat fleet has dominated the northern shortfin squid fishery during periods when the species is widely available, while the freezer boat fleet has been a stable component of the fishery in all years (Figure 1). In recent years, the freezer trawler fleet (<10 vessels, 23 - 45m in length) has been approximately one-third the size of the wet boat fleet (>30 vessels, 15 - 30m in length). Because they process and freeze squid at sea, freezer trawlers typically remain at sea for longer periods of time and search over larger areas compared to wet boats. Freezer trawler catch, effort, and landing rates are largely driven by the relatively long handling times associated with freezing squid at sea; freezer trawlers can only freeze a certain quantity of squid at a time, and thus, have to stop fishing to process squid after a certain amount are caught. Freezer trawler operations are less influenced by price than the wet boat fleet and are unlikely to switch species if northern shortfin squid are less available or if prices are low. Conversely, wet boats have short handling times and catch, effort, and landing rates can be high if northern shortfin squid, which are highly perishable, are available at locations less than about 72 hours from shoreside processing plants. Trip durations of the wet boat fleet are short, and effort is strongly driven by the price and availability of squid. Wet boats are more likely to switch to other species if northern shortfin squid prices or availability are low. An action item moving forward from the summit, and now being considered by the Mid-Atlantic Fishery Management Council (MAFMC) as a management requirement, was to document individual vessel hold types to be able to formally account for fleet type in CPUE calculations and other data analyses.
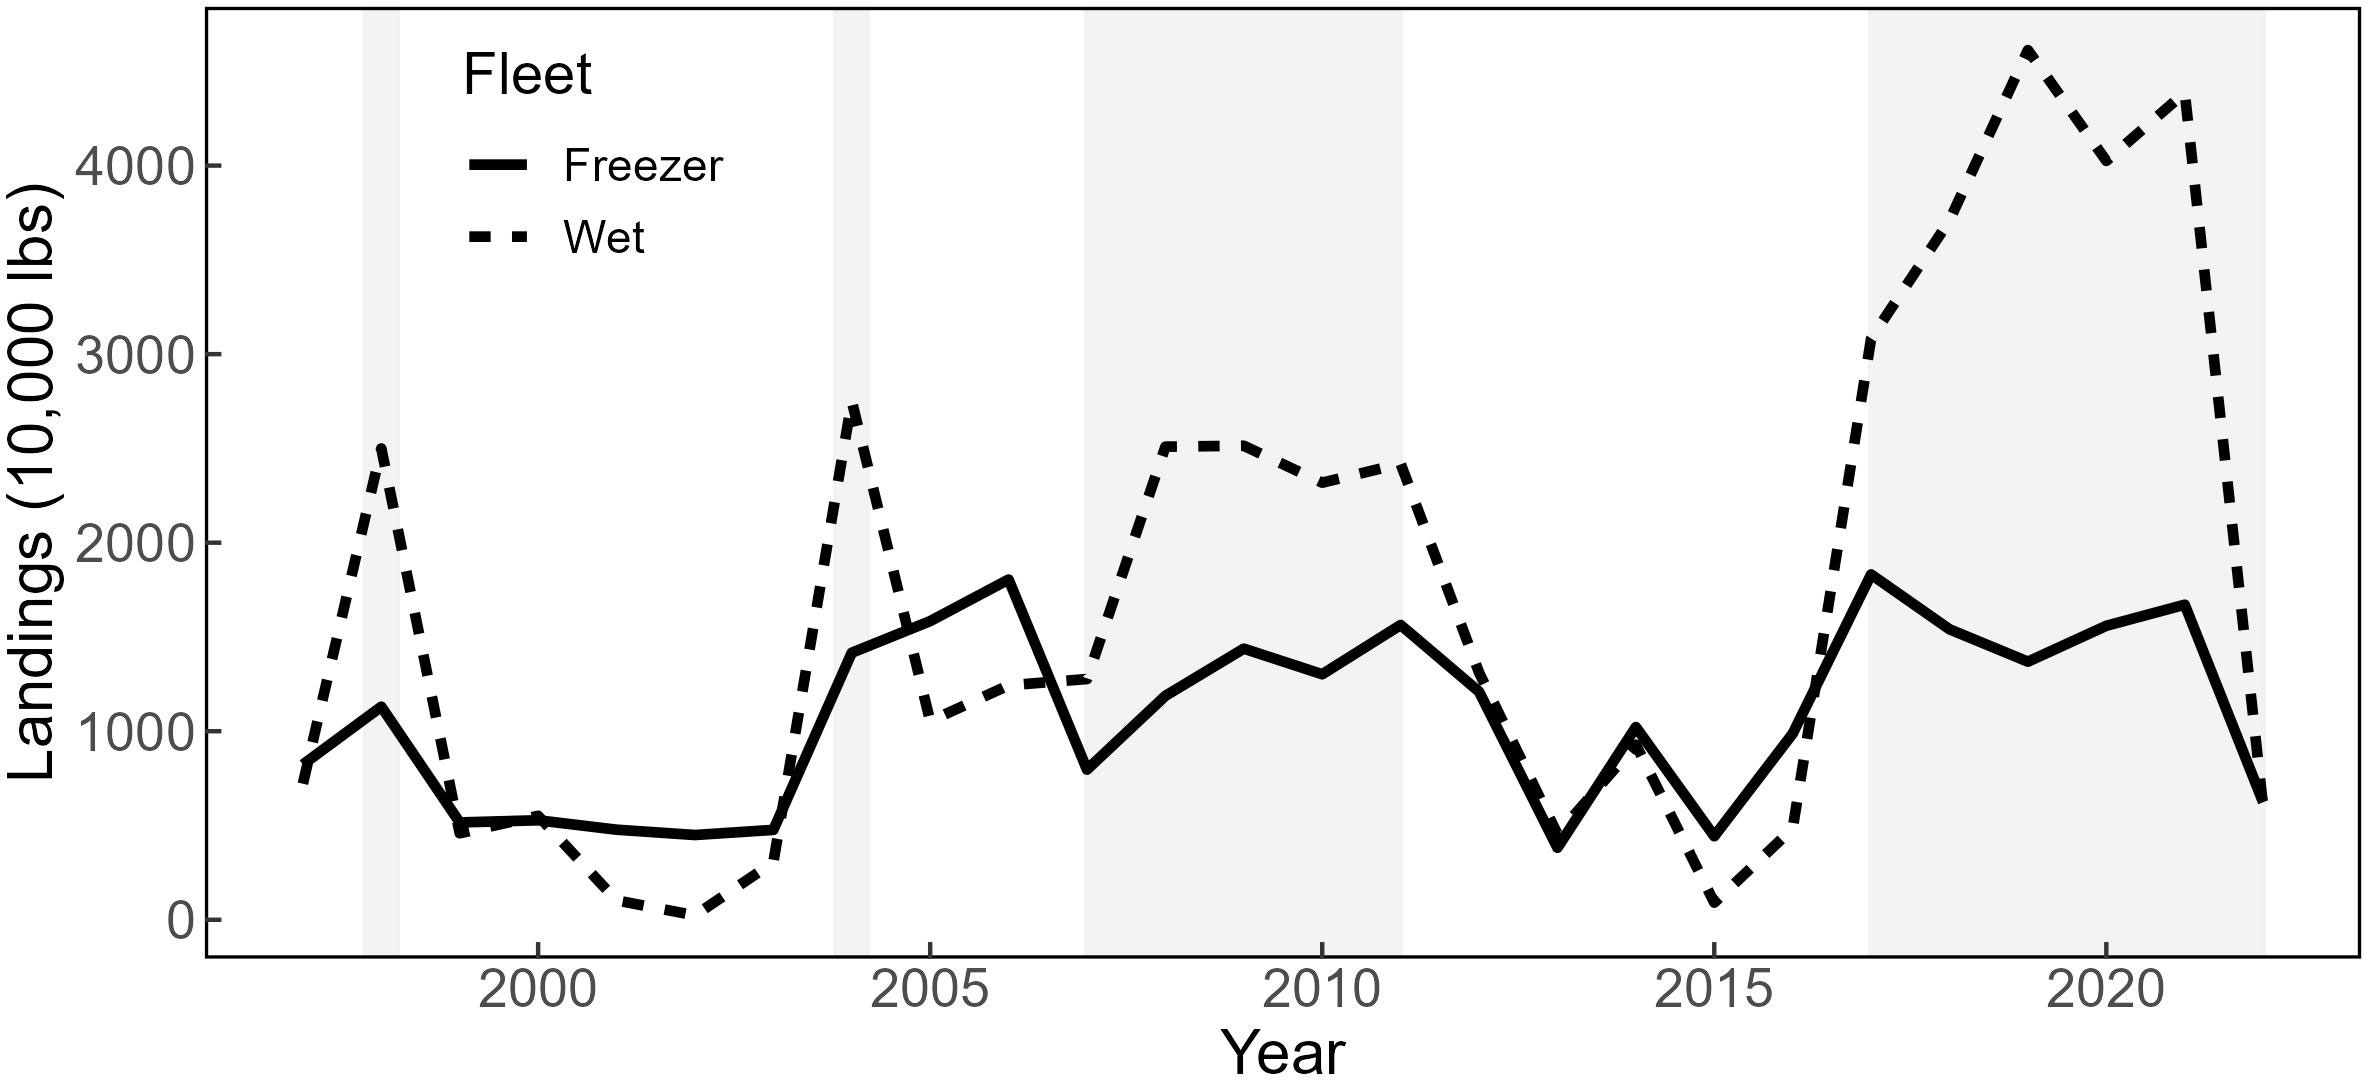
Figure 1 Northern shortfin squid (Illex illecebrosus) landings from 1997 to 2022. Dashed line represents wet boat landings. Solid line represents freezer trawler landings. Shaded grey areas highlight years in which the ‘Wet Boat’ fleet reported higher annual landings than Freezer Trawlers.
Another important summit product was the description of the global market dynamics that impact the northern shortfin squid fishery. Specifically, northern shortfin squid from the Northwest Atlantic compete in the global market with Argentine shortfin squid (Illex argentinus) squid caught in the Southwest Atlantic (Falkland Islands to Southern Brazil) and Japanese flying squid (Todarodes pacificus) caught in the North Pacific. Annual landings of squid in the Southwest Atlantic and North Pacific are typically 30-35 times larger than northern shortfin squid production in the Northwest Atlantic. The Argentine shortfin squid fishery in the Southwest Atlantic occurs during the austral summer and closes just before the beginning of the northern shortfin squid fishery season in the northwest Atlantic, which begins when northern shortfin squid migrate onto the continental shelf. As a result, the supply of squid from the Southwest Atlantic fishery regulates demand, and sets the baseline price and risk appetite for inventory for the U.S. northern shortfin squid fishery. Documenting annual trends and scale of landings of Argentine shortfin squid and Japanese flying squid for integration into CPUE standardizations and further analyses was, therefore, identified at the summit as an important next step (Table 1).
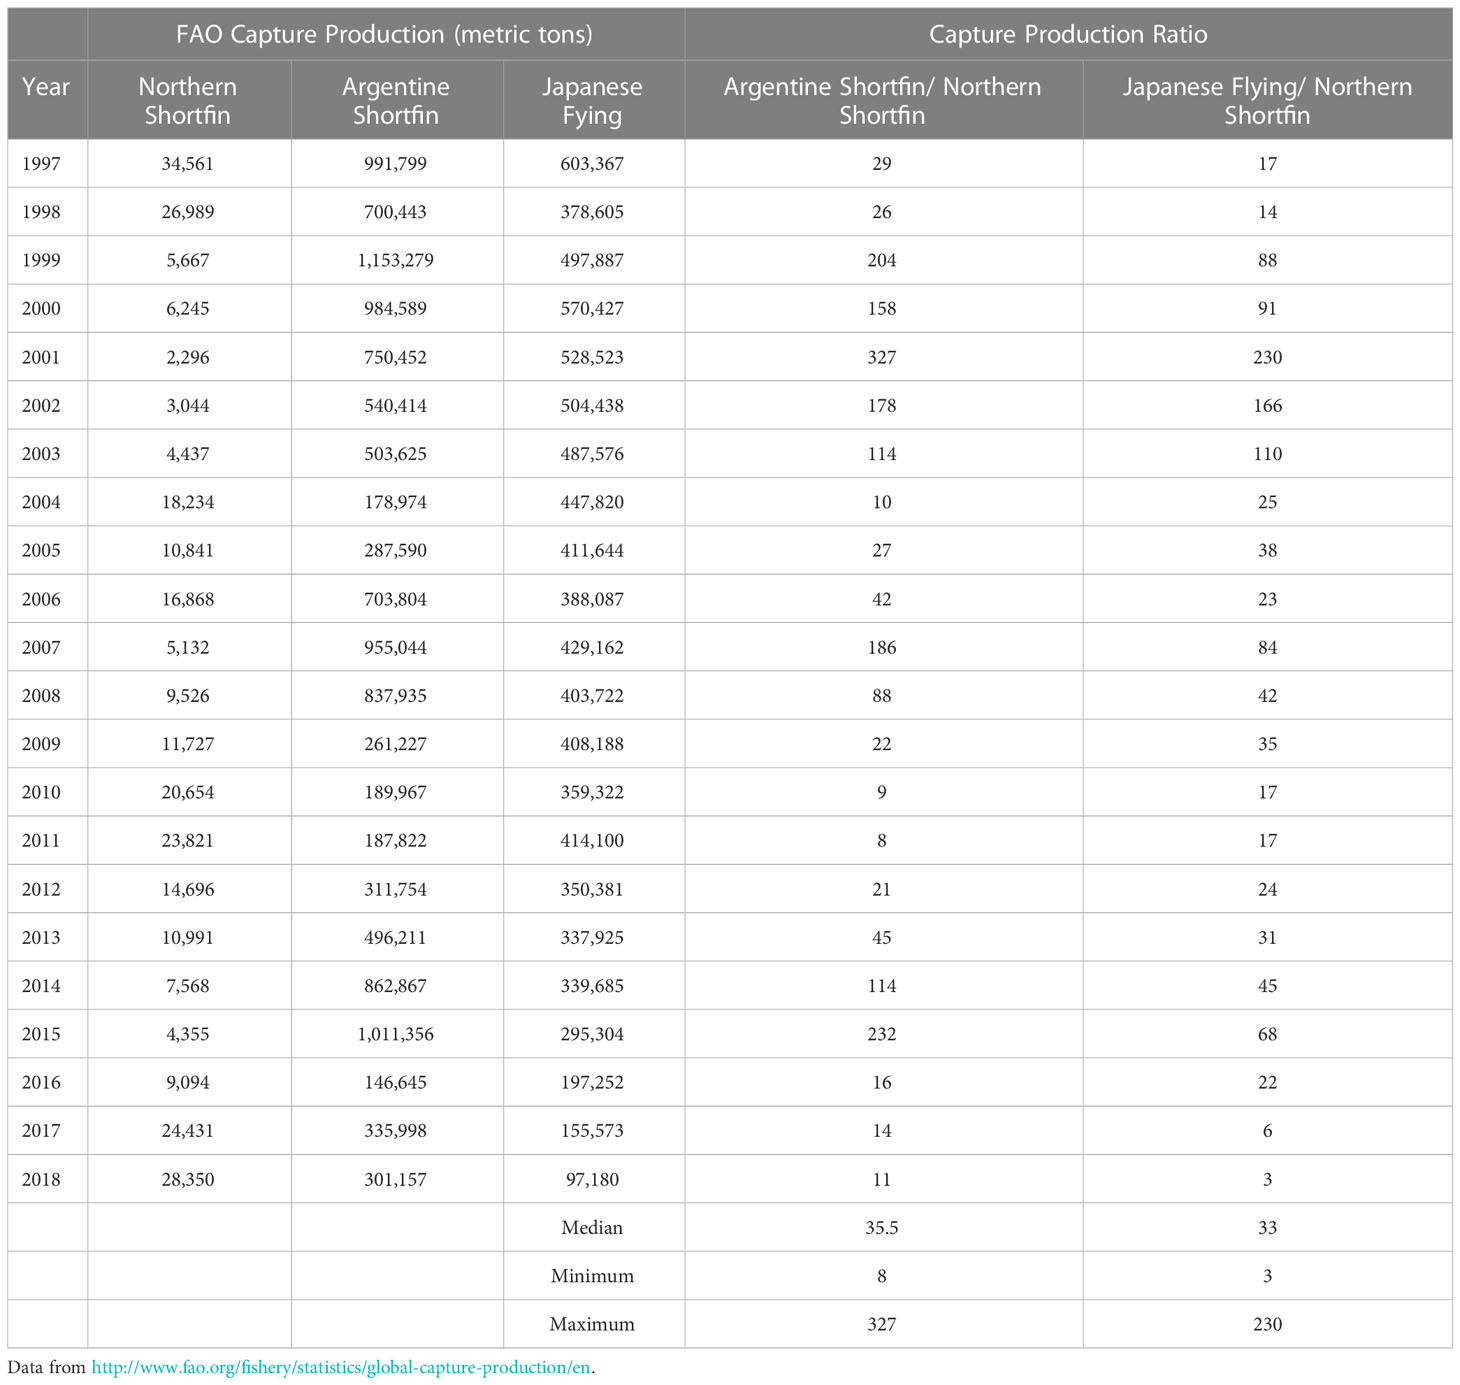
Table 1 Food and Agriculture Organization (FAO) capture production for northern shortfin squid, Argentine shortfin squid in the southwestern Atlantic and Japanese flying squid in the north Pacific and the relative scale of northern shortfin squid capture production to these fisheries (capture production ratio).
The summit also provided a valuable opportunity for members of the fishing industry and science community to share information about the dynamics of the northern shortfin squid population and fishery, develop priorities for research efforts going forward, and form industry-science relationships to facilitate ongoing collaboration. The research efforts prioritized at the summit included 1) quantify the overlap between the U.S. northern shortfin squid fishery and stock distribution to better estimate availability, escapement and the impact of fishery removals (Lowman et al., 2021); 2) define the hold type (freezer, RSW, ice) of each vessel participating in the fishery to enable explicit integration of the impacts of differences in handling in CPUE standardization and stock assessment modeling; 3) explore methods to quantify market dynamics impacting fishing behavior and include in CPUE standardizations; 4) explore how environmental conditions affect the distribution and productivity of northern shortfin squid; and 5) develop a streamlined mechanism to compile northern shortfin squid mantle length and body weight data collected by processors and use data to better understand northern shortfin squid movement, growth, and environmental drivers. In order to address these research priorities, additional conversations with individual harvesters and processors were required for data collection, hypothesis formulation, and interpretation purposes.
2.3 Documenting knowledge through targeted conversations with industry
Following the summit, we held semi-structured conversations with representatives of six northern shortfin squid processors and 17 northern shortfin squid harvesters. The six processors have been responsible for processing and marketing 75-90% of the total landings of northern shortfin squid in U.S. waters since 1997. Most of the 17 harvesters had participated in the northern shortfin squid fishery for at least a decade. The harvesters collectively represented all ports participating in the fishery and included six that fish out of New Jersey, eight that fish out of Rhode Island, and three that fish out of Massachusetts. Of the 17 harvesters consulted, four operate vessels that freeze squid at sea, seven operate vessels that store squid on ice, and six operate vessels with RSW systems. Thus, all vessel/processing types described above were represented. In addition to the 23 industry members consulted via semi-structured conversations, an additional 63 harvesters were contacted to characterize the hold type for each vessel that had participated in the fishery since 1997.
Conversations with harvesters were guided by a list of standard questions about technical and economic factors influencing catch and effort in the fishery developed collaboratively by members of the Northern Shortfin Squid Research Track Stock Assessment Working Group. The questions were sent to harvesters to review before conversations were held either by telephone, video meeting, or in person. Notes were compiled for each conversation, which were provided to each harvester to review for accuracy and completeness. Follow up conversations to clarify responses and mechanisms were ad hoc and numerous.
During semi-structured conversations with industry members, further details about freezer trawler and wet boat fleet dynamics were identified by the industry and discussed. For example, industry members described how the availability of northern shortfin squid and alternative stocks, changes in the global market, and investment in shoreside processing have caused the northern shortfin squid fishery to change from one dominated by trawlers freezing squid at sea, to a fishery in which vessels store squid in RSW systems or on ice and sell them to shoreside processor/dealers (Figure 1). Freezer trawlers can store up to 650,000 pounds of frozen squid in a 7-10 day fishing trip and usually complete around 12 fishing trips per year. Freezer trawlers generally make fewer trips in years when the global market is saturated with squid, prices are low, and large inventories are held in cold storage. While catch rates of freezer trawlers are limited by shipboard freezing rates, capacities to store large quantities of frozen squid shipboard allow the vessels to fish grounds distant from shoreside facilities. Alternatively, large RSW vessels can land up to 300,000 pounds in a 1-2 day fishing trip, usually completing well over 20 trips per fishing season. Since northern shortfin squid are highly perishable and the vessels generally need to return to port within 72 hours of first catch, RSW and ice vessels are profitable when the squid are concentrated on fishing grounds near enough to shoreside processing plants so that vessels can reach plants before squid begin to spoil. Rapid transit from fishing grounds to processing plants is particularly critical for vessels that store squid on ice, which is less effective than RSW at quickly reducing product temperature to maximize product quality. Thus, the perishability of squid combined with market demand for high quality product imposes constraints on the duration of fishing trips, location of fishing grounds, and the timing of landings for ice and RSW vessels that deliver to shoreside processors. Wet boats and shoreside processing are profitable when squid are persistently available in large quantities.
Beyond fleet type and market dynamics, industry members identified several other factors that impact northern shortfin squid catch and effort: fuel price, hold/tank capacity, length of time catch remains fresh, gear conflicts, recent increases in participation in the northern shortfin squid fishery, weather, time of day, and environmental conditions.
Fuel price was cited by several harvesters as an important determinant of fishing behavior. Specifically, when fuel price is high, harvesters are less likely to search over large areas, as the potential benefit of more productive fishing grounds is outweighed by the high cost of fuel. Thus, in years or weeks when fuel price is high, catch or landings per unit effort indices may be decoupled from the condition of the northern shortfin squid population, as vessels are more likely to continue to fish on lower densities of squid to conserve fuel.
Hold or tank capacity was also described as a major driver of fishing behavior. Vessels with larger hold or tank capacities are more likely to steam farther from port to fish in areas where northern shortfin squid densities are highest. This is particularly true for freezer vessels, which are not constrained by the perishability of fresh squid. RSW vessels with larger hold capacities can also benefit from larger area searches, as the benefit of highly productive tows outweighs the cost of the extra steam time as long as the squid can be kept from spoiling. Vessels with lower tank or hold capacity are more likely to fish closer to port where squid densities are lower, as they do not require high densities of squid to fill their hold/tanks.
The length of time that catch remains fresh was specifically identified as impacting fishing location, likelihood of changing fishing locations, and limits to catch per tow for ice and RSW vessels. As described above, the length of time that catch remains fresh depends on the vessel type, with ice vessels having the shortest time that catch remains fresh (48 hours), followed by RSW (72 hours), and freezer (weeks). Thus, wet boats are more likely to fish closer to port, even if northern shortfin squid are less productive in those areas. Wet boats are also less likely to change fishing locations, as time spent steaming between fishing grounds is time when squid quality is degrading and no additional catch is occurring. Finally, total catch per tow is limited by the amount that can be processed while staying cold enough to maintain quality.
In addition to the vessel-specific factors impacting northern shortfin squid catch and fishing effort described above, harvesters also identified several management-related factors that drive when, how, and where they fish. Restricted Gear Areas, which are intended to separate mobile gear and fixed gear, preclude mobile gear vessels from fishing along the shelf break from the northern edge of Hudson Canyon to Atlantis Canyon during the northern shortfin squid fishing season (Figure 2). Fishing regulations (e.g. small mesh restricted areas) and technical constraints also limit northern shortfin squid fishing throughout most of the Gulf of Maine. Thus, lack of landings from these areas are not due to the absence of northern shortfin squid, but due to the exclusion of mobile gear or all fishing. In addition to formal gear restricted areas, there are also areas where the density or location of fixed gear makes it impossible to fish mobile gear and harvest northern shortfin squid. These areas vary by year, following the distribution of the offshore lobster and crab fisheries.
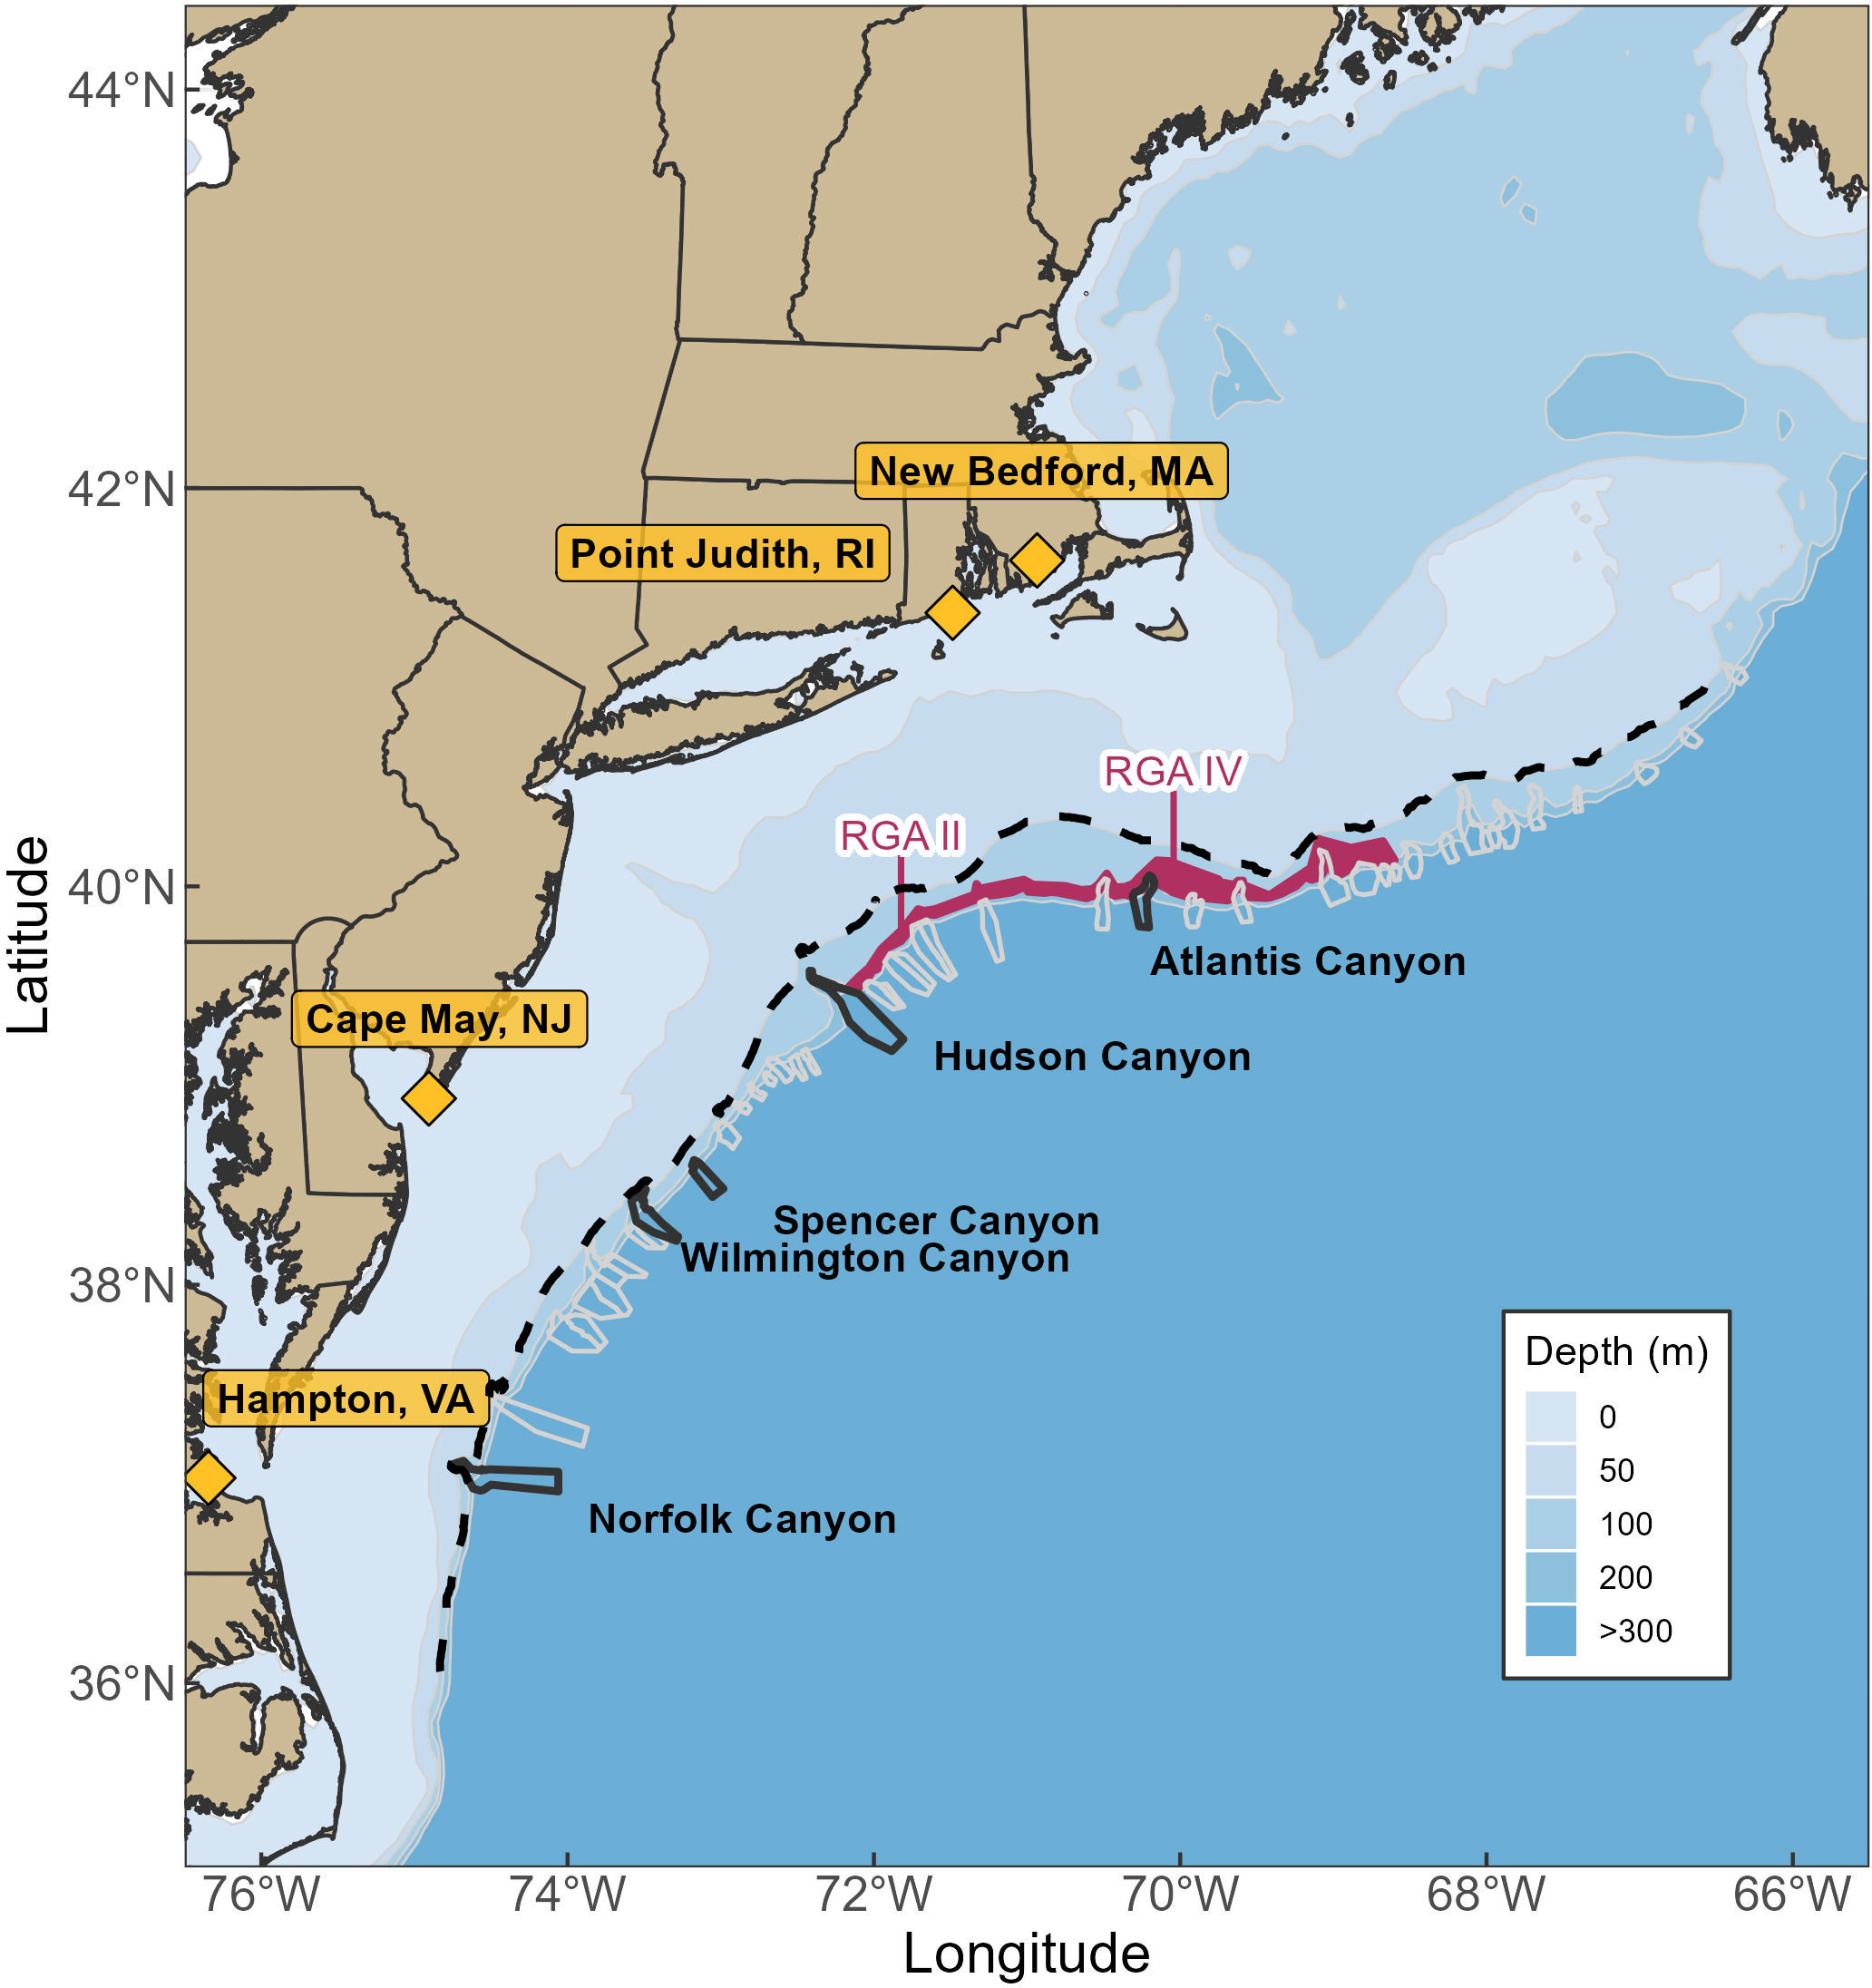
Figure 2 Map of the general extent of northern shortfin squid fishing grounds (dotted black line), Restricted Gear Areas (RGA - solid maroon polygons), ports with squid processing facilities (yellow diamonds), and major canyons (solid lines of black or grey) along the continental shelf (approximately 200 m isobath).
As mentioned previously, there has been a significant change in the composition and number of participants in the northern shortfin squid fishery in recent years. The static and common quota for northern shortfin squid has always resulted in some level of competitive fishing. In 2017-2021, with more vessels harvesting northern shortfin squid and a limited and common quota, the quota was harvested faster. This has changed the dynamics of the fishery substantially.
Another factor affecting fishing behavior of northern shortfin squid harvesters is weather. Severe weather (strong winds, high seas) can impede vessels from safely sailing, from keeping their gear on the bottom, or from effectively catching squid. Severe weather also makes it difficult to maintain ship stability on RSW and ice boats when they transport large volumes of fresh squid to shoreside processing plants in rough conditions. Squid are also sensitive to the conditions of the water column and often disperse during large storms. Thus, northern shortfin squid catch and landings may decline or cease for weeks during years in which large storms have impacted the Mid-Atlantic or offshore Southern New England. Weather plays into a harvester’s decision about whether to fish, but it is variable by vessel type, vessel size, port, and captain. Further research is needed on the threshold of weather conditions that prevent fishing or scatter northern shortfin squid, and therefore effectively shut the fishery down temporarily.
Many harvesters noted that the catch rate of individual tows varied greatly throughout the day. The most productive tows most commonly occur at dawn or dusk, with midday tows yielding lower catch rates. This is likely related to the diel vertical migration of northern shortfin squid, with squid more strongly associated with the seabed, and thus more available to bottom trawling, during daylight. Aggregation near the seabed is especially pronounced during morning and evening twilight on the outer edge of the shelf during the summer months (Benoit-Bird and Moline, 2021). In addition, harvesters noted that northern shortfin squid fishing is typically less productive on and around the full moon.
Finally, harvesters largely agreed that there are oceanographic drivers of northern shortfin squid. Specific oceanographic drivers discussed by harvesters included Gulf Stream position, Gulf Stream warm core rings, eddies, filaments, streamers, southerly winds, and upwelling zones. Although hypotheses were abundant, the harvesters consulted were not confident that pre-season oceanographic conditions could be used to forecast the productivity or availability of northern shortfin squid in a given year. While oceanographic features may be observed to be associated with high or low quantities of northern shortfin squid at one time, the relationships are often not consistent (Dawe et al. 2007; Rodhouse et al. 2014; Moustahfid et al. 2021). Harvesters recommended that additional research is needed on this topic to identify and test hypotheses related to the oceanographic drivers of northern shortfin squid.
2.4 Applying industry knowledge to Catch Rate standardization
The knowledge shared by members of the northern shortfin squid fishing industry were used to define how fishery dependent data were handled and which covariates were applied in the development of CPUE indices. For example, we used information provided by industry members to define and differentiate freezer trawler and wet boat fleets within the data, which enabled discrete CPUE modeling of the two fleets. We used a stepwise approach to prioritize the other factors that industry members described as important in driving catch and effort for inclusion as covariates in CPUE standardization. First, we determined which factors were consistently identified by members of the fishing industry. Second, we determined which factors were likely to be correlated due to similar underlying drivers. Third, we determined which factors were quantifiable with available data. These factors were then used as covariates in the CPUE standardizations.
Ultimately, three fishery dependent data sets maintained by the Northeast Fishery Science Center (NEFSC) were used for the landings and CPUE standardizations: dealer/logbook, Observer program, and Study Fleet program (Figure 3). The dealer/logbook data set is a census of landings that comprehensively describes northern shortfin squid landings, as they have been collected for every northern shortfin squid fishing trip since 1996 as part of federal reporting requirements. The spatial resolution and time step of the data set, however, are relatively coarse, with landed catch information recorded at the sub-trip level (i.e. one record of total landed catch per statistical area per fishing trip). As part of routine data auditing procedures, mandatory dealer reports are compared to the self-reported logbooks to verify reported landings. The Observer program data set comprises catch, bycatch, and fishing effort information for individual tows collected by independent observers through the Northeast Fisheries Observer Program during a subset of randomly selected northern shortfin squid fishing trips since 2011 (Wigley and Tholke, 2020). The observer data set covers 4-10% of northern shortfin squid fishing trips in a given year, with lower coverage in recent years, especially during the COVID-19 pandemic. Finally, the Study Fleet data set is composed of detailed catch, bycatch, fishing effort, and bottom water temperature data for individual tows that are self-reported by harvesters participating in the Study Fleet program (Jones et al., 2022). The Study Fleet data set covers up to 45% of northern shortfin squid fishing trips in recent years.
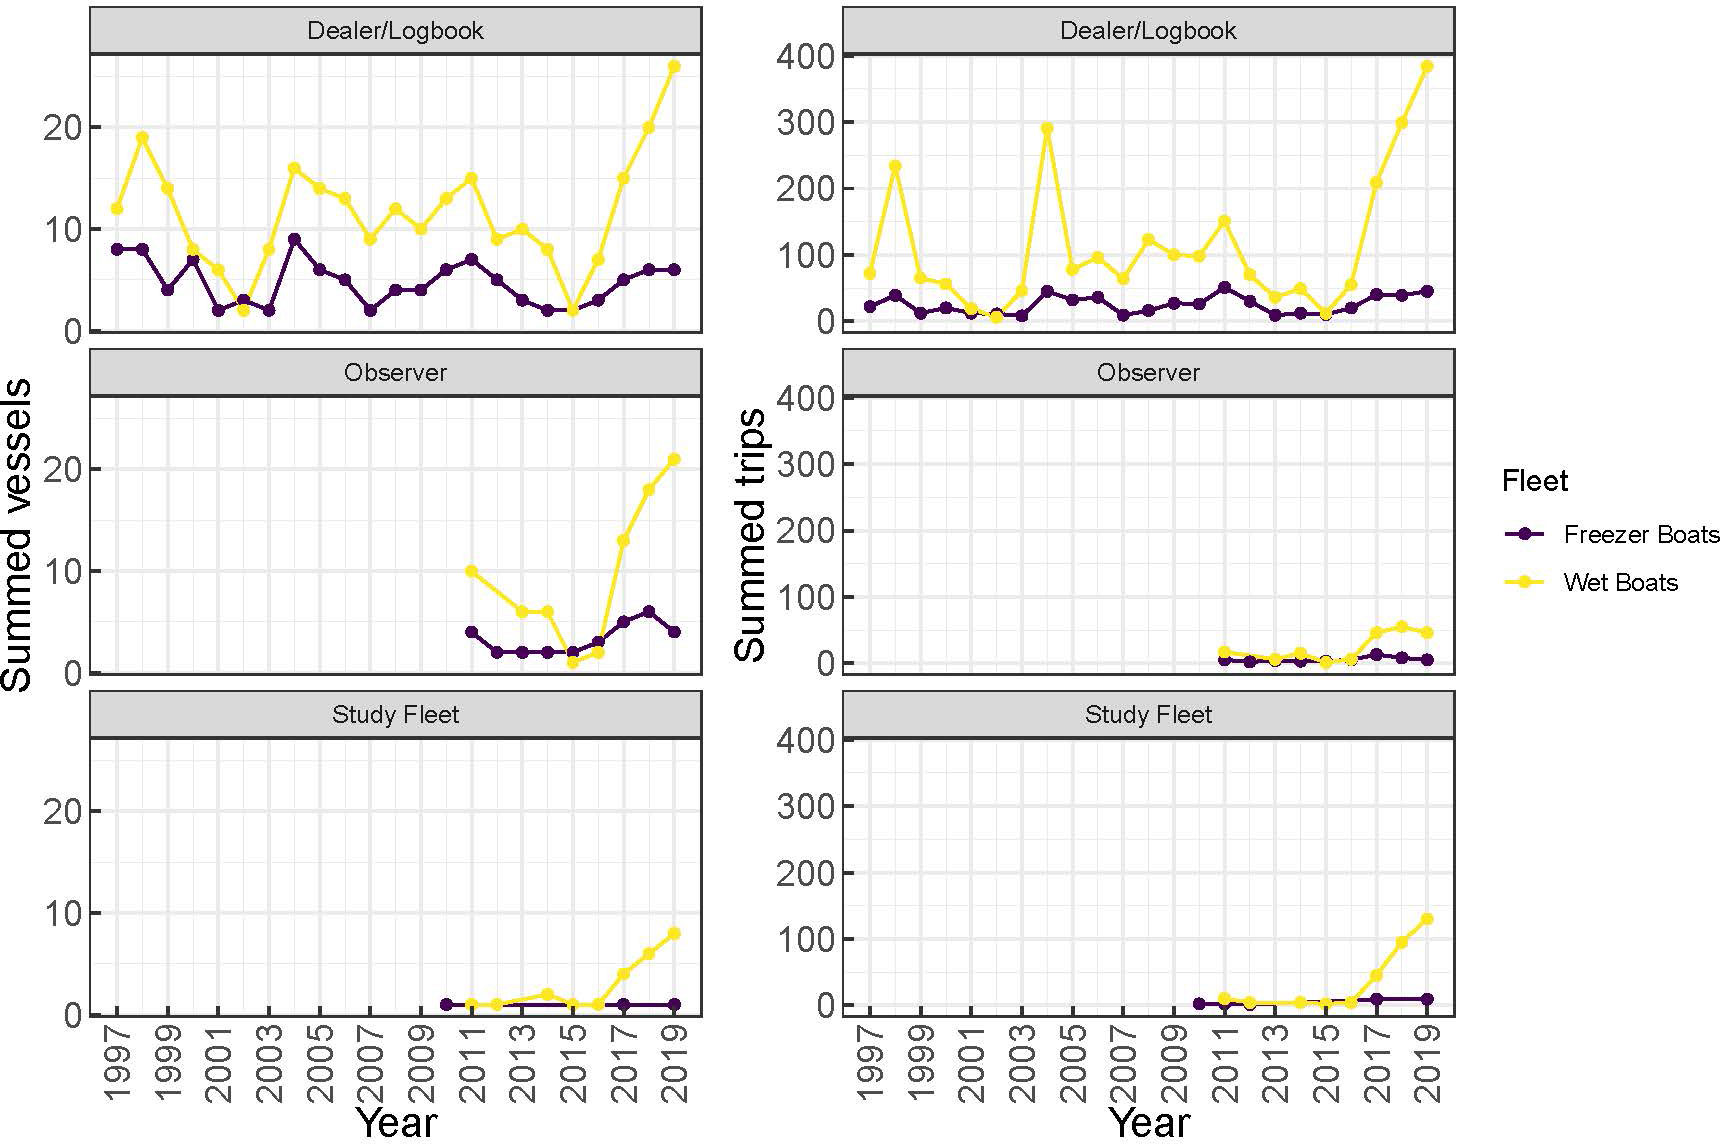
Figure 3 Time series of northern shortfin squid fishery participation (number of vessels, left panels) and effort (number of trips, right panels) across the Dealer/Logbook, Observer, and Study Fleet data sets. Purple lines indicate freezer vessels. Yellow lines indicate wet boats (ice and refrigerated sea water).
We used conventional statistical methods for building standardized CPUE indices. All statistical analyses were performed using R version 3.6.2 (R Core Team, 2019). Generalized additive models (GAMs) were fitted using the mgcv package (Wood, 2011). Based on histograms of CPUE and LPUE, we investigated several error distributions: lognormal, gamma (with log link), and negative binomial (with log link). Based on the most promising set of diagnostics (quantile-quantile plots, Cook’s distance, and residuals), we built GAMs with the corresponding distribution using forward stepwise selection of explanatory variables with AIC and percent deviance explained as the selection criteria. For further detail on statistical methods, see Supplementary Material. Additional information is also available as a working paper supplement to the 2022 Illex Research Track Assessment (available online through the NEFSC Stock Assessment Support Information portal at https://apps-nefsc.fisheries.noaa.gov/saw/sasi.php).
A variety of social and environmental factors identified by the fishing industry at the summit and during individual conversations were considered as covariates in the CPUE standardization. These included year and week effects, weekly domestic squid and fuel prices, the state and port where squid were landed, the number of days a vessel was absent from port, the location of the fishing activity, the distance from the landing port to the fishing location (a straight line distance estimate), and global Ommastrephid production. A subset of these variables were ultimately included in final models to each data set for each vessel hold type (freezer or wetboat: see Table 2). Models were fit to each data set, rather than a combined data set, due to differences in spatiotemporal resolution across data sets. For example, the Observer and Study Fleet data sets contain northern shortfin squid catches for individual fishing tows, while the dealer/logbook data set contains total northern shortfin squid catch from a fishing trip. Additionally, not all data sets include records of discarded catch, therefore we used landings per unit effort (LPUE) as the response variable in modeling. Because discards are negligible in the northern shortfin squid fishery, landings are nearly equivalent to catch and we therefore use the terms LPUE and CPUE interchangeably.
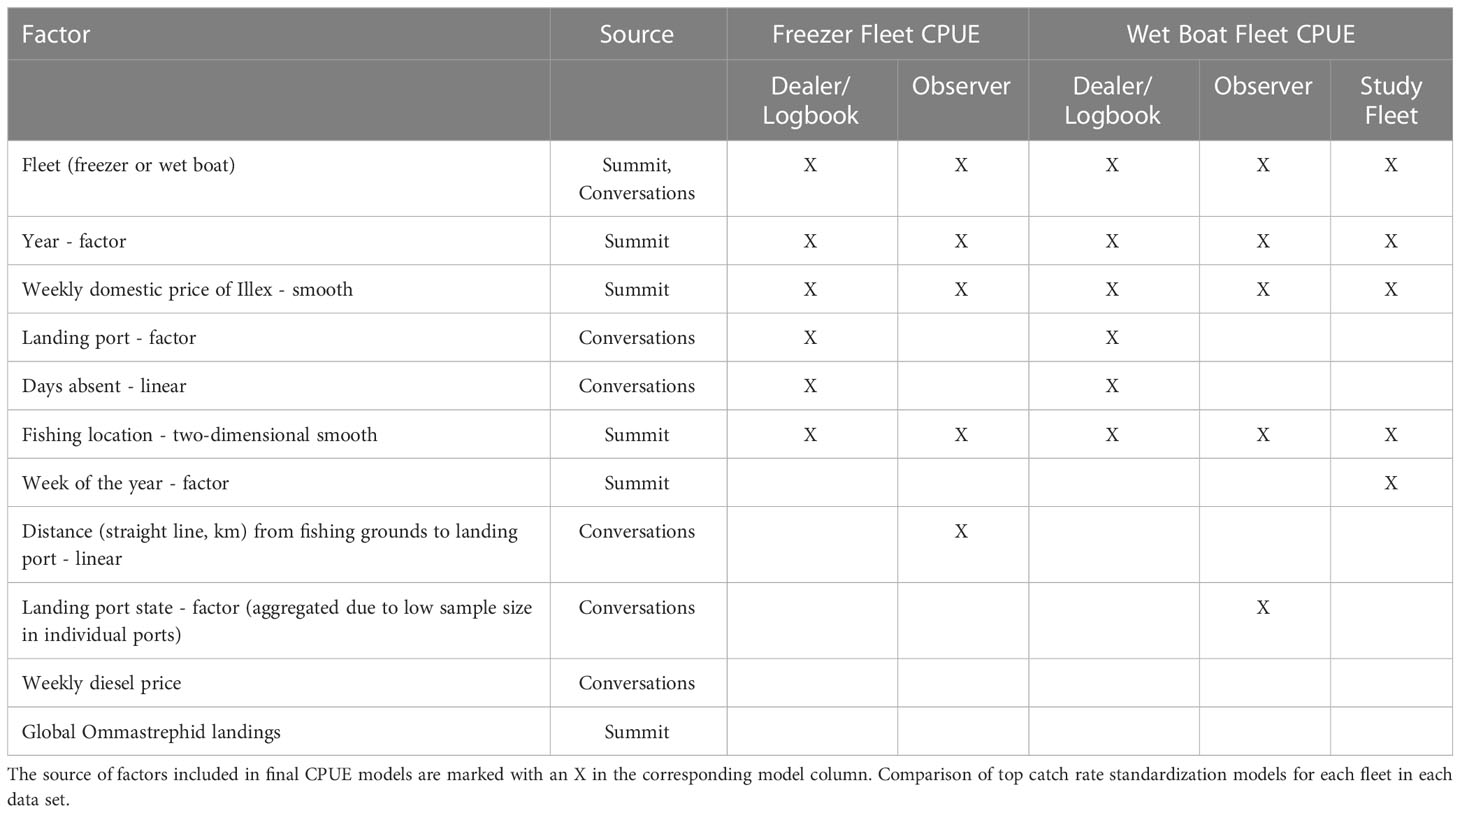
Table 2 Factors that impact northern shortfin squid catch and effort identified by industry collaborators and considered in CPUE standardization.
Domestic prices for northern shortfin squid by week are included in the CPUE and LPUE standardizations because some harvesters noted that they modified their fishing behavior based on fluctuations in price. For example, when price is high they may stay on a less dense aggregation of squid and accept a lower LPUE, when they would otherwise move on to search for denser fishing ground when prices are lower. Domestic price is calculated based on total landed value divided by the total landings (pounds) for each week. Prices were adjusted for inflation by standardizing to 2019 USD, using the Gross Domestic Product Implicit Price Deflator from the Federal Reserve Economic Data (U.S. Bureau of Economic Analysis). Prices from the week preceding a fishing trip were used to reflect the fact that fishing decisions are made based on the information available when boats leave the dock, not the price when they land.
Global harvest of Ommastrephids was consistently reported by industry members as a major factor affecting northern shortfin squid LPUE. Therefore, annual global landings of Argentine shortfin squid (Illex argentinus) and Japanese flying squid (Todarodes pacificus) were included in the CPUE and LPUE standardizations as indicators of the global Ommastrephid squid market (Tables 1; 2). The Argentine shortfin squid fishery occurs primarily in the first half of the year before the U.S. northern shortfin squid fishery, so Argentine shortfin squid landings were not lagged during covariate development. Conversely, the Japanese flying squid fishery occurs primarily in the second half of the year, so Japanese flying squid landings were used from the year previous to the northern shortfin squid fishing year.
Fuel price was reported by harvesters to impact fishing behavior in a similar way to the domestic northern shortfin squid price. When fuel is more expensive, harvesters are less willing to search or move off a moderately productive spot. Diesel price for the New England region of the U.S. was pulled from the Energy Information Administration and prices were adjusted for inflation by standardizing to 2019 USD using the Gross Domestic Product Implicit Price Deflator from Federal Reserve Economic Data.
Landing port and days absent (trip duration) were also included as covariates in the CPUE and LPUE standardizations, as harvesters noted longer trips were often associated with lower CPUE. In addition, the distance to fishing grounds was calculated as the straight line distance between the reported fishing location and the landing port.
Using the data sets described above and covariates highlighted by industry, we developed GAMs using forward stepwise selection with Akaike’s Information Criterion (AIC) and percent deviance explained as the selection criteria (Wood, 2017). Ongoing discussions with fishing industry collaborators and the stock assessment working group produced suggestions for model adjustments, insight into the CPUE trends produced, and explanation of the non-linear effects of covariates. Feedback was received during one-on-one or small group conversations with fishing industry collaborators as well as during stock assessment working group meetings. The process was iterative, with the CPUE models and outputs taking many shapes along the way. Ultimately, the CPUE and LPUE indices developed were utilized to assess the general trends in northern shortfin squid abundance across years (Figure 4). Each distinct CPUE and LPUE series provided useful insight into the dynamics of the northern shortfin squid fishery in addition to species abundance. Further, congruence between these CPUE and LPUE with other indices developed for the northern shortfin squid stock assessment, provided confidence in the accuracy of the trends (Figure 5). For additional information on CPUE model building, see Supplementary Materials.
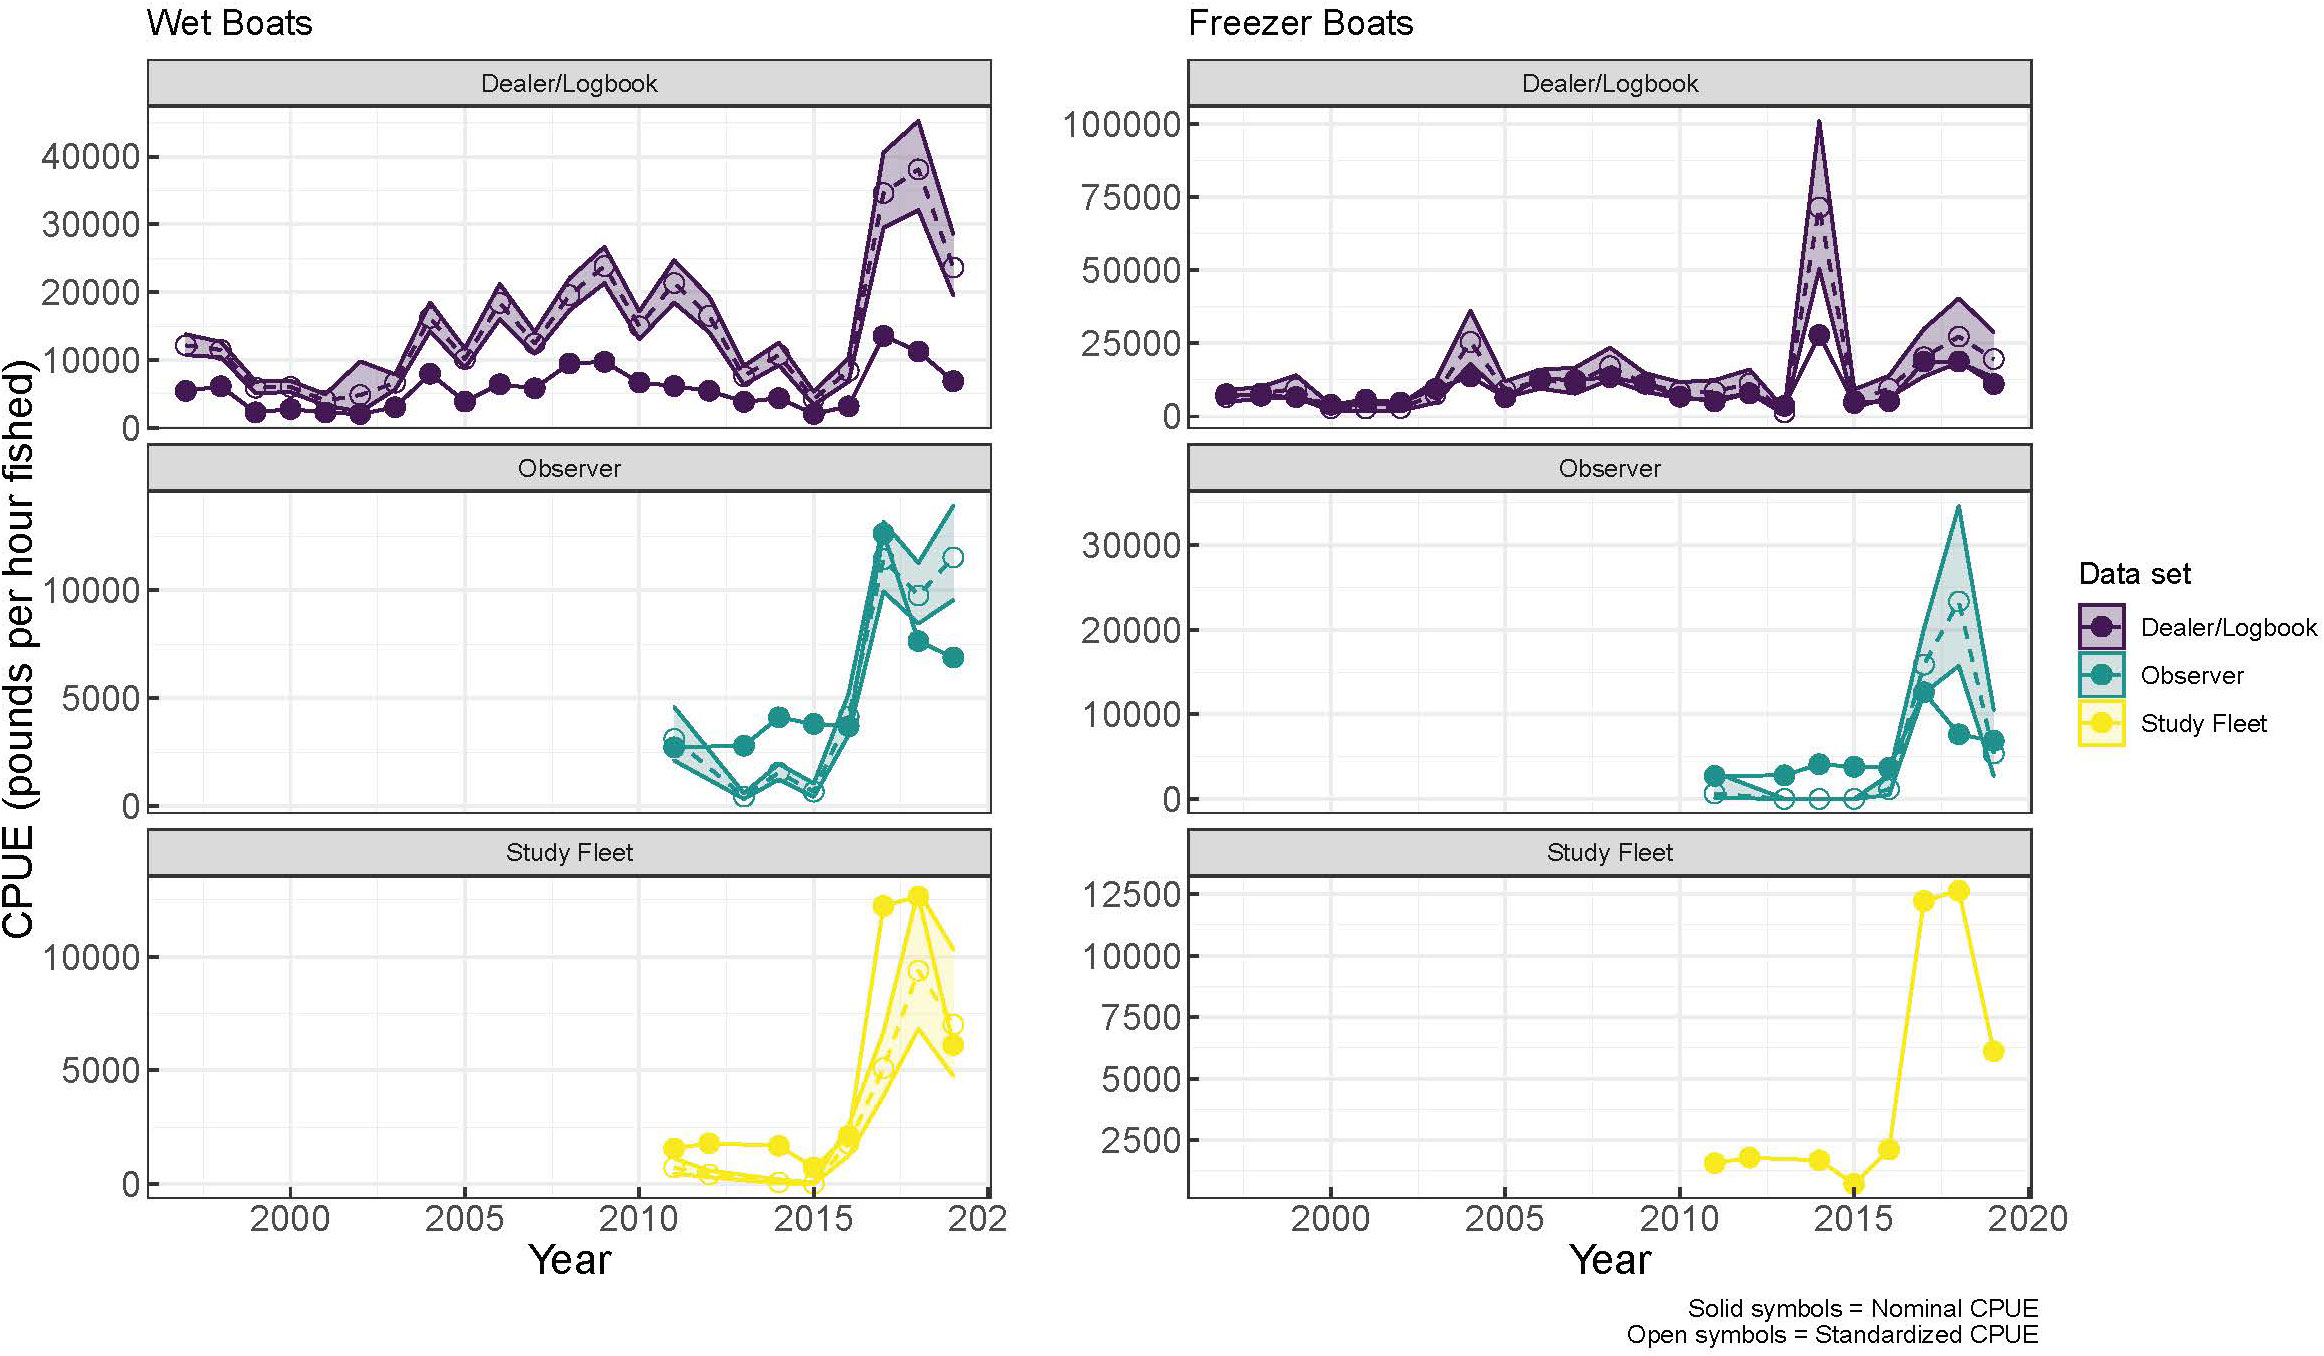
Figure 4 Nominal (solid symbols) and standardized CPUE (open symbols) series for the Wet Boat fleet and the Freezer Boat fleet. The shaded region indicates +/- SE. Top panel shows the dealer/logbook data, middle panel shows the observer data, and bottom panel shows the Study Fleet data.
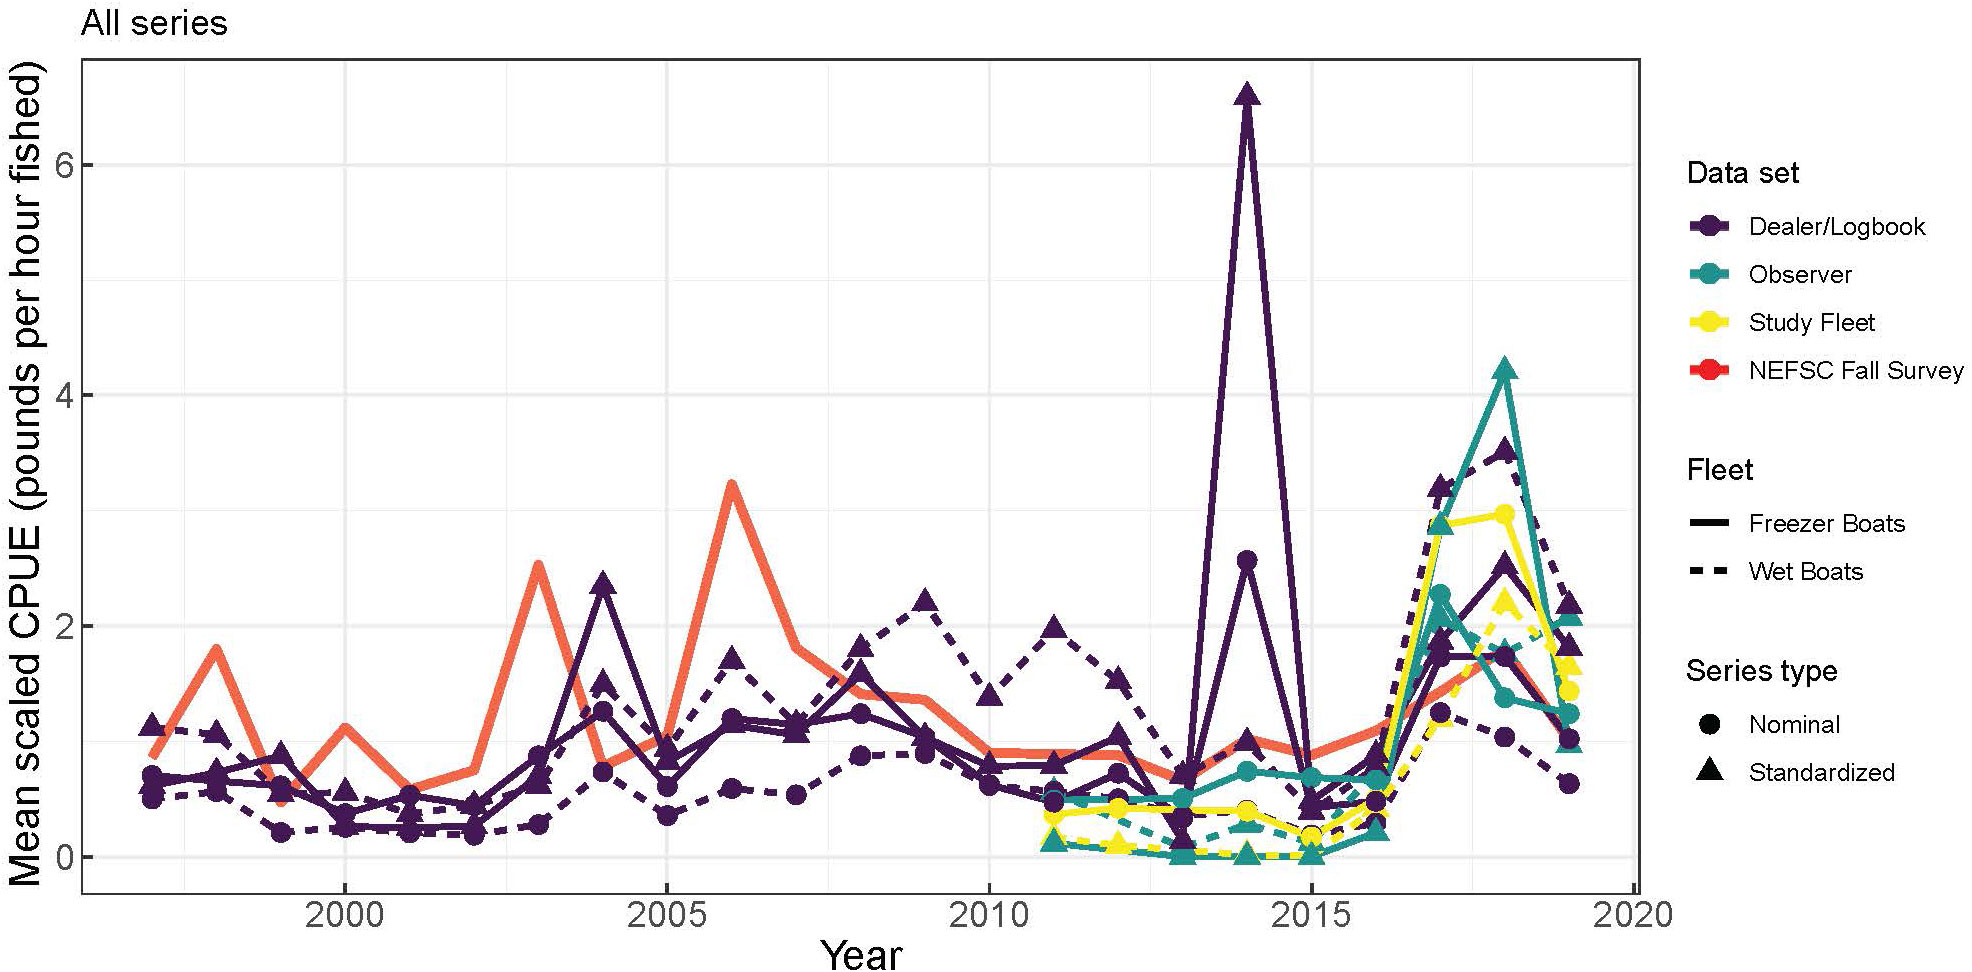
Figure 5 Comparison of standardized northern shortfin squid Catch Per Unit Effort (triangles), nominal northern shortfin squid Catch Per Unit Effort (circles), and NEFSC Fall Bottom Trawl Survey index (red line) from 1997 to 2019. For standardized CPUE time series, line color indicates data set (Purple = Dealer/logbook, Blue = Observer, Yellow = Study Fleet) and dash type indicates standardization approach (Short dashed = Freezer boat CPUE standardization; Long dashed = Wet boat CPUE).
2.5 Integration of fishery knowledge into the stock assessment
Several members of our research team formally and informally participated in the Northern Shortfin Squid Research Track Stock Assessment Working Group, which was initiated several months after the summit. Industry members also regularly participated in stock assessment working group meetings, which were open to the public. To ensure that industry knowledge gathered both at the summit and through individual conversations was integrated into the stock assessment process, we developed a working paper detailing the technical and economic dynamics of the northern shortfin squid fishery, as well as the ecology and environmental drivers of the species, as reported by industry (Northeast Fisheries Science Center (NEFSC), 2021). This information was referenced regularly throughout the stock assessment process. We also engaged the Northern Shortfin Squid Research Track Stock Assessment Working Group in progressing application of industry knowledge to CPUE modeling. This enhanced the quality of the standardized CPUE model.
The knowledge shared and documented throughout this SIRC was also critical to the development, parameterization, and interpretation of a generalized depletion model for the northern shortfin squid stock assessment (Northeast Fisheries Science Center (NEFSC), 2021; Arkhipkin et al., 2021). Depletion modeling requires robust fishery dependent data, including documentation of the socioeconomic and technical factors that impact catch (Roa-Ureta, 2012; Roa-Ureta et al., 2015). The knowledge that industry shared during this SIRC was essential to determining the structure of the generalized depletion modeling and in interpreting the outputs. Industry knowledge about gear selectivity and species catchability were also applied in the development of a mass balance model, an envelope model, and an escapement model for northern shortfin squid (Rago 2020; Northeast Fisheries Science Center (NEFSC), 2021).
The SIRC developed during this research evolved and expanded to cover several other topics that were identified as priorities during the stock assessment process. For example, it became clear throughout the stock assessment process that enhanced data on northern shortfin squid body size and weight are essential for understanding the structure of the population as well as the movement of cohorts onto and off of the continental shelf. In response to this need, industry collaborators shared insight on northern shortfin squid growth throughout the fishing season as well as squid body size and weight data collected by processors. This exchange of information initiated a formal research initiative to develop an electronic data collection system for use by the region’s northern shortfin squid processors to collect individual squid size and weights during the vessel offload process. In 2021 and 2022, six northern shortfin squid processors collected over 60,000 northern shortfin squid mantle lengths and weights through this initiative.
Further research to evaluate the oceanographic drivers of northern shortfin squid was also prioritized during the stock assessment process. Thus, a team of researchers and industry members formed the “Squid Squad” to share observations and develop hypotheses to explore analytically. The “Squid Squad” collectively developed a conceptual model and identified oceanographic features and fishery data to explore, resulting in new hypotheses and areas for research (Salois et al., 2023). Regular (~weekly) meetings provided industry, scientists, and managers with an informal opportunity to discuss the status of the fishery and the surrounding ecosystem. These meetings continue to be an effective tool for progressing this collaboration and pursuing multiple research questions related to the northern shortfin squid. In 2022, the “Squid Squad” executed a novel process-oriented research cruise, with a commercial fishing vessel sampling for northern shortfin squid within and around a mid-depth salinity maximum intrusion that was simultaneously being mapped by an oceanographic research vessel (Gawarkiewicz et al., 2022). The relationships developed and results produced throughout this process have laid the foundation for meaningful collaborations between the scientific and fishing communities in the future.
The 2021 northern shortfin squid research track stock assessment did not produce an acceptable stock assessment model for the species (Northeast Fisheries Science Center (NEFSC), 2021). Thus, the research products described above are critically important for informing management of the northern shortfin squid fishery.
3 Summary recommendations
As exemplified through this research, the insights and knowledge of members of the fishing industry are essential to the proper application and interpretation of fishery dependent data. In the case of northern shortfin squid, industry collaborators played a key role in identifying the factors that impact fishing selectivity, effort, and landings, as well as refining CPUE models and interpreting results. Northern shortfin squid processors and harvesters identified many technical and economic factors that drive the catch and landings of northern shortfin squid. The most frequently identified factors impacting northern shortfin squid catch and landings were 1) vessel type (freezer or wet boat), 2) market dynamics (global production of Ommastrephids), 3) price for northern shortfin squid, and 4) availability of northern shortfin squid to the fishery (abundance of northern shortfin squid in fishable areas, and proximity of productive fishing grounds to ports). With these factors explicitly accounted for, we believe CPUE and other fishery-dependent data analyses can be useful tools for assessing the trends in and condition of the northern shortfin squid population. Frequent and meaningful dialogue with members of the northern shortfin squid fishery is necessary to ensure that technical and socio-economic factors are accounted for appropriately.
In addition to identifying the factors that are important to consider when analyzing and interpreting northern shortfin squid fishery data, this research also highlights the importance of using the appropriate effort metrics when calculating CPUE for northern shortfin squid. Given the highly variable tow times, catch handling techniques and technical constraints on trip length, we suggest using tow time, rather than days absent or number of tows, as an effort metric in CPUE analyses. Accompanied with precise fishing locations and data on squid sizes and weights, CPUE indices can be a powerful tool for understanding the northern shortfin squid population and fishery.
Catch rate standardizations can be challenging to construct, as they require a nuanced understanding of fishing behavior and the fishery-dependent data sets collected within a region, which researchers and managers often do not independently possess. As demonstrated by this research, documenting and incorporating industry knowledge can be an effective means to advance catch rate standardizations. Furthermore, several existing CPUE standardization methods suggest enhanced integration of local ecological knowledge, but the types of approaches for engaging with industry members are not well described (Bishop, 2006; Bentley et al, 2012). In the research presented here, three phases of collaboration contributed to the effective integration of industry knowledge: 1) a summit of scientists and industry members, 2) a series of semi-structured conversations, and, 3) application of industry knowledge to CPUE standardization, and 4) ongoing discussions throughout the stock assessment process.
Each phase of collaboration provided insight into different aspects of the northern shortfin squid fishery and the biology of the species, together providing the comprehensive understanding needed for accurate catch rate standardization. The continued and constructive communication between science and industry partners throughout all phases was essential to building trust and laid the groundwork for information sharing. The summit allowed us to gain important insights into general trends in catch through time and high-level factors that may be important to collect at a higher resolution. For example, vessel hold type, which became a key variable in stratifying the data, was identified at this stage. Following this event, it was clear that follow up conversations were needed to generate data on vessel hold type for each vessel participating in the fishery, and while soliciting this information, additional questions about fishing practices could be asked as well. These follow up conversations allowed us to get more detailed information about the factors influencing catch rates and ensured that a diversity of perspectives was documented. Following the individual conversations, working through model development and iterative fitting during the stock assessment process allowed considerations about time series length, data set coverage, and other logistical considerations to be worked through such that insights from industry could best be translated into time series of catch or landings per unit effort. The industry’s belief in the value of this research and trust in scientific collaborators grew throughout all phases of this research and was paramount to its success.
4 Conclusion
Overall, this work exemplifies the value of engaging the fishing industry in research to inform stock assessments and fisheries management. Members of the fishing industry hold valuable experiential knowledge that can inform data treatment and analysis, offer unique data collection opportunities to meet research needs, and have unique insights into and hypotheses about the environmental drivers of resource species that are derived from many years on the water. Initial focus on building trust and open communication and identification of mutually beneficial research products are essential to science and industry collaborations. Proper application and interpretation of fishery dependent data requires the insights and knowledge of members of the fishing industry.
This research highlights the unique benefits and outcomes of engaging with members of the fishing industry through large-group summits, one-on-one conversations, and during the formal stock assessment process. We suggest that large-group summits are most effective for developing initial relationships and trust between science and industry collaborators, gaining insight into the major factors influencing fishery dynamics, and identifying research priorities. Semi-structured conversations with individual industry members are immensely helpful to dig deeper into specific factors that influence fishery dynamics, identify potential covariates to be included in catch rate standardizations, and to review research results and identify areas for future work. Finally, bringing scientists and industry members together during the stock assessment process can be an effective method for refining catch rate standardization models and identifying other avenues for applying industry knowledge. Together, these approaches for building, maintaining, and applying science-industry research collaborations have been demonstrated to be highly effective at informing catch rate standardization and should be applied in this research area more regularly.
Data availability statement
The raw data supporting the conclusions of this article will be made available by the authors, without undue reservation.
Ethics statement
Ethical review and approval was not required for the animal study because there was no interaction with live animals for this research.
Author contributions
JM and AM conceived of the study in collaboration with industry partners. AM, JM, BL, JP, SS, and KH collected and documented the knowledge shared by industry. RR, BB, TS, ML, JK, KA, and GD contributed knowledge and assisted with documentation. BL, AM, and AJ completed the CPUE analyses. AM and JM contributed the original draft. All authors contributed to the editing. All authors contributed to the article and approved the submitted version.
Funding
Funding for this project was largely provided by the National Oceanic and Atmospheric Administration, Northeast Fisheries Science Center, Cooperative Research Branch. Personnel resources were also contributed by industry partners.
Acknowledgments
We gratefully acknowledge the many shortfin squid harvesters and processors that participated in this research, including James Ruhle, Leif Axelsson, Stefan Axelsson, Kyle Goodwin, Hank Lackner, Bill Bright, Glenn Goodwin, Philip Ruhle, Meghan Lapp, Jeff Kaelin, Greg DiDomenico, Katie Almeida, Mike Roderick, Meade Amory, Ryan Clark, Brendon Mitchell, Gerry O’Neill, Wayne Reichle, Eric Reid, Eoin Rochford, Shawn Laughlin, Jeffrey Wise, Michael Cox, Roman Wloch, Doug Feeney, Steve Welch, and Jeffrey Jordan. We also appreciate the contributions of Jacob Wilson, Calvin Alexander, and Giovanni Gianesin, who facilitated several conversations. The views expressed herein are those of the authors and do not necessarily reflect the view of NOAA or any of its sub-agencies.
Conflict of interest
Author BL was employed by company ERT, Inc.. Author ML was employed by company SeaFreeze Shoreside. Authors JK and GD were employed by Lunds Fisheries. Author KA was employed by The Town Dock.
The remaining authors declare that the research was conducted in the absence of any commercial or financial relationships that could be construed as a potential conflict of interest.
Publisher’s note
All claims expressed in this article are solely those of the authors and do not necessarily represent those of their affiliated organizations, or those of the publisher, the editors and the reviewers. Any product that may be evaluated in this article, or claim that may be made by its manufacturer, is not guaranteed or endorsed by the publisher.
Supplementary material
The Supplementary Material for this article can be found online at: https://www.frontiersin.org/articles/10.3389/fmars.2023.1144108/full#supplementary-material
References
Arkhipkin A. I., Hendrickson L. C., Payá I., Pierce G. J., Roa-Ureta R. H., Robin J.-P., et al. (2021). Stock assessment and management of cephalopods: advances and challenges for short-lived fishery resources. ICES J. Mar. Sci. 78 (2), 714–730. doi: 10.1093/icesjms/fsaa038
Arkhipkin A. I., Rodhouse P. G., Pierce G. J., Sauer W., Sakai M., Allcock L., et al. (2015). World squid fisheries. Rev. Fish. Sci. Aquac. 23 (2), 92–252. doi: 10.1080/23308249.2015.1026226
Benoit-Bird K. J., Moline M. A. (2021). Vertical migration timing illuminates the importance of visual and nonvisual predation pressure in the mesopelagic zone. Limnol. Oceanog. 66 (8), 3010–3019. doi: 10.1002/lno.11855
Bentley N., Kendrick T. H., Starr P. J., Breen P. A. (2012). Influence plots and metrics: tools for better understanding fisheries catch-per-unit-effort standardizations. ICES J. Mar. Sci. 69 (1), 84–88. doi: 10.1093/icesjms/fsr174
Bishop J. (2006). Standardizing fishery-dependent catch and effort data in complex fisheries with technology change. Rev. Fish Biol. Fish. 16, 21–38. doi: 10.1007/s11160-006-0004-9
Bishop J., Venables W. N., Wang Y.-G. (2004). Analyzing commercial catch and effort data from a penaeid trawl fishery: a comparison of linear models, mixed models, and generalised estimating equations approaches. Fish. Res. 70 (2-3), 179–193. doi: 10.1016/j.fishres.2004.08.003
Boyle P. R., Rodhouse P. (2005). Cephalopods: ecology and fisheries (Ames, Iowa: Blackwell Science).
Calderwood J., Pedreschi D., OCuaig M., Reid D. G. (2023). Reflecting on the importance of open communication and social capital for the co-creation of knowledge in Irish fisheries. Front. Mar. Sci. 9. doi: 10.3389/fmars.2022.1081616
Cheng M. L. H., Rodgeveller C. J., Langan J. A., Cunningham C. J. (2023). Standardizing fishery-dependent catch rate information across gears and data collection programs for Alaska sablefish (Anoplopoma fimbria). ICES J. Mar. Sci. 0, 1–15. doi: 10.1093/icesjms/fsad037
Clegg T. L., Fuglebakk E., Ono K., Vølstad J. H., Nedreaas K. (2022). A simulation approach to assessing bias in a fisheries self-sampling programme. ICES J. Mar. Sci. 79 (1), 76–87. doi: 10.1093/icesjms/fsab242
Dawe E. G., Beck P. C. (1985). Distribution and size of short-finned squid (Illex illecebrosus) larvae in the Northwest Atlantic from winter surveys in 1969, 1981 and 1982. J. Northwest Atl. Fish. Sci. 6, 43–55. doi: 10.2960/J.v6.a5
Dawe E. G., Hendrickson L. C. (1998). A review of the biology, population dynamics, and exploitation of short-finned squid in the northwest Atlantic ocean, in relation to assessment and management of the resource. In Scientific Council Meetin - June 1998 / NAFO, 3-18 June, 1998, Dartmouth, N.S., Canada, NAFO SCR Doc., 98 (59), 1–33. Available at: https://oceanrep.geomar.de/id/eprint/52403/
Dawe E. G., Hendrickson L. C., Colbourne E. B., Drinkwater K. F., Showell M. A. (2007). Ocean climate effects on the relative abundance of short-finned (Illex illecebrosus) and long-finned (Loligo pealeii) squid in the northwest Atlantic ocean. Fish. Oceanogr. 16 (4), 303–316. doi: 10.1111/j.1365-2419.2007.00431.x
Dawe E. G., Warren W. (1993). Recruitment of short-finned squid in the northwest Atlantic ocean and some environmental relationships. J. Cephalopod Biol. 2 (2), 1–21. Available at: https://oceanrep.geomar.de/id/eprint/50746/.
Doubleday Z. A., Prowse T. A., Arkhipkin A., Pierce G. J., Semmens J., Steer M., et al. (2016). Global proliferation of cephalopods. Curr. Biol. 26 (10), 406–407. doi: 10.1016/j.cub.2016.04.002
Ducharme-Barth N. D., Grüss A., Vincent M. T., Kiyofuji H., Aoki Y., Pilling G., et al. (2022). Impacts of fisheries-dependent spatial sampling patterns on catch-per-unit-effort standardization: a simulation study and fishery application. Fish. Res. 246, 106–169. doi: 10.1016/j.fishres.2021.106169
Gawarkiewicz G., Fratantoni P., Bahr F., Ellertson A. (2022). Increasing frequency of mid-depth salinity maximum intrusions in the middle Atlantic bight. J. Geophysical Research: Oceans 127, e2021JC018233. doi: 10.1029/2021JC018233
Hare J. A., Morrison W. E., Nelson M. W., Stachura M. M., Teeters E. J., Griffis R. B., et al. (2016). A vulnerability assessment of fish and invertebrates to climate change on the northeast U.S. continental shelf. PloS One 11 (2), e0146756. doi: 10.1371/journal.pone.0146756
Hatanaka H., Lange A. M. T., Hole W., Amaratunga T. (1985). Geographical and vertical distribution of short-finned squid (Illex illecebrosus) larvae in the Northwest Atlantic. NAFO Sci. Council Stud. 9, 93–99. Available at: https://archive.nafo.int/open/studies/s9/hatanak2.pdf
Hendrickson L. C. (2004). Population biology of northern shortfin squid (Illex illecebrosus) in the northwest Atlantic ocean and initial documentation of a spawning area. ICES J. Mar. Sci. 61, 252e266. doi: 10.1016/j.icesjms.2003.10.010
Hilborn R., Walters C. J. (1992). Quantitative fisheries stock assessment: choice, dynamics and uncertainty (New York: Chapman and Hall).
Jackson G., O'Dor R. (2001). Time, space and the ecophysiology of squid growth, life in the fast lane. Vie Milieu, 205–215. Available at: https://hal.sorbonne-universite.fr/hal-03192511/document.
Johnson T. R. (2011). Fishermen, scientists, and boundary spanners: cooperative research in the US Illex squid fishery. Soc. Nat. Resour. 24 (3), 242–255. doi: 10.1080/08941920802545800
Jones A. W., Burchard K. A., Mercer A. J. M., Hoey J. J., Morin M. D., Gianesin G. L., et al. (2022). Learning from the study fleet: maintenance of a Large-scale reference fleet for northeast US fisheries. Front. Mar. Sci. 9. doi: 10.3389/fmars.2022.869560
Karp M. A., Brodie S., Smith J. A., Richerson K., Selden R. L., Liu O. R., et al. (2022). Projecting species distributions using fishery-dependent data. Fish Fisheries 00, 1–22. doi: 10.1111/faf.12711
Lowman B. A., Jones A. W., Pessutti J. P., Mercer A. M., Manderson J. P., Galuardi B.. (2021). Northern shortfin squid (Illex illecebrosus) fishery footprint on the Northeast US continental shelf. Front .Mar. Sci. 8, 631657. doi: 10.3389/fmars.2021.631657
Mackinson S. (2022). The fall and rise of industry participation in fisheries science - a European story. ICES J. Mar. Sci. 79 (4), 1034–1033. doi: 10.1093/icesjms/fsac041
Mamouridis V., Klein N., Kneib T., Suarez C. C., Maynou F. (2017). Structured additive distributional regression for analysing landings per unit effort in fisheries research. Math. Biosci. 283, 145–154. doi: 10.1016/j.mbs.2016.11.016
Manderson J. P. (2020) Summary report: northern shortfin squid (Illex illecebrosus) population ecology & fishery summit. Available at: https://www.openoceanresearch.com/projects.
Mangi S. C., Kupschus S., Mackinson S., Rodmell D., Lee A., Bourke E., et al. (2018). Progress designing and delivering effective fishing industry-science data collection in the UK. Fish Fisheries 19 (4), 622–642. doi: 10.1111/faf.12279
Maunder M. N., Punt A. E. (2004). Standardizing catch and effort data: a review of recent approaches. Fish. Res. 70, 141–159. doi: 10.1016/j.fishres.2004.08.002
Maunder M. N., Sibert J. R., Fonteneau A., Hampton J., Kleiber P., Harley S. J. (2006). Interpreting catch per unit effort data to assess the status of individual stocks and communities. ICES J. Mar. Sci. 63 (8), 1373–1385. doi: 10.1016/j.icesjms.2006.05.008
McAllister M. K., Hill S. L., Agnew D. J., Kirkwood G. P., Beddington J. R. (2004). A Bayesian hierarchical formulation of the de lury stock assessment model for abundance estimation of Falkland islands' squid (Loligo gahi). Can. J. Fisheries Aquat. Sci. 61 (6), 1048–1059. doi: 10.1139/f04-084
Moustahfid H., Hendrickson L. C., Arkhipkin A., Pierce G. J., Gangopadhyay A., Kidokoro H., et al. (2021). Ecological-fishery forecasting of squid stock dynamics under climate variability and change: review, challenges, and recommendations. Rev. Fish. Sci. Aquac. 29 (4), 682–705. doi: 10.1080/23308249.2020.1864720
Northeast Fisheries Science Center (NEFSC). (2006). in 42nd Northeast Regional Stock Assessment Workshop (42nd SAW) stock assessment report. U.S. Department of Commerce. Northeast Fisheries Science Center Reference Document. 06–09a; 284. https://repository.library.noaa.gov/view/noaa/5271.
Northeast Fisheries Science Center (NEFSC). (2021). Report of the illex 2021 research track assessment working group. 149. Available at: https://apps-nefsc.fisheries.noaa.gov/saw/sasi.php.
Perez J. A. A., O’Dor R. K. (1998). The impact of environmental gradients on the early life inshore migration of the short-finned squid illex illecebrosus. South Afr. J. Mar. Sci. 20, 293–303. doi: 10.2989/025776198784126359
Pierce G. J., Guerra A. (1994). Stock assessment methods used for cephalopod fisheries. Fish. Res. 21, 255–285. doi: 10.1016/0165-7836(94)90108-2
Quirijns F. J., Poos J. J., Rijnsdorp A. D. (2008). Standardizing commercial CPUE data in monitoring stock dynamics: accounting for targeting behaviour in mixed fisheries. Fish. Res. 89 (1), 1–8. doi: 10.1016/j.fishres.2007.08.016
Rago P. (2020). Identification of indicators of fishery condition and relative abundance for illex (Working Paper for Mid-Atlantic Fisheries Management Council Illex Squid Working Group). Available at: https://www.mafmc.org/ssc-meetings/2020/may-12-13.
R Core Team. (2019). R: a language and environment for statistical computing (Vienna, Austria: R Foundation for Statistical Computing). Available at: https://www.R-project.org/.
Roa-Ureta R. H. (2012). Modelling in-season pulses of recruitment and hyperstability-hyperdepletion in the Loligo gahi fishery around the Falkland islands with generalized depletion models. ICES J. Mar. Sci. 69 (8), 1403–1415. doi: 10.1093/icesjms/fss110
Roa-Ureta R. H., Molinet C., Baraho N., Arayaca P. (2015). Hierarchical statistical framework to combine generalized depletion models and biomass dynamic models in the stock assessment of the Chilean sea urchin (Loxechinus albus) fishery. Fish. Res. 171, 59–67. doi: 10.1016/j.fishres.2014.12.006
Rodhouse P. G., Pierce G. J., Nichols O. C., Sauer W. H., Arkhipkin A. I., Laptikhovsky V. V., et al. (2014). Environmental effects on cephalopod population dynamics: implications for management of fisheries. Adv. Mar. Biol. 67, 99–233. doi: 10.1016/B978-0-12-800287-2.00002-0
Salois S. L., Hyde K. J., Silver A., Lowman B. A., Gangopadhyay A., Gawarkiewicz G., et al. (2023). Shelf break exchange processes influence the availability of the northern shortfin squid, Illex illecebrosus, in the Northwest Atlantic. Fish. Oceanogr. doi: 10.1111/fog.12640
Steins N. A., Kraan M. L., van der Reijden K. J., Quirijns F. J., van Broekhoven W., Poos J. J. (2020). Integrating collaborative research in marine science: recommendations from an evaluation of evolving science-industry partnerships in Dutch demersal fisheries. Fish Fisheries 21 (1), 146–161. doi: 10.1111/faf.12423
Steins N. A., Mackinson S., Mangi S. C., Pastoors M. A., Stephenson R. L., Ballesteros M., et al. (2022). A will-o’-the wisp? on the utility of voluntary contributions of data and knowledge from the fishing industry to marine science. Front. Mar. Sci. 9. doi: 10.3389/fmars.2022.954959
U.S. Bureau of Economic Analysis, Gross Domestic Product. (2021). Implicit price deflator [GDPDEF], retrieved from FRED, federal reserve bank of st. Louis. Available at: https://fred.stlouisfed.org/series/GDPDEF.
Walters C. J. (2003). Folly and fantasy in the analysis of spatial catch-rate data. Can. J. Fisheries Aquat. Sci. 60, 1433–1436. doi: 10.1139/f03-152
Wigley S., Tholke C. (2020). Discard estimation, precision, and sample size analyses for 14 federally managed species groups in the waters off the northeastern united states (NOAA Technical memorandum). NMFS-NE-261. Available at: https://repository.library.noaa.gov/view/noaa/25521.
Wood S. (2017). Generalized additive models: an introduction with R (2nd ed.). Chapman and Hall/CRC, New York. doi: 10.1201/9781315370279
Keywords: shortfin squid, stock assessment, cooperative research, local ecological knowledge, northeast United States, catch per unit effort, fisheries dynamics
Citation: Mercer AJM, Manderson JP, Lowman BA, Salois SL, Hyde KJW, Pessutti J, Jones AW, Ruhle R, Bright B, Sawyer T, Lapp M, Kaelin J, Almeida K and DiDomenico G (2023) Bringing in the experts: application of industry knowledge to advance catch rate standardization for northern shortfin squid (Illex illecebrosus). Front. Mar. Sci. 10:1144108. doi: 10.3389/fmars.2023.1144108
Received: 13 January 2023; Accepted: 10 April 2023;
Published: 01 May 2023.
Edited by:
Matthew R. Baker, North Pacific Research Board, United StatesReviewed by:
Taner Yildiz, Istanbul University, TürkiyeValeria Mamouridis, Independent researcher, Rome, Italy
Kotaro Ono, Norwegian Institute of Marine Research (IMR), Norway
Copyright © 2023 Mercer, Manderson, Lowman, Salois, Hyde, Pessutti, Jones, Ruhle, Bright, Sawyer, Lapp, Kaelin, Almeida and DiDomenico. This is an open-access article distributed under the terms of the Creative Commons Attribution License (CC BY). The use, distribution or reproduction in other forums is permitted, provided the original author(s) and the copyright owner(s) are credited and that the original publication in this journal is cited, in accordance with accepted academic practice. No use, distribution or reproduction is permitted which does not comply with these terms.
*Correspondence: Anna J. M. Mercer, anna.mercer@noaa.gov