ATR-FTIR spectroscopy combined with multivariate analysis as a rapid tool to infer the biochemical composition of Ulva laetevirens (Chlorophyta)
 Goverdina C. H. Derksen1,2*
  Lander Blommaert1
  Leen Bastiaens3 Cem Hasşerbetçi1 Roy Fremouw1
  Jesse van Groenigen1,2
  Robert H. Twijnstra1
  Klaas R. Timmermans1
- 1Department of Estuarine and Delta Systems, NIOZ Royal Netherlands Institute for Sea Research, Yerseke, Netherlands
- 2Centre of Applied Research Biobased Economy, Hanze University of Applied Sciences, Groningen, Netherlands
- 3Flemish Institute for Technological Research, VITO NV, Mol, Belgium
Introduction: Attenuated total reflection (ATR)–Fourier transform infrared (FTIR) analysis is a rapid tool and represents a snapshot of all molecules present in a (plant) sample. Most alternative techniques for biochemical analyses of plant biomass require destructive sampling, complex and laborious sample pre-treatment, and precise and costly analysis. These analyses are often limited to soluble compounds instead of all compounds present. Such complicated procedures are not efficient for manipulative studies that involve repeated sampling and rapid nutrient changes over time, such as in agro-industrial cultivation studies.
Methods: In our study, the green seaweed species Ulva laetevirens (Chlorophyta) was cultivated under different nutritional regimes in onshore cultivation tanks. The regimes were nitrogen and phosphorus repletion, nitrogen depletion, phosphorus depletion, and light limitation. Samples were taken and tested according to common laborious analysis methods to determine the biochemical composition of polysaccharides, proteins, carbon, and nitrogen. These results were compared with the potential of ATR-FTIR spectroscopy combined with multivariate analysis to allow for prediction of biomass composition.
Results: Statistical analysis of the spectra showed that the samples were clustered according to the nutritional regime during the incubation of U. laetevirens. This made it possible to deduce which abiotic factors were replete or deplete during cultivation. Furthermore, partial least square regression analysis proved the most suitable method to predict carbohydrate concentration and nitrogen content present in the biomass.
Discussion/conclusion: On the basis of these findings, it is concluded that ATR-FTIR spectroscopy is an efficient and rapid alternative tool for qualitative and quantitative determination of the biochemical composition of U. laetevirens that can be used in industrial cultivation setups.
1 Introduction
Species of the green seaweed genus Ulva have high growth and productivity rates across diverse geo-climatic conditions, including North-West Europe. Ulva sp. usage is increasing worldwide due to its potential as food, feed, and fertilizer (Holdt and Kraan, 2011; Figueira et al., 2020). Cultivation under controlled and sustainable cultivation systems, as opposed to natural harvesting, can produce a high-quality monoculture of Ulva biomass, which can then generate bioproducts of consistent composition, with highly exploitable biochemical profiles (Kidgell et al., 2019; Lim et al., 2021). These controlled onshore cultivations of Ulva sp. are deemed to be the future method for supplying biomass to meet market development needs (Dominguez and Loret, 2019). Ulva biomass production and biochemical variation are influenced by ecophysiological factors (Figueira et al., 2020). On-shore, the variation of the biochemical composition can be actively influenced, for example, by the ratio and amount of different nutrients, light quality, light quantity, and turbulence. In an experimental cultivation study on P and N uptake kinetics, quantitative insight into the nutrient uptake by Ulva lactuca and its corresponding biomass production were provided (Lubsch and Timmermans, 2018). As a result, large variations in biochemical composition for Ulva species are found in the literature (Yaich et al., 2011; Rohani-Ghadikolaei et al., 2012; Yu-Qing et al., 2016; Dominguez and Loret, 2019; Hentati et al., 2020). The concentration ranges found for the main biopolymers, i.e., polysaccharides and proteins, are given in Supplementary Table S1.
Conventional techniques that are used for analysis of biochemical compounds are gas chromatography and high-pressure liquid chromatography (HPLC) for separation coupled with nuclear magnetic resonance (NMR), mass spectrometry (MS), refractive index, or ultraviolet (UV)/visible light spectroscopy for identification and quantification of the separate compounds. These methods are not only very precise but also time-consuming, especially when multiple different types of compounds have to be analyzed. Moreover, destructive and complex sample pre-treatment techniques are needed. For seaweed, there is a need for a rapid and reliable monitoring of biochemical compound adaptations. In the latest decade, Fourier transform infrared (FTIR) spectroscopy in combination with multivariate analysis has been successfully used for characterization and clustering of plant samples. Cluster gives, for example, insight into the correlation of the biomass with abiotic cultivation factors used or other aspects such as the origin of the plant material. FTIR is a non-destructive and non-labor-intensive technique, making it suitable as a rapid tool. In the literature, analysis was performed successfully on biomass extracts and fractions dried on a surface or blended with KBr in tablet form. Spectral recordings can even be done on plant material that is solely dried and powdered, using attenuated total reflection (ATR). In that case ATR-FTIR is used to evaluate the chemical profile of the solid-state biochemical compounds. Commonly, the spectral range of the middle infrared region (MIR) between 4000 and 650 cm−1 is recorded and used for interpretation, which corresponds to characteristic vibrations of molecular bonds present in organic molecules (Socaciu et al., 2020). Because of the complexity of plant biomass and differences in compound concentrations, it is not possible to assign exactly each ATR-FTIR band to its respective functional chemical group or compound (Türker-Kaya and Huck, 2017; Canteri et al., 2019). However, it is known from the literature that it is possible to distinguish areas where specific wave numbers correspond to vibrations of functional groups that are directly correlated to molecular identification (Ceylan and Goldfarb, 2015; Christou et al., 2018). The successful interpretation of dried and ground seaweed ATR-FTIR-MIR spectra needs the combination with multivariate data analysis (Socaciu et al., 2020). In combination with multivariate data analysis, FTIR is successfully used for qualitative and quantitative analysis of complex biological matrices (Baker et al., 2014). Qualitative assessment of the spectra can be accomplished by principal component analysis (PCA). Quantitative analysis is done with partial least squares regression (PLSR) that permits calibration models between spectral and analytical data (Canteri et al., 2019; Santos et al., 2019).
For seaweeds, some studies are found in which whole samples or isolates are analyzed with FTIR and interpreted with PCA and, in most cases, also with the addition of hierarchical cluster analysis (HCA) and PLSR. For example, differences were found in the composition of five brown seaweed extracts used as bio-stimulant formulation (Shekhar et al., 2012). Compositional variation in biochemical composition between the three taxonomical seaweed species could be evaluated with NMR and FTIR spectroscopy combined with PCA and HCA (Date et al., 2012). Differences were shown between carbohydrate, protein, and phenolics due to salinity and UV-radiation treatments of the brown seaweed Sargassum cymosum by classifying FTIR spectra with PCA (Polo et al., 2015). Results obtained from both FTIR and Raman spectroscopy were used to develop PLSR models for the quantitative determination of mannuronic and guluronic acid (M/G ratio) in commercial alginate products, i.e., from two other brown seaweeds: Fucus vesiculosus and Undaria pinnatifida (Salomonsen et al., 2008; Gómez-Ordóñez and Rupérez, 2011; Gómez-Ordóñez et al., 2014; Zhao et al., 2021). Protein quantification in North Atlantic brown and red seaweeds was successfully done with diffuse reflectance infrared Fourier transform spectroscopy (DRIFTS) analysis and PLSR (Niemi et al., 2023).
For the green seaweed, specifically Ulva, a few studies are found where FTIR is combined with multivariate analysis for spectral data interpretation. It was successfully used for the determination and quantification of ulvan extracts, a sulfated cell wall heteropolysaccharide (Robic et al., 2009; Figueira et al., 2020). For this, the spectral features of uronic acid carboxylic groups; sulfate ester groups; and the glycosidic linkage between the major sugars, rhamnose, and glucuronic acid were used (Kidgell et al., 2019). In a study, FTIR and multivariate analysis were used to discriminate metabolic profiles of Ulva lactuca after in vitro exposure to diesel oil and gasoline (Pilatti et al., 2017). All examples given above indicate that the combination of FTIR with multivariate analysis can be a possible rapid and efficient methodology for biochemical profiling and even biochemical quantification in brown, red, and green seaweed biomass.
In our current study, Ulva laetevirens biomass was produced in onshore cultivation tanks and sampled under nitrogen- and phosphorus-replete (RE), nitrogen-depleted (ND), phosphorus-depleted (PD), and light-limited (LL) conditions. Analyses of the biochemical composition of the biomass were done with ATR-FTIR and traditional analyses of carbohydrates, proteins and amino acids. We specifically examined the application of ATR-FTIR combined with multivariate analysis as a rapid method to evaluate the biochemical profiling within one green seaweed species during onshore cultivation in this case U. laetevirens biomass. To our knowledge, this is the first time that this has been done within one green seaweed species under imposed conditions. Our method enabled samples to be examined directly in the (freeze-)dried solid state without the need for further sample preparations.
2 Material and methods
2.1 Ulva laetevirens biomass
2.1.1 Cultivation
Clean and healthy Ulva laetevirens samples were originally collected from the Marsdiep (Texel, The Netherlands) in the summer of 2018 and were cultivated in concrete cultivation tanks (28 m3) at the NIOZ Seaweed Centre on Texel into the summer of 2020 to form the Ulva stock used in this research. Nutrients were added on a weekly basis. Seawater was filtered using a sand filter column (L × W × H, 1 × 1 × 3 m) with a mesh of ±0.50 µm at a refreshment rate of 10% per day. Air was bubbled to the bottom of the tank to keep the seaweed tumbling throughout the water column.
Before the start of each experiment, the Ulva was subjected to a starvation period of 12 days in which no supplements were added. At the start of each experiment, U. laetevirens stock samples were taken out and centrifuged in mesh bags in batches of 2–3 kg in a Thomas Centrifuge 776 (50 s, 2,016 g). The stock batch was divided over cleaned outdoor cultivation tanks of 2000 L (90 × 170 cm), in aliquots of 1,000 g (total fresh weight of 5 kg). Aeration was provided in such a way that individuals tumbled freely inside the cultivation tanks at a pressure of 1.18 bar. Treatments were randomly distributed over tanks at the start of each experiment to exclude tank variation at the research site.
At day 0 (T0), Ulva samples were taken. Every tank had a different treatment: with sufficient nutrients (RE), nitrogen-deplete (ND), phosphorus-depleted (PD), and 60% light-limited (LL) conditions; see Supplementary Figure S1. Light-limited treatment was achieved with placing a custom mesh-screen lid over the tank, the light reduction at water surface level was determined with a LI-1000 datalogger (LI-COR). RE, ND, PD, or LL conditions were randomly distributed along the present cultivation tanks to exclude variation between tanks at the research site, if any. At day 0 (T0), nutrients were added according to the cultivation treatment (potassium nitrate pa, Emsure; mono potassium phosphate, Royal Brinkmans; Easygro Fe-EDDHA6%, Royal Brinkman). Nitrogen concentration in the cultivation medium varied between 529 and 1,544 µM for RE, PD, and LL. For ND, this is 2.0−6.0 µM. Phosphorus concentration in the cultivation medium varied between 16.5 and 30.9 µM for RE, ND, and LL and 0.04−0.47 µM for PD; Table 1. Nutrients (NH4+, NO2−, NO3−, and PO43−) in the cultivation medium were analyzed with a Segmented Flow Analyzer (QuAAtro39 AutoAnalyzer with XY-2 Sampler Autosampler, SEAL Analytical).
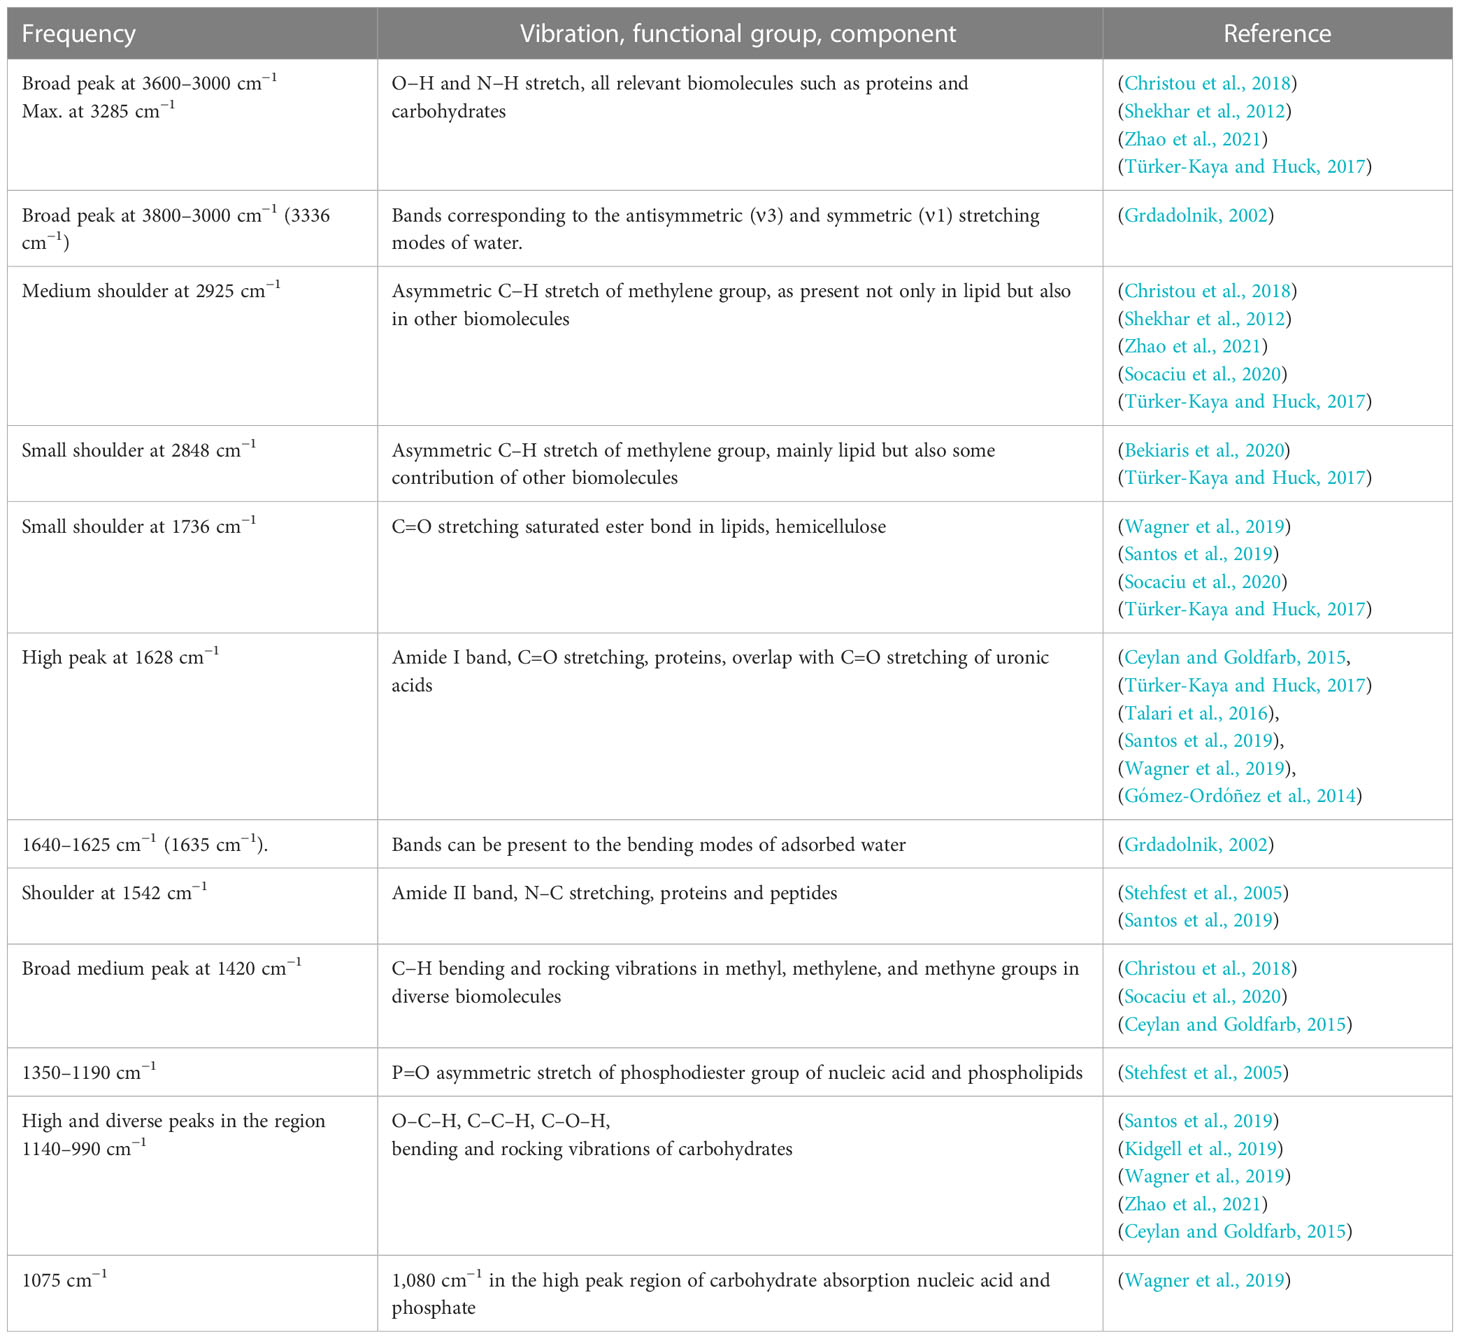
Table 1 General bands of in this study obtained FTIR spectrum of Ulva, assignment based on literature of different plants, macro- and microorganism.
After 7 days (T7) of cultivation, all U. laetevirens biomass was taken out and centrifuged (Thomas Centrifuge 776, 50 s, 2,016 g). Then, 1 kg was put back in the same tank, thus harvesting the excess biomass that was grown that week. According to the cultivation treatment—RE, ND, PD, or LL, nutrients were added. At T7, additional nutrients were added to ensure that the nutrient availability imposed for that specific group was not the limiting factor throughout the entire experiment.
After 14 days (T14), U. laetevirens samples were harvested and centrifuged (Thomas Centrifuge 776, 50 s, 2,016 g). The 14-day cultivation experiments were conducted three times (n = 3) sequentially, starting on 30 June, 17 July, and 18 August, respectively. Through the summer, biomass was collected from one RE, three ND, two PD, and three LL setup, all at T0, T7, and T14 days. This resulted in 21 samples for chemical analysis and not 27 because samples for day 0, T0, represent all tanks within one experiment round.
2.1.2 Biomass pre-treatment
The 21 unique U. laetevirens biomass samples obtained at 0, 7, and 14 days of harvest (T0, T7, and T14) were centrifuged in the Thomas Centrifuge 776 (50 s, 2,016 g). The centrifuged samples were freeze-dried overnight (Beta 1-8 LD plus, Christ). The dried samples were homogenized to a fine powder using vibratory mill (MM301, Retch), operated in three pulses of 30 s at a frequency of 30 s−1. When necessary, samples were subjected to multiple pulses until a fine powder was obtained (Cantero-Tubilla and Walker, 2018). Ground samples that are pending for analysis were stored and sealed in food-grade bags at −20°C. Each unique sample consists of all the individuals that are harvested from one tank and that are then dried, ground, and mixed together to get a homogeneous sample.
2.2 Analysis of biochemical compounds
2.2.1 Carbon and nitrogen
Carbon and nitrogen content, expressed in % dry weight was determined with an elemental analyzer (FLASH 2000 CHNS/O Analyzer) according to a method described in the literature (Nieuwenhuize et al., 1994). Lyophilized and ground samples were combusted at 1,020°C under oxic conditions. The nitrous oxides were reduced to N2 with elementary copper at 650°C, and water was removed by trapping. After separation on a Haysep Q column, CO2 and N2 were detected with a thermal conductivity detector.
2.2.2 Carbohydrates
After acid hydrolyzation, carbohydrates were quantified using high-performance anion-exchange chromatography (HPAEC) with pulsed amperometric detection according to (Gilbert-López et al. (2015); Verspreet et al. (2020)). All samples were hydrolyzed and injected twice. For the calculation of the total sugar content, the sum of the individual dehydrated monosaccharide content was made.
2.2.3 Total amino acids
Dried ground U. laetevirens samples of 50 mg were hydrolyzed in hydrochloric acid (HCl) as described by Gangopadhyay et al. (2022). Dried hydrolyzed samples were resuspended in 0.1 M HCl and filtered using a 0.2-µm polyvinylidene difluoride filter. Samples were derivatized with 45 µl of 3-mercaptopropionic acid solution, 22 µl of the ortho-phtaldialdehyde solution, and 7.5 µl of sample solution in the autosampler prior to injection. Analysis was done using a Shimadzu Nexera X2 HPLC system (Shimadzu Corporation, Kyoto, Japan) with an YMC-Triart C18 (100 × 30 mm, 1.9 µm, 12 nm) column connected to a RF-20A XS Prominence fluorescence detector. Solvents, flow, and program were used as described by Vidyalakshmi et al. (2016). As reference, amino acids were obtained from Sigma-Aldrich (Sigma-Aldrich, AAs-18).
2.2.4 ATR-FTIR spectroscopy
The ATR-FTIR spectra were obtained in random sequence (in terms of sample number and tank origin) on a PerkinElmer Frontier spectrophotometer (Rotterdam, The Netherlands). A ZnSe crystal was used as accessory. PerkinElmer Spectrum IR software version 10.6.1 was used (Waltham, MA, USA). Similar to the work by Gómez-Ordóñez and Rupérez (2011), a small amount of freeze-dried U. laetevirens sample was deposited directly on the diamond ATR crystal, and 125-N force was applied to provide good contact of the sample with the ATR diamond crystal. The spectra were made with a resolution of 4 cm−1 at 32 scans. As background, a sample-free spectrum was collected before each sample was recorded and then subtracted automatically from the sample spectra prior to further analysis. Every sample was recorded in triplicate using three new aliquots of powder, resulting in an average spectra from these triplicates (Oberreuter et al., 2002; Piermaria et al., 2011; Lee et al., 2017; Innes et al., 2019; Liberda et al., 2021). Between every measurement the ATR crystal plate was cleaned with ethanol (96%) and dried to ensure a clean crystal surface (Gómez-Ordóñez and Rupérez, 2011).
2.3 Dataset handling
2.3.1 Pre-processing
FTIR spectra pre-processing is necessary to correct for differences in sample thickness. In this way, band intensities of different samples can be quantitatively compared for multivariate modeling. Baseline correction provided for ATR in the Perkin Elmer Spectrum IR software version 10.6.1 was used. Multiplicative signal correction, present in “pls” 2.8-0 package (Mevik and Wehrens, 2007), is used as normalization method, as is also the method of choice in the literature for ATR-FTIR (Lee et al., 2017; Innes et al., 2019; Liberda et al., 2021). The spectral range of 2750–1800 cm−1 is excluded because of the low signal-to-noise ratio in this spectral region caused by the absorbance of the ATR crystal. For chemometric analysis, no outliers were removed. Prior to PLSR, the log transformation was taken from the concentration data in the total protein and total carbohydrate column of Y to get a more homogenous distribution of the concentration values (Mevik and Wehrens, 2007; Varmuza and Filzmoser, 2016). A PLSR model was made for the original (non–log-transformed) and log-transformed data.
2.3.2 Multivariate data analysis on FTIR spectra
PCA and HCA of the pre-processed FTIR spectra were performed in R-studio 2021.09.2 + 382, with the “ChemoSpecs” 6.1.3 package (Hanson, 2022). PCA robust method median based with no scaling was chosen as most suitable (Hanson, 2022).
Partial least square regression (PLSR) analysis was performed through the use of the “pls” 2.8-0 package (Mevik and Wehrens, 2007). The single-data matrices, X and Y, were defined: X as a dimension of 21 samples by 1,850 wave number intensities and Y as the independently measured concentrations, such as the total sum of amino acids and monosaccharides composition and percentage C and N determined by element analysis. For the fit study, the data was mean-centered, and the number of PLS factors was determined by leave-one-out cross-validation.
3 Results
3.1 Biochemical quantification U. laetevirens samples
Figure 1 shows the biochemical composition in the different U. laetevirens samples. The carbohydrate concentration varied from 240 to 490 mg g−1 dry weight. The highest amount of carbohydrates was found in the samples cultivated under nitrogen depletion (ND). In particular, the monosaccharide glucose was abundantly present (up to 50% of total carbohydrates), which was the highest concentration in the ND samples compared to the other treatments. Compared to the start (T0), the carbohydrate concentration decreased under RE, PD, and LL conditions. The total amino acid concentration was highest in the replete samples (RE), 140 mg g−1. In the ND samples, the total amino acid concentration was lowest. In addition, at the start (T0), the total amino acid concentration is low, comparable with the ND samples. This is due to the fact that all individuals were already starved for 12 days prior the start of the cultivation experiments (Section 2.1.1). For most samples, the most abundant amino acids were aspartic acid (Asp) (Yaich et al., 2011), alanine (Ala), and glutamic acid (Glu). However, for the phosphorus-depleted (PD) samples, arginine (Arg) was proportionally more present. Protein concentrations of the phosphorus (PD) and light limitation (LL) samples were in between the concentrations of the ND and RE samples. In general, all types of amino acids increased when nitrogen was replete—RE, PD, and LL—during cultivation.

Figure 1 Biochemical composition of the U. laetevirens samples after on-shore cultivation under different abiotic stress factors. (A) Total amino acid and (B) total carbohydrate concentration; (C) nitrogen and (D) carbon percentage determined with element analysis. T0 and T14 sampling after 0 and 14 days; no separate abiotic treatment, (RE), “repletion”; (ND), nitrogen depletion; (PD), phosphorus depletion; and (LL), light limitation.
3.2 ATR-FTIR analyses
All FTIR spectra are depicted in Supplementary Figure S2. Visually, we compared the spectra with each other. Figure 2 is a selection of FTIR spectra based on samples where there was mutual difference in abiotic stress factors. From bottom to top, representative sample spectra are selected for the T0, RE, ND, PD, and LL treatments. It is noticeable that the spectra in Figure 2 differ from each other. In the region between 1800 and 800 cm−1 the differences are most pronounced, but differences can also be observed in the region between 3500 and 2800 cm−1. Visually, there were no noticeable differences in the spectra between cultivations performed in different weeks; see Supplementary Figure S3.
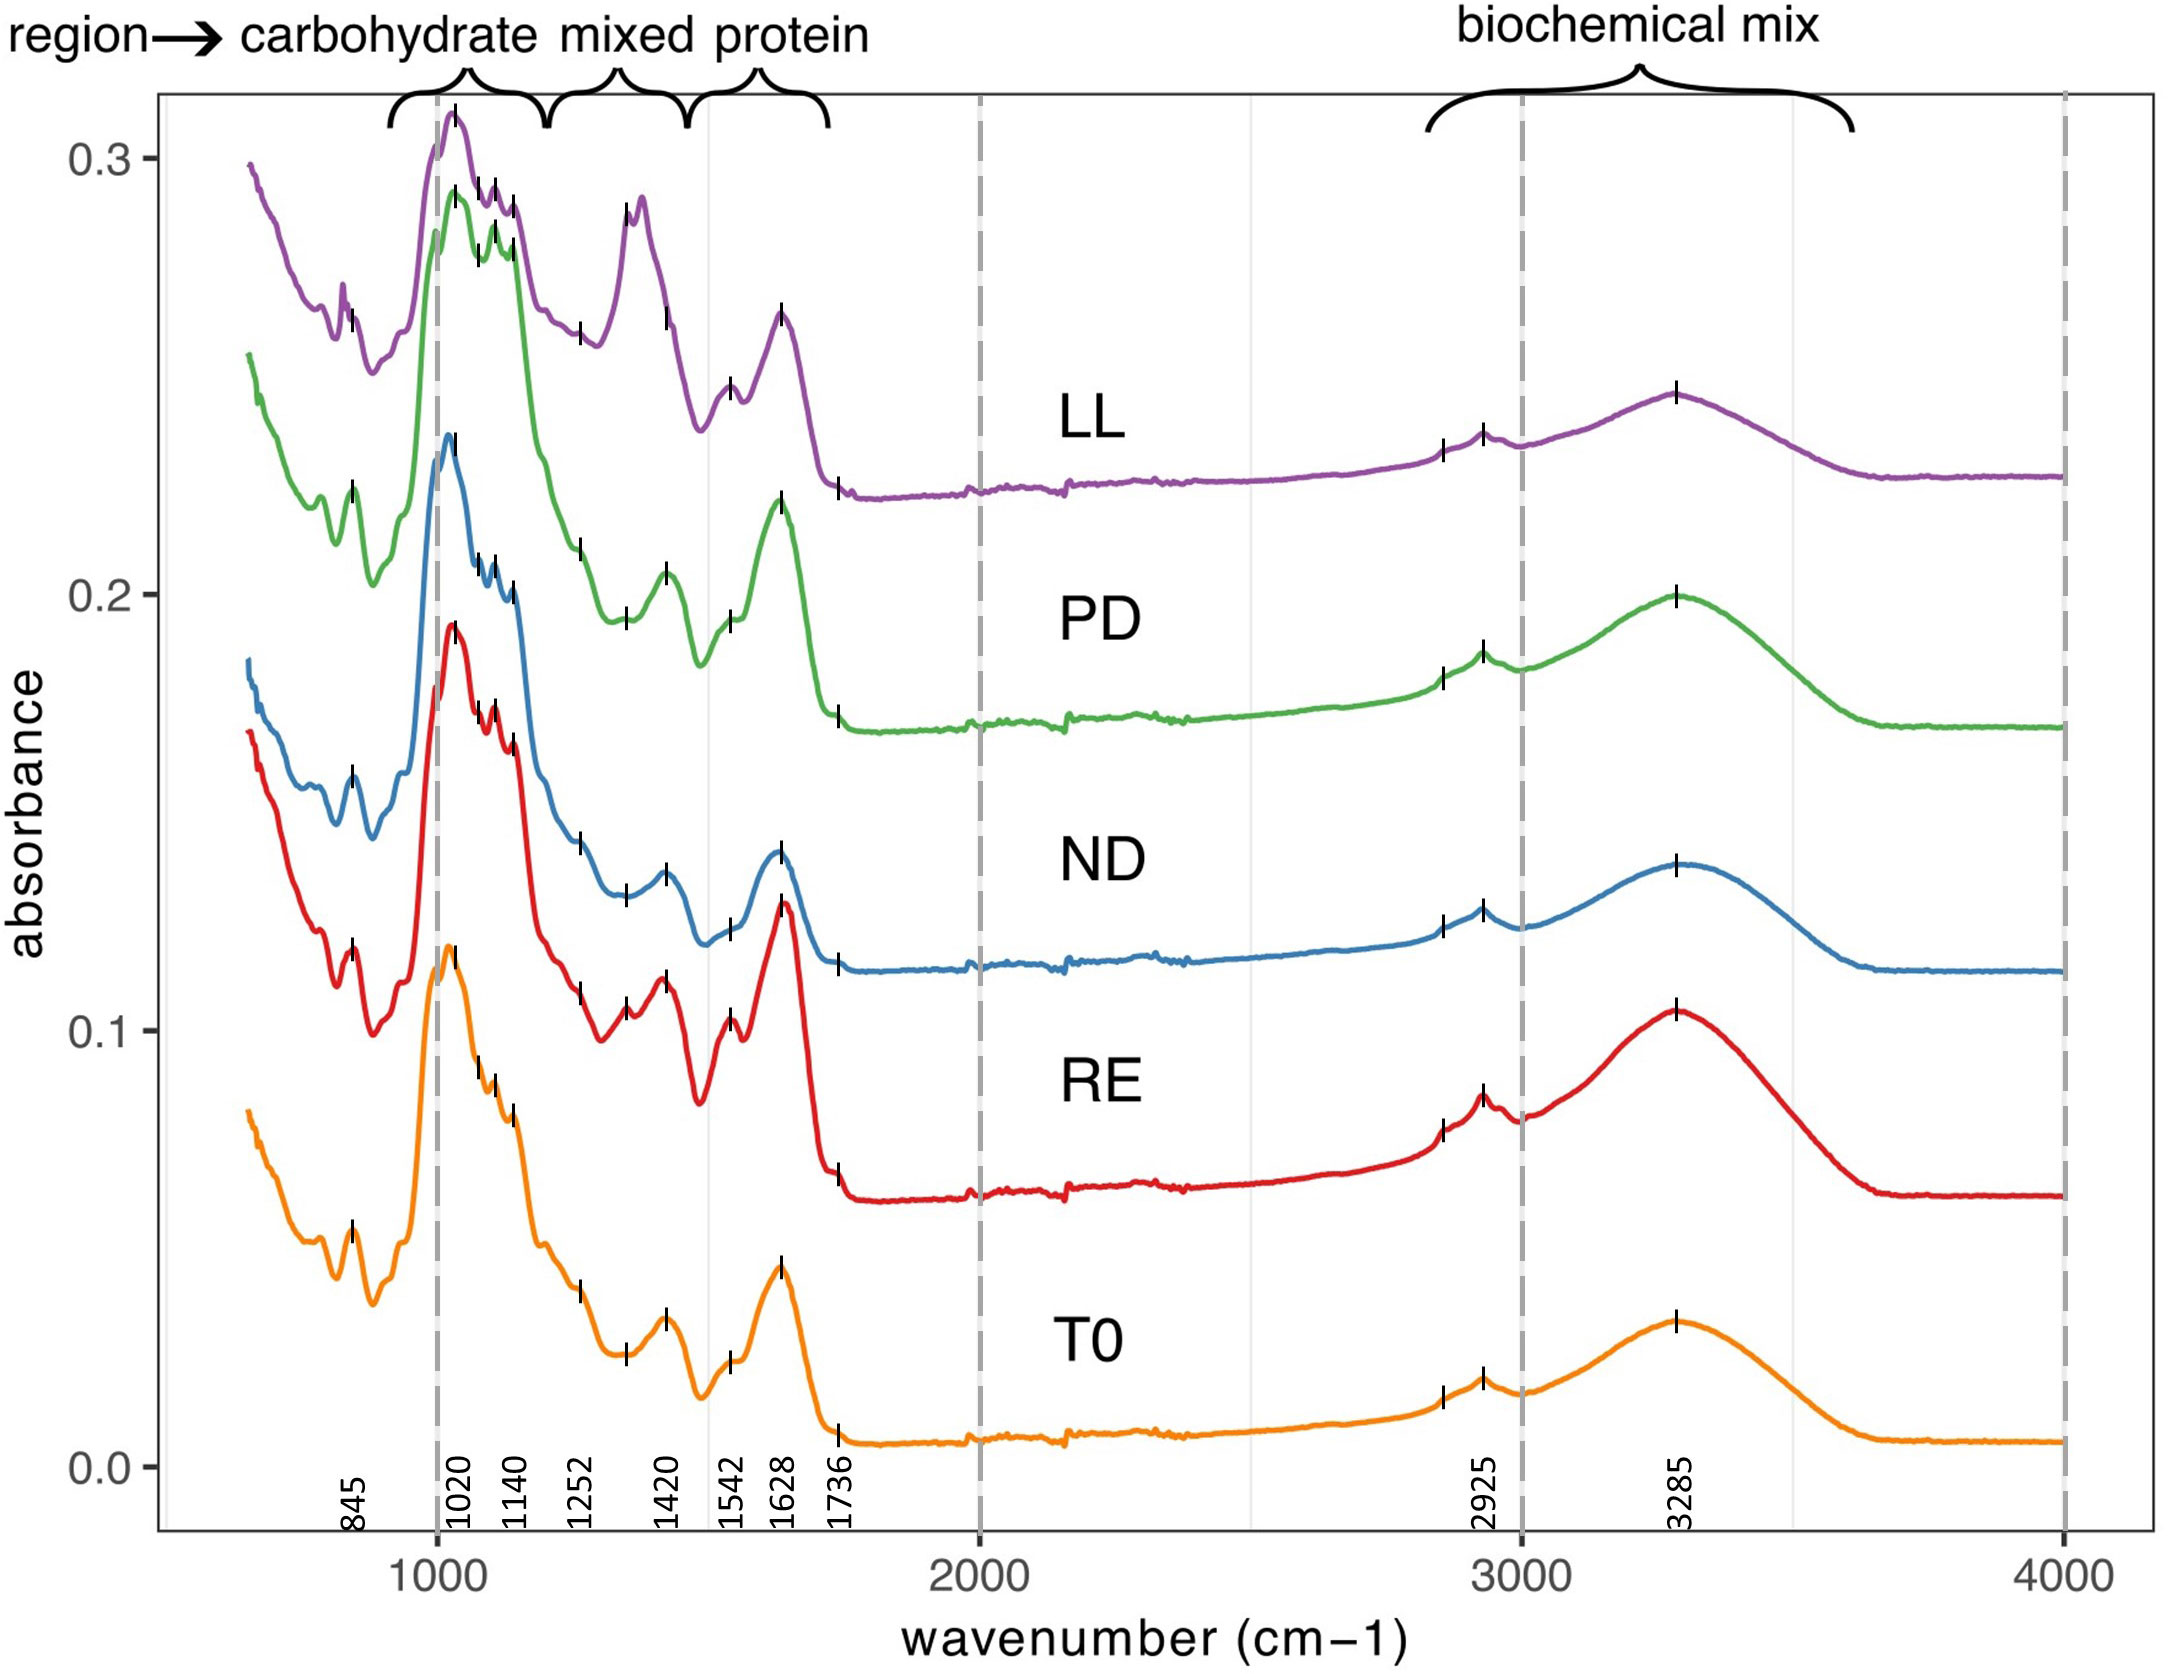
Figure 2 Shifted overlay of five FTIR spectra from U. laetevirens samples. Samples differ in type of abiotic stress applied (RE),“repletion”; (ND), nitrogen depletion; (PD), phosphorus depletion; and (LL), light limitation. All the spectra are from samples obtained at T14 with exception of the lowest that is starting material from day 0 (T0).
The following main regions can be distinguished in ATR-FTIR spectra of dry plant biomass and are also distinguished in the FTIR spectra of the U. laetevirens samples made in this study: proteins (1800–1500 cm−1), diversity of functional groups, the mixed region (1500–1200 cm−1), carbohydrates (1200–900 cm−1), and a biochemical mix mainly caused by proteins and carbohydrates (3600–2800 cm−1) (Baker et al., 2014; Corte et al., 2015; Dias et al., 2016). After assigning regions, one should always be aware that dried samples are complex with a wide variety of compounds (Table 1). In the assigned regions, in addition to the assigned biochemical composition, there are always other components whose functional groups interfere with the characteristic bands of the group. An example is water, with possible bending bands of adsorbed water between 1640 and 1625 cm−1 and stretching bands of water between 3000 and 3800 cm−1.
For identification of molecular bands present in our samples, in Supplementary Figure S4, the spectrum of a T0 sample was labeled with all recognizable wave numbers. With the information in Table 1, obtained from the literature, the corresponding molecular vibrations were, if possible, identified. The prominent, intense peak at 1628 cm−1 that recurs in every spectrum corresponds to C=O amide stretching from proteins, which is also called the amide I band (Ceylan and Goldfarb, 2015). For later interpretation, one has to be aware that the C=O stretching band of the carbonyl group in uronic acid of ulvan probably overlaps with the amide I band. For that in the amide II band, N–C stretching in proteins and peptides can be distinguished as a shoulder at 1542 cm−1 (Stehfest et al., 2005; Gómez-Ordóñez et al., 2014; Santos et al., 2019). The notable solitary broad band at 1420 cm−1 that changes in the different sample spectra is likely indicative for C–H bending in methyl, methylene, and methyne groups and, as such, not traceable to one particularly biochemical compound, the mixed region (Ceylan and Goldfarb, 2015; Christou et al., 2018; Socaciu et al., 2020). The strong and multi-peak area between 1200 and 800 cm−1 is attributed to the vibration of glycosidic bonds between the in algae commonly present polysaccharide units, such as rhamnose and glucuronic acid (Figueira et al., 2020).
3.3 HCA and PCA of FTIR spectra for qualitative prediction of biochemical constituents in U. laetevirens
The PCA and HCA were successfully applied and showed a clear visualization of the data, whereby samples were clustered on the basis of three applied abiotic stress factors. This is based on the qualitative differences in FTIR spectra.
The PCA score plot of all the FTIR spectra obtained for the freeze-dried U. laetevirens samples is shown in Figure 3. The regions 3700–2750 cm−1 and 1800–900 cm−1 were selected for analysis. The PCA plot showed a good separation (90%) between the different types of cultivation. The samples with different abiotic stress factors, RE, ND, PD, and LL at T7 and T14 and the T0 samples, clustered mainly on the x-axis along the direction of PC1 score, which comprised 81% of the differences. It can be seen that, within a circled cluster, in most cases, the T7 samples lie to the left relative to the T14 samples. From bottom to top, along the PC2 score (9%), the cluster of the phosphorus-depleted samples, PD lies higher than the other clusters. In the PC1 score, the T0 appeared in the same region as the ND cluster (nitrogen-depleted). This was also observed in the HCA (Figure 4), which is in agreement with the results of the univariate biochemical analysis (Figure 1). The start samples, T0, were already starved for 12 h at the beginning of the cultivation experiments (Section 2.1.1). In the PCA, it can be seen that RE samples lie close to LL and PD cluster, which is also reflected in the HCA figure. RE samples lie higher on the PC2 score than most LL samples. There is clear difference between RE T7 and RE T14 as the last one is more biochemical stable due to longer equilibrium time. The different cultivation regimes gave a clear clustering and separation on the PC1 axis, and most samples can also be distinguished if the PC2 axis is taken into account. Further comparison on a PC3 axis (results not shown) did not show better resolution of these clusters and is not necessary because enough separation (90%) is already obtained with PC1 and PC2, which is also confirmed by the scree plot (depicted in Supplementary Figure S5).
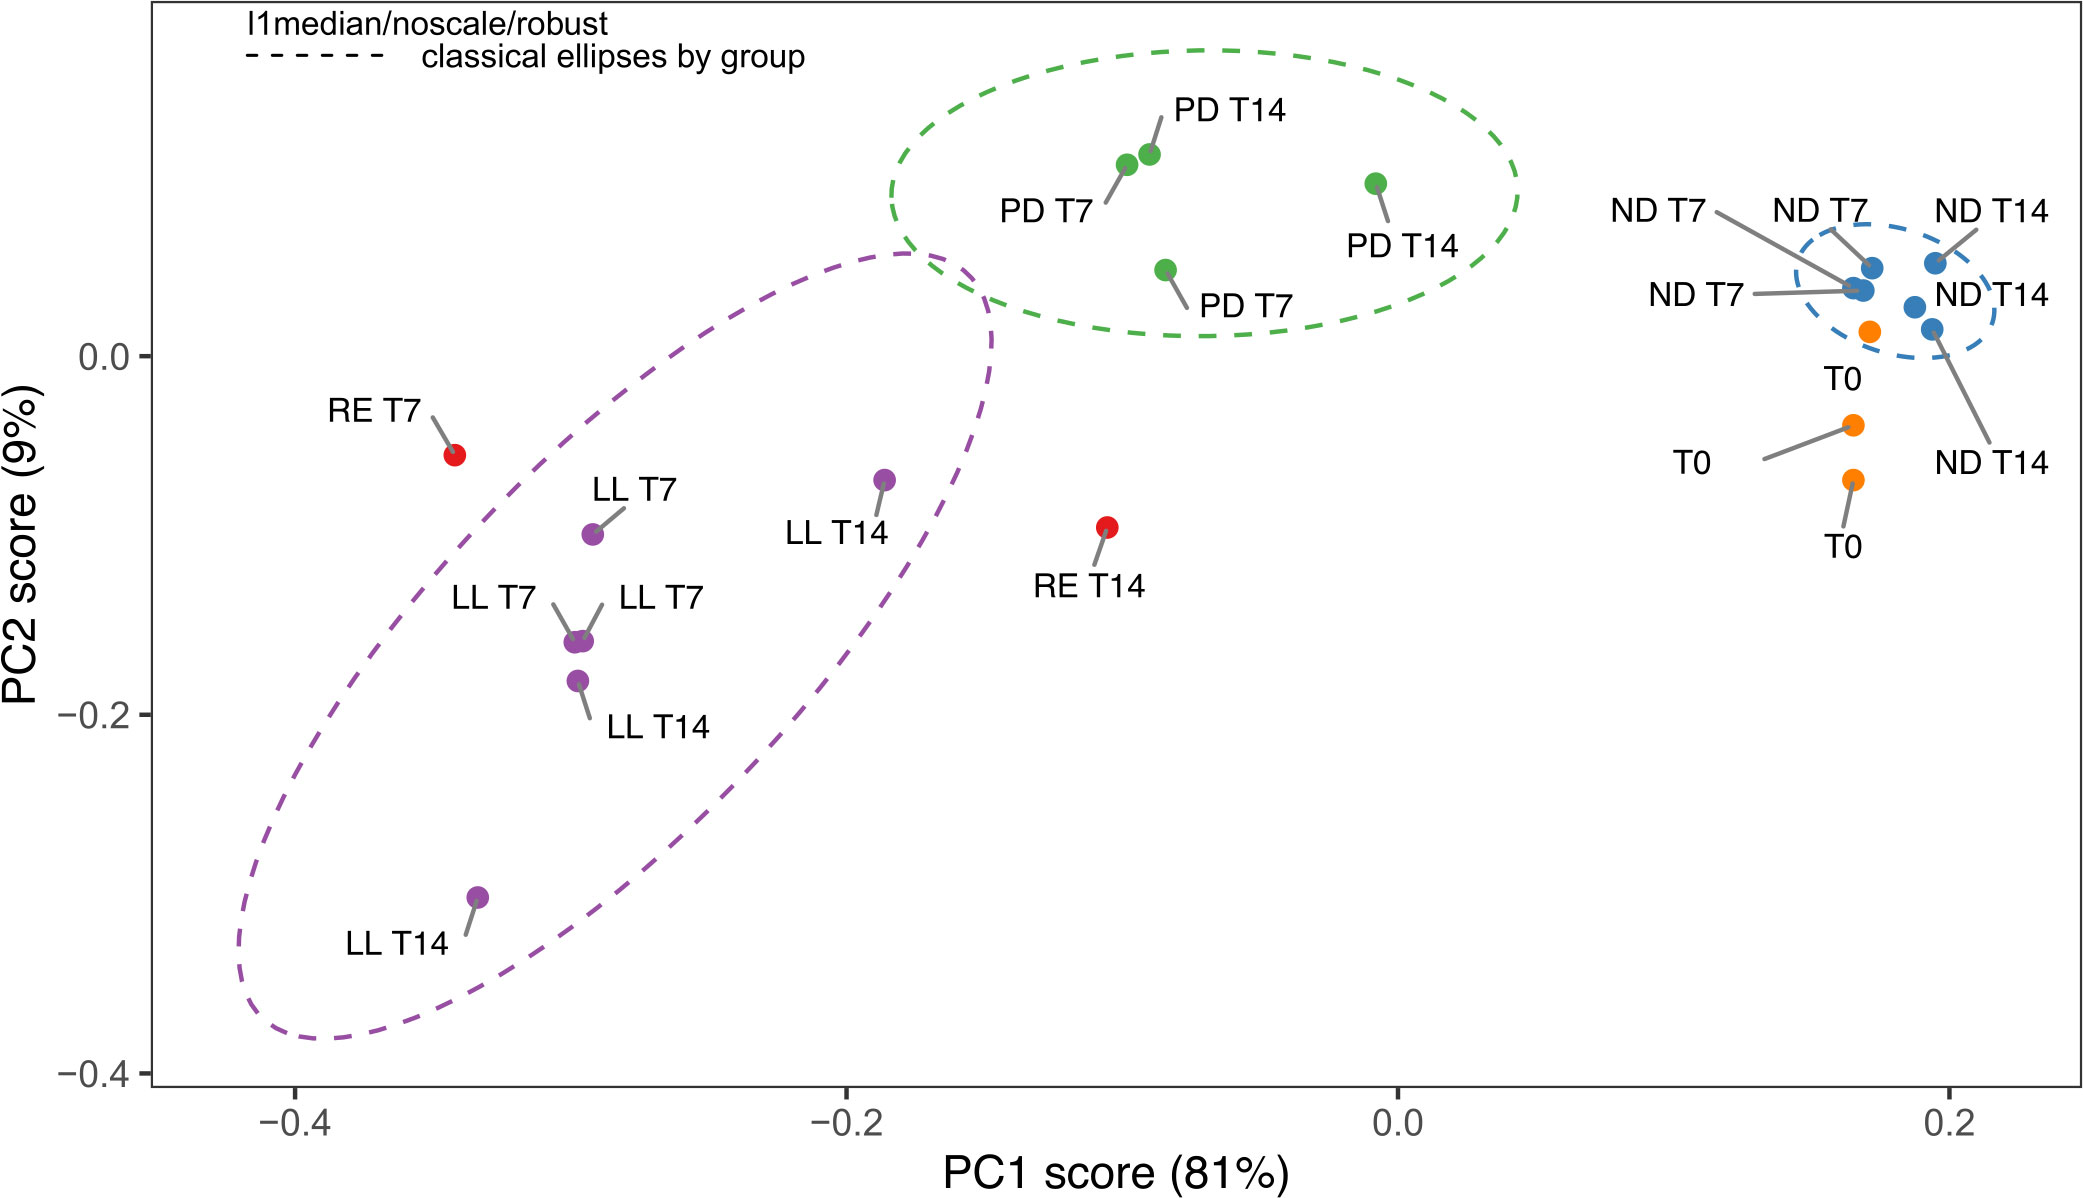
Figure 3 Principal component analysis (PCA) score plot of the FTIR spectra from the U. laetevirens samples. Samples differ in type of abiotic stress applied (RE), “repletion”; (ND), nitrogen depletion; (PD), phosphorus-depletion; and (LL), light limitation. Samples were harvested at days 0 (T0), 7 (T7), and 14 (T14).
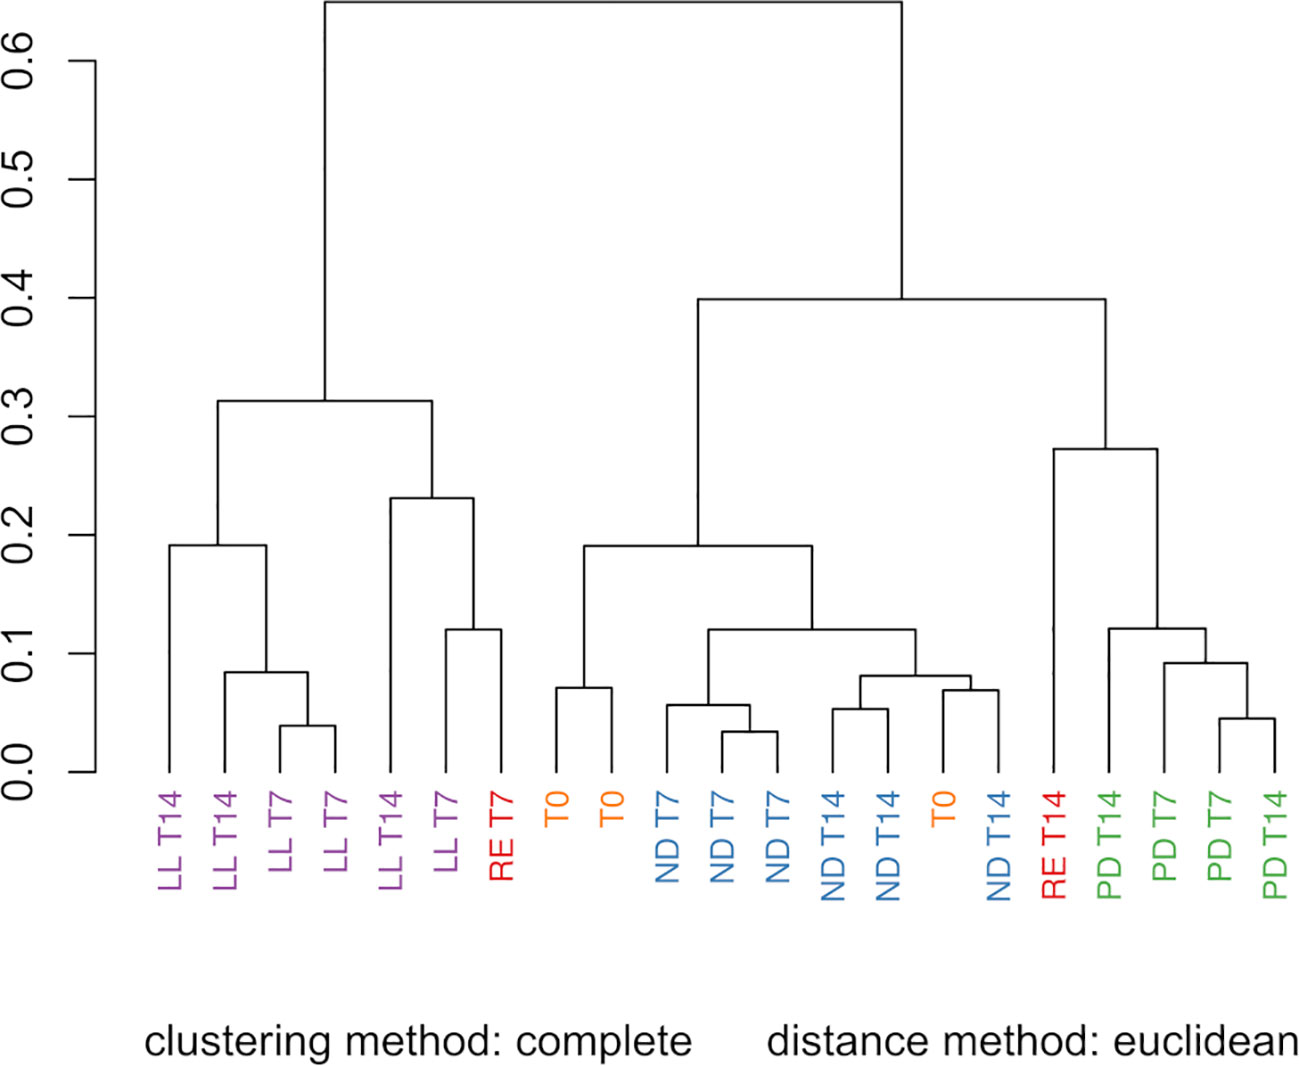
Figure 4 Hierarchical cluster analysis (HCA) of the FTIR spectra from the U. laetevirens samples. Samples differ in type of abiotic stress applied (RE), “repletion”; (ND), nitrogen depletion; (PD), phosphorus-depletion; and (LL), light limitation. Samples were harvested at days 0 (T0), 7 (T7), and 14 (T14).
In Figure 5, the loading weight plots of the first and second principal component (PC1 and PC2) are presented. The loading weight plots indicated that the variation between the spectra was multivariate, with contributions from all biomolecular regions (Sackett et al., 2016). The main weighting in the PC1 plot was for the 1700–1100 cm−1 and 1100–900 cm−1 regions. Both regions work opposite to each other’s weight and results in a PC1 loading that is predominantly a result of the carbohydrate-to-protein ratio. The samples on the left of the PC1 x-axis (negative scores) have a low carbohydrate-to-protein ratio, whereas the samples on the right of the PC1 x-axis (positive scores) have a high carbohydrate-to-protein ratio. This is in accordance with the results of the univariate biochemical, presented in Figure 1. Samples with a low carbohydrate-to-protein ratio, LL, are on the left, and samples with a high carbohydrate-to-protein ratio, ND and T0, are on the right. PD samples are mainly around zero, the middle of the axis. In the case of PC2, which is associated with 4% of the variance, the region between 1100 and 1250 cm−1 (part of the carbohydrate and mixed region) correlated positively and most of the other regions correlated negatively.
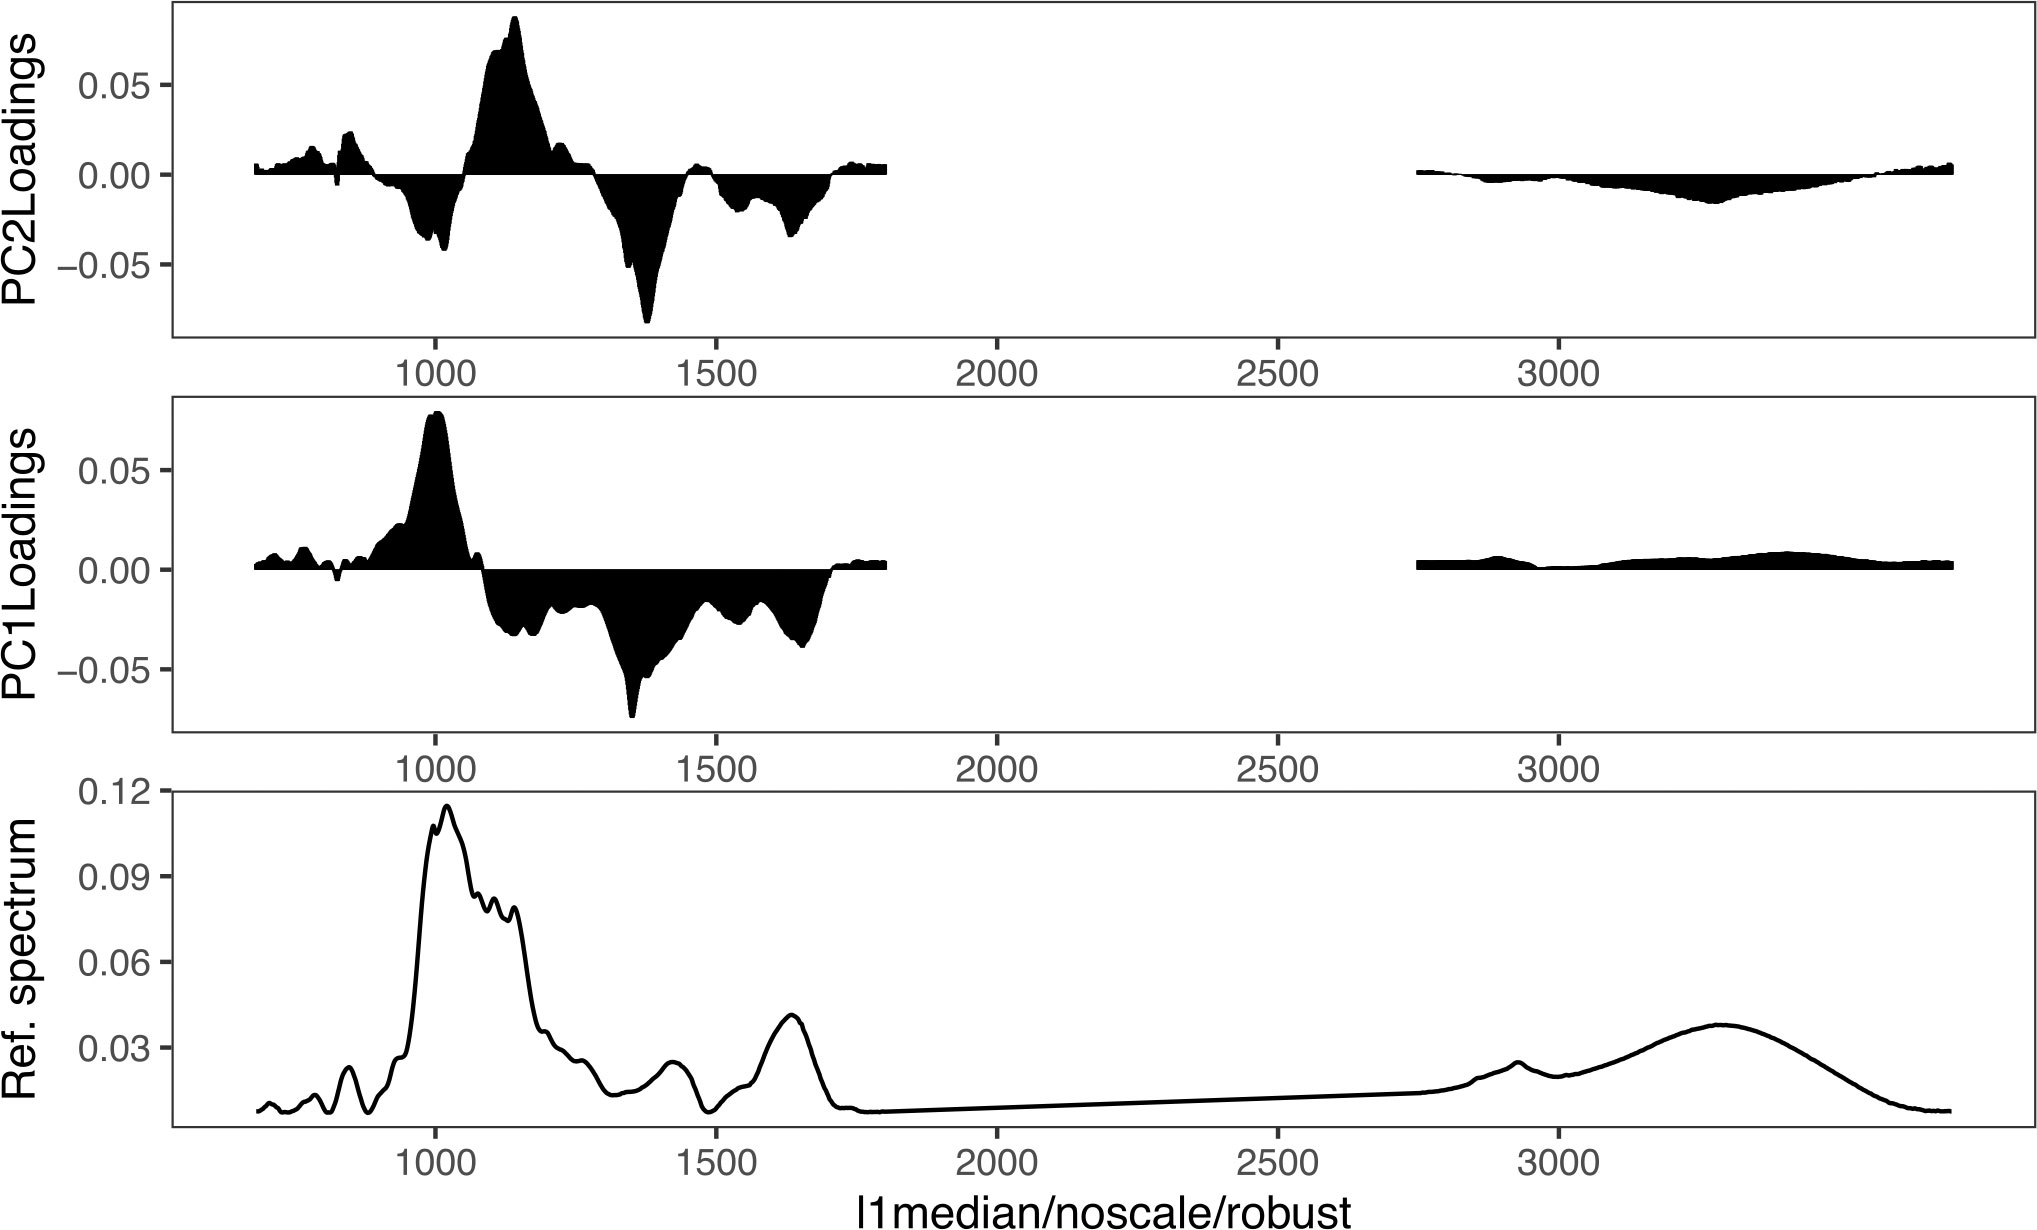
Figure 5 Loading weights associated with the factor PC1 and PC2 scores related to an FTIR reference spectrum of U. laetevirens samples.
Investigation of the sample spectra with PCA or HCA on another aspect than the abiotic stress factor, such as sample day or starting day, did not result in clear separation profiles. This was also not the case if, in addition to PC1 and PC2, higher PCs were included in the comparison.
3.4 PLSR analysis of FTIR spectra for quantitative prediction of biochemical constituents in U. laetevirens
PLSR was conducted to determine if, in addition to clustering, it is also possible to get an estimation of the quantitative biochemical composition of random U. laetevirens samples by using FTIR. The PLSR models were obtained from the regression of the FTIR spectral data on the parameters from the classical chemical analyses, specifically total amino acid concentration, total carbohydrate concentration, nitrogen content and carbon content. The obtained prediction plots are given in Figure 6 and the coefficients of determination in Table 2.
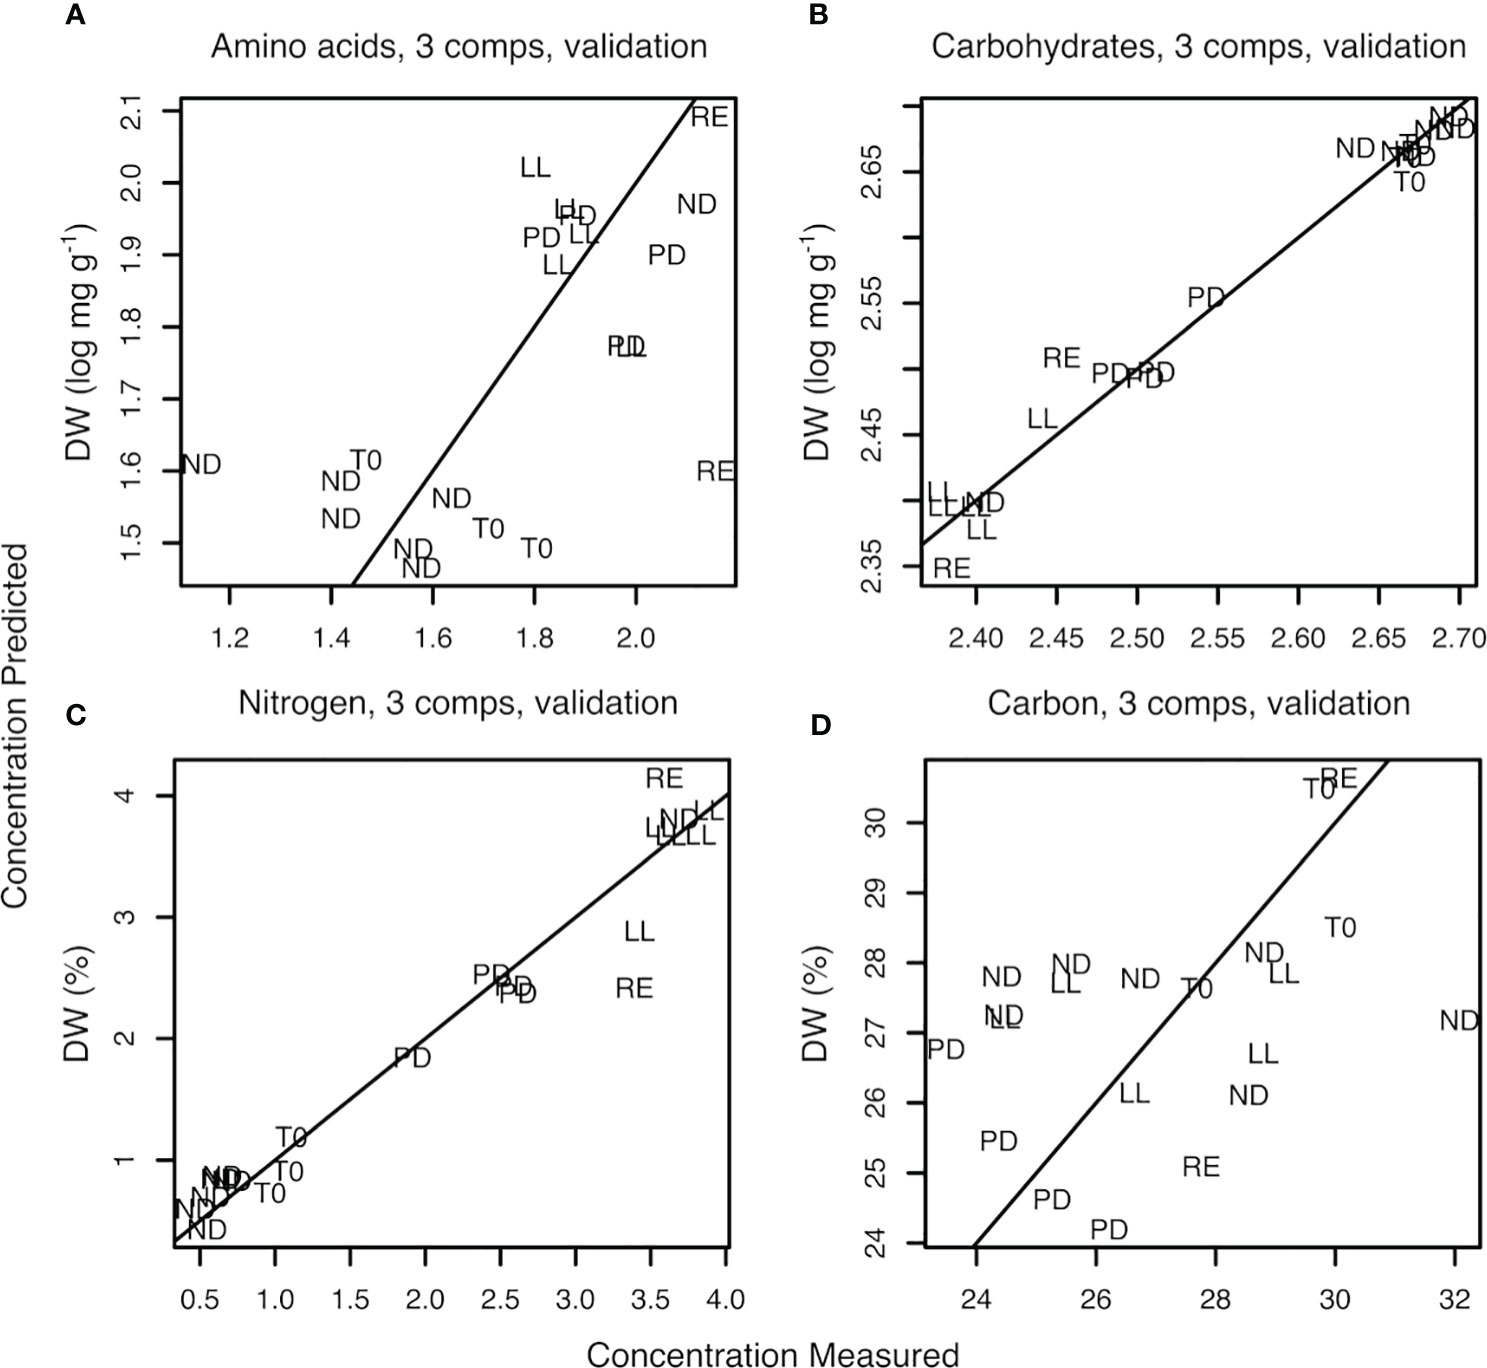
Figure 6 Plot of measured versus predicted values obtained with PLSR for total amino acid concentration (amino acids) (A), total monosaccharide concentration (carbohydrates) (B), %N of dry weight (nitrogen) (C), and %C of dry weight (carbon) (D). The number of PLSR-PCs used was 3.
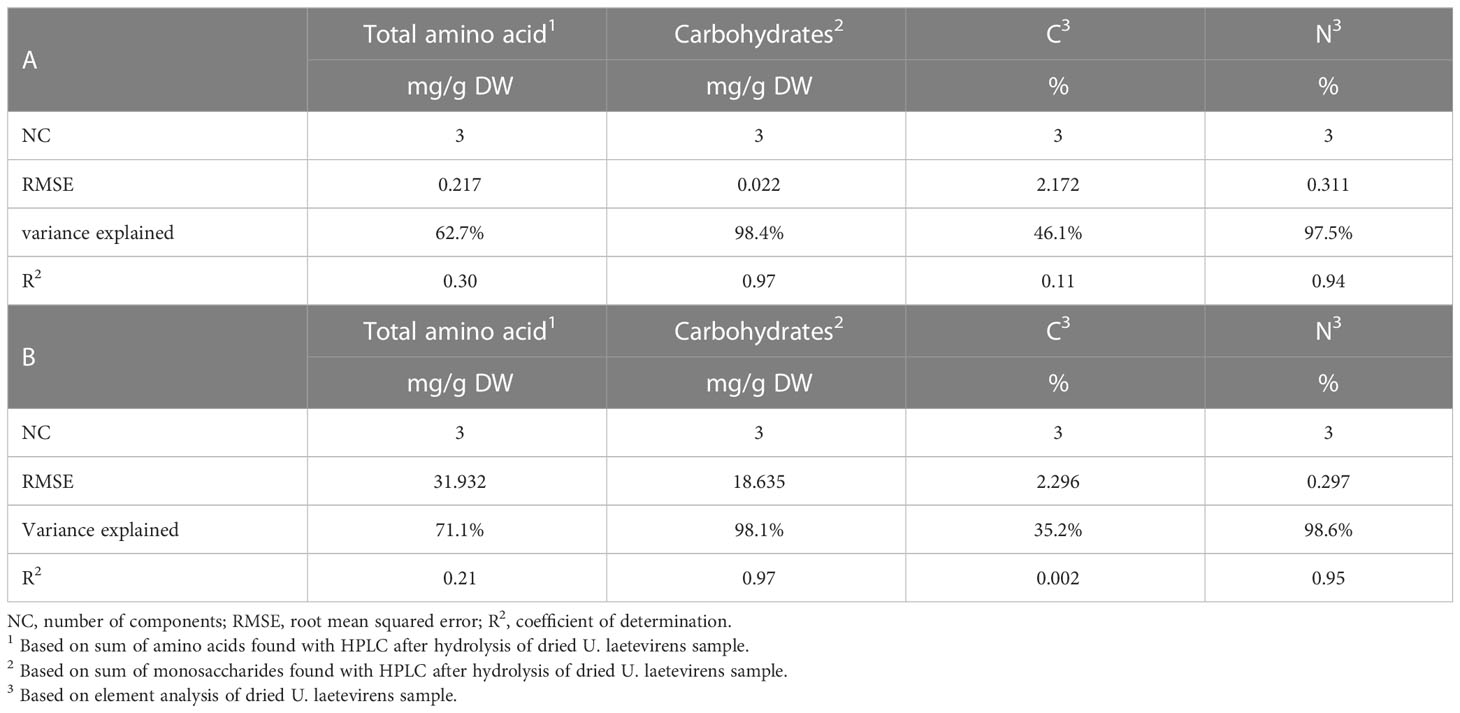
Table 2 Linear and PLSR predictive model based on logarithmic numbers (A) and on original (non-log) numbers (B).
The lowest root mean square error (RMSE) was traced to select the optimal number of components (NC) (Supplementary Figure S7) (Ter Braak and Juggins, 1993). Three was selected as the optimal number of components. At three components, the RMSE is 0.217 when based on total amino acid concentration and 0.311 when based on percentage nitrogen (%N). In the case of carbohydrate concentration, RMSE was 0.022. The corresponding coefficients of determination, R2, were 0.30 for total amino acid, 0.97 for carbohydrate, 0.11 for %C, and 0.94 for %N (Table 2A and Figure 6). Table 2B represents the results from the non–log-transformed data; these deviate only slightly downward. Supplementary Figure S8 represents the regression coefficient determined for all wave numbers. It can be concluded that a high positive correlation was established between the predicted concentration of carbohydrates and measured amount, in this case, the total sum of the monosaccharide concentration after hydrolysis of the sample.
The regression between classical protein analysis, based on the sum of the total amino acid concentration after hydrolysis, and protein prediction was 0.30. A closer look at the protein regression figure shows that all samples with low protein concentrations, all T0 and ND samples, were in the bottom left corner of Figure 6 and the higher concentrations were all in the upper right corner. It appeared that the samples were divided into two major groups as a lower left and higher right group; therefore, the acquired regression could be considered as a line through only two points (~clouds). However, the correlation between the prediction of percentage of nitrogen in an U. laetevirens sample and the analyzed amount by element analysis was high, R2 = 0.94. This means that, in contrast to the PLSR plot of protein concentration based on total amino acid, the regression plot based on %N with FTIR spectra can be done reliably.
The prediction plot of %C showed a low R2. Given the huge dispersion of all points found in Figure 6D, it appeared that there was no correlation for C atoms present. The opposite correlations found for all four biochemical measurements with FTIR were also clearly visible in the heatmap; Supplementary Figure S6. The MID-FTIR area with the strongest correlation was found between 1800 and 1200 cm−1. From the colors in this heatmap, it was clearly seen that the rows related to N or protein analysis correlated oppositely with the carbohydrate row. Furthermore, it could be seen that no correlation was found for any wave number in the FTIR spectra and the analyzed %C present in the samples.
4 Discussion
There is an urgent need for a rapid, simple, and reliable qualification and quantification of biochemical components in seaweed biomass. Here, we present our results for using ATR-FTIR combined with PCA and PLSR as a rapid tool to qualify and quantify the biochemical composition of U. laetevirens biomass cultivated onshore under different abiotic stress factors.
4.1 Setup experimental conditions for analysis of on-shore U. laetevirens cultivation
To our knowledge, this is the first time that a study has been done with FTIR combined with multivariate analysis to determine biochemical composition within one species of green algae, U. laetevirens, that is cultivated under different abiotic stress factors. A few studies have used FTIR combined with multivariate analysis to analyze biochemical composition in green seaweed, with the aim of demonstrating differences between seaweed divisions (brown, red, and green)(Date et al., 2012; Verma et al., 2017; Charles and Alamsjah, 2019; Agrawal et al., 2022). For green seaweeds, studies are rarely done within the same family, let alone within one species, as done here for U. laetevirens. In addition, the samples are mostly collected from the wild (Date et al., 2012; Shekhar et al., 2012; Niemi et al., 2023) and not harvested from a seaweed farm or onshore cultivation setup as done in this study. For microalgae, it is more common to research a single species under controlled cultivation conditions and analyze biochemical compositions using FTIR with multivariate analysis (Wagner et al., 2010; Coat et al., 2014; Fanesi et al., 2019; Ferro et al., 2019; Wagner et al., 2019; Liu et al., 2020). However, microalgae have a different biochemical composition compared to seaweeds when looking at the carbohydrate-to-protein ratio. Seaweeds have four to five times higher % w/w carbohydrate than microalgae and microalgae have four to five times higher % w/w protein than seaweeds (Cai et al., 2013). This difference results in FTIR spectra with a more pronounced amide I and II band (Pistorius et al., 2009) for microalgae. Then, because of the different sample matrix, the sampling accessory used during FTIR analysis is different. For micro-algae, an aliquot of aqueous cell suspension is titrated in a well plate, dried, and analyzed on FTIR with transmission mode (Wagner et al., 2010; Fanesi et al., 2019; Wagner et al., 2019). ATR mode is used for a lot of experiments with more bulky but fine enough (≤0.5 mm)(Cantero-Tubilla and Walker, 2018) and homogenously distributed dry plant powder such as seaweed. On the basis of our focus on single seaweed species, FTIR as a rapid and efficient novelty analysis was developed.
Our aim was to use ATR-FTIR to obtain a non-laborious and simple method for freeze-dried and ground seaweed samples (Gómez-Ordóñez and Rupérez, 2011; Canteri et al., 2019; Santos et al., 2019; Bekiaris et al., 2020). For freeze-dried and ground seaweed samples, other multiple-step sample preparations have been published, namely, extraction of dried seaweed (Shekhar et al., 2012; Gómez-Ordóñez et al., 2014; Polo et al., 2015; Yaich et al., 2017; Niemi et al., 2023) or dilution of dried seaweed with KBr powder (Wagner et al., 2010; Date et al., 2012; Sackett et al., 2016; Zhao et al., 2021). The way that the sample is applied during analysis influences the results. In this research, no further sample treatment (such as extraction or dilution) was done. ATR as the sampling technique for the freeze-dried material was enough to get the required resolution for multivariate analysis and execution was rapid. For all samples, FTIR spectra were obtained, where all biochemical regions that are representative of dry plant biomass were present, i.e., carbohydrate and protein. The spectra differed most in the region from 1800 to 800 cm−1. Even the visual inspection differences in this region, where amides and glycosidic bonds vibrate, were noticeable (Figure 2).
Choices between technical devices in analysis are always a decision between precision and speed. For instance, in exact component qualification and quantification, other spectroscopic techniques such as MS or NMR are more applicable, in combination with a separation technique such as HPLC (Mouritsen et al., 2019; Gowda et al., 2022). When hardware pricing and daily material costs were taken into account, a rough estimation learned that ATR-FTIR analysis of seaweed samples as developed in this study is 10 times less expensive than the more traditional methods. Furthermore, a major advantage compared to the more traditional analyses is that the traditional methods have to be performed by a trained chemical analyst, whereas the FTIR analysis can be performed by a layman.
4.2 Suitability of PCA for discrimination of samples obtained by different abiotic stress conditions
To obtain a suitable pool of reference samples, an experimental setup was chosen in which a conditioned U. laetevirens batch was divided and exposed to abiotic stress factors that were expected to result in different biochemical compositions. From Figure 1, it can be seen that, when an abiotic factor is depleted, the biochemical composition changes. For example, when nitrogen is depleted, the total amount of amino acids in the sample declined. However, because photosynthesis was still possible and the amount of phosphorus was still replete, this resulted in higher carbohydrate concentrations, particularly glucose (Lubsch and Timmermans, 2018). The concentrations found in our study correspond with those in literature (Supplementary Table S1) (Gómez Pinchetti et al., 1998). We conclude that our onshore cultivation of U. laetevirens resulted in a set of samples with a range of low and high concentrations of major constituents that are very appropriate for the subsequent multivariate data analysis.
In this study, ATR-FTIR combined with PCA chemometrics turned out to be excellent in characterizing the type of abiotic stress factor to which U. laetevirens was exposed. The broad regions of 3700–2750 cm−1 and 1800–900 cm−1 were selected for multivariate analysis. In addition, the evaluation of narrower regions was also done, for instance, the regions containing amide I or amide II band (Supplementary Figure S4) were evaluated separately and combined. However, the already good separation of 90% (PC1 + PC2) found using the broad spectrum did not improve significantly when evaluating only narrower regions. Therefore, it was decided to use the broad region in this study.
It is shown that the PC1 + PC2 score separated the phosphorus-depleted samples from the other samples. This shows that PCA is able to discriminate also on the basis of the phosphorus repletion, which is much more difficult using classical biochemical analysis. ATR-FTIR with PCA is therefore useful to get an overall view of the total biochemical conditions of the whole organism where other analytical methods such as LC-MS or NMR analyze a specific type of compounds, for instance, sulfated polysaccharides or anti-oxidants. A major advantage that can be concluded from this ATR-FTIR combined with PCA setup is that, with a minimal sampling and analysis, it can be decided whether cultivation is on the right track or whether it needs additional nitrogen or phosphorus nutrients.
4.3 Suitability of PLSR analysis as carbohydrate and nitrogen concentration determination and additional considerations concerning protein and carbon quantification
The results of the PLSR analysis were promising in allowing for quantification of biochemical components in U. laetevirens biomass. For prediction of the carbohydrate concentration, PLSR is applicable because of the high coefficient of determination, R2 of 0.97. This is also the case for the prediction of nitrogen present. However, these high coefficients of determination were not found for the other two analyses: carbon content and total amino acid concentration. This indicates that not all biochemical components can be quantified reliably at this stage.
It was apparent that PLSR was not suitable for prediction of carbon content, despite the fact that prediction of carbohydrates, a major carbon storage, was possible. Most likely due to the unfocused nature of carbon wave numbers in FTIR, no correlation was found using PLSR. Because of the sheer amount of different carbon bonds, a broad range of carbon-associated wave numbers is present in FTIR spectra. These carbon atoms belong to all other non-carbohydrate biochemical compounds present in seaweed biomass.
There are a few articles that focus on the prediction of protein concentration in seaweed with FTIR PLSR (Tadmor Shalev et al., 2022; Niemi et al., 2023). Niemi et al. (2023) constructed a protein prediction model from total amino acid concentration analyzed with mass spectrometry and the peak height of the amide II band found with DRIFTS. They also claim that models where a colorimetric assay was used undoubtedly over- or underestimate the protein concentration, due to the overly generic multiplier that was used. In the early stage of this research, when Lowry was used before switching to element analysis, we also noticed the same result (not published). For the DRIFTS model, the authors claimed that a reliable result was found if only the height of the amide II band of the FTIR spectrum was used. In that case, a model with good prediction performance was obtained if based on seven PLS components. Similarly, for micro-algae, the use of only one wave number for calculating and predicting protein content has been implemented successfully. In literature it is sometimes said that only amide II is suitable to use because amide I interferes too muchwith the alginate peak (Wagner et al., 2010; Sackett et al., 2016; Fanesi et al., 2019; Wagner et al., 2019; Niemi et al., 2023). In our case, the PLSR did not improve much when we only used the amide I or the amide II band instead of the whole spectra. We prefer to use the full spectrum because, as already mentioned in Section 3.2, choosing one band may cause confusion due to presence of other functional groups of other components that interfere with the absorption band of the specific structure. The use of the whole spectrum takes into account the biochemical complexity of the sample and the various functional groups present.
Tadmor Shalev et al. (2022) described a correlation for protein concentration between FTIR and PLSR. This protein correlation was drawn from nitrogen determination by element analysis of 144 Gracilaria sp. specimens (Tadmor Shalev et al., 2022). This result for this species of red seaweed can be compared to our findings with the green seaweed U. laetevirens. We also found that PLSR is applicable because of the high coefficient of determination, R2 of 0.94, for the prediction of nitrogen present in the biomass. We did not find any literature showing a prediction of protein concentration for seaweed based on amino acid profile determined on full FTIR spectra instead of only the amide bands. Nitrogen content can be a good indicator for protein content. However, when using nitrogen content as a measure for protein content, it is not taken into account that nitrogen can be stored as such in seaweed (Lubsch and Timmermans, 2018; Lubsch and Timmermans, 2019).
Considering PLSR for the study of total amino acid prediction by FTIR, it is probably worthwhile to have a larger variation in total amino acid concentrations in the samples. In our study, we sampled after 7 and 14 days in circumstances where nitrogen was replete or deplete (in fact, end-members only) for three total cultivations (n = 3). This ensured that seaweed had either a minimum and maximum of protein compounds due to completely empty or full nitrogen stock (Lubsch and Timmermans, 2018). A gradient of nitrogen availability during cultivation over multiple tanks should be included to enlarge the reference sample database and observe whether this results in PLSR prediction compared to the HPLC amino acid analysis.
We found that the combination of ATR-FTIR spectra with multivariate statistical analysis is a rapid tool that gives very useful information on the identity and quantity of the main biomass constituents in U. laetevirens biomass. This method can be developed toward a useful tool for adjustment of nutrients or other abiotic stress factors during cultivation to get biomass suitable for further application with demands for explicit nutritional value or polysaccharide content. It is therefore advisable to increase the number of reference samples to increase the flexibility of the model. Increasing the samples cultivated under other abiotic stress factors, other Ulva species, the samples collected in the wild on different locations (preferably with known abiotic conditions), etc., will contribute greatly.
5 Conclusion
In our study, we conclude that the combination of ATR-FTIR spectroscopy with multivariate analysis can be successfully applied to qualitatively differentiate U. laetevirens samples from different abiotic effects, namely, replete and nitrogen depletion, phosphorus depletion, and light limitation. ATR-FTIR with PCA is a rapid tool for determining the physiological state of U. laetevirens during cultivation. There is no need for further sample processing beyond freeze-drying and grinding. ATR-FTIR with PCA takes into account the entire biochemical composition. Looking at the PCA, PC1 and PC2 of the spectra, in the region of 3700–2750 cm−1 and 1800–900 cm−1, give clusters with confidence levels of 90%, discriminating between abiotic stress factors. With PLSR, the nitrogen content and carbohydrate concentration can be predicted quantitatively.
We conclude that ATR-FTIR spectroscopy combined with PCA and PLSR is a rapid tool that can be very helpful in rapid monitoring and controlling biochemical compound changes during cultivation systems, at lower costs than using traditional analyses. This is highly desirable with the increasing scale of commercial onshore seaweed cultivation optimizing toward specific biochemical compositions. This research shows the possibilities of FTIR when applied within one single species of seaweed, highlighting the impact of abiotic stress factors during cultivation.
Data availability statement
The raw data supporting the conclusions of this article will be made available by the authors, without undue reservation.
Author contributions
GD: data curation, data analysis, investigation, software, validation, visualization, writing—original draft and review and editing. LBl: conceptualization, data curation, data analysis, investigation, methodology, project administration, visualization, review editing, and supervision. LBa: chemical analysis, data processing, and review editing. CH: data handling in R, multivariate analysis and interpretation plots, and review editing. RF: data curation, chemical analysis, investigation, and review editing. JG: writing—draft and review and editing RT: conceptualization, data curation, cultivation performance, investigation, and review editing. KT: conceptualization, methodology, project administration, review editing, and supervision. All authors contributed to the article and approved the submitted version.
Funding
This work was supported by the ValgOrize project, is subsidized by the Interreg 2 seas program 2014-2022, and is co-financed by the European Regional Development Fund under subsidy contract Nr. 2S05-17.
Acknowledgments
The authors would like to thank Adri Knuijt for his technical support on data handling in R; Jurian Brasser and Jan Peene for their help on total amino acid and element analysis respectively; Faye Diederiks and Jasper Gerritsen for their assistance with the seaweed cultivation during their internship; CH for his input on multivariate analysis of the data during his internship; and Victoria Mason for reading the paper and valuable comments. All the aforementioned persons are from NIOZ, Royal Netherlands Institute for Sea Research. Sandra van Roy and Peter de Rechter from VITO, Flemish Institute for Technological Research are thanked for their technical support related to sugar analyses.
Conflict of interest
The authors declare that the research was conducted in the absence of any commercial or financial relationships that could be construed as a potential conflict of interest.
Publisher’s note
All claims expressed in this article are solely those of the authors and do not necessarily represent those of their affiliated organizations, or those of the publisher, the editors and the reviewers. Any product that may be evaluated in this article, or claim that may be made by its manufacturer, is not guaranteed or endorsed by the publisher.
Supplementary material
The Supplementary Material for this article can be found online at: https://www.frontiersin.org/articles/10.3389/fmars.2023.1154461/full#supplementary-material
References
Agrawal S., Siddiqui S. A., Chaudhary D. R., Rathore M. S. (2022). Bio-prospection and compositional multivariate analysis revealed the industrial potential of selected seaweeds along Gujarat seacoast. Bioresour. Technol. Rep. 19, 101130. doi: 10.1016/J.BITEB.2022.101130
Baker M. J., Trevisan J., Bassan P., Bhargava R., Butler H. J., Dorling K. M., et al. (2014). Using Fourier transform IR spectroscopy to analyze biological materials. Nat. Protoc. 98 9, 1771–1791. doi: 10.1038/NPROT.2014.110
Bekiaris G., Koutrotsios G., Tarantilis P. A., Pappas C. S., Zervakis G. I. (2020). FTIR assessment of compositional changes in lignocellulosic wastes during cultivation of Cyclocybe cylindracea mushrooms and use of chemometric models to predict production performance. J. Mater. Cycles. Waste. Manage. 22, 1027–1035. doi: 10.1007/s10163-020-00995-7
Cai T., Park S. Y., Li Y. (2013). Nutrient recovery from wastewater streams by microalgae: status and prospects. Renew. Sustain. Energy Rev. 19, 360–369. doi: 10.1016/J.RSER.2012.11.030
Canteri M. H. G., Renard C. M. G. C., Le Bourvellec C., Bureau S. (2019). ATR-FTIR spectroscopy to determine cell wall composition: application on a large diversity of fruits and vegetables. Carbohydr. Polym. 212, 186–196. doi: 10.1016/j.carbpol.2019.02.021
Cantero-Tubilla B., Walker L. P. (2018). Transformations to reduce the effect of particle size in mid-infrared spectra of biomass. Analyst 143, 5191–5201. doi: 10.1039/C8AN01137K
Ceylan S., Goldfarb J. L. (2015). Green tide to green fuels: TG–FTIR analysis and kinetic study of Ulva prolifera pyrolysis. Energy Convers. Manage. 101, 263–270. doi: 10.1016/j.enconman.2015.05.029
Charles A. L., Alamsjah M. A. (2019). Application of chemometric techniques: an innovative approach to discriminate two seaweed cultivars by physico-functional properties. Food Chem. 289, 269–277. doi: 10.1016/J.FOODCHEM.2019.03.051
Christou C., Agapiou A., Kokkinofta R. (2018). Use of FTIR spectroscopy and chemometrics for the classification of carobs origin. J. Adv. Res. 10, 1–8. doi: 10.1016/j.jare.2017.12.001
Coat R., Montalescot V., León E. S., Kucma D., Perrier C., Jubeau S., et al. (2014). Unravelling the matrix effect of fresh sampled cells for in vivo unbiased FTIR determination of the absolute concentration of total lipid content of microalgae. Bioprocess. Biosyst. Eng. 37, 2175–2187. doi: 10.1007/S00449-014-1194-5/FIGURES/6
Corte L., Tiecco M., Roscini L., De Vincenzi S., Colabella C., Germani R., et al. (2015). FTIR metabolomic fingerprint reveals different modes of action exerted by structural variants of n-alkyltropinium bromide surfactants on Escherichia coli and Listeria innocua cells. PloS One 10, e0115275. doi: 10.1371/JOURNAL.PONE.0115275
Date Y., Sakata K., Kikuchi J. (2012). Chemical profiling of complex biochemical mixtures from various seaweeds. Polym. J. 44, 888–894. doi: 10.1038/pj.2012.105
Dias D. A., Jones O. A. H., Beale D. J., Boughton B. A., Benheim D., Kouremenos K. A., et al. (2016). Current and future perspectives on the structural identification of small molecules in biological systems. Metabolites 6, 46. doi: 10.3390/METABO6040046
Dominguez H., Loret E. P. (2019). Ulva lactuca, a source of troubles and potential riches. Mar. Drugs 17, 357. doi: 10.3390/MD17060357
Fanesi A., Wagner H., Birarda G., Vaccari L., Wilhelm C. (2019). Quantitative macromolecular patterns in phytoplankton communities resolved at the taxonomical level by single-cell synchrotron FTIR-spectroscopy. BMC Plant Biol. 19, 1–14. doi: 10.1186/s12870-019-1736-8
Ferro L., Gojkovic Z., Gorzsás A., Funk C. (2019). Statistical methods for rapid quantification of proteins, lipids, and carbohydrates in Nordic microalgal species using ATR–FTIR spectroscopy. Mol 24, 3237. doi: 10.3390/MOLECULES24183237
Figueira T. A., da Silva A. J. R., Enrich-Prast A., Yoneshigue-Valentin Y., de V. P., Figueira T. A., et al. (2020). Structural characterization of ulvan polysaccharide from cultivated and collected ulva fasciata (Chlorophyta). Adv. Biosci. Biotechnol. 11, 206–216. doi: 10.4236/ABB.2020.115016
Gangopadhyay D., Ray M., Sinha S. (2022). Comparison of amino acid profiles and vitamin contents of male and female prepupae and pupae of eri silkworm, samia ricini. J. Food Compos. Anal. 113, 104723. doi: 10.1016/J.JFCA.2022.104723
Gilbert-López B., Mendiola J. A., Fontecha J., Van Den Broek L. A. M., Sijtsma L., Cifuentes A., et al. (2015). Downstream processing of isochrysis galbana: a step towards microalgal biorefinery. Green Chem. 17, 4599–4609. doi: 10.1039/c5gc01256b
Gómez-Ordóñez E., Jiménez-Escrig A., Rupérez P. (2014). Bioactivity of sulfated polysaccharides from the edible red seaweed mastocarpus stellatus. Bioact. Carbohydrates. Diet. Fibre. 3, 29–40. doi: 10.1016/j.bcdf.2014.01.002
Gómez-Ordóñez E., Rupérez P. (2011). FTIR-ATR spectroscopy as a tool for polysaccharide identification in edible brown and red seaweeds. Food Hydrocoll. 25, 1514–1520. doi: 10.1016/J.FOODHYD.2011.02.009
Gómez Pinchetti J. L., del Campo Fernández E., Moreno Díez P., García Reina G. (1998). Nitrogen availability influences the biochemical composition and photosynthesis of tank-cultivated ulva rigida (Chlorophyta). J. Appl. Phycol. 10, 383–389. doi: 10.1023/A:1008008912991
Gowda S. G. B., Yifan C., Gowda D., Tsuboi Y., Chiba H., Hui S.-P. (2022). Analysis of antioxidant lipids in five species of dietary seaweeds by liquid chromatography/mass spectrometry. Antioxidants 11, 1538. doi: 10.3390/antiox11081538
Grdadolnik J. (2002). ATR-FTIR spectroscopy: its advantages and limitations. Acta Chim. Slov. 49, 631–642.
Hanson B. A. (2022) ChemoSpec: exploratory chemometrics for spectroscopy. Available at: https://www.researchgate.net/publication/331060038 (Accessed July 11, 2022).
Hentati F., Tounsi L., Djomdi D., Pierre G., Delattre C., Ursu A. V., et al. (2020). Bioactive polysaccharides from seaweeds. Molecules 25, 3152. doi: 10.3390/MOLECULES25143152
Holdt S. L., Kraan S. (2011). Bioactive compounds in seaweed: functional food applications and legislation. J. Appl. Phycol. 23, 543–597. doi: 10.1007/s10811-010-9632-5
Innes S. N., Arve L. E., Zimmermann B., Nybakken L., Melby T. I., Solhaug K. A., et al. (2019). Elevated air humidity increases UV mediated leaf and DNA damage in pea (Pisum sativum) due to reduced flavonoid content and antioxidant power. Photochem. Photobiol. Sci. 18, 387–399. doi: 10.1039/C8PP00401C
Kidgell J. T., Magnusson M., de Nys R., Glasson C. R. K. (2019). Ulvan: a systematic review of extraction, composition and function. Algal. Res. 39, 101422. doi: 10.1016/J.ALGAL.2019.101422
Lee L. C., Liong C.-Y., Jemain A. A. (2017). A contemporary review on data preprocessing (DP) practice strategy in ATR-FTIR spectrum. Chemom. Intell. Lab. Syst. 163, 64–75. doi: 10.1016/j.chemolab.2017.02.008
Liberda D., Pięta E., Pogoda K., Piergies N., Roman M., Koziol P., et al. (2021). The impact of preprocessing methods for a successful prostate cell lines discrimination using partial least squares regression and discriminant analysis based on Fourier transform infrared imaging. Cells 10, 953. doi: 10.3390/cells10040953
Lim C., Yusoff S., Ng C. G., Lim P. E., Ching Y. C. (2021). Bioplastic made from seaweed polysaccharides with green production methods. J. Environ. Chem. Eng. 9, 105895. doi: 10.1016/J.JECE.2021.105895
Liu J.-Y., Zeng L.-H., Ren Z.-H. (2020). Recent application of spectroscopy for the detection of microalgae life information: a review. Appl. Spectrosc. Rev. 55, 26–59. doi: 10.1080/05704928.2018.1509345
Lubsch A., Timmermans K. (2018). Uptake kinetics and storage capacity of dissolved inorganic phosphorus and corresponding N:P dynamics in ulva lactuca (Chlorophyta). J. Phycol. 54, 215–223. doi: 10.1111/JPY.12612
Lubsch A., Timmermans K. R. (2019). Uptake kinetics and storage capacity of dissolved inorganic phosphorus and corresponding dissolved inorganic nitrate uptake in saccharina latissima and laminaria digitata (Phaeophyceae). J. Phycol. 55, 637–650. doi: 10.1111/JPY.12844
Mevik B. H., Wehrens R. (2007). The pls package: principal component and partial least squares regression in r. J. Stat. Software 18, 1–23. doi: 10.18637/JSS.V018.I02
Mouritsen O. G., Duelund L., Petersen M. A., Hartmann A. L., Frøst M. B. (2019). Umami taste, free amino acid composition, and volatile compounds of brown seaweeds. J. Appl. Phycol. 31, 1213–1232. doi: 10.1007/S10811-018-1632-X/FIGURES/8
Niemi C., Mortensen A. M., Rautenberger R., Matsson S., Gorzsás A., Gentili F. G. (2023). Rapid and accurate determination of protein content in north Atlantic seaweed by NIR and FTIR spectroscopies. Food Chem. 404, 134700. doi: 10.1016/J.FOODCHEM.2022.134700
Nieuwenhuize J., Maas Y. E. M. M., Middelburg J. J. (1994). Rapid analysis of organic carbon and nitrogen in particulate materials. Mar. Chem. 45, 217–224. doi: 10.1016/0304-4203(94)90005-1
Oberreuter H., Seiler H., Scherer S. (2002). Identification of coryneform bacteria and related taxa by Fourier-transform infrared (FT-IR) spectroscopy. Int. J. Syst. Evol. Microbiol. 52, 91–100. doi: 10.1099/00207713-52-1-91/CITE/REFWORKS
Piermaria J., Bosch A., Pinotti A., Yantorno O., Garcia M. A., Abraham A. G. (2011). Kefiran films plasticized with sugars and polyols: water vapor barrier and mechanical properties in relation to their microstructure analyzed by ATR/FT-IR spectroscopy. Food Hydrocoll. 25, 1261–1269. doi: 10.1016/j.foodhyd.2010.11.024
Pilatti F. K., Ramlov F., Schmidt E. C., Costa C., de Oliveira E. R., Bauer C. M., et al. (2017). Metabolomics of ulva lactuca Linnaeus (Chlorophyta) exposed to oil fuels: Fourier transform infrared spectroscopy and multivariate analysis as tools for metabolic fingerprint. Mar. pollut. Bull. 114, 831–836. doi: 10.1016/j.marpolbul.2016.11.006
Pistorius A. M. A., DeGrip W. J., Egorova-Zachernyuk T. A. (2009). Monitoring of biomass composition from microbiological sources by means of FT-IR spectroscopy. Biotechnol. Bioeng. 103, 123–129. doi: 10.1002/BIT.22220
Polo L. K., Felix M. R. L., Kreusch M., Pereira D. T., Costa G. B., Simioni C., et al. (2015). Metabolic profile of the brown macroalga sargassum cymosum (Phaeophyceae, fucales) under laboratory UV radiation and salinity conditions. J. Appl. Phycol. 27, 887–899. doi: 10.1007/s10811-014-0381-8
Robic A., Bertrand D., Sassi J.-F., Lerat Y., Lahaye M. (2009). Determination of the chemical composition of ulvan, a cell wall polysaccharide from Ulva spp. (Ulvales, chlorophyta) by FT-IR and chemometrics J. Appl. Phycol. 21, 451–456. doi: 10.1007/s10811-008-9390-9
Rohani-Ghadikolaei K., Abdulalian E., Ng W. K. (2012). Evaluation of the proximate, fatty acid and mineral composition of representative green, brown and red seaweeds from the Persian gulf of Iran as potential food and feed resources. J. Food Sci. Technol. 49, 774–780. doi: 10.1007/s13197-010-0220-0
Sackett O., Petrou K., Reedy B., Hill R., Doblin M., Beardall J., et al. (2016). Snapshot prediction of carbon productivity, carbon and protein content in a southern ocean diatom using FTIR spectroscopy. ISME. J. 10, 416–426. doi: 10.1038/ISMEJ.2015.123
Salomonsen T., Jensen H. M., Stenbæk D., Engelsen S. B. (2008). Chemometric prediction of alginate monomer composition: a comparative spectroscopic study using IR, raman, NIR and NMR. Carbohydr. Polym. 72, 730–739. doi: 10.1016/J.CARBPOL.2007.10.022
Santos D. I., Correia M. J. N., Mateus M. M., Saraiva J. A., Vicente A. A., Moldão M. (2019). Fourier Transform infrared (FT-IR) spectroscopy as a possible rapid tool to evaluate abiotic stress effects on pineapple by-products. Appl. Sci. 9, 4141. doi: 10.3390/APP9194141
Shekhar S. H. S., Lyons G., McRoberts C., McCall D., Carmichael E., Andrews F., et al. (2012). Brown seaweed species from strangford lough: compositional analyses of seaweed species and biostimulant formulations by rapid instrumental methods. J. Appl. Phycol. 24, 1141–1157. doi: 10.1007/s10811-011-9744-6
Socaciu C., Fetea F., Ranga F., Bunea A., Dulf F., Socaci S., et al. (2020). Attenuated total reflectance-Fourier transform infrared spectroscopy (ATR-FTIR) coupled with chemometrics, to control the botanical authenticity and quality of cold-pressed functional oils commercialized in Romania. Appl. Sci. 10, 8695. doi: 10.3390/APP10238695
Stehfest K., Toepel J., Wilhelm C. (2005). The application of micro-FTIR spectroscopy to analyze nutrient stress-related changes in biomass composition of phytoplankton algae. Plant Physiol. Biochem. 43, 717–726. doi: 10.1016/J.PLAPHY.2005.07.001
Tadmor Shalev N., Ghermandi A., Tchernov D., Shemesh E., Israel A., Brook A. (2022). NIR spectroscopy and artificial neural network for seaweed protein content assessment in-situ. Comput. Electron. Agric. 201, 1–14. doi: 10.1016/J.COMPAG.2022.107304
Talari A. C. S., Garcia Martinez M. A., Movasaghi Z., Rehman S., Rehman I. U. (2016). Advances in Fourier transform infrared (FTIR) spectroscopy of biological tissues. Appl. Spectrosc. Rev. 52, 456–506. doi: 10.1080/05704928.2016.1230863
Ter Braak C. J. F., Juggins S. (1993). Weighted averaging partial least squares regression (WA-PLS): an improved method for reconstructing environmental variables from species assemblages. Hydrobiologia 269, 485–502. doi: 10.1007/BF00028046
Türker-Kaya S., Huck C. W. (2017). A review of mid-infrared and near-infrared imaging: principles, concepts and applications in plant tissue analysis. Molecules 22, 168. doi: 10.3390/MOLECULES22010168
Varmuza K., Filzmoser P. (2016). Introduction to multivariate statistical analysis in chemometrics (Boca Raton: CRC Press). doi: 10.1201/9781420059496
Verma P., Kumar M., Mishra G., Sahoo D. (2017). Multivariate analysis of fatty acid and biochemical constitutes of seaweeds to characterize their potential as bioresource for biofuel and fine chemicals. Bioresour. Technol. 226, 132–144. doi: 10.1016/J.BIORTECH.2016.11.044
Verspreet J., Soetemans L., Bastiaens L. (2020). Searching for appropriate storage conditions for short-term wet preservation of porphyridium purpureum. Appl. Sci. 10, 8315. doi: 10.3390/APP10238315
Vidyalakshmi R., Paranthaman R., Sureshkumar K. (2016). Simultaneous determination of 17 amino acids in microbial pigments from monascus spp by UHPLC amino acid analyser using pre-column derivatization. Int. J. Curr. Microbiol. Appl. Sci. 5, 354–362. doi: 10.20546/IJCMAS.2016.503.042
Wagner H., Jebsen C., Wilhelm C. (2019). Monitoring cellular C:N ratio in phytoplankton by means of FTIR-spectroscopy. J. Phycol. 55, 543–551. doi: 10.1111/JPY.12858
Wagner H., Liu Z., Langner U., Stehfest K., Wilhelm C. (2010). The use of FTIR spectroscopy to assess quantitative changes in the biochemical composition of microalgae. J. Biophotonics. 3, 557–566. doi: 10.1002/JBIO.201000019
Yaich H., Amira A., Abbes F., Bouaziz M., Besbes S., Richel A., et al. (2017). Effect of extraction procedures on structural, thermal and antioxidant properties of ulvan from ulva lactuca collected in monastir coast. Int. J. Biol. Macromol. 105, 1430–1439. doi: 10.1016/J.IJBIOMAC.2017.07.141
Yaich H., Garna H., Besbes S., Paquot M., Blecker C., Attia H. (2011). Chemical composition and functional properties of ulva lactuca seaweed collected in Tunisia. Food Chem. 128, 895–901. doi: 10.1016/J.FOODCHEM.2011.03.114
Yu-Qing T., Mahmood K., Shehzadi R., Furqan Ashraf M. (2016). Ulva lactuca and its polysaccharides: food and biomedical aspects. J. Biol. Agric. Healthc. 6, 2224–3208.
Keywords: principal component analysis (PCA), on-shore cultivation, partial least square regression (PLSR), seaweed, protein, carbohydrate, nitrogen, abiotic stress factor
Citation: Derksen GCH, Blommaert L, Bastiaens L, Hasşerbetçi C, Fremouw R, van Groenigen J, Twijnstra RH and Timmermans KR (2023) ATR-FTIR spectroscopy combined with multivariate analysis as a rapid tool to infer the biochemical composition of Ulva laetevirens (Chlorophyta). Front. Mar. Sci. 10:1154461. doi: 10.3389/fmars.2023.1154461
Received: 30 January 2023; Accepted: 22 June 2023;
Published: 17 July 2023.
Edited by:
Rafael R. Robaina, University of Las Palmas de Gran Canaria, SpainReviewed by:
Boris Zimmermann, Norwegian University of Life Sciences, NorwayJavier Araña, University of Las Palmas de Gran Canaria, Spain
Copyright © 2023 Derksen, Blommaert, Bastiaens, Hasşerbetçi, Fremouw, van Groenigen, Twijnstra and Timmermans. This is an open-access article distributed under the terms of the Creative Commons Attribution License (CC BY). The use, distribution or reproduction in other forums is permitted, provided the original author(s) and the copyright owner(s) are credited and that the original publication in this journal is cited, in accordance with accepted academic practice. No use, distribution or reproduction is permitted which does not comply with these terms.
*Correspondence: Goverdina C. H. Derksen, dorien.derksen@nioz.nl