Quantitative evaluation of sea reclamation activities on tidal creek connectivity
 Ying Man
 Fangwen Zhou1,3
  Qing Wang
 Baoshan Cui
- 1State Key Joint Laboratory of Environmental Simulation and Pollution Control, School of Environment, Beijing Normal University, Beijing, China
- 2Yellow River Estuary Wetland Ecosystem Observation and Research Station, Ministry of Education, Dongying, Shandong, China
- 3Operation Management Department, China Construction Eco-Environmental Group Co., LTD, Beijing, China
- 4Research and Development Center for Watershed Environmental Eco-Engineering, Beijing Normal University, Zhuhai, China
Deltas are in a dynamic balance due to the impact of fluvial and coastal flooding, and hydrological connectivity plays an important role. In recent decades, the dynamic equilibrium has been influenced by upstream and local human activities, including sea reclamation activities. However, in most instances, the influence of human activities has not been explicitly distinguished and quantified in detail. In this paper, the influence of sea reclamation activities on hydrological connectivity in the Yellow River Delta was quantified by parameterizing the resistance surfaces (a spatial layer that assigns a value to each landscape feature, indicating the degree to which that variable impedes or promotes movement) that includes sea reclamation activities. By optimizing a functional relationship between landscape features and hydrological connectivity (water flow movement patterns), the values in the resistance surfaces could be assigned. We first calculated hydrological distances among bifurcations from 1985 to 2020 with a 5-year interval representing the hydrological connectivity of each tidal creek. The sea reclamation activities in the YRD were classified into four: reclaimed land, sea enclosure activity, freshwater resource facilities, and engineering in the oil field to create resistance surfaces. We identified that the periods of 1990–1995 and 2000–2005 were under the most severe influence of sea reclamation activities. Sea enclosure activity, freshwater resource facilities, and engineering in oil fields played major roles in composing resistance surfaces. Mariculture (quantified relative resistance value, 1.00), reservoir (0.92), agriculture (0.91), and river (0.97) were the features with the highest resistance values in the initial and mature development stages. The formation of resistance (costs to movement) was due to human activities and natural factors, for example, the evolution of tidal creeks. To develop the resource in tidal flats sustainably, systematic monitoring and sufficient conservation awareness were required. This study contributed to coastal management and planning by providing a quantified assessment of different types of sea reclamation activities.
1 Introduction
The hydrological connectivity of tidal creeks plays an important role in maintaining the dynamic balance in deltas. By transferring nutrients, dissolved oxygen, sediment, propagules, and other substances to coastal salt marsh vegetation (Nelson et al., 2017; Wu et al., 2020; Wang et al., 2021), tidal creeks contribute to the health and ecological processes of coastal ecosystems (Nelson et al., 2017). By transporting water and sediment, the stability of tidal flats is maintained by stably developed tidal creeks. In turn, stable landform environments promote the development of coastal salt marsh vegetation, reaching equilibrium with the mutual promotion of vegetation-landform-tidal creek systems (Xie et al., 2017). Through this process, deltas are in dynamic balance (Tessler et al., 2015). However, in recent decades, the dynamic balance is often influenced by upstream and local human activities, such as the construction of upstream reservoirs (Chen et al., 2013b), floodplain engineering, and local sea reclamation activities. Once the dynamic balance is interrupted, deltas become vulnerable to disturbances such as sea level rise.
Studies of the influences of human activities on tidal creeks have focused on various aspects of the tidal creek response. Regarding the morphology characteristics and connectivity, the responses of tidal creeks to upstream construction (Chen et al., 2013a), land reclamation (Shi et al., 2016; Xie et al., 2020; Fan et al., 2021), or other coastal developments (Chen and Han, 2015; Xie et al., 2020; Fan et al., 2021) have been studied, including the sedimentary changes to land use (Sanger et al., 2004; Darrow et al., 2017–). Regarding the water environment, the variations in water quality due to the influence of pollution have been studied using simulations (Buzzelli, 2008; Boynton et al., 2014) and experiment methods (DiDonato et al., 2009; Boynton et al., 2014; Wessel et al., 2021). The biological responses to coastal development have also been studied, including the changes to zooplankton (Li et al., 2012), nekton, macrobenthos (Lerberg et al., 2000; Washburn and Sanger, 2011), and fish (Bilkovic, 2011).
In most studies, however, human activities have not been classified specifically, and their influence has not been quantified. Rather, human activities have largely been considered rough categorical variables, such as urban or suburban (Lerberg et al., 2000), and summarized as rough indexes according to population density (Holland et al., 2004) or impervious land cover (Sanger et al., 2015). In fact, human activities are more detailed, particularly considering that multiple activities can coexist in one area.
In this paper, we distinguished the different types of sea reclamation activities that influenced tidal creeks and quantified these influences on the Yellow River Delta (YRD). We modeled each tidal creek as a hydrological network, with its edges represented as hydrological distance. Using this network as the observed data, we optimized the resistance surface based on the resistance theory and random walk theory. Through this process, different human activities were modeled as a series of randomly assigned resistance surfaces (Spear et al., 2010), on which commute distances (details in Materials and methods) were calculated to reflect water flow movement among sites of bifurcation in the tidal creeks. By comparing the hydrological distances with commute distances using a generalized linear mixed model, the best-fitted commute distances were selected, as well as the resistance surface. The framework and its application provided a quantitative assessment of the influence of human activities on hydrological connectivity at multiple temporal and spatial scales.
2 Materials and methods
2.1 Study area
The YRD (36° 24.0′–36° 48.2′ N; 117° 59.8′–120° 36.1′ E) is situated to the south of Bohai Bay in eastern China (Figure 1). It is not only the youngest delta in China’s warm temperate zone but also the largest delta with the most complete preservation (Song, 2015). The case study area is representative of coastal wetlands in the high-efficiency eco-economic zone of the Yellow River Delta, which extends from the mouth of the Taoer River in Zhanhua to the Qimu Cape in Longkou. Most areas of the YDR are dominated by irregular semidiurnal tides, while the tide in areas from the north of Doying Port to the south of the current course of the Yellow River is a diurnal tide (Yang et al., 2015; Weikang et al., 2018). The Yellow River has changed its channel courses multiple times, and the deposition of new subdeltas and the erosion of abandoned subdeltas have occurred successively (Zhang et al., 2018). In the study area, the mean tidal range on the north and south coasts is about 1–2 m, while that on the east coast near the current course is 0.76 m and that on the south coast is 0.61–1.68 m (Yang et al., 2015; Zhou et al., 2016; Wang et al., 2017). Changes to the coastline on the north coast were influenced by reclamation activities in recent decades, with maximum expansion rates up to 123.98 km2 (Fan et al., 2018).
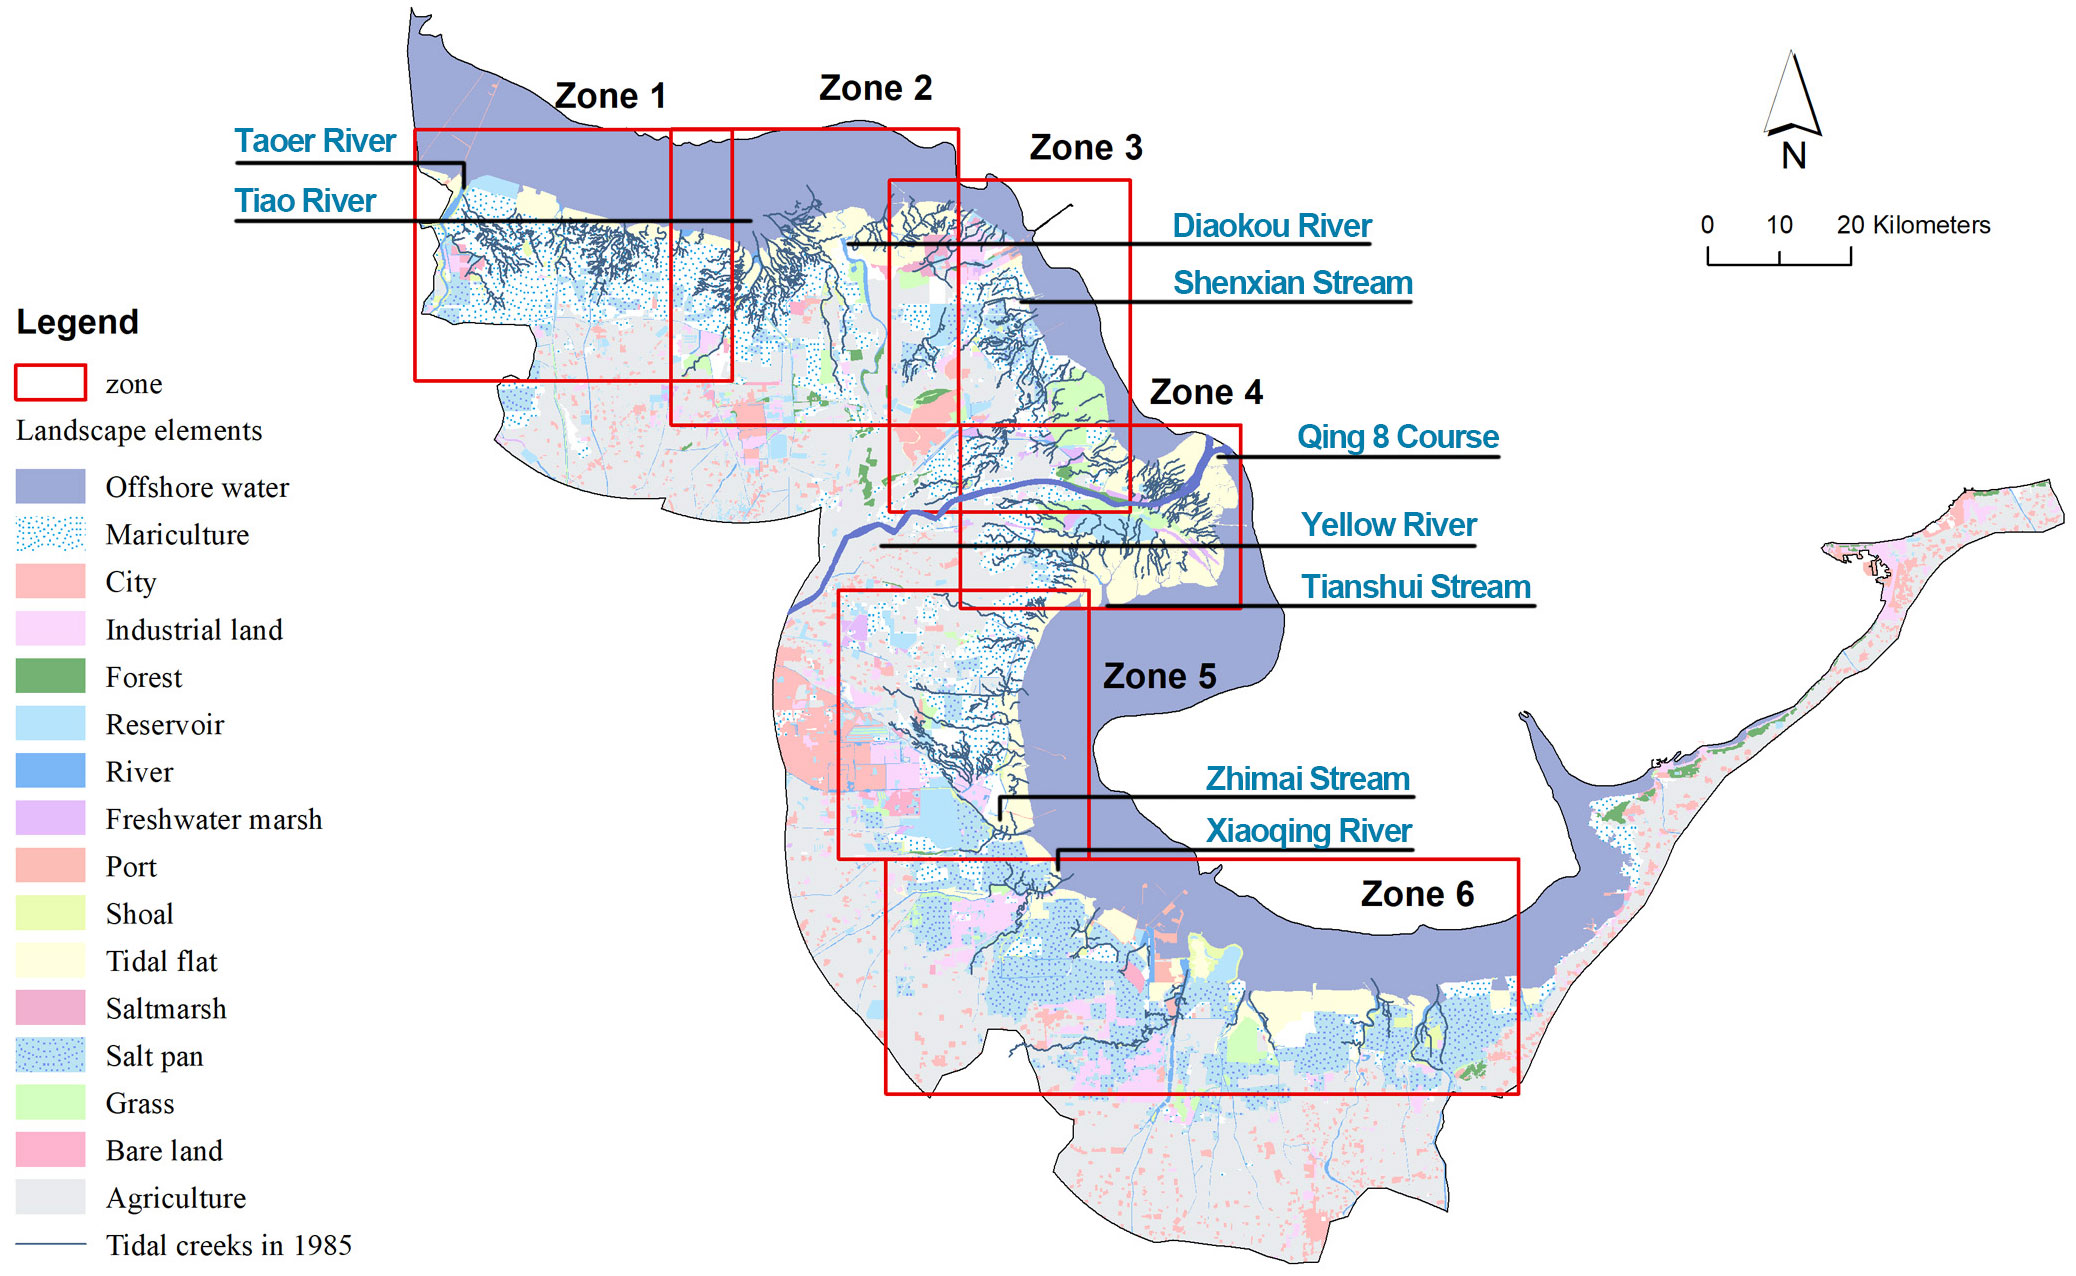
Figure 1 Study area and subzone divisions. The Yellow River Delta study area with landscape elements and tidal creeks in 1985.
2.2 Subzone division
As the drainage area of one tidal creek is much smaller compared to the entire YRD, there is no need to optimize the entire resistance surface of the YRD each time, especially considering the huge operand of the genetic algorithm. According to different hydrological conditions, patterns of human activity, and natural resources, we divided the entire area into six zones (Figure 1). The different hydrological conditions were mainly due to the change of courses of the Yellow River into the sea in different periods in history. Zone 1 was located on the northwest coast of the study area and mainly contains the Ancient YRD due to the flow of the Yellow River into the sea in 1855 through the Taoer River. Zone 2 mainly contains the delta lobe of the Diaokou course, has suffered significant erosion since it was abandoned in 1976. Zone 3 was the subdelta of the Yellow River that flows into the sea in Stream Shenxian and courses south and north of it from 1953 to 1976. Zone 4 contained the National Reserve of the YRD, which was built in 1992 to protect coastal wetlands. Zone 5 contained the southern abandoned subdelta formed at the beginning of this century from the south of the current course of the Qingshui Sream to the southern plain of Laizhou Bay. Zone 6 mainly contained Laizhou Bay.
2.3 Framework of landscape resistance quantification
2.3.1 Hydrological distance calculation
We used hydrological distance to measure the hydrological connectivity of tidal creeks, which was the shortest distance between pairs of sites computed along the stream network (Ganio et al., 2005; Ver Hoef et al., 2006). We focused on tidal creek changes in each 5-year period; the branching sites (e.g., confluence sites) in the beginning year were selected as objective sites (nodes). The hydrological distances between the objective sites in the ending year were selected as edges. Hydrological distances between lost objective sites were set to an infinite value (9999) to show the two sites were unconnected. By quantifying the changes between lost nodes caused by landscape features, their influence on hydrological connectivity could be reflected. The Spatial Tools for the Analysis of the River Systems (STARS) toolbox in ArcGIS 10.5 (Peterson and Ver Hoef, 2014) and the R package Spatial Stream Network (SSN) were used to calculate the hydrological distances between objective sites in tidal creeks, which referred to river system (Ver Hoef et al., 2014). The direction of the ebb tide was taken as the direction of tidal creek networks to be consistent with the terms defined in the river system in the software. The detailed steps for calculation were as follows.
First, the STARS toolbox was used to identify the topological relationships between features in the tidal creek data. Because the topological relationships were the basis for analyzing connectivity, adjacency, and directional relationships in a network, they were not stored in the format of extracted tidal creeks (shapefile) (Peterson and Ver Hoef, 2014). Specifically, the polyline to landscape network tool was used to transform the extracted tidal creek data from polyline format to landscape network format. Tools to check network topology, clean braided channels, and identify complex confluences were then used to eliminate topological errors in the tidal creek networks. Considering that the tidal creek segment may change during the 5-year period, the snap points to landscape network edges tool was used to ensure the objective sites were located on the tidal creek segment. After these preprocessing steps, the upstream distances tool of edges and sites was used for calculating upstream distances that were defined as the length of the continuous line from any location on the tidal creek network to its outlet (the most downstream location of the tidal creek network) (Peterson and Ver Hoef, 2014). Upstream distance based on edges was calculated between the stream outlet and the most downstream points. An upstream distance based on edges was calculated between the stream outlet and selected sites. Both were needed in the calculation of hydrological distances between objective sites. The Create SSN object tool was used to store the information of upstream distance in a.ssn object that can be statistically computed and graphed in an R environment (Peterson and Ver Hoef, 2014). At the same time, this tool also generated network identifiers (IDs) and binary IDs in the.ssn object. Network IDs could distinguish different tidal creeks. Binary IDs were assigned in each segment in one tidal creek to identify flow-connected and flow-unconnected segments. The R package SSN was at last used to calculate hydrological distances between objective sites on flow-connected and flow-unconnected segments. Specifically, command importing was used to open the.ssn object, and command creatDisMat was used to generate the matrix of the hydrological distance between objective sites in each tidal creek network.
2.3.2 Quantifying values of resistance surfaces
Commute distances among the bifurcation sites in each tidal creek network could be calculated based on the resistance surfaces, according to random walk and resistance theory (Figure 2A). Commute distance, or resistance distance, was a graph-theoretic distance metric that was defined as the effective resistance between the nodes when each graph edge was replaced by conductance (McRae, 2006; Zeller et al., 2012). The commute distance was calculated based on the resistance surface. When comparing different commute distances from different resistance surfaces with the hydrological distance between the same objective sites, the resistance surface with the most fitted commute distance (to hydrological distance) could reflect the influence of landscape features on the tidal creeks (Figure 2B). An R package, ResistanceGA v.4.0-14 was used to execute the calculation of commute distances and the comparison (Peterman, 2018).
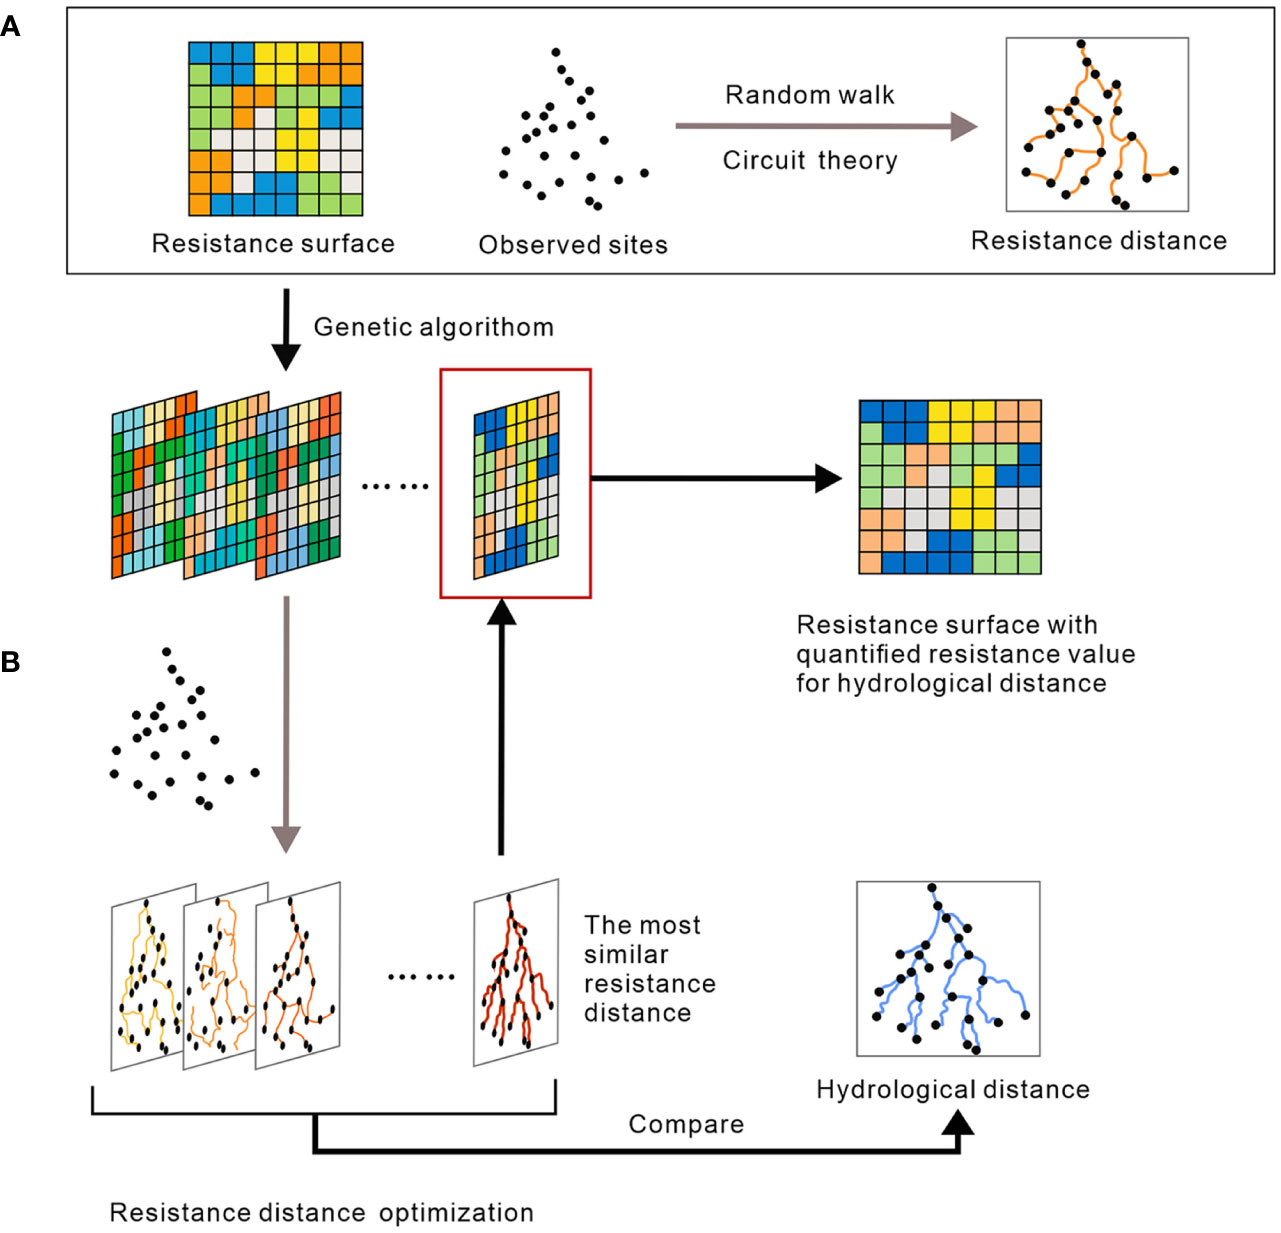
Figure 2 Framework for landscape resistance quantification. (A) Resistance distance calculation; (B) Resistance surface assignment based on observed hydrological distance.
The landscape features in the YRD that have the potential to influence tidal creek connectivity were classified into five categories (reclaimed land, sea enclosure activities, freshwater resource facilities, coastal wetland of saltwater, and engineering in oil fields) (details in Resistance surfaces generation). Each category that influenced tidal creek connectivity was considered one of the components of the resistance surface. To identify specific categories that have an influence on tidal creeks, all combinations of the five categories were generated (e.g., the Reclaim. Oil surface was composed of reclaimed land category and engineering in oil fields category). Each combination of categories formed a potential resistance surface. Each resistance surface was transformed into ASCII format to calculate commute distances. A series of random values were generated using genetic algorithms to assign landscape features to the category (Figure 2B). Commute distances between objective sites based on the assigned resistance surface were compared with hydrological distances between the same sites using a linear mixed-effect model named MLPE in the ResistanceGA. By comparing marginal R2 (reflecting the influence of the fixed effect in the model, which is the landscape feature here) of the models, the most fitted commute distance could be selected, and the values on the resistance surface thus reflected the resistance degree. Apart from the comparison between models based on one resistance surface, models of resistance surfaces with all combinations of categories were also compared using the all_comb command in the ResistanceGA. By comparing the marginal R2, or AIC, and running a bootstrap procedure, the most fitted model could be selected according to the rank. Resistance surface values in the corresponding resistance surface were regarded as the value that most closely resembled reality.
2.4 Tidal creek extraction
To understand the changes in the hydrological connectivity of tidal flats in the YRD, we extracted tidal creeks from Landsat images over the past 35 years at 5-year intervals. Level-1 Precision and Terrain (L1TP) data of Landsat-5 Thematic Mapper (TM) and Landsat-8 Operational Land Imager (OLI) were available from the United States Geological Survey (USGS) Earth Explorer (Survey, U.S. G., 2022). Images with a cloud cover of less than 10% were chosen. All images were pre-processed by ENVI 5.3. Radiometric calibration and Fast Line-of-Sight Atmospheric Analysis of Spectral Hypercubes (FLAASH) were used to eliminate the errors from sensors, solar radiation, and the atmosphere. (The information from the images, as well as the specific year chosen, are shown in Table 1).
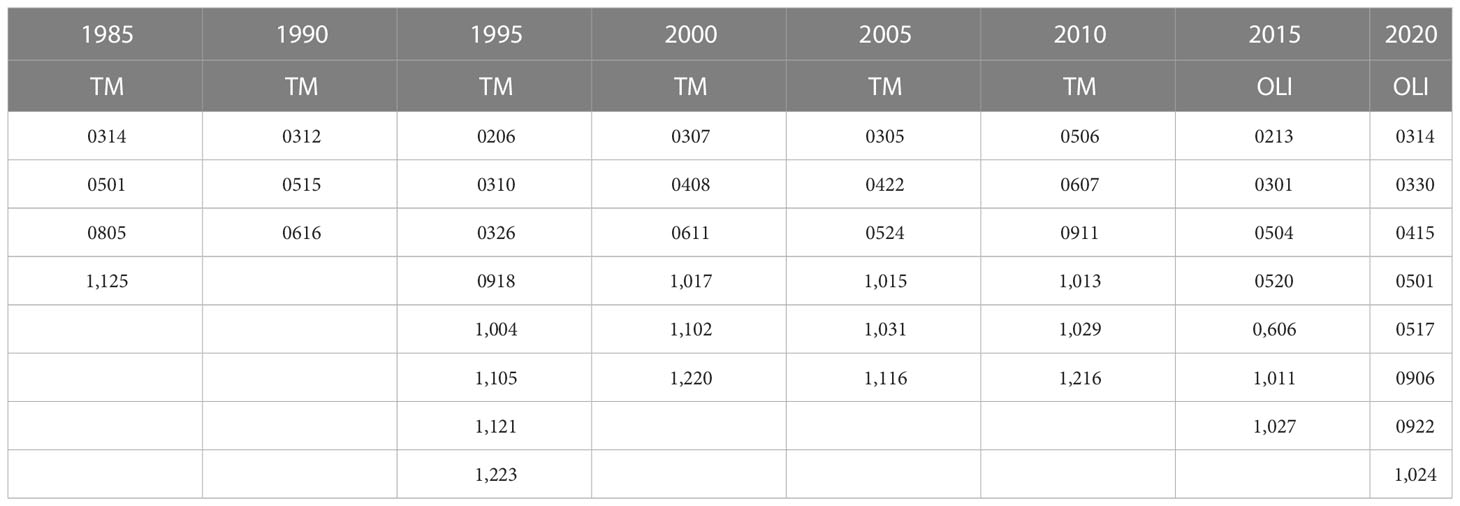
Table 1 Dates of satellite images used for tidal creek extraction with the corresponding Landsat sensor.
To calculate the hydrological distance between specific sites, we focused on the center line of tidal creeks. Considering that the small creeks (e.g., first order according to the Horton–Strahler method) were difficult to extract from tidal flats using the automatic methods, visual interpretation was employed for creek extraction. Considering the strong impact of tidal conditions on the appearance of tidal creeks in the images, we used the nonstandard false-color image to assist with the extraction. Because this combination of bands could better distinguish the boundaries between water bodies and land, it could help identify tidal creeks from tidal flats. Command of change RGB bands in ENVI 5.3 was used to execute the band combination of near-infrared bands, short-wave near-infrared bands, and red bands (453 and 564 for TM and OLI, respectively). The combination emphasizes water, which is often used to distinguish the boundaries between water and land in the coastline and tidal flat surveys.
2.5 Generation of resistance surfaces
The landscape features of sea reclamation activities in the YRD were obtained from the Northeast Institute of Geography and Agroecology, Chinese Academy of Sciences, to represent the resistance surface in the YRD. The sea reclamation activities in this dataset include categories of city construction land, port, industrial land, dry farmland, forest, bare land and tourism land, grass, salt pans, mariculture ponds, rivers, and reservoirs. On this basis, we reclassified these features into four categories, according to their similarities. City construction land, port, industrial land, dry farmland, forest, bare land, tourism land, and grass were classified as reclaimed land. Salt pans and mariculture ponds were classified as sea enclosure activities. Rivers, reservoirs, and offshore water were classified as freshwater resource facilities. Considering the high intensity and large temporal and spatial scale of oil exploration in the YRD, we also identified engineering in oil fields, including oil wells, roads leading to different oil wells, and oil fields that occupied large areas of land. In addition, coastal salt marshes and tidal flats were classified as coastal wetlands. All such surface data were processed into a raster stack to accommodate the requirements of the algorithm. The constructed resistance surface contains both a single and a combination of the sea reclamation activity categories (composite resistance surface).
3 Results
3.1 Identification of the key resistance surfaces for hydrological connectivity
The landscape resistance inversion results of tidal creeks with changes in 5-year intervals that were significantly related to landscape resistance revealed that resistance surfaces and the number of tidal creeks were different in different zones and at different times. Only resistance surfaces containing sea reclamation activity categories (with R2 higher than 0.1) are shown as the leading resistance surface in the rank of all possible resistance surface combinations in each tidal creek (Table 2) (the model result with optimal resistance surfaces composed of only coastal wetland of saltwater, null model, and distance model is not listed in the table). In general, the period of 1990–1995 had the greatest number of tidal creeks influenced by resistance surfaces, followed by the period of 2000–2005. The creek ID in each zone demonstrates that the influence of resistance surfaces at different times can be seen in the same tidal creeks. The majority of resistance surfaces are composite resistance surfaces, with two surfaces of either human activity or natural elements. Based on the specific resistance surfaces identified in Table 2, we discovered that sea enclosure activity played a significant role in the formation of resistance surfaces in the majority of zones, as such activities were present in the majority of resistance surfaces in zones 1, 3, 4, 5, and 6. Freshwater resource facilities are the second surface resistance component since these facilities were involved in the majority of zone 2 and 6 resistance surfaces. Engineering in oil fields also contributed to zone 4 resistance surfaces.
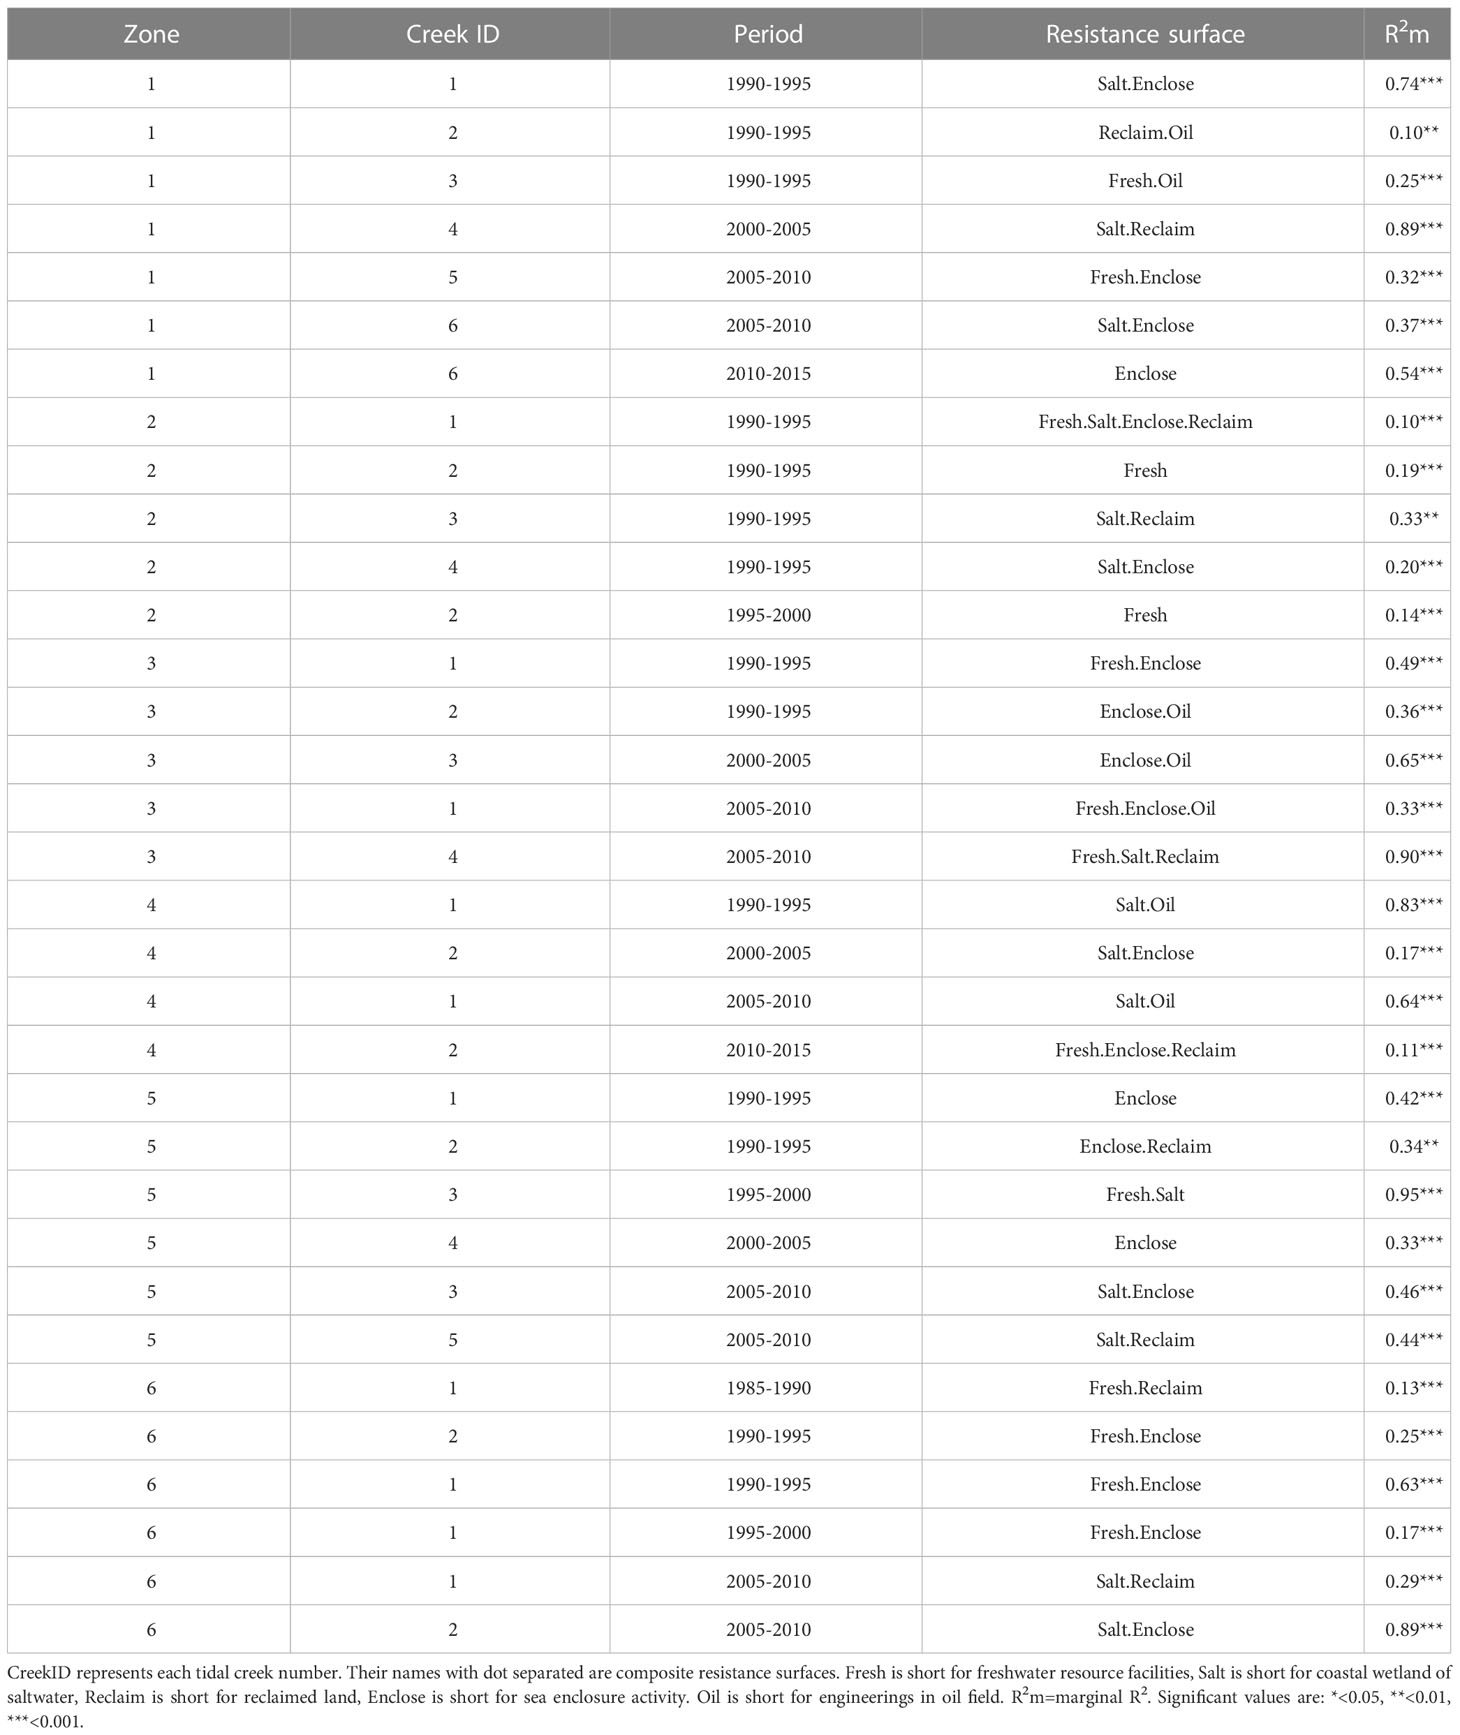
Table 2 Landscape resistance surface inversion results in period of 5-year interval in each zone.
3.2 Spatial–temporal variation of quantified resistance values
The result of the spatial-temporal distribution of resistance values in the YRD showed that high and low resistance values were distributed in different areas in different periods (Figures 3–5). According to the intensity of human activity and the invention time, the six zones were divided into three groups for analysis. Zones 1, 2, and 5 were grouped together because their human activities began at about the same time in the 1990s (Figure 3). Zones 3 and 6 were grouped together as their human activities began the earliest (and earlier than the time scale in this study) (Figure 4). Zone 4 was a single group with supposed minimal human intervention as the National Natural Reserve of the YRD is located within it (Figure 5). The findings revealed two types of connections between landscape elements and resistance values. One is that a single landscape feature had a single resistance value, such as mariculture in zone 1 with a resistance value of 0.12 in 1990–1995 in tidal creek 1 (Figure 3A). Another is in the form of component features (CF), such as the CF-1 in zone 1 with a resistance value of 0.07 in tidal creek 2 in 1990–1995 (Figure 3A). CF-1 contained reservoir, mariculture, salt marsh, and tidal flat landscape features (Figure 3A). In the case of the former, each landscape feature had a single resistance value, therefore we referred to them as independent features. By comparison, for the latter, as multiple landscape features had a single resistance value, we termed them composite features. According to the circuit theory, higher resistance values might arise from attributes of landscape features or the distribution of the landscape features (McRae, 2006). From this point, independent features might be more likely to reflect the influence of landscape feature attributes than the same landscape features with the same resistance value. In addition, composite features might be more likely to reflect the influence of the distribution of the landscape features, as distinct landscape features in them did not make the resistance values different.
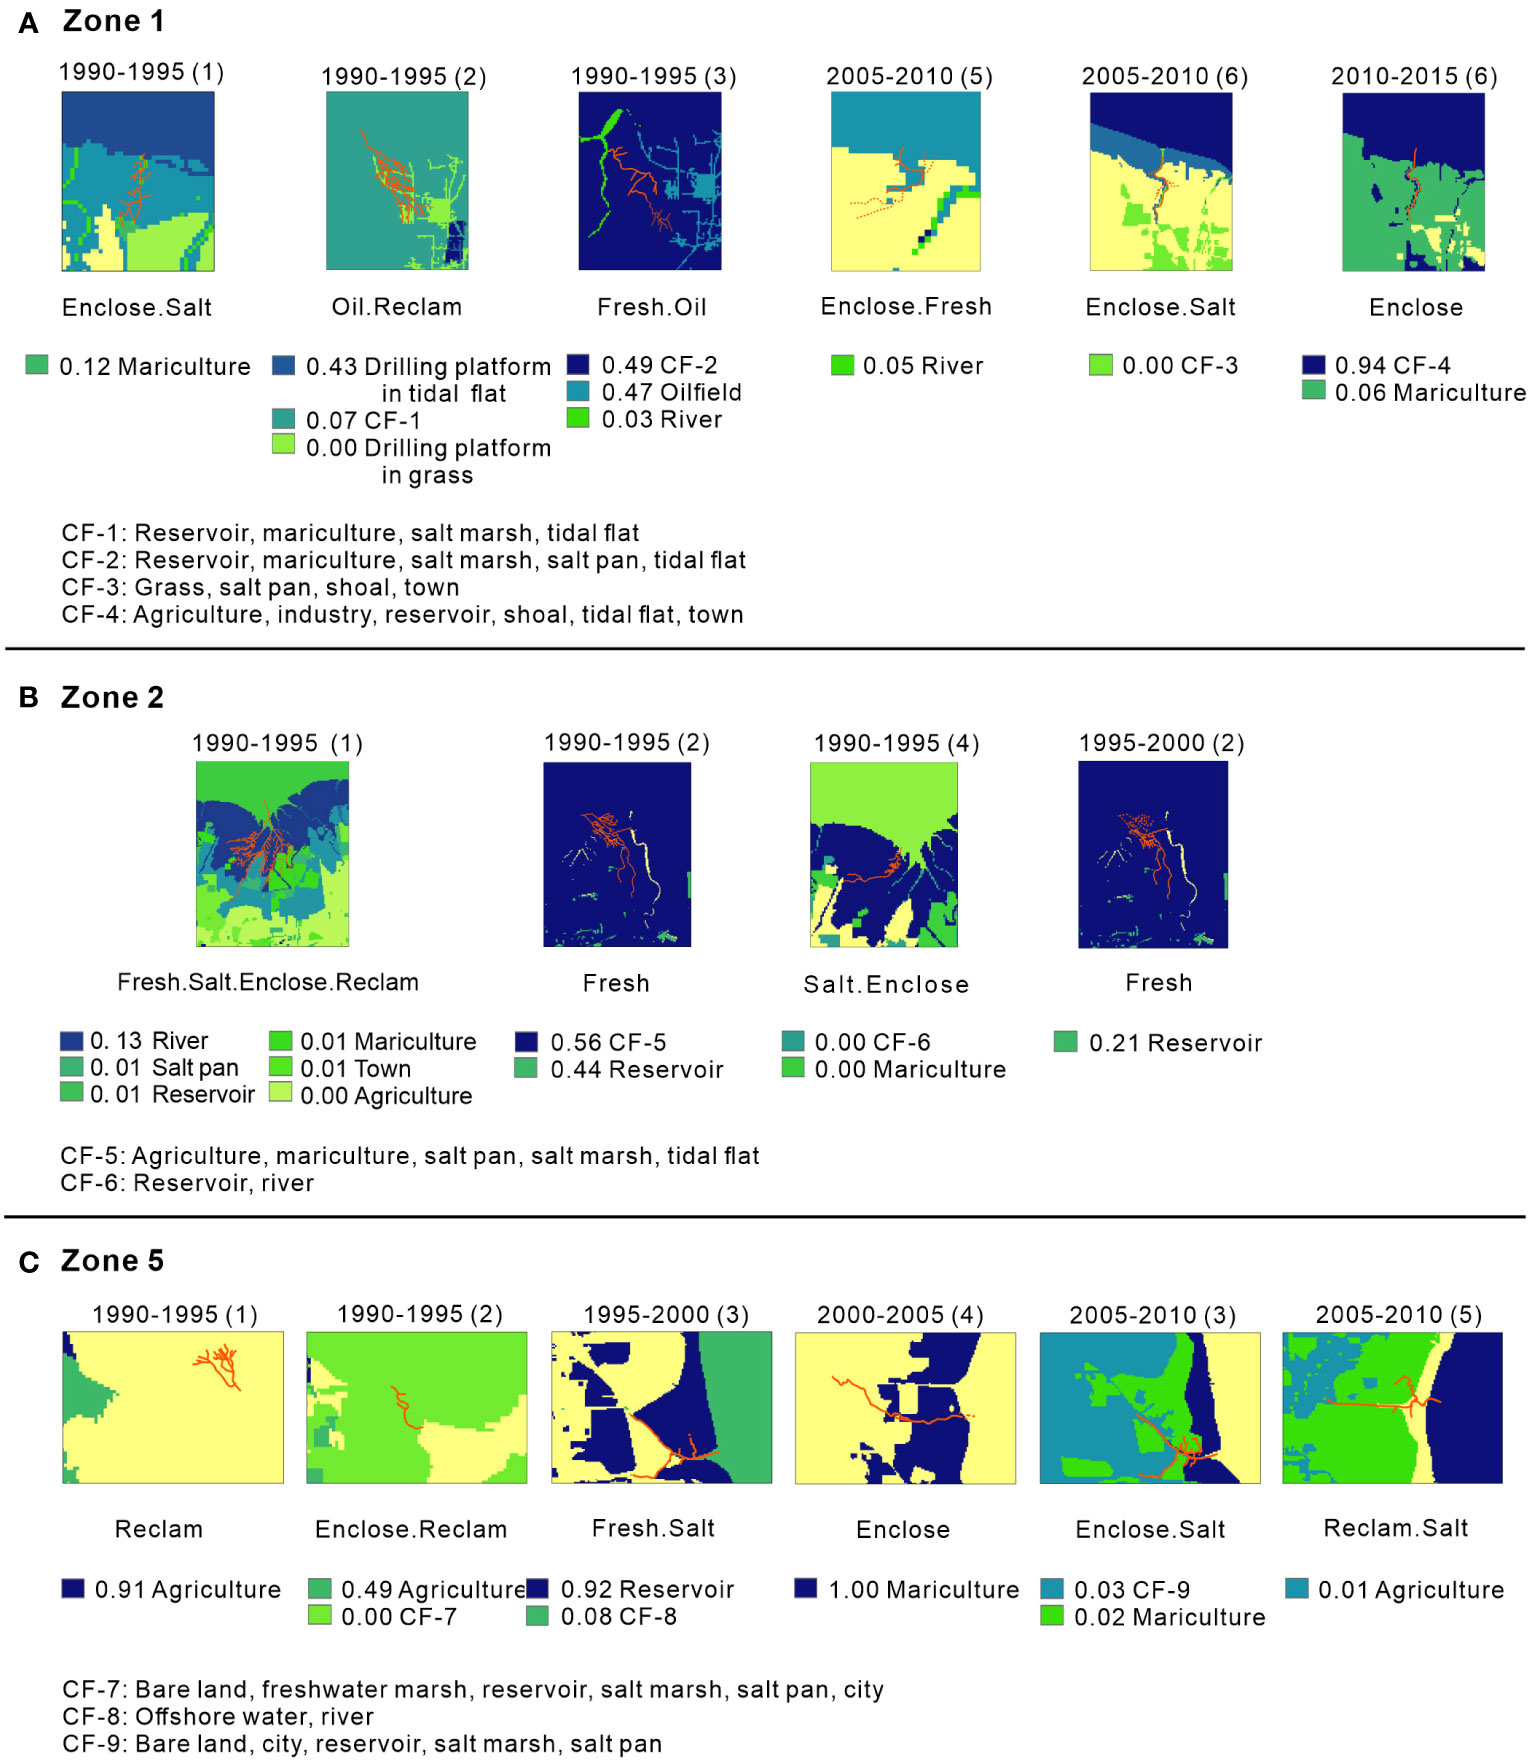
Figure 3 Spatial distribution of relative resistance values at resistance surfaces in zone 1(A), 2(B), and 5(C). The number in parentheses represents the serial number of each influenced tidal creek (creek ID). CF, composite feature.
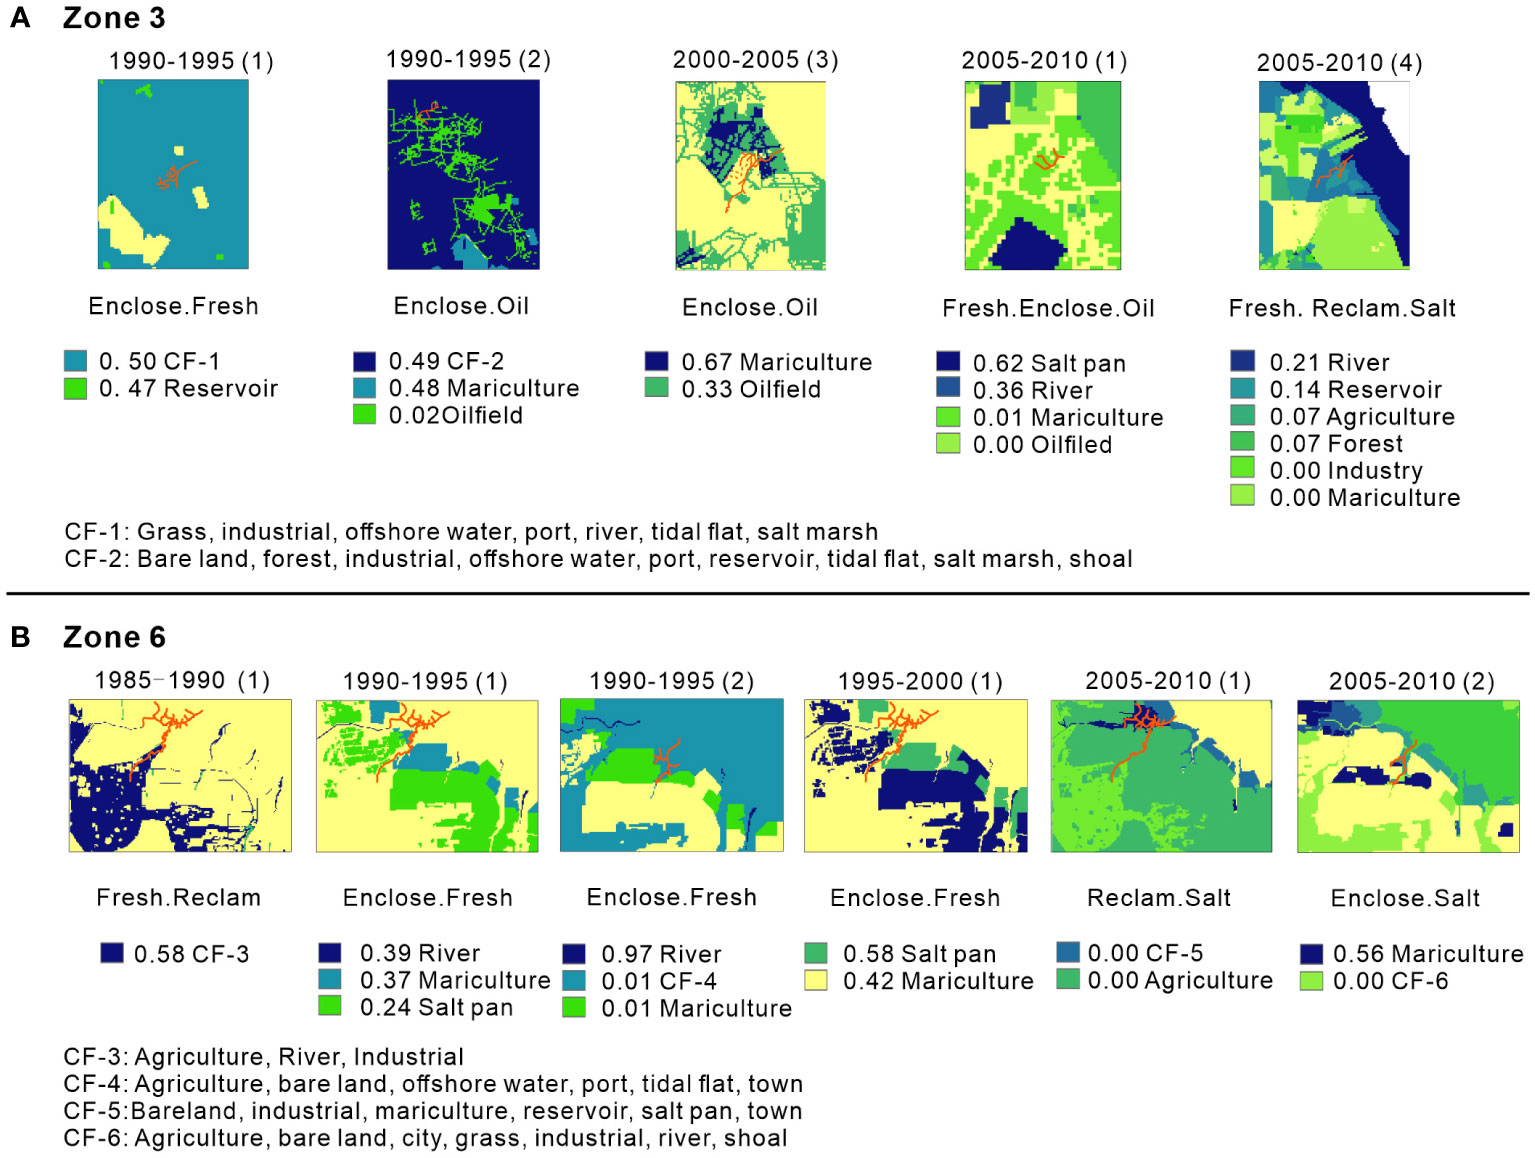
Figure 4 Spatial distribution of relative resistance values at resistance surfaces in zone 3(A) and 6(B). The number in parentheses represents the serial number of each influenced tidal creek (creek ID). CF, composite feature.
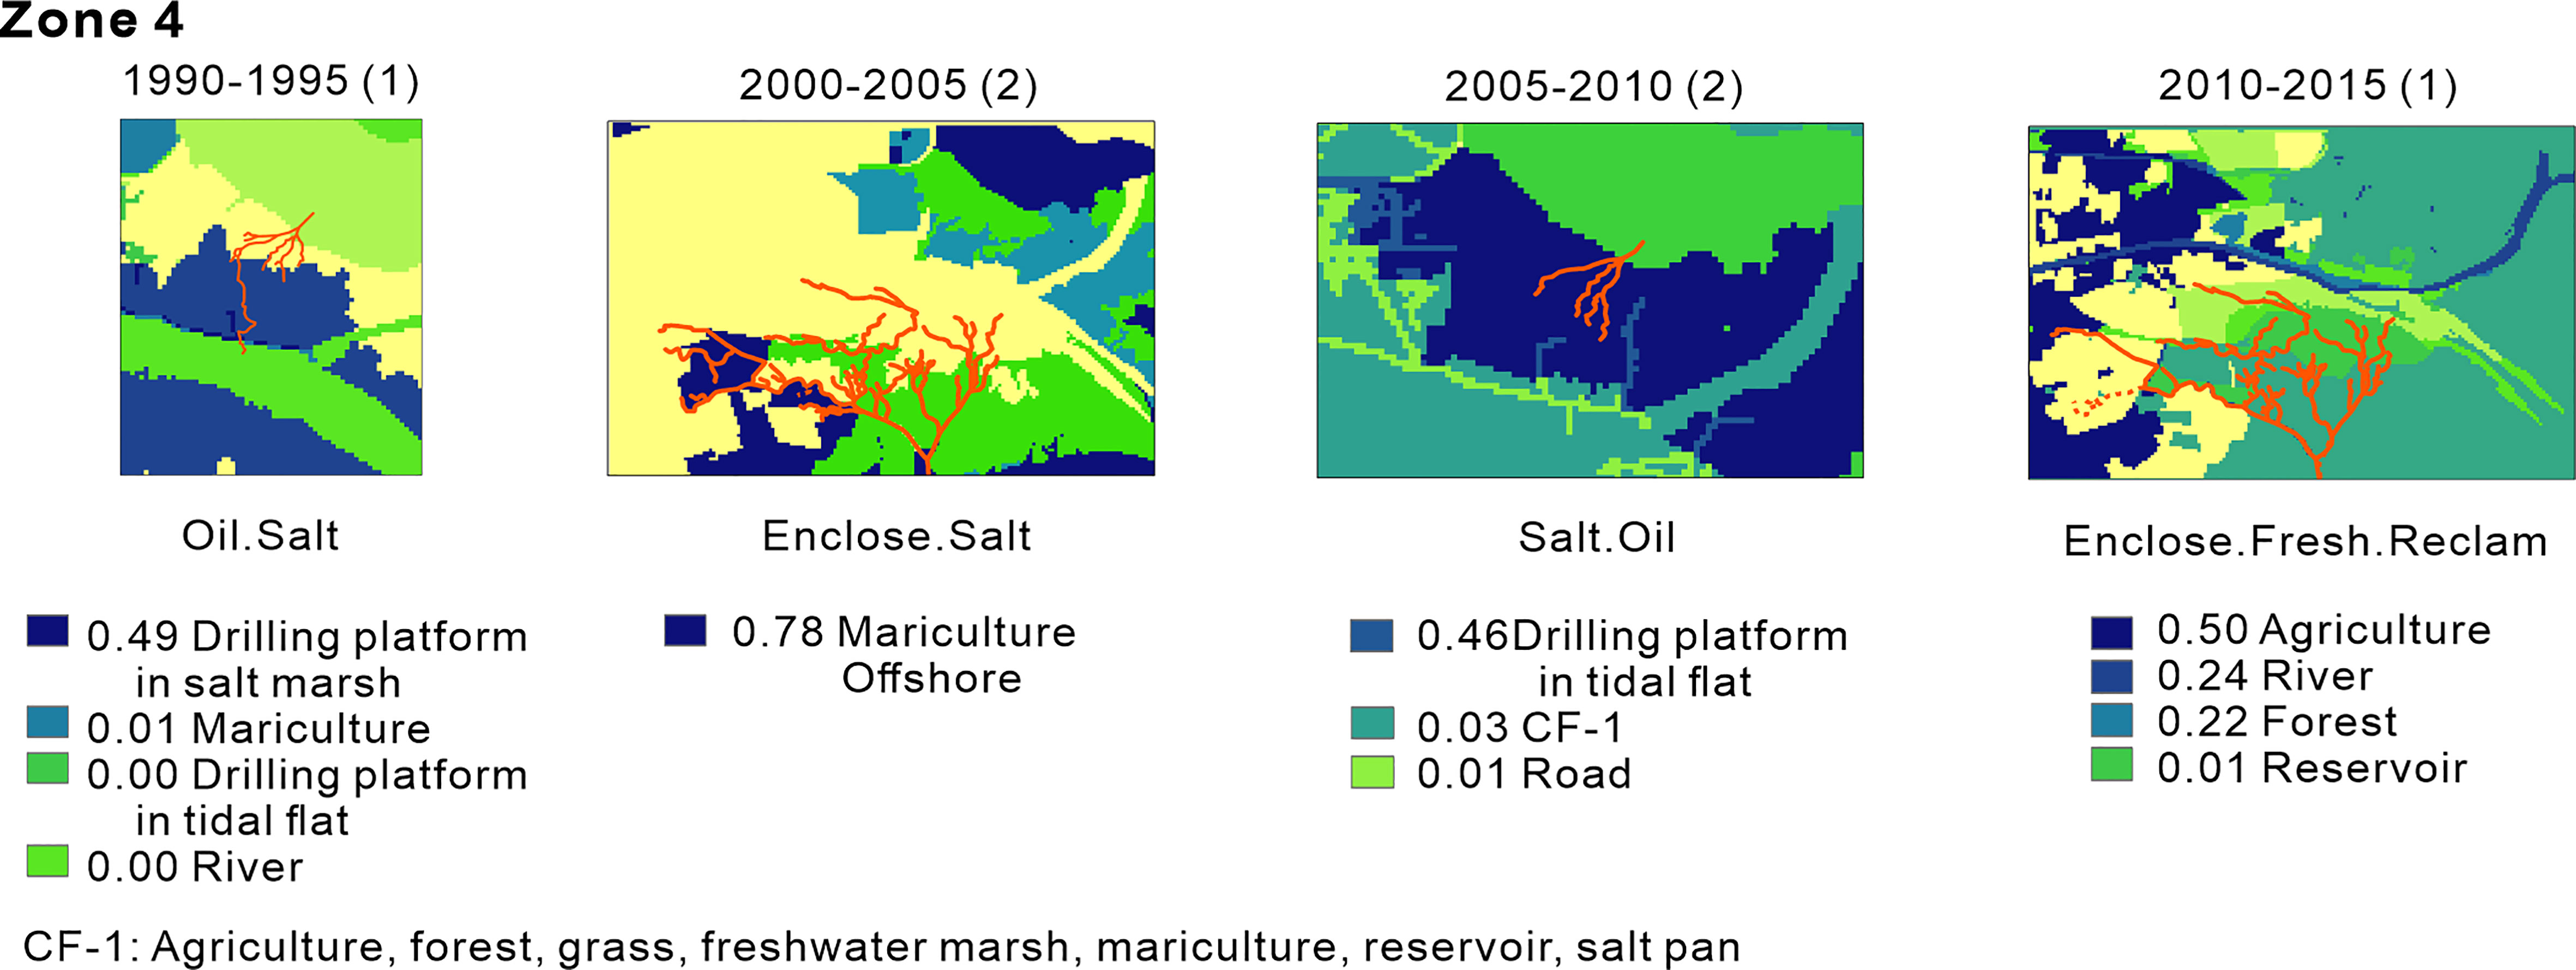
Figure 5 Spatial distribution of relative resistance values at resistance surfaces in zone 4. The number in parentheses represents the serial number of each influenced tidal creek (creek ID). CF, composite feature.
Agriculture (0.91), reservoir (0.92), and mariculture (1.00) in zone 5 were the independent feature types with the highest resistance values in zones 1, 2, and 5 (Figure 3, the initial stage of human activities) (Figure 3C). In zone 1, CF-4 (0.94) has the highest resistance value in composite features (Figure 3A). Other high values in resistance surface, both independent and composite features, are around or lower than 0.5. In zones 3 and 6 (Figure 4, the mature stage of human activities), the independent feature types with the greatest resistance values arise in the river (0.97) in zone 6 (Figure 4B) and mariculture (0.67) in zone 3. The highest resistance values in composite features were found in CF-3 (0.58) in zone 6 (Figure 4B) and CF-1 (0.50) in zone 3 (Figure 4A). Other high values in resistance surface, both independent and composite features, are around or less than 0.7. In zone 4 (Figure 5, reserve), the independent feature types with the highest resistance values appear in mariculture (0.78). Other high values on the resistance surface, primarily independent features, are less than 0.5. The results demonstrate that in regions with early phases of human activity, several specific features play key roles in the form of resistance, and they have an exceptionally high value. In comparison, the average value of landscape features was higher in places with mature stages of human activity than in areas with early stages of human activity.
3.3 Responses of tidal creek changes to resistance surface
The spatial distribution and their changes in the length of impacted tidal creeks by sea reclamation activities (influenced tidal creeks, for short) revealed that the tidal creeks in different zones had varied characteristics (Figure 6). Tidal creeks in zones 1 and 2 had the most lost edges, and their mean length was significantly longer than in other zones (Figure 6A). Tidal creeks in zone 4 had more edges that had changed length (increased or reduced) (Figure 6D). Tidal creeks in the other three zones all revealed a pattern of only one tidal creek changing significantly over a 5-year interval and other tidal creeks changing somewhat in edge number or edge length (Figures 6B, C, E, F).
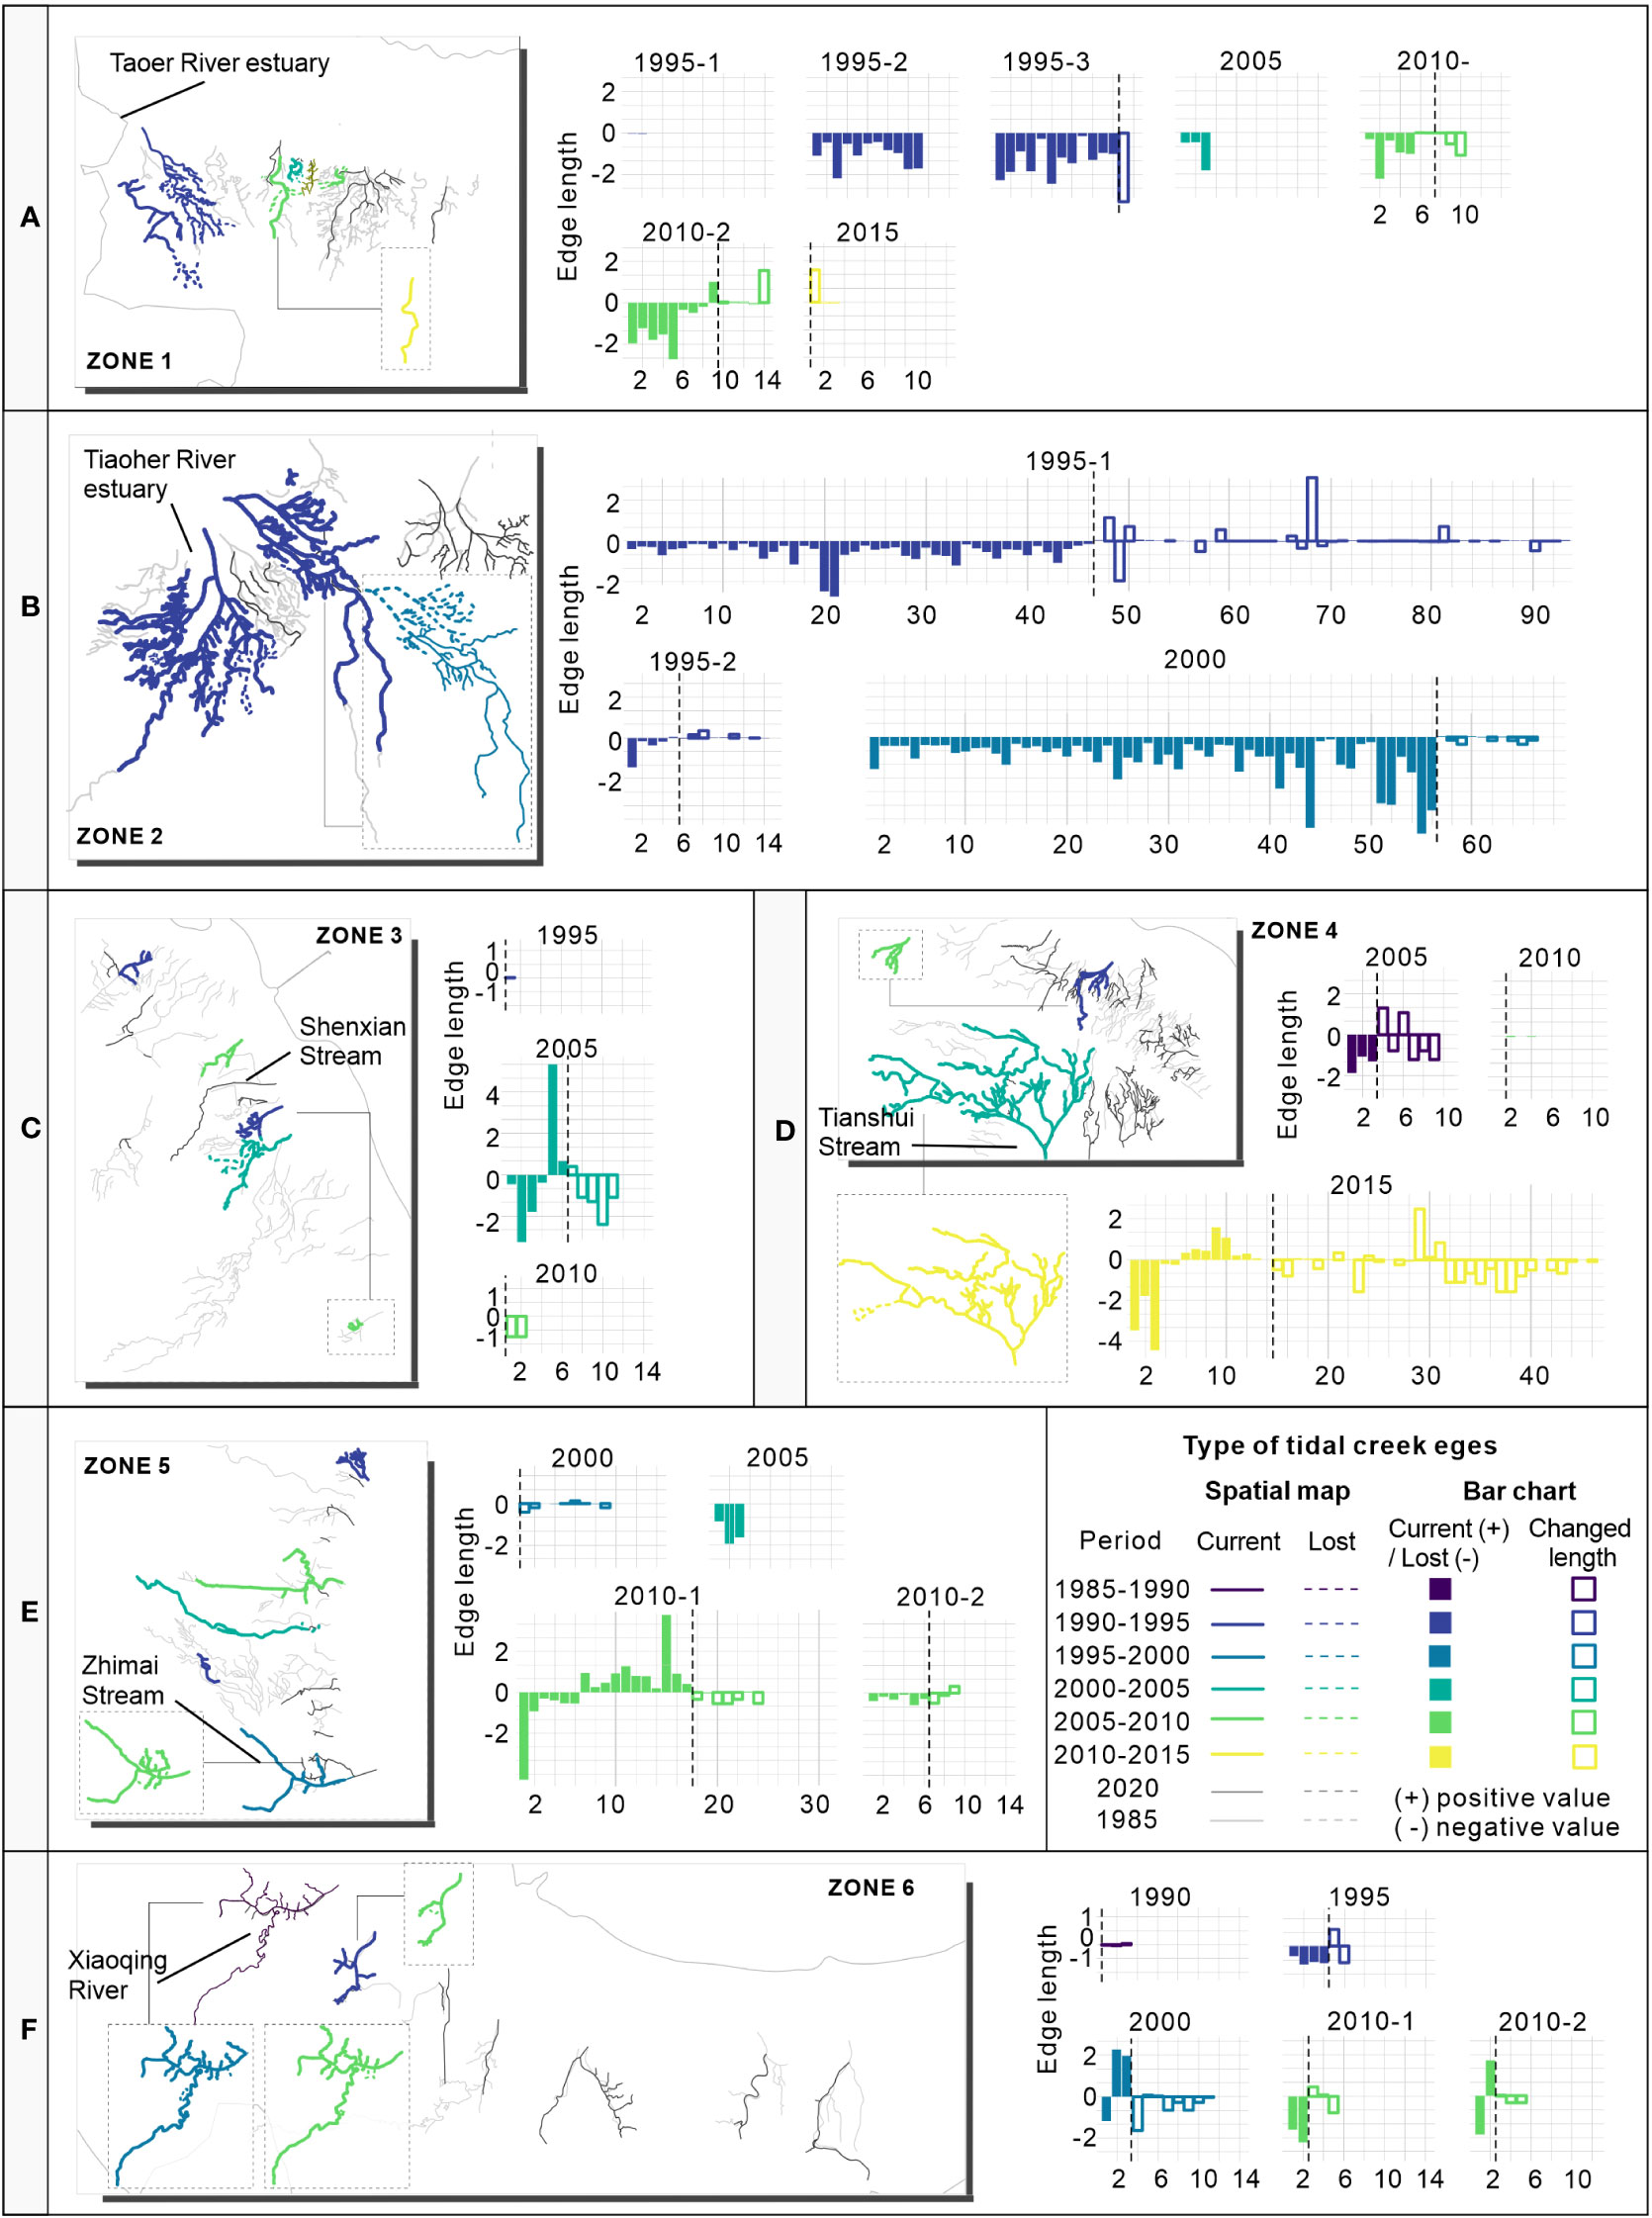
Figure 6 Spatial distribution of influenced tidal creeks in zone 1(A), zone 2(B), zone 3(C), zone 4(D), zone 5(E), and zone 6(F). Bar graphs of the edge length changes of the tidal creeks. The numbers in parentheses distinguish different tidal creeks of the same period.
Tidal creeks impacted by resistance surfaces (influenced tidal creeks, for short) were distributed across the Yellow River Delta near abandoned estuaries from the Yellow River’s previous course. The Yellow River has changed its course thousands of times due to accumulative landform (due to significantly more sediment and less water in the river), resulting in juxtaposed and imbricated deltaic lobes around the river mouths at different times (Zhang et al., 2018). The Taoer River estuary was the source of the most impacted tidal creeks in zone 1 from 1990 to 1995. Tidal creeks have formed in the Taoer River estuary since the Yellow River left. Because the Taoer River was one of the first routes that the Yellow River took to reach the sea (around 1904–1917), tidal creeks in the Taoer River estuary have developed for a long time. In zone 2, the Tiao River estuary had the greatest two impacted tidal creeks in the 1990–1995 and 1995–2000 periods (the Tiao River was the course that the Yellow River used to flow into the sea in 1917–1925). The three impacted tidal creeks in zone 3 were near the Stream Shenxian, which is the course that the Yellow River used to take into the sea in 1953–1960. The Stream Tianshui estuary in zone 4 had the most impacted tidal creek (the Stream Tianshui was the course that the Yellow River used to flow into the sea around 1934–1953). Another impacted tidal creek from the years 2000 to 2010 was in the Stream Qingshui estuary (the Stream Qingshui was the route that the Yellow River took to reach the sea from 1976 to 1996). Tidal creeks of the Zhimai River estuary were impacted in zone 5 (the Zhimai River was the course that the Yellow River used to flow into the sea in 1929).
4 Discussion
4.1 Resistance as a result of human activity and tidal flat evolution
Resistance to movement values provided a quantitative estimate of how landscape features or environmental parameters affect movement. “resistance” refers to an organism’s willingness, costs, or friction when traveling or moving on a surface (McRae, 2006; Zeller et al., 2012). Resistance is utilized in this study to represent the degree to which sea reclamation activities impede or promote water flow movement. The resistance surfaces of various tidal creeks with more than one impacted period varied at different periods. This finding was related to the rate of development of the YRD in the most recent 30 years. Specifically, mariculture activities in zones 1, 2, and 5 (in Zhanhua, Hekou District, and Dongying District) began in the mid-1980s, and generally obtained better yield and expanded the active area in the mid of 1990s after experiencing some technical difficulties and mariculture management measure adjustments (Committee, 2002; Committee, 2008; Committee, 2010). Consequently, mariculture has not yet become a resistance surface in these zones over the periods of 1985–1990 and 1990–1995. During that time, freshwater resource facilities served as resistance surfaces. Storm surges began to harm people and property more regularly as mariculture began to thrive in the tidal flats. When large-scale mariculture activities began after 1995, dikes and hydraulic engineering along the mainstream and near the estuaries of the rivers were built to higher engineering standards (Committee, 2010). As a result, alterations in tidal creeks may occur at the start of resource-use activities. In other words, resource utilization activities may serve as driving forces for the creation of resistance surfaces.
The spatial distribution of influenced tidal creeks exhibited a pattern related to tidal creek evolution. In the first five zones, the impacted tidal creeks, which were generally large-scale tidal creeks, were distributed near estuaries along previous courses of the Yellow River (Figure 6). Taking zone 1 as an example, as far from the Yellow River’s current estuary (the Stream Qingshui estuary in zone 4), it has been affected only minimally by sediment from the recent course of the Yellow River, and the coastline in this area has changed slowly. As a relatively stable condition for tidal creek development, tidal creeks were thus extremely developed before 1985, when dike constructions began (Huang and Fan, 2004). Similarly, for zones 2 and 5, tidal creeks began developing when human activity began (Committee, 2002; Committee, 2008). The existence of increased and newly developed edges also revealed that many influenced tidal creeks were still developing. Thus, the formation of resistance was not only due to human activity but also the natural evolution of tidal creeks was an important aspect in the early stages of resistance formation.
4.2 Management implications
The results of different resistance values of human activities influencing hydrological connectivity revealed that the same type of human activity could have different influences at different times and spaces. The resistance value depended on the intensity of the human activity itself, for example, the area of sea reclamation activities. During approved sea reclamation activities in the YRD, strict classification has been made to regulate different human activities (Zhou, 2017; Liu, 2020). For example, in Shandong province, for reclamation projects that change the property of the sea completely, such as port and dike, projects with areas between 60 and 100 hm2 should be applied to provincial government agencies (Administration, 2008). By comparison, projects that did not change the property of the sea with areas between 500 and 700 hm2, such as bathing beaches, should be applied to the provincial government (Administration, 2008). However, the classification for each project was only based on the properties of each human activity. Although the impacts of sea reclamation activities on ecosystems have been assigned to environmental impact assessment the environmental impact assessments for reclamation activity projects have considered the impacts on the environment in aspects of hydrodynamic, water quality, landforms, oceanic sediment, and so on, it does not take hydrological connectivity of tidal creeks into consideration in the indexes. More comprehensive regulatory approval steps may be needed to take the impacts of the project on spatially explicit tidal creek connectivity into the evaluation system to classify projects, rather than the current criteria that only focused on project attributes. One of the suggested ways could be that resistance values related to tidal creek connectivity could first be calculated for each land use zone in the planning stage, which could make into a single resistance map. In the steps to check the location of the project in the planning map, the resistance zone of the project could be identified according to its location. Thus, the attributes to classify projects could include project types, area, as well as its resistance value.
The relationship between tidal flat evolution and resistance surface development revealed that there were several previous estuaries with the potential to develop large-scale tidal flats and become stopover hotspots along shorebirds’ migratory routes. However, the government of these estuaries has not utilized the ecological value of tidal flats to both benefit local government and regional ecological safeguards. Instead, all the governments of the estuaries focused on resource development activities, for example, mariculture activities, to increase fiscal revenue. By comparison, in zone 4, as large-scale tidal flat and coastal salt marsh ecosystems are well preserved, developing tourism is chosen by the local government, which has also proved to be a good way to both increase fiscal revenue and maintain the ecosystem’s benefits. Thus, a good understanding of the potential of resources within the jurisdictional zones is necessary for local governments in the YRD to choose the best way for sustainable development. This required systematic monitoring of the ecosystems and sufficient conservation awareness. Although human activity has caused the most tidal flat loss, except for that in the National Reserve of the Yellow River Delta (Shi et al., 2016; Chen et al., 2019), local areas with developing tidal creeks still exist, including, for example, the Zhimai River estuary. Despite the fewer areas for conservation in regions such as the YRD, which has severe human activity, attention could also be paid to restoration, for example, returning mariculture to tidal flats (Zhang, 2022). According to the potential tidal and hydrodynamic conditions, further tidal flat development may also exist in some areas.
5 Conclusion
Sea reclamation activities have had strong impacts on tidal creeks. The method we used in this study provided a quantified analysis to assess the impacts of human activities on tidal creeks over a 5-year time scale. In the YRD, the periods of 1990–1995 and 2000–2005 had the greatest number of tidal creeks influenced by resistance surfaces. Most resistance surfaces were composite, the majority of which contained two surfaces. Resistance surfaces of sea enclosure activity, freshwater resource facilities, and engineering in oil fields played a major role in creating resistance surfaces. In areas at the initial development stage, the highest resistance values appeared in mariculture (1.00), reservoir (0.92), and agriculture (0.91). In areas at mature development stages, the highest resistance values appeared in the river (0.97) and mariculture (0.67). Therefore, in the natural resource governance in coastal zones, the plans for reclamation activity, particularly for mariculture, should make sure that their locations have no conflict with tidal creeks. As the formation of resistance was from both human activities and the natural evolution of tidal creeks, it is necessary to take the conditions of tidal creek development into consideration in the planning. Also, for the tidal creek that is in developing conditions, a resource utilization pattern that can benefit both economics and ecology is advised. To achieve this goal, a comprehensive understanding of resources in tidal flats is needed, which requires systematic monitoring and sufficient conservation awareness.
Data availability statement
The original contributions presented in the study are included in the article/supplementary material. Further inquiries can be directed to the corresponding authors.
Author contributions
YM and BC designed the research. YM and FZ collected the data. YM analyzed the data and drafted the manuscript. QW reviewed the manuscript. All authors contributed to the manuscript drafts. All authors contributed to the article and approved the submitted version
Funding
The study was supported financially by the Key Project of the National Natural Science Foundation of China (U2243208), the National Natural Science Foundation of China (52271256), the National Science Foundation for Young Scientists of China (42107057), and the National Postdoctoral Program for Innovative Talents (BX20220040).
Conflict of interest
Author FZ was employed by the company China Construction Eco-Environmental Group Co. Ltd.
The remaining authors declare that the research was conducted in the absence of any commercial or financial relationships that could be construed as a potential conflict of interest.
Publisher’s note
All claims expressed in this article are solely those of the authors and do not necessarily represent those of their affiliated organizations, or those of the publisher, the editors and the reviewers. Any product that may be evaluated in this article, or claim that may be made by its manufacturer, is not guaranteed or endorsed by the publisher.
References
Administration (2008). Interim measures of shandong province for the administration of examination and approval of applications for the use of sea areas. Jinan, Shandong Provincial People’s Government.
Bilkovic D. M. (2011). Response of tidal creek fish communities to dredging and coastal development pressures in a shallow-water estuary. Estuar. Coast. 34, 129–147. doi: 10.1007/s12237-010-9334-x
Boynton W. R., Hodgkins C., O Leary C. A., Bailey E. M., Bayard A. R., Wainger L. A. (2014). Multi-decade responses of a tidal creek system to nutrient load reductions: mattawoman creek, Maryland USA. Estuar. Coast. 37, 111–127. doi: 10.1007/s12237-013-9690-4
Buzzelli C. (2008). Development and application of tidal creek ecosystem models. Ecol. Model. 210, 127–143. doi: 10.1016/j.ecolmodel.2007.07.011
Chen Y., Dong J., Xiao X., Ma Z., Tan K., Melville D., et al. (2019). Effects of reclamation and natural changes on coastal wetlands bordering china's yellow Sea from 1984 to 2015. Land Degrad. Dev. 30, 1533–1544. doi: 10.1002/ldr.3322
Chen Y., Fa Z., Li B., Zhao B. (2013a). Quantitative analysis of the development characteristics and influencing factors of tidal creeks in East chongming beach. J. Jilin Univ. (Earth Sci. Edition) 43, 212–219. doi: 10.13278/j.cnki.jjuese.2013.01.028
Chen L., Han Z. (2015). Study of the influence of the deep-water channel project in the Yangtze river estuary on ecological landscape and fractal dimensions of jiuduan shoal tidal channels. J. Coast. Res. 73, 146–154. doi: 10.2112/SI73-026.1
Chen Y., He Z., Li B., Zhao B. (2013b). Spatial distribution of tidal creeks and quantitative analysis of its driving factors in chongming dongtan,shanghai. J. Jilin University. Earth Sci. Edition. 43, 212–219. doi: 10.13278/j.cnki.jjuese.2013.01.028
Darrow E. S., Carmichael R. H., Calci K. R., Burkhardt W. III (2017). Land-use related changes to sedimentary organic matter in tidal creeks of the northern gulf of Mexico. Limnol. Oceanogr. 62, 686–705. doi: 10.1002/lno.10453
DiDonato G. T., Stewart J. R., Sanger D. M., Robinson B. J., Thompson B. C., Holland A. F., et al. (2009). Effects of changing land use on the microbial water quality of tidal creeks. Mar. pollut. Bull. 58, 97–106. doi: 10.1016/j.marpolbul.2008.08.019
Fan Y., Chen S., Zhao B., Yu S., Ji H., Jiang C. (2018). Monitoring tidal flat dynamics affected by human activities along an eroded coast in the yellow river delta, China. Environ. Monit. Assess. 190, 396. doi: 10.1007/s10661-018-6747-7
Fan X., Huang H., Zhang Q., Sun N., Wang Y. (2021). Response of tidal creek networks and tidal connectivity to coastal squeeze of saltmarshes in the southern bohai bay. New Zeal. J. Mar. Fresh. 56, 617–631. doi: 10.1080/00288330.2021.1917632
Ganio L. M., Torgersen C. E., Gresswell R. E. (2005). A geostatistical approach for describing spatial pattern in stream networks. Front. Ecol. Environ. 3, 138–144. doi: 10.1890/1540-9295(2005)003[0138:agafds]2.0.co;2
Holland A. F., Sanger D. M., Gawle C. P., Lerberg S. B., Santiago M. S., Riekerk G., et al. (2004). Linkages between tidal creek ecosystems and the landscape and demographic attributes of their watersheds. J. Exp. Mar. Biol. Ecol. 298, 151–178. doi: 10.1016/S0022-0981(03)00357-5
Huang H., Fan H. (2004). Spatial-temporal changes of tidal flats in the huanghe river delta using landsat TM/ETM+ images. J. Geogr. Sci. 14, 365–374. doi: 10.11821/xb200405010
Lerberg S. B., Holland A. F., Sanger D. M. (2000). Responses of tidal creek macrobenthic communities to the effects of watershed development. Estuaries 23, 838–853. doi: 10.2307/1353001
Li Q., Ma C., Lu W., Tian W., Zhao Y. (2012). The effect of reclamation on community structure of macro-meso zooplankton in tidal creeks of the chongming dongtan. J. Fudan University. Natural Sci. 51, 515–522. doi: 10.15943/j.cnki.fdxb-jns.2012.04.018
Liu F. (2020). Study on the use and management of sea areas in zhanhua district of binzhou city (Changsha (HN: Hunan Agricultural University).
McRae B. H. (2006). Isolation by resistance. Evolution 60, 1551–1561. doi: 10.1111/j.0014-3820.2006.tb00500.x
Nelson N. G., Munoz-Carpena R., Neale P. J., Tzortziou M., Megonigal J. P. (2017). Temporal variability in the importance of hydrological, biotic, and climatic descriptors of dissolved oxygen dynamics in a shallow tidal-marsh creek. Water Resour. Res. 53, 7103–7120. doi: 10.1002/2016WR020196
Peterman W. E. (2018). ResistanceGA: an r package for the optimization of resistance surfaces using genetic algorithms. Methods Ecol. Evol. 9, 1638–1647. doi: 10.1111/2041-210X.12984
Peterson E., Ver Hoef J. (2014). STARS: an ArcGIS toolset used to calculate the spatial information needed to fit spatial statistical models to stream network data. J. Stat. Software 56, 1–17. doi: 10.18637/jss.v056.i02
Sanger D., Blair A., DiDonato G., Washburn T., Jones S., Riekerk G., et al. (2015). Impacts of coastal development on the ecology of tidal creek ecosystems of the US southeast including consequences to humans. Estuar. Coast. 38, 49–66. doi: 10.1007/s12237-013-9635-y
Sanger D. M., Holland A. F., Hernandez D. L. (2004). Evaluation of the impacts of dock structures and land use on tidal creek ecosystems in south Carolina estuarine environments. Environ. Manage. 33, 385–400. doi: 10.1007/s00267-003-0019-0
Shi H., Shen Y., Kang M. (2016). Rapid response of tidal creek network patterns to the reclamation on the central jiangsu coast. Acta Oceanol. Sin. 38, 106–115. doi: 10.3969/j.issn.0253-4193.2016.01.010
Song H. (2015). Influence of reclamation activities on ecosystem type and carbon sink function of the coastal wetland in the yellow river estuary. [Doctor of philosophy] (Changchun (JL: Chinese Academy of Sciences).
Spear S. F., Balkenhol N., Fortin M. E. E., McRae B. H., Scribner K. (2010). Use of resistance surfaces for landscape genetic studies: considerations for parameterization and analysis. Mol. Ecol. 19, 3576–3591. doi: 10.1111/j.1365-294x.2010.04657.x
Tessler Z. D., Voeroesmarty C. J., Grossberg M., Gladkova I., Aizenman H., Syvitski J. P. M., et al. (2015). Profiling risk and sustainability in coastal deltas of the world. Science 349, 638–643. doi: 10.1126/science.aab3574
United States Geological Survey Earth explorer. Available at: https://earthexplorer.usgs.gov (Accessed March 23, 2022).
Ver Hoef J., Peterson E., Clifford D., Shah R. (2014). SSN: an r package for spatial statistical modeling on stream networks. J. Stat. Software 56, 1–45. doi: 10.18637/jss.v056.i03
Ver Hoef J. M., Peterson E., Theobald D. (2006). Spatial statistical models that use flow and stream distance. Environ. Ecol. Stat. 13, 449–464. doi: 10.1007/s10651-006-0022-8
Wang Q., Wang X., Li X., Wang X., Zhan C. (2017). Grain size characteristics and coarsening phenomenon of inter-tidal flat surficial sediment along the abandoned southern yellow river Sub-delta. Quaternary Sci. 37, 353–367. doi: 10.11928/j.issn.1001-7410.2017.02.13
Wang Q., Xie T., Ning Z., Chen C., Man Y., Cui B. (2021). Enhancement of lateral connectivity promotes the establishment of plants in saltmarshes. Sci. Total Environ. 767, 145484. doi: 10.1016/j.scitotenv.2021.145484
Washburn T., Sanger D. (2011). Land use effects on macrobenthic communities in southeastern united states tidal creeks. Environ. Monit. Assess. 180, 177–188. doi: 10.1007/s10661-010-1780-1
Weikang S., Xinghua Z., Yikai F., Yanguang F. (2018). Temporal and spatial characteristics of coastal tides in Shandong province. J. Ocean Technol. 37, 68–75. doi: 10.3969/j.issn.1003-2029.2018.04.011
Wessel M. R., Leverone J. R., Beck M. W., Sherwood E. T., Hecker J., West S., et al. (2021). Developing a water quality assessment framework for southwest florida tidal creeks. Estuar. Coast. 552, 1–21. doi: 10.1007/s12237-021-00974-7
Wu Y., Liu J., Yan G., Zhai J., Cong L., Dai L., et al. (2020). The size and distribution of tidal creeks affects salt marsh restoration. J. Environ. Manage. 259, 110070. doi: 10.1016/j.jenvman.2020.110070
Xie C., Cui B., Xie T., Yu S., Liu Z., Wang Q., et al. (2020). Reclamation shifts the evolutionary paradigms of tidal channel networks in the yellow river delta, China. Sci. Total Environ. 742, 140585. doi: 10.1016/j.scitotenv.2020.140585
Xie W., He Q., Wang X., Guo L., Guo C. (2017). Hydrodynamic process and sediment transport in a tidal creek system over the easten chongming Island,Yangtze estuary. Acta Oceanol. Sin. 39, 80–91. doi: 10.3969/j.issn.0253-4193.2017.07.008
Yang Z., Shenliang C., Guochuan G. (2015). Spatial extent and tidal characteristics of the diurnal tidal zone along the yellow river delta coast. Chin. J. Hydrodynamics. 30, 540–548. doi: 10.16076/j.cnki.cjhd.2015.05.008
Zeller K. A., McGarigal K., Whiteley A. R. (2012). Estimating landscape resistance to movement: a review. Landscape Ecol. 27, 777–797. doi: 10.1007/s10980-012-9737-0
Zhang H. (2022). Effects of wetland restoration on the spatial distribution of nests,nesting microhabitat and egg camouflage of shorebirds in liaohekou estuarine wetland (Shenyang (LN: Liaoning University).
Zhang X., Lu Z., Jiang S., Chi W., Zhu L., Wang H., et al. (2018). The progradation and retrogradation of two newborn huanghe (Yellow river) delta lobes and its influencing factors. Mar. Geol. 400, 38–48. doi: 10.1016/j.margeo.2018.03.006
Zhou C. (2017). Sea Areas management problem study under the new situation —–illustrated by the case of wenzhou (Nanchang (JX: Jiangxi Agricultural University).
Keywords: tidal creek, hydrological connectivity, resistance surface, coastal wetland, reclamation activities
Citation: Man Y, Zhou F, Wang Q and Cui B (2023) Quantitative evaluation of sea reclamation activities on tidal creek connectivity. Front. Mar. Sci. 10:1164065. doi: 10.3389/fmars.2023.1164065
Received: 12 February 2023; Accepted: 24 April 2023;
Published: 09 May 2023.
Edited by:
Laibin Huang, University of California, Davis, United StatesReviewed by:
Jiakai Liu, Beijing Forestry University, ChinaWeiqing Meng, Tianjin Normal University, China
Copyright © 2023 Man, Zhou, Wang and Cui. This is an open-access article distributed under the terms of the Creative Commons Attribution License (CC BY). The use, distribution or reproduction in other forums is permitted, provided the original author(s) and the copyright owner(s) are credited and that the original publication in this journal is cited, in accordance with accepted academic practice. No use, distribution or reproduction is permitted which does not comply with these terms.
*Correspondence: Qing Wang, wq@bnu.edu.cn; Baoshan Cui, cuibs@bnu.edu.cn