Seasonal and vertical variations of nutrient cycling in the world’s deepest blue hole
 Lin Chen
 Peng Yao
 Zuosheng Yang
 Liang Fu4
- 1Frontiers Science Center for Deep Ocean Multispheres and Earth System, and Key Laboratory of Marine Chemistry Theory and Technology, Ministry of Education, Ocean University of China, Qingdao, China
- 2Laboratory for Marine Ecology and Environmental Science, Qingdao National Laboratory for Marine Science and Technology, Qingdao, China
- 3College of Marine Geosciences, Ocean University of China, Qingdao, China
- 4Sansha Track Ocean Coral Reef Conservation Research Institute, Sansha, China
Nutrient cycling in anoxic seawaters is essential to marine ecosystem health and sustainability, yet it remains poorly understood. In this work, we analyzed dissolved inorganic nutrients as well as hydrochemical parameters in the Yongle Blue Hole (YBH) of the South China Sea in October 2019, which is the world’s deepest blue hole and is characterized by anoxia below the depth of 100 m. Nutrient data collected in two sampling campaigns in 2017 were also incorporated to examine the seasonal and vertical variations of nutrient cycling across steep redox gradients in the YBH. In response to the changes in redox conditions in different seasons, nutrients in the YBH showed significant seasonal variations. The nitrate maximum rose from a depth of 90 m in March 2017 to 60-80 m in October 2019, while the primary nitrite maximum concentration decreased from 0.5 μmol/L to 0.1 μmol/L. In October 2019, the nitrite decreased to below the detection limit at about 100 m, while in March 2017, it was 140 m. The regeneration of phosphate and silicate both started from around 40 m in October 2019 and from 80 m in March 2017. Silicate shows non-conservative adding behaviors relative to phosphate and DIN, and phosphate shows a similar but weaker adding behavior relative to DIN. The nutrient ratios also varied seasonally, especially for N/P, which fluctuated greatly on the surface at 80 m, while Si/N and Si/P fluctuated above 50 m. At the oxic-anoxic interface, extreme values of nutrient ratios were observed, and below 150 m, the N/P, Si/N, and Si/P were kept constant at about 17, 1.5, and 26, respectively. Seasonal and vertical variations of nutrient concentrations and ratios in the YBH reflect the impact of redox conditions on nutrient cycling in anoxic seawaters, especially during the transition from oxic to anoxic zone. And the high-resolution distributions of nutrients and hydrochemical parameters are helpful to better understand the nutrient cycling processes in highly dynamic coastal environments that are suffering deoxygenation.
Introduction
Nutrients are the basis of primary production in the ocean, and their concentrations, structures, and distributions in seawater are directly related to biogeochemical processes in marine ecosystems (Doney et al., 2012; Hutchins and Capone, 2022). For example, nutrients can be utilized by different types of algae in water columns, and the microbial decomposition of organic matter produced by these algae may promote the regeneration of nutrients (Falkowski and Woodhead, 2013). During these processes, nutrients, especially nitrogen-containing nutrients, undergo complex transformations of forms in concert with the changes in reduction-oxidation (redox) conditions, because different nitrogen cycling processes have different oxygen requirements (Gruber, 2008). As a result, the redox conditions of water columns can be deduced to a certain extent from the concentrations and distributions of nutrients. Investigating the regeneration and transformation of nutrients during redox transitions is important to better understand the controls on nutrient biogeochemistry in seawaters, especially under the context of global oceanic deoxygenation.
There are many typical low-oxygen or anoxic marine environments in the world, of which marine blue holes are unique geomorphological features of modern reef systems that are characterized by steep redox and biogeochemical gradients, which can provide valuable information regarding karst processes, marine ecology, climate change, and paleoclimate (Bishop et al., 2015; Xie et al., 2019; Yao et al., 2020). The Sansha Yongle Blue Hole (YBH) in the South China Sea (SCS) is the deepest known marine blue hole in the world (Bi et al., 2018). It has a depth of 300 m, and the water column below 100 m is in a hypoxic or anoxic state, making it an excellent natural laboratory for studying the biogeochemical processes of nutrients during oxic-anoxic transitions (Yao et al., 2018). A few nutrient cycling studies have been carried out in the YBH previously. For example, Yao et al. (2018) collected water samples from the YBH in March 2017, analyzed dissolved inorganic nutrients in those samples, and studied the controls on vertical distributions of nutrients in the YBH. They found that in March 2017, the YBH water column was characterized by well-defined physical and chemical gradients with sharp transitions occurring at 80 m depth, and the water column changed from oxic to anoxic at 100 m depth. Nitrate and nitrite varied dramatically in the oxic layer, and ammonium accumulated in the anoxic layer (Yao et al., 2018). On the contrary, phosphate, and silicate started to accumulate after a sharp decrease of dissolved oxygen (DO) at 80 m depth. All nutrients showed relatively constant distributions below 160 m depth. Two months later, Xie et al. (2019) also collected samples from the YBH and analyzed nutrients and other hydrochemical properties. Similarly, the water column was divided into three layers: an oxic layer in the top 70 m, a chemocline at 70-100 m, and an anoxic layer below 100 m in May 2017. They found that in the oxic layer, organic matter (OM) degradation and nitrification led to the accumulation of nitrate, but within the chemocline, nitrate was depleted by the denitrification process. Within the deep anoxic layer, sulfate reduction and OM degradation resulted in accumulations of ammonium, phosphate, and silicate (Xie et al., 2019). These two studies provide preliminary knowledge about nutrient cycling and processes in the YBH. However, seasonal variations of nutrient cycling in the YBH remain poorly understood. As a semienclosed environment, the intensity of water exchange of the YBH, especially in the upper oxic layer can be influenced by tides, winds, and seasonal variations of temperature and salinity. As a result, the distributions of DO in the water column may vary among seasons, affecting the microbial composition and redox reactions and thus nutrient cycling processes.
In this study, we analyzed dissolved inorganic nutrients, including nitrate (NO3-), nitrite (NO2-) and ammonium (NH4+), phosphate (PO43-), and silicate (SiO32-), as well as hydrochemical properties, such as temperature, salinity, DO, sulfide and chlorophyll a (Chl a) in water samples collected in October 2019 in the YBH. Compared with previous work, this is the first report of such data in the autumn season. The overarching objective of this work is to build on previous studies and illuminate the seasonal and vertical variations of nutrient concentrations, distributions, and structural characteristics during oxic-anoxic transitions in the YBH, and to better understand the impacts of the changing redox conditions on the biogeochemical processes of nutrients in deoxygenated seawaters.
Materials and methods
Study area and sample collection
The YBH is located on the Yongle Atoll of the western Paracel Islands (Xisha Qundao) in the SCS (111.768° N, 16.525° E) (Figure 1). It is shaped like a ballerina’s shoe, with a bottom that deviates 118 m laterally from the entrance, and the twisted structure is located between 90 and 158 meters (Figure 1) (Li et al., 2018). The sidewall of the YBH is composed of a modern coral reef above ca. 17 m, and hard limestone below that depth (Yao et al., 2020). Since the YBH is located far offshore, meteoric freshwater inputs are relatively minimal, resulting in a salinity profile not characterized by a surface freshwater lens (Bi et al., 2018), unlike many other blue hole systems located closer to shore (Schwabe and Herbert, 2004; Gischler et al., 2008; van Hengstum et al., 2011; Bishop et al., 2015) (Figure 1). The YBH water column stratification existed mostly within the depth range of 80 to 100 m, as reflected in well-defined physical/chemical and microbial gradients, resulting in metabolic pathways rapidly changing from oxic in the upper 100 m depth to anoxic, sulfidic, and methanogenic below that depth (Bi et al., 2018; Xie et al., 2019; Yao et al., 2020).
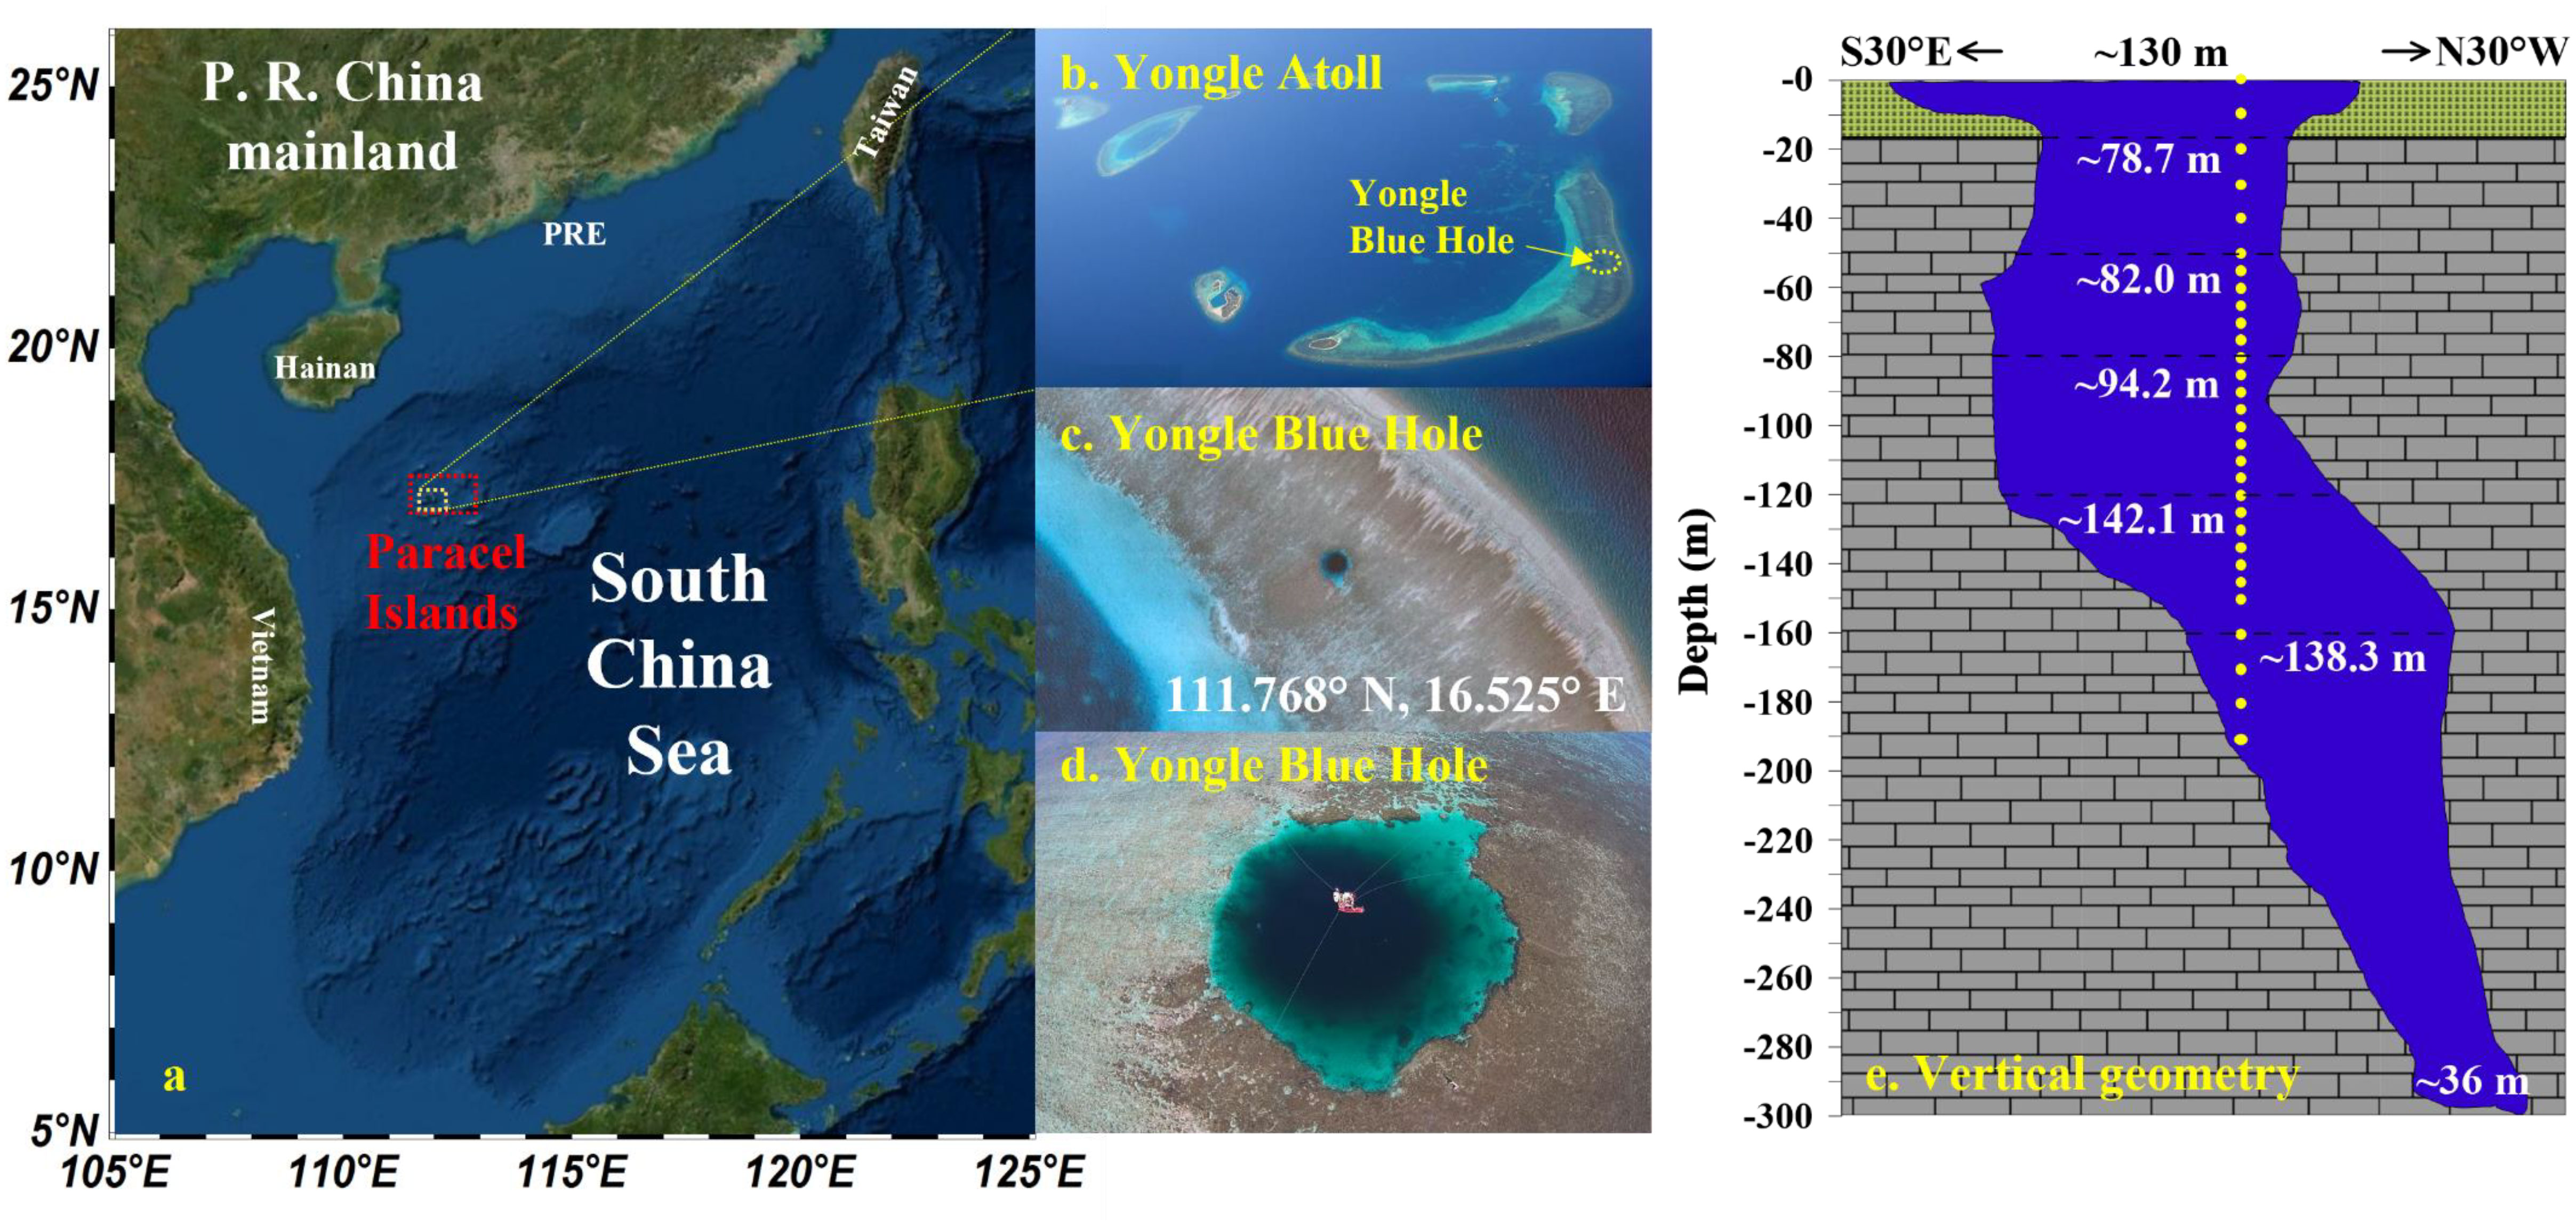
Figure 1 Location and vertical geometry of the Yongle Blue Hole. (A) Location of the Paracel Islands in the South China Sea; (B) Aero view of the Yongle Atoll; (C, D) Aero views of the Yongle Blue Hole from different altitudes and depression angles; (E) Vertical profile of the Yongle Blue Hole. (E) is modified from Li et al., 2018; Yao et al., 2020.
Samples were collected on October 24-25, 2019. Since the water around the YBH is very shallow, the research vessel (Qiongqionghai 03138) had to be anchored in the lagoon of the Yongle Atoll, ca. 1.7 km from the YBH. All investigators and materials were transported to a floating platform built in the center of the YBH during the spring tide period. During the survey, a buoyancy platform was set up on the surface of YBH, a winch was placed, and Niskin samplers were mounted for water sampling. The sampling depth reached 190 m.
Hydrochemical parameters
Water samples were collected using Niskin bottles mounted on a stainless-steel wire, which is marked every five meters before the cruise, and deployed from a winch mounted on the platform. Twenty-nine samples were collected to a depth of 190 m at intervals of 5 m (50-190 m) or 10 m (surface-50 m). After recovery, DO and sulfide were sampled first from the Niskin bottles to the sample bottles. For DO, 100-mL glass stoppered bottles, which volumes were pre-determined, were carefully filled brim-full after overflowing the bottle with two times of the bottle volume of water. Reagents (1mL 2mol/L MnCl2 and 1mL 1mol/L NaOH/KI) were added to fix the oxygen, following the standard procedures described by Grasshoff et al. (2007). After DO sampling, samples for sulfide analysis were collected in 25 mL colorimetric tubes and the procedural reagents (a mixture of N, N-dimethyl-p-phenylenediamine sulfate and ferric reagents) were added immediately (Cline, 1969). Duplicate samples were collected for both DO and TH2S. DO was measured on-site using the conventional Winkler titration method (Grasshoff et al., 2007) with a digital bottle-top burette (Titrette, BrandTech Scientific Inc., USA). The detection limit of current DO measurement is about 1 μmol/L (Thamdrup et al., 2012; Ulloa et al., 2012). Sulfide was also determined on-site using a spectrophotometer at 670 nm after color development, and all necessary dilutions were made in volumetric glassware before determination (Cline, 1969). The detection limit of this measurement is about 1 μmol/L (Cline, 1969). Since this method measures the concentration of total sulfide species (H2S, HS-, and S2-) in seawaters, the result is expressed as total H2S (TH2S) hereafter. Average data were reported for DO and TH2S from duplicate samples.
Dissolved inorganic nutrients
After water sampling, the samples were brought back to the supply vessel moored near the YBH. The samples were filtered through pre-soaked and washed acetic acid fiber membranes (pore size 0.45 μmol/L, diameter 47 mm) in the laboratory on board. The filtrates were frozen at -20°C for dissolved inorganic nutrient analysis (Murphy and Riley, 1962; Catalano, 1987). Nutrients were detected by standard colorimetric method on AA3 continuous flow analyzer (Seal Analytical Ltd., UK). The detection limits of NO3-, NO2-, NH4+, PO43- and SiO32- are 0.02, 0.01, 0.04, 0.02, and 0.01 μmol/L, respectively, and the analytical uncertainties of multiple replicates are less than 5-10%.
Statistical analyses
Correlation between parameters was analyzed by IBM SPSS software (V22) (two-tailed test), and statistical differences between the two groups were tested by one-way variance analysis (ANOVA). Regression analysis and Principal Component Analysis (PCA) between parameters were performed by Originpro 2022 software (OriginLab).
Results
Hydrochemical characteristics
During the investigation in October 2019, sharp transitions in salinity, temperature, and DO occurred at about 50 m depth, and most physicochemical parameters in the YBH remained relatively uniform below the depth of 140 m (Figure 2). Below 100 m depth, the YBH is characterized by both anoxic and sulfidic conditions. The water temperature was roughly unchanged on the surface at 50 m but decreased sharply from 50 m to 60 m. After gradually decreasing from 60 m to 115 m, the temperature was kept at 17.6°C to 130 m, then gradually decreasing to 15.7°C at 145 m (Figure 2A). The salinity resembles the vertical distribution pattern of temperature with depth, but in a reverse way (Figure 2B). At the surface of 50 m, the salinity was kept at about 33.7, and below 140 m depth, the salinity was kept at about 34.6 (Figure 2B). The subsurface Chl a maximum was found at the depth of 30 m with the highest value of 1.2 μg/L and the secondary peak of Chl a (0.23 μg/L) appeared near 95 m (Figure 2C). The peak value of Chl a at 95 m is likely caused by the enrichment of cyanobacteria under anoxic conditions (He et al., 2020). The same phenomenon has been observed in the underwater anoxic layer of Rot Lake in Switzerland (Brand et al., 2016). The increase of Chl a concentration and its good correlation with turbidity in water below 130 m in the YBH (Bi et al., 2018) are attributed to the strong scattering of Chl a light source signal caused by high turbidity under the condition of extremely low Chl a concentration, leading to high Chl a fluorescence measurement value (YSI Environmental, 2006; Wang et al., 2007). The surface DO was highest and decreased sharply from 0 m (192.0 μmol/L) to 10 m depth (121.5 μmol/L), and kept at 113.8 μmol/L to 40 m depth before further decreasing (Figure 2D). With the disappearance of DO at about 100 m depth, the hydrogeochemistry of the water column in the YBH dramatically changed from oxic to strongly reductive conditions as reflected by an increase of TH2S (Figures 2D, E). The TH2S increased gradually from 110 m to 120m and then kept constant at 130 m, corresponding to the change of temperature at the same layer (Figures 2A, E). After that, the TH2S increased sharply from 20.5 μmol/L to 249.4 μmol/L at 150 m depth and kept constant again below that depth (Figure 2E).
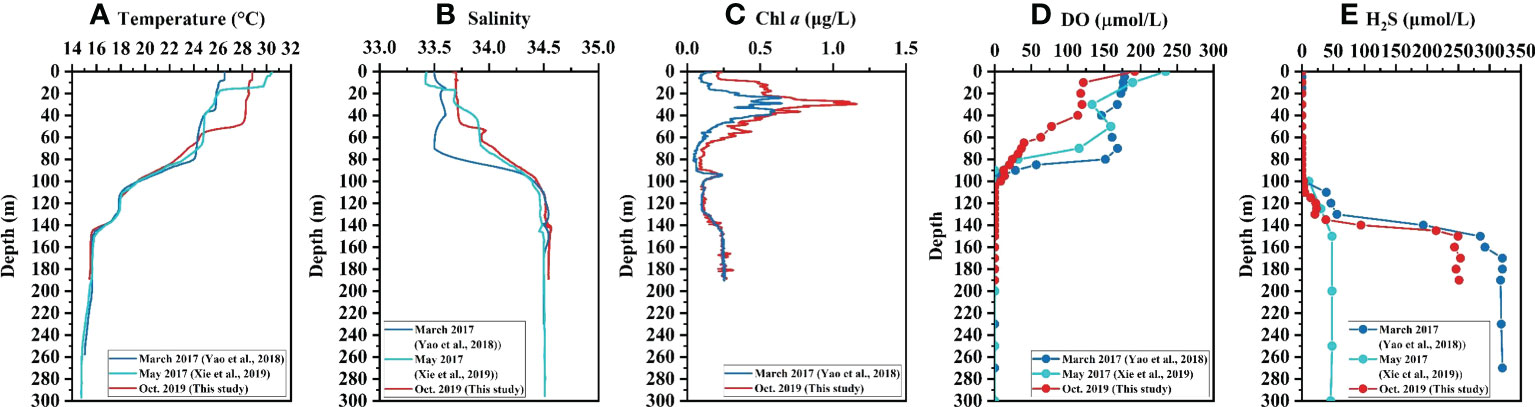
Figure 2 Vertical profiles of hydrochemical parameters in the Yongle Blue Hole. (A) Temperature, (B) Salinity, (C) Chl a, (D) DO, and (E) TH2S.
Concentration and distribution characteristics of nutrients
The nitrate concentration was very low on the surface at 40 m but increased rapidly from near 0 at 40 m to about 11 μmol/L at 60 m. From 60 m to 80 m, there has been little change in the nitrate, but from 80 m to 95 m, the nitrated decreased to near 0 (Figure 3A). The nitrite concentration was two orders of magnitude lower than the nitrate. There were two peaks of nitrite concentration at 50 m (0.12 μmol/L) and 90 m (0.16 μmol/L), respectively. The nitrite decreased to near 0 below 100 m (Figure 3B). In contrast with nitrate and nitrite, the ammonium concentration was low in the upper 90 meters of the water column, and rapidly increased below 95 m, with the trend slowing down between 110 m and 130 m, where the average concentration was 21.9 ± 2.1 μmol/L; it then increased to 83.8 μmol/L at 160 m but did not increase further, remaining at around 85 ± 2 μmol/L (Figure 3C). Therefore, the distribution of dissolved inorganic nitrogen (DIN, the sum of the concentrations of nitrate, nitrite, and ammonium) was dominated by nitrate and nitrite in the upper 100 m and by ammonium below 100 m. The phosphate and silicate had similar distribution patterns to ammonium. Like the nitrate, both phosphate and silicate concentrations were very low on the surface at 40 m, and started to increase below that depth (Figure 3). Unlike the silicate, the phosphate concentration was kept relatively constant between 60-105 m (Figures 3D, E). Both phosphate and silicate concentrations did not increase below 160 m, remaining at around 5 μmol/L and 130 μmol/L, respectively.
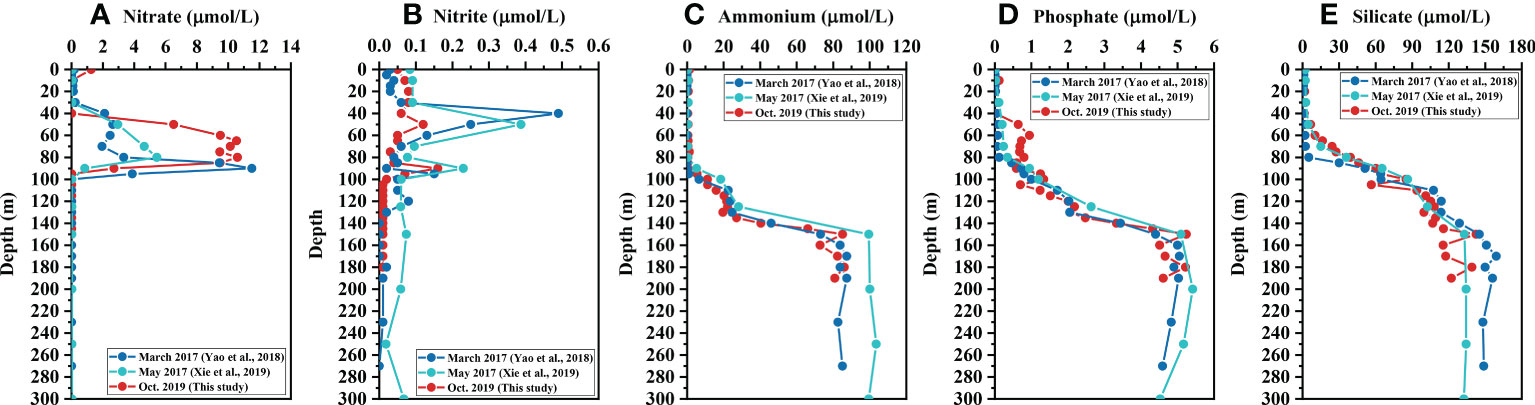
Figure 3 Vertical profiles of nutrients in the Yongle Blue Hole. (A) nitrate, (B) nitrite, (C) ammonium, (D) phosphate, and (E) silicate.
Discussion
Seasonal variations of hydrochemical characteristics and nutrient distributions in the YBH
Synthetic analysis of the hydrochemical and nutrient characteristics of the YBH water column in March and May of 2017 and October 2019 indicates a significant difference in water properties between depths greater than and less than 100 m. Above 100 m, the temperature and salinity stratifications are mainly controlled by meteorological conditions and the influx of seawater, with a possible slow vertical exchange, whereas below 100 m, there is almost no exchange with the sea (Bi et al., 2018). Distributions of hydrochemical parameters and nutrients in the upper 100 m vary significantly with the season (Figures 2, 3). For example, in March 2017, the water temperature was kept constant in the upper 80 m, and in May 2017 it was about 70 m, while in October 2019, it was only 50 m (Figure 2A) (Bi et al., 2018; Xie et al., 2019; Yao et al., 2020). The seasonal variations of salinity in the upper layer were analogous to the temperature (Figure 2B), which indicated that the intensity of water exchange was higher in later winter than those in the spring and autumn seasons. This is mainly attributed to the lower atmospheric temperature and stronger wind and waves in winter than in other seasons in the SCS (Wang et al., 2008; Pan et al., 2015; Yu et al., 2019).
Under the influence of varied thermocline and halocline in different seasons, the DO showed similar stratification patterns accordingly. In March 2017, DO was kept constant in the upper 80 m, and in May 2017 the constant layer decreased to the upper 50 m, while in October 2019, it was only 40 m (Figure 2D) (Bi et al., 2018; Xie et al., 2019; Yao et al., 2020). This indicated that in October 2019, DO was consumed by aerobic OM decomposition below 40 m, and the balance between consumption and replenishment was broken due to weak water exchange in autumn, resulting in a more rapid decrease of DO concentration compared with the other two months in 2017. The distribution patterns of Chl a in 2017 and 2019 were basically the same, but the primary subsurface chlorophyll maximum was lower in March 2017 than that in October 2019 (Figure 2C). Previous studies have shown that the primary productivity is higher in autumn than that in later winter in the SCS, due in part to temperature and light intensity differences (Chen, 2005). The vertical distributions of TH2S below 100 m in March 2017 and October 2019 were similar. The TH2S concentration in October 2019 was slightly lower than that in March 2017, possibly due to the difference in upper layer OM cycling between these two months. As aforementioned, the OM decomposition in the upper aerobic layer was extensive in October 2019, as shown by the rapid depletion of DO. This should eventually result in a decrease in the supply of OM in sinking particles and/or in dissolved phase to the lower layer and thus a reduction of TH2S. The TH2S concentration in the bottom layer in May 2017 was only about 50 μmol/L (Xie et al., 2019), significantly lower than those in March 2017 and October 2019 (p<0.001) (Yao et al., 2020), which is most likely caused by oxidation of sulfides during sampling or analysis. Therefore, the TH2S data in May 2017 are not incorporated into the later discussion.
Nutrients, especially nitrate, nitrite, and phosphate in the upper layer also varied seasonally along with the variations of hydrochemical properties. There were two peaks of nitrate concentration in March 2017, of which one peak was at 50 m and another at 90 m, with the highest concentration at the second peak, reaching 11.5 μmol/L (Figure 3A) (Yao et al., 2018). Similar to October 2019, only one peak at 80 m was found for nitrate in May 2017, but the peak value was only about 5.5 μmol/L, less than those of the other two months (Figure 2C) (Xie et al., 2019). There were three peaks of nitrite concentration in March 2017, at 40 m, 95 m, and 120 m, respectively, whereas only two peaks of nitrate were found in May 2017 and October 2019, and both were at 50 m and 90 m (Figure 3B) (Yao et al., 2018; Xie et al., 2019). Although the distribution patterns of nitrate in different seasons were similar, the maximum concentrations were significantly different (p<0.001). For the primary nitrite maximum at 40-50 m, both values in 2017 were higher than that in 2019, as opposed to the distributions of nitrate (Figure 3B). The third peak of nitrite at 120 m in March 2017 was the lowest compared with the other two peaks. Nevertheless, the detection of nitrite below 100 m indicated that there was a trace amount of DO undetected by the Winkler method (Ulloa et al., 2012). In fact, anoxic marine zones (AMZs) are often distinguished from oxygen minimum zones (OMZs) by the accumulation of nitrite (Ulloa et al., 2012; Vargas et al., 2021). In some AMZs, such as the Peruvian coast, the coast of Iquique, Chile, Eastern tropical South Pacific (ETSP), and the Arabian Sea, nanomolar levels of DO were detected using high-sensitivity oxygen sensors (Revsbech et al., 2009). The existence of a trace amount of DO below 100 m in March 2017 was consistent with the higher intensity of water exchange compared with the other two months, as shown by other hydrochemical parameters (Figure 2). The existence of DO, even in trace amounts, has a significant influence on microbial composition and thus biogeochemical processes. For example, at the depth of 100-120 m in March 2017, the abundance of sulfur-oxidizing bacteria (SOB) was significantly higher than that of sulfate reduction bacteria (SRB) (Yao et al., 2020; Zhou et al., 2023). The SOB is a chemolithoautotrophic microorganism living in dysoxic or suboxic conditions and deriving energy from the oxidation of thiosulfate, sulfide, or elemental sulfur to sulfate (van Vliet et al., 2021). As for the low value of nitrite below 100 m in May 2017, it is more like the background noise of the analyzing method they used (Xie et al., 2019).
In October 2019, the depth of phosphate and silicate began to increase and matched well with the decrease of DO, indicating the direct release of phosphate and silicate by aerobic decomposition of OM. Relative constant distribution of phosphate at the depth of 60-90 m in October 2019 suggests re-utilization of phosphate by microorganisms (Noffke et al., 2012), but not by phytoplankton because of low Chl a at this layer (Figure 2D). While for silicate, there is no such assimilation pathway by microbial activities (Tréguer and De la Rocha, 2013), and thus it showed gradual accumulation with depth (Figure 3D).
Despite numerous studies on blue holes and/or anchialine caves over the past 30 years, there is a scarcity of continuous hydrochemical profiles for nutrients. With the exception of the YBH, there have been very few investigations into nutrient cycling in these systems, including caves in Bermuda (Maloney et al., 2011), Hospital Hole (Davis and Garey, 2018), Bundera Sinkhole (Seymour et al., 2007), caves in Croatia (Žic et al., 2011), and Amberjack Hole (Patin et al., 2021) (Figure S1). Nutrient concentrations in these blue holes are generally lower in waters above chemoclines than those in the YBH. However, below the chemoclines, nutrient concentrations vary significantly among systems, which may be related to the locations and material sources of each system (Figure S1). Overall, the depths of other blue holes are shallower, and the water column structures are more complex than those of the YBH. Some of the surface layers of these blue holes are more affected by land (e.g., caves in Bermuda (Maloney et al., 2011)), and some of their bottom layers are affected by seawater inputs (e.g., Bundera Sinkhole (Seymour et al., 2007)). Only a few of them have complete anoxic bottom waters (e.g., Hospital Hole (Davis and Garey, 2018), caves in Croatia (Žic et al., 2011), Amberjack Hole (Patin et al., 2021)). For anoxic basins in the open ocean, such as the Black Sea and Cariaco Trench, the overall variation patterns of nutrients with depth are similar to those of the YBH. However, the nutrient concentrations in deep waters are different in these systems, partly due to differences in water depth and primary productivity in the surface layer (Zhang and Millero, 1993; Murray et al., 1995; Volkov and Rozanov, 2006) (Figure S1).
The effects of hydrochemistry on nutrient cycling in the YBH
As aforementioned, seasonal differences in hydrochemical characteristics partly contribute to the seasonal changes in nutrient cycling. Despite these seasonal changes, the variety of nutrients with these environmental parameters remained somewhat consistent among different seasons, especially in the anoxic layer (Figures 2, 3). PCA analysis further proves this inference drawn from distribution characteristics. The distributions of PCA scores of samples (observation) and parameters (loading) in March 2017 were basically the same as in October 2019, and both were similar to that in May 2017 (Figure 4). Different nutrient species are greatly affected by the redox environment. Nitrate and nitrite are mainly influenced by DO and water temperature in the upper 100 m, whereas ammonium, phosphate, and silicate are more controlled by TH2S and salinity (Figure 4).
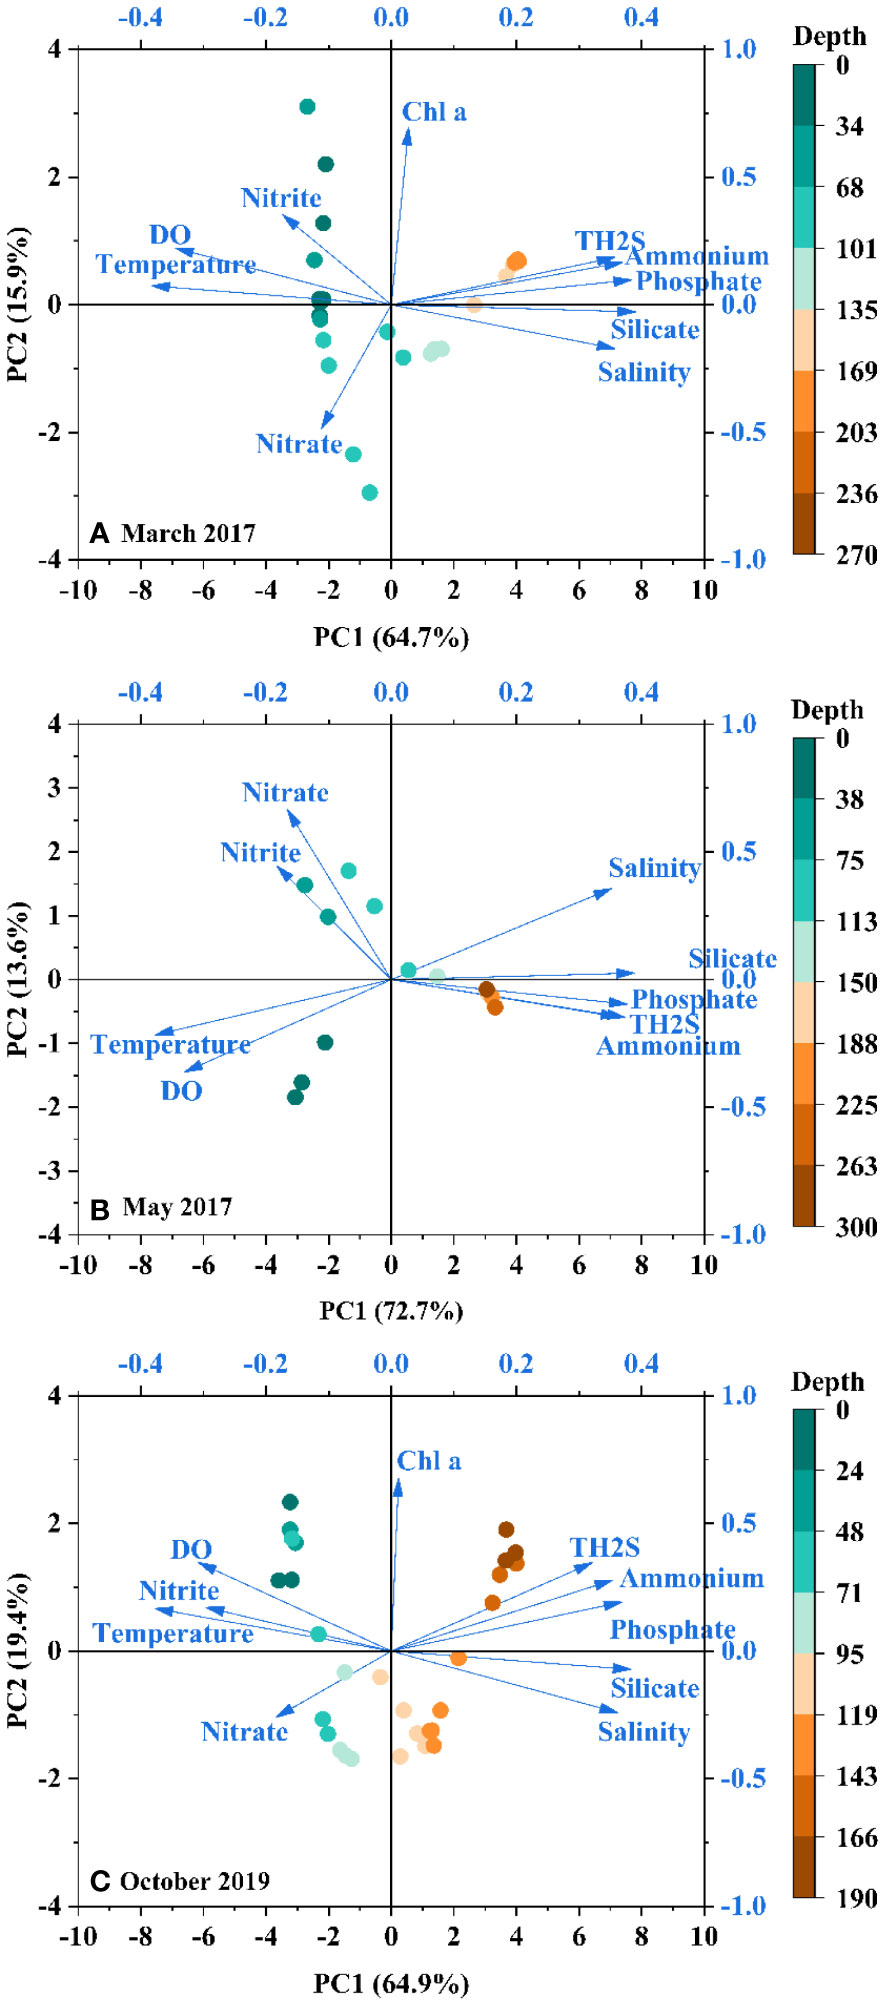
Figure 4 Biplots of PCA scores of observations (sampling depth) and loadings (parameters) for samples collected in the Yongle Blue Hole in (A) March 2017, (B) May 2017, and (C) October 2019.
Nevertheless, variations of nutrients with these environmental parameters differ among different nutrient species, indicating the differences in the cycling processes of these nutrient species, especially in the oxic layer (Figure 5). For example, in the oxic layer, the concentrations of nutrients increased with the decrease in temperature and Chl a and the increase of salinity, especially of phosphate and DIN in October 2019 (Figures 5A–I). Along with the decreasing of DO, DIN increased first and decreased rapidly when DO was below about 30 μmol/L (Figure 5J), reflecting a shift from a nitrification process to a predominantly denitrification process (Paulmier and Ruiz-Pino, 2009; He et al., 2020), the thresholds between DO and DIN were also found in other anoxic blue holes, such as the Bundera sinkhole (Seymour et al., 2007), as well as anchialine caves in Croatia (Žic et al., 2011) and the Black Sea (Murray et al., 1995), but not as obvious as in the YBH, possibly because these systems have more complex hydrological structures and biogeochemical gradients and less data across oxic-anoxic interfaces (Figure S3). On the contrary, both silicate and phosphate increased with the decrease of DO, but in different manners. With the decreasing of DO, the silicate increased slowly first in a nonlinear way, and when DO was below 50 μmol/L, it increased rapidly (Figure 5L), indicating that the decreasing rate of DO (OM decomposition) is not consistent with the dissolution of silica (silicate regeneration). In general, silicate regeneration depends on the dissolution of the organism’s siliceous crust in seawater, which is much slower than the phytoplankton cell lysis to release the extra- and intracellular OM (Tréguer and de la Rocha, 2013). The phosphate increased linearly with the decreasing of DO (Figure 5K), indicating that phosphate regeneration and OM decomposition were simultaneous (Redfield, 1963).
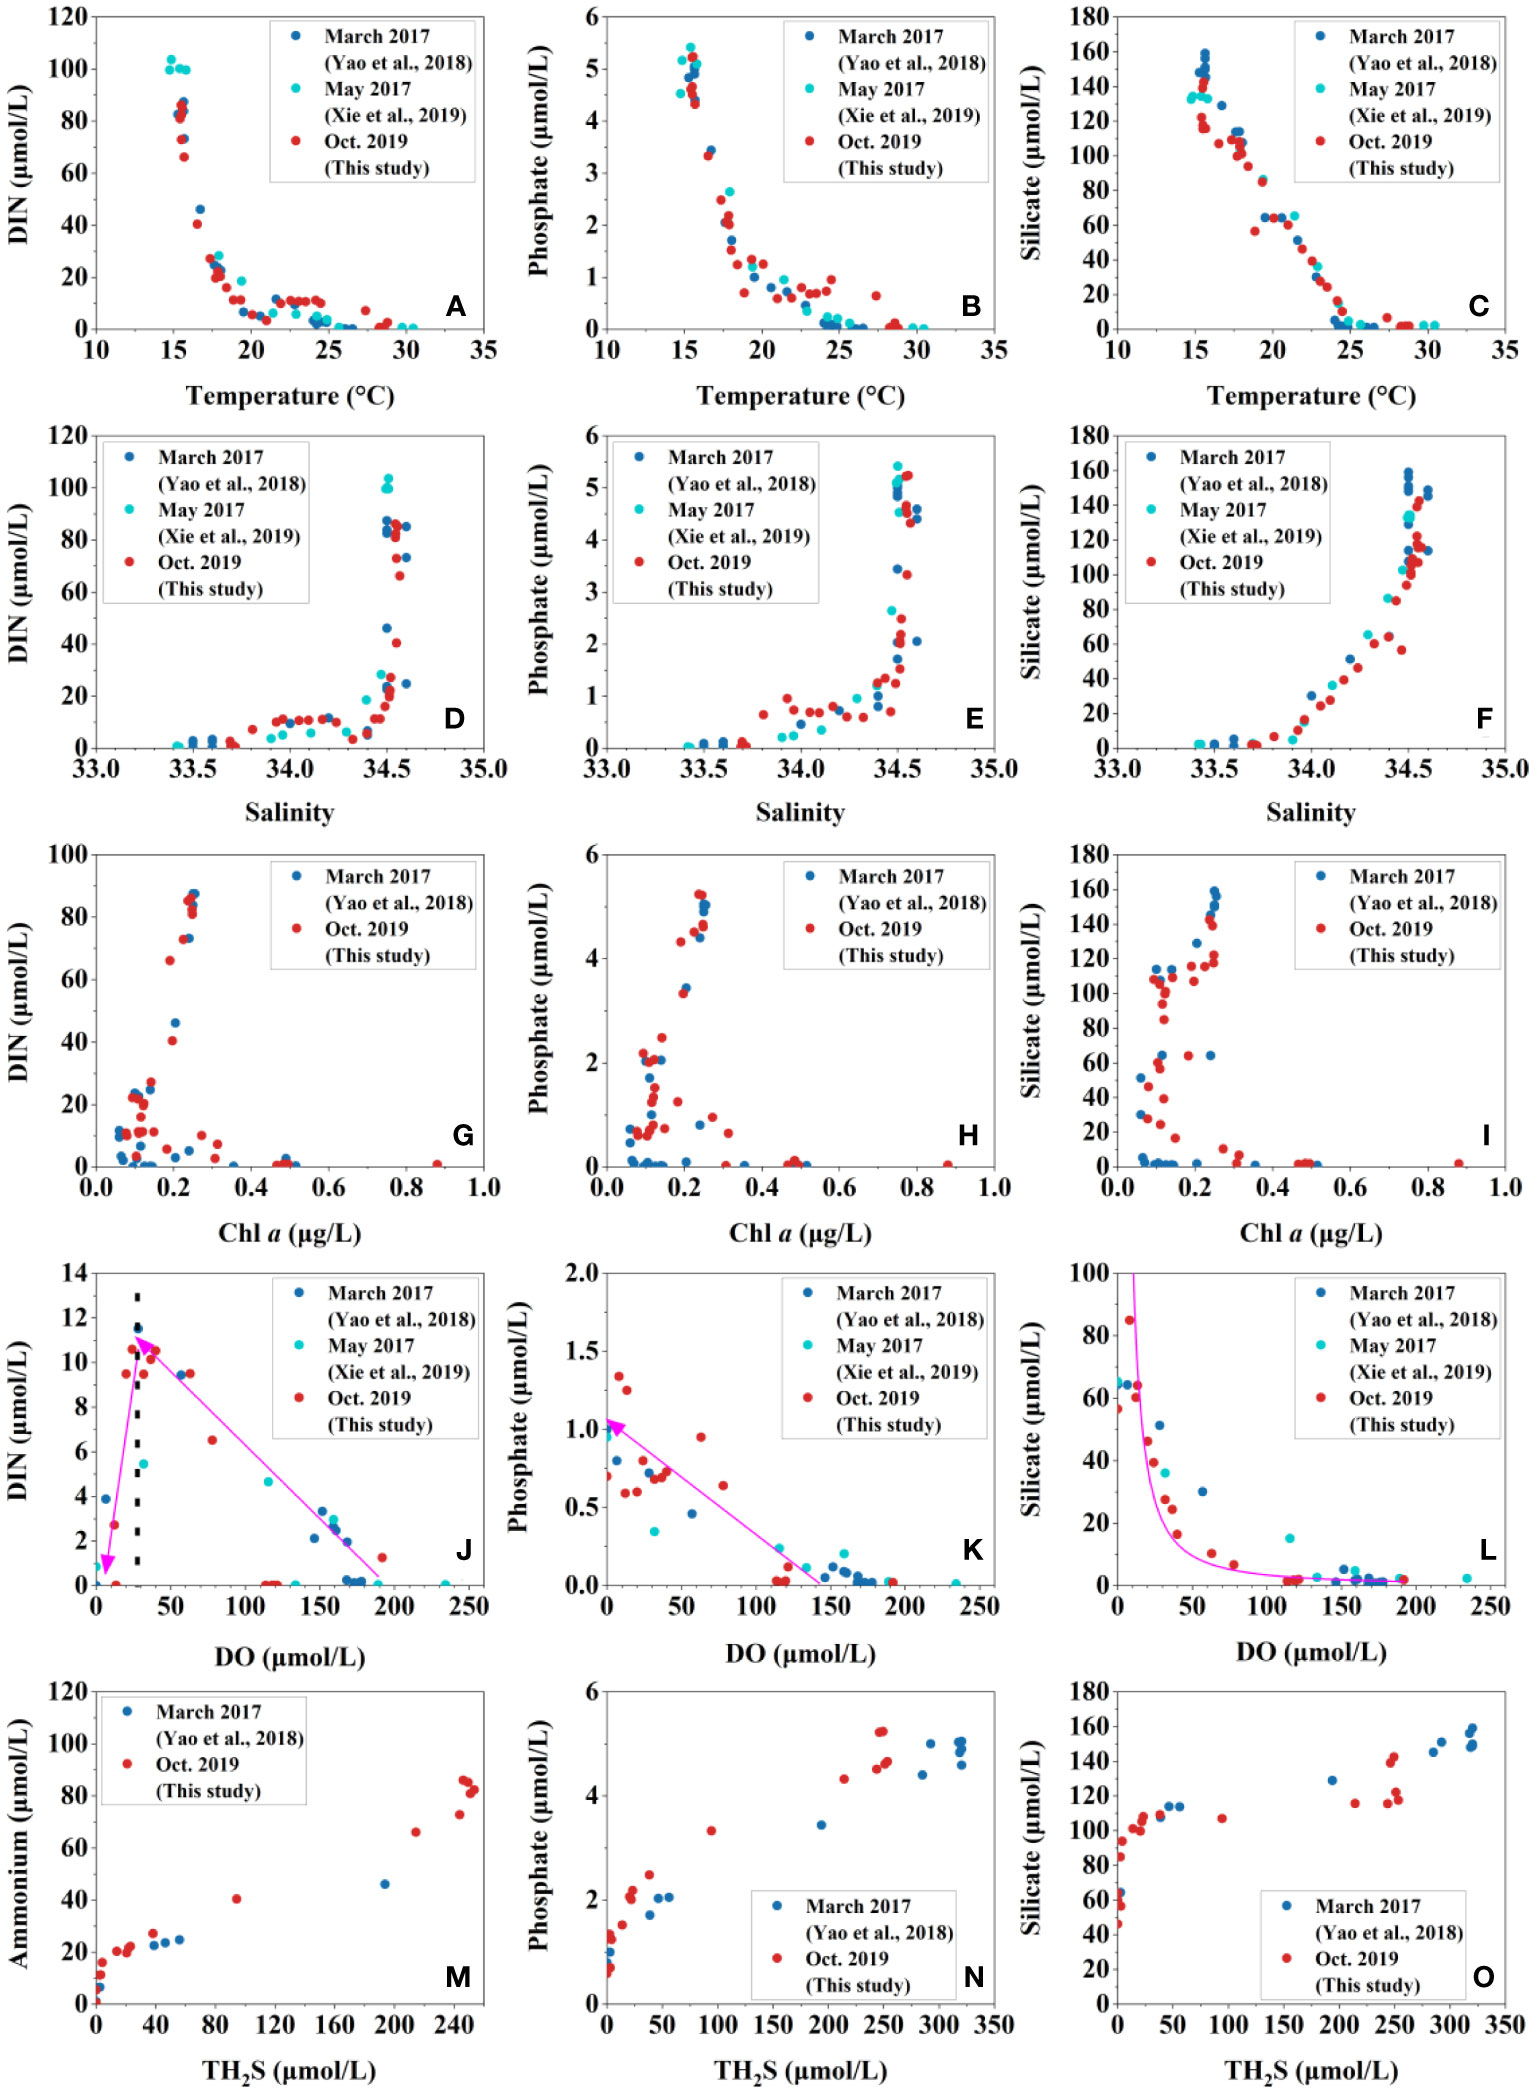
Figure 5 Relationships between nutrients and hydrochemical parameters in the Yongle Blue Hole. DIN, phosphate, and silicate vs. temperature (A–C), salinity (D–F), Chl a (G–I), DO (J–L), and TH2S (M–O).
With the accumulation of TH2S, the concentrations of ammonium, phosphate, and silicate all increased linearly, but their increasing magnitudes were different. The increasing multiple of ammonium was much higher than those of phosphate and silicate (Figures 5M–O), probably because phosphate and silicate started to increase in the absence of TH2S (Figures 2, 3).
Relative changes of different nutrient species in the YBH: implications for production and consumption of nutrients
As mentioned earlier, different nutrients have different sources and cycling processes, resulting in diverse response to environmental factors. For phosphate and silicate, their cycling processes in the ocean are relatively simple, mainly involving utilization by biota and organic matter decomposition and regeneration (Noffke et al., 2012; Tréguer and de la Rocha, 2013). For nitrogen-containing nutrients, their behavior is largely controlled by oxidation-reduction reactions mediated by phytoplankton and microorganisms, resulting in their presence in multiple valence states and more complex biogeochemical behavior (Gruber, 2008). In the surface layer of the YBH, phosphate and silicate were quickly utilized by primary production (Figure 3). With the decrease of DO, phosphate and silicate began to gradual accumulate (Figure 3), indicating that the regeneration of these nutrients from decomposition of organic matter exceeded the consumption. Below 100 m depth, where DO, nitrate and nitrite drop to 0, ammonium began to increase. Below 160 m, the concentrations of ammonium, phosphate and silicate, and their ratios were kept constant, indicating a balance between nutrient regeneration and consumption. The nutrient ratios are close to the Redfield ratio below 160 m, suggesting that regenerated nutrients mainly come from marine phytoplankton (Redfield, 1963).
At depths above 100 m, nitrate and nitrite are the main nitrogen nutrients, while ammonium is dominated below 100m. The distinct changes in the three nitrogen forms indicate an active nitrogen cycle in the YBH, which is mainly driven by natural processes such as changes in oxidation-reduction conditions, phytoplankton and microbial activities and organic matter decomposition (Gruber, 2008). The nitrogen cycle in marine environment mainly includes nitrification under aerobic conditions, assimilation, ammonia oxidation, aerobic ammonium oxidation and nitrification, as well as denitrification, DNRA (nitrate dissimilatory reduction to ammonium) and anaerobic ammonium oxidation (Gruber, 2008). The low DIN content in the surface water of YBH is mainly attributed to the combined effects of nitrification, assimilation, and aerobic ammonium oxidation (Yao et al., 2018; He et al., 2020). Subsequently, nitrite concentration began to increase, followed by an increase in nitrate concentration, and at 40 m, nitrite reached its first peak, which is referred to as the Primary Nitrite Maximum (PNM), and nitrate reached a relatively high value at this depth, indicating the sequential occurrence of ammonium oxidation (nitrite formation) and nitrification. PNM is a common phenomenon in oxygen-poor, nutrient-poor waters, mainly from nitrification, which has been observed in the waters near the Xisha Islands (Wu et al., 2015). Nitrite concentration quickly decreased after reaching the peak, along with the increase of nitrate, further indicating that nitrification was the main process, which converted nitrite to nitrate. Below 80 m, DO concentration decreased rapidly, and nitrate concentration increased rapidly to its highest peak, indicating that nitrification rate was at its maximum. However, below 90m, nitrate concentration quickly decreased, indicating the existence of denitrification and/or DNRA processes. Considering that ammonium did not start to accumulate until 100m, the decrease of nitrate below 90 m should be mainly attributed to denitrification, because DNRA is the direct production of NH4+ from NO3- (Gruber, 2008). At 95 m, nitrite reached its second peak, which is referred to as the Secondary Nitrite Maximum (SNM). SNM is a common phenomenon in the oxygen minimum zone of the marine environment, mainly from nitrate reduction rather than ammonium oxidation (Lam et al., 2011; Buchwald et al., 2015). Within the range of hypoxic layer, the decrease of nitrate and nitrite concentrations indicates that denitrification and nitrification occurred simultaneously. The coupling between nitrification and denitrification is a significant process of reactive nitrogen (N) removal that has been observed in many anoxic systems (Gruber, 2008). Below 100 m, nitrate and nitrite concentrations both decreased to a very low level, and ammonium began to accumulate. The massive accumulation of ammonium (concentration far higher than the maximum concentrations of nitrate and nitrite) is mainly attributed to the decomposition of organic nitrogen, as shown by the relationships between different nutrient species (Figure 6). All the relationships between DIN vs. phosphate, silicate vs. DIN and phosphate showed nonconservative trends among different seasons (Figure 6). For example, DIN increases slowly in a gentle upward concave shape with the increase of phosphate, whereas silicate increases rapidly with the increase of DIN and phosphate, showing concave downward shapes (Figure 6). Furthermore, the increase of silicate relative to DIN is more rapid than relative to phosphate, consistent with the slow increase in DIN relative to phosphate (Figure 6). These changes may reflect the differences in the production and consumption pathways of different nutrients during cycling (Cross et al., 2007). Both nitrite and nitrate have production and consumption in the oxic layer due to complex nitrogen cycling processes, such as nitrification, denitrification, and ammonia oxidation (Paulmier and Ruiz-Pino, 2009). Whereas, silicate is not required by microbial metabolic processes except being utilized by siliceous organisms such as diatoms (Tréguer and de la Rocha, 2013). Therefore, the distribution of silicate is mainly controlled by OM decomposition and shows a net accumulation due to the lack of utilization pathways. As for phosphate, although it can also be utilized by microorganisms, e.g., to build cell membrane lipids and DNA, the amount demanded is usually lower than the amount of phytoplankton uptake (Karl, 2014). Thus, the relative constant distribution of phosphate at 60-100 m depth is most likely due to the phosphate regeneration by OM decomposition being in balance with microbial utilization (Figure 3D).
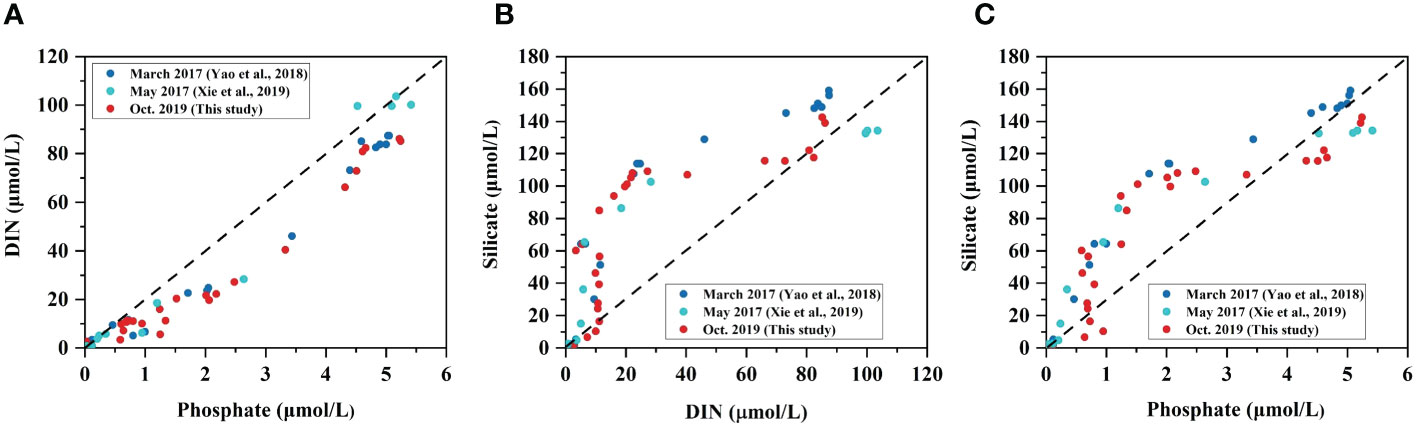
Figure 6 Relationships between (A) DIN and phosphate, (B) silicate and DIN, and (C) silicate and phosphate in the Yongle Blue Hole.
The inconsistent variations of different nutrient species also influence their proportional relationships, and the vertical variations of the nutrient ratios (e.g., DIN/Phosphate (N/P), Silicate/DIN (Si/N), and Silicate/Phosphate (Si/P)) well represent the relative changes in the production and consumption of different nutrients, which also reflecting the variations in the nutrient source and transformation. All nutrient ratios fluctuated with the season in the surface layer, especially the N/P (Figure 7). The highest N/P of different seasons occurred at different depths, and the deepest was at 40m in March 2017 (Figure 7A). The N/P reached minimum values (ca. 4~5) at about 95 m in all seasons, consistent with that this depth is the transition interface of nitrogen from oxidation status to reduction status and the DIN concentration is lowest at this depth (Figure 3). At deeper depths, the N/P was kept constant at about 16~17, which is very close to the Redfield ratio (Redfield, 1963) and the ratios in deep ocean waters (Anderson and Sarmiento, 1994). The N/P in marine environments has been extensively studied and is reported to be approximately 16:1, assuming that these nutrients are primarily derived from the decomposition of organic matter from primary production (Redfield, 1963; Hiscock and Millero, 2006). However, the N/P in deep waters varies among different anoxic systems, possibly due to the complexity of organic carbon sources in these systems. The N/P in the YBH deep water is similar to the Redfield ratio, indicating that the source of organic carbon in the YBH is relatively uniform. Similar values were observed in other permanently anoxic zones, such as the Framvaren fjord, where the N/P in deep waters is approximately 15-16 (Yao and Millero, 1995) (Figure S2). In an anoxic blue hole, the Hospital hole, the N/P in the deep water is approximately 40, which is much higher than that of the YBH, owing to the high levels of NO3- in the anoxic layer, which might be related to the low abundance of nitrogen reducers there (Davis and Garey, 2018). In an underwater blue hole, the Amberjack Hole in the Gulf of Mexico, the N/P in the deep water is only 7-8, probably because the depth of the anoxic layer of this blue hole is too shallow to accumulate ammonium (Patin et al., 2021). In open ocean anoxic zones, such as the Black Sea and the Cariaco Trench, the N/P is also less than 16, due to the complex water structure and allochthonous input of organic matter (Murray et al., 1995; Volkov and Rozanov, 2006). The seasonal fluctuation of Si/N occurred mainly at the surface of 50 m (Figure 7B). The Si/N also increased to the maximum near 95 m in all seasons, reaching the highest in October 2019 (~17), due in part to DIN being lowest at this depth. The Si/N at deeper depths was around 1~2, which is slightly greater than the Redfield ratio (Redfield, 1963) and the Si/N of nutrient-rich diatoms (Brzezinski et al., 1998), suggesting the accumulation of silicate and/or potential use of ammonium by anaerobic microorganisms, such as anammox bacteria (Hutchins et al., 2009). In general, the Si/P shows an S-shaped distribution from the surface to the bottom (Figure 7C). The Si/P in the surface layer was highest, up to 110, and it gradually decreased with depth, which is mainly because of the continuous regeneration of phosphate from OM decomposition. The lowest Si/P was only about 10 and was found at around 50~60 m. The Si/P increased to about 100 between 80~100 m, indicating the re-utilization of phosphate by microbial activities, as mentioned earlier. Below that depth, the Si/P decreased gradually and was kept constant at around ~30 below 140 m, which is almost two times the Redfield ratio (Redfield, 1963), suggesting the continuous accumulation of silicate and further microbial utilization of phosphate (Parsons et al., 1984).
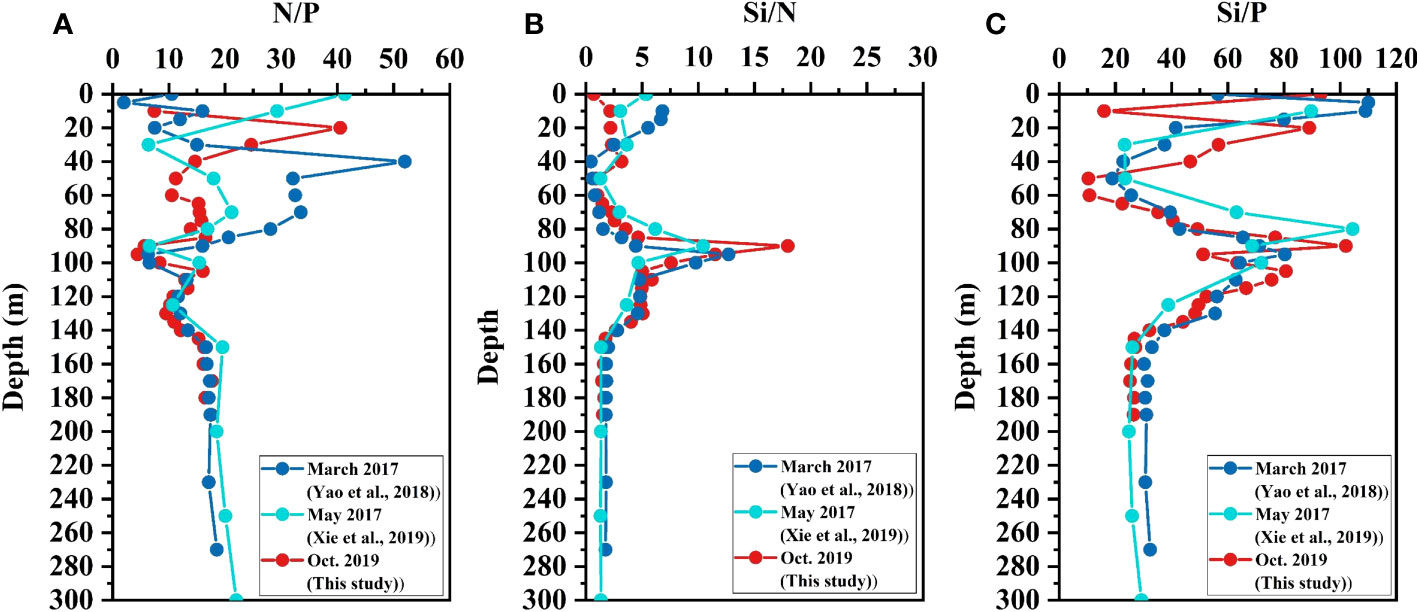
Figure 7 Vertical profiles of nutrient ratios in the Yongle Blue Hole. (A) N/P, (B) Si/N, and (C) Si/P.
Conclusions
The YBH is a semi-enclosed marine environment, where the upper layer of the water column is actively exchanged with the outer sea, and the water exchange intensity varies seasonally. Based on the distributions of salinity and temperature, the water exchange with the outer sea for the YBH in October 2019 is weaker than those in March and May 2017. As a result, dissolved oxygen (DO) started to decrease below the depth of 40 m in October 2019, which is 30-40 m shallower than those in March and May 2017, indicating that the aerobic OM decomposition in October 2019 was more extensive than those in March and May 2017. Influenced by the hydrochemical properties, different nutrient species showed different seasonal and vertical variation patterns. The variations of nitrate, nitrite, and ammonium reflected the evolution of nitrogen cycling processes, such as nitrification, denitrification, and anammox with decreasing DO and increasing TH2S, but the specific contribution needs to be constrained by nitrogen isotopes. It is worth noting that in March 2017, there was a small tertiary nitrite maximum at a depth of 120m, which origin needs to be further examined. The relative constant distributions of ammonium, phosphate, and silicate below the depth of 140 m indicated the depletion of decomposable OM or a balance between nutrient regeneration and reutilization. Changes in the distributions of different nutrients also affected their relationships. The non-conservative behaviors of silicate relative to phosphate and DIN and phosphate relative to DIN indicated that silicate was constantly accumulating, while the regenerated phosphate and DIN were probably re-utilized by microorganisms in addition to accumulation. As a result, nutrient ratios also varied seasonally in the surface oxic layer and had extreme values at the oxic-anoxic interfaces, indicating the relative changes in the production and consumption of different nutrient species.
In conclusion, the seasonal variations of the concentrations and ratios of nutrients in the YBH reflect the close relationships of nutrient cycling and regeneration with hydrochemical parameters, OM decomposition, and microbial activities in anoxic seawaters, and further prove that the YBH is a unique natural laboratory for studying the biogeochemical processes during the oxic-anoxic transition.
Data availability statement
The original contributions presented in the study are included in the article/Supplementary Material. Further inquiries can be directed to the corresponding author.
Author contributions
LF and ZY designed the cruise. LC, PY, and LF attended the cruise and collected the samples. LC and PY designed the experiments. LC conducted most of the experiments, analyzed the data, prepared graphs and tables, and wrote the manuscript. PY and ZY revised the manuscript. All authors contributed to the article and approved the submitted version.
Funding
This study was supported by the National Natural Science Foundation of China (NSFC) (42076034), the Research and Development Program for the South China Sea of the Sansha Track Ocean Coral Reef Conservation Research Institute (HJLD16-01, HJLD-1701), the Fundamental Research Funds for the Central Universities (201762038).
Acknowledgments
We thank the captain Yichuan Chen and the crews of the Qiongqionghai 03138, Yunyu Yuan, and Honglin Ma for logistical support and sampling assistance. We also thank Guoling Zhang for her technical assistance during laboratory analyses.
Conflict of interest
The authors declare that the research was conducted without any commercial or financial relationship that could be considered a potential conflict of interest.
Publisher’s note
All claims expressed in this article are solely those of the authors and do not necessarily represent those of their affiliated organizations, or those of the publisher, the editors and the reviewers. Any product that may be evaluated in this article, or claim that may be made by its manufacturer, is not guaranteed or endorsed by the publisher.
Supplementary material
The Supplementary Material for this article can be found online at: https://www.frontiersin.org/articles/10.3389/fmars.2023.1172475/full#supplementary-material
References
Anderson L. A., Sarmiento J. L. (1994). Redfield ratios of remineralization determined by nutrient data analysis. Global Biogeochem. Cycles 8, 65–80. doi: 10.1029/93GB03318
Bi N. S., Fu L., Chen H. J., Liu R. Z., Chen L., Liu Q. Q., et al. (2018). Hydrographic features of the yongle blue hole in the south China Sea and their influential factors. Chin. Sci. Bull. 63, 2184–2194. doi: 10.1360/N972017-01329
Bishop R. E., Humphreys W. F., Cukrov N., Žic V., Boxshall G. A., Cukrov M., et al. (2015). ‘Anchialine’redefined as a subterranean estuary in a crevicular or cavernous geological setting. J. Crustacean Biol. 35 (4), 511–514. doi: 10.1163/1937240X-00002335
Brand A., Bruderer H., Oswald K., Guggenheim C., Schubert C. J., Wehrli B. (2016). Oxygenic primary production below the oxycline and its importance for redox dynamics. Aquat. Sci. 78, 727–741. doi: 10.1007/s00027-016-0465-4
Brzezinski M. A., Villareal T. A., Lipschultz F. (1998). Silica production and the contribution of diatoms to new and primary production in the central north pacific. Mar. Ecol. Prog. Ser. 167, 89–104. doi: 10.3354/meps167089
Buchwald C., Santoro A. E., Stanley R. H., Casciotti K. L. (2015). Nitrogen cycling in the secondary nitrite maximum of the eastern tropical north pacific off Costa Rica. Global Biogeochem Cycles 29 (12), 2061–2081. doi: 10.1002/2015GB005187
Catalano G. (1987). An improved method for the determination of ammonia in seawater. Mar. Chem. 20 (3), 289–295. doi: 10.1016/0304-4203(87)90079-X
Chen Y. L. (2005). Spatial and seasonal variations of nitrate-based new production and primary production in the south China Sea. Deep Sea Res. Part I: Oceanographic Res. Papers 52 (2), 319–340. doi: 10.1016/j.dsr.2004.11.001
Cline J. D. (1969). Spectrophotometric determination of hydrogen sulfide in natural waters. Limnol Oceanogr. 14 (3), 454–458. doi: 10.4319/lo.1969.14.3.0454
Cross W. F., Wallace J. B., Rosemond A. D. (2007). Nutrient enrichment reduces constraints on material flows in a detritus-based food web. Ecology 88 (10), 2563–2575. doi: 10.1890/06-1348.1
Davis M. C., Garey J. R. (2018). Microbial function and hydrochemistry within a stratified anchialine sinkhole: a window into coastal aquifer interactions. Water 10 (8), 972. doi: 10.3390/w10080972
Doney S. C., Ruckelshaus M., Emmett Duffy J., Barry J. P., Chan F., English C. A., et al. (2012). Climate change impacts on marine ecosystems. Annu. Rev. Mar. Sci. 4, 11–37. doi: 10.1146/annurev-marine-041911-111611
P. G. Falkowski, A. D. Woodhead (Eds.) (2013). Primary productivity and biogeochemical cycles in the sea (Springer Science & Business Media), 387–405.
Gischler E., Shinn E. A., Oschmann W., Fiebig J., Buster N. A. (2008). A 1500-year Holocene Caribbean climate archive from the blue hole, lighthouse reef, Belize. J. Coast. Res. 24 (6), 1495–1505. doi: 10.2112/07-0891.1
Grasshoff K., Kremling K., Ehrhardt M. (2007). Methods of seawater analysis (Third edition) (Weinheim, Germany: Wiley-VCH Verlag GmbH).
Gruber N. (2008). The marine nitrogen cycle: overview and challenges. Nitrogen Mar. Environ. 2, 1–50. doi: 10.1016/B978-0-12-372522-6.00001-3
He P., Xie L., Zhang X., Li J., Lin X., Pu X., et al. (2020). Microbial diversity and metabolic potential in the stratified sansha yongle blue hole in the south China Sea. Sci. Rep. 10 (1), 5949. doi: 10.1038/s41598-020-62411-2
Hiscock W. T., Millero F. J. (2006). Alkalinity of the anoxic waters in the Western Black Sea. Deep Sea Research Part II: Topical Studies in Oceanography 53 (17–19), 1787–1801. doi: 10.1038/s41579-022-00687-z
Hutchins D. A., Capone D. G. (2022). The marine nitrogen cycle: new developments and global change. Nat. Rev. Microbiol. 20 (7), 401–414. doi: 10.1038/s41579-022-00687-z
Hutchins D. A., Mulholland M. R., Fu F. (2009). Nutrient cycles and marine microbes in a CO2-enriched ocean. Oceanography 22 (4), 128–145. doi: 10.5670/oceanog.2009.103
Karl D. M. (2014). Microbially mediated transformations of phosphorus in the sea: new views of an old cycle. Annu. Rev. Mar. Sci. 6, 279–337. doi: 10.1146/annurev-marine-010213-135046
Lam P., Jensen M. M., Kock A., Lettmann K. A., Plancherel Y., Lavik G., et al. (2011). Origin and fate of the secondary nitrite maximum in the Arabian Sea. Biogeosciences 8 (6), 1565–1577. doi: 10.5194/bg-8-1565-2011
Li T., Feng A., Liu Y., Li Z., Guo K., Jiang W., et al. (2018). Three-dimensional (3D) morphology of sansha yongle blue hole in the south China Sea revealed by underwater remotely operated vehicle. Sci. Rep. 8 (1), 17122. doi: 10.1038/s41598-018-35220-x
Maloney B., Iliffe T. M., Gelwick F., Quigg A. (2011). Effect of nutrient enrichment on naturally occurring macroalgal species in six cave pools in Bermuda. Phycologia 50 (2), 132–143. doi: 10.2216/09-83.1
Murphy J., Riley J. P. (1962). A modified single solution method for the determination of phosphate in natural waters. Analytica Chimica Acta 27, 31–36. doi: 10.1016/S0003-2670(00)88444-5
Murray J. W., Codispoti L. A., Friederich G. E. (1995). Oxidation-reduction environments: the suboxic zone in the black Sea. Aquatic Chemis. 7, 157–176. doi: 10.1021/ba-1995-0244.ch007
Noffke A., Hensen C., Sommer S., Scholz F., Bohlen L., Mosch T., et al. (2012). Benthic iron and phosphorus fluxes across the Peruvian oxygen minimum zone. Limnol Oceanogr 57 (3), 851–867. doi: 10.4319/lo.2012.57.3.0851
Pan X., Wong G. T., Tai J. H., Ho T. Y. (2015). Climatology of physical hydrographic and biological characteristics of the northern south China Sea shelf-sea (NoSoCS) and adjacent waters: observations from satellite remote sensing. Deep Sea Res. Part II: Topical Stud. Oceanogr. 117, 10–22. doi: 10.1016/j.dsr2.2015.02.022
Parsons T. R., Takahashi M., Hargrave B. (1984). Biological Oceanographic processes. 3rd ed (Oxford: Pergamon Press).
Patin N. V., Dietrich Z. A., Stancil A., Quinan M., Beckler J. S., Hall E. R., et al. (2021). Gulf of Mexico blue hole harbors high levels of novel microbial lineages. ISME J. 15 (8), 2206–2232. doi: 10.1038/s41396-021-00917-x
Paulmier A., Ruiz-Pino D. (2009). Oxygen minimum zones (OMZs) in the modern ocean. Prog. Oceanogr. 80 (3-4), 113–128. doi: 10.1016/j.pocean.2008.08.001
Revsbech N. P., Larsen L. H., Gundersen J., Dalsgaard T., Ulloa O., Thamdrup B. (2009). Determination of ultra-low oxygen concentrations in oxygen minimum zones by the STOX sensor. Limnol. Oceanogr.: Methods 7 (5), 371–381. doi: 10.4319/lom.2009.7.371
Schwabe S., Herbert R. A. (2004). Black holes of the Bahamas: what they are and why they are black. Quaternary Int. 121, 3–11. doi: 10.1016/j.quaint.2004.01.019
Seymour J. R., Humphreys W. F., Mitchell J. G. (2007). Stratification of the microbial community inhabiting an anchialine sinkhole. Aquat. Microbial Ecol. 50 (1), 11–24. doi: 10.3354/ame01153
Thamdrup B., Dalsgaard T., Revsbech N. P. (2012). Widespread functional anoxia in the oxygen minimum zone of the Eastern south pacific. Deep Sea Res. Part I: Oceanographic Res. Papers 65, 36–45. doi: 10.1016/j.dsr.2012.03.001
Tréguer P. J., de la Rocha C. L. (2013). The world ocean silica cycle. Annu. Rev. Mar. Sci. 5, 477–501. doi: 10.1146/annurev-marine-121211-172346
Ulloa O., Canfield D. E., DeLong E. F., Letelier R. M., Stewart F. J. (2012). Microbial oceanography of anoxic oxygen minimum zones. Proc. Natl. Acad. Sci. 109 (40), 15996–16003. doi: 10.1073/pnas.1205009109
van Hengstum P. J., Scott D. B., Gröcke D. R., Charette M. A. (2011). Sea Level controls sedimentation and environments in coastal caves and sinkholes. Mar. Geology 286 (1-4), 35–50. doi: 10.1016/j.margeo.2011.05.004
van Vliet D. M., von Meijenfeldt F. B., Dutilh B. E., Villanueva L., Sinninghe Damsté J. S., Stams A. J., et al. (2021). The bacterial sulfur cycle in expanding dysoxic and euxinic marine waters. Environ. Microbiol. 23 (6), 2834–2857. doi: 10.1111/1462-2920.15265
Vargas C. A., Cantarero S. I., Sepúlveda J., Galán A., De Pol-Holz R., Walker B., et al. (2021). A source of isotopically light organic carbon in a low-pH anoxic marine zone. Nat. Commun. 12 (1), 1604. doi: 10.1038/s41467-021-21871-4
Volkov I. I., Rozanov A. G. (2006). Fundamentals of biohydrochemistry of anoxic basins. Oceanology 46 (6), 803. doi: 10.1134/S0001437006060051
Wang H., Jin Q., Gao S. (2008). A preliminary study on the response of marine primary production to monsoon variations in the south China Sea basic characteristics. Acta Oceanologica Sin. 5), 21–35.
Wang Y., Zhang J., Sun P. (2007). The in-situ chlorophyll-a fluorometer and turbidity meter for marine application. Ocean Technol. 26 (1), 29.
Wu M. L., Liu Q. Y., Dong J. D., Wang Y. S., Wang D. X. (2015). Primary nitrite maximum in the euphotic layer near the xisha islands, south China Sea. Aquat. Ecosystem Health Manage. 18 (4), 414–423. doi: 10.1080/14634988.2015.1115321
Xie L., Wang B., Pu X., Xin M., He P., Li C., et al. (2019). Hydrochemical properties and chemocline of the sansha yongle blue hole in the south China Sea. Sci. Total Environ. 649, 1281–1292. doi: 10.1016/j.scitotenv.2018.08.333
Yao P., Chen L., Fu L., Yang Z., Bi N., Wang L., et al. (2018). Controls on vertical nutrient distributions in the sansha yongle blue hole, south China Sea. Chin. Sci. Bull. 63 (23), 2393–2402. doi: 10.1360/N972018-00155
Yao W., Millero F. J. (1995). The chemistry of the anoxic waters in the framvaren fjord, Norway. Aquat. Geochem 1, 53–88. doi: 10.1007/BF01025231
Yao P., Wang X. C., Bianchi T. S., Yang Z. S., Fu L., Zhang X. H., et al. (2020). Carbon cycling in the world's deepest blue hole. J. Geophys Res.: Biogeosciences 125 (2), e2019JG005307. doi: 10.1029/2019JG005307
YSI Environmental (2006). “In vivo measurement of chlorophyll and the YSI 6025 wiped chlorophyll sensor,” in YSI environmental white paper (Ohio: Yellow Springs), 1–4.
Yu Y., Xing X., Liu H., Yuan Y., Wang Y., Chai F. (2019). The variability of chlorophyll-a and its relationship with dynamic factors in the basin of the south China Sea. J. Mar. Syst. 200, 103230. doi: 10.1016/j.jmarsys.2019.103230
Zhang J. Z., Millero F. J. (1993). The chemistry of the anoxic waters in the cariaco trench. Deep Sea Res. Part I: Oceanographic Res. Papers 40 (5), 1023–1041. doi: 10.1016/0967-0637(93)90088-K
Zhou S., Liu J., Yao P., Fu L., Yang Z., Zhang Y., et al. (2023). Unique bacterial communities and lifestyles in deep ocean blue holes: insights from the yongle blue hole (South China Sea). Front. Mar. Sci. 10, 104. doi: 10.3389/fmars.2023.1086117
Keywords: Yongle blue hole, dissolved inorganic nutrients, seasonal variation, vertical distribution, nutrient ratios
Citation: Chen L, Yao P, Yang Z and Fu L (2023) Seasonal and vertical variations of nutrient cycling in the world’s deepest blue hole. Front. Mar. Sci. 10:1172475. doi: 10.3389/fmars.2023.1172475
Received: 23 February 2023; Accepted: 03 May 2023;
Published: 17 May 2023.
Edited by:
Wen Zhuang, Shandong University, ChinaReviewed by:
Zhuo-Yi Zhu, Shanghai Jiao Tong University, ChinaXiangbin Ran, Ministry of Natural Resources, China
Copyright © 2023 Chen, Yao, Yang and Fu. This is an open-access article distributed under the terms of the Creative Commons Attribution License (CC BY). The use, distribution or reproduction in other forums is permitted, provided the original author(s) and the copyright owner(s) are credited and that the original publication in this journal is cited, in accordance with accepted academic practice. No use, distribution or reproduction is permitted which does not comply with these terms.
*Correspondence: Peng Yao, yaopeng@ouc.edu.cn