Numerical simulation of offshore wind power pile foundation scour with different arrangements of artificial reefs
 Mingda Yang
  Yanli Tang
 Fenfang Zhao
- Fisheries College, Ocean University of China, Qingdao, China
The industrial integration of offshore wind power and marine ranches has been actively explored and developed in many countries. This emerging industrial synergy can significantly improve the ecological friendliness of offshore wind power and contribute to the development of the marine economy in the region. This industrial synergy is an important development direction for future offshore engineering. Artificial reefs (ARs) are critical components of marine ranches and are widely placed around offshore wind foundations (OWFs). The ARs can block the water flow and form a complex wake region behind it, which changes the original turbulence structure and reduces scour around the OWF. Therefore, determining the arrangement of ARs for scour protection around an OWF is of great engineering significance. In this study, a three-dimensional numerical model is established using a prototype of the first offshore wind power-marine ranch demonstration project in China. The turbulent change and sediment movement between the OWF and ARs are solved using the Reynolds-averaged Navier-Stokes (RANS) and sediment transport equations. Moreover, the variations in the maximum scour depth and scour volume around the OWF at different arrangements of ARs are explored. The results demonstrate that the arrangement of ARs weakens the horseshoe vortices in front of the OWF and destroys the vortex shedding behind the OWF, thereby producing a beneficial scour protection effect. Various arrangements of ARs have different effects on scour results around the OWF. Increasing the height of the AR could significantly reduce the scour results around the OWF and play an effective role in scour protection, followed by the tandem arrangement of ARs, whereas the parallel arrangement of ARs will produce negative scour effects. This study will serve a vital guiding role in the arrangement of ARs and practical significance for scouring protection around the OWF.
1 Introduction
The sustainable development of marine fisheries has emerged as a major global concern because of the increasing degradation of the marine environment and the global reduction of fishing resources. In many sea regions, a novel fisheries development model known as “marine ranching” is used to increase marine fisheries resources, restore ecosystem functions, and ultimately achieve sustainable use of fisheries resources (Fang et al., 2021). Alternatively, many nations are actively pursuing the development of renewable energy sources to address climate change and the increase in electricity consumption. Since wind energy has great potential as a renewable and clean energy source, offshore wind power has rapidly expanded globally over the past 20 years (Bilgili et al., 2011; Chen and Lin, 2022). However, the widespread expansion of offshore wind power and marine ranching will result in sea space overlap, which will eventually generate issues such as conflicting sea usage (Chu et al., 2022). To address this problem, Europe was the first to propose an integrated development of offshore wind facilities and marine ranching facilities. An emerging industrial synergy that significantly improves the ecological friendliness of offshore wind power and contributes to the development of the marine economy in the region is a crucial new development direction for the future (Yang et al., 2019), as shown in Figure 1A. Preliminary research has been conducted on the integrated design of offshore wind foundation (OWF) and aquaculture cages in marine ranching (Lei et al., 2021; Huang et al., 2022; Zhang et al., 2022). Artificial reefs (ARs) are vital fishery facilities in marine ranches. ARs can produce significant flow-field effects through their structures, which play a pivotal role in protecting and increasing fishery resources (Komyakova et al., 2019). Simultaneously, the change in flow around the ARs will impact the sediment movement around the OWF and ultimately affect the stability of the OWF. In order to reasonably arrange ARs to avoid aggravating the scour around the OWF, it is necessary to explore the challenges of ARs arrangement around the OWF. Therefore, scientifically arranging ARs around the OWF is of great engineering significance.
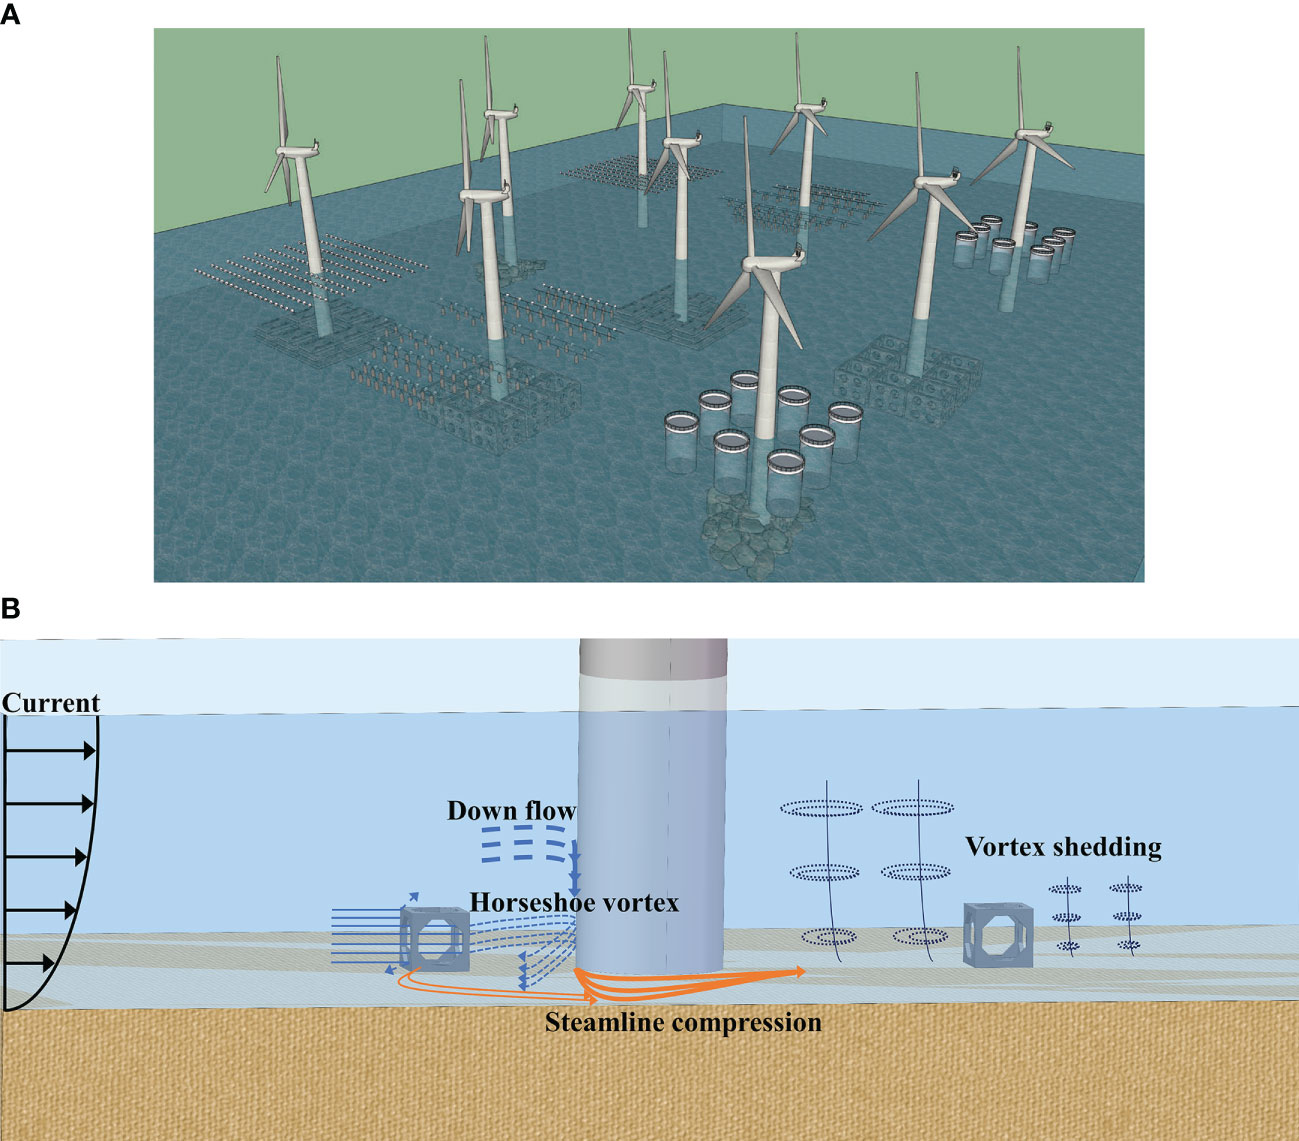
Figure 1 Combination of marine ranching and offshore wind power: (A) combination of OWFs and ARs (Yang et al., 2019) (B) characteristics of turbulent motion around an OWF and ARs.
The scour around marine structures is an established engineering problem that results from interactions between currents, structures, and sediments. Large-diameter monopile foundations (abbreviated as “pile”) are the most commonly used foundation form of OWFs. However, their embedded depth is reduced by sediment scour, which can significantly affect OWF safety and service life (Dai et al., 2021). When the fluid flows through the pile, a horseshoe vortex is formed in front of the pile, fluid compression acceleration occurs on both sides of the pile, and vortex shedding occurs behind the pile. These vortex structures with high turbulent kinetic energy enhance the sediment transport capacity and eventually produce scour and deposition around the pile. In the past decades, many experimental and theoretical studies have been conducted on the scour phenomenon around piles under various conditions. They include (1) the scour mechanism due to diverse vortex systems (Sumer et al., 1992; Sumer and Fredsøe, 2001; Roulund et al., 2005; Jenkins et al., 2007; Baykal et al., 2015), (2) the scour development process over time and prediction of the scour balance time (McGovern et al., 2014; Ma et al., 2018; Schendel et al., 2018; Lu et al., 2022), and (3) the main factors affecting the scour results and characteristics (Zhao et al., 2010; Yao et al., 2018; Gautam et al., 2021; Chen et al., 2022; Yang Q. et al., 2022).
The focus of research has shifted to effectively protecting the seabed around the OWF from scouring as the basic theory of scour has been gradually refined. The scour protection measures of OWF are classified into active and passive protection methods. Active scour protection involves the addition of structures at the bottom of the OWF, such as collars and anchor branches (Pandey et al., 2020; Yu et al., 2020; Zhang et al., 2021). These methods can change the flow pattern at the bottom of the OWF and strengthen the ability to protect the seabed, thereby further reducing sediment transport at the junction (Yang et al., 2020; Yang F. et al., 2021; Deng et al., 2022). Active scour protection structures, such as skirted mudmat foundations, multi-bucket jacket foundations, composite bucket foundations, and skirted caisson foundations, have also been designed to solve scour damage under various complex conditions (Yu et al., 2019; Yao et al., 2020; Li et al., 2022; Lian et al., 2022; Wei et al., 2022). Passive scour protection changes the flow movement mode and seabed composition without changing the structure of the OWF, such as by placing a stone protection layer covering the sediments. This is the most widely used scour protection measure in practical engineering applications. It was found that the number of stone layers is a critical factor affecting scour results (Yang Q. et al., 2021). The scour depth decreases with an increasing number of stone layers because more layers will generate more pores to consume turbulence. Therefore, determining the size of the stone and the scope and thickness of the stone protection layer are key to achieving effective scour protection (Nielsen et al., 2013; Ma and Chen, 2021). However, some field surveys of offshore wind power around the world found that the arrangement range and thickness of stone layers are difficult to implement due to the uneven size of stones in practical engineering applications. These conditions lead to the second scour around the stone protection layer, and scours at the stone’s edge result in stone deformation, subsidence, and scour protection failure (Raaijmakers et al., 2010; Whitehouse et al., 2011). Another type of passive scour protection is the installation of several smaller diameter piles around the OWF, known as sacrificial piles, to reduce the flow velocity and shear stress around the OWFs. Research has found that the protective effect of sacrificial piles depends mainly on their number and arrangement (Wang et al., 2017; Nazari-Sharabian et al., 2020; Li et al., 2022). In the context of integration of marine ranching and offshore wind power, ARs play a similar role to sacrificial piles when placed around the OWF. Compared to other passive scour protection, using ARs as passive scour protection has significant advantages. Firstly, Each AR can be accurately placed around the OWF based on coordinates, quantitative research on the arrangement of multiple ARs can identify the optimal flow field effect to significantly protect from scour around the OWF (Liu and Su, 2013). Secondly, optimizing the structure of ARs can avoid their own scour and increase efficiency (Tang et al., 2022; Yang M. et al., 2022; Zhao et al., 2022). Besides, ARs are not “sacrificial” because they can improve the marine ecosystem around the OWF through the generated flow field effects and promote ecological benefits, such as sustainable use of species and habitats.
Combining OWFs with ARs to mitigate sediment scour is a pressing issue for future engineering endeavors (Pan et al., 2022), and no existing literature addresses this specific issue. There are two main theoretical justifications for using ARs as passive scour-protection structures for OWF. First, previous research demonstrated that ARs could effectively reduce wave and current energy, block sediment, and prevent erosion when used in conjunction with traditional breakwaters. These properties make ARs well-suited for addressing local scour and erosion issues in traditional underwater breakwaters (Srisuwan and Rattanamanee, 2015; López et al., 2016; Almeida, 2017; Kim et al., 2020; Ghiasian et al., 2021; Marin-Diaz et al., 2021; Kim et al., 2022). It is evident that ARs can attenuate waves and mitigate sediment transport. Second, the interaction of water with ARs creates a wake region that generates vortexes and contributes to the development of a recirculating water flow (Jung et al., 2022). The wake region behind ARs is widely regarded as an important habitat for fish, as it provides opportunities for shelter, feeding, spawning, and inhabitation. The ability of ARs to create these habitat areas is an essential aspect of their ecological functions. Previous research has used both experimental and numerical simulation techniques to quantify the size and range of wake regions behind ARs (Kim et al., 2016; Kim et al., 2019; Kim et al., 2021). These studies examined the relationship between the wake region range and various reef structure characteristics, including opening design, roughness, complexity, arrangement, and combination of ARs (Liu and Su, 2013; Jiang et al., 2016; Wang et al., 2018; Jiang et al., 2020; Wang et al., 2021; Jung et al., 2022; Zhou et al., 2022; Kim et al., 2022). When ARs are arranged around the OWF, the wake region can converge with the horseshoe vortex at the bottom of the OWF and disrupt the turbulent structure, reducing the transport capacity of the horseshoe vortex for sediment and providing scour protection, as shown in Figure 1B. However, no published literature has studied the interaction between ARs and the OWF, such as hydrodynamic interactions, sediment transport processes, and other engineering issues. Therefore, several issues require further investigation and analysis, such as the optimal spacing between ARs and the OWF for maximum scour protection effectiveness and the relationship between scour protection efficacy and the combination mode of multiple ARs.
It is essential to examine the impact of ARs on sediment scour in the vicinity of an OWF. In this study, a numerical model based on the first demonstration project of marine ranching and offshore wind power integration in China was developed using the computation fluid dynamics (CFD) method was used to investigate the effect of AR arrangement spacing and combination under steady flow on the turbulent structure, and sediment scours around the OWF. Section 2 presents the construction of the numerical model and related control equations, and verifies the accuracy of the numerical model. Section 3 discusses the results of simulation cases involving different parameter settings and describes the hydrodynamic characteristics and sediment transport processes between the AR and the OWF. The conclusions are given in Section 4. This research aims to fill a gap in the literature on the combination of ARs and OWF, provide valuable engineering guidance for arranging ARs around OWF, and suggest new approaches for scour protection in marine engineering.
2 Material and methods
2.1 Numerical methods
In the present study, a numerical analysis of the local scour between the OWF and ARs is conducted using the commercial CFD code FLOW-3D. The CFD code fully solved the three-dimensional transient Navier-Stokes governing equations using the Finite Difference Method (FDM) in a fixed Eulerian mesh. Automatic time-step adjustment is used to ensure the stability and convergence of the simulation. A first-order numerical scheme is used to discretize each term in the momentum equation. The Generalized Minimal Residual (GMRES) algorithm is selected to iteratively solve the linear system of pressure equations, which effectively improved the convergence of the simulation and significantly reduced the calculation time. A brief introduction to the theoretical model is provided, as described by some scholars (Nielsen et al., 2013; Zhang et al., 2017).
2.1.1 Governing equations of the flow
The Reynolds-averaged Navier-Stokes (RANS) equations closed with the renormalization group (RNG) turbulence model are regarded as the governing equations for the incompressible viscous fluid motion around the OWF and ARs. The governing equations of the flow can be divided into continuous and motion equations as follows:
where u, v, and w are the velocity components in x, y, and z directions, respectively. Ax, Ay and Az represent the area fractions open to the flow in x, y and z directions, respectively. Gx, Gy, and Gz denote the body accelerations, whereas fx, fy, and fz are the viscous accelerations in the respective directions x, y, and z. VF denotes the fractional volume open to flow, p is the average hydrodynamic pressure, and ρ is the fluid density.
2.1.2 Turbulence model
The RNG k-ϵ turbulent model is adopted in this study to investigate the local scour around the OWF and ARs because the RNG model is capable of accurately capturing the flow field recirculation and is widely used to predict turbulent motion around various offshore structures. The k and ϵ equations in the RNG model are expressed as follows:
where PT denotes the turbulent kinetic energy production, kT represents the specific kinetic energy associated with turbulent velocity fluctuations, GT is the turbulent energy generated by buoyancy, ϵT is the dissipation rate of the turbulent energy, Diffϵ and DiffkT are terms related to diffusion, and CDIS1, CDIS2 and CDIS3 are dimensionless parameters.
2.1.3 Sediment transport model
The sediment scour model involves two parts: setting up sediment types and their related properties, including the grain size, mass density, and angle of repose. The other is to estimate the motion of sediment (suspended sediment transport, settling, entrainment, and bed load transport) by predicting sediment erosion, advection, and deposition.
(1) Sediment starting
The entrainment lift velocity of sediment is computed as:
where αi represents the entrainment parameter, d* is a dimensionless parameter, and di is the diameter of the sediment. ns is the outward pointing normal to the packed-bed interface. ρi is the density of the sediment, ρf is the fluid density, and |g| is the magnitude of the acceleration of gravity g. θi indicates the local Shields parameter, θcr,i is the critical Shields parameter and computed by
(2) Entrainment and deposition
The equation of the settling velocity (usetting,i) and the bedload transport model proposed by Soulsby (1997) are used in the present study:
where vf is the kinematic viscosity of the fluid. The model introduced by Meyer-Peter (1948) is used to calculate bedload motion.
where Φi denotes the dimensionless bedload transport rate, whileβm is a coefficient generally set to 8.0.
(3) Suspended sediment concentration
The suspended sediment concentration is calculated by solving its own transport equation:
Here, Cs,i denotes the suspended sediment mass concentration, which is defined as the sediment mass per volume of the fluid-sediment mixture; Df is the diffusivity; and us,i indicates the velocity of suspended sediment.
(4) Sea bed deformation tracking
The fractional area-volume obstacle representation (FAVOR) method is used in the CFD code, which uses the volume fraction of solids within each grid to determine the surface of the solids. In the computational domain, the sand content in each grid is calculated using Equations (5)-(9). FAVOR method is used in the sediment transport model to accurately describe the shape of the seabed by calculating the area and volume fraction parameters of accumulated sediment in each grid throughout the entire scouring process.
2.2 Computational domain and meshing
This research is based on the first demonstration project on integrating offshore wind power and marine ranches in China. The offshore wind power plant is located in Laizhou Bay, Shandong Province, China, where the water depth is approximately 10 m. The sea area is a tidal current with a maximum flow velocity of approximately 0.6 m/s. A constant flow velocity of 0.6 m/s is used as the simulated flow condition, as the scour results obtained under this flow condition can be approximated as the results of tidal current (Schendel et al., 2018). The seabed sediment mainly consisted of silty clay with a median diameter (d50) of approximately 0.5 mm. The diameter of the OWF (D) is 5 m. The type of AR selected for the arrangement is shown in Figure 2A, which is widely used in the marine ranch of China, with a side length (L) of 2 m and a positive octagonal opening. The flow characteristics and scour process of this AR are fully investigated in our previous study, and the ideal design of this AR is derived and applied in this study.
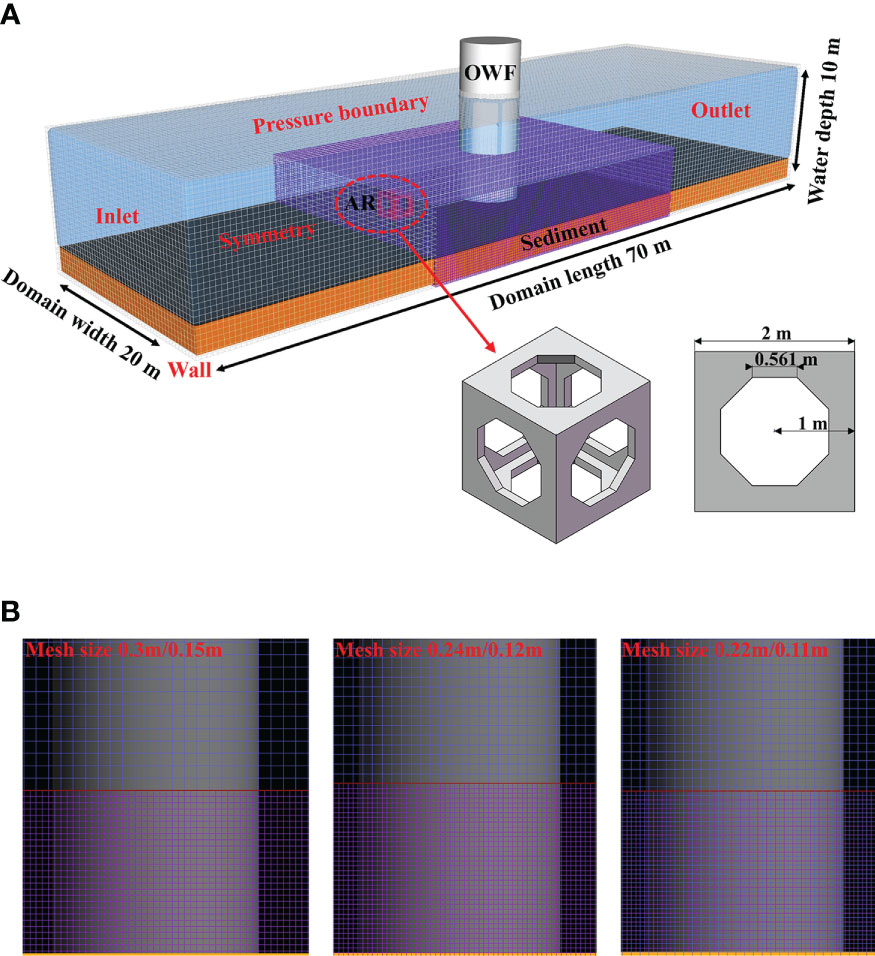
Figure 2 Mesh independence analysis: (A) distribution of the flow velocity contour near the seabed around the OWFs (B) distribution of scour depth on both sides of OWFs.
The dimensions of the computational domain are 70 m in length, 20 m in width, and 10 m in height Figure 2A, including the OWF located in the center of the domain, and a 70 m×20 m×2 m sandy seabed composed of sediment with a median diameter of 0.5 mm. The parameter settings for the simulations are listed in Table 1.

Table 1 Numerical calculation of scouring conditions.
An appropriate mesh size is crucial to the accuracy and efficiency of numerical simulations. The independence of the mesh is investigated to find a mesh strategy with reasonable accuracy and high efficiency. As shown in Figure 3, the computational domain is discretized using a uniformly spaced structured mesh system. A nested mesh is created around the OWF and ARs to encrypt the mesh size. According to the relevant literature, the size of the nested cell is usually set between 0.03 D and 0.05 D of the OWFs, and the external cell size is usually twice the size of the nested cell. Therefore, three mesh sizes (the global mesh/nested mesh) are set to analyze the mesh independent test as follows: 0.3 m/0.15 m, 0.24 m/0.12 m, and 0.22 m/0.11 m, respectively Figure 2B. Numerical calculations of the OWF scour process are performed for the model divided by three mesh sizes at a water depth of 10 m and a flow velocity of 0.6 m/s. The calculation time is 7000 s.
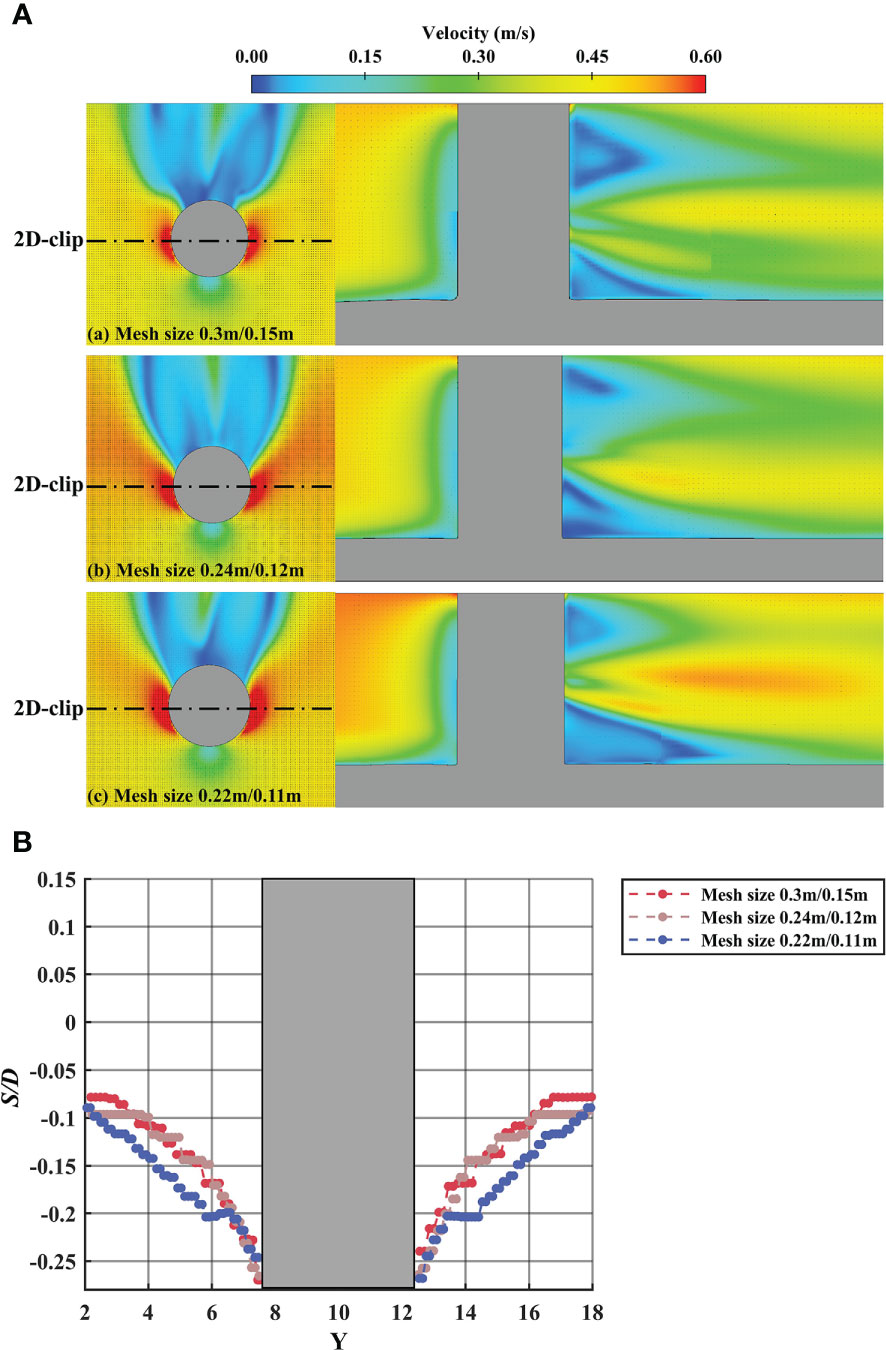
Figure 3 Calculation model and mesh strategy (A) calculation domain settings and boundary conditions (B) three different mesh sizes.
Figure 3A shows the flow velocity distribution around the OWF for three mesh sizes. It can be observed that the acceleration of the fluid on both sides of the OWF and the shedding of the vortex street behind the OWF are almost identical for the three mesh sizes. However, a smaller mesh size will produce a more detailed description of the flow separation. The scour depth distribution of the cross-section of the OWF central axis for the three mesh sizes is shown in Figure 3B. It can be seen that the scour depth generated by mesh 0.22 m/0.11 m on both sides away from the OWF is slightly greater than the other two mesh sizes. However, the scour depths generated by the three mesh sizes are nearly identical near both sides of the OWF. These three mesh sizes can precisely simulate the turbulence characteristics and sediment scours around the OWF because they are within the range of the optimal mesh size settings. Therefore, to ensure the accuracy of the calculation results and the calculation efficiency, the subsequent research and discussion will select the middle size mesh (0.24 m/0.12 m) as the mesh parameter for the calculation.
2.3 Boundary condition
First, a velocity vector of 0.6 m/s is specified at the inlet boundary. The scour model is not active, and a sufficiently long numerical channel is used to develop the flow field fully. When the boundary layer of the seabed is fully formed, it can be regarded as a fluid that has completely developed on a rough seabed. The velocity profile is intercepted as the Neumann boundary condition at the velocity inlet of the calculation domain.
At the top, the pressure is specified as standard atmospheric pressure and zero gradients. The symmetry boundary condition is adopted on the sides of the model, where the normal velocity and all gradients in the normal direction are zero. A pressure boundary condition is adopted at the outlet, where the fluid level is specified during the entire calculation period. The surfaces of the OWF and ARs are treated as no-slip wall boundaries Figure 2A.
2.4 Validation of numerical models
In the present study, the effect of the flow field changes between the ARs and OWF on the scour results is investigated. To validate the CFD models, the velocity distribution around the AR and the scour of the pile between the present simulation results and the published data are compared.
2.4.1 Validation of velocity distribution around AR
Wang et al. (2021) conducted particle image velocimetry (PIV) experiments on a symmetrical cubic porous AR model in a tank to explore the changes of flow characteristics around the AR. The velocity distribution around the AR is validated by comparing the experimental data and the present simulation results.
Figure 4A shows the velocity vector distribution of fluid flow around the AR. It can be seen that the present simulation results are in good agreement with the experimental data, and a large wake region is formed behind the AR, which is crucial for present studies. The velocity distribution along y = 0.06 m, 0.1 m, and 0.15 m are represented in Figure 4B. Slight deviations arise because of turbulent motion at locations close to the AR. In general, the comparison between the PIV experimental data and the simulated results shows good agreement, and the present numerical model can accurately simulate the flow characteristics around the AR.
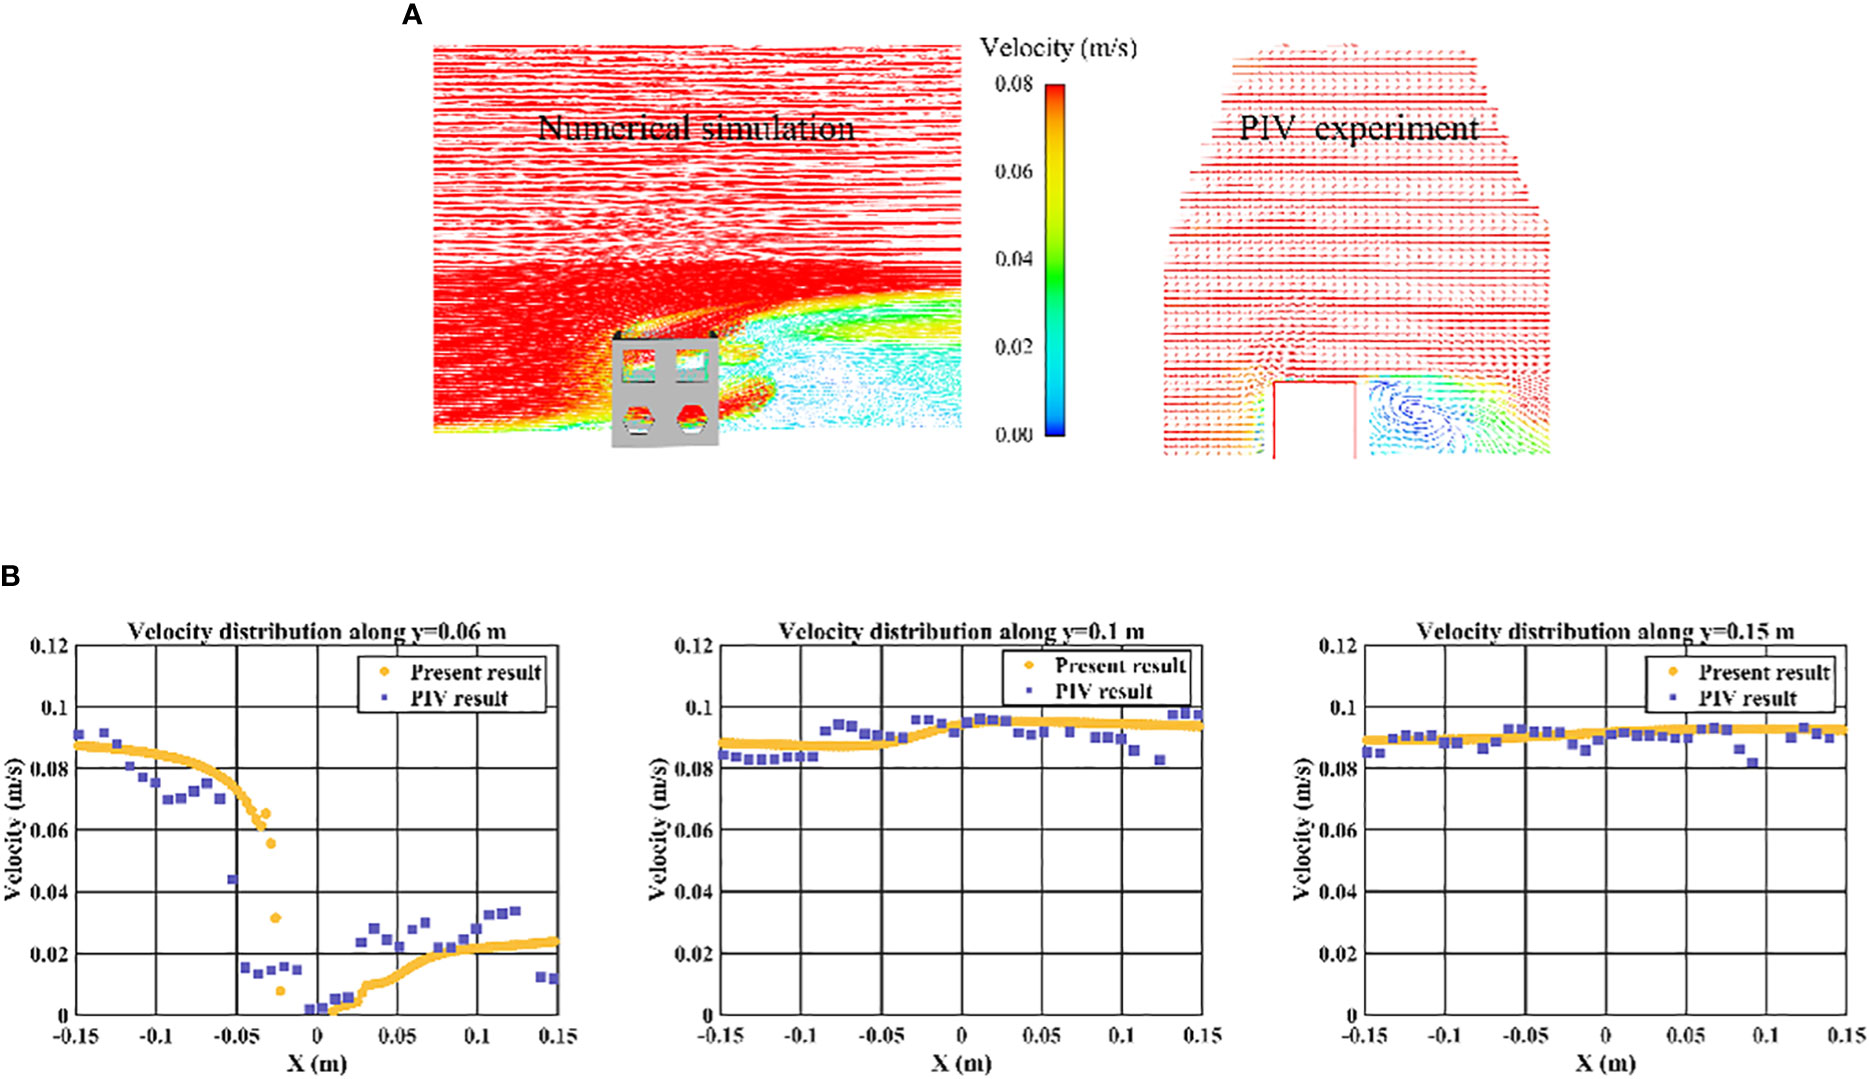
Figure 4 Numerical model calculation and verification about the flow of an AR: (A) streamline distribution around the AR (B) the velocity curve along y = 0.06 m, y = 0.1 m and y = 0.15 m respectively.
2.4.2 Validation of scour around pile
Further validation is performed by comparing the scour around a pile between the numerical results of the present study and published experimental data (Zhao et al., 2010). For comparison, the present simulations are conducted at a water depth of 0.5 m and a velocity of 0.441 m/s. The diameter of the pile is 0.1m, and the median particle size of the sediment is 0.4 mm.
A comparison of the scour depth between the present numerical simulations and the measured data is shown in Figure 5A, and the three-dimensional morphology is shown in Figure 5B. It can be seen that the numerical model can predict the maximum scour depth around the pile. The maximum scour depth generated is at the 45° side of the pile, where the flow compression acceleration causes the increase of seabed shear stress. Subsequently, the scour area starts to develop towards the front and both sides of the pile, forming a spoon-shaped scour hole. The simulated scour depths on both sides and in front of the pile are in excellent agreement with the measured data but slightly underestimated the scour range behind the pile. The variation in the maximum scour depth with time is illustrated in Figure 5C. It can be seen that a rapid scour phase occurred first for about 2000 s, then the scour rate decreases and reaches the scouring equilibrium phase at about 7000 s, with almost constant scour depth. The process produced by the numerical simulation is almost identical to the published experimental data. Although the scour depths calculated numerically in the early stages are slightly underestimated, they yield almost identical maximum scour depths, with an error of no more than 5%. As this study mainly investigates the impact of different layout parameters of ARs on the development of scour around the OWF, the present deviation value is within the acceptable range. Therefore, it is feasible and accurate to establish a three-dimensional numerical scour model to study scour around an OWF.
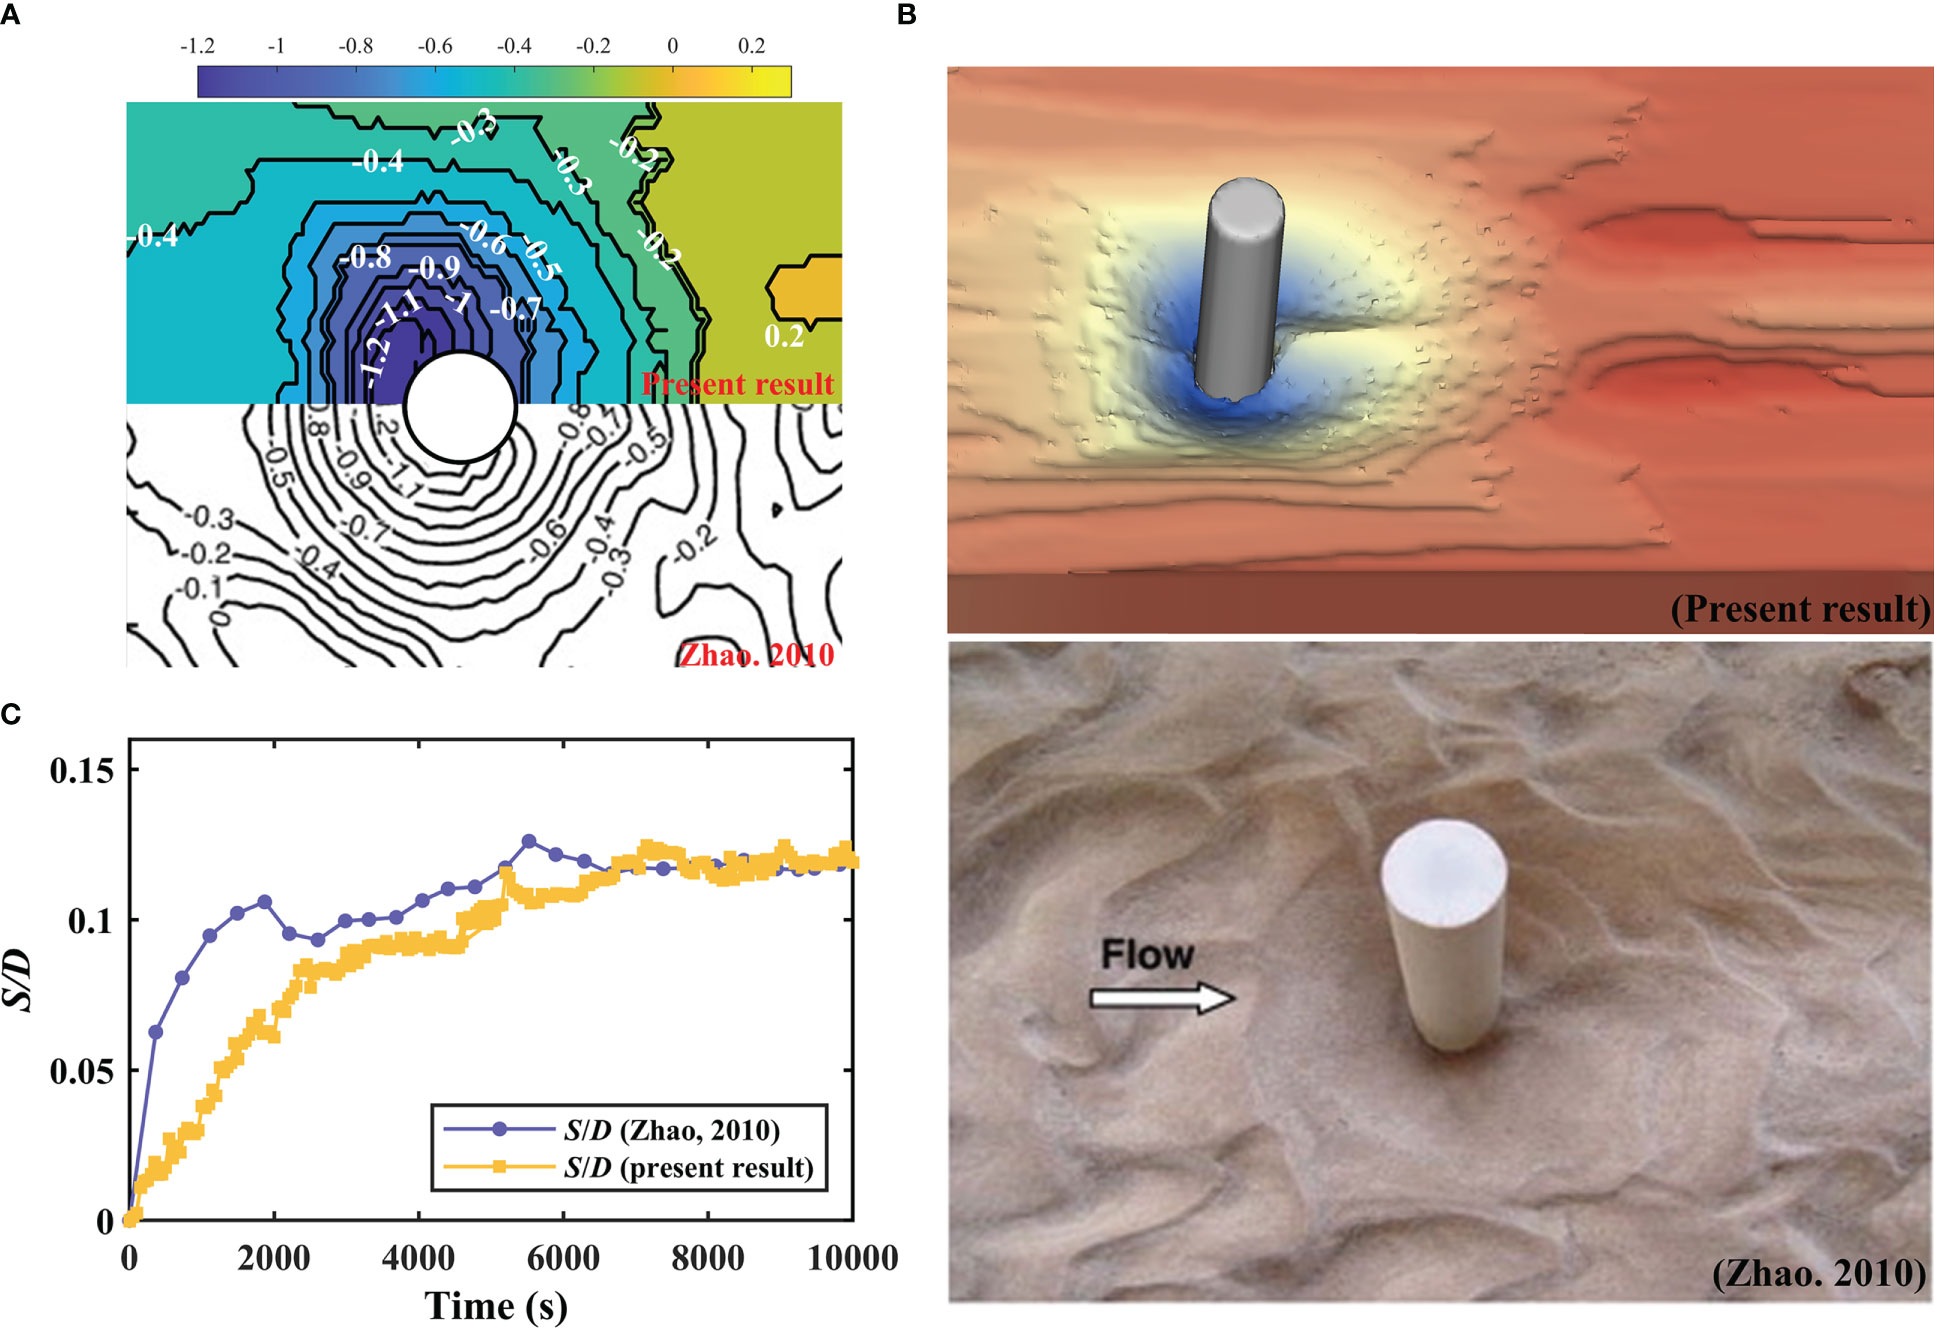
Figure 5 Comparison of the present results and experimental data from (Zhao et al., 2010): (A) contour of SID at 10000 s (B) scour shapes at 10000 s (C) time development of the maximum scour depth.
After validating the velocity distribution around the AR and the scour around a pile, it can be concluded that this numerical model can capture the flow characteristics around the AR structure and accurately predict the pile scour process. The present CFD model can be applied for later investigations.
2.5 Numerical simulation group setting
The numerical simulations are divided into four groups to investigate the effects of the AR arrangement on the maximum scour depth and scour volume around the OWF, in addition to flow characteristics and scour mechanism between the ARs and OWF. First, the scouring process of a single OWF (control) is simulated, and its results are compared and analyzed with the results of subsequent studies. As shown in Figure 6, in Group I, the AR is placed at different locations on the central axis of the OWF, and the normalized distances of the ARs from the OWF (G/D) are − -1.0, -0.5, 0.5, 1.0, 2.0, and 4.0, respectively. In Groups II and III, two ARs are set in front of the OWF, and the distance between the OWF center cross section and ARs is fixed at 1.0 D. In Group II, the spacing direction of two ARs is perpendicular to the flow direction, and the normalized distance between the ARs (P/L) is set from 0 to 5.0, with an interval of 1.0. In Group III, the spacing direction of two ARs are along the flow direction with normalized spaces (T/L) of 0, 0.5, 1.0, and 2.0. In Group IV, the distance between the AR and OWF is fixed at 1.0 D, and the normalized heights of the ARs (H/L) are 1.0, 1.5, and 2.0. The specific numerical case conditions and parameter settings are shown in Figure 6 and Table 2, where G is the distance between the AR and OWF, and P and T are the horizontal and vertical spacing between the two ARs, respectively.
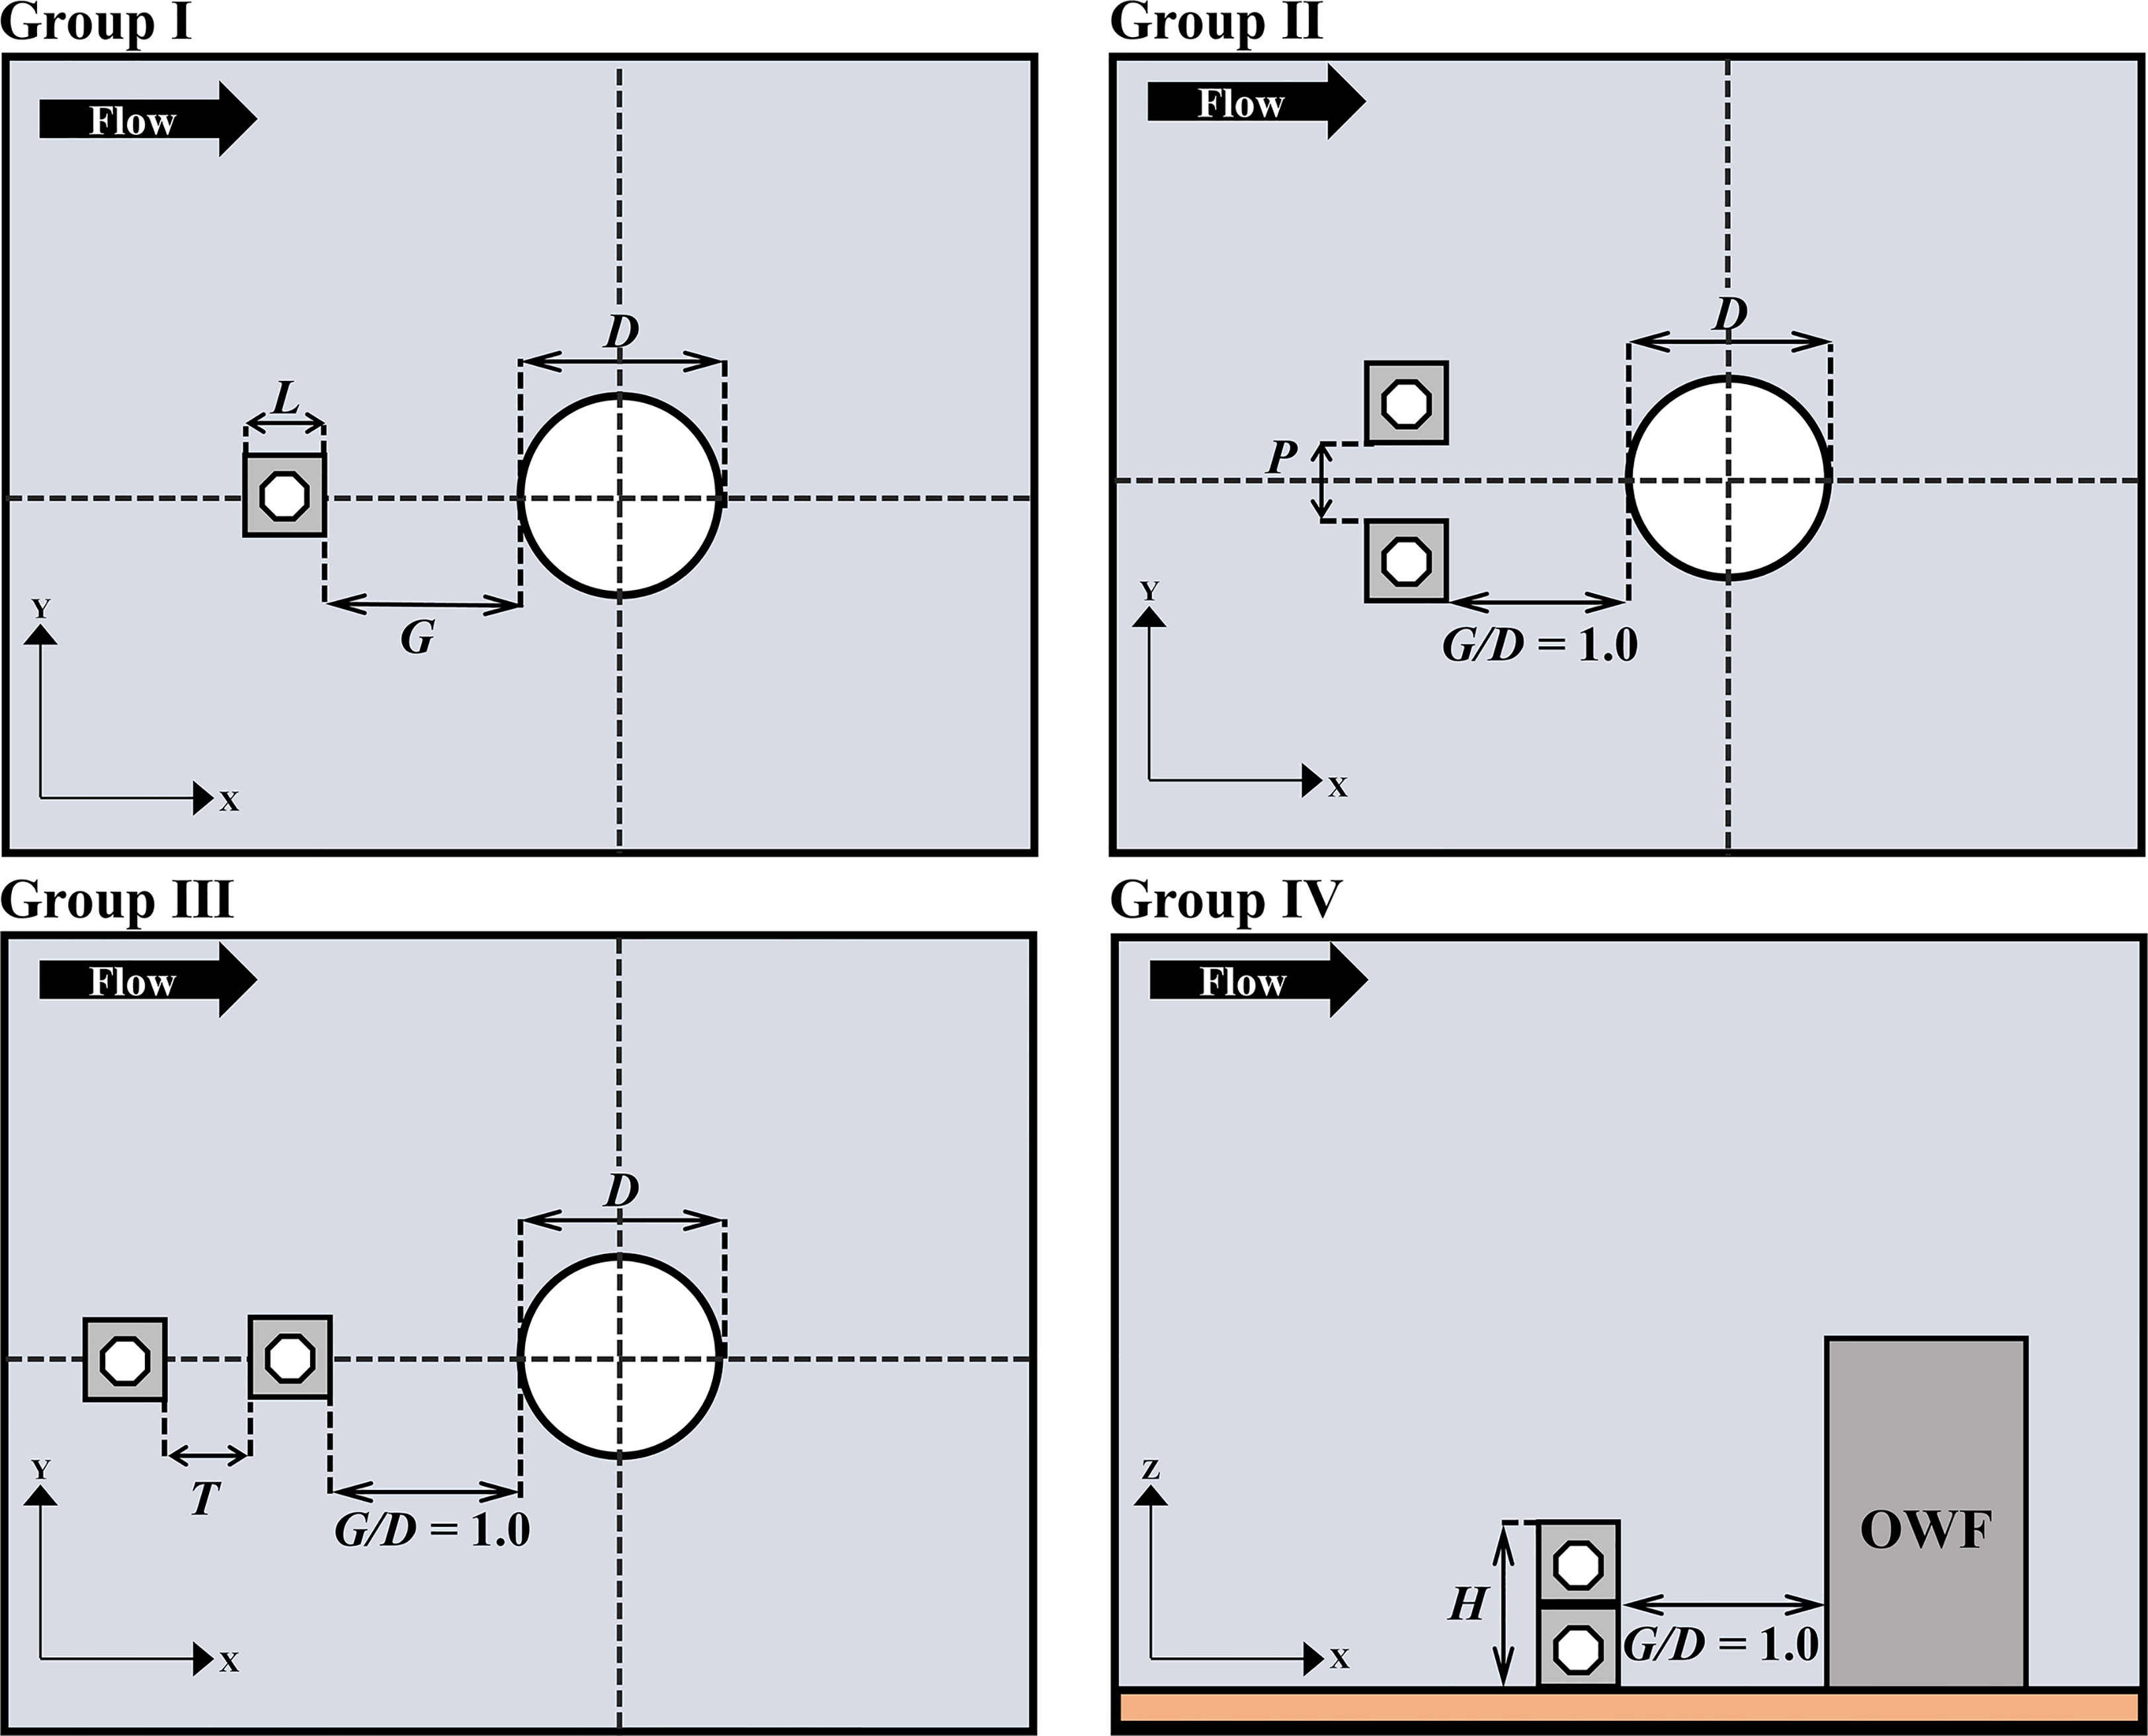
Figure 6 Group of numerical calculation.
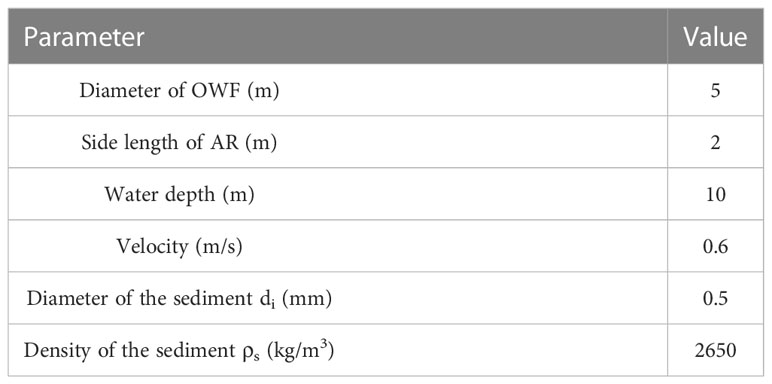
Table 2 Parameters used in the numerical calculations.
The scour depth S and scour volume Vs are two important indicators for determining the scour results around the OWF, and are dimensionless using the diameter D and volume Vc of the OWF, respectively. S is obtained by extracting the maximum scour depth around the OWF. Vs is obtained by using MATLAB programming to fit all scour points around the OWF to a surface (Figure 7) The calculation range is 7.5 m × 20.0 m × 2.0 m, which almost contains the main scour area. The simulation time of the scour process selected is 7000 s because the purpose of this study is to examine the influence of the arrangement distance and method of ARs on scour characteristics around an OWF. This means that there may be a state where the scour equilibrium condition is not reached in some simulation cases. Further research is needed on the scour phenomenon after reaching the equilibrium conditions.
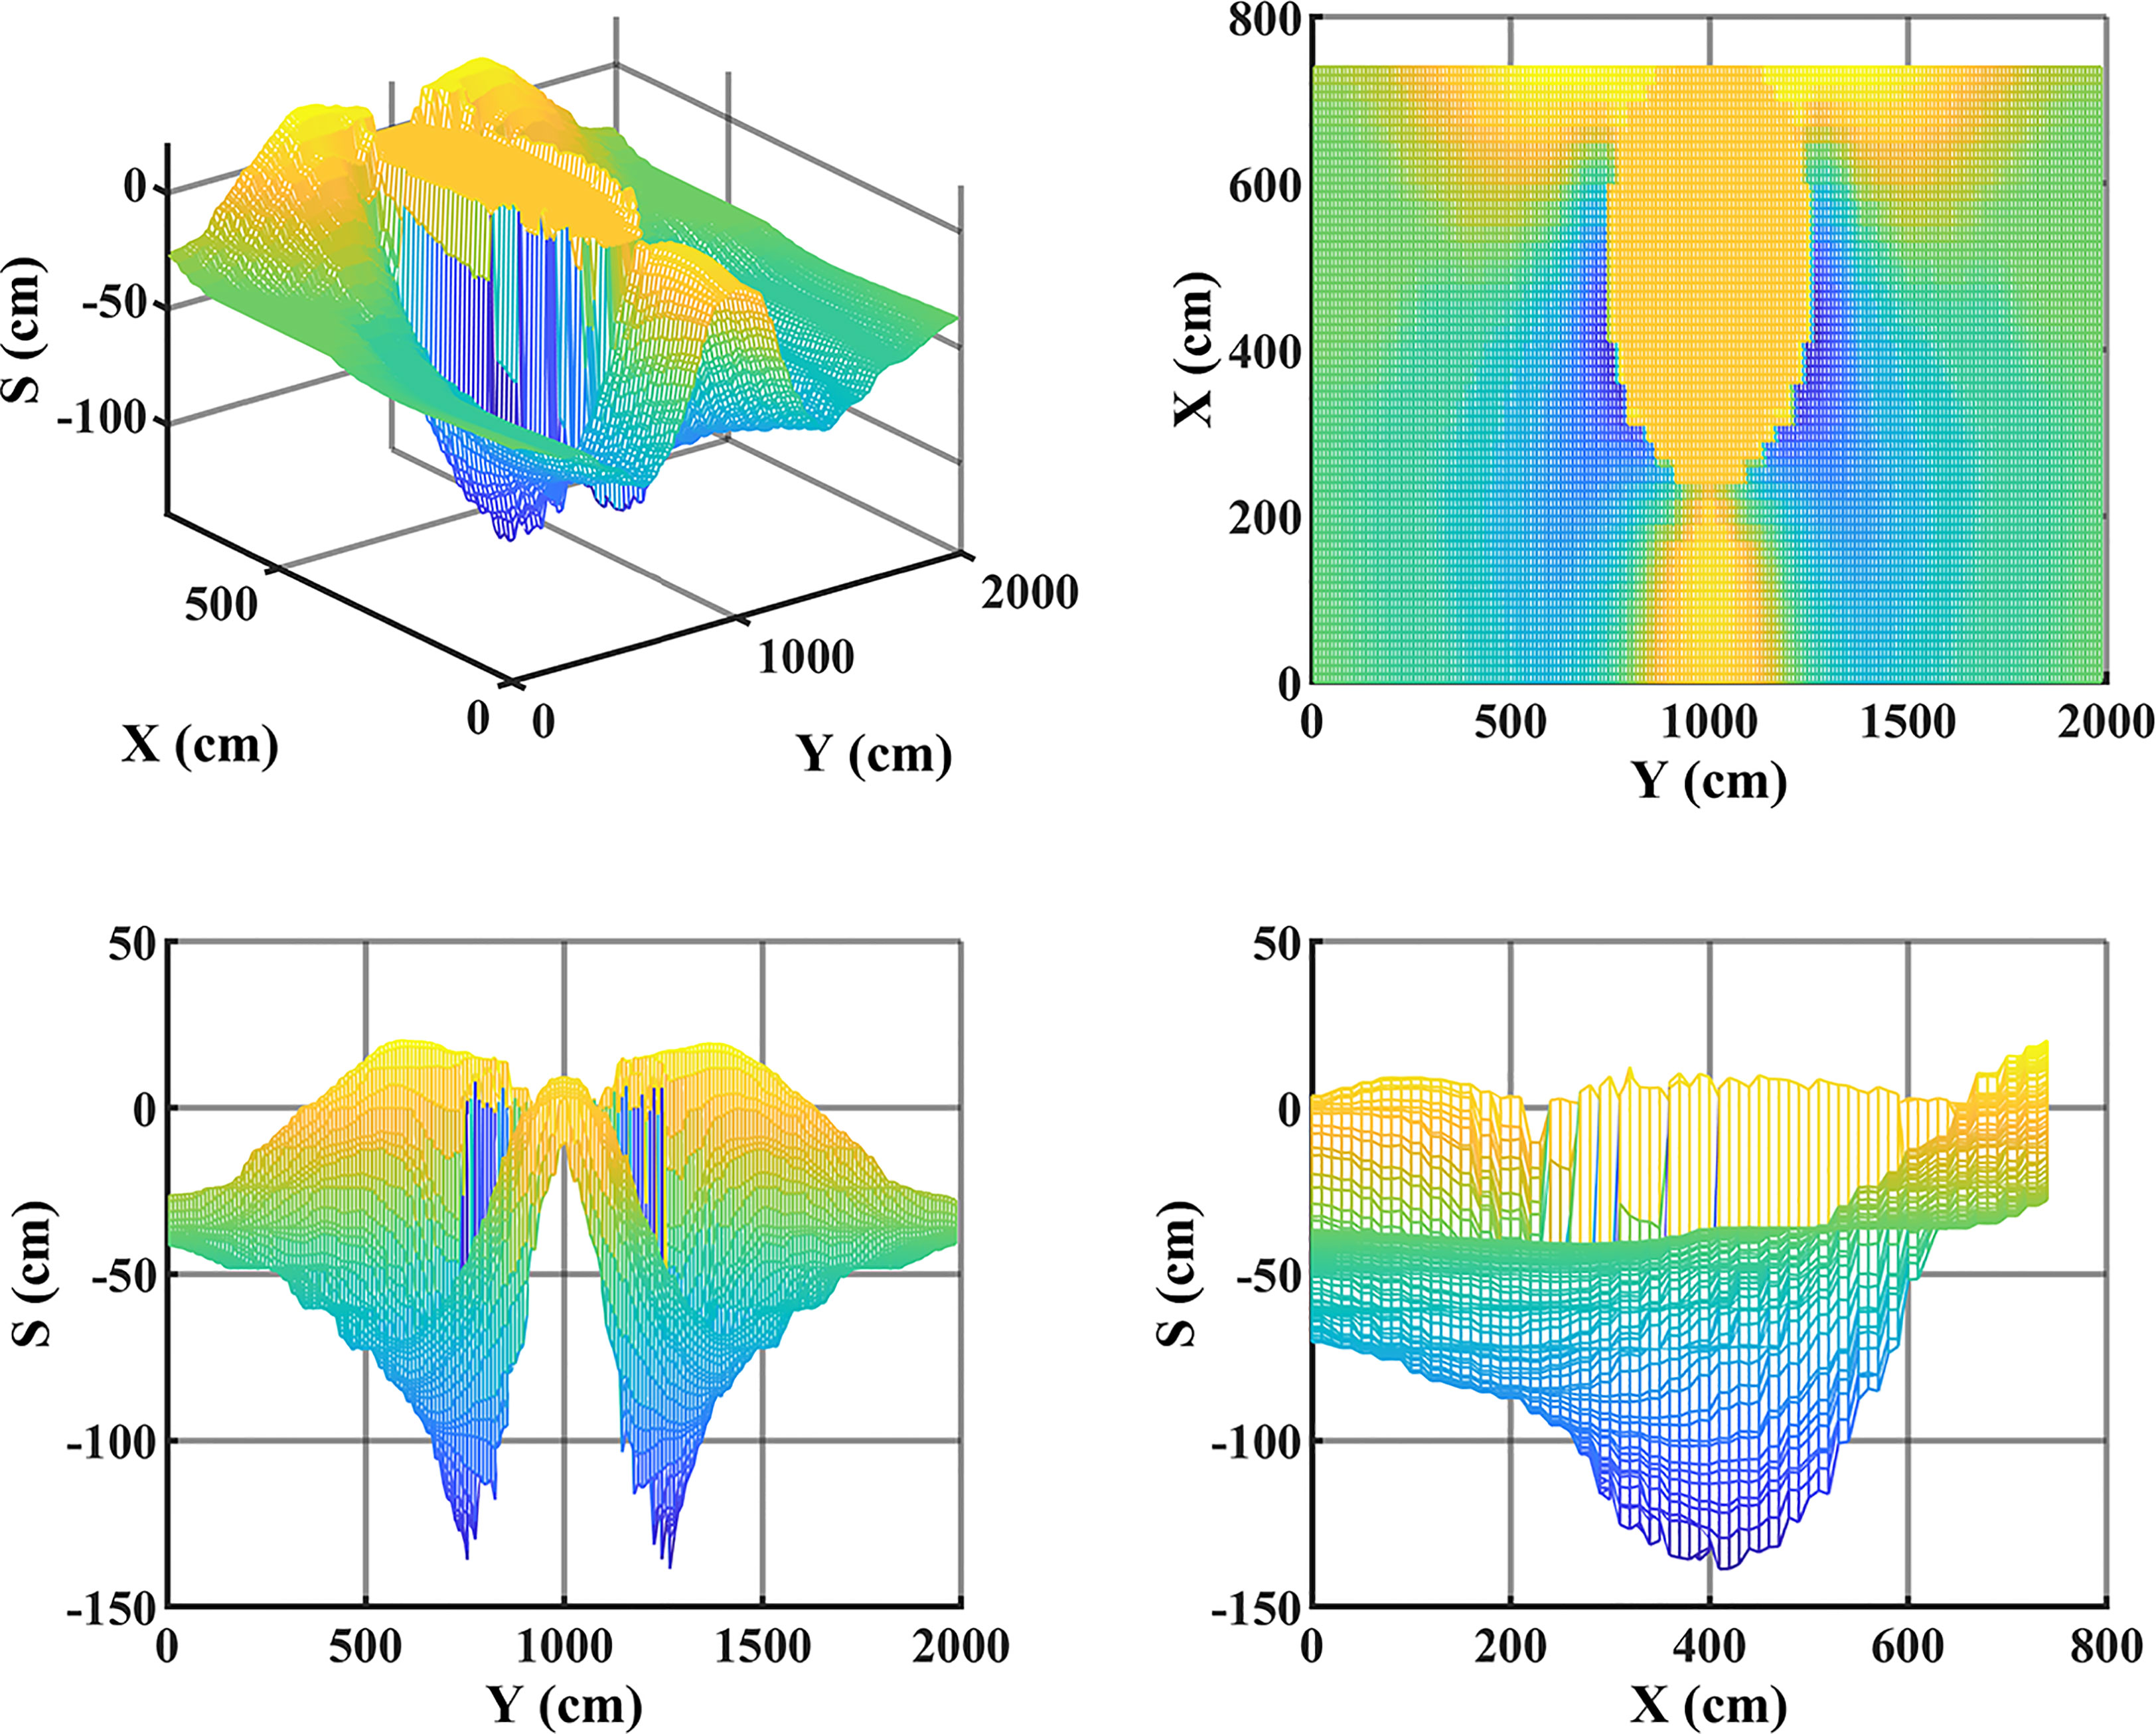
Figure 7 Scour volume calculation process.
3 Numerical results and discussion
3.1 Influence of G/D
Figure 8A depicts the seabed surface elevation around the OWF for different distances between the AR and the OWF at the last moment. In the control case, it can be seen from the figure that the scour started at 45° on both sides of the OWF and gradually developed towards the front of the OWF. The main deposition area is located behind the scour hole and OWF and gradually expanded downstream. At G/D = -0.5, it can be observed that there is no impact on the scour results in front of and on both sides of the OWF, and only the deposition area behind the OWF extends backward. However, it can be observed that the sediment movement in front of the OWF becomes stable, and the scour pit does not extend downstream with G/D = -1.0. When the AR is located in front of the OWF (G/D = 0.5, 1.0, 2.0, and 4.0), an obvious fault phenomenon of the scour depth occurred in the scour area. The scour depth on both sides near the OWF is relatively larger than that on both sides far away from the OWF, and an obvious spoon-shaped scour hole is finally formed around the OWF. In addition, the fault phenomenon of the scour depth becomes increasingly serious as the distance between the OWF and AR increases.
The time evolutions of the scour depth and scour volume around the OWF in the control case and Group I are shown in Figures 8B, C. It can be seen from the figure that the existence of AR can effectively reduce the scour depth and scour volume around the OWF, and the change of scour depth has the following rules: G/D = 0.5< G/D = -1.0< G/D = 1.0< G/D = 2.0 = G/D = 4.0< G/D = -0.5< control. Compared with the control case, G/D = 0.5 provides the most effective scour protection, which results in a 27% reduction in scour depth. The change of scour volume around the OWF has the following rules: G/D = -1.0< G/D = 0.5< G/D = 2.0< G/D = 1.0< G/D = 4.0< G/D = -0.5< control. It can be found that the scour volume around the OWF decreases by 26% when the AR is arranged at a distance of 1.0 D directly behind the OWF. Moreover, the scour depth around the OWF changes with time owing to the AR arrangement.
The scouring process of traditional pile structure can be divided into three processes: fast scouring, slow scouring, and scour balance, similar to the scouring process of the control case in Figure 8B. However, it can be observed in Figure 8B that only G/D = 0.5 followed this process, and the other cases reached a transient scour balance at approximately 3000s, and then the scour depth began to increase gradually. However, the physical mechanism of this phenomenon requires further investigation. It can be seen from Figure 8C that the scour volume increases rapidly in the 0–2000s, and then slowly increases. The equilibrium stage is not reached because the scour volume is the calculation of the large-scale scour area around the OWF and the scour range and scour depth are always changing. Figure 8D illustrates the variation in the normalized scour depth (S/SC) and normalized scour volume (V/VC) around the OWF with the distance from the AR, where SC and VC are the scour depth and scour volume of the control case, respectively. It can be seen that the variations in the scour depth and scour volume with distance change slightly. When G/D is -1.0, the effect of the AR on reducing the scour volume around the OWF is significantly greater than the effect on the scour depth. After G/D > 1.0, the effect of AR on the scour results around the OWF became stable. In general, placing a single AR directly in front of or behind an OWF provides effective scour protection. Different distances provide different scour protection, which requires further analysis and discussion.
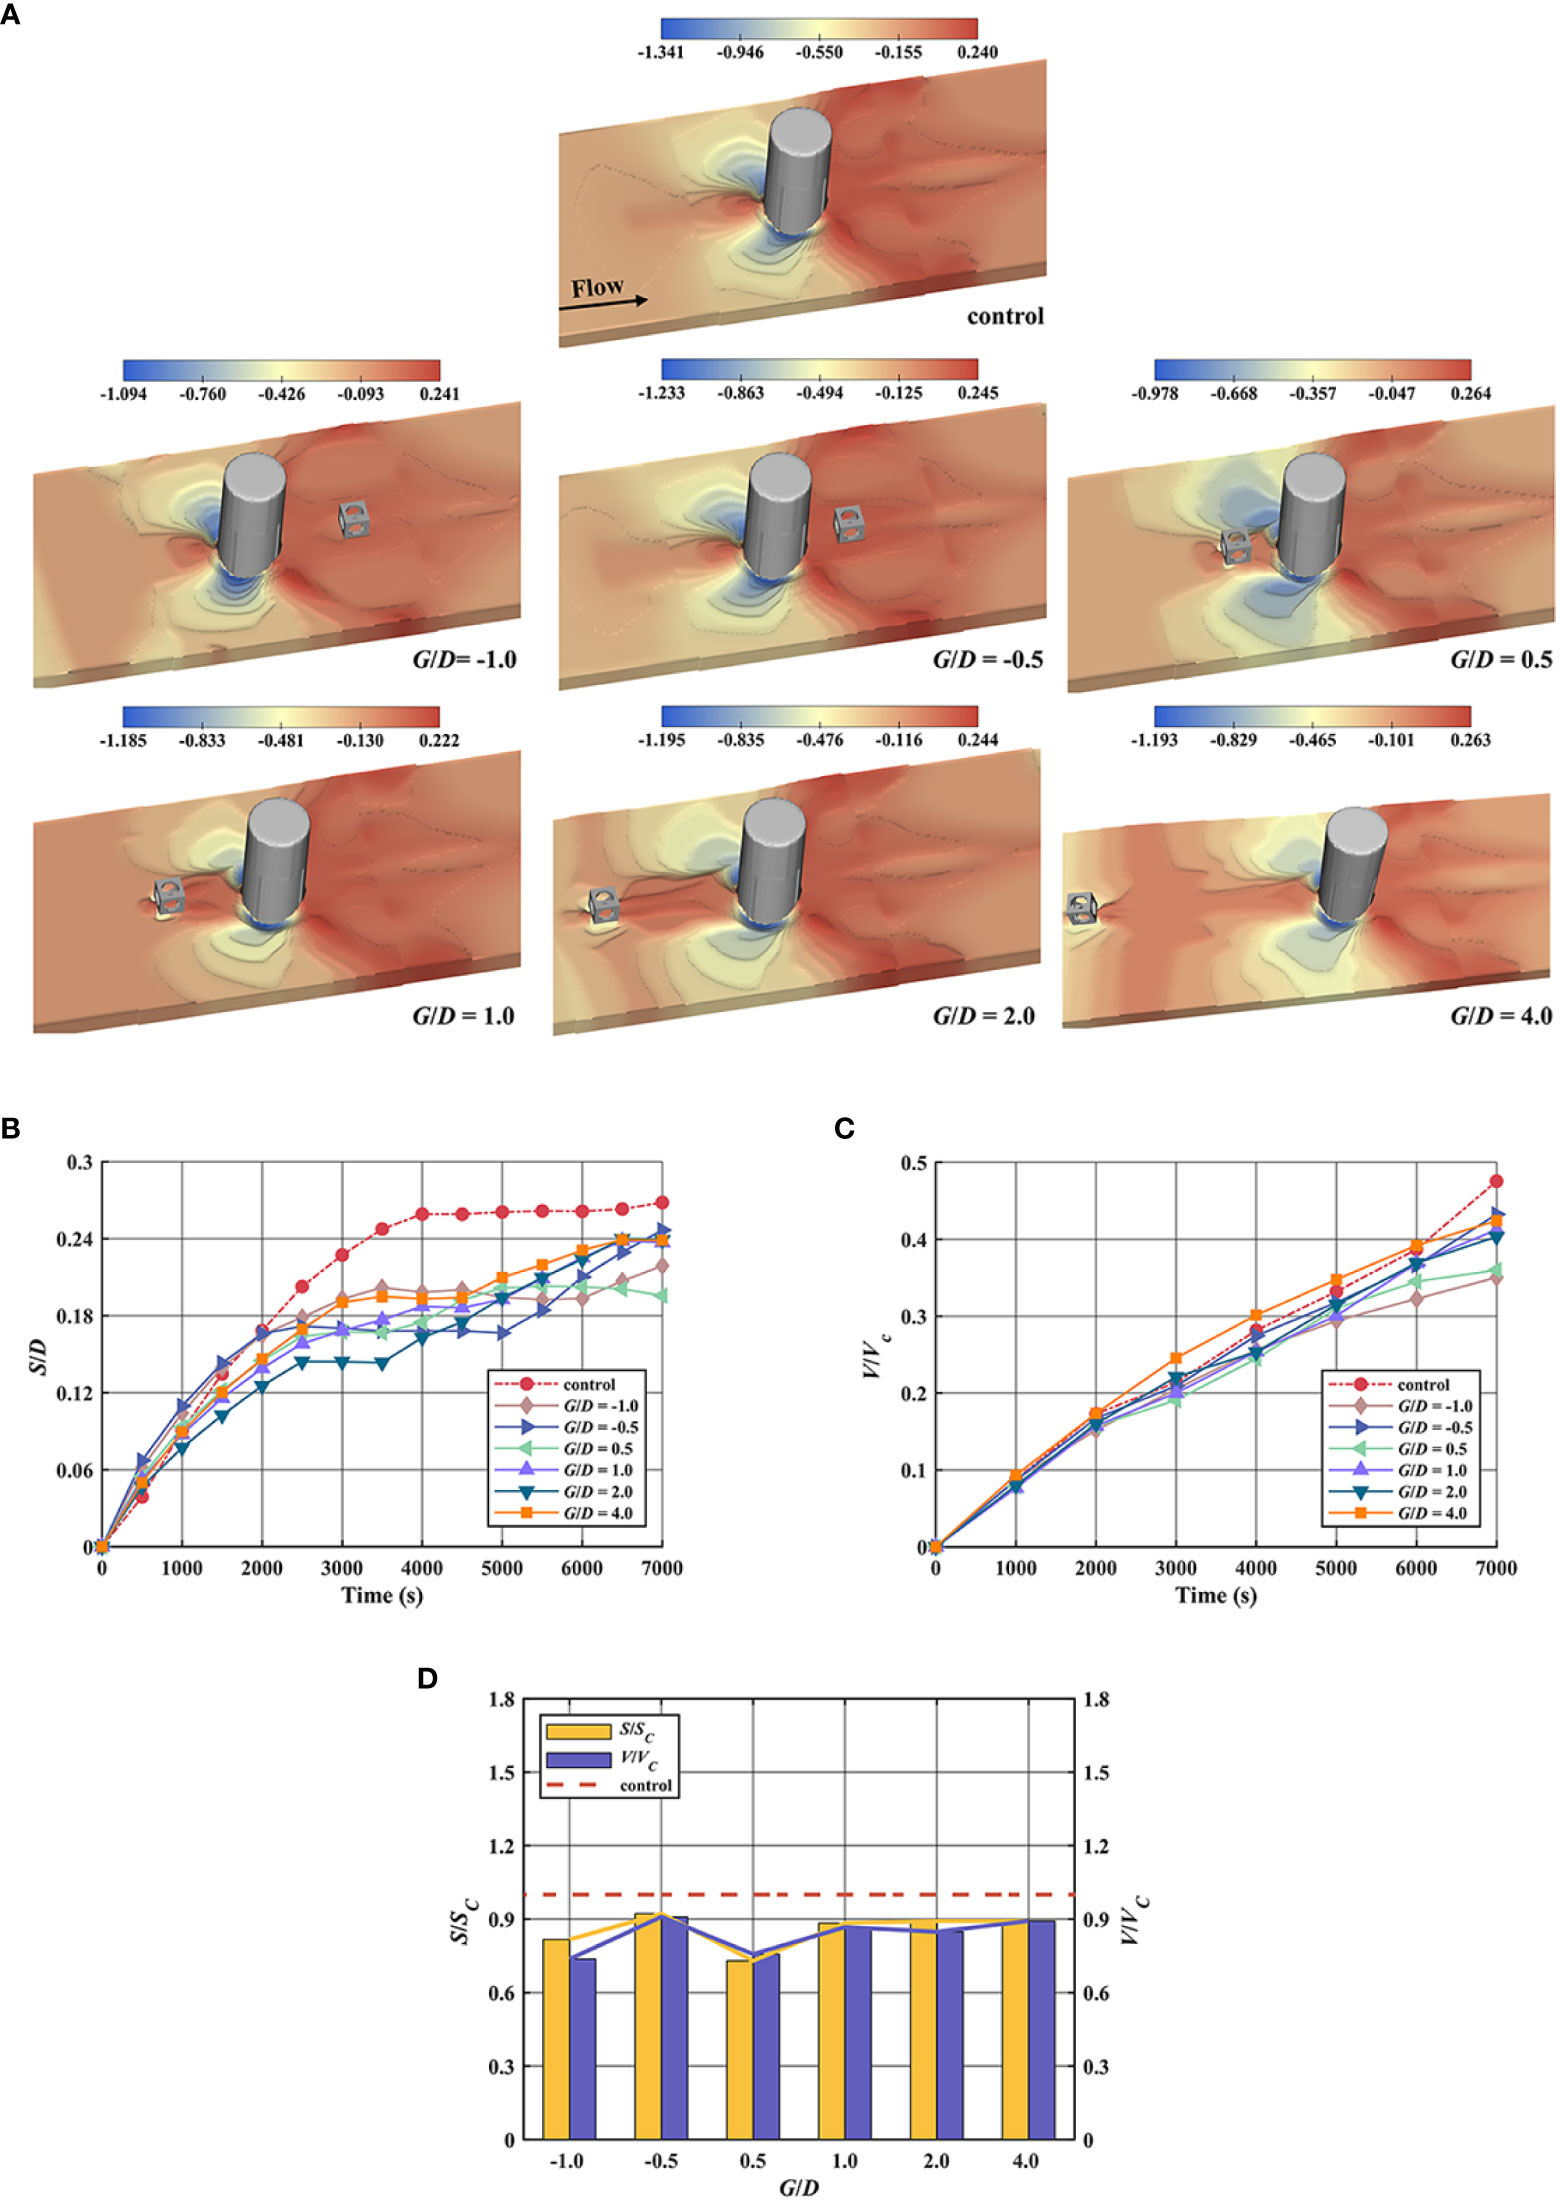
Figure 8 Scour calculation results of the Group I: (A) seabed surface elevation change around the OWF (B) time evolution of the scour depth around the OWF (C) time evolution of the scour volume around the OWF (D) standardization of scour depth and scour volume.
To clarify the physical mechanism by which the presence of the AR can reduce the scour depth and scour volume around the OWF. The reasons for the different scour results caused by the different distances between the AR and the OWF are obtained. The flow velocity variation, streamline motion, turbulence intensity, vortex shedding, and shear stress distribution of the fluid around the OWF are visualized and analyzed.
Figure 9 compares the distribution of the flow velocity contour near the seabed around the OWF for the control case and Group I at the beginning of the scour. The figure shows that the flow velocity in front of the OWF decreases owing to the blocking effect of the OWF, and then the flow accelerates around the two sides of the OWF. The two sides of the OWF formed an arc-shaped fluid acceleration area. At the same time, a large slow-flow area is formed behind the OWF, and a vortex is formed in this area. However, when the AR is arranged at G/D > 0, it produces a wake region with a slower flow velocity at the interval between the OWF and AR. The wake region expands the scope of the slow flow area in front of the OWF, which eventually affects the scope of the acceleration area and the acceleration magnitude of the fluid on both sides of the OWF. The magnitude and range of fluid acceleration on both sides of the OWF are significantly reduced due to the presence of AR at G/D = 0.5, G/D = 1.0, and G/D = 2.0. However, this effect gradually decreased with increasing distance. When G/D = 4.0, the range of the acceleration region on both sides of the OWF is almost the same as that of the control case. It can be considered that under this distance condition, the effect of AR on the flow field around the OWF is not obvious. However, when G/D< 0, the effect of AR on the flow field around the OWF cannot be observed in the current view, and a more comprehensive analysis is needed in these two cases.
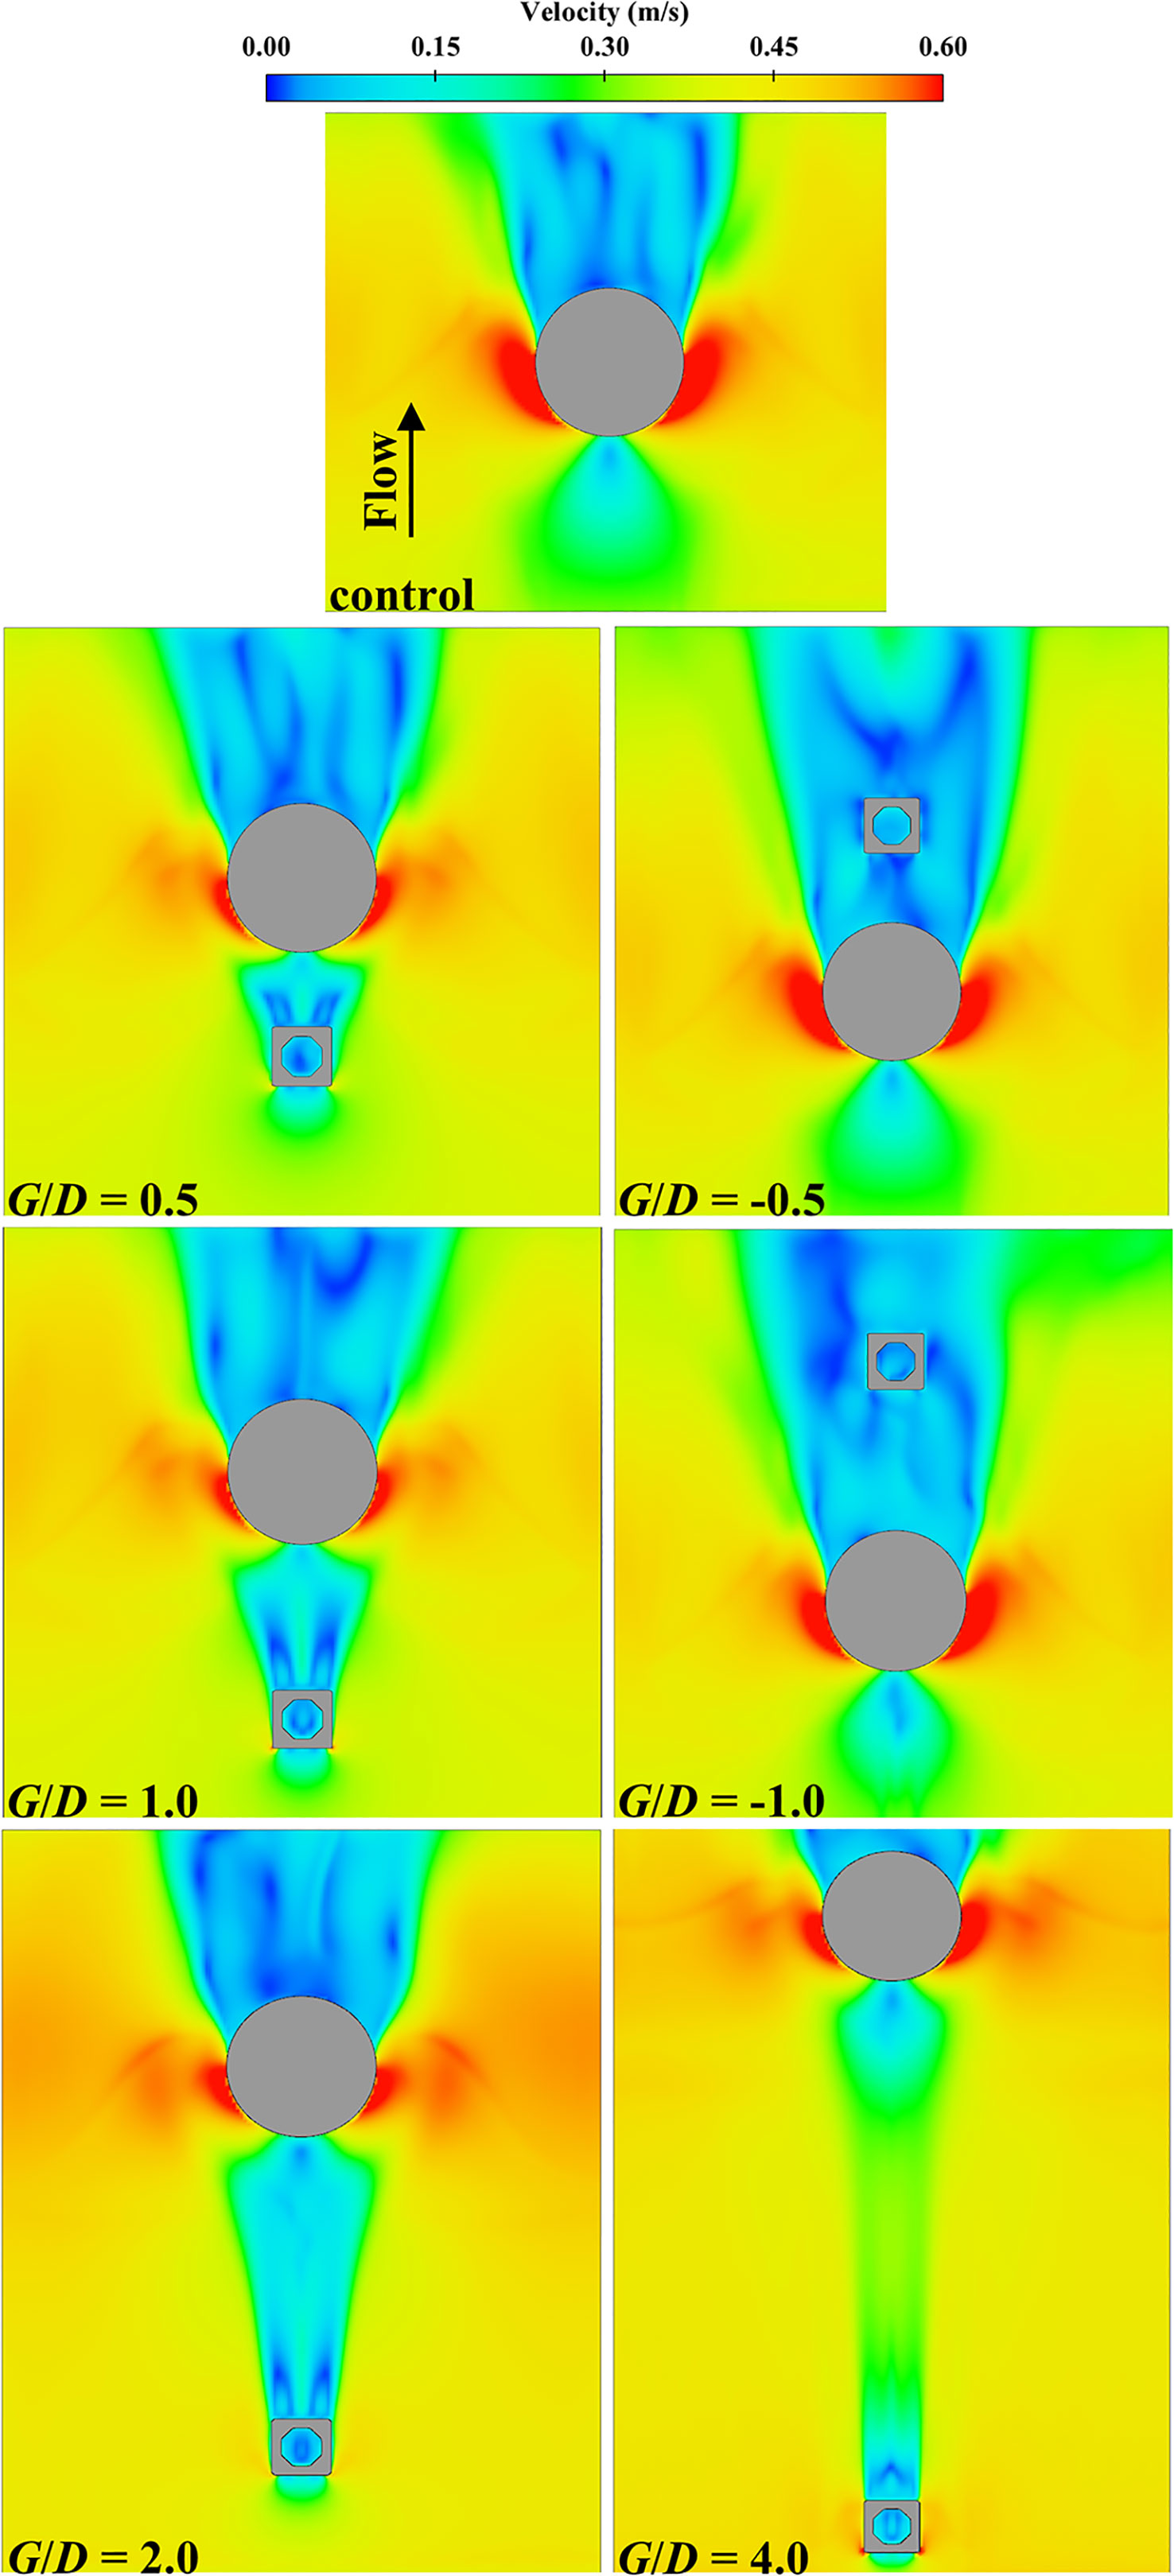
Figure 9 Distribution of the flow velocity contour near the seabed around the OWF in Group I.
Bed shear stress refers to the shear drag force of the bottom flow on the bed, which is the main factor affecting the scour and deposition of the bed. The greater the shear stress, the stronger the scour capacity of the fluid on the bed surface (Yang M. et al., 2022). The shear stress distribution on both sides of the axial plane in the OWF is shown in Figure 10 for scour times of 3000 s and 7000 s. The bed shear stress on both sides of the OWF is significantly lower than that of the control case when G/D = 1.0, which indicates that AR can effectively reduce the bed shear stress around the OWF and reduce the scour depth at this distance. The shear stress on both sides of the OWF is mainly influenced by the accelerating flow that bypassed the OWF. As analyzed in the previous section, when G/D< 0, AR cannot affect the flow acceleration on either side of the OWF. Therefore, at the initial time of scour, the shear stress on both sides of the OWF at G/D = -1.0 and in the control case is almost the same. However, at the end of the scour, the shear stress and scour depths on both sides of the OWF at G/D = -1.0 are significantly less than those in the control case, which indicates that at G/D= -1.0 and G/D= 1.0, indicating the mechanism of the reduction of the scour depth is different. Therefore, the mechanism of scour protection is analyzed separately for G/D > 0 and G/D< 0 in the following section. Finally, when G/D = 4.0, the shear stress on both sides of the OWF decreased only slightly compared with the control case. This also confirms the previous conclusion that the effect of the AR on the flow field around the OWF gradually decreases with increasing distance.
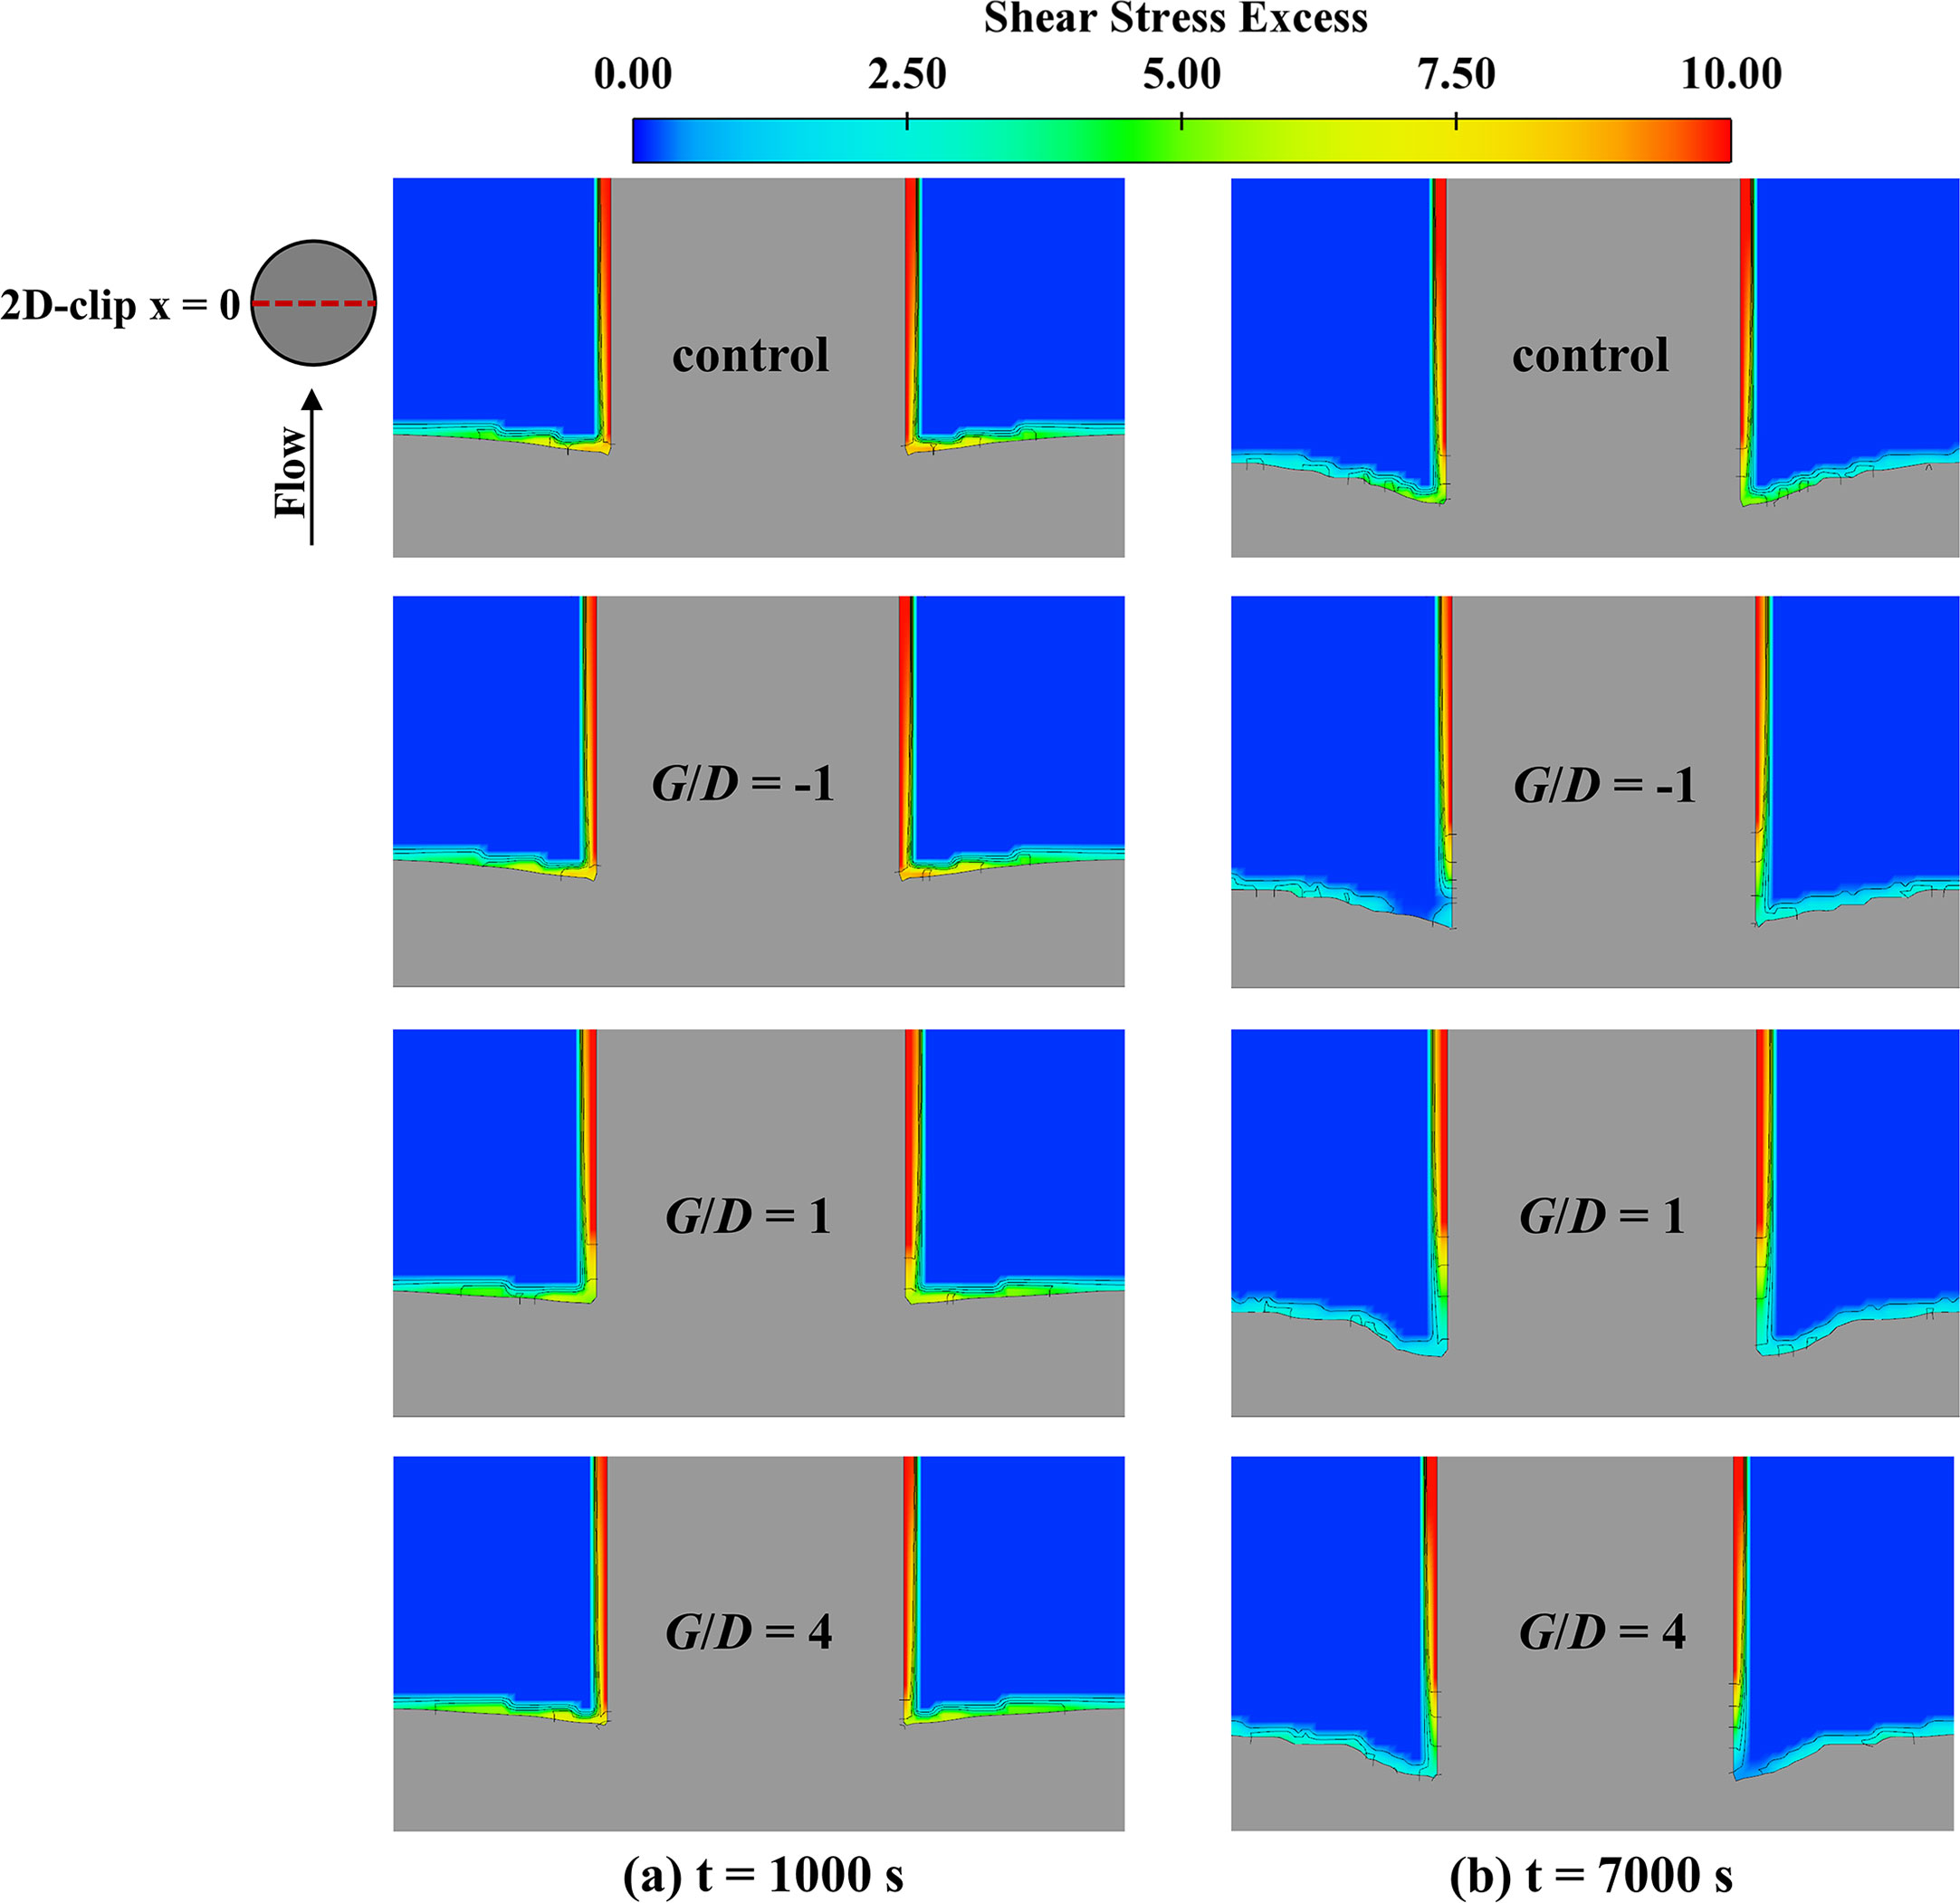
Figure 10 Shear stress distribution on both sides of the OWF in Group I.
The streamline distribution around the OWF at G/D = 0.5, G/D = 1.0, and G/D = 2.0 compared to the control case are shown in Figure 11. It can be clearly seen from the figure that the horseshoe vortex in front of the OWF and a streamlined compression at the OWF side lead to an increase in the bed shear stress, which is the main reason for the sediment scour around the OWF. In addition, the wake vortex behind the OWF developed rapidly and moved downstream, which is also the cause of scour. Significantly, the AR disrupted the horseshoe vortex system in front of the OWF, and a wake region is formed behind the ARs. This reduces the strength and size of the horseshoe vortex. This reduces the bed area controlled by the horseshoe vortex, and the AR eventually acts as scour protection for the sediments around the OWF.
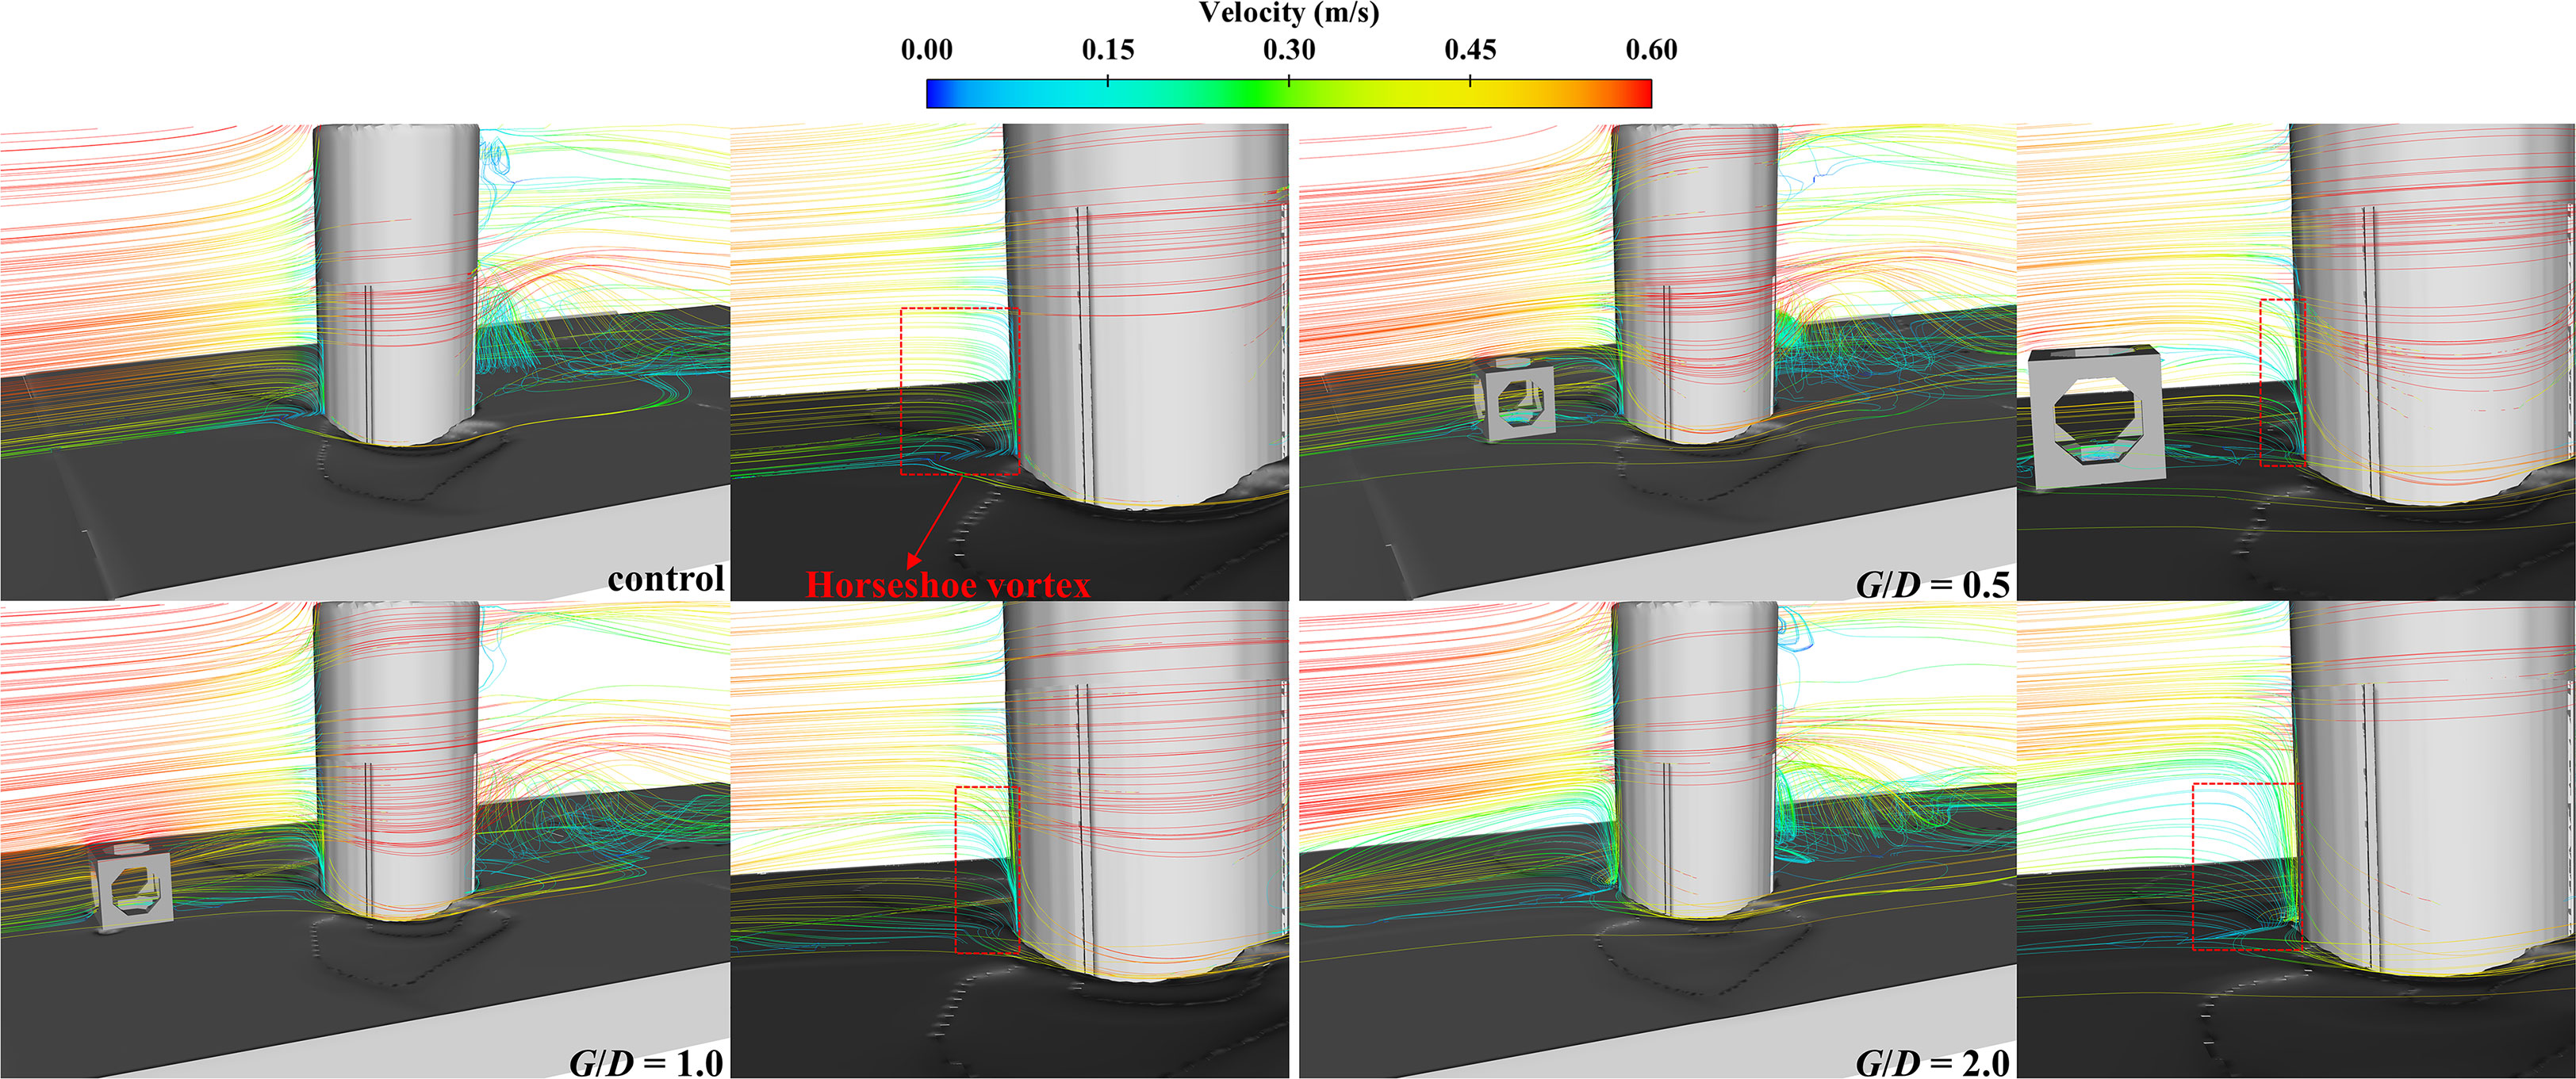
Figure 11 Streamline distribution around the OWF in Group I.
Moreover, it can also be found that as the AR gradually moves farther away from the OWF, the strength of the horseshoe vortex becomes the dominant effect. Therefore, the scour depth and volume around the OWF increase with an increase in G/D. The turbulence intensity is a dimensionless physical quantity that represents the ratio of turbulent fluctuating velocity to the average velocity. Typically, turbulence intensities greater than 10 are considered high turbulence intensity, and the high turbulence intensities around the OWF and ARs are shown in Figure 12A. The turbulence intensity on both sides of the OWF gradually increased with G/D; therefore, the scour is more violent.
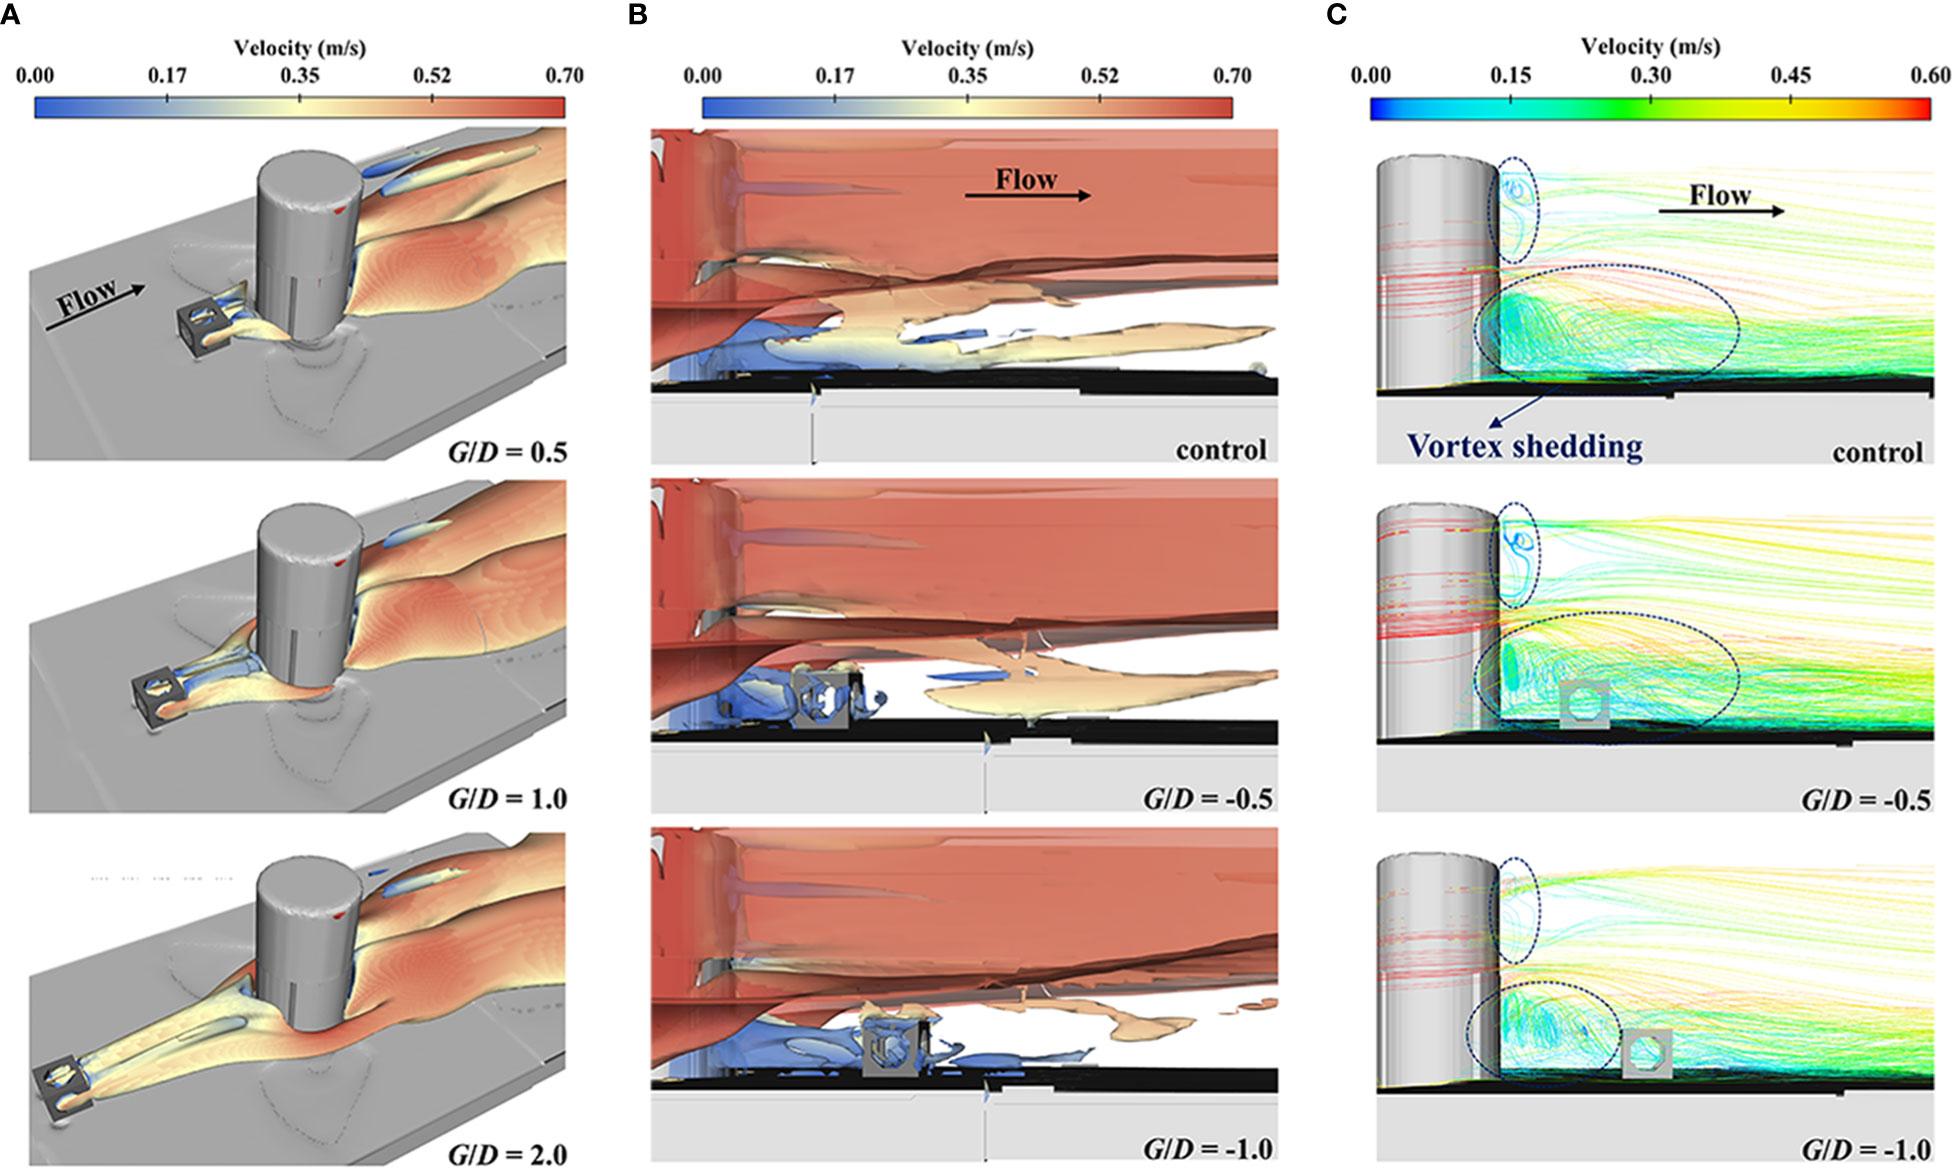
Figure 12 Turbulence structure and streamline distribution around the OWF: (A) turbulence intensity around the OWF (B) vorticity around the OWF (under Q-Criterion) (C) streamline distribution behind the OWF.
A comparison of the vortex fields of the control and G/D< 0 cases are shown in Figure 12B. The vortex alternately forms near the bed behind the OWF and sheds downstream. The vortex is broken by the AR but continued to shed when the AR is located at G/D = -0.5. However, the vortex is almost completely broken after passing through AR. When AR is located at G/D = -1.0, it does not continue to be shed due to the broken vortex, thus causing the flow behind the OWF to become more stable and the scour intensity to be reduced, which eventually has a significant scour protection effect. This phenomenon not only explains the mechanism by which ARs can effectively reduce scour depth and scour volume when G/D< 0 but also clarifies why the AR at G/D = -1.0 are more effective in reducing scour intensity than at G/D = -0.5. The streamlined distribution of the rear of the OWF in the three cases are shown in Figure 12C. The top and bottom behind the OWF formed large-scale vortex shedding in the control case. Large-scale vortex shedding causes more sediment to roll up and be transported, resulting in serious scour. The AR significantly reduced the vortex formation with the OWF and broke the vortex behind, successfully destroying the original vortex system behind the OWF and playing a significant role in scour protection.
3.2 Influence of P/L
Figure 13A shows the seabed surface elevation around the OWF under different P/L values at the last moment. Regular semicircular scour holes formed on each side of the OWF and developed in front of and behind the OWF when P/L = 0. From a previous study (Yang M. et al., 2022), it is known that the sides of the AR in the flow field form a fluid compression and accelerate the movement to the rear. At this time, the width of the AR in the present case is slightly less than the D of the OWF, which accelerates from the outer side of the AR to the two sides of the OWF. Thus, it mixes with the flow on both sides of the OWF, and accelerates the flow, resulting in the flow and scour around the two sides of the OWF being more intense. In addition, the extent of the scour hole cannot develop to the rear of the OWF with a gradual increase in P/L, but to the inner side of the two ARs, and finally form an M-shaped scour hole. The reason for this phenomenon is that with an increase in P/L, the fluid acceleration area on the inner side of the ARs starts to form gradually and converges with the acceleration area on both sides of the OWF. This causes turbulence fluctuations between the inner side of the ARs and the OWF, which eventually leads to a larger scour area.
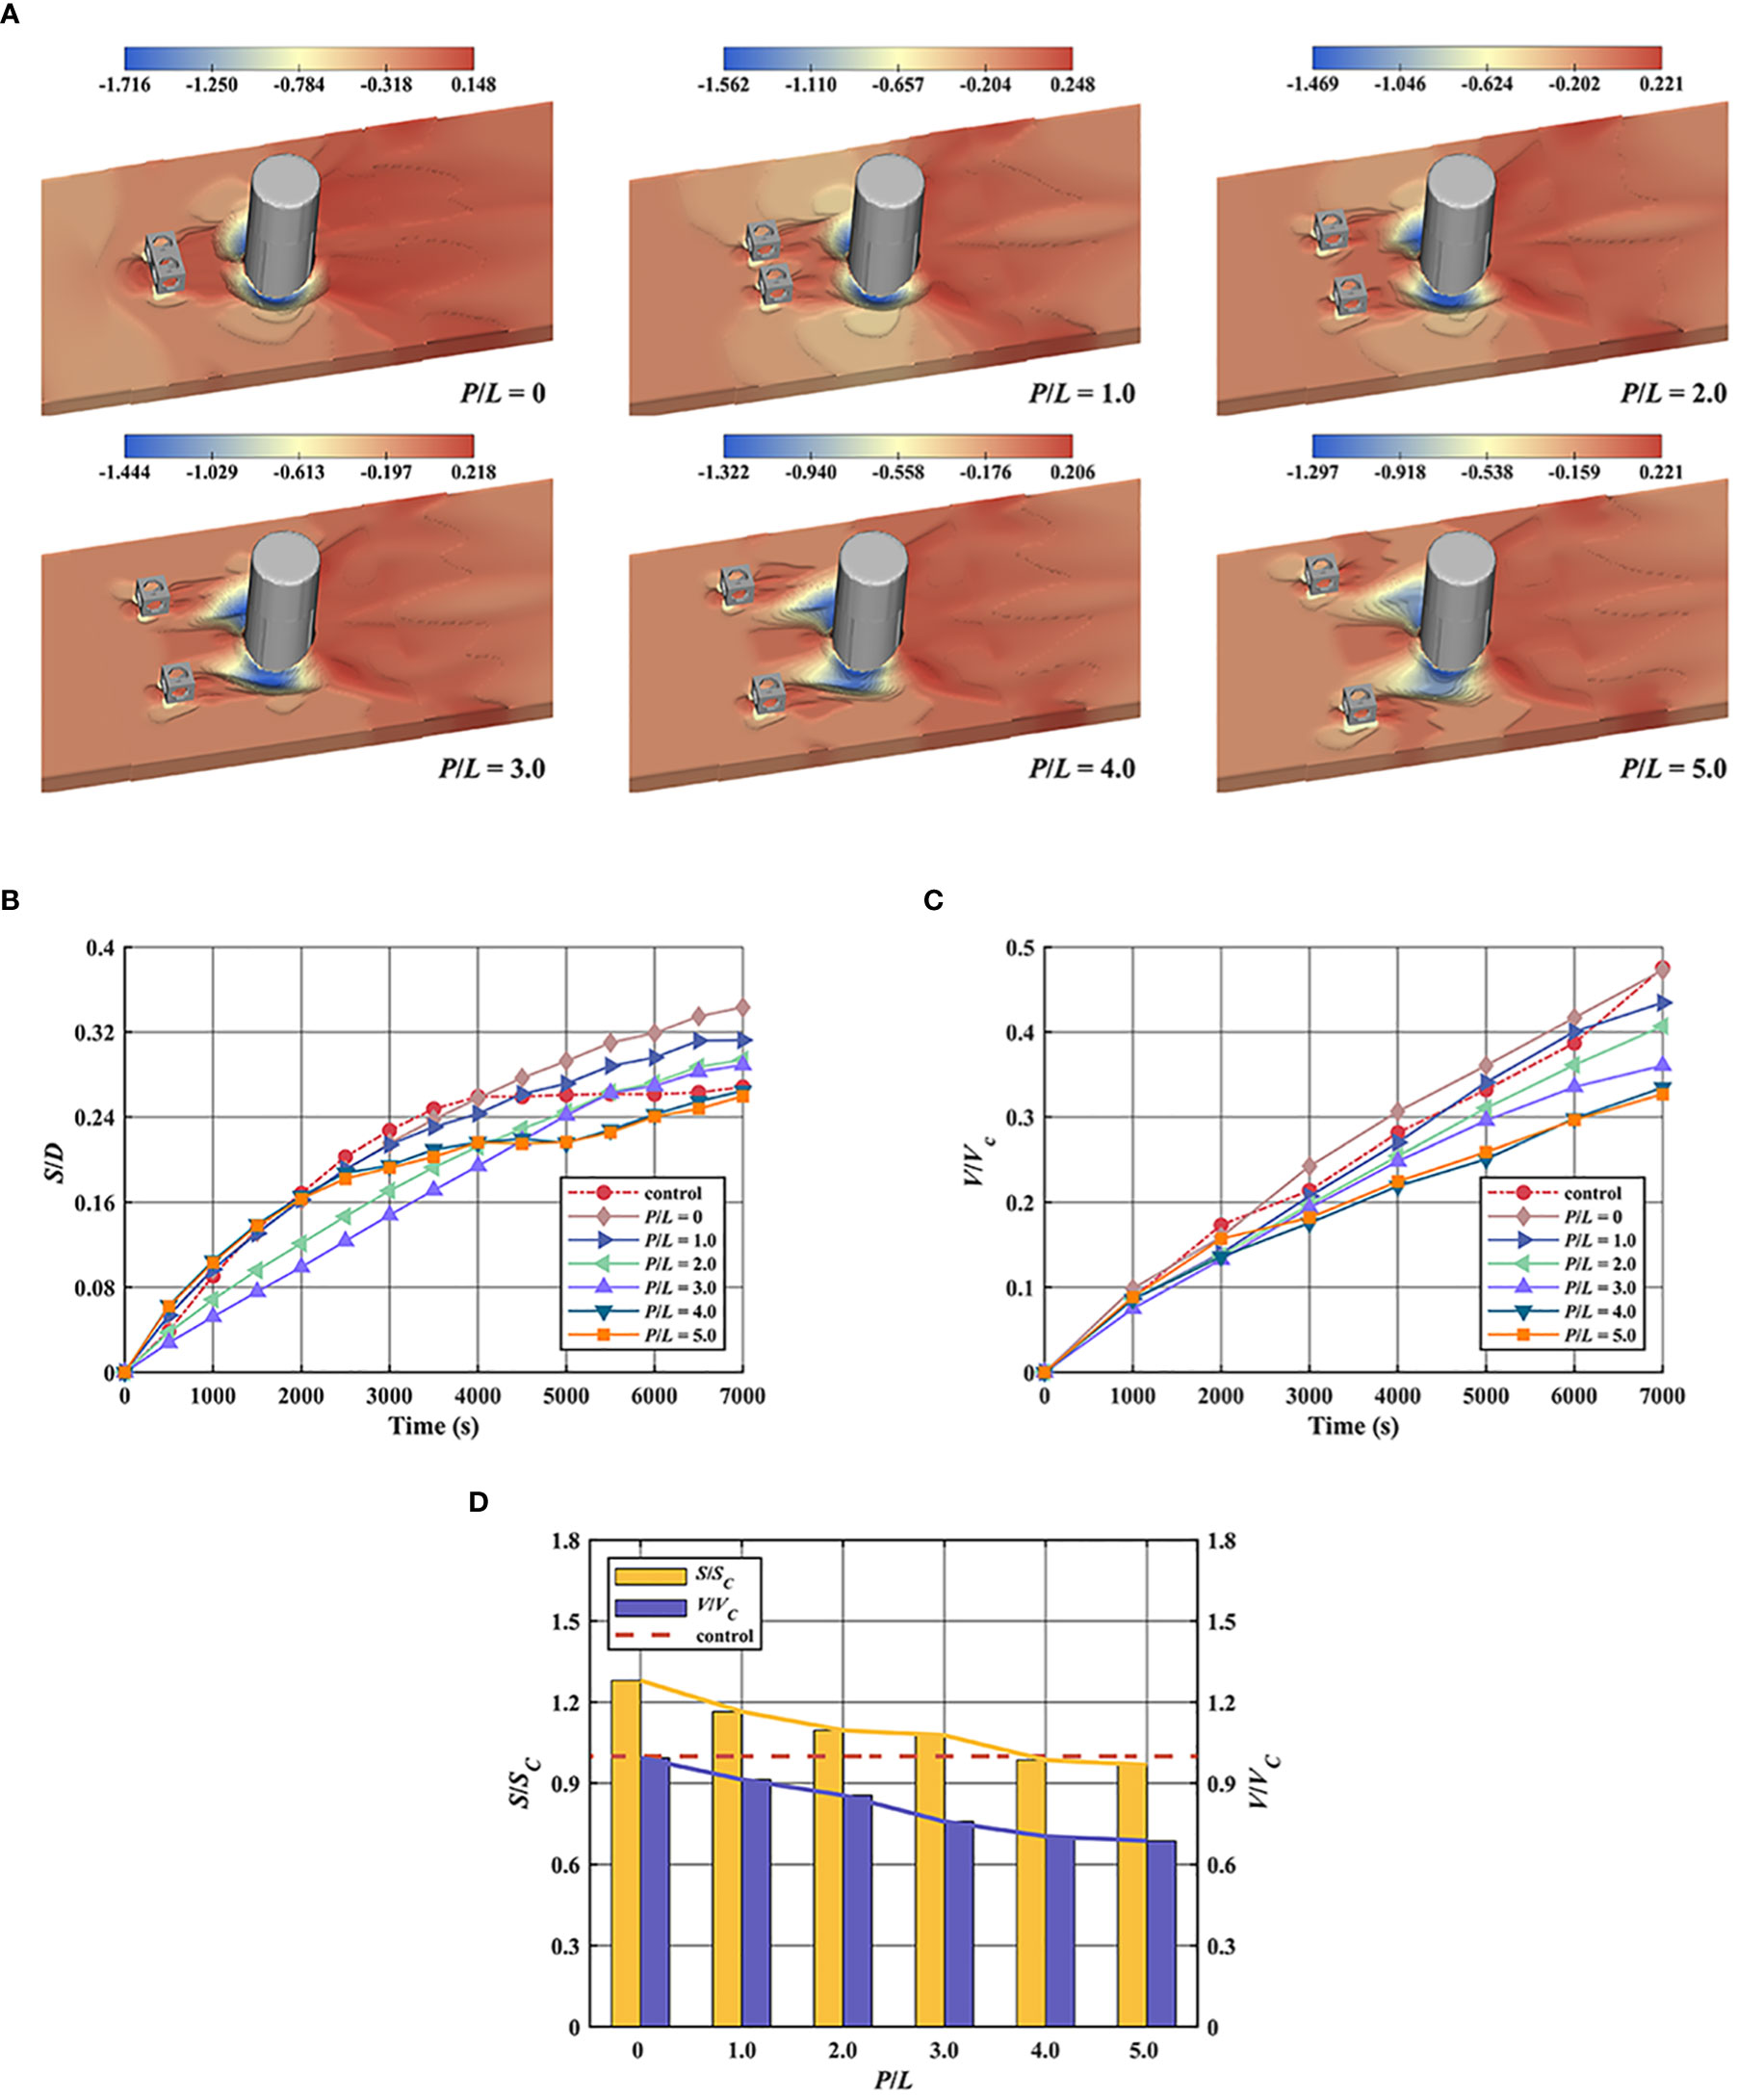
Figure 13 Scour calculation results of Group II: (A) seabed surface elevation change around the OWF (B) time evolution of the scour depth (C) time evolution of the scour volume (D) standardization of scour depth and scour volume.
The time evolutions of the scour depth and scour volume around the OWF in the control case and Group II are shown in Figures 13B, C. For the scour depth, it can be clearly found that the scour depth gradually decreases with the increase of P/L. When P/L< 4.0, the scour depth around OWF is greater than that of the Control case. This indicates that, within this arrangement, ARs have a negative effect on the scour depth around the OWF. The maximum scour depth occurred at P/L = 0, which is approximately 28% greater than that of the control case. When P/L = 4.0 or P/L = 5.0, the scour depth around the OWF is almost the same as that of the control case, with a difference of no more than 3%. From the development process of scour depth with time, the time to reach scour equilibrium is longer than that of the control case when P/L = 0 and P/L = 1.0. The development of the scour depth around the OWF is similar at P/L = 2.0 and P/L = 3.0. After 5000s, the scour rate decreased and gradually equilibrated. The scour development process is almost identical when P/L = 4.0 and P/L = 5.0. The difference in the final scour depth between them and the control case is no more than 3%, which indicates that when P/L > 3.0, the negative impact of ARs on the scour depth around the OWF disappears. However, the scour volume also decreased gradually with an increase in P/L. It is worth noting that except for the scour volume when P/L = 0, which is the same as that of the control case, the scour volume of the remaining five cases is less than that of the control case. The lowest scour volume is reduced by 31% compared with the control case when P/L = 5.0. This result indicates that, although the parallel arrangement of the ARs will have a negative effect on increasing the maximum scour depth around the OWF, it will positively affect the overall volume of scour occurring around the OWF. Figure 13D illustrates the variation in scour depth and scour volume around the OWF in Group II, where the scour depth and scour volume are normalized by the control case. It can be seen from the figure that the change rate of scour depth and scour volume gradually approaches 0 with the increase in P/L, indicating that at G/D = 1.0. Moreover, the P/L between the two ARs should be greater than 3.0 to avoid aggravating the maximum scour depth around the OWF.
The streamlined distribution around the OWF in Group II compared to the control case are shown in Figure 14. It can be seen that an accelerated upwelling is formed above the contact surface of the two ARs. When P/L = 0, the upwelling causes turbulent fluctuations in front of the OWF. The streamlines are compressed and accelerated on both sides of the OWF, which are the flow motion characteristics that cause severe scour. It can also be observed that with an increase in P/L, the turbulent fluctuations in front of the OWF gradually stabilize and disappear. The streamline distribution on both sides is gradually uniform, which is the reason why the scour depth decreases with an increase in P/L. In addition, the flow velocity behind the AR is low because the wake region is formed at the rear of each AR, and the bed shear stress is lower than the critical shear stress of the sediment. Therefore, it can be clearly seen that AR effectively prevents the expansion of the scour hole. However, the vortex shedding behind the OWF gradually becomes regular with an increase in P/L. These two physical phenomena led to a gradual decrease in scour volume with an increase in P/L.
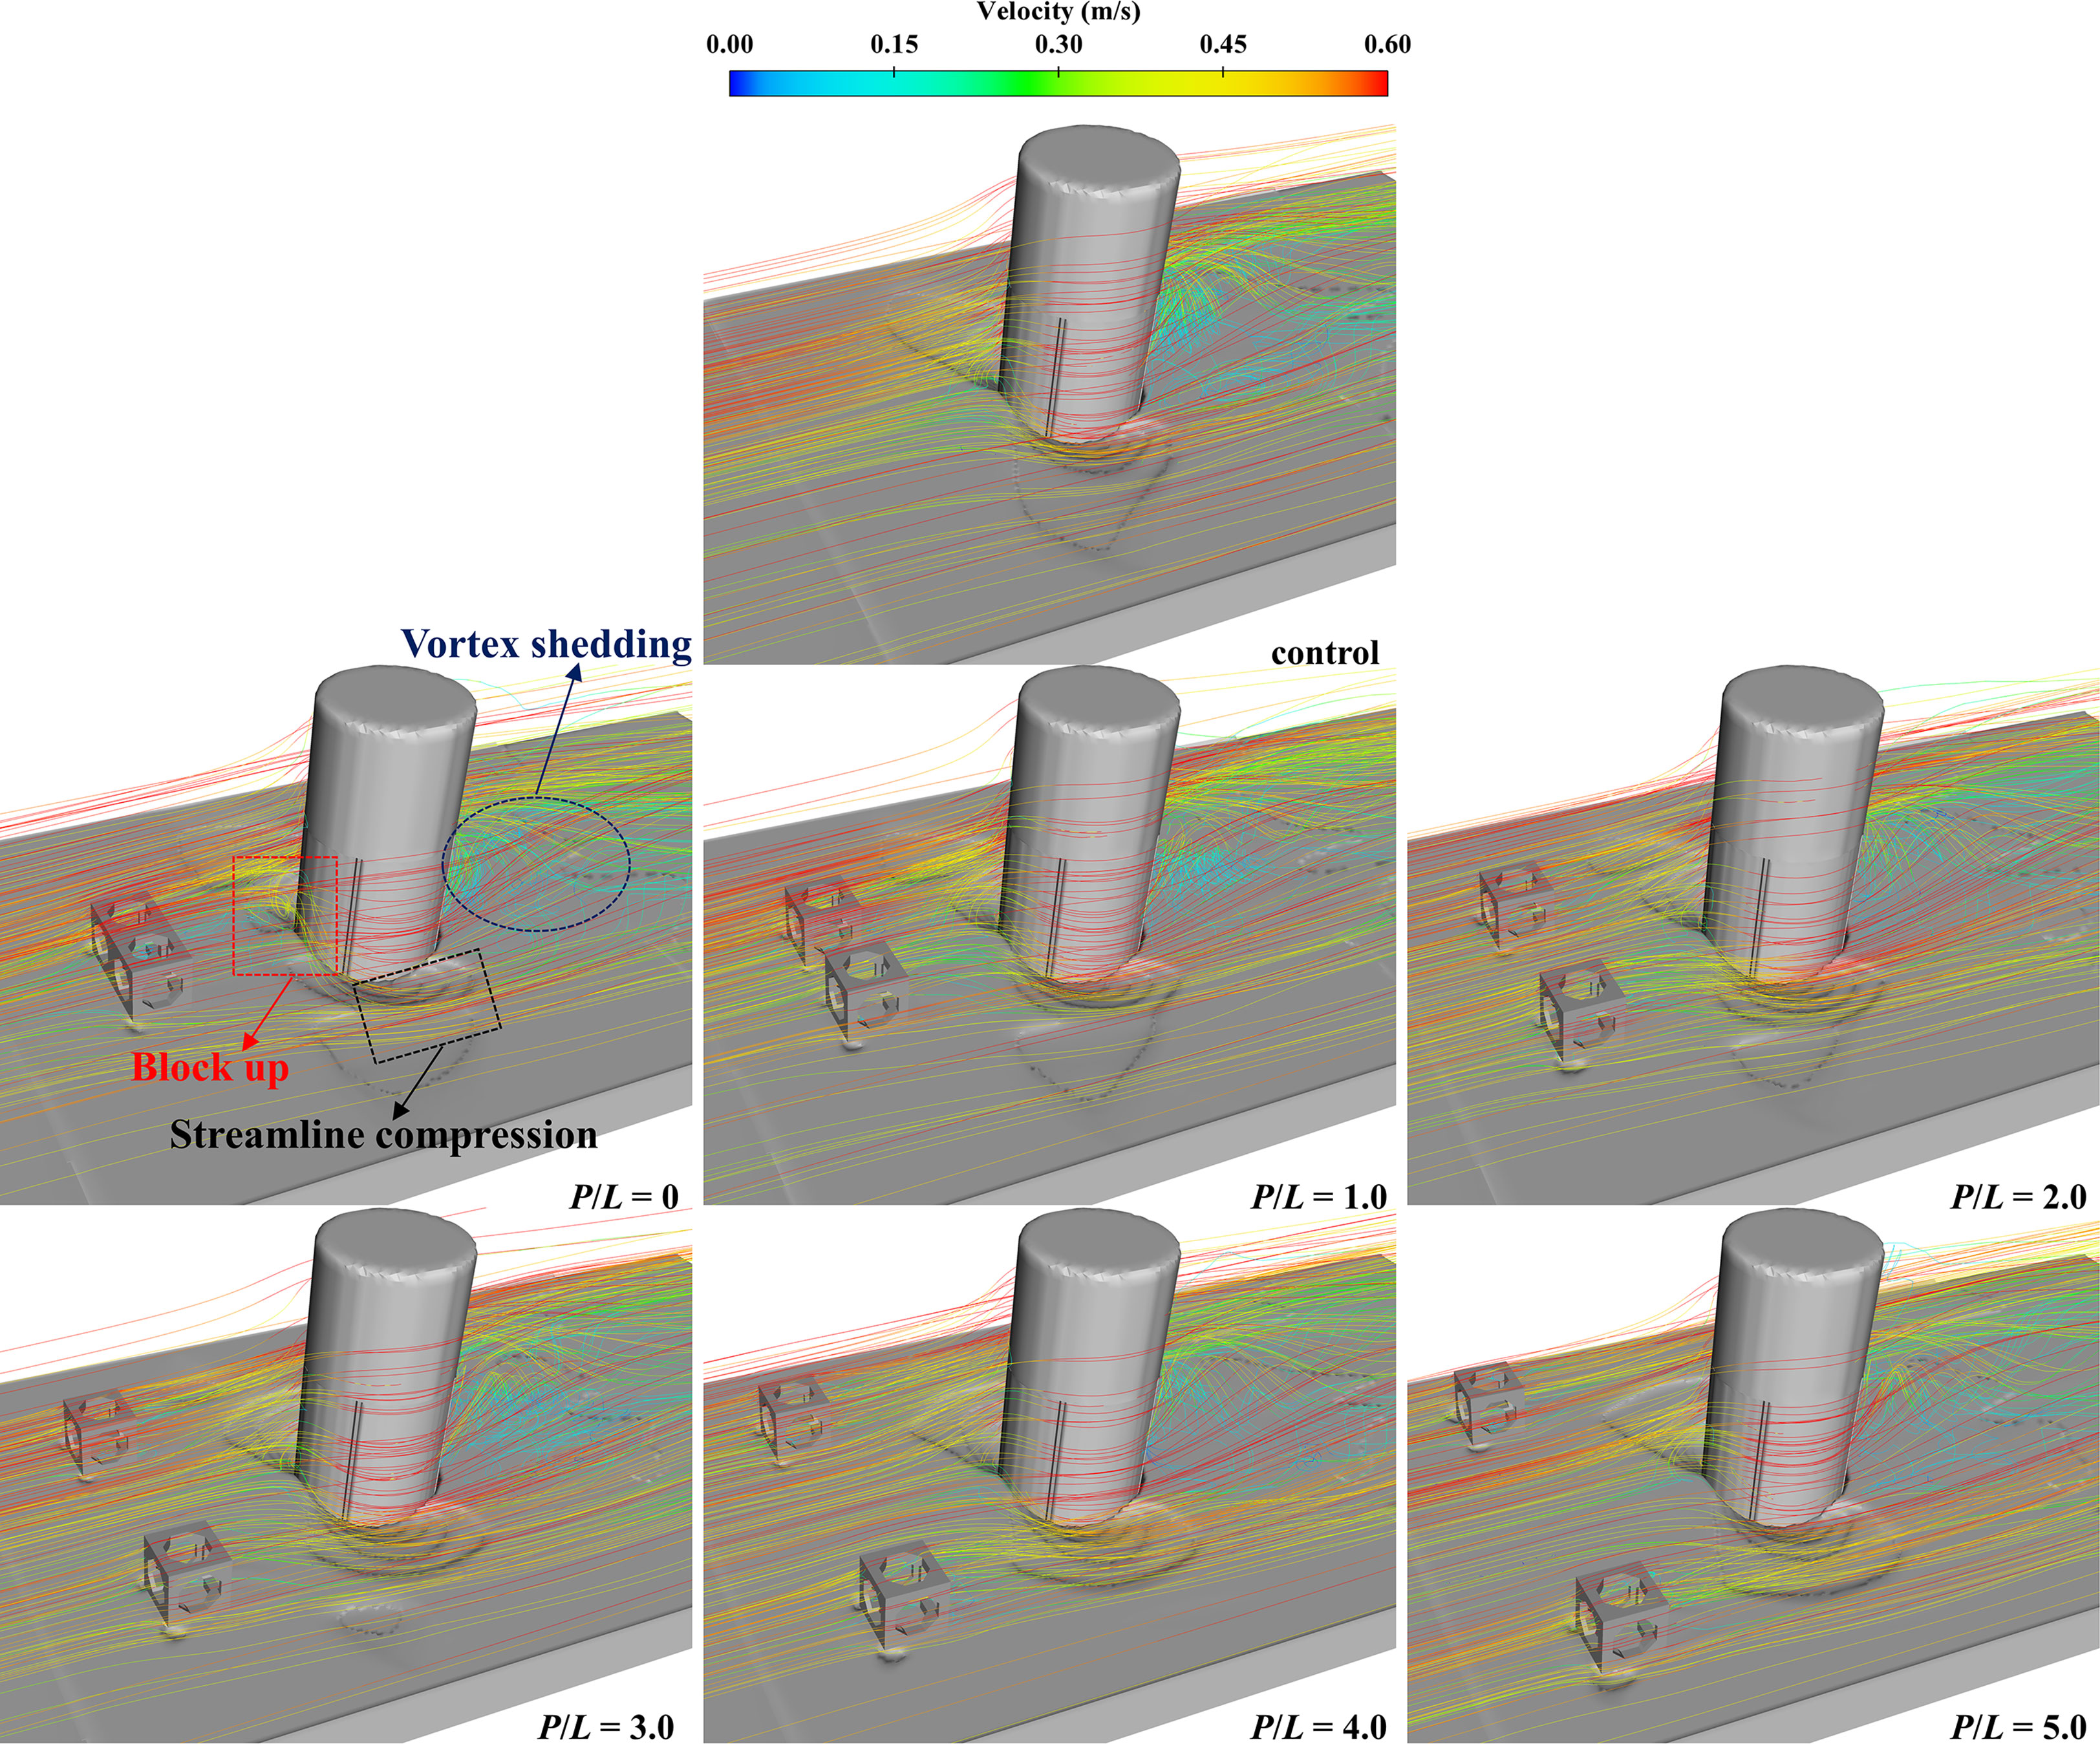
Figure 14 Streamline distribution around the OWF in Group II.
3.3 Influence of the T/L
Figure 15A depicts the seabed surface elevation around the OWF under different T/L values between the AR values at the last moment. As the wake region of the ARs increases with increasing T/L (Liu and Su, 2013), the scope of the slow-flow area between the OWF and ARs also increases. This finally leads to an expansion of the extent of sediment deposition in front of the OWF with an increase in T/L. The sediment scour pattern around the OWF is almost identical in these four cases. However, it can be found that the scour depth in the outer area of the scour hole decreases with increasing T/L.
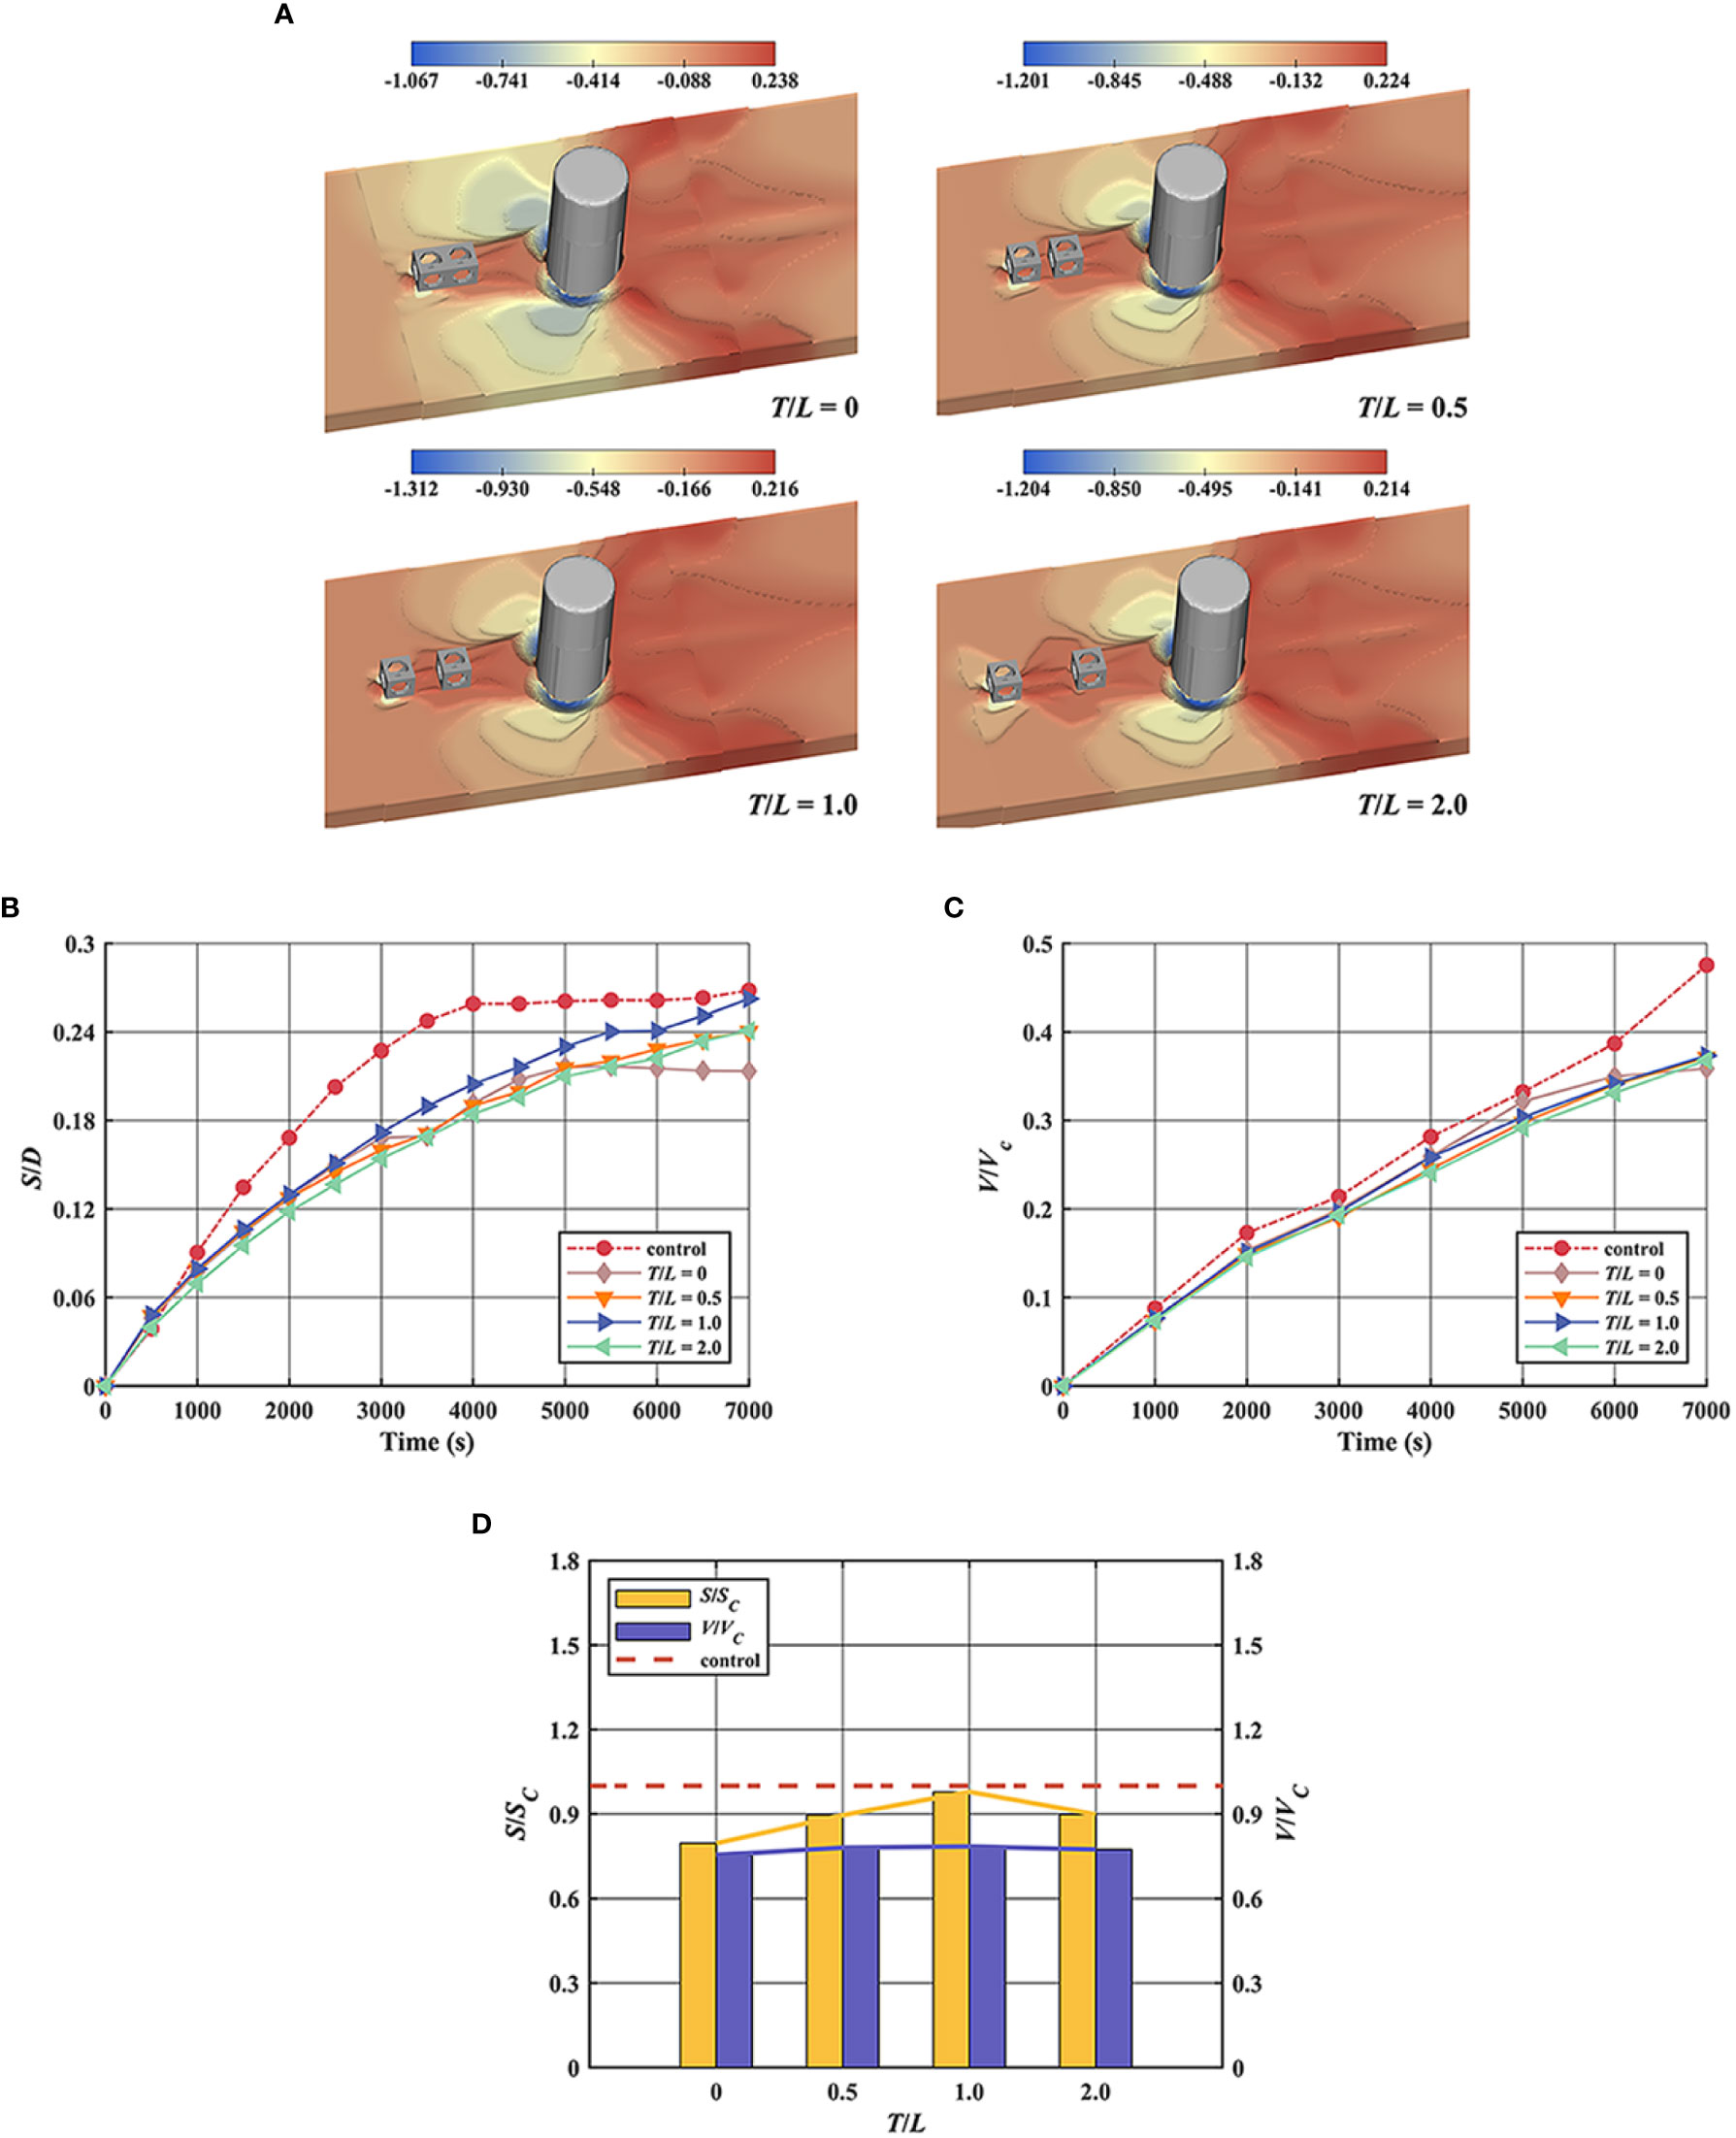
Figure 15 Scour calculation results of the Group III: (A) seabed surface elevation change around the OWF (B) time evolution of the scour depth around the OWF (C) time evolution of the scour volume around the OWF (D) standardization of scour depth and scour volume.
The time evolution of the scour depth and scour volume around the OWF in the control case and Group III are shown in Figures 15B, C. In this Group, ARs reduce the maximum scour depth and volume around the OWF and play an effective role in scour protection. It has the following rules for scour depth: T/L = 0< T/L = 0.5 ≈ T/L = 2.0< T/L = 1.0< control. Compared with the Control case, the minimum scour depth occurred at T/L = 0, which is approximately 21% less than the control case and reached the scour equilibrium stage at 5000s. The scour development process and final scour depth of T/L = 0.5, and T/L = 2.0 are almost the same, approximately 10% more than the control case. The maximum scour depth occurred when T/L = 1.0, which is approximately 2% less than that of the control case. However, the scour volume in Group III is noteworthy. In these four cases of Group III, the change process of the scour volume and the value at the last moment are almost the same, and the maximum difference is no more than 3%. Compared with the Control case, the scour volume around the OWF decreased by 24% (T/L = 0), 22% (T/L = 0.5), 21% (T/L = 1.0), and 23% (T/L = 2.0). However, under the condition of G/D = 1 in Group I, the scour volume is only 13% less than that in the control case. The present results show that the tandem arrangement of the ARs can significantly reduce the scour volume around the OWF, but changes in the spacing between the ARs have little effect on the scour volume, as shown in Figure 15D.
The streamlined distribution around the OWF in Group III are shown in Figure 16A. The area controlled by the horseshoe vortex in front of the OWF is similar when T/L = 0 and T/L = 0.5. The horseshoe range in front of the OWF is significantly expanded when T/L = 1.0 and T/L = 2.0. However, the scour depth around the OWF at T/L = 2.0 is lower than that at T/L = 1.0. To explore the reasons for this result, the high turbulence intensity around the OWF and Ars, when T/L = 1.0 and T/L = 2.0, are shown in Figure 16B. From the figure, it can be seen that the momentum transfer of intense turbulence occurs between the two ARs when T/L = 1.0, resulting in a higher turbulent kinetic energy of the fluids around the OWF, and ultimately, more sediment is scoured away. However, when T/L = 2.0, it can be clearly seen that the momentum transfer of turbulence between the two ARs is reduced. This also affects the kinetic energy of turbulence moving from the AR to the OWF and finally results in a lower turbulence kinetic energy around the OWF at T/L = 2.0 and a lower scour depth compared to T/L = 1.0.
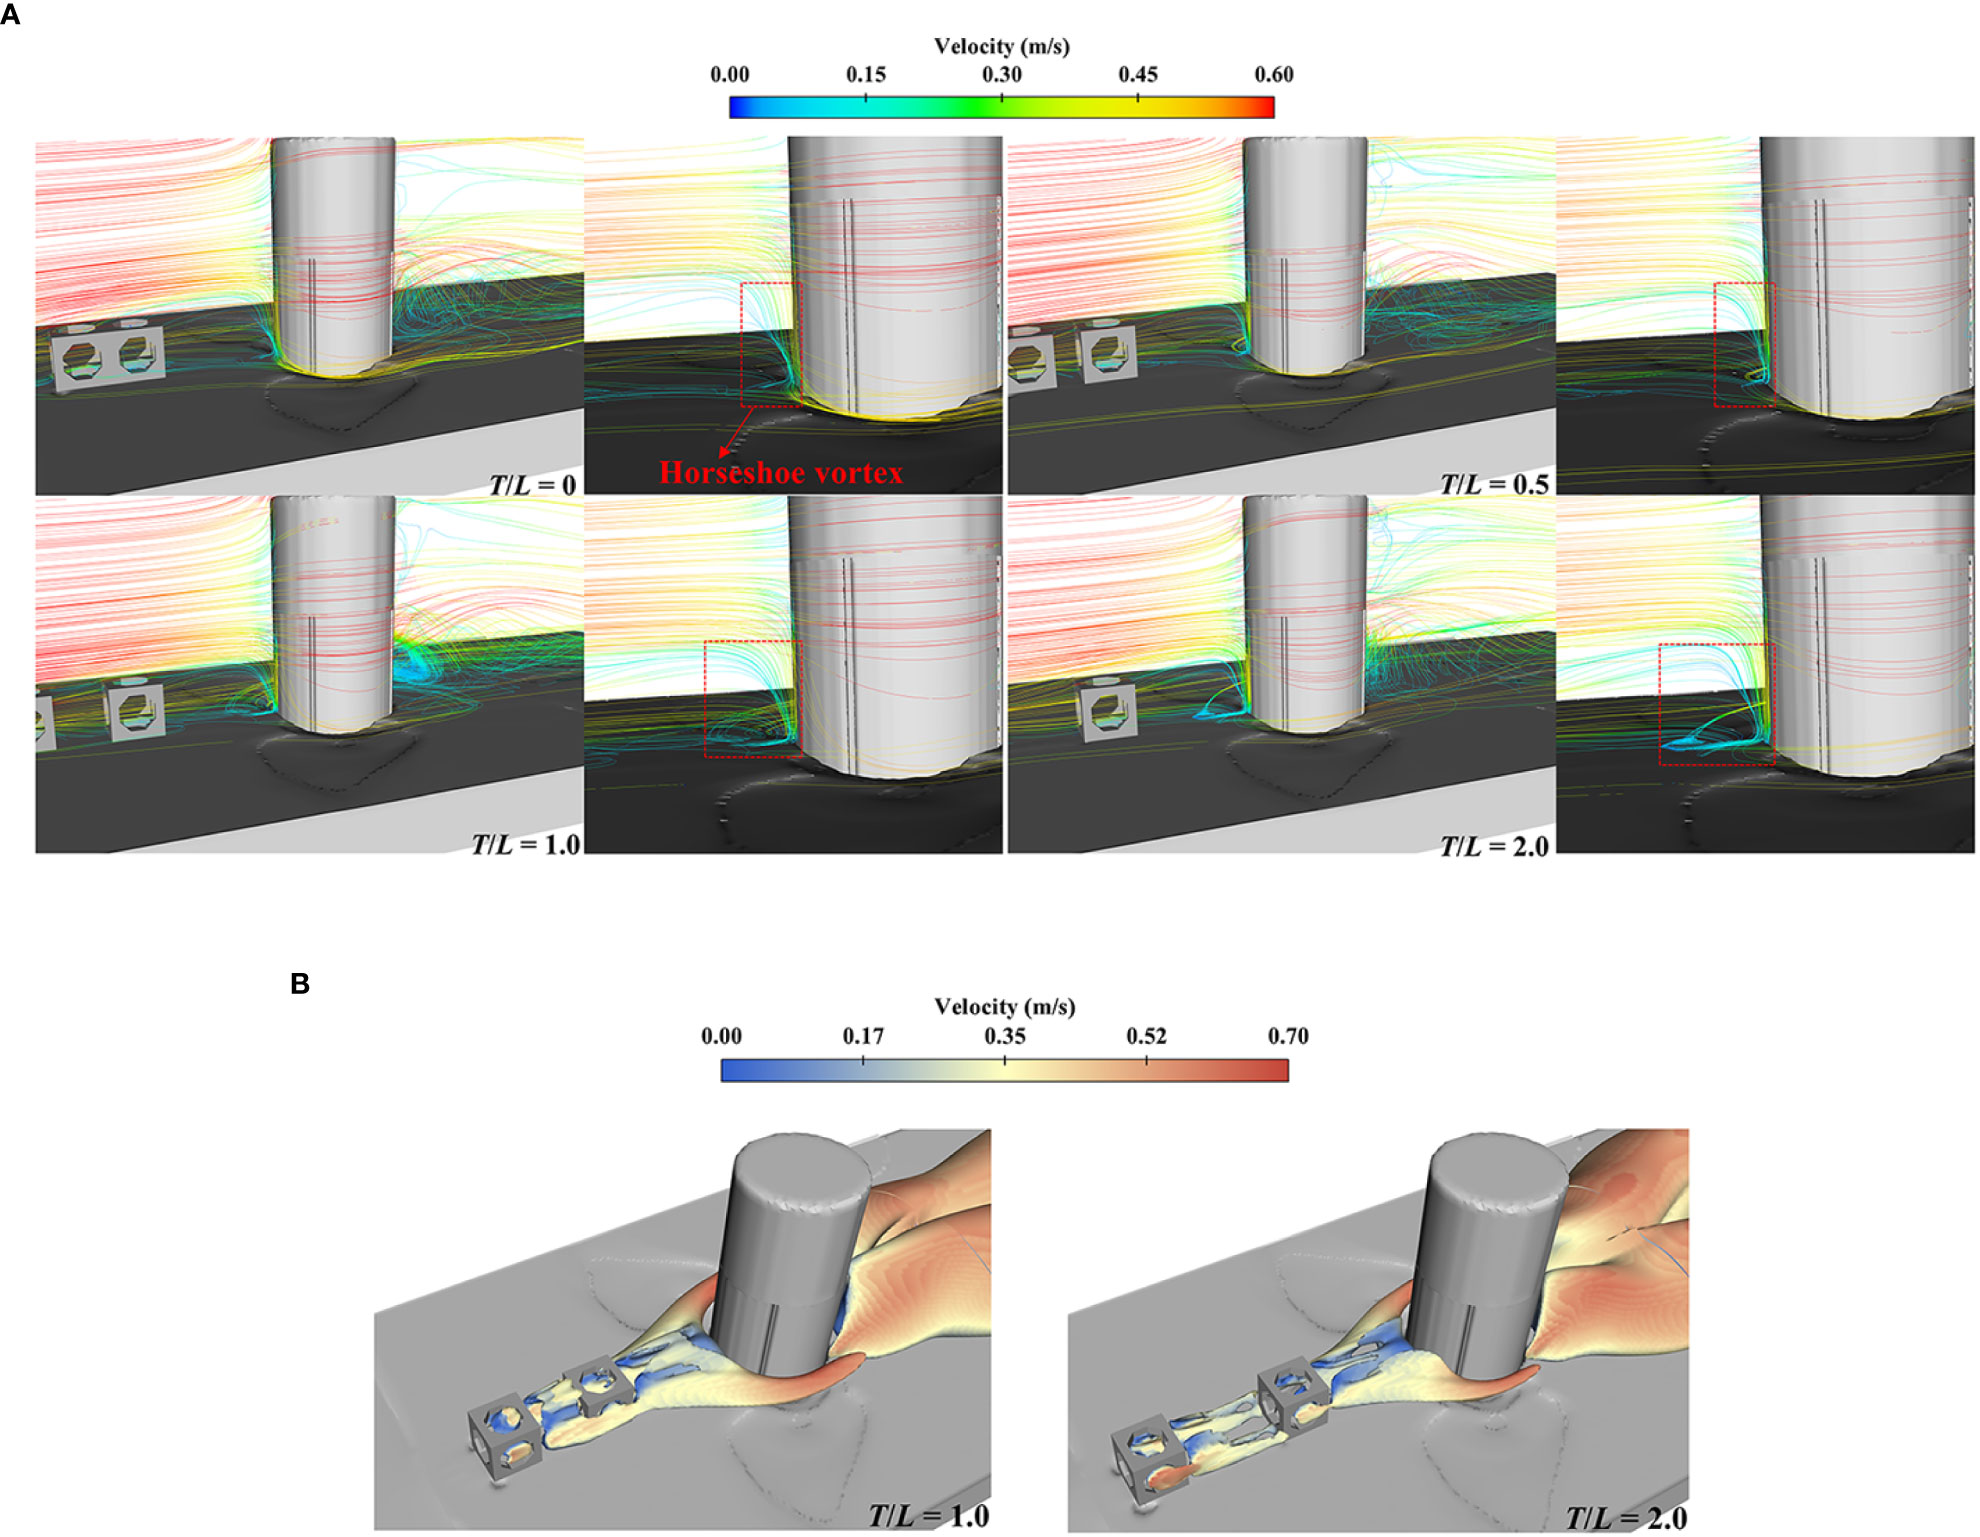
Figure 16 Flow velocity characteristics around the OWF in the Group III: (A) streamline distribution around the OWF (B) turbulence intensity around the OWF.
3.4 Influence of the H/L
Figure 17A depicts the seabed surface elevation around the OWF under different H/L values between the AR values at the last moment. The depth of the scour holes on both sides of the OWF decreased with an increase in the AR height. The higher the height of the AR, the lower the slope of the scour holes. In addition, the scour range in front of the OWF also increased with an increase in the height of the AR, as can be seen from the figure that the scour depth of the scour area outside the scour pit gradually deepened with increasing height.
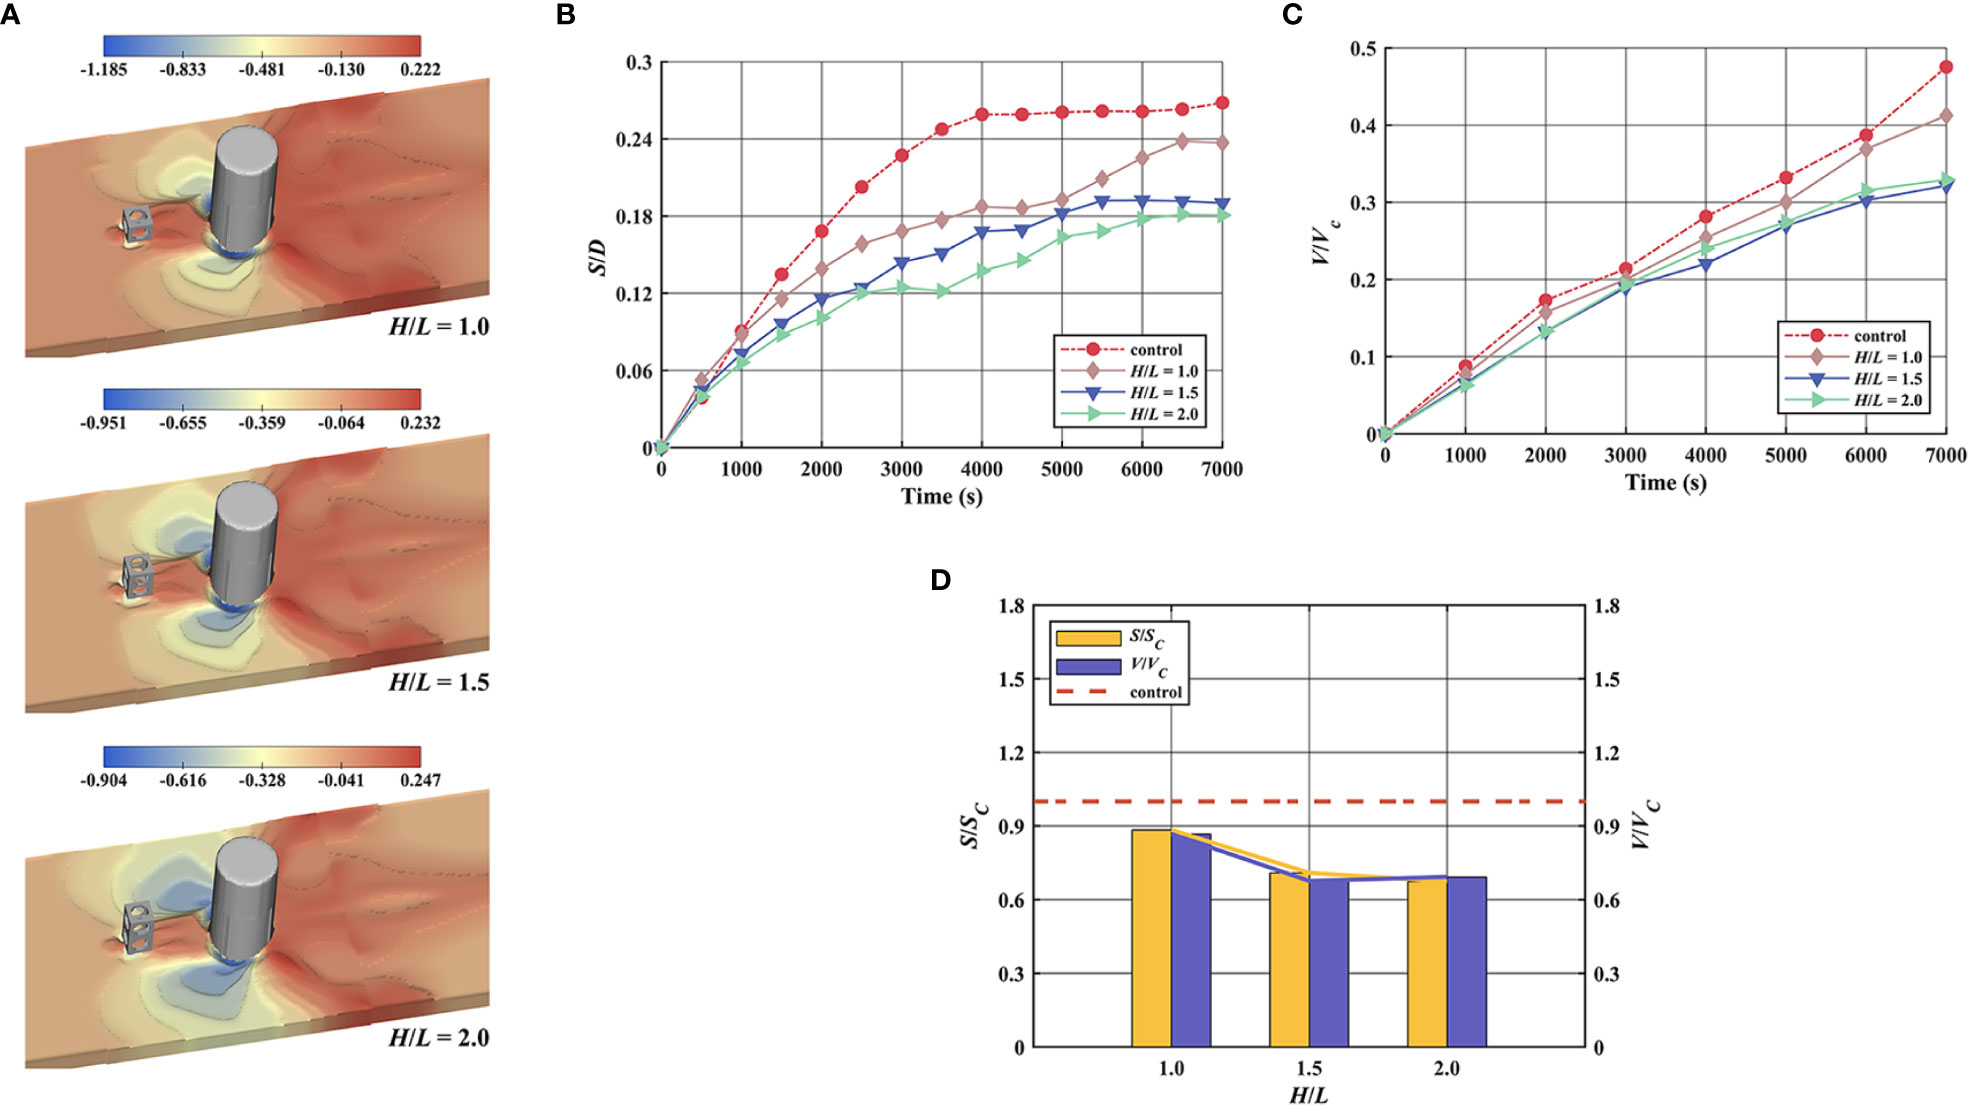
Figure 17 Scour calculation results of the Group IV: (A) seabed surface elevation change around the OWF (B) time evolution of the scour depth around the OWF (C) time evolution of the scour volume around the OWF (D) standardization of scour depth and scour volume.
The time evolutions of the scour depth and scour volume around the OWF in the control case and Group IV are shown in Figures 17B, C. The maximum scour depth around the OWF decreased gradually with increasing AR height. The minimum scour depth occurred at H/L = 2.0, which is 33% less than that of the control case.
An increase in AR height could improve the scour protection ability around the OWF. It is found that the scour depth reached the equilibrium stage at H/L = 1.5 and H/L = 2.0. In terms of scour volume, all three cases significantly reduced the scour volume of the terrain surrounding the OWF, and the results for H/L = 1.5 and H/L = 2.0 are comparable, with reductions of 32% and 31%, respectively, compared to the control case. Furthermore, no more calculation cases for the height of the AR have been set to study because of the limitation of calculation resources. However, it is still possible to find a significant decrease in the rate of change of scour depth and scour volume with height change Figure 17D. The scour depth and scour volume of H/L = 1.5 are 20% and 22% less than those of H/L = 1.0, respectively. However, the difference in scour results between H/L = 1.5 and H/L = 2.0 did not exceed 5%. In contrast, the differences in scour depth and scour volume between H/L = 1.5 and H/L = 2.0 are only 5% and 2%, respectively. The results demonstrate that although the increase in height effectively reduces scour around the OWF, there is a threshold value for the height of the AR beyond which the gain in scour protection from an increase in height is less.
Figure 18 compares the distribution of the flow velocity near the seabed around the OWF for the control case and Group IV at the beginning of the scour. The figure shows that the extent of the high-flow area on both sides of the OWF regularly decreases with an increase in the AR height. The increase in the height of the ARs will increase the height range of the wake region, and the change in the height of the wake region will affect the interaction with the horseshoe vortex (Li X. et al., 2022). The wake vortex behind the higher AR is at a higher elevation, merging with the horseshoe vortex and weakening it (Figure 19). This eventually leads to a slower flow around the OWF, lower bed shear stress, and weaker scour around the OWF as the height of the ARs increases. In the future, more cases need to be simulated to explore and obtain the optimal AR height considering both the construction cost and the effectiveness of scour protection.
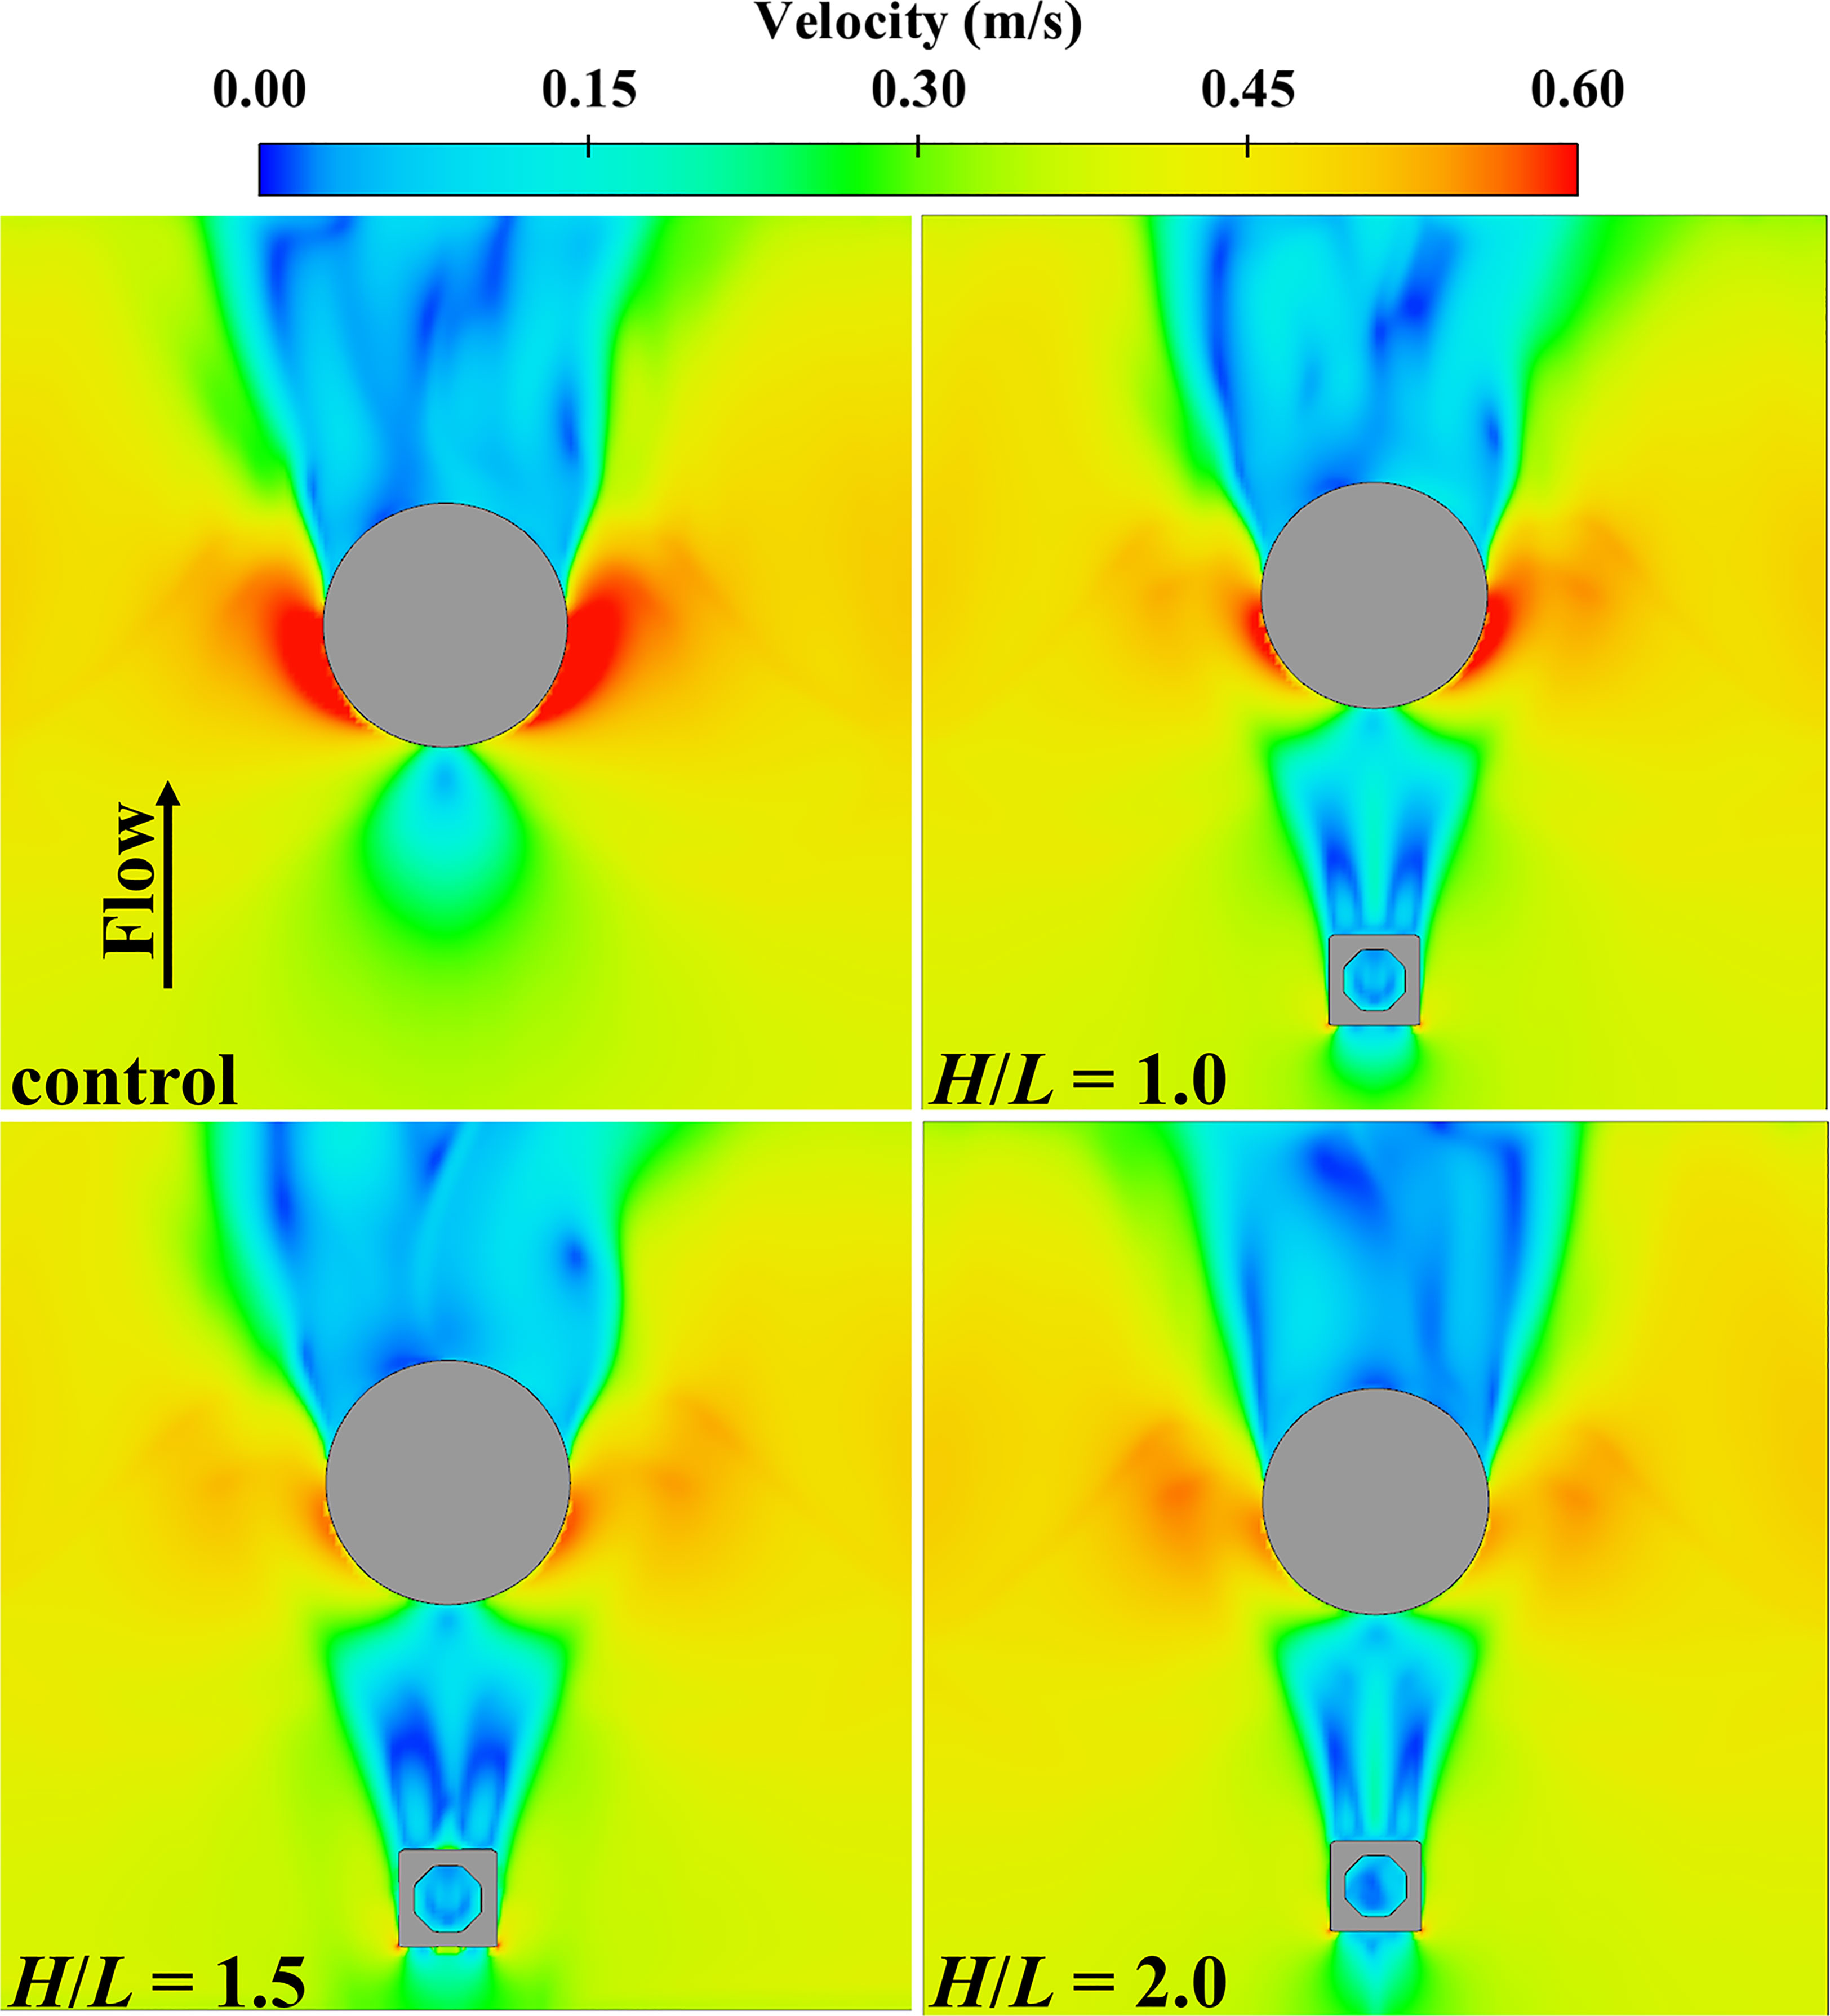
Figure 18 Distribution of the flow velocity contour near the seabed around the OWF in Group IV.
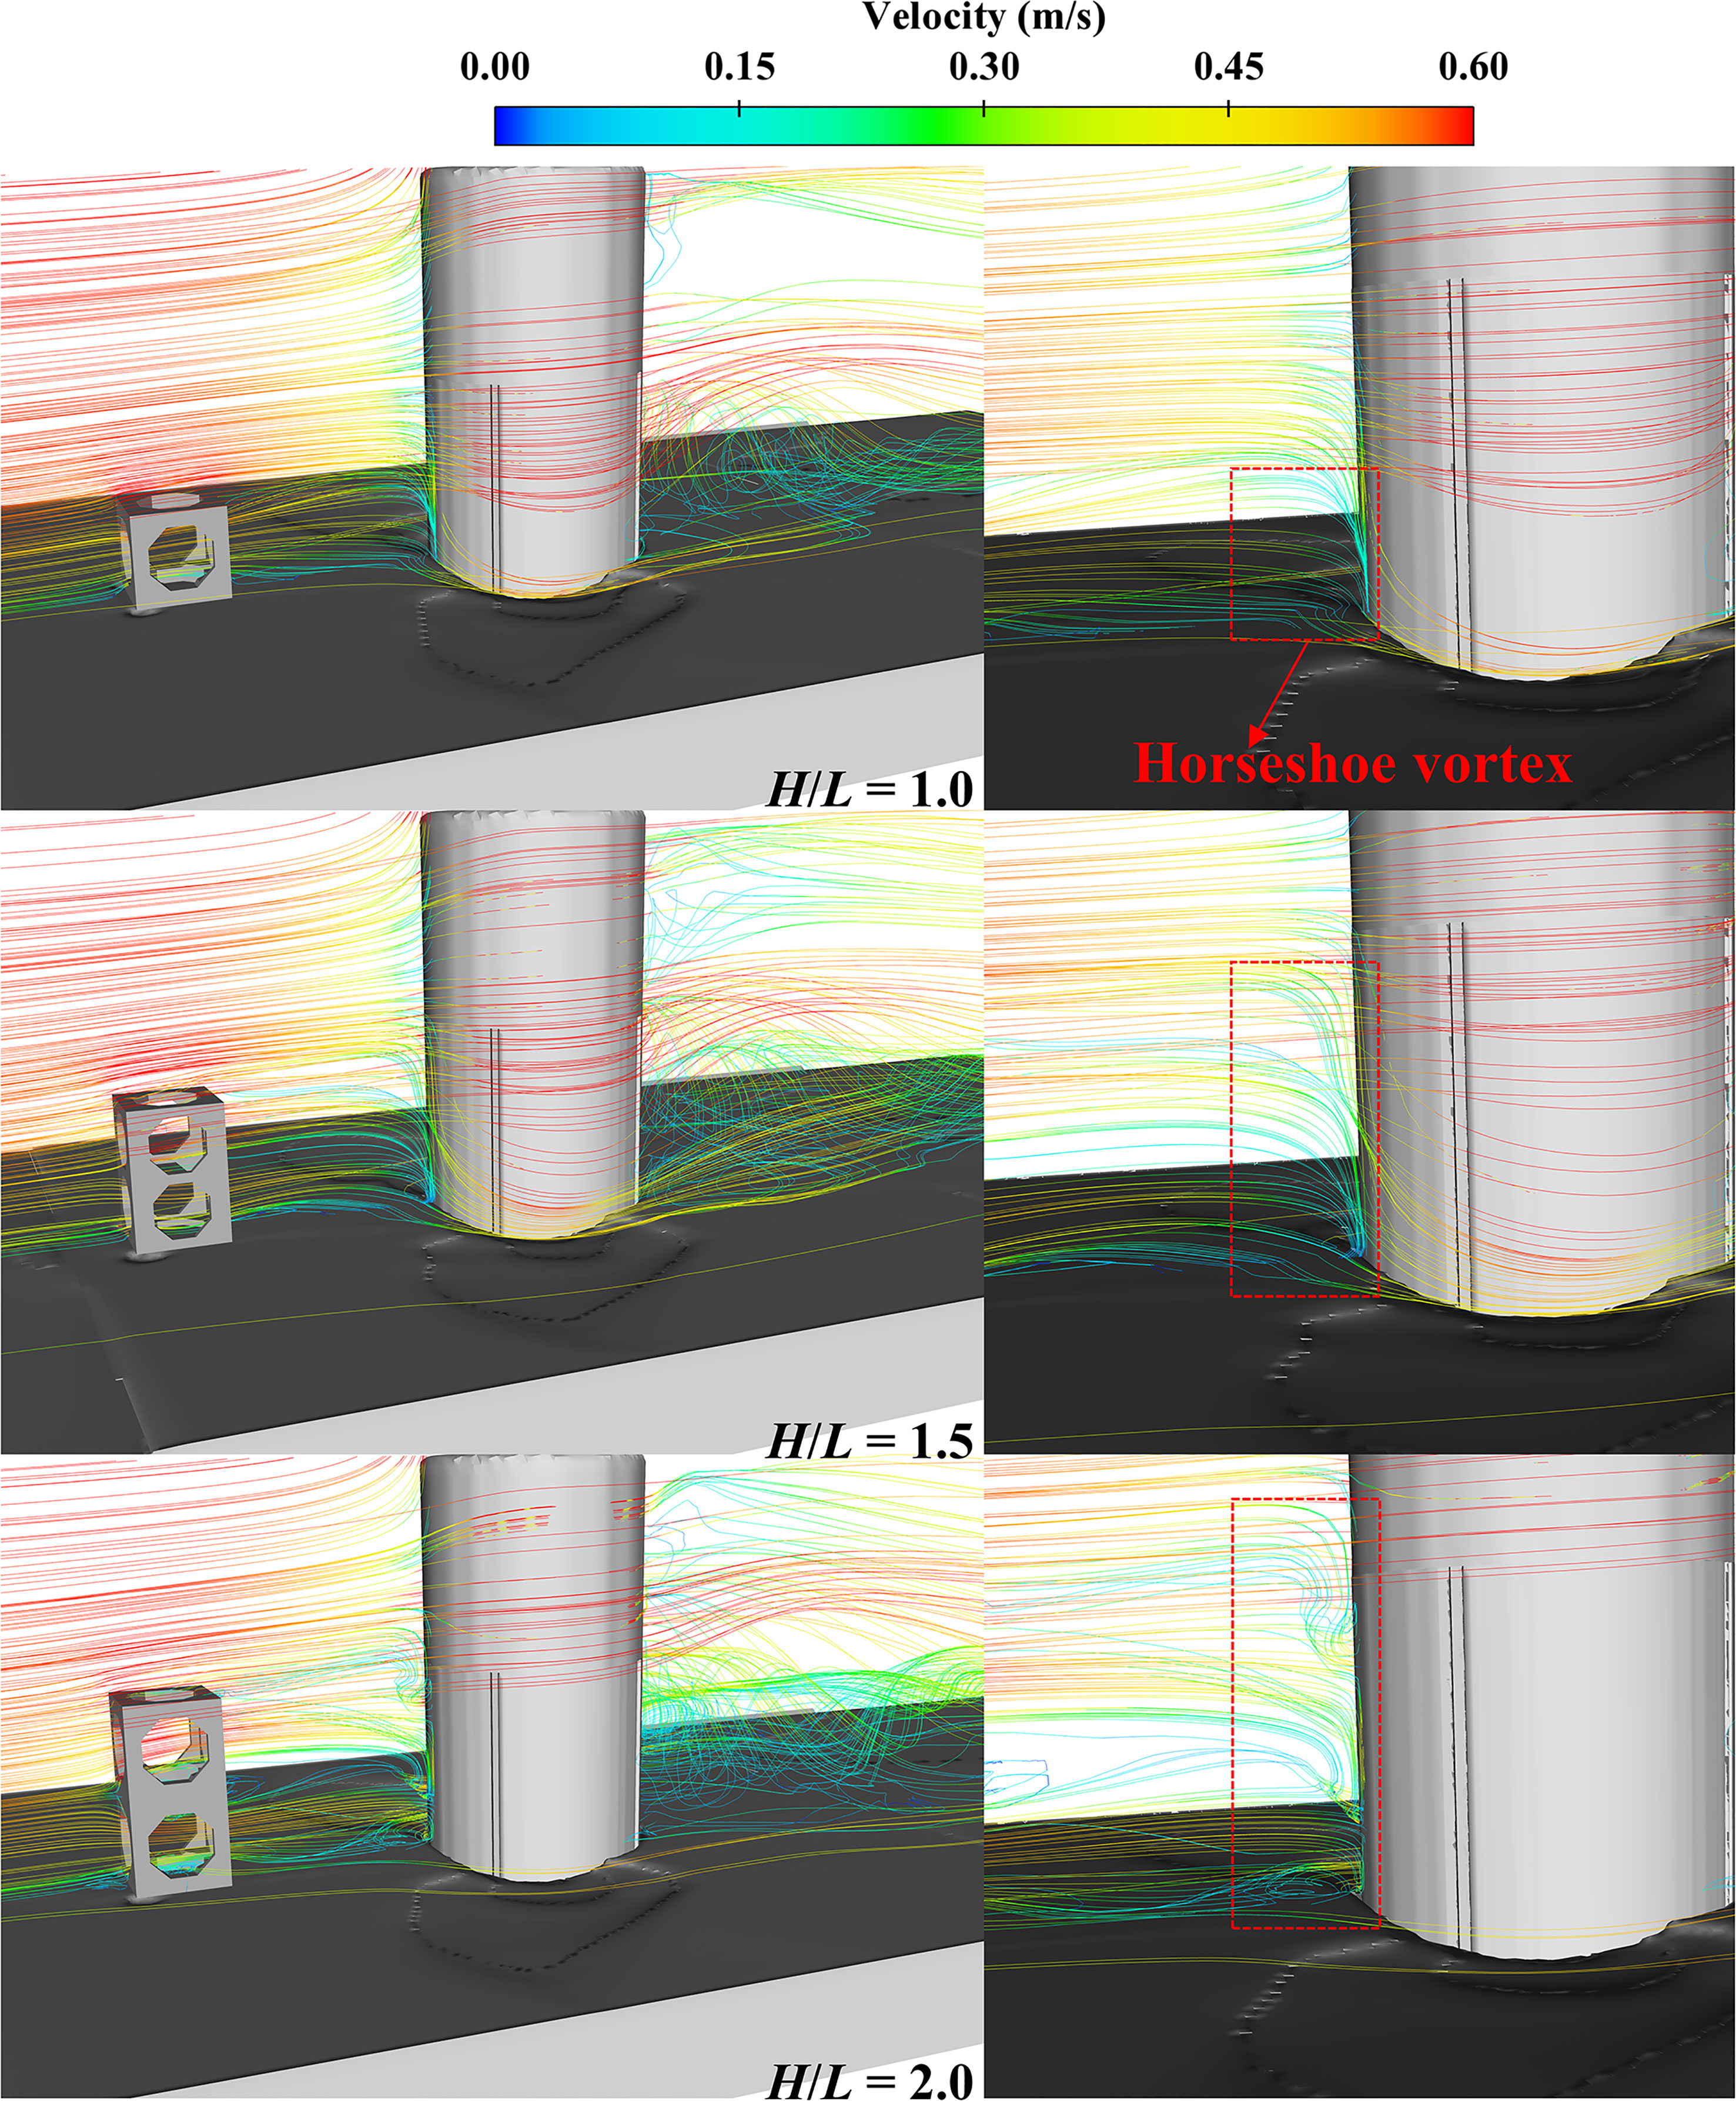
Figure 19 Streamline distribution around the OWF in Group IV.
4 Conclusion
In this study, the potential of scour protection for OWF using ARs inspired by the mechanism of passive scour protection is evaluated numerically. A numerical model using the RANS method with the RNG k-ϵ turbulence model and sediment transport model is conducted to investigate the effects of various distances between individual AR and the OWF on flow characteristics and sediment scour changes around the OWF. Based on this, the impact of various AR arrangements on the scour process around the OWF is also analyzed. Based on the numerical results, the following conclusions are drawn.
1. AR significantly reduced the scour depth and scour volume around the OWF and played a role in scour protection. The horseshoe vortex in front of the OWF is weakened by the AR and the range of fluid acceleration areas on both sides of the OWF. The shear stress on the seabed is reduced due to the effect of AR, which is the mechanism for the AR to provide a scour protection when G/D > 0. Finally, the scour depth and scour volume are reduced. G/D = 0.5 provided the most effective scour protection, which resulted in a 27.0% reduction in scour depth. The wake vortex shedding after the OWF is destroyed by the AR, which is the mechanism by which the AR provided scour protection when G/D< 0. G/D = -1.0 provided the most effective scour protection, which resulted in a 26% reduction in scour volume.
2. The parallel arrangement of the ARs had a negative impact on the maximum scour depth around the OWF due to the momentum transfer and acceleration of the fluid on the inner sides of the ARs and both sides of the OWF. However, this negative effect gradually decreased with increasing P/L, and when P/L > 3.0, the negative effects completely disappeared. The parallel arrangement of ARs had a positive role in the maximum scour volume around the OWF because the range of the wake region generated by ARs increased with an increase in the P/L. P/L = 5.0 provided the most effective scour protection, which resulted in a 31% reduction in scour volume.
3. The tandem arrangement of ARs effectively reduced the scour depth and scour volume around the OWF, because this arrangement affected the horseshoe vortex and reduced the turbulence intensity on both sides of the OWF. T/L = 0 provided the most effective scour protection, resulting in a 21% reduction in the scour depth. In addition, the tandem arrangement of ARs significantly reduced the scour volume around the OWF compared with a single AR. However, the change in T/L had almost no effect on the reduction in scour volume. The four current T/L cases had almost the same scour protection effect, which resulted in approximately 21%–24% of the scour volume.
4. The increase in the height of the AR provided the most significant scour protection at a fixed distance from the OWF, as a higher AR produced a higher wake region and interacted more intensely with the horseshoe vortex in height. H/L = 2.0 provided the most effective scour protection, which resulted in a 33% reduction in the scour depth. There is a limit for the effect of scour protection by increasing the height of the AR, beyond which the effect of scour protection did not change.
The scour results obtained in this study can provide guidance not only for the arrangement method of ARs with OWFs, but also be applied to the arrangement method of ARs with other offshore pile structures such as submerged cage and marine ranching platforms. It also provides an innovative and more ecologically effective passive scour protection method for the traditional pile scour problem.
Data availability statement
The raw data supporting the conclusions of this article will be made available by the authors, without undue reservation.
Author contributions
MY performed the simulation and wrote the manuscript. YT and FZ helped design the study, and critically revised the manuscript. SX edited the manuscript. All authors listed have made a direct and substantial contribution to this work, gave final approval for publication, and agreed to be held accountable for the work performed therein.
Funding
The study is supported by National Natural Science Foundation of China (NSFC: 32073025).
Conflict of interest
The authors declare that the research was conducted in the absence of any commercial or financial relationships that could be construed as a potential conflict of interest.
Publisher’s note
All claims expressed in this article are solely those of the authors and do not necessarily represent those of their affiliated organizations, or those of the publisher, the editors and the reviewers. Any product that may be evaluated in this article, or claim that may be made by its manufacturer, is not guaranteed or endorsed by the publisher.
References
Almeida L. (2017). REEFS: an artificial reef for wave energy harnessing and shore protection – a new concept towards multipurpose sustainable solutions. Renewable Energy 114, 817–829. doi: 10.1016/j.renene.2017.07.076
Baykal C., Sumer B., Fuhrman D., Jacobsen N., Fredsøe J. (2015). Numerical investigation of flow and scour around a vertical circular cylinder. Philos. Trans. R. Society Mathematical Physical Eng. Sci. 373, 20140104. doi: 10.1098/rsta.2014.0104
Bilgili M., Yasar A., Simsek E. (2011). Offshore wind power development in Europe and its comparison with onshore counterpart. Renewable Sustain. Energy Rev. 15, 905–915. doi: 10.1016/j.rser.2010.11.006
Chen Y., Lin H. (2022). Overview of the development of offshore wind power generation in China. Sustain. Energy Technol. Assessments 53, 102766. doi: 10.1016/j.seta.2022.102766
Chen X., Zhang X., Liu X., Zhang F., Yan J., Wang H. (2022). Experimental study of scour characteristics and scour hole dimensions in consolidated silt sediment under a current. Ocean Eng. 266, 112801. doi: 10.1016/j.oceaneng.2022.112801
Chu Y. I., Wang C. M., Zhang H. (2022). A frequency domain approach for analyzing motion responses of integrated offshore fish cage and wind turbine under wind and wave actions. Aquacultural Eng. 97, 102241. doi: 10.1016/j.aquaeng.2022.102241
Dai S., Han B., Wang B., Luo J., He B. (2021). Influence of soil scour on lateral behavior of large-diameter offshore wind-turbine monopile and corresponding scour monitoring method. Ocean Eng. 239, 109809. doi: 10.1016/j.oceaneng.2021.109809
Deng X., He S., Cao Z. (2022). Numerical investigation of the local scour around a coconut tree root foundation under wave-current joint actions. Ocean Eng. 245, 110563. doi: 10.1016/j.oceaneng.2022.110563
Fang G., Yu H., Sheng H., Tang Y., Liang Z. (2021). Comparative analysis of microbial communities between water and sediment in laoshan bay marine ranching with varied aquaculture activities. Mar. Pollut. Bull. 173, 112990. doi: 10.1016/j.marpolbul.2021.112990
Gautam S., Dutta D., Bihs H., Afzal M. (2021). Three-dimensional computational fluid dynamics modelling of scour around a single pile due to combined action of the waves and current using level-set method. Coast. Eng. 170, 104002. doi: 10.1016/j.coastaleng.2021.104002
Ghiasian M., Carrick J., Rhode-Barbarigos L., Haus B., Baker A., Lirman D. (2021). Dissipation of wave energy by a hybrid artificial reef in a wave simulator: implications for coastal resilience and shoreline protection. Limnol. Oceanogr. Methods 19, 1–7. doi: 10.1002/lom3.10400
Huang C., Afero F., Hung C., Chen B., Nan F., Chiang W., et al. (2022). Economic feasibility assessment of cage aquaculture in offshore wind power generation areas in changhua county, Taiwan. Aquaculture 548, 737611. doi: 10.1016/j.aquaculture.2021.737611
Jenkins S., Inman D., Richardson M., Wever T., Wasyl J. (2007). Scour and burial mechanics of objects in the nearshore. IEEE J. Oceanic Eng. 32, 78–90. doi: 10.1109/JOE.2007.890946
Jiang Z., Liang Z., Zhu L., Guo Z., Tang Y. (2020). Effect of hole diameter of rotary-shaped artificial reef on flow field. Ocean Eng. 197, 106917. doi: 10.1016/j.oceaneng.2020.106917
Jiang Z., Liang Z., Zhu L., Liu Y. (2016). Numerical simulation of effect of guide plate on flow field of artificial reef. Ocean Eng. 116, 236–241. doi: 10.1016/j.oceaneng.2016.03.005
Jung S., Na W., Kim D. (2022). Rugosity and blocking indices of artificial reefs and their correlations with wake volume. Ocean Eng. 261, 112204. doi: 10.1016/j.oceaneng.2022.112204
Kim T., Baek S., Kwon Y., Lee J., Cha S., Kwon S. (2020). Improved coastal erosion prevention using a hybrid method with an artificial coral reef: large-scale 3D hydraulic experiment. Water 12, 2801. doi: 10.3390/w12102801
Kim D., Jung S., Kim J., Na W. (2019). Efficiency and unit propagation indices to characterize wake volumes of marine forest artificial reefs established by flatly distributed placement models. Ocean Eng. 175, 138–148. doi: 10.1016/j.oceaneng.2019.02.020
Kim D., Jung S., Na W. (2021). Evaluation of turbulence models for estimating the wake region of artificial reefs using particle image velocimetry and computational fluid dynamics. Ocean Eng. 223, 108673. doi: 10.1016/j.oceaneng.2021.108673
Kim T., Kwon Y., Lee J., Lee E., Kwon S. (2022). Wave attenuation prediction of artificial coral reef using machine-learning integrated with hydraulic experiment. Ocean Eng. 248, 110324. doi: 10.1016/j.oceaneng.2021.110324
Kim D., Woo J., Yoon H., Na W. (2016). Efficiency, tranquillity and stability indices to evaluate performance in the artificial reef wake region. Ocean Eng. 122, 253–261. doi: 10.1016/j.oceaneng.2016.06.030
Komyakova V., Chamberlain D., Jones G., Swearer S. (2019). Assessing the performance of artificial reefs as substitute habitat for temperate reef fishes: implications for reef design and placement. Sci. Total Environ. 668, 139–152. doi: 10.1016/j.scitotenv.2019.02.357
Lei Y., Zheng X., Li W., Zheng H., Zhang Q., Zhao S., et al. (2021). Experimental study of the state-of-the-art offshore system integrating a floating offshore wind turbine with a steel fish farming cage. Mar. Structures 80, 103076. doi: 10.1016/j.marstruc.2021.103076
Li J., Guo Y., Lian J., Wang H. (2022). Scour effects on the bearing capacity of multi-bucket jacket foundation for offshore wind turbines. Ocean Eng. 259, 111848. doi: 10.1016/j.oceaneng.2022.111848
Li X., Paassen L., Tao J. (2022). Investigation of using mangrove-inspired skirt pile group as a scour countermeasure. Ocean Eng. 266, 113133. doi: 10.1016/j.oceaneng.2022.113133
Lian J., Li J., Guo Y., Wang H., Yang X. (2022). Numerical study on local scour characteristics of multi-bucket jacket foundation considering exposed height. Appl. Ocean Res. 121, 103092. doi: 10.1016/j.apor.2022.103092
Liu T., Su D. (2013). Numerical analysis of the influence of reef arrangements on artificial reef flow fields. Ocean Eng. 74, 81–89. doi: 10.1016/j.oceaneng.2013.09.006
López I., Tinoco H., Aragonés L., García-Barba J. (2016). The multifunctional artificial reef and its role in the defence of the Mediterranean coast. Sci. Total Environ. 550, 910–923. doi: 10.1016/j.scitotenv.2016.01.180
Lu Y., Liang B., Yin Z., Pan X., Wang J., Du S. (2022). Experimental study on time factor of scour around pile groups. Ocean Eng. 261, 112125. doi: 10.1016/j.oceaneng.2022.112125
Ma H., Chen C. (2021). Scour protection assessment of monopile foundation design for offshore wind turbines. Ocean Eng. 231, 109083. doi: 10.1016/j.oceaneng.2021.109083
Ma L., Wang L., Guo Z., Jiang H., Gao Y. (2018). Time development of scour around pile groups in tidal currents. Ocean Eng. 163, 400–418. doi: 10.1016/j.oceaneng.2018.06.035
Marin-Diaz B., Fivash G., Nauta J., Temmink R., Hijner N., Reijers V., et al. (2021). On the use of large-scale biodegradable artificial reefs for intertidal foreshore stabilization. Ecol. Eng. 170, 106354. doi: 10.1016/j.ecoleng.2021.106354
McGovern D., Ilic S., Folkard A., McLelland S., Murphy B. (2014). Time development of scour around a cylinder in simulated tidal currents. J. Hydraulic Eng. 140, 04014014. doi: 10.1061/(ASCE)HY.1943-7900.0000857
Meyer-Peter E. (1948). Formulas for bed-load transport. Proceedings of the 2nd Meeting of the International Association for Hydraulic Structures Research, 39–64.
Nazari-Sharabian M., Nazari-Sharabian A., Karakouzian M., Karami M. (2020). Sacrificial piles as scour countermeasures in river bridges a numerical study using FLOW-3D. Civil Eng. J. 6, 1091–1103. doi: 10.28991/cej-2020-03091531
Nielsen A., Liu X., Sumer B., Fredsøe J. (2013). Flow and bed shear stresses in scour protections around a pile in a current. Coast. Eng. 72, 20–38. doi: 10.1016/j.coastaleng.2012.09.001
Pan Y., Tong H., Wei D., Xiao W., Xue D. (2022). Review of structure types and new development prospects of artificial reefs in china. Front. Mar. Sci. 9. doi: 10.3389/fmars.2022.853452
Pandey M., Azamathulla H., Chaudhuri S., Pu J., Pourshahbaz H. (2020). Reduction of time-dependent scour around piers using collars. Ocean Eng. 213, 107692. doi: 10.1016/j.oceaneng.2020.107692
Raaijmakers T., Oeveren M., Rudolph D., Leenders V., Sinjou W. (2010). Field performance of scour protection around offshore monopiles. Int. Conf. Scour. Erosion, 428–339. doi: 10.1061/41147(392)41
Roulund A., Sumer B., Fredsøe J., Michelsen J. (2005). Numerical and experimental investigation of flow and scour around a circular pile. J. Fluid Mechanics 534, 351–401. doi: 10.1017/S0022112005004507
Schendel A., Hildebrandt A., Goseberg N., Schlurmann T. (2018). Processes and evolution of scour around a monopile induced by tidal currents. Coast. Eng. 139, 65–84. doi: 10.1016/j.coastaleng.2018.05.004
Srisuwan C., Rattanamanee P. (2015). Modeling of seadome as artificial reefs for coastal wave attenuation. Ocean Eng. 103, 198–210. doi: 10.1016/j.oceaneng.2015.04.069
Sumer B., Fredsøe J. (2001). Wave scour around a large vertical circular cylinder. J. Waterway Port Coast. Ocean Eng. 127, 125–134. doi: 10.1061/(ASCE)0733-950X(2001)127:3(125
Sumer B., Fredsøe J., Christiansen N. (1992). Scour around vertical pile in waves. J. Waterway Port Coast. Ocean Eng. 118, 15–31. doi: 10.1061/(ASCE)0733-950X(1992)118:1(15
Tang Y., Wei S., Yang M., Wang X., Zhao F. (2022). Experimental investigation of local scour around artificial reefs in steady currents. J. Ocean Univ. China 21, 445–456. doi: 10.1007/s11802-022-4883-8
Wang C., Liang F., Yu X. (2017). Experimental and numerical investigations on the performance of sacrificial piles in reducing local scour around pile groups. Nat. Hazards 85, 1417–1435. doi: 10.1007/s11069-016-2634-0
Wang X., Liu X., Tang Y., Zhao F., Luo Y. (2021). Numerical analysis of the flow effect of the menger-type artificial reefs with different void space complexity indices. Symmetry 13, 1040. doi: 10.3390/sym13061040
Wang G., Wan R., Wang X., Zhao F., Lan X., Cheng H., et al. (2018). Study on the influence of cut-opening ratio, cut-opening shape, and cut-opening number on the flow field of a cubic artificial reef. Ocean Eng. 162, 341–352. doi: 10.1016/j.oceaneng.2018.05.007
Wei K., Qiu F., Qin S. (2022). Experimental and numerical investigation into effect of skirted caisson on local scour around the large-scale bridge foundation. Ocean Eng. 250, 111052. doi: 10.1016/j.oceaneng.2022.111052
Whitehouse R., Harris J., Sutherland J., Rees J. (2011). The nature of scour development and scour protection at offshore windfarm foundations. Mar. pollut. Bull. 62, 73–88. doi: 10.1016/j.marpolbul.2010.09.007
Yang F., Qu L., Tang G., Lu L. (2021). Local scour around a porous surface-piercing square monopile in steady current. Ocean Eng. 223, 108716. doi: 10.1016/j.oceaneng.2021.108716
Yang M., Tang Y., Zhao F., Xu S., Fang G. (2022). “Numerical simulation of local scour around square artificial reef,” in Proceedings of the ASME2022 41st International Conference on Ocean, Offshore and Arctic Engineering. 13. doi: 10.1115/OMAE2022-78941
Yang Q., Yu P., Liu H. (2021). CFD modelling of local scour around tri-USAF in sand with different arrangements under steady current. Ocean Eng. 235, 109359. doi: 10.1016/j.oceaneng.2021.109359
Yang Q., Yu P., Liu H. (2022). Computational investigation of scour characteristics of USAF in multi-specie sand under steady current. Ocean Eng. 262, 112141. doi: 10.1016/j.oceaneng.2022.112141
Yang Q., Yu P., Liu Y., Liu H., Zhang P., Wang Q. (2020). Scour characteristics of an offshore umbrella suction anchor foundation under the combined actions of waves and currents. Ocean Eng. 202, 106701. doi: 10.1016/j.oceaneng.2019.106701
Yang H., Ru X., Zhang L., Lin C. (2019). Industrial convergence of marine ranching and offshore wind power: concept and prospect. Bull. Chinese Acad. Sci. 34, 6. doi: 10.16418/j.issn.1000-3045.2019.06.011
Yao W., An H., Draper S., Cheng L., Harris J. (2018). Experimental investigation of local scour around submerged piles in steady current. Coast. Eng. 142, 27–41. doi: 10.1016/j.coastaleng.2018.08.015
Yao W., Draper S., An H., Cheng L., Harris J., Whitehouse R. (2020). Effect of a skirted mudmat foundation on local scour around a submerged structure. Ocean Eng. 218, 108127. doi: 10.1016/j.oceaneng.2020.108127
Yu P., Hu R., Yang J., Liu H. (2020). Numerical investigation of local scour around USAF with different hydraulic conditions under currents and waves. Ocean Eng. 213, 107696. doi: 10.1016/j.oceaneng.2020.107696
Yu T., Zhang Y., Zhang S., Shi Z., Chen X., Xu Y., et al. (2019). Experimental study on scour around a composite bucket foundation due to waves and current. Ocean Eng. 189, 106302. doi: 10.1016/j.oceaneng.2019.106302
Zhang Q., Tang G., Lu L., Yang F. (2021). Scour protections of collar around a monopile foundation in steady current. Appl. Ocean Res. 112, 102718. doi: 10.1016/j.apor.2021.102718
Zhang C., Wang S., Cui M., Liu H., Liu A., Xu J., et al. (2022). Modeling and dynamic response analysis of a submersible floating offshore wind turbine integrated with an aquaculture cage. Ocean Eng. 263, 112338. doi: 10.1016/j.oceaneng.2022.112338
Zhang Q., Zhou X., Wang J. (2017). Numerical investigation of local scour around three adjacent piles with different arrangements under current. Ocean Eng. 142, 625–638. doi: 10.1016/j.oceaneng.2017.07.045
Zhao M., Cheng L., Zang Z. (2010). Experimental and numerical investigation of local scour around a submerged vertical circular cylinder in steady currents. Coast. Eng. 57, 709–721. doi: 10.1016/j.coastaleng.2010.03.002
Zhao F., Xu S., Yang M., Tang Y., Huang L., Fang G. (2022). “Experimental study on local scour of triangular artificial reef,” in Proceedings of the ASME2022 41st International Conference on Ocean, Offshore and Arctic Engineering. 9. doi: 10.1115/OMAE2022-78936
Keywords: offshore wind turbine, artificial reef, numerical simulation, scour depth, arrangement method
Citation: Yang M, Tang Y, Zhao F and Xu S (2023) Numerical simulation of offshore wind power pile foundation scour with different arrangements of artificial reefs. Front. Mar. Sci. 10:1178370. doi: 10.3389/fmars.2023.1178370
Received: 02 March 2023; Accepted: 16 May 2023;
Published: 05 July 2023.
Edited by:
Zhao Yunpeng, Dalian University of Technology, ChinaReviewed by:
Ray-Yeng Yang, National Cheng Kung University, TaiwanTao Tian, Dalian Ocean University, China
Copyright © 2023 Yang, Tang, Zhao and Xu. This is an open-access article distributed under the terms of the Creative Commons Attribution License (CC BY). The use, distribution or reproduction in other forums is permitted, provided the original author(s) and the copyright owner(s) are credited and that the original publication in this journal is cited, in accordance with accepted academic practice. No use, distribution or reproduction is permitted which does not comply with these terms.
*Correspondence: Yanli Tang, tangyanli@ouc.edu.cn; Fenfang Zhao, zhaoff@ouc.edu.cn