Mooring tension assessment of a single line kelp farm with quantified biomass, waves, and currents
 David W. Fredriksson1*
  Adam T. St. Gelais2
  Tobias Dewhurst3
  Struan Coleman4
  Damian C. Brady2,4
  Barry Antonio Costa-Pierce5,6
- 1School of Marine Science and Ocean Engineering, University of New Hampshire, Durham, NH, United States
- 2Aquaculture Research Institute, University of Maine, Darling Marine Center, Walpole, ME, United States
- 3Kelson Marine Co., Portland, ME, United States
- 4School of Marine Sciences, Darling Marine Center, University of Maine, Walpole, ME, United States
- 5Faculty of Biosciences and Aquaculture, Nord University, Bodø, Norway
- 6Ecological Aquaculture Foundation, LLC, Biddeford, ME, United States
While the number of kelp farms have steadily increased, few have been deployed with sensors to measure mooring tensions with substantial biomass. During the kelp farming season of 2018–2019 in Saco Bay, Maine USA, a field study was conducted to assess mooring loads due to environmental conditions and kelp growth. The effort included the deployment of a farm with a 122 m cultivation line and spread mooring with rope, chain, and anchors in 15.2 m of water. The system was deployed with seeded twine in late November and harvested in May. In April, with kelp biomass estimated at 7.8 kg m−1, two load cells were installed to measure mooring tensions in response to currents and waves. The currents and waves were measured with two Acoustic Doppler Current Profilers deployed adjacent to the load cells. From these measurements, we characterized the maximum loading case in response to a complex hydrodynamic environment. The maximum tension occurred on the landward side of the farm even though wave exposure was seaward. The tension in the landward side mooring was dominated by steady drag from the currents going to the east southeast. During this event, the two profilers were positioned on the leading and trailing edges of the farm relative to the prevailing current direction. Velocities measured at 0.5 m bins showed a 26.7% reduction at the depths where the kelp was located. To analyze the dynamic portion of the load cell datasets, the oscillatory components were processed into energy density spectra. Results showed that mooring tensions were not affected by waves at frequencies greater than 0.175 Hz, with most of the energy occurring near 0.12 Hz. The tension spectra did reveal energy at frequencies between 0.0075 and 0.01 Hz, indicating a low frequency response, possibly due to nonuniform velocity profiles inducing vertical motion of the cultivation line. It was also observed that the landward mooring, subjected to higher currents, was more sensitive to oscillating loads than the slack seaward side. The high-fidelity dataset will be useful for numerical modeling validation to further understand these dynamics and to optimize kelp farm designs.
1 Introduction
The farming of brown macroalgae of order Laminariales (kelp) in temperate oceans has grown in recent years (Grebe et al., 2019). In the northeast of the United States (US), especially in the Gulf of Maine, the kelp industry has expanded by nearly 3,000% from 2015 to 2020, characterized by mostly small owner-operators (St-Gelais et al., 2022). This sector of the traditional working waterfront utilizes existing fishing industry infrastructure, including lobster fishing vessels, often with just 2–3 individuals as crew (Piconi et al., 2020). At this infrastructure scale, gear cannot be oversized even though more exposed sites are being considered. These factors influence both capital and equipment replacement costs that represent a significant portion of the cost of production (Coleman et al., 2022).
The evaluation and design of kelp farming systems is challenging because kelp can grow densely (Kim et al., 2015; Augyte et al., 2017), is compliant (Buck and Buchholz, 2005; Henry, 2014; Rominger and Nepf, 2014), and is often close to being neutrally buoyant (Vettori and Nikora, 2017). Because of these qualities, Fredriksson et al. (2020) examined the steady flow hydrodynamics of a full-scale physical model representing 1 m aggregates of Saccharina latissima grown on an ocean-deployed farm in a series of tow tank experiments. The intent was to produce normal and tangential drag coefficients to be utilized in time domain numerical models, based on the empirical approach using a modified Morison equation (Morison et al., 1950), and using the finite element method (FEM). One set of FEM approaches stem from the work of Gosz et al. (1996); Tsukrov et al. (2003), and Fredriksson et al. (2003) focusing on net systems. Many others have also developed numerical modeling techniques for containment net structures. Examples include Li et al. (2006), Zhao et al. (2007), Zhao et al. (2015), Lee et al. (2008), Lee et al. (2015), Huang and Pan (2010), Reite et al. (2014), Cifuentes and Kim, (2017), Tsarau and Kristiansen (2019), and Martin et al. (2021). Commercial codes are also available such as OrcaFlex (https://www.orcina.com/), ProteusDS (https://dsa-ltd.ca/proteusds/overview/), and AquaSim (Berstad et al., 2012; Berstad and Heimstad, 2019). Considerable work has also been done modeling single line aquaculture systems such as mussel farms (e.g., Raman-Nair and Colbourne, 2003 and Raman-Nair et al., 2008; Pribadi et al., 2019; Knysh et al., 2020). Many of these net and mussel farm modeling techniques can be modified for kelp farming applications, such as Knysh et al. (2022). As with any engineering approach, however, these computational methods are only as valuable as they are accurate. Thus, the predictions must be validated with measurements of the behavior of in-situ macroalgae cultivation structures.
Understanding in-situ physical properties of these aquaculture systems requires field instrumentation with specific sampling strategies. A body of work has been established focusing on field measurement of engineering parameters for aquaculture systems. For example, Colbourne and Allen (2001); Fredriksson et al. (2003), and Fredriksson et al. (2007a, b), developed techniques to measure loadings on fish cage systems, while Stevens et al. (2007); Stevens et al. (2008), and Nguyen et al. (2019) deployed engineering instrumentation on shellfish farms. A need also exists to establish a similar understanding of the in-situ characteristics of kelp farms. Specifically, this information will guide the application of numerical models and associated design procedures, especially as larger scale farms are designed for exposed ocean areas to meet demand for non-food end uses of biomass (biofuel, animal feed, bio-composite materials, carbon, and nutrient removal).
The objective of this study was to assess mooring load characteristics due to biomass and environmental conditions for an exposed kelp farm. The engineering study was conducted during the kelp farming season from November 2018 to May 2019 in Saco Bay, Maine USA. Submersible load cell instruments were custom designed and deployed on farm mooring lines to measure the tension response to directional waves and currents recorded with two bottom-mounted Acoustic Doppler Current Profilers (ADCPs). Tension datasets with wave and current information were examined along with the amount of kelp biomass growing at the time of measurement. We then examined the current velocity profile and directional wave details associated with the highest tension event. The goal is to use this high-fidelity dataset in the future to improve numerical modeling approaches, filling a critical research and development need for kelp aquaculture in emerging production regions.
2 Methodology
2.1 The kelp farm site and system
The field study was conducted at an aquaculture lease (St-Gelais et al., 2022) where a kelp farm was deployed at an exposed site in Saco Bay, Maine, USA (Figure 1). The site was permitted with a Limited Purpose Aquaculture (LPA) license, having surface dimensions of 0.3 x 122 m, a nominal mean sea level of 15.2 m, and bottom substrate composed mostly of sand. The intent of the LPA license in Maine is to provide opportunity for entry into aquaculture with a yearly lease of a single grow line. The Saco Bay LPA site was chosen for its exposure to the east, but still accessible for farm operation with only a 3.5 km transit from a pier in the Saco River.
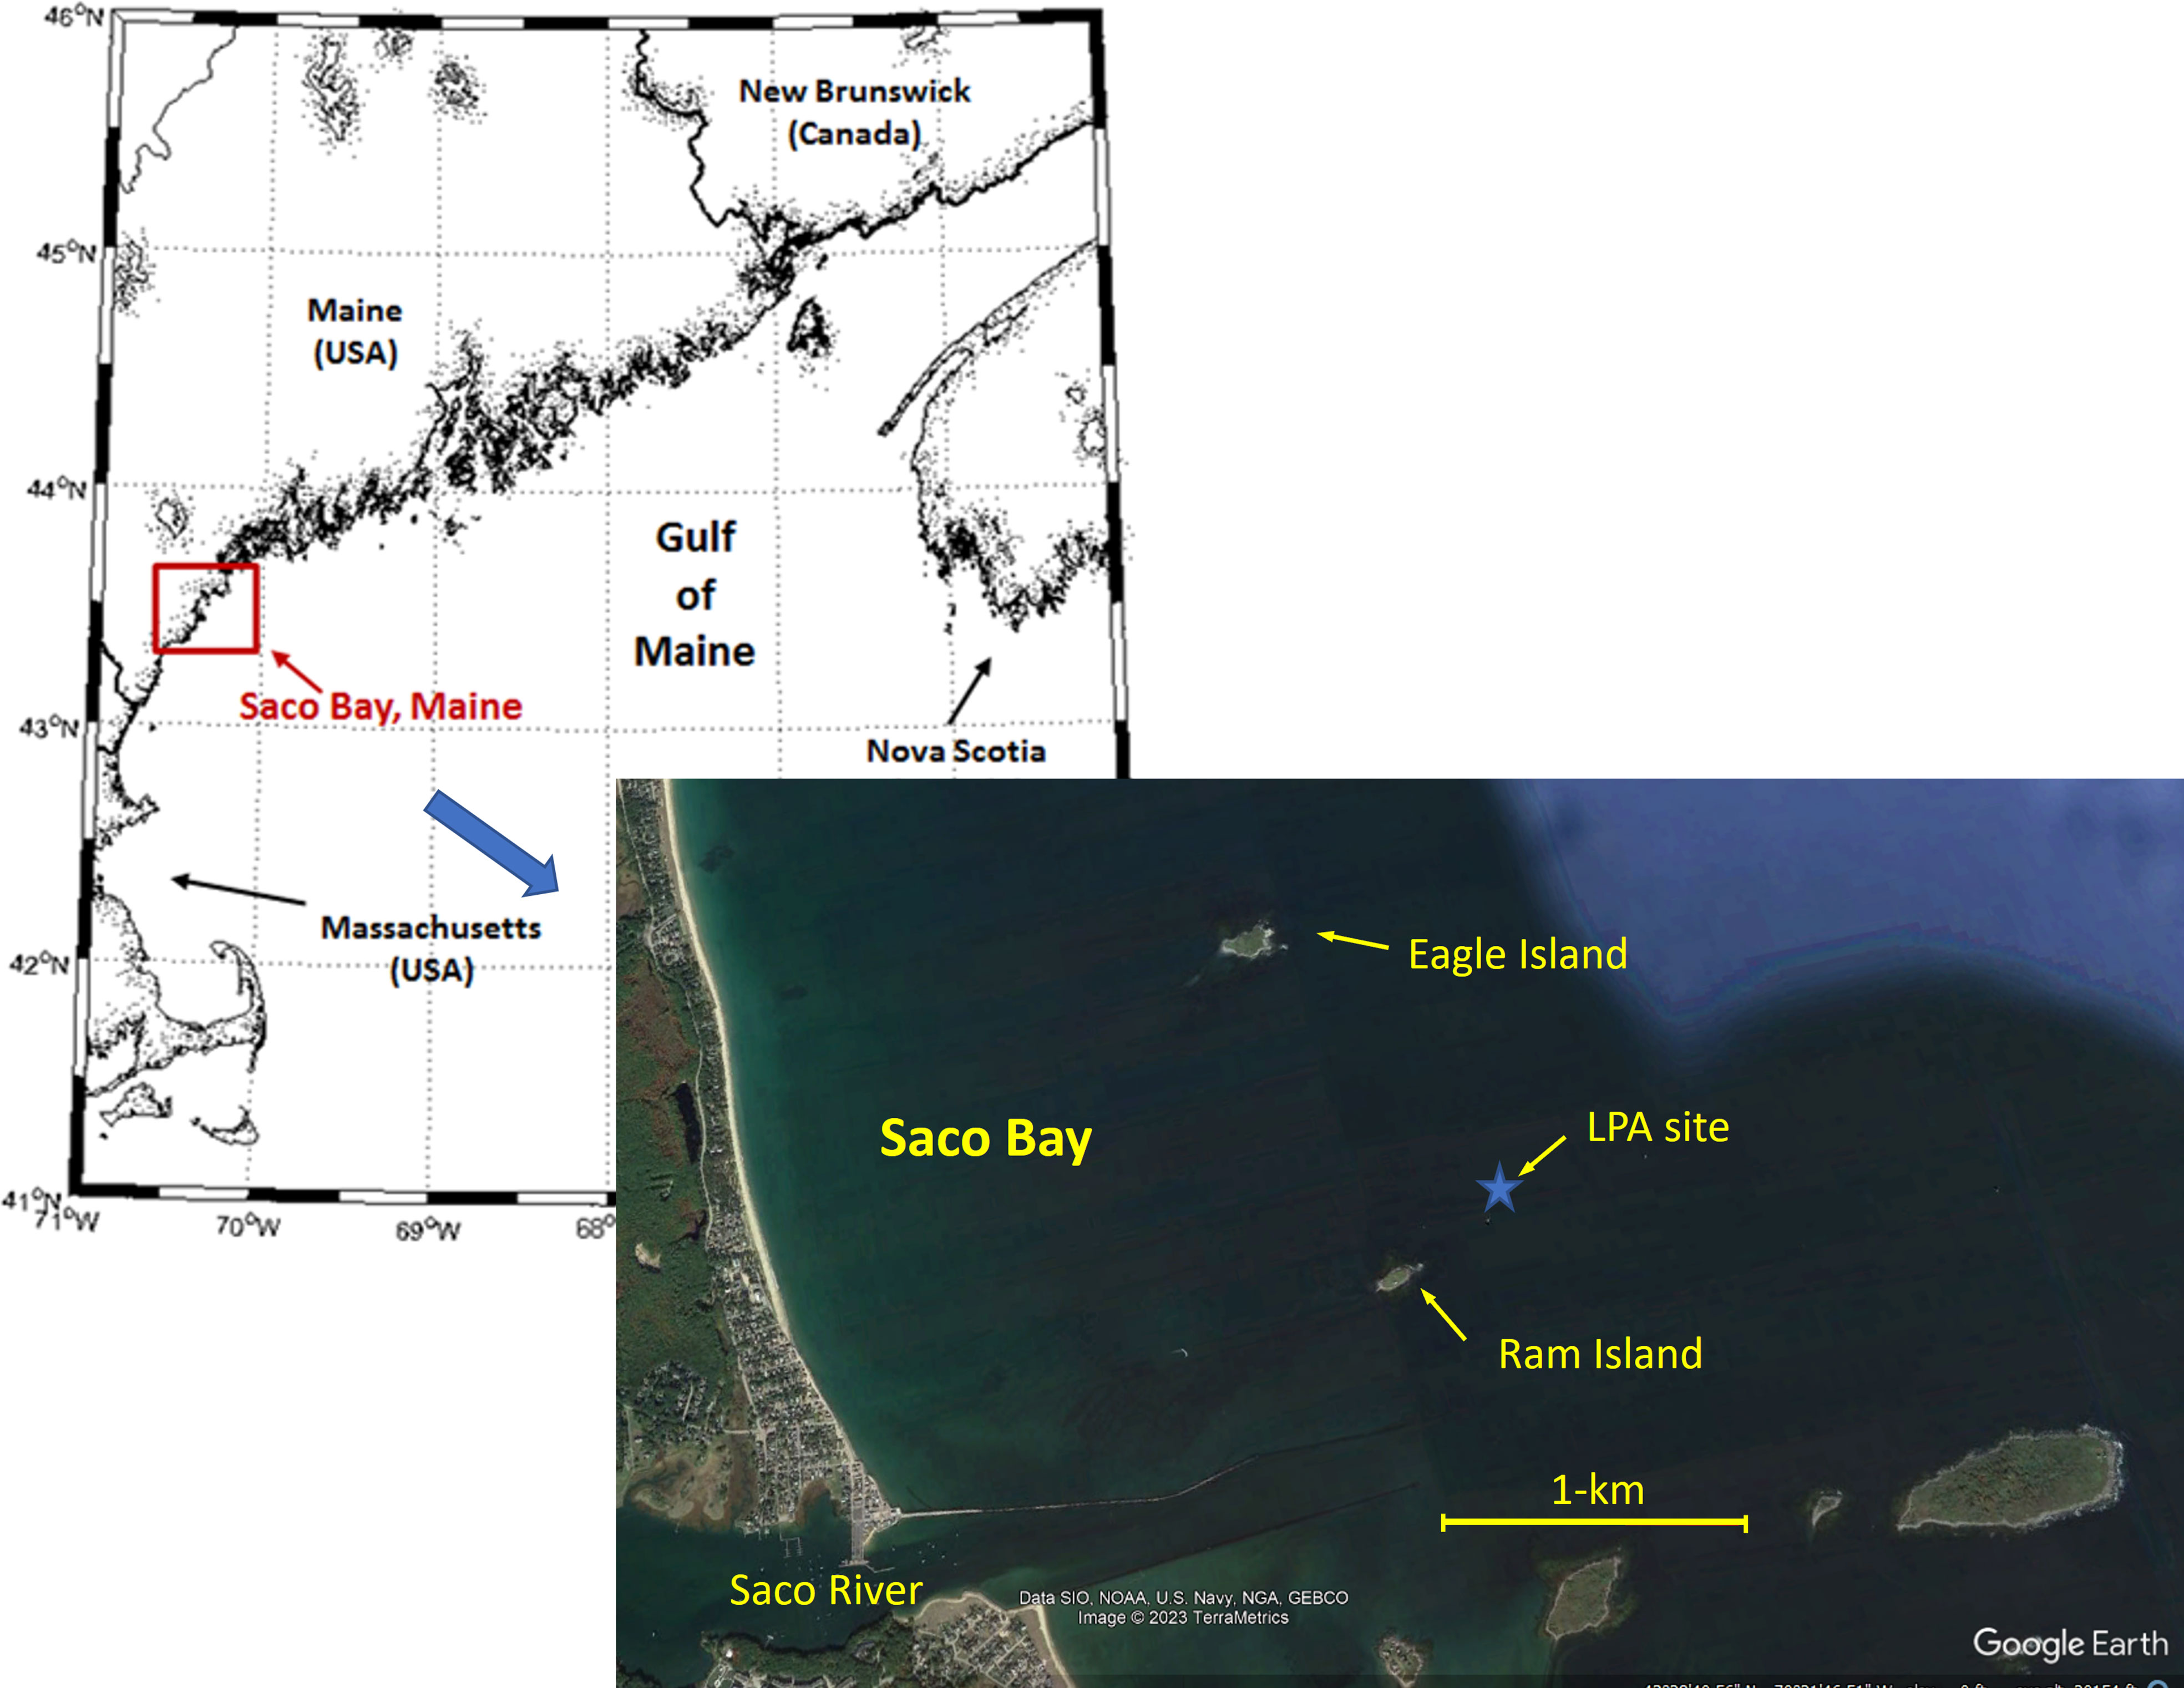
Figure 1 The kelp farm site in Saco Bay, ME was exposed to storms coming from the east. Access to the site was about 3.5 km from a pier in the Saco River (Google Earth Pro 7.3.6.9345, 2022).
As described in St-Gelais et al. (2022), the mooring system designed for the LPA site was based on an extreme condition that occurred in April 2007, called the Patriot’s Day storm. Offshore wave characteristics of the storm were obtained at station 44007 operated by the National Data Buoy Center (NDBC) with a maximum zero-order moment wave height (Hm0) value equal to equal to 9.64 m with a dominant period of 11.43 s. Even though station 44007 is located approximately 19 km from the LPA site in a depth of 49 m, return period analysis was performed using 35 years of 44007 historical datasets to characterize storm severity. The analysis applied the annual maxima method (for every month) with a Weibull distribution and least squares fitting as described in Goda (2010). This produced an offshore 50-year storm condition with waves having an Hm0 equal to 9.51 m.
To relate offshore conditions to the nearshore LPA site, wave hindcast simulations from Zou and Xie (2016) were examined for the same Patriot’s Day storm that included the LPA site within the computational domain. The dataset yielded an Hm0 value approximately 4.5 m with peak periods on the order of 11 s. We used these parameters to develop our nominal 50-year storm wave condition for the design of the kelp farm. The design condition also included an estimated 50-year current equal to 0.56 m s−1. This value was based on a set of ADCP measurements obtained at the site from 2018 that yielded a major axis tidal current (M2) in an east–west orientation equal to 0.3 m s−1. This value was multiplied by a factor 1.85 according to the Norwegian Standard NS 9415. The design condition assumed both waves and current coming from the east as a potential worst-case orientation.
2.2 Kelp growth at the Saco Bay site
During the 2018–2019 growing season, kelp was seeded on October 30, 2018, on the 122 m horizontal cultivation line secured to the pretensioned mooring system deployed on the same day. The seed slowly grew over the following months. Accelerated growth occurred in March and April before being harvested in May. During this time, biomass samples were taken from the eastern, middle, and western sections of the farm throughout the growing season. Each sample consisted of 0.5 meter of biomass from the cultivation line with holdfasts included. The number of blades were recorded along with individual length and width values. The width was measured at 3 locations along the blade. The samples were weighed at sea while suspended out of the water using a spring scale. Logistic growth curves were fitted to the time series of biomass per meter using the curve-fitting methodology described in St-Gelais et al. (2022). While St-Gelais et al. (2022) was focused on biomass for harvest and thus fit a single time series to the total biomass, the present analysis focused on quantifying biomass on the farm while the instrumentation was deployed, including the distribution of the biomass within the farm. Therefore, a separate logistic fit was applied for each of the three locations, and a composite average was derived.
2.3 Engineering instrumentation and deployment strategy
The strategy for deploying instrumentation was to measure mooring line tension in response to waves and currents from spring storm events to coincide with near harvest levels of biomass. Mooring tension measurements were obtained with two custom made load cells with data acquisition systems designed for submersible applications. The submersible load cell, data logger, and power supply components were mounted as an assembly to a stainless steel strongback that was shackled in line with each of the moorings, one of which is shown on Figure 2A. Inline tensions were measured with a pancake type load cell attached with a spacer to the flange of the strongback. A custom threaded eye was inserted through the center of the load cell to engage the instrument upon loading. The spacer was needed to allow the attachment of a thin bolt and cotter pin securing the eye to the load cell. Small gaps were maintained on either side of the spacer with washers to allow some water exchange to prevent crevice corrosion. The pancake load cell shown in Figure 2A was specified with a capacity of 8.9 kN with the strongback having a limit of 35.6 kN. The data logger and power supply were developed as part of a series of ocean observatories described in Comeau et al. (2007). For this application, the data logger was modified with two analog ports for load cell input with 16-bit, analog to digital conversion. The assembly weighed about 222 N. To make it neutrally buoyant, lobster floats were attached to both sides of the data logger above the heavier battery pack. The 8.9 kN load cell system was deployed on the west mooring line (landside) since it was not expected to carry the primary load of exposure. A similar load cell system was deployed on the east mooring line (oceanside), but with a higher capacity of 44.4 kN and a strongback designed for a load of 80 kN (Figure 2B). The higher capacity instrument was installed on the east due to expected higher exposure levels. Both load cells were set to measure for 30 minutes each hour at a rate of 4 Hz.
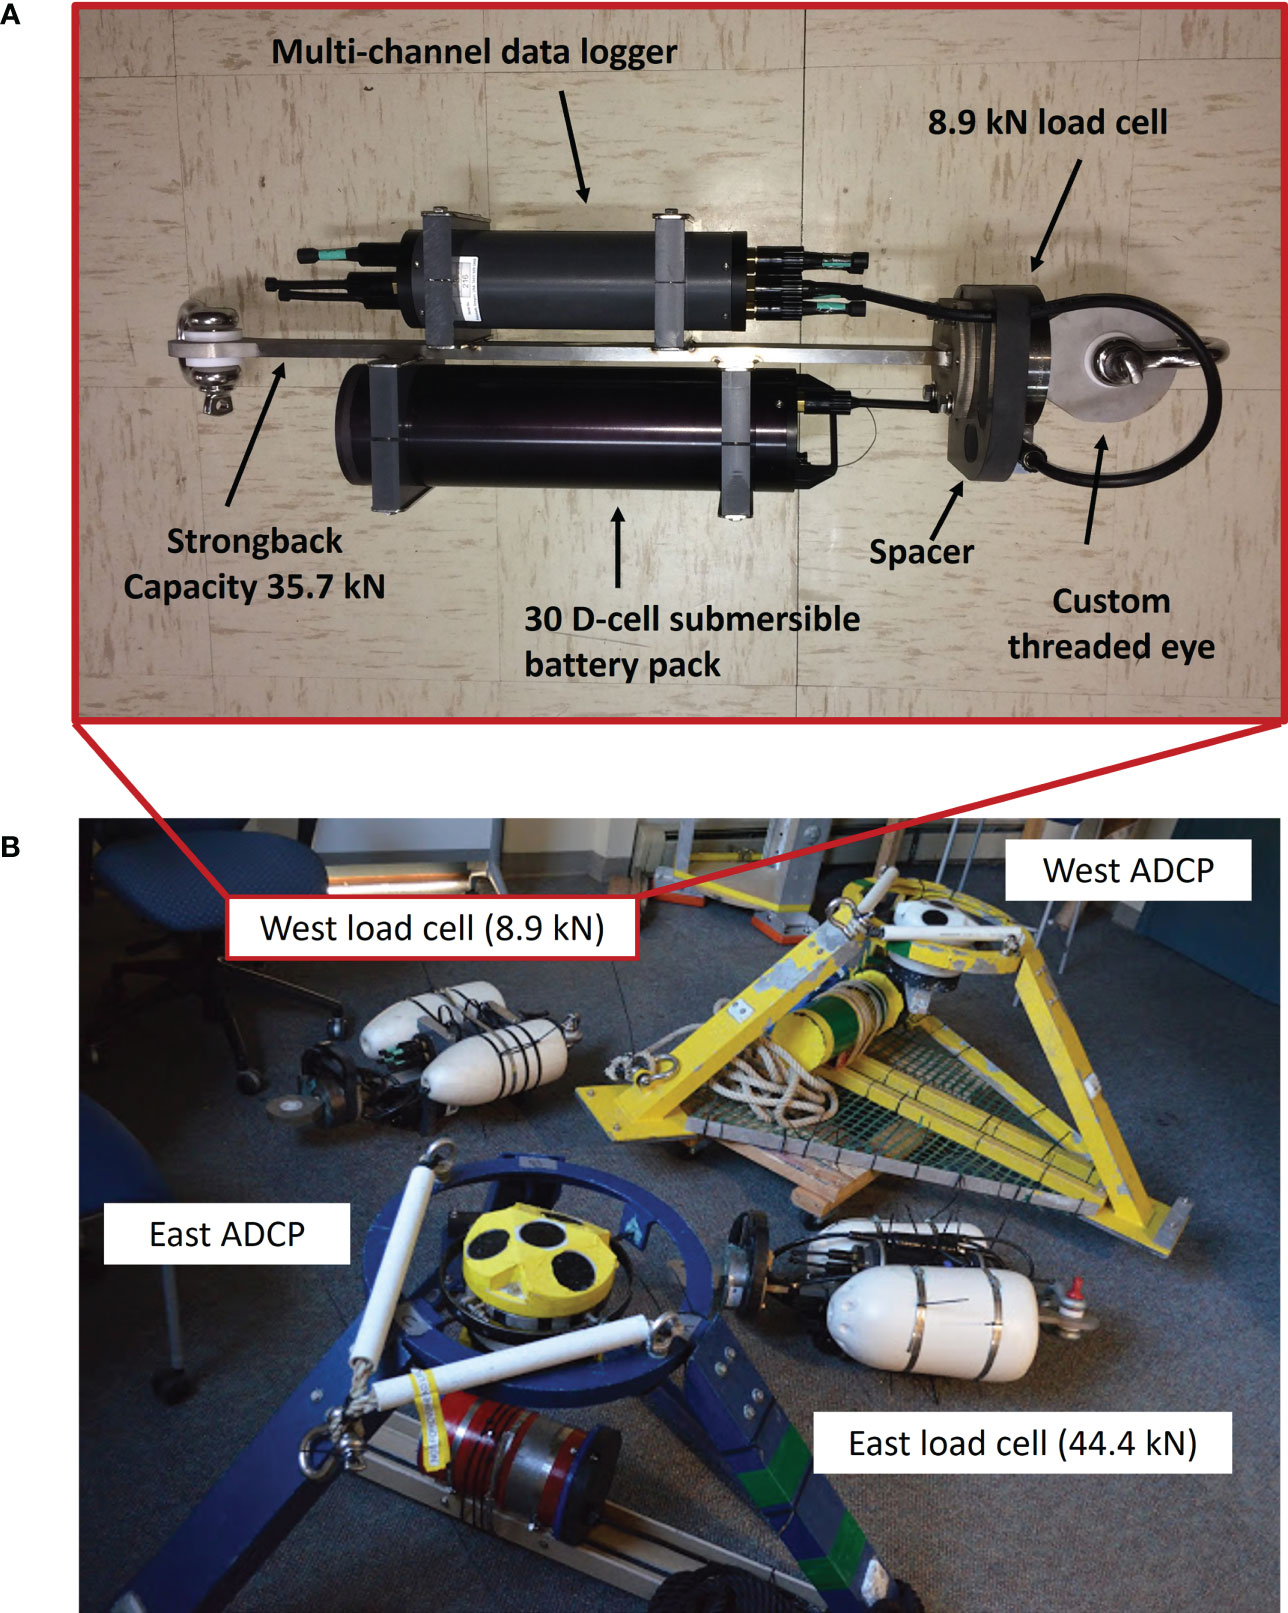
Figure 2 (A) The component details of the 8.9 kN capacity load cell instrumentation package deployed on the west mooring line. (B) Lobster floats were used to make the load cells instrumentation neutrally buoyant. The suite of instruments deployed on the kelp farm included two ADCPs and two load cell instruments.
Current profile and directional wave datasets were obtained with two, 1 MHz ADCPs manufactured by Nortek (Figure 2B). The load cell and ADCP deployment positions, with respect to the kelp farm, are shown in Figure 3, and were deployed from April 24 to May 1. The ADCPs were configured to alternate between sampling velocity profiles and directional waves. East- and north-going velocities were obtained at thirty-four, 0.5 m bins above the instrument. The configuration considers the estimated depth of the water (15.2 m), height of the transducers above the bottom (0.5 m), the instrument blanking distance (0.4 m) and a 3 m tidal range. Profiles were measured every 15 min as 3 min averages (from 7 Hz sampling) from 0–3, 15–18, 30–33 and 45–48 minutes past each hour.
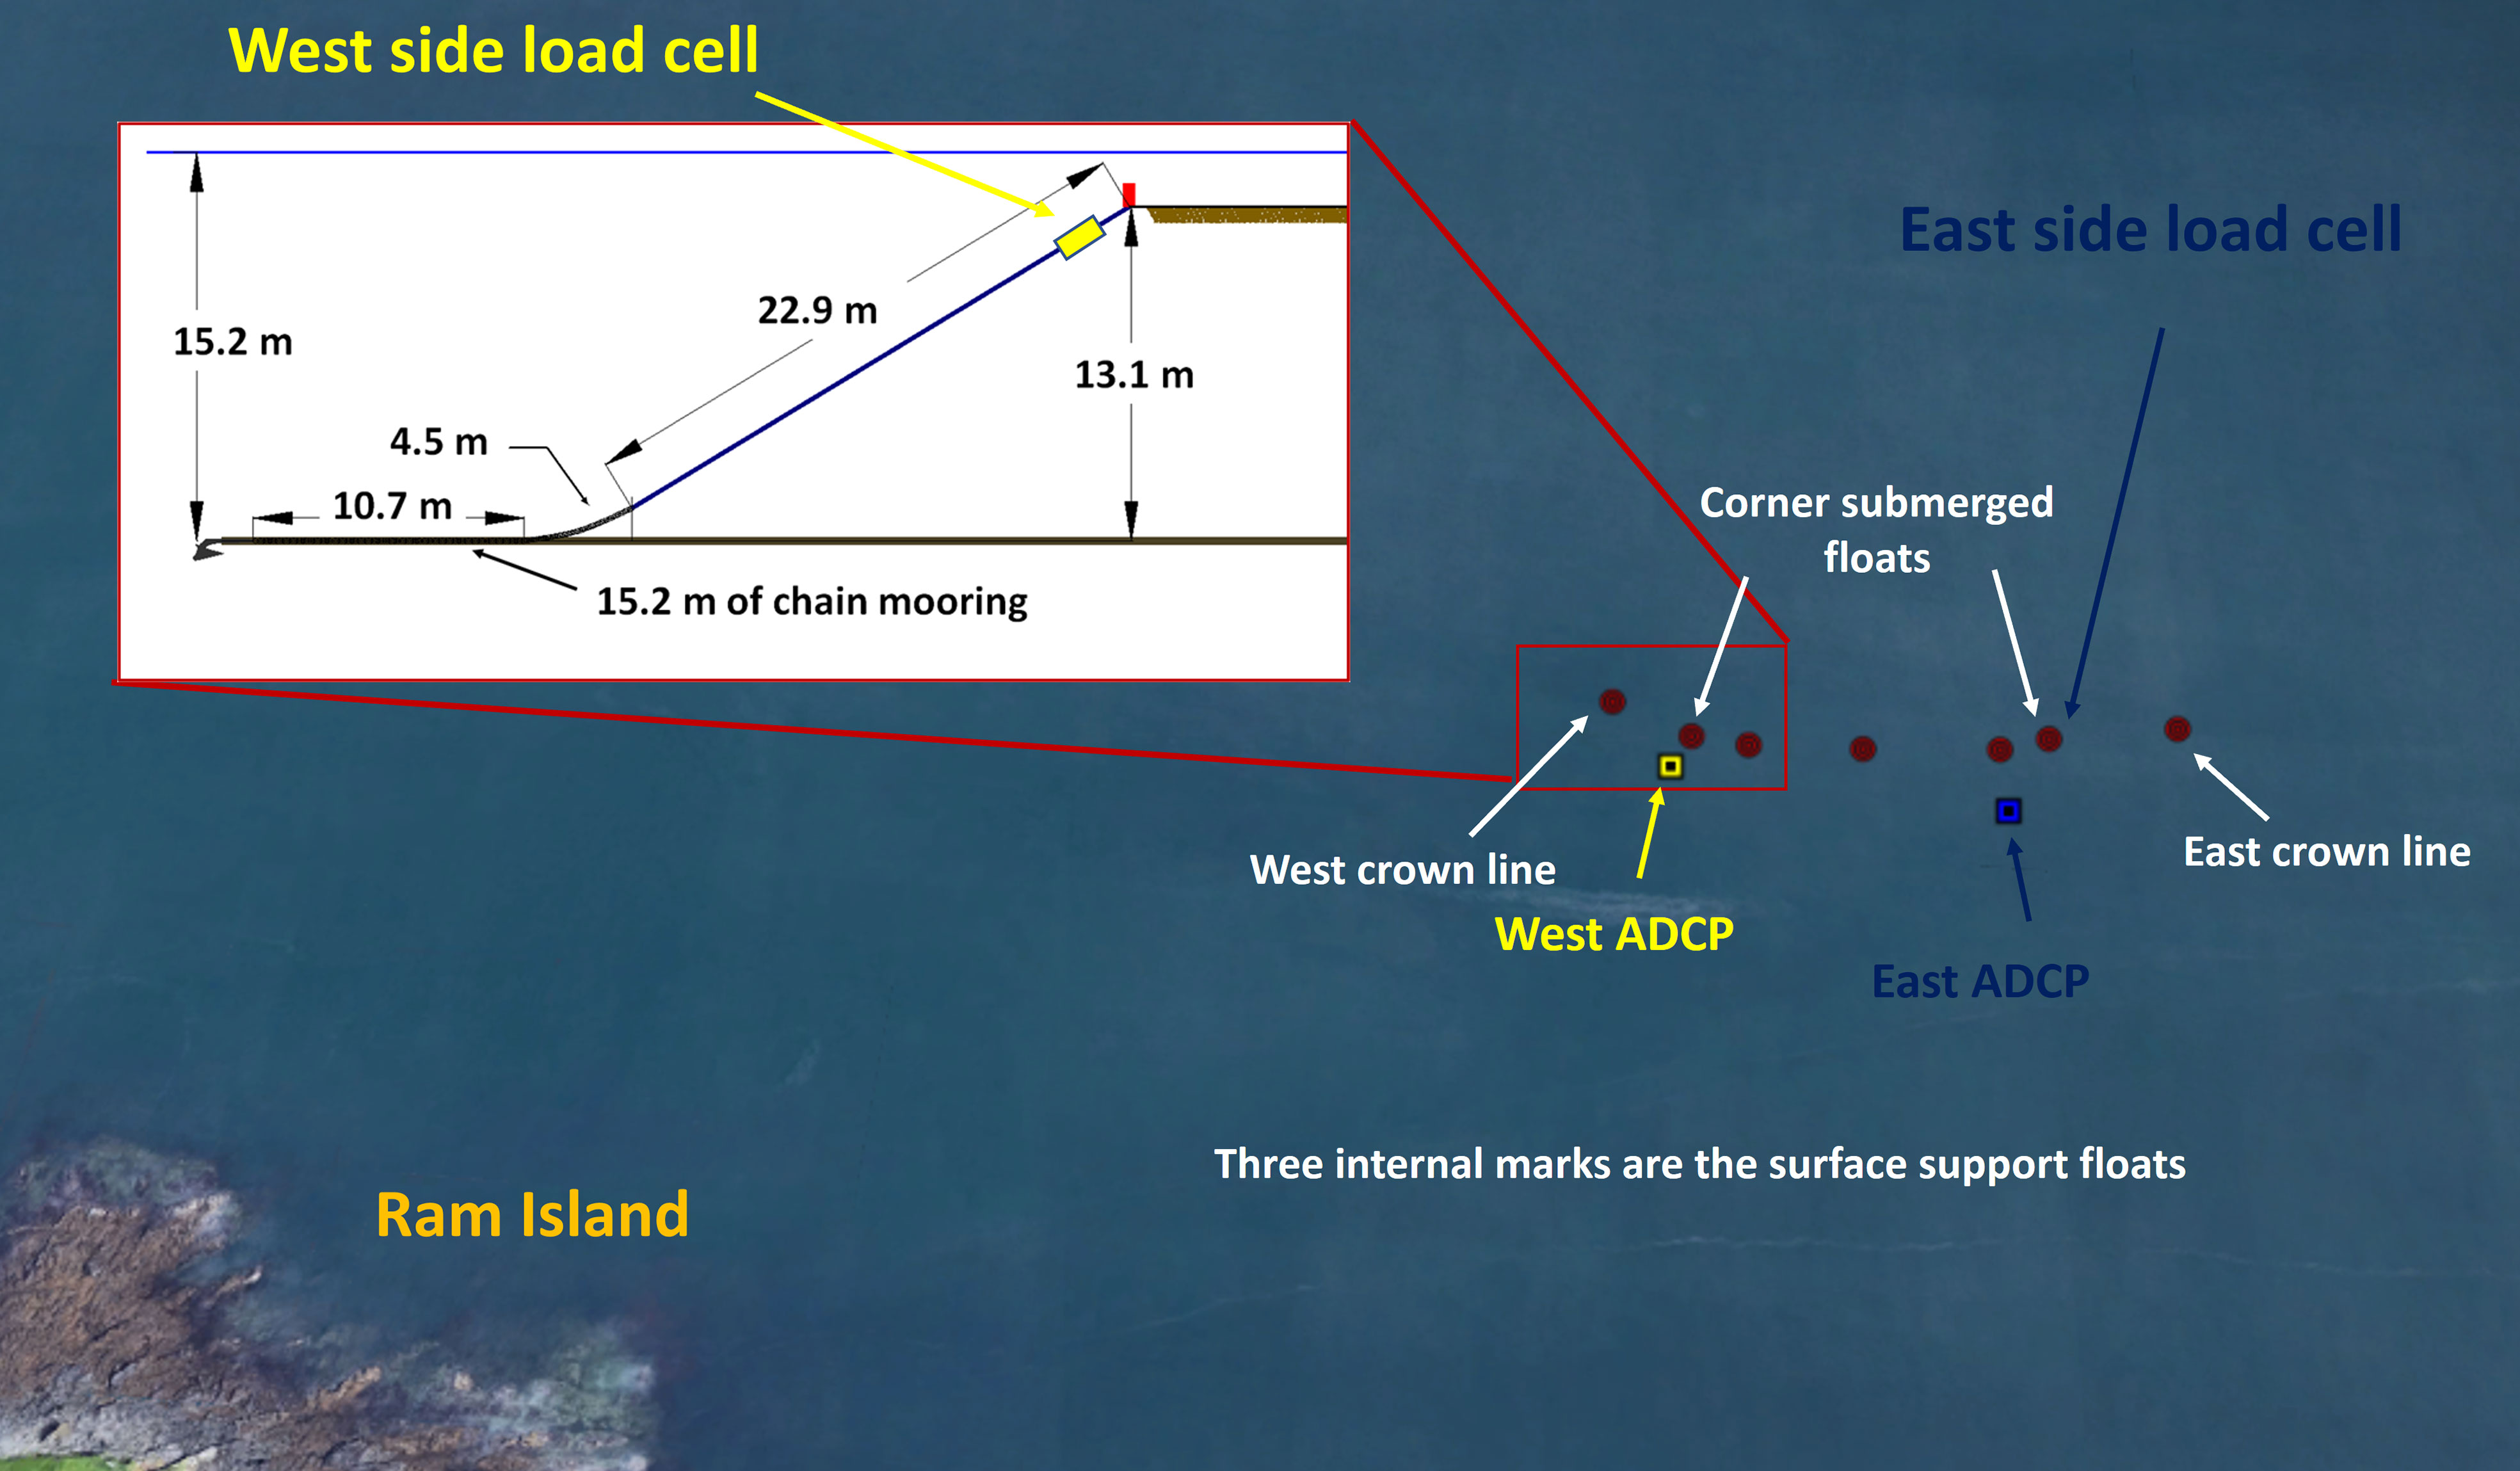
Figure 3 The spatial configuration of the kelp farm with the ADCPs and the load cells at the Saco Bay site (Google Earth, 2018).
Both east and west ADCPs were also utilized in wave measuring mode. In this mode, velocities, pressures, and acoustic surface tracking (AST) parameters were acquired in time series bursts. The time series were processed into statistical, spectral, and directional wave information (Krogstad, 1988; Pedersen et al., 2002; Pedersen and Siegel, 2008). Bursts were set to begin following each current profile measurement. Wave orbital velocities and dynamic pressures were sampled at 2 Hz for 1024 counts, while the AST data were measured at 4 Hz for 2048 counts, each for a duration of 8 min and 32 s to fit between velocity profile acquisition.
3 Results
3.1 Kelp biomass
The general kelp biomass dataset as described in St-Gelais et al. (2022) was revisited to focus on the time frame for which the instruments were deployed. Kelp biomass was assessed at three regions along the cultivation line. Samples were taken at 8 locations on the west, 7 locations on the middle and 9 locations on the east sections between February 2 and May 22 (Figure 4). We then developed logistic models of kelp biomass production (Masters and Ela, 2007) for each of the regions on the cultivation line combining them into an average. The average logistic fit is also shown in Figure 4. The resulting fit had an initial value of 0.1 kg m−1 and an environmental limit of nearly 15 kg m−1. The resulting biomass on April 25, was calculated from the data derived fit to be 7.8 kg m−1. In addition to the biomass assessment, specific samples were obtained on April 24. On this day, 5 replicate samples were acquired from east, middle, and west locations along 0.5 m sections of the cultivation line for a total of 15 bundles of kelp. An average of 175 blades were counted from each 0.5 m bundle. The length of each blade collected was measured along with the width at three locations, near the stipe, in the middle and near the tip. The average length was 0.99 m with a standard deviation of 0.32 m. The average width was 0.095 m with a standard deviation of 0.034 m.
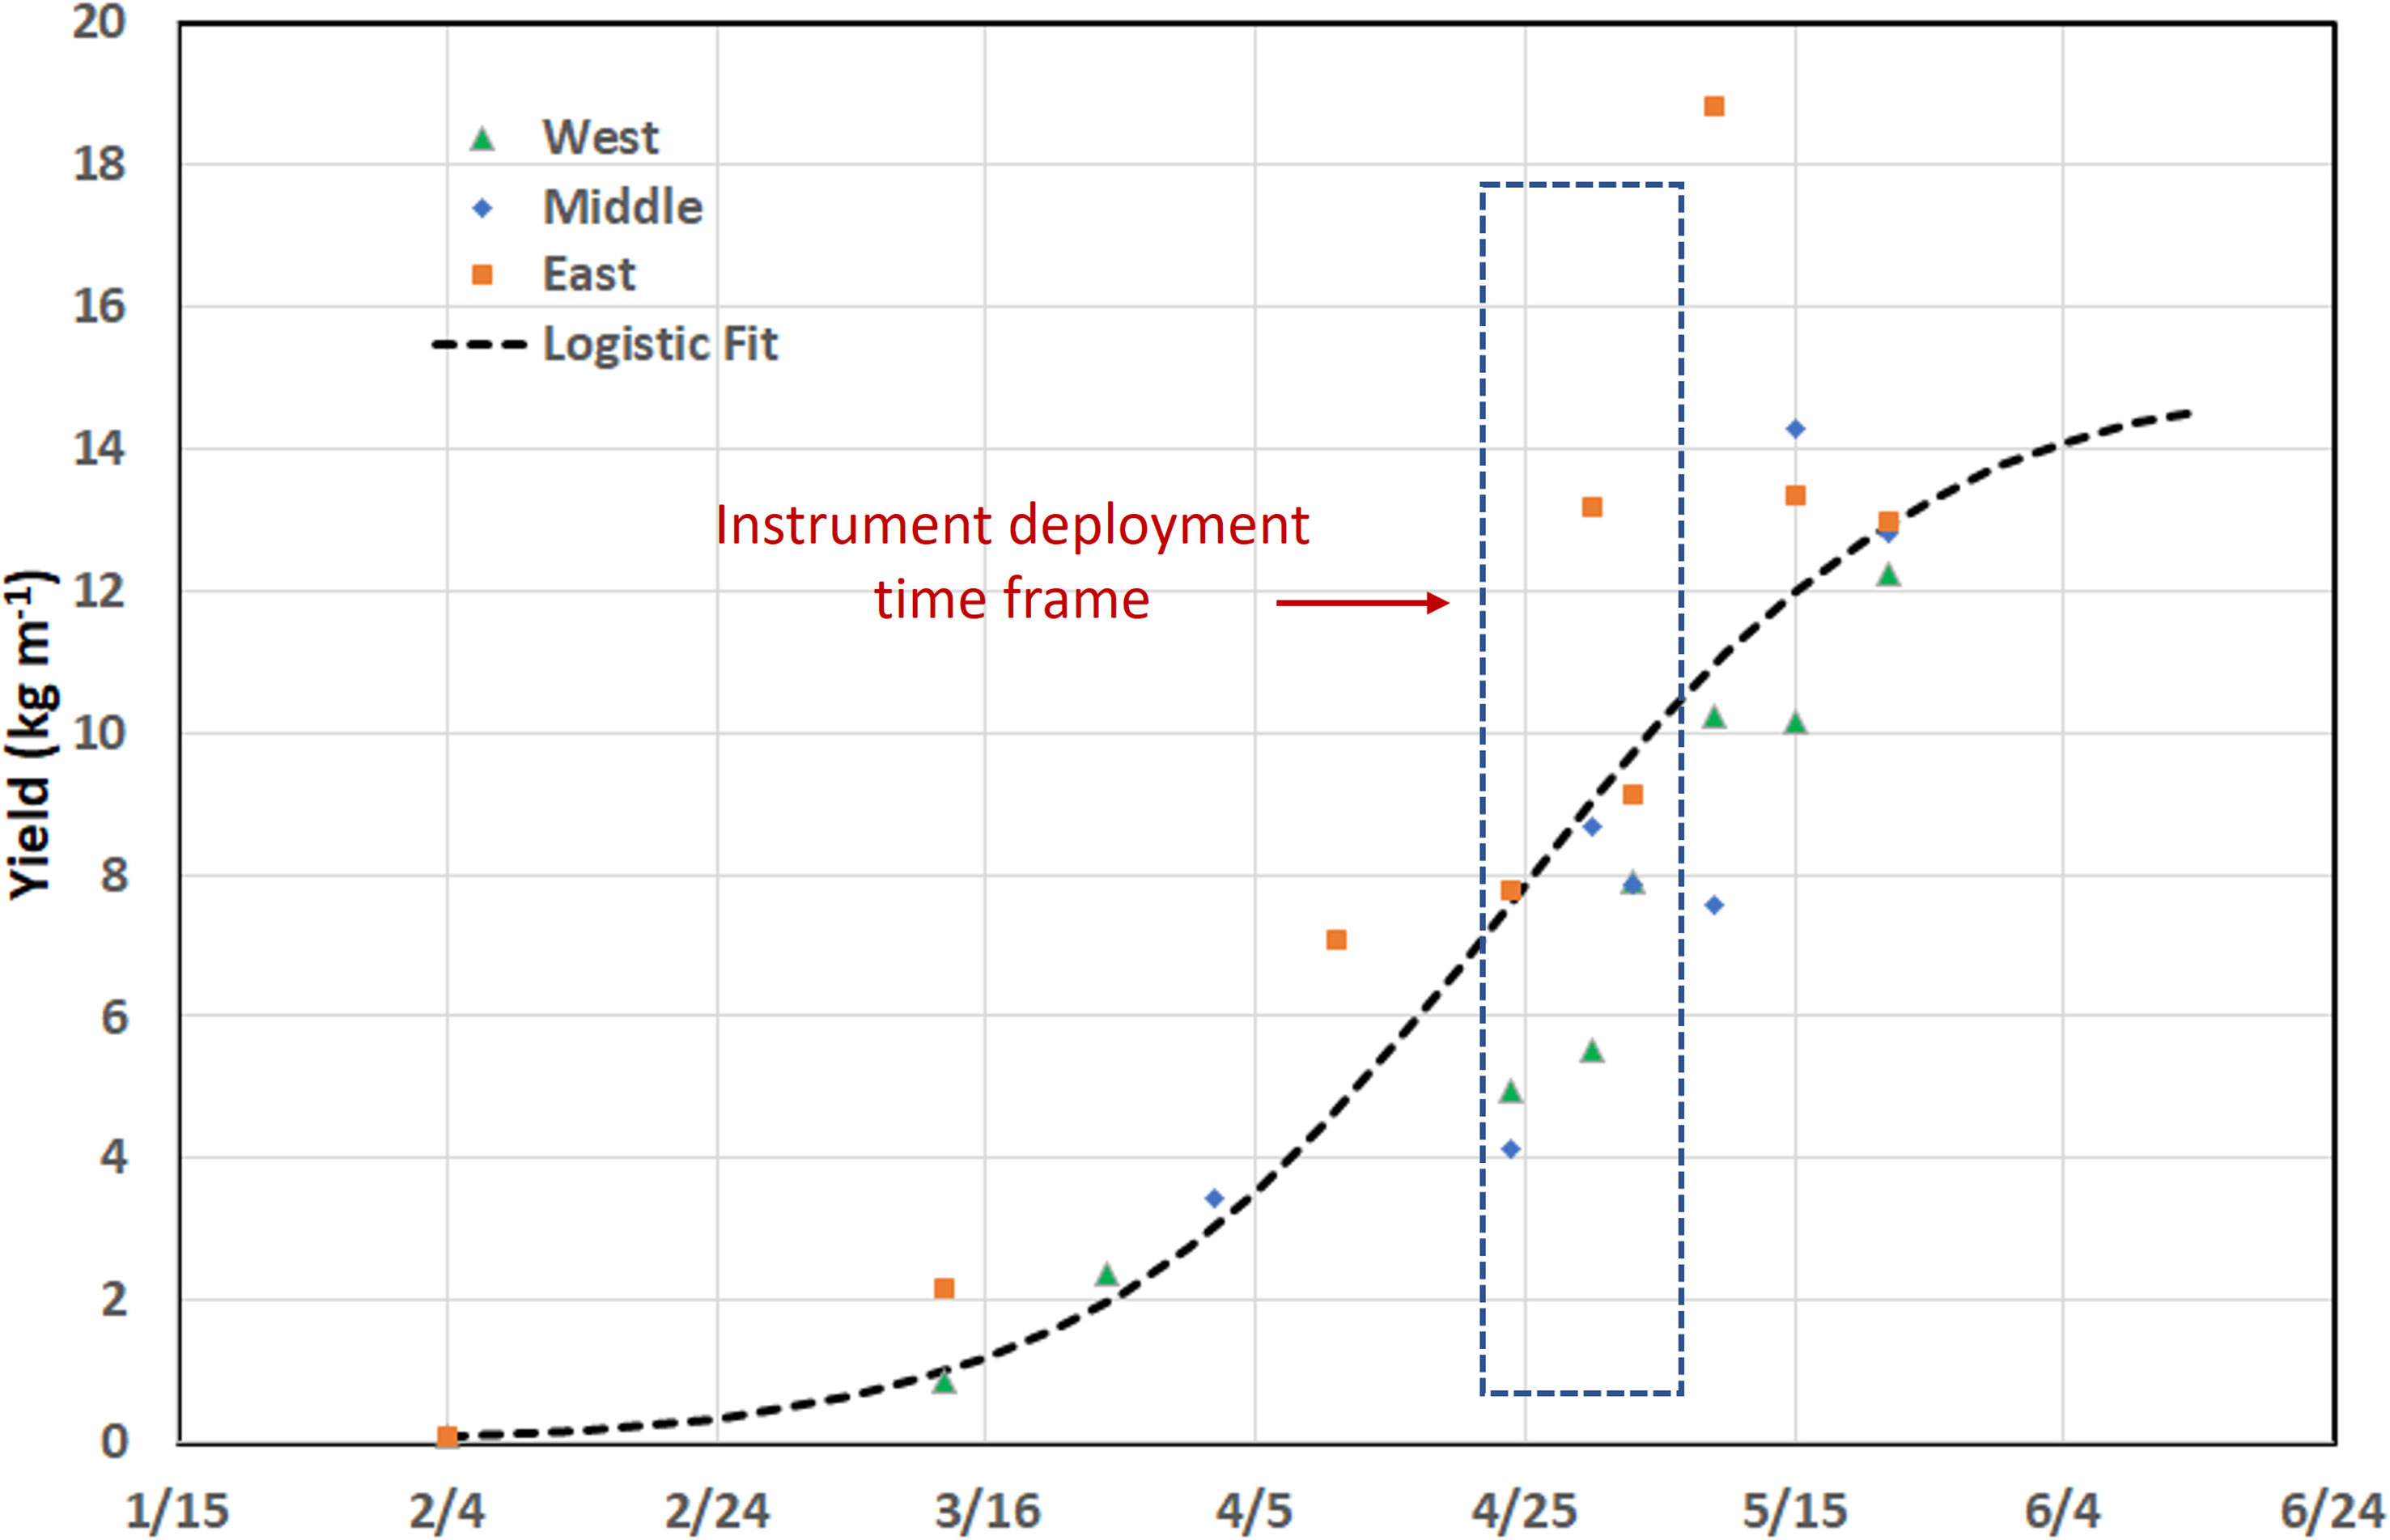
Figure 4 The measured and logistic curve fit biomass from the 2019 kelp growing season.
3.2 General dataset results
3.2.1 Mooring line tensions
Data from the east and west mooring load cells from April 25 to May 1 were first processed to remove offset values associated with a no-load condition. Zero values were recorded for 30 minutes before and after the deployment from each unit while unloaded on the deck of the vessel. The mean and ± the standard deviation values for the no-load condition are provided in Table 1. The west load cell zero values showed less variation than those from the east load cell due to capacity and amplifier design. In all cases, the offsets were within 0.6% of the total capacity of each respective unit and thus we were confident that the tension value margin of uncertainty was at most 100 N.
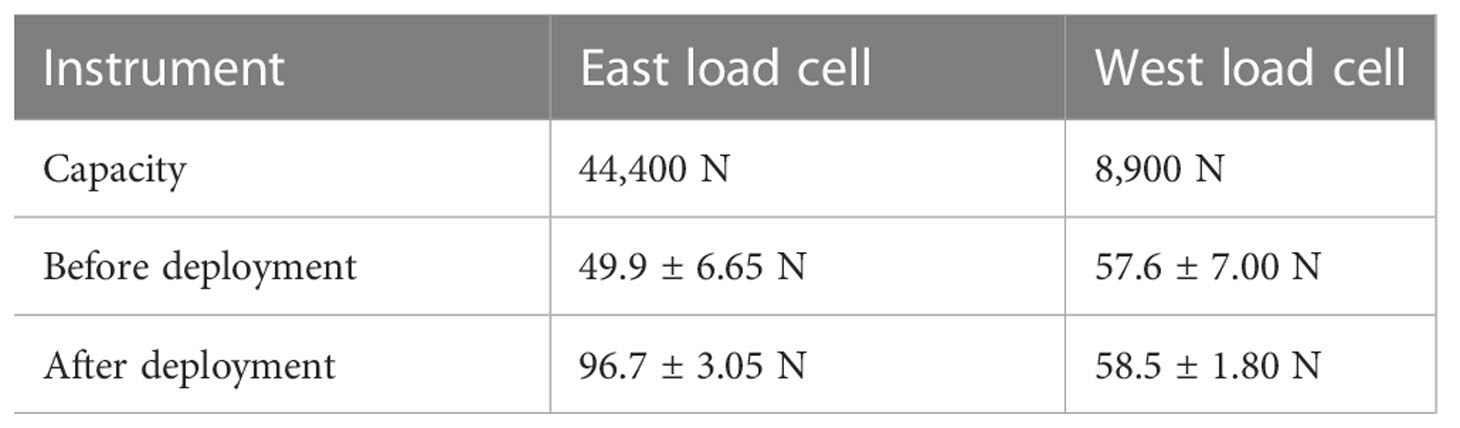
Table 1 Mean and ± standard deviation for the no load conditions for the east and west load cells.
The before and after deployment zero values were averaged, then subtracted from the deployed portion of the dataset to create a time series for each instrument (Figures 5A, B). The most prominent event occurred on the west mooring line at 1:21 UTC on April 27 with the maximum tension equal to 2843 N. The corresponding highest tension on the east mooring line during this burst was considerably less at 1515 N. Averaged over the length of the deployment, tensions on the east mooring line (628 N), however, were higher than those on the west side (482 N). The east mooring line also had more frequent events as shown by the peaks greater than the mean values. Mean values for both moorings were not much greater than the calculated static pretension (418 N) created by the submerged floats at each corner.
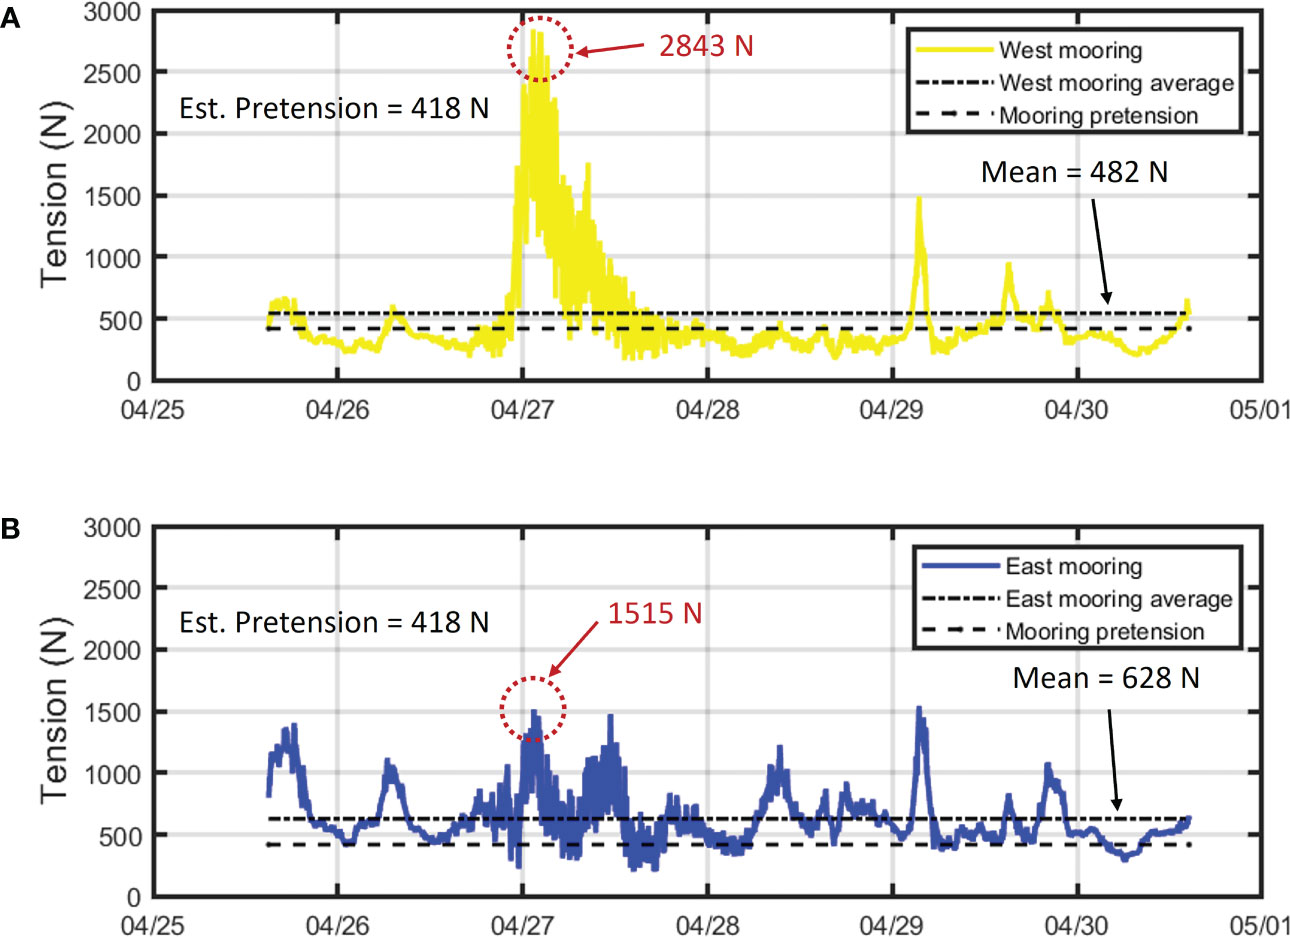
Figure 5 The tension results from the load cell deployment from April 25 to 30 for the (A) east and (B) west mooring lines. The largest tension value occurred on April 27 at 1:21 UTC on the west mooring line.
3.2.2 ADCP datasets
Water level, velocity profiles, and directional waves were measured from the east and west ADCPs deployed just south of the load cells (Figure 3). Mean sensor depth was 15.51 m on the east (seaward) and 14.72 m on the west side (landward) as shown in Figure 6A. The water level datasets also show the tides are dominated by the M2 constituent with a period of 12.42 hours with an average range of 2.2 m. Depth averaged velocity profile results are shown on Figures 6B, C for the east- and north-going components. A vertical dashed line is included on the three plots for the time of the maximum tension on the west mooring. The line corresponds with a point between the high and low water marks on (Figure 6A) indicating an ebb tidal current. The vertical dashed line also correlates with the maximum current velocity measured from both the ADCPs.
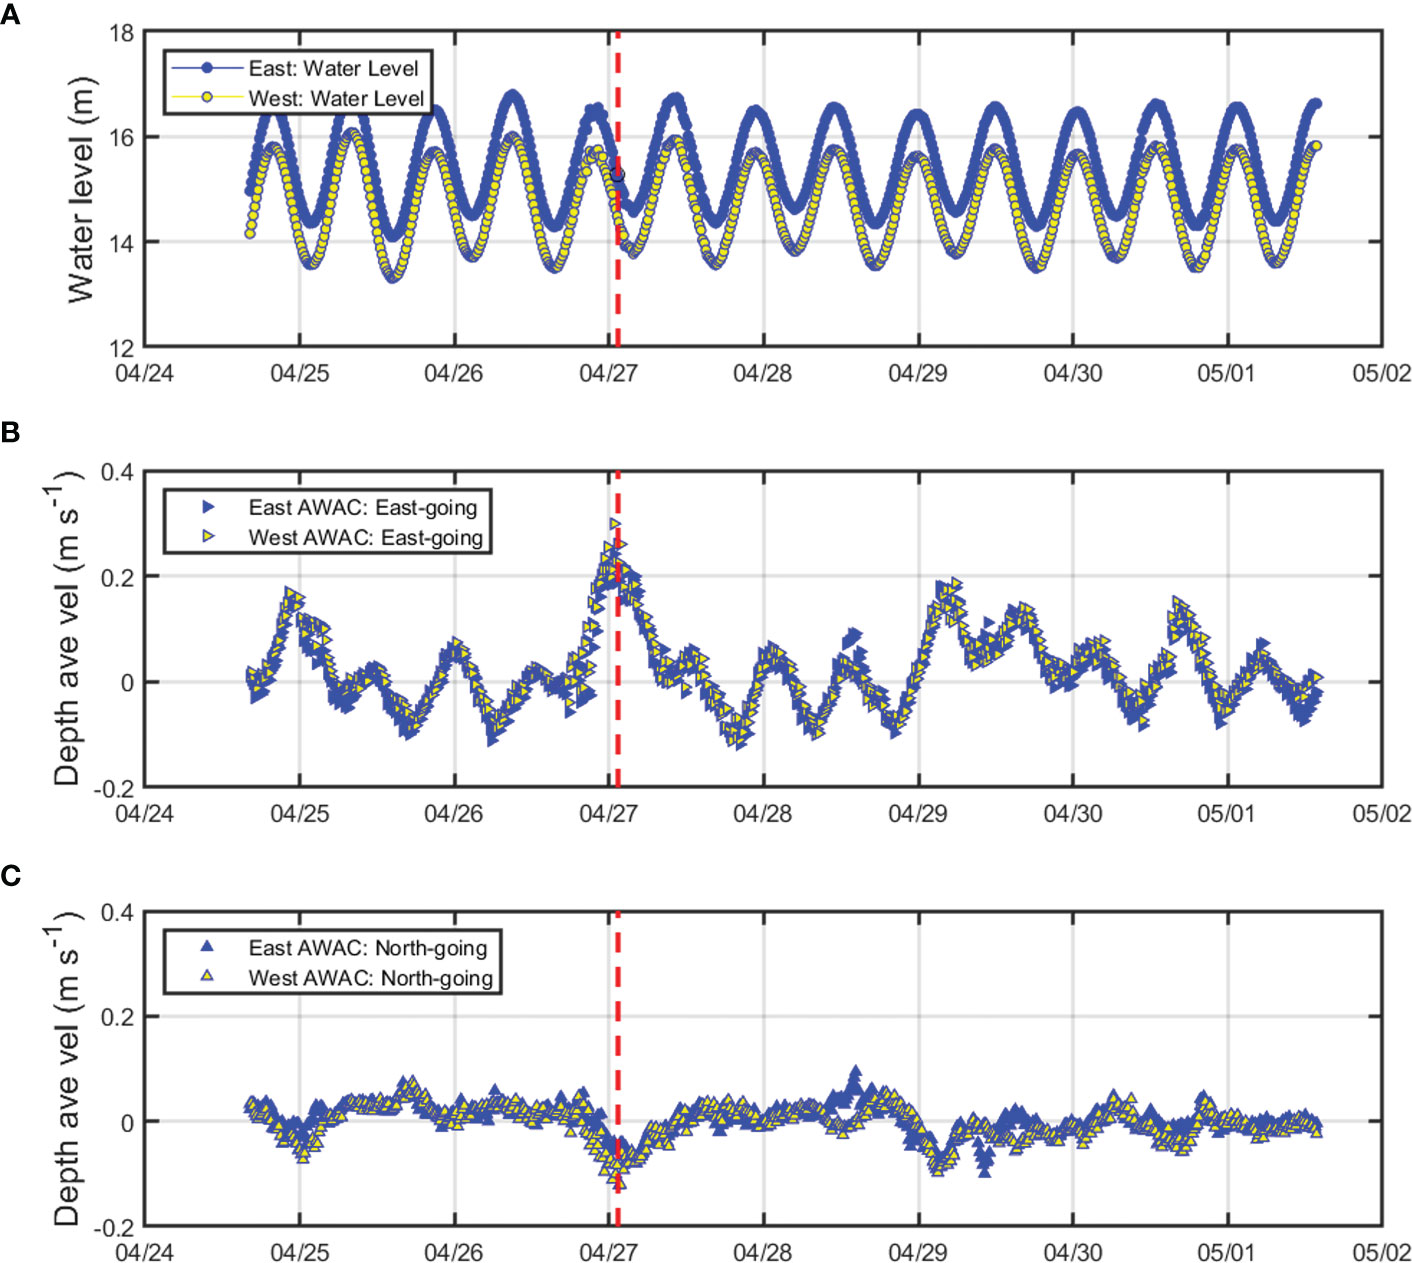
Figure 6 Datasets from the east and west ADCPs including the water levels (A), and the east- (B) and north-going (C) depth averaged velocity components for the deployment in 2019.
With the ADCPs configured to calculate 3 minute averages every 15 minutes, east and west datasets were obtained from 1:15–1:18 and 1:30–1:33, before and after the time of maximum tension at 1:21 UTC. The east- and north-going components with speed and direction are provided in Table 2 for these time periods, bracketing the maximum tension event. The speed values on the west side were greater than those on the east side. Because the prevailing currents in the region were in the ESE direction, the west ADCP was likely on the unobstructed, leading edge of the farm, with the east ADCP in the lee, with a potential reduction of velocity through the farm.
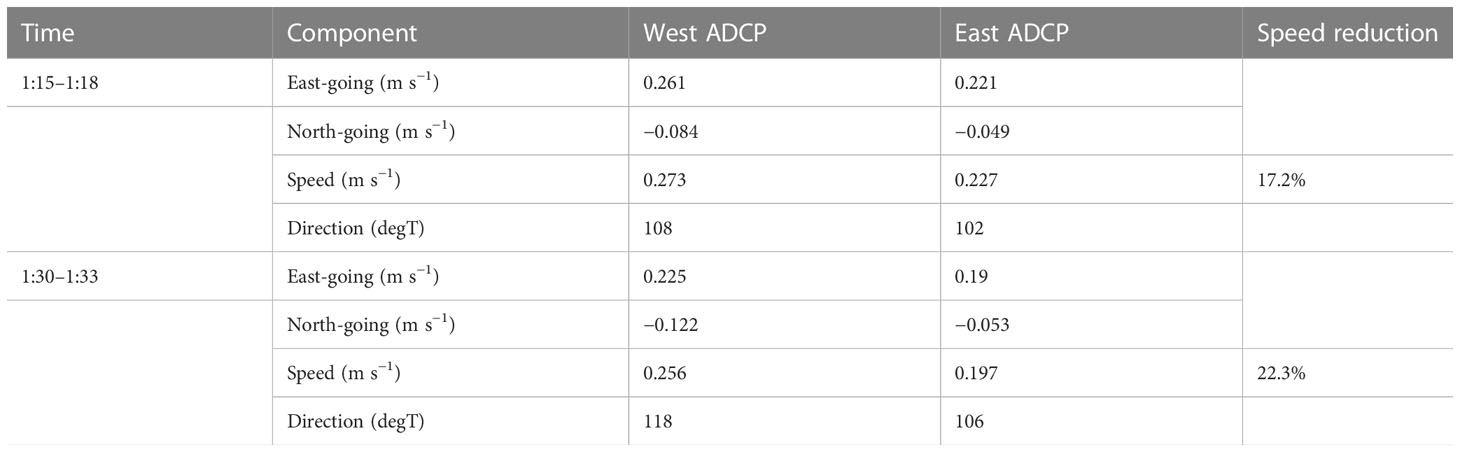
Table 2 Depth averaged velocity characteristics during the maximum tension event. Current velocity directions are described as “going-to”.
Wave AST bursts measured by the ADCPs for the April 25 to May 1 deployment were used to identify the maximum wave height (Hmax) from each instrument. The time series were also processed into a spectral energy density form. With the spectral energy density, the significant wave heights, based on the zero-order moment about the spectral curve (Hm0), were calculated and paired with the dominant period (Tp). The directions associated with the dominant period (Tp-direction) were also determined from the ADCPs by processing the wave orbital velocity components. The Hmax, Hm0, Tp and Tp-direction results from each burst are shown on Figures 7A through D, respectively. The maximum tension event occurred between 1:18:00 and 1:26:32 UTC on April 27.
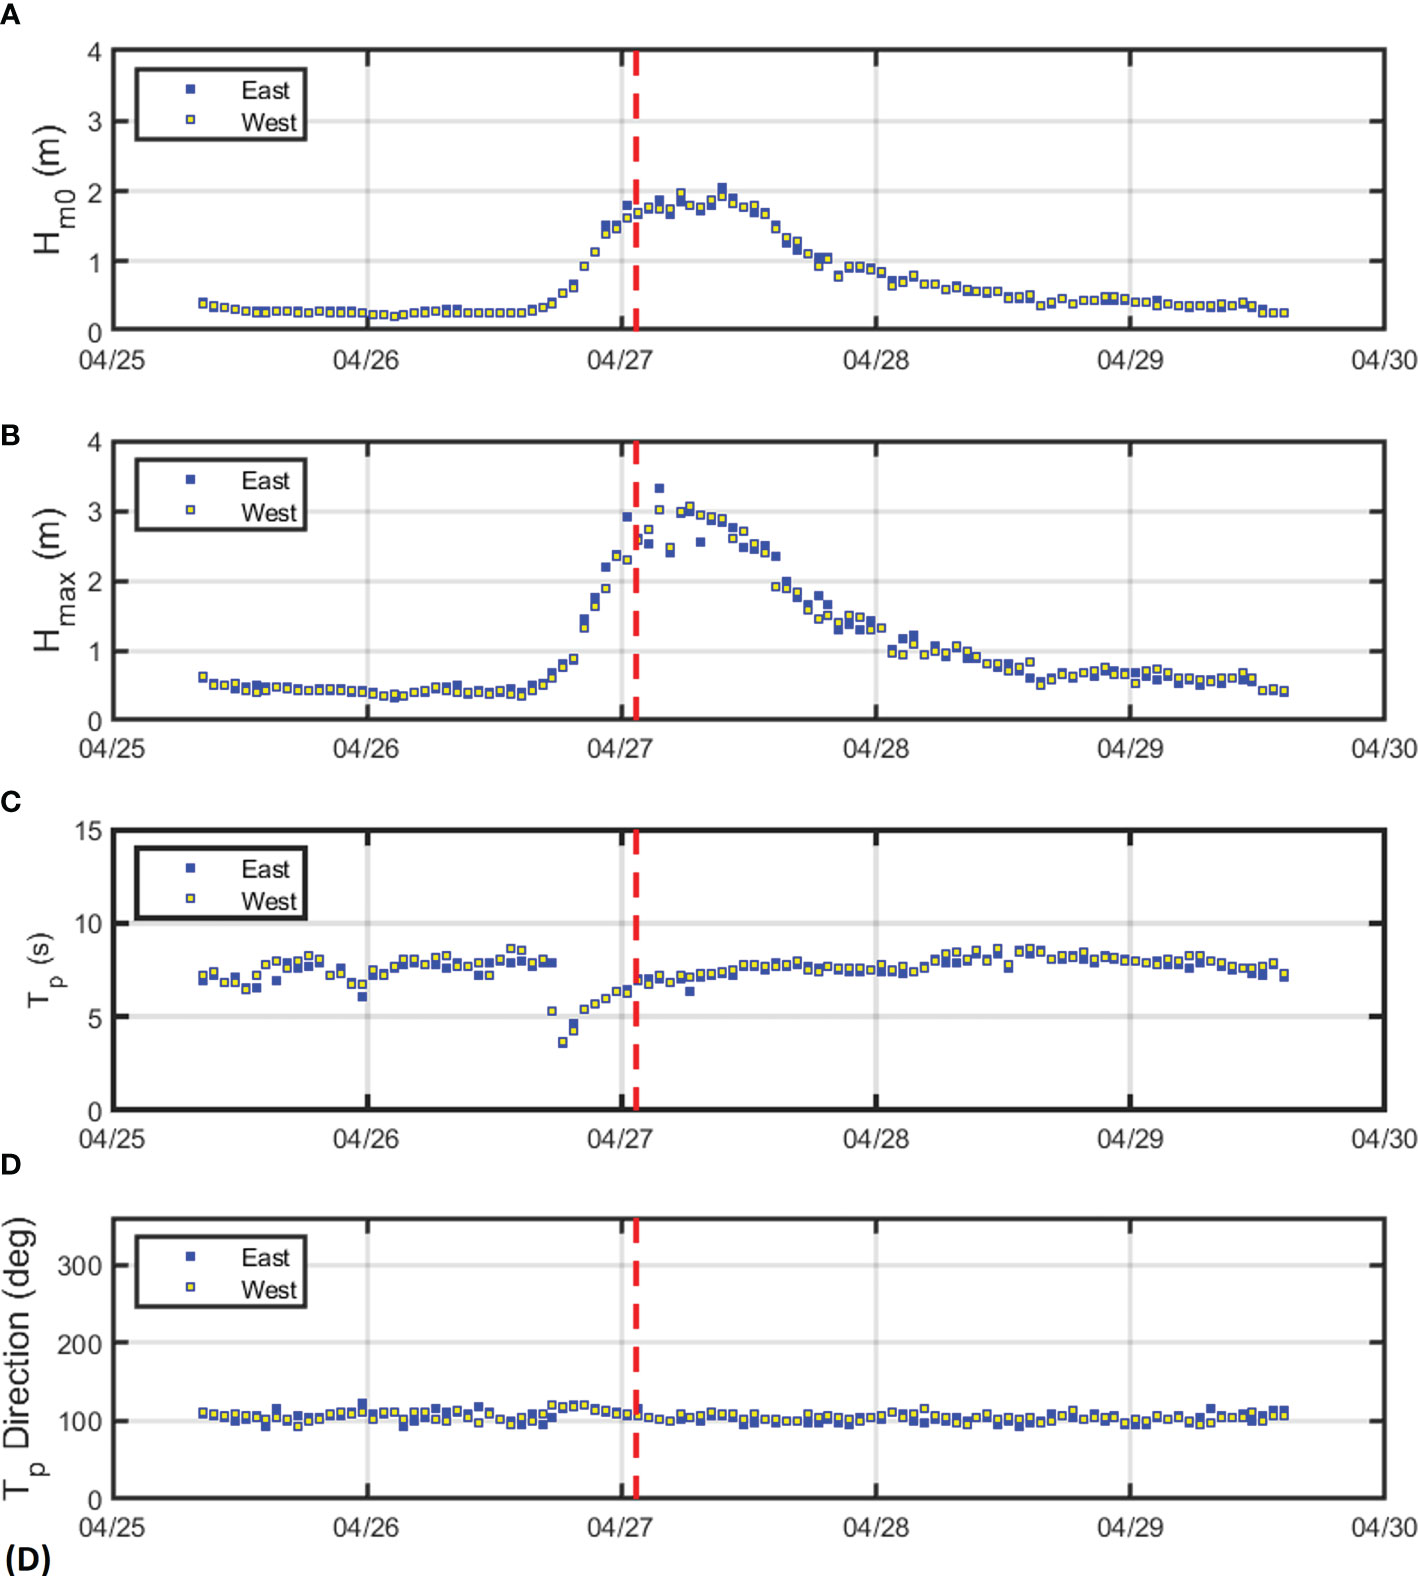
Figure 7 (A) The Hm0 values from the east and west ADCPs. (B) The Hmax values obtained with the zero-crossing method from the acoustic surface tracking (AST) datasets. (C) The Tp time series from the east and west ADCPs. (D) The direction of the Tp from the ADCPs. The vertical dashed line was included to identify the maximum tension event from the west mooring line.
4 Maximum tension load case
4.1 West and east mooring line load cells
The 30 minute burst for the maximum tension load case is shown on Figure 8A for both the west and east side instruments. In additional to the peak value of 2843 N occurring at 1:21:53, it was clear that the west mooring line was bearing more of the load than the east with higher mean and oscillatory components. The maximum tension event coincided with the AST wave bursts obtained from 1:18:00 to 1:26:32 and between two sets of ADCP velocity profiles from 1:15–1:18 and 1:30–1:33.
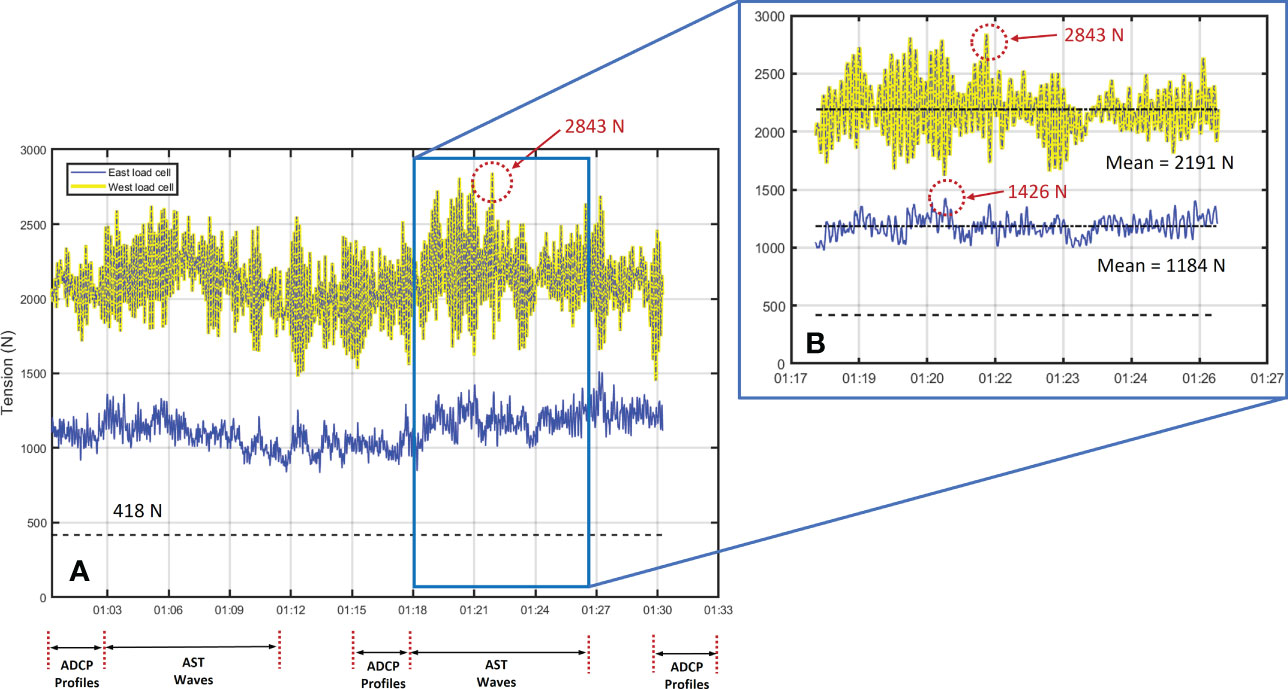
Figure 8 (A) The maximum tension occurred during the 30 minute load cell bursts obtained on April 27 at 1:21:53 on the west mooring. (B) The maximum tension value associated with the acoustic surface tracking (AST) wave burst from 1:18:00 to 1:26:32. Both mooring tension time series showed a clear wave component, though the signal was stronger on the west.
Maximum, mean and standard deviation calculations were performed for both the west and east load cells from the section of tension data on Figure 8B. The results are provided in Table 3 with the static pretension. A value of significant tension (Ts) was then calculated as four times the standard deviation and is also included in Table 3. Ts can be interpreted as a measure of wave influence, comparable to the Hm0 of the waves during this burst. The basic statistics show that, for this event, the steady tension values induced by fluid drag and characterized by the mean have more influence on the kelp farm structure than the oscillatory components.
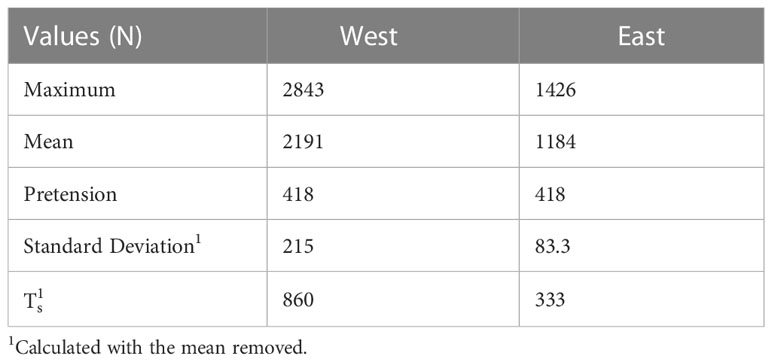
Table 3 Load cell statistics for the west and east mooring lines from 1:18 to 1:26:32.
4.2 West and east ADCP velocity profiles
To further investigate the depth averaged current velocity results summarized in Table 2, the 1:15–1:18 and 1:30–1:33 profiles from each ADCP were examined as a function of 0.5 m depth bins (Figures 9A, B). The profile results show small differences over time within each site. However, when comparing the spatial results, a distinct velocity reduction was evident between 2 and 6 m at the east ADCP in the lee of the farm. At these bin locations, it seemed that the kelp induced work on the fluid to decrease average speed from 0.45 to 0.33 m s−1 (26.7%), thus creating drag on the system and contributing to the mean tension values shown in Table 3.
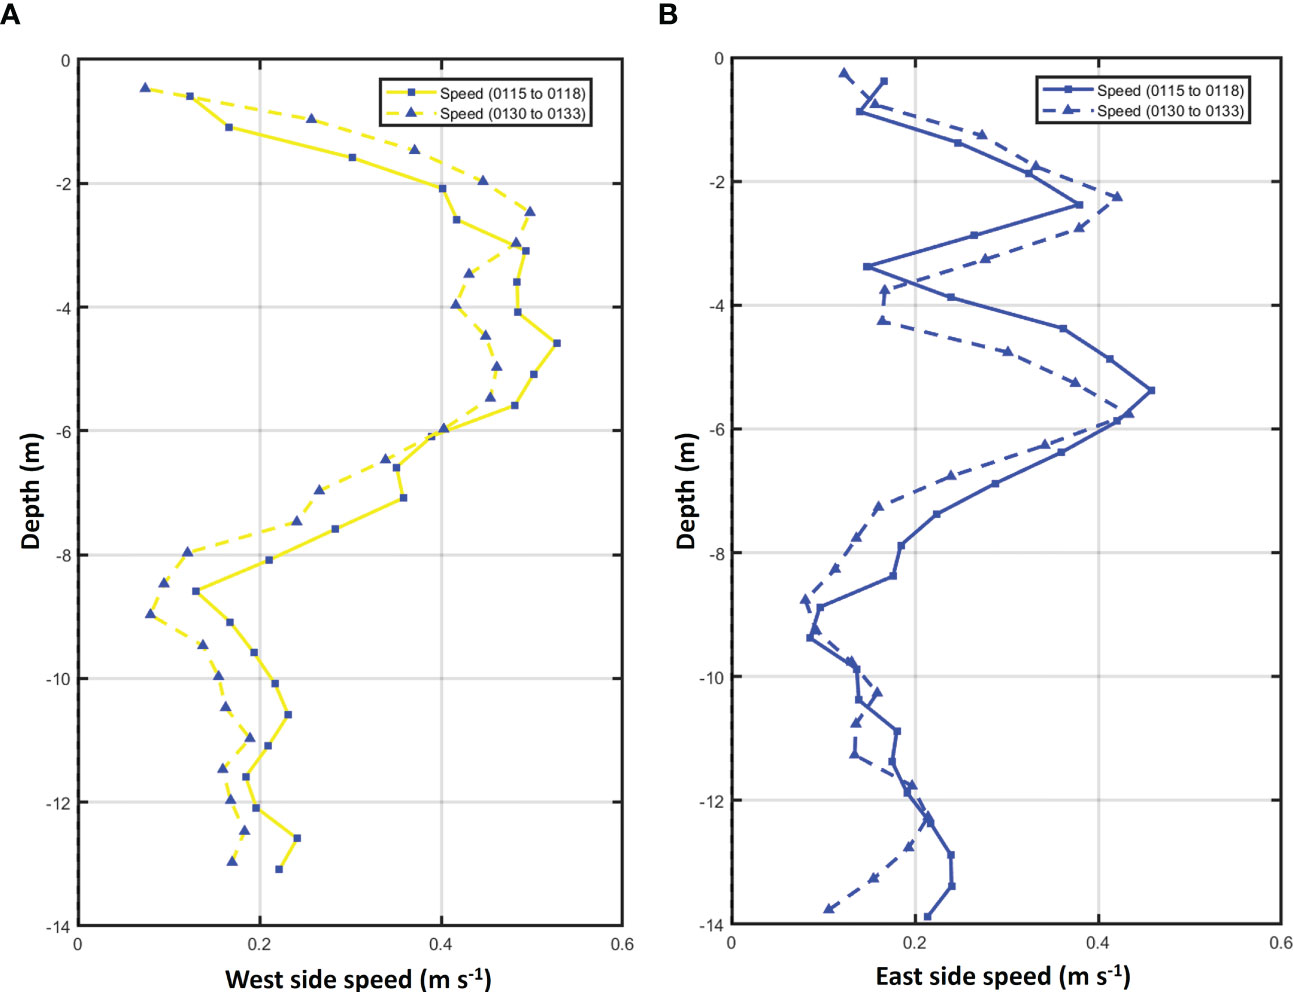
Figure 9 (A) The west side speed profile upstream of the farm from 1:15 to 1:18 and 1:30 to 1:33. (B) The east side speed profile in the lee of the farm from 01:15 to 01:18 and 01:30 to 01:33.
4.3 West and east ADCP acoustic surface track
We also investigated if steady wave conditions existed during the maximum tension event. Three sets of AST time series, representing bursts from 1:03:00 to 1:11:32, 1:18:00 to 1:26:32 and 1:33:00 to 1:41:32, were plotted from each ADCP (Figure 10). Figure 10 shows how the load cell sampling coincided with the wave burst measurements to assess potential steady state conditions. The box on Figure 10 includes the wave bursts (1:18:00–1:26:32) that were acquired when the maximum tension value was measured at 1:21:53.
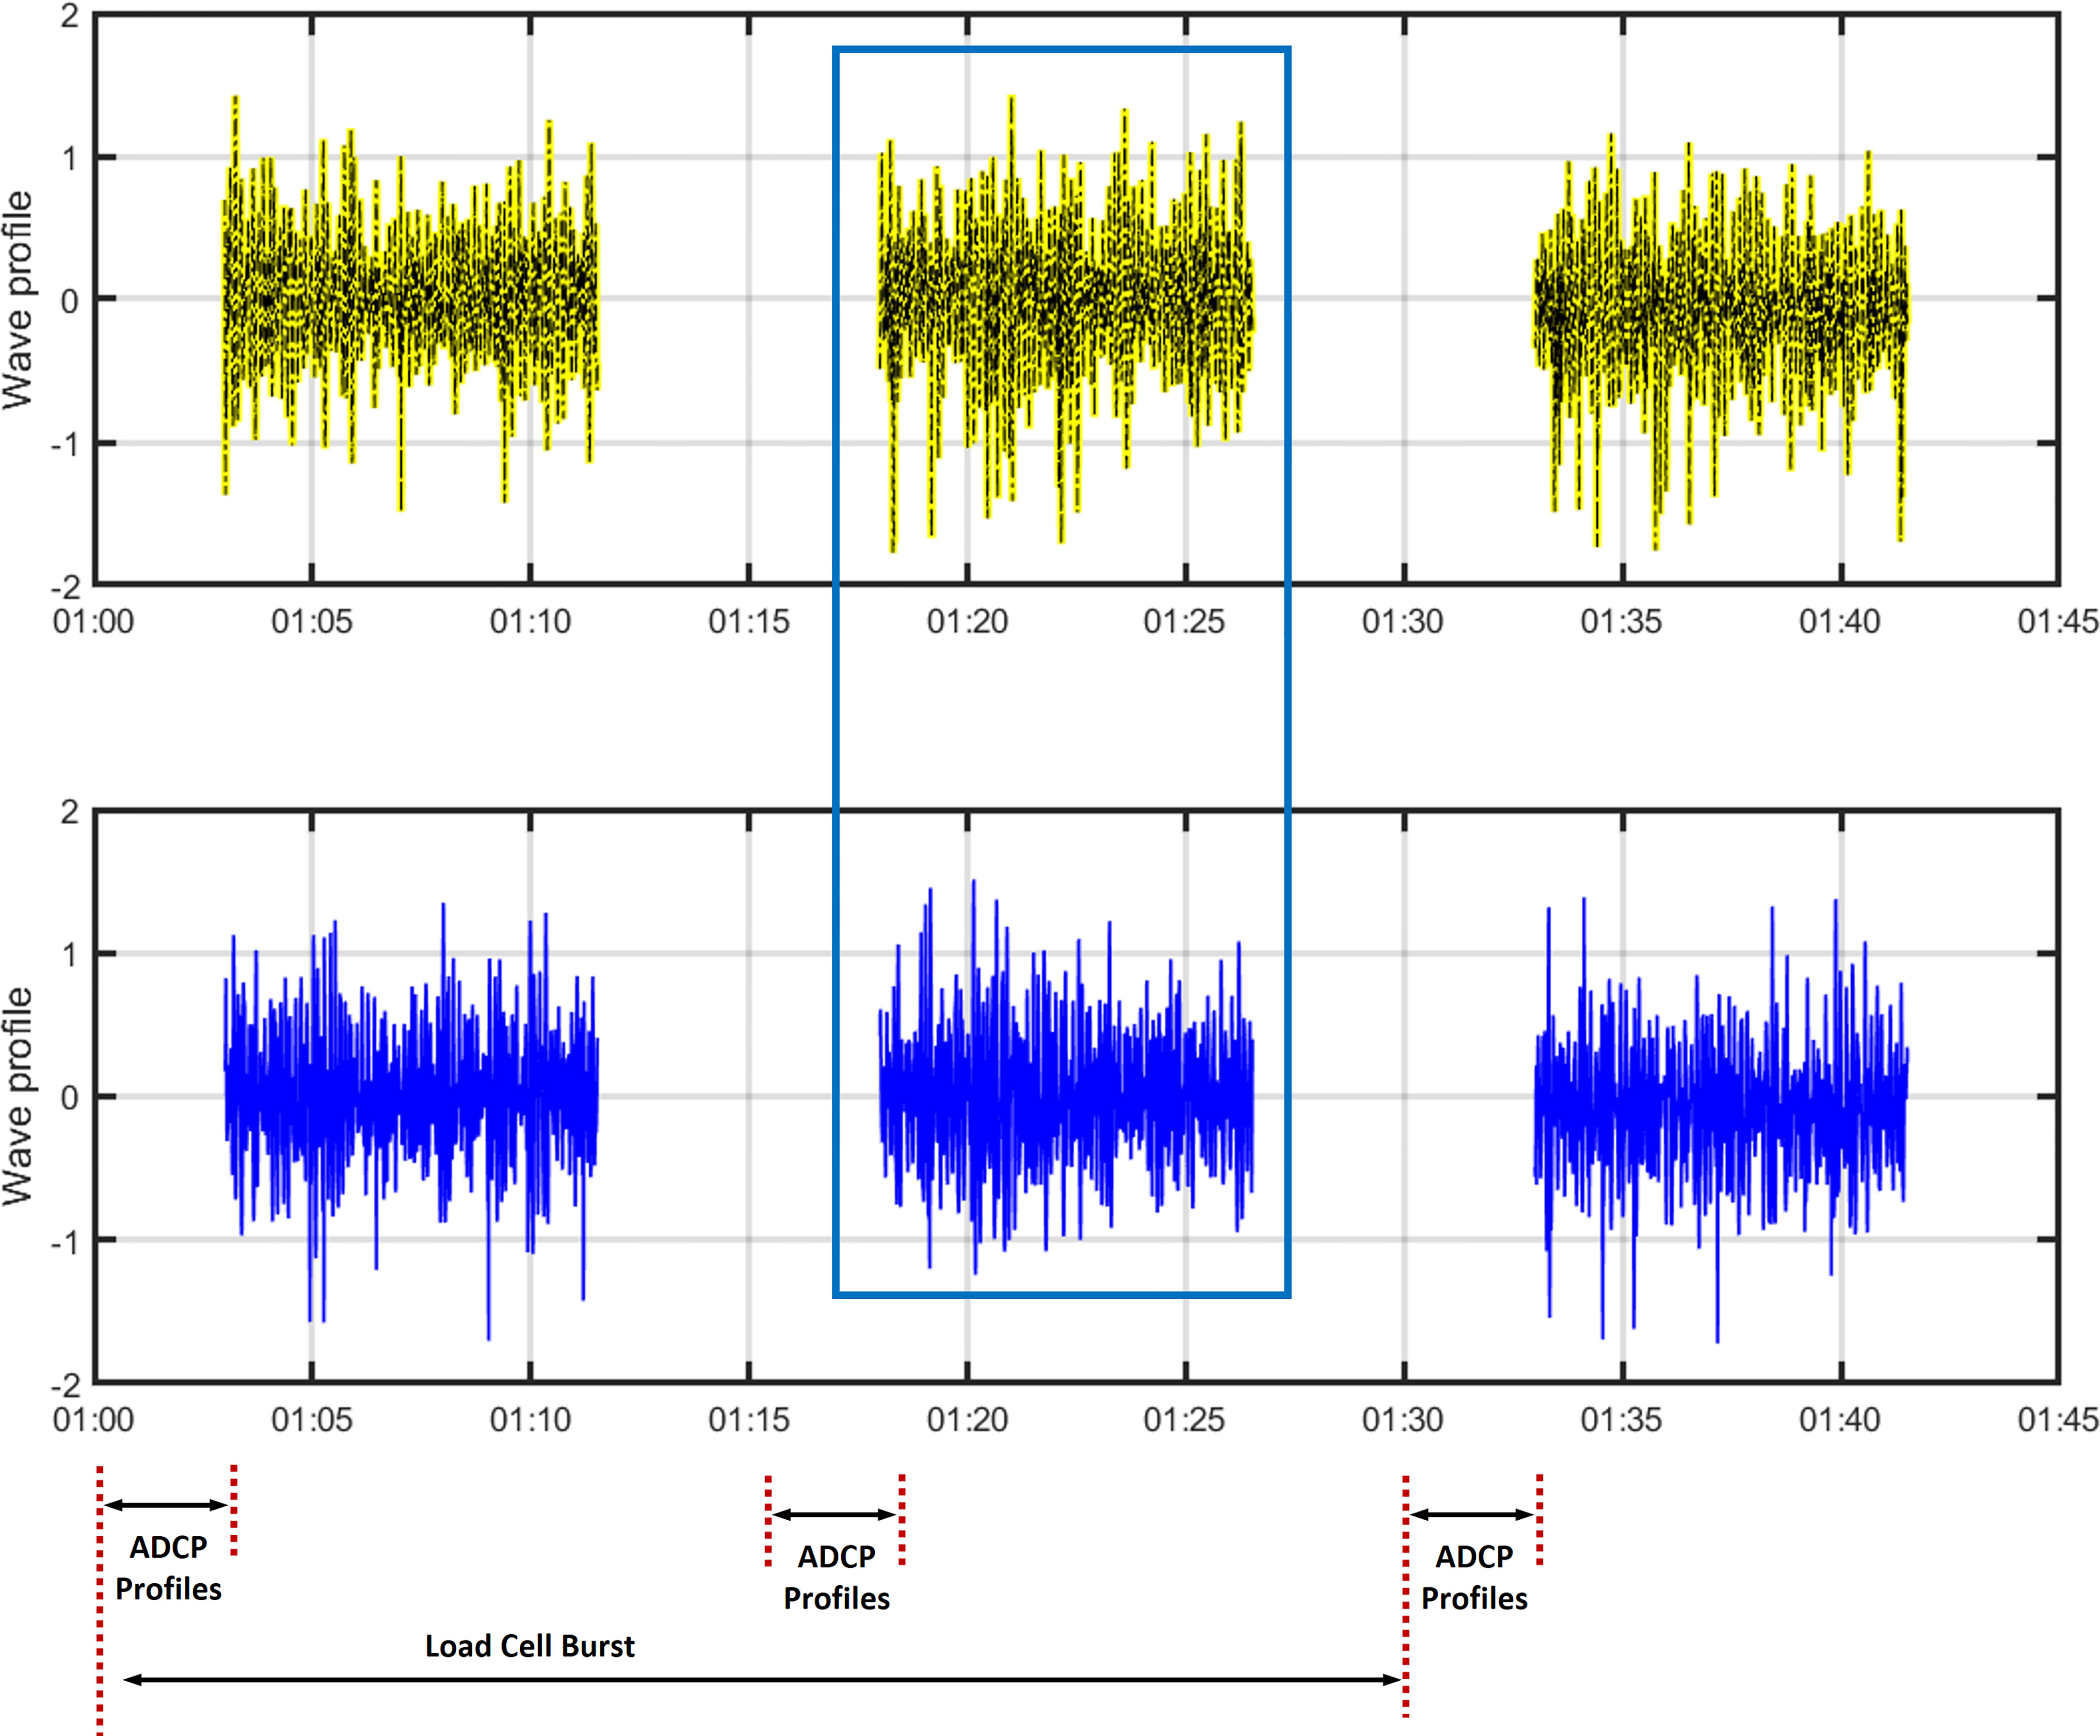
Figure 10 Acoustic surface tracking wave bursts obtained before, during and after the point of maximum tension (21:53 minutes) at 1:03–1:11:32, 1:18–1:26:32 and 1:33–1:41.32 minutes past the hour.
Wave characteristics including the Hmax, Hm0, Tp and wave direction were calculated for each of the bursts and are provided in Table 4. The values were consistent between the two west and east ADCPs with slightly larger values from 1:18:00 to 1:26:32. With this dataset, we made a general assessment that for the maximum tension case, that steady waves with an Hm0 of 1.77 m created oscillatory tensions of Ts = 860 and 333 N for the west and east mooring line, respectively. By comparing the six wave datasets, we identified the sea as a weak stationary, and ergodic process during the 40 minutes. Therefore, oscillations in the tension time series are less likely the result of “transient effects” due to changing wave and current conditions and thus provide a better situation to assess the mooring system dynamics.
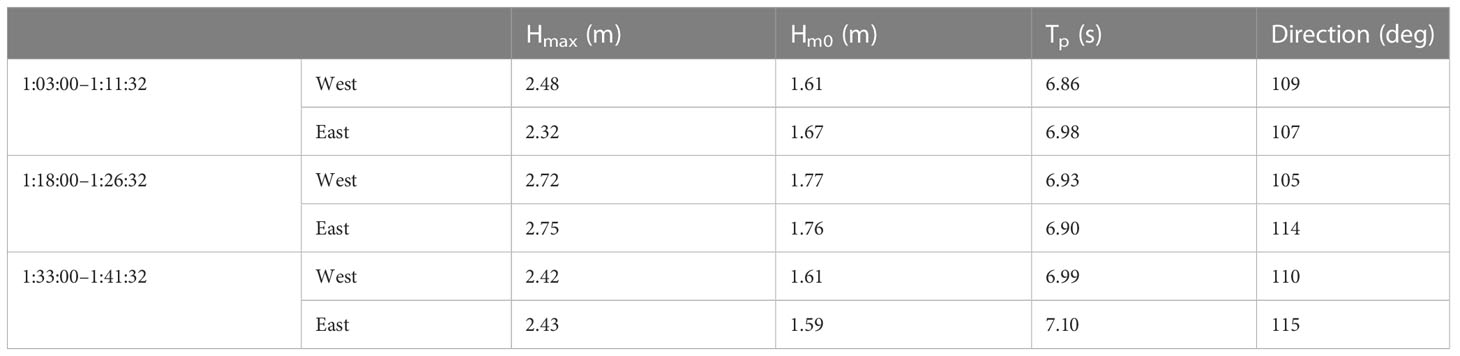
Table 4 Wave characteristics from the west and east mooring lines during the hour that the maximum tension was measured.
5 Discussion
5.1 Interpretation of the field study datasets
The results of this field study produced a suite of high-fidelity datasets to investigate mooring line tension of a kelp farm in response to quantified wave and current conditions with known levels of biomass. The sampling scheme developed proved effective in identifying a maximum tension event with steady state conditions for both currents and waves by profile sampling before and after wave bursts at 15 minute intervals.
The maximum tension value measured (2.8 kN) on the west mooring occurred during a mild spring storm with an Hm0 = 1.7 m, Hmax = 2.7 m, and Tp = 7 s. The storm produced a unique, localized hydrodynamic environment with peak profile current speeds of 0.5 m s−1. It was unique in the sense that the current direction was to the ESE, nearly opposite that of the wave direction. Based on the direction of the waves and the geometric configuration of Saco Bay, it is hypothesized that waves from the east, pile up on the shore, then formed a “rip” like current out between Eagle and Ram Islands (Figure 1) to the ESE. It was this steady current that generated most of the load on the west side mooring line. This same effect was illustrated in the wave/current/surge model simulations done for the Patriot’s Day storm in Zou and Xie (2016). The ADCP results also quantified velocity reduction from the west to the east side even on this relatively small, single line farm.
The maximum tension event was further examined using a 1st order, superposition approach by removing the mean tension from each 30-minute burst to obtain the oscillatory components. We used a Fast Fourier Transform (FFT) on the zero-mean time series to isolate these frequency components of tension on the farm structure. Then, we multiplied the FFT by its complex conjugate and by normalizing per frequency bin, produced energy density spectra in units of kN2 Hz−1. The curves were smoothed by performing an 8-point frequency bin average. This technique was chosen in lieu of ensemble averaging sections to obtain potential low frequency components that could be resolved from the 30 minute burst (Figure 11A).
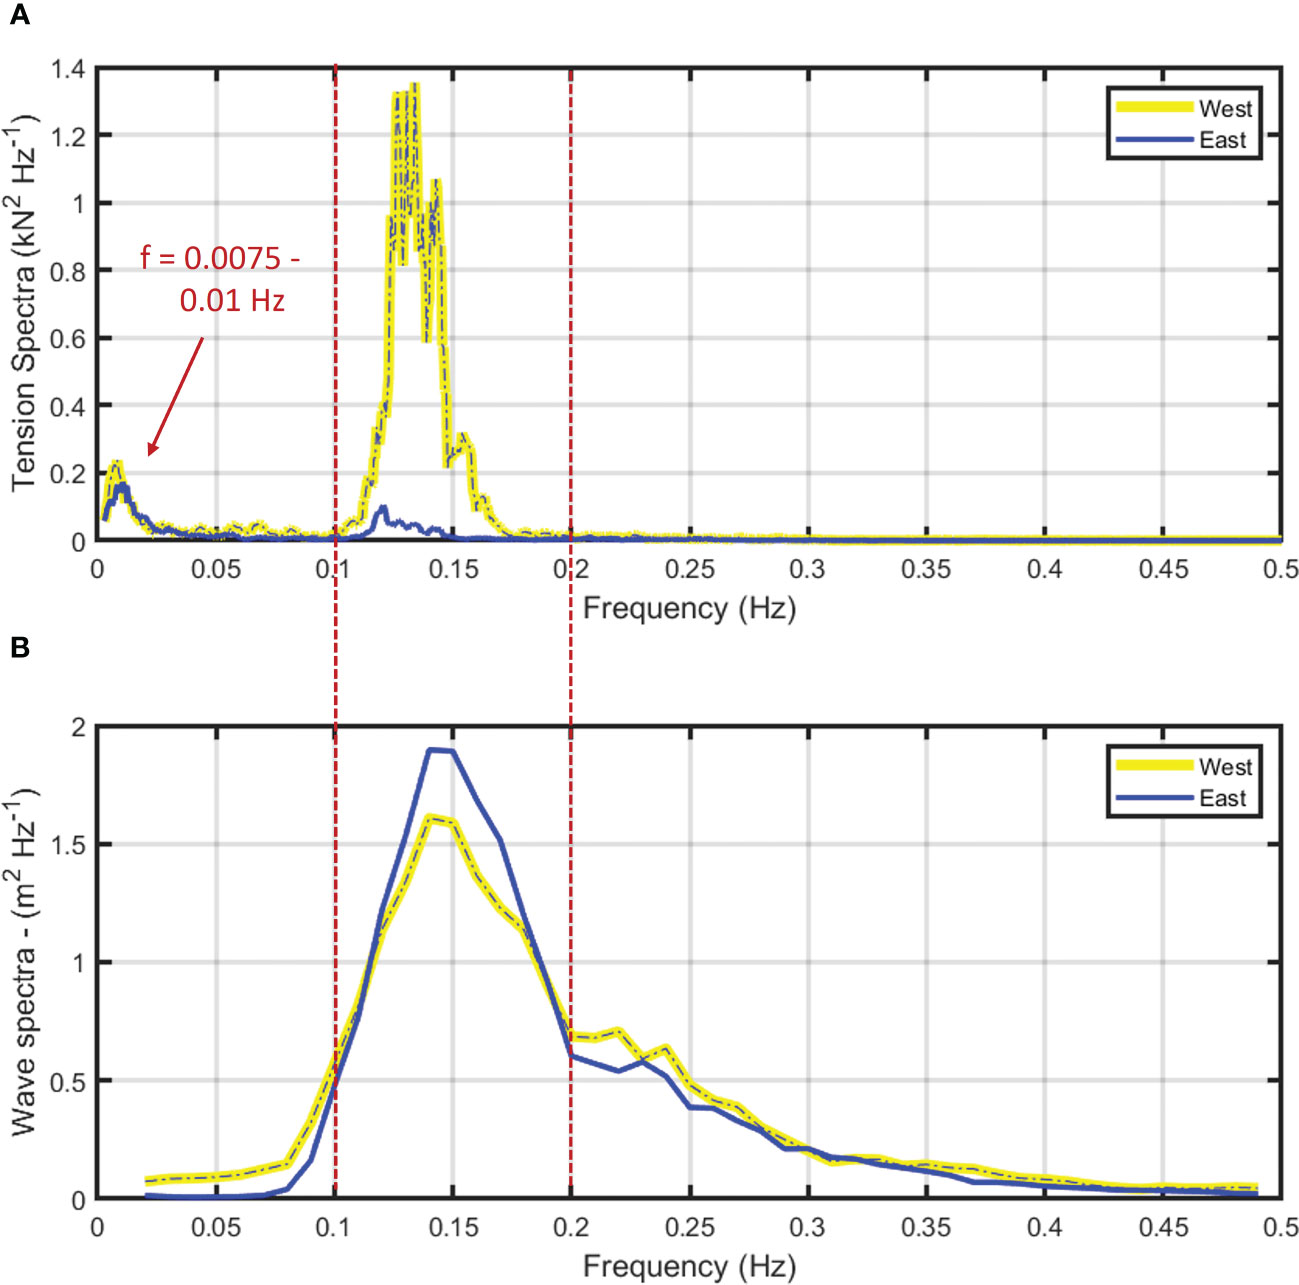
Figure 11 (A) Tension spectra from the west and east load cells calculated from the zero-mean, 30 minute burst of the maximum tension case. (B) Wave spectra from the west and east ADCPs calculated from the 1:18:00 to 1:26:32 AST bursts.
Each spectral curve was characterized by two distinct peaks. For the west mooring line, the largest peak occurred at 0.13 Hz, or a period of about 7.7 seconds. This was consistent with the dominant wave periods measured with the ADCPs (Table 4 and Figure 11B). In the nominal frequency band between 0.05 and 0.5 Hz, the east mooring line showed less wave energy influence, with a peak frequency of 0.12 Hz (Tp = 8.33 s), despite being oriented toward the incoming waves. This indicates a strong nonlinear interaction between current-induced and wave-induced forces: The amplitudes of the wave-induced oscillations were significantly larger on the west end of the farm. We hypothesize that since this mooring line was under a higher mean tension, it was more sensitive to oscillatory load in this complex current and wave condition. Another set of dominant peaks occurred in the range between 0.0075 and 0.01 Hz (1.6–2.2 min) indicating a substantial low frequency oscillation in the mooring system tension response. Notably, while the mean tensions and tension amplitudes in the wave frequency range were substantially higher on the west side, the amplitudes of the low-frequency tension oscillations were approximately equal between the west and east mooring lines. These low-frequency oscillations are outside of the range of wave frequencies associated with highest wave energy. The wave spectral plots from the ADCPs (Figure 11B) have peak frequencies of 0.14 Hz, with seas having a broad range incorporating both swell and local wind components. It was also evident that the higher frequency wind waves (> 0.2 Hz) have little direct influence on the tension measurements.
5.2 Implications for numerical modeling approaches
The detailed load cell and ADCP datasets for the maximum tension case provided substantial insight regarding the load dynamics of the small kelp farm. The measurements quantified loading on the system as mostly from the steady currents, but with some wave influence. The farm biomass (≈7.8 kg m−1) induced a 26.7% reduction in flow at the depth between 2–6 m. The tension datasets also identified low frequency oscillations. This is likely a farm dynamic response to velocity shear in the water column. It is possible that the farm is vertically oscillating, first by being pushed deeper by the stronger velocities near the surface (overcoming buoyancy) and then while in the deeper, lower velocity zone, relaxing as it floats back up to the depths of higher velocities. This process then repeats every 1–2 min.
The field measurements describe the combination of ocean processes that induce load on the kelp farm, which are transmitted to the anchors through the mooring lines. This oceanographic-structure interaction is complicated with waves and currents propagating in different directions. The waves and currents also interact producing nonlinear components. In addition, wave forcing incorporates both drag and inertia, which are 90 degrees out-of-phase. These complexities are difficult to resolve with just in-situ datasets.
Advanced modeling techniques such as those described in Knysh et al. (2020) and Knysh et al. (2022), however, have been applied specifically for such compliant aquaculture applications. One model platform (called HydroFE) applies the Morison et al. (1950) approach with relative velocities and accelerations. The velocities include both waves and currents with the nonlinear interaction components and the phase relationships between drag and inertia (Fredriksson et al, 2005). HydroFE and other models can use high-fidelity input to include waves and currents from different directions. For instance, our velocity profiles at 0.5 m bin resolution can be used directly as input, with waves propagating in the opposite direction and with values identical to those measured. Clear evidence exists that kelp biomass induces work on the fluid, impacting downstream circulation and current speeds. Changing the horizontal velocity field by incorporating reduction values (Knysh et al., 2022) may also be useful for systems with multiple cultivation lines such as those described in (Kite-Powell et al., 2022). Farms with multiple cultivation lines are becoming more common as kelp systems scale (e.g., DeAngelo et al., 2023). Velocity reduction schemes will also become more important to have optimized numerical modeling approaches. With the information presented here as potential validation, one possible next step would be to develop a numerical velocity reduction approach based on spatial momentum changes, potentially using normal and tangential empirical drag information (e.g., Fredriksson et al., 2020).
6 Conclusion
As macroalgae farms move into exposed areas and scale to accommodate high volume end uses, detailed and accurate modeling approaches will be needed. This high-fidelity dataset focusing on engineering parameters will improve numerical model modeling techniques that include velocity reduction caused by kelp biomass, especially as multiline kelp farms are designed. These model improvements will be crucial because steady drag effects dominate the tension values, at least during conditions with mild storms. Mooring system response as a function of current and wave forcing magnitudes and directionality is an area that needs substantial attention to reduce uncertainty during the design process. The detailed datasets presented here represent multiple potential load cases that could be used to evaluate model performance for a suite of distinct conditions. This will enable us to verify that the pertinent physical processes are adequately represented so that future designs are specified as optimized kelp farming systems.
Data availability statement
The raw data supporting the conclusions of this article will be made available by the authors, without undue reservation.
Author contributions
DF, BC-P, and AS contributed to the conceptualization of the work. DF, AS, TD, and BC-P collaborated to design the kelp farm system. AS led the field operations including deployment of gear and recovery of datasets. Data processing was done by DF with input from TD. DF worked on the initial draft of the manuscript. AS, BC-P, TD, SC, and DB provided manuscript edits. All authors contributed to the article and approved the submitted version.
Funding
Funding for this research was received in part from the United States Department of Energy Macroalgae Research Inspiring Novel Energy Resources (MARINER) program award #DEAR0000917 to the University of New England. From the same MARINER program, funds were allocated to the U.S. Naval Academy (DF’s previous affiliation) as an ARPA-E Interagency Agreement No. 89703018SAR000002. Initial load cell design work was funded from the National Science Foundation Established Program to Stimulate Competitive Research (EPSCoR) award #IIA-1355457 to Maine EPSCoR at the University of Maine subaward to the University of New England (UNE), and by the UNE School of Marine & Environmental Programs. Funds for the University of Maine were received from Conscience Bay Research, LLC/Conscience Bay Company. Funding was also provided by the Aquaculture Research Institute in partnership with the University of Maine and the United States Department of Agriculture Aquaculture Experimental Station. The funders were not involved in the study design, collection, analysis, interpretation of data, the writing of this article or the decision to submit it for publication.
Acknowledgments
The authors would like to thank Liz Johndrow, Tim Arienti, Zach Miller-Hope and Addie Waters at the University of New England for field work, vessel operation and project coordination. Load cell design work was conducted at the U.S. Naval Academy with work done by Michael Stanbro. The authors also thank Dan Chadbourne for assisting in permitting, liaising with the local marine community, and vessel support.
Conflict of interest
Author BC-P was partially employed by the Ecological Aquaculture Foundation, LLC. Author TD was employed by Kelson Marine Co.
The remaining authors declare that the research was conducted in the absence of any commercial or financial relationships that could be construed as a potential conflict of interest.
Publisher’s note
All claims expressed in this article are solely those of the authors and do not necessarily represent those of their affiliated organizations, or those of the publisher, the editors and the reviewers. Any product that may be evaluated in this article, or claim that may be made by its manufacturer, is not guaranteed or endorsed by the publisher.
References
Augyte S., Yarish C., Redmond S., Kim J. K. (2017). Cultivation of a morphological distinct strain of the sugar kelp, Saccharina latissima forma angustissima, from coastal Maine, USA, with implications for ecosystem services. J. Appl. Phycol. 29 (4), 1967–1976. doi: 10.1007/s10811-017-1102-x
Berstad A. J., Heimstad L. F. (2019). Analysis of flexible net structures in marine environment. Proceedings of the VIII International Conference on Computational Methods in Marine Engineering: CIMNE, Bensow R., Ringsberg J. (Eds). 259-270
Berstad A. J., Walaunet J., Heimstad L. F. (2012). Loads from currents and waves on net structures. Proceedings of the ASME 2012 31st International Conference on Ocean, Offshore and Arctic Engineering. Volume 7: Ocean Space Utilization; Ocean Renewable Energy (Rio de Janeiro, Brazil), 95–104. doi: 10.1115/omae2012-83757
Buck B. H., Buchholz C. M. (2005). Response of offshore cultivated Laminaria saccharina to hydrodynamic forcing in the North Sea. Aqua. 250, 674–691. doi: 10.1016/j.aquaculture.2005.04.062
Cifuentes C., Kim M. (2017). Hydrodynamic response of a cage system under waves and currents using a Morison-force model. Ocean Eng. 141, 283–294. doi: 10.1016/j.oceaneng.2017.06.055
Colbourne D. B., Allen J. H. (2001). Observations on motions and loads in aquaculture cages from full scale and model scale measurements. Aquacult. Eng. 24 (2), 129–148. doi: 10.1016/S0144-8609(00)00069-8
Coleman S., Dewhurst T., Fredriksson D. W., Gelais A. T. S., Cole K. L., MacNicoll M., et al. (2022). Quantifying baseline costs and cataloging potential optimization strategies for kelp aquaculture carbon dioxide removal. Front. Mar. Sci. Sec. Mar. Fish Aquacult. Living Res 9. doi: 10.3389/fmars.2022.966304
Comeau A. J., Lewis M., Cullen J., Adams R. S., Andrea J., Feener S., et al. (2007). Monitoring the spring bloom in an ice covered fjord with the Land/Ocean Biogeochemical Observatory (LOBO). Vancouver, BC, Canada: OCEANS 2007, 1–7. doi: 10.1109/OCEANS.2007.4449185
DeAngelo J., Saenz B. T., Arzeno-Soltero I. B. (2023). Economic and biophysical limits to seaweed farming for climate change mitigation. Nat. Plants 9, 45–57. doi: 10.1038/s41477-022-01305-9
Fredriksson D. W., Dewhurst T., Drach A., Beaver W. M., St. Gelais A. T., Johndrow K. (2020). Hydrodynamic characteristics of a full-scale kelp model for aquaculture applications. Aquacult. Eng. 90. doi: 10.1016/j.aquaeng.2020.102086
Fredriksson D. W., Swift M. R., Eroshkin O., Tsukrov I., Irish J. D., Celikkol B. (2005). Moored fish cage dynamics in waves and currents. Special issue on open ocean aquaculture engineering. IEEE J. Oceanic Eng. 30 (1), 28–36. doi: 10.1109/JOE.2004.841412
Fredriksson D. W., Swift M. R., Tsukrov I., Irish J. D., Celikkol B. (2003). Fish cage and mooring system dynamics using physical and numerical models with field measurements. Aquacult. Eng. 27 (2), 117–270. doi: 10.1016/S0144-8609(02)00043-2
Fredriksson D. W., DeCew J. C., Tsukrov I. (2007b). Development of structural modeling techniques for evaluating HDPE plastic net pens used in marine aquaculture. Ocean Eng. 34, 2124–2137. doi: 10.1016/j.oceaneng.2007.04.007
Fredriksson D. W., DeCew J. C., Tsukrov I., Swift M. R., Irish J. D. (2007a). Development of large fish farm numerical modeling techniques with in-situ mooring tension comparisons. Aquacult. Eng. 36, 137–148. doi: 10.1016/j.aquaeng.2006.10.001
Goda Y. (2010). Random seas and design of maritime structures, 3rd edition (Advanced Series on Ocean Engineering: World Scientific) 33, 732 p. doi: 10.1142/7425
Gosz M., Kestler K., Swift M. R., Celikkol B. (1996). Finite element modeling of submerged aquaculture net-pen systems. Proceedings of the ASME 1997 International Mechanical Engineering Congress and Exposition (Dallas, Texas, USA: Ocean Engineering), 8–10. doi: 10.1115/IMECE1997-1262
Google Earth (2018). Ram Island site. 43.4697°N 70.35 °W, Elevation 954M Data SIO, NOAA, U.S. Navy, NGA, GEBCO. Available at: https://www.google.com/earth/index.html
Google Earth Pro 7.3.6.9345 (2022). Ram Island site. 43.4697°N 70.35°W, Elevation 5195 m Data SIO, U.S. Navy, NGA, GEBCO. TetraMetrics 2023
Grebe G. S., Byron C. J., Gelais A. S., Kotowicz D. M., Olsond T. K. (2019). An ecosystem approach to kelp aquaculture in the Americas and Europe. Aquacult. Rep. 15, 100215. doi: 10.1016/j.aqrep.2019.100215
Henry P. T. (2014). Bending properties of a macroalga: adaptation of peirce’s cantilever test for in-situ measurements of Laminaria digitate (Laminariaceae). Brief Commun. Amer. J. Bot. 101 (6), 1050–1055. doi: 10.3732/ajb.1400163
Huang C.-C., Pan J.-Y. (2010). Mooring line fatigue: a risk analysis for an SPM cage system. Aquacult. Eng. 42, 8–16. doi: 10.1016/j.aquaeng.2009.09.002
Kim J. K., Kraemer G. P., Yarish C. (2015). Use of sugar kelp aquaculture in Long Island Sounds and the Bronx River Estuary for nutrient extraction. Mar. Ecol. Prog. Series. 531, 155–166. doi: 10.3354/meps11331
Kite-Powell H. L., Ask E., Augyte S., Bailey D., Decker J., Goudey C. A., et al. (2022). Estimating production cost for large-scale seaweed farms. Appl. Phycol. 3 (1), 435–445. doi: 10.1080/26388081.2022.2111271
Knysh A., Drach A., Fredriksson D., Dewhurst T., Tsukrov I. (2022). Methodology for multidimensional approximation of current velocity fields around offshore aquaculture installations. Aquacult. Eng. 99. doi: 10.1016/j.aquaeng.2022.102284
Knysh A., Tsukrov I., Chambers M., Swift M. R., Sullivan C., Drach. A. (2020). Numerical modeling of submerged mussel longlines with protective sleeves. Aquacult. Eng. 88. doi: 10.1016/j.aquaeng.2019.102027
Krogstad H. E. (1988). Maximum likelihood estimation of ocean wave spectra from general arrays of wave gauges. Model. Ident. Control 9 (2), 81–97. doi: 10.4173/mic.1988.2.3
Lee C. W., Kim Y. B., Lee G. H., Choe M. Y., Lee M. K., Koo K. Y. (2008). Dynamic simulation of a fish cage system subjected to currents and waves. Ocean Eng. 35 (14-15),1521-1532. doi: 10.1016/j.oceaneng.2008.06.009
Lee C. W., Lee J., Park S. (2015). Dynamic behavior and deformation analysis of the fish cage system using mass-spring model. China Ocean Eng 29, 311-324. doi: 10.1007/s13344-015-0022-2
Li Y. C., Zhao Y. P., Gui F. K., Teng B. (2006). Numerical simulation of the hydrodynamic behaviour of submerged plane nets in current. Ocean Eng. 33 (17–18), 2352-2368. doi: 10.1016/j.oceaneng.2005.11.013
Martin T., Tsarau A., Bihs H. (2021). A numerical framework for modelling the dynamics of open ocean aquaculture structures in viscous fluids. Appl. Ocean. Res. 106, 102410. doi: 10.1016/j.apor.2020.102410
Masters G. M., Ela W. (2007). Introduction to environmental engineering and science. 3rd Edn (Hoboken, NJ: Prentice Hall) 189, 720.
Morison J. R., Johnson J. W., O’Brien M. P., Schaaf S. A. (1950). The forces exerted by surface waves on piles. Petrol. Trans. Am. Inst. Min. Eng., 149–157. doi: 10.2118/950149-G
Nguyen N. G., Thiagarajan K., Auger J. (2019). Integrity assessment of an oyster farm mooring system through in-situ measurements and extreme environment modeling. Ocean. Eng. 172, 641–659. doi: 10.1016/j.oceaneng.2018.11.023
Pedersen T., Nylund S., Dolle A. (2002). “Wave height measurements using acoustic surface tracking,” in Oceans ’02 MTS/IEEE Conference, 29–31 October 2002 3, 1747–1754. doi: 10.1109/OCEANS.2002.1191898
Pedersen T., Siegel E. (2008). Wave measurements from a subsurface buoy. Sea Technol. 49 (2), 17–20. doi: 10.1109/CCM.2008.4480872
Piconi P., Veidenheimer R., Chase B. (2020) Edible seaweed market analysis. Available at: https://www.islandinstitute.org/edible-seaweed-market-analysis/.
Pribadi A. B. K., Donatini L., Lataire E. (2019). Numerical modelling of a mussel line system by means of lumped-mass approach. J. Mar. Sci. Eng. 7 (9), 309. doi: 10.3390/jmse7090309
Raman-Nair W., Colbourne B. (2003). Dynamics of a mussel longline system. Aquac. Eng. 27, 191–212. doi: 10.1016/S0144-8609(02)00083-3
Raman-Nair W., Colbourne B., Gagnon M., Bergeron P. (2008). Numerical model of a mussel longline system: coupled dynamics. Ocean Eng. 35, 1372–1380. doi: 10.1016/j.oceaneng.2008.05.008
Reite K.-J., Føre M., Aarsæther K. G., Jensen J., Rundtop P., Kyllingstad L. T., et al. (2014). FHSIM – Time Domain Simulation of Marine Systems. Proceedings of the ASME 2014 33rd International Conference on Ocean, Offshore and Arctic Engineering (San Francisco, California, USA: Ocean Engineering), 8A. doi: 10.1115/omae2014-23165
Rominger J. T., Nepf H. M. (2014). Effects of blade flexural rigidity on drag force and mass transfer rates in model blades. Limnol. Oceanogr. 59 (6), 2028–2014. doi: 10.4319/lo.2014.59.6.2028
Stevens C., Plew D., Hartstein N., Fredriksson D. W. (2008). The physics of open-water shellfish aquaculture. Aquacult. Eng. 38 (3), 145–160. doi: 10.1016/j.aquaeng.2008.01.006
Stevens C., Plew D., Smith M. R., Fredriksson D. W. (2007). Hydrodynamic forcing of long-line mussel farms. J. Waterway Port Coast. Ocean Eng. 133 (3), 192–199. doi: 10.1061/(ASCE)0733-950X(2007)133:3(192)
St-Gelais A. T., Fredriksson D. W., Dewhurst T., Miller-Hope Z. S., Barry Costa-Pierce B.-A., Johndrow K. (2022). Engineering a low-cost kelp aquaculture system for community-scale seaweed farming at nearshore exposed sites via user-focused design process. Front. Sustain. Food Syst. 6. doi: 10.3389/fsufs.2022.848035
Tsarau A., Kristiansen D. (2019). Application of FhSim for the analysis of environmental loads on a complete fish-farm system. MARINE VIII : Proceedings of the VIII International Conference on Computational Methods in Marine Engineering (CIMNE) 2019, 271–284.
Tsukrov I., Eroshkin O., Fredriksson D. W., Swift M. R., Celikkol B. (2003). Finite element modeling of net panels using consistent net element. Ocean Eng. 30, 251–270. doi: 10.1016/S0029-8018(02)00021-5
Vettori D., Nikora V. (2017). Morphological and mechanical properties of blades of Saccharina latissima. Estuar. Coast. Shelf Sci. 196, 1–9. doi: 10.1016/j.ecss.2017.06.033
Zhao Y. P., Li Y. C., Dong G. H., Gui F. K., Teng B. (2007). A numerical study on dynamic properties of the gravity cage in combined wave-current flow. Ocean Eng. 34 (17–18), 2350-2363. doi: 10.1016/j.oceaneng.2007.05.003
Zhao Y. P., Wang X. X., Decew J., Tsukrov I., Bai X. D., Bi C. W. (2015). Comparative study of two approaches to model the offshore fish cages. China Ocean Eng. 29, 459–472. doi: 10.1007/s13344-015-0032-0
Keywords: ocean measurements, aquaculture engineering, macroalgae farms, Saccharina latissima, anchor lines
Citation: Fredriksson DW, St. Gelais AT, Dewhurst T, Coleman S, Brady DC and Costa-Pierce BA (2023) Mooring tension assessment of a single line kelp farm with quantified biomass, waves, and currents. Front. Mar. Sci. 10:1178548. doi: 10.3389/fmars.2023.1178548
Received: 02 March 2023; Accepted: 24 April 2023;
Published: 17 May 2023.
Edited by:
Zhao Yunpeng, Dalian University of Technology, ChinaReviewed by:
Hung-Jie Tang, National Cheng Kung University, TaiwanPeter M. J. Herman, Delft University of Technology, Netherlands
Copyright © 2023 Fredriksson, St. Gelais, Dewhurst, Coleman, Brady and Costa-Pierce. This is an open-access article distributed under the terms of the Creative Commons Attribution License (CC BY). The use, distribution or reproduction in other forums is permitted, provided the original author(s) and the copyright owner(s) are credited and that the original publication in this journal is cited, in accordance with accepted academic practice. No use, distribution or reproduction is permitted which does not comply with these terms.
*Correspondence: David W. Fredriksson, David.Fredriksson@unh.edu