Exploring modern bathymetry: A comprehensive review of data acquisition devices, model accuracy, and interpolation techniques for enhanced underwater mapping
 Zhuoxiao Li1,2
  Zitian Peng1 Zheng Zhang1 Yijie Chu1,2 Chenhang Xu1,2 Shanliang Yao1,2 Ángel F. García-Fernández2,3 Xiaohui Zhu1* Yong Yue1
  Andrew Levers4 Jie Zhang1
  Jieming Ma1
- 1School of Advanced Technology, Xi’an Jiaotong-Liverpool University, Suzhou, Jiangsu, China
- 2Department of Electrical Engineering and Electronics, University of Liverpool, Liverpool, United Kingdom
- 3ARIES Research Centre, Universidad Antonio de Nebrija, Madrid, Spain
- 4Institute of Digital Engineering and Autonomous Systems, University of Liverpool, Liverpool, United Kingdom
Building a high-precision bathymetry digital elevation model is essential for navigation planning, marine and lake resource planning, port construction, and underwater archaeological projects. However, existing bathymetry methods have yet to be effectively and comparatively analyzed. This paper comprehensively reviews state-of-the-art bathymetry methods, including data acquisition techniques, model accuracy, and interpolation algorithms for underwater terrain mapping. First, We assess the merits and drawbacks of novel data acquisition devices, such as single-beam/multi-beam echo sounders and light detection and ranging systems. After that, we analyze the accuracy of the ETOPO1, GEBCO_2022 and SRTM15 to provide valuable insights into their performance. Furthermore, we evaluate ANUDEM, Inverse Distance Weighting, Kriging and Nearest Neighbor interpolation algorithms in different underwater terrains by comparing their applicability, reliability, and accuracy in various underwater environments. Finally, we discuss the development trends and challenges in underwater bathymetry technology and offer a forward-looking perspective on the future of this essential field.
1 Introduction
1.1 Background
A landform represents any physically discernible form and features on Earth’s surface (Evans, 2012). Consequently, these features can be depicted on topographic maps using elevation and contour lines (MacMillan and Shary, 2009). Elevation data is acquired point by point during field surveys, and contour lines are generated following the processing of elevation points. Since the 1960s, land-based terrain surveying and mapping techniques have evolved, with numerous observation satellites now capable of providing elevation data at accuracies between 30m and 90m (Chang et al., 2010). Unmanned aerial vehicles (UAVs) employing aerial triangulation and automated image-matching technologies facilitate the acquisition of point cloud data for digital elevation models (DEMs) (Zongjian, 2008; Samad et al., 2013).
Analogous to inland topography, seabed undulations constitute vital information on maps, being indispensable for applications including oceanographic research, hydrographic surveying, marine habitat mapping, coastal zone management, and navigational safety. Currently, three mainstream bathymetric methods prevail:
1. Ship-borne seabed topography is the most widely used high-resolution topographic method. Platforms like vessels, unmanned surface vehicles (USVs), and autonomous underwater vehicles (AUVs) (Zongjian, 2008; Samad et al., 2013; Rossi et al., 2020) can incorporate bathymetric equipment like single-beam and multi-beam echo sounders (SBES and MBES) for bathymetry. Multi-beam bathymetric technology is becoming routine in oceanographic surveying, making the point-and-line seabed topographic surveys have evolved into planar, full-coverage operation modes (Dunham et al., 2005; H Simons and Snellen, 2009; Mohammadloo et al., 2020).
2. Airborne seabed topography primarily encompasses airborne laser bathymetry (ALB) (Chen et al., 2003; Guenther, 2007; Kinzel et al., 2013; Chowdhury et al., 2017; Eren et al., 2018) and airborne synthetic aperture radar (SAR) (Fan et al., 2008; Pereira et al., 2019). ALB is well-suited for water depth measurements in offshore shallow water areas, including nearshore, shallow seas, islands, and reefs, with a minimum detection depth of 0.15 m and a maximum sounding depth of approximately 50 m. Airborne SAR technology is ideal for acquiring surface information in non-ideal conditions such as cloudiness and fog.
3. The spaceborne mode primarily comprises satellite-derived bathymetry (SDB) (Chenier et al., 2018; Kim and Yun, 2018; da Silveira et al., 2020; Niroumand-Jadidi et al., 2020) and satellite altimetry (SA) (Smith and Sandwell, 1994; Smith and Sandwell, 1997; Ablain et al., 2017; Veng and Andersen, 2021), facilitating the acquisition of a wide range of bathymetric data with consistent quality. Large-scale seabed topography can also be conducted by utilizing satellite altimetry gravity anomalies and ship bathymetry data or employing multispectral or SAR satellite remote sensing images to construct inversion models
1.2 Challenges in underwater mapping
Accuracy and resolution are crucial factors in generating reliable bathymetric digital elevation models (BDEMs). Many factors can affect the models’ accuracy, such as the type of device, the water depth, and the seabed topography. It is essential to calibrate the device and use appropriate corrections to ensure the accuracy of the model. Additionally, interpolation is vital in enhancing the resolution of bathymetric maps, which can be performed using kriging (Zhang et al., 2015) and inverse distance weighting (IDW) techniques (Amante and Eakins, 2016). However, the choice of interpolation method depends on the data distribution, data density, and the intended application (Amante and Eakins, 2016). In recent years, machine learning techniques have also been employed to improve the accuracy of bathymetric maps.
1. Environmental Factors: Various environmental factors can impact the accuracy and reliability of bathymetric data, including water clarity, turbidity, surface waves, currents, and seafloor composition (Ernstsen et al., 2006; Stammer et al., 2014; Rowley et al., 2020). These factors can cause signal attenuation, scattering, or refraction, leading to inaccuracies in the acquired data (Rowley et al., 2020).
2. Technological Limitations: Current bathymetric data acquisition devices have resolution, coverage, and depth penetration limitations. These limitations can result in the incomplete or low-resolution mapping of certain areas, particularly in complex or deep-sea environments.
3. Data Gaps and Inconsistencies: Bathymetric data is often acquired from various sources using different devices, leading to gaps and inconsistencies in the data. These inconsistencies can result from variations in survey methods, time periods, and data quality, making it challenging to create seamless and accurate maps (Shu et al., 2021).
4. Cost and Accessibility: Acquiring high-quality bathymetric data can be expensive, especially for large or remote areas. This can be a major barrier for researchers and organizations with limited resources, resulting in a lack of accessible data for certain regions (Sahafi, 2013; Bio et al., 2020).
5. Integration of Heterogeneous Data: Integrating data from different sources, such as satellite-derived bathymetry, LiDAR, and acoustic measurements, can be challenging due to differences in spatial resolution, data formats, and accuracy levels. Developing robust methods to combine and harmonize these datasets is essential for generating comprehensive maps.
6. Data Processing and Interpolation: The large volume of data collected during bathymetric surveys often requires extensive processing and interpolation to generate accurate and reliable maps. Selecting appropriate interpolation techniques and addressing data quality issues can be challenging and time-consuming.
1.3 Objectives of the review
This study is motivated by the escalating demand for accurate, high-resolution bathymetric data spurred by increased human activities in coastal and deep-sea environments and the quest for a more comprehensive understanding of complex marine ecosystems. Recent technological advancements have fostered significant progress in data acquisition devices and analytical methods for processing and visualizing bathymetric data. Nonetheless, challenges persist concerning data coverage, resolution, accuracy, and integration of various data sources and techniques.
This paper delivers a comprehensive review of cutting-edge bathymetry methods, with a focus on recent advancements in data acquisition devices and interpolation algorithms. By discerning the strengths and limitations of these methods, comparing their applicability and accuracy across various underwater environments, and addressing challenges and future trends in bathymetry, we aspire to contribute to the continued progress in underwater terrain mapping. Additionally, we assess the accuracy of three representative bathymetry models, scrutinizing factors that influence their performance and reliability. This analysis will facilitate the identification of areas for improvement, along with trade-offs that must be considered when choosing a model for a specific application.
Moreover, we assess the performance of four interpolation algorithms, comparing their applicability, reliability, and accuracy across diverse underwater environments. Interpolation is a crucial step in processing bathymetric data and enables depth value estimation in areas lacking direct measurements. Evaluating the strengths and weaknesses of different interpolation techniques will aid researchers and practitioners in choosing the most suitable method for their requirements. Lastly, we investigate development trends and challenges in underwater bathymetry technology, providing a forward-looking perspective on this vital field’s future. We address emerging technologies and explore the potential of integrating multiple data sources and techniques to generate more accurate and comprehensive bathymetric maps.
The rest of the paper is organized as follows. Section 2 provides a comprehensive review of the state-of the-art bathymetry data acquisition techniques, including single-beam echo sounders, multi-beam echo sounders, LiDAR, and satellite-derived bathymetry. Section 3 summarizes existing DEM interpolation methods for enhanced resolution. Section 4 presents an in-depth analysis of the accuracy of three bathymetry models and the factors affecting their performance. In Section 5, we discuss four interpolation algorithms and their applicability, reliability, and accuracy in different underwater environments. Section 6 offers a critical comparison of our results with previous reviews, highlighting the contributions and advancements made in the field, and concludes the paper by summarizing the main findings, discussing the future trends and challenges in underwater bathymetry technology, and providing recommendations for further research and development in this essential area. Finally, Section 7 provides a conclusion of this paper.
2 Sensors for bathymetry
2.1 Single beam echo sounder (SBES)
As the sound wave signal reaches the seabed interface, most of the energy generates a reflected signal that propagates back to the transducer. This can be recorded by an SBES, which calculates the seabed depth based on the propagation time of the acoustic pulse in seawater and the speed of sound. Stringent on-site control is necessary to acquire high-quality data and clear reflection images (Eleftherakis et al., 2018; Popielarczyk, 2022). For instance, if the transducer draft is too deep, it will be affected by secondary reflected waves and may compromise the boat’s safety. On the other hand, when the transducer draft is shallow, air bubbles and water splashes produced by the carrier may generate substantial noise. This reduction in the signal-to-noise ratio consequently degrades data quality (Mopin et al., 2022).
Table 1 shows the key parameters of three popular SBESs. Although SBES bathymetry surveys are simple and low-cost, they have limitations (Yamasaki et al., 2017; Bandini et al., 2018). Large-scale bathymetry surveys require precise depth measurements of numerous adjacent points on the seafloor, enabling accurate seafloor topography construction. To achieve this effectively, two requirements must be met: (1) producing accurate depth measurements corresponding to specific latitude and longitude and (2) performing a large number of measurements within a reasonable time frame. However, SBES falls short in both aspects, providing low spatial resolution and limited survey area.
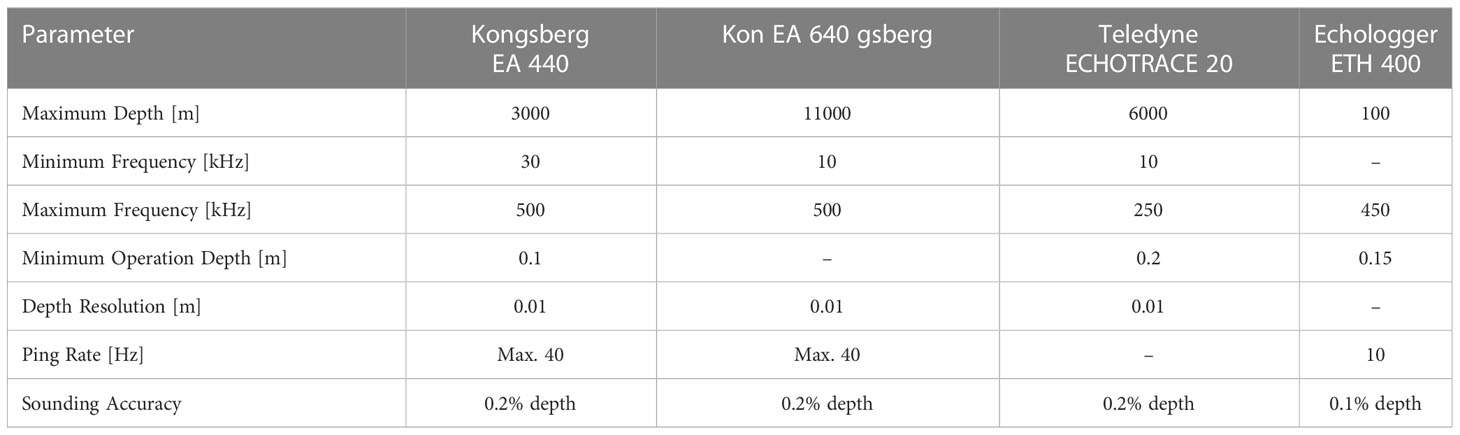
Table 1 Single-beam echo sounder products.
Two factors that influence the resolution of the BDEM are the platform’s operating speed and SBES’s sampling interval, which can be reduced by conducting surveys at a slow speed while following a fixed route (Di Matteo and Milli, 2008). Typically, SBES is performed along both vertical and horizontal routes to cover the entire area. In a study by Bio et al. (2020), 22 sounding lines perpendicular to the coastline and three diagonal control lines separated by 350 meters were used to create bathymetry maps for small water areas, showing that SBES is cost-effective and efficient. However, SBES can only obtain bathymetric data for the planned route, resulting in blank spaces that require interpolation.
The accuracy of the BDEM generated by SBES can be improved by using smaller sampling intervals and denser survey routes. However, the operating costs and survey time increase significantly once the research area is enlarged. To address this issue, multi-source data fusion is a solution (Eleftherakis et al., 2018). A study by da Silveira et al. (2020) combined multi-resolution satellite images with SBES measurements to create detailed bathymetry maps. Field data obtained from SBES was used to calibrate the depth retrieval algorithm, improving the accuracy of the bathymetry maps. Combining these two technologies can meet the measurement accuracy requirements and provide high-quality bathymetry maps for large areas, including shallow regions with complex terrain.
2.2 Multi-beam echo sounder (MBES)
The limitations of SBES, including low resolution and extended operating time, have driven the development of more sophisticated and expensive MBES systems. Table 2 shows the parameters of three MBES products. Key considerations must be taken into account when using them for bathymetry tasks:
1. Sounding resolution: Sounding resolution refers to the minimum interval between two adjacent target points that MBES can distinguish in the three-dimensional direction of the seabed space. This resolution determines the detection ability of small underwater targets and complex terrain (Ernstsen et al., 2006). Pulse width, ping sampling rate, beam width, and speed are the primary factors affecting multibeam bathymetry resolution (Dunham et al., 2005; H Simons and Snellen, 2009; Mohammadloo et al., 2020).
2. Accuracy: The International Hydrographic Organization (IHO) has published regulations (IHO S-44) on accuracy in bathymetric surveys. These regulations include sound velocity refraction compensation, motion attitude compensation, and tide level compensation. The surface sound velocity meter can obtain the sound velocity profile to provide accurate sound velocity refraction compensation (Ernstsen et al., 2006). The motion sensor provides three-dimensional offset parameters for the transmitting and receiving arrays. The transmit beam is corrected for pitch, roll, and yaw (Kiesel, 2000). In deep sea areas without tide level stations, GPS carrier phase measurement technology is used to determine the instantaneous change in tide level and tide level compensation is performed on the bathymetric data (Giorgi et al., 2012).
3. Coverage: The coverage of multibeam bathymetry directly affects the mapping efficiency of the system. However, in deep-sea areas, two-way propagation attenuation affects the signal-to-noise ratio of the outer (grazing angle) signal, and the waveform is severely broadened (Kuperman and Roux, 2007). The signal-to-noise ratio of the outer signal can be improved by optimizing the design of the transmitting and receiving array and using broadband signals. The problem of waveform broadening can also be suppressed by using a wideband signal. Estimating target orientation using a new method (such as the multi-subarray detection method) can improve the orientation estimation accuracy of the outer signal (Li et al., 2018; Wei et al., 2019).
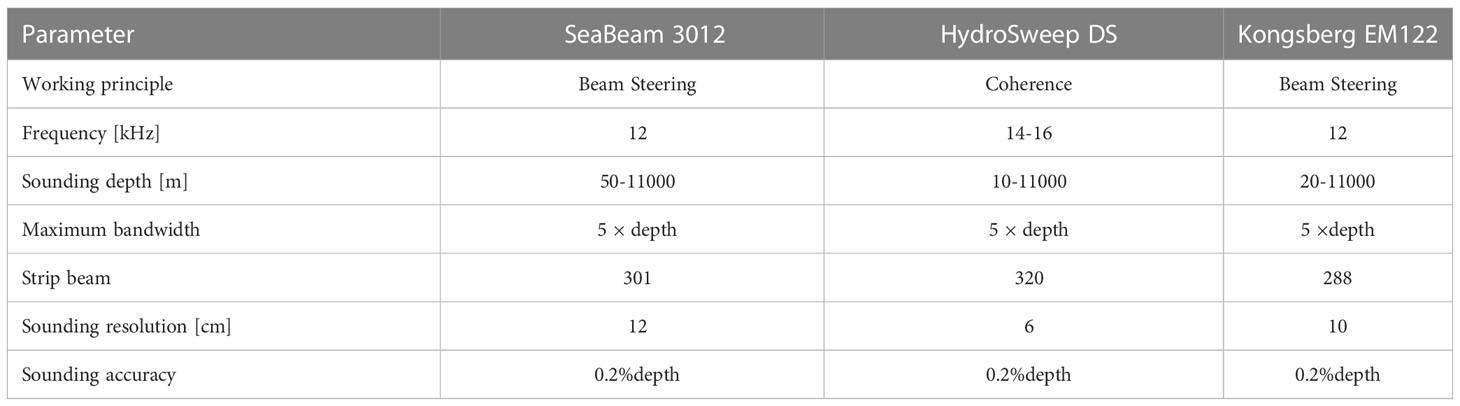
Table 2 Multi-beam echo sounding products.
MBES bathymetry has two main disadvantages: (1) the covered area is relatively small, (2) the amount of collected data is too large to optimize data management, and (3) in areas with flat terrain, the measurement accuracy of MBES can be affected by sound reflection and offset. Therefore, a hybrid approach has become the mainstream of research. One solution is to combine MBES with side-scan sonar, which provides seamless scan data and improves efficiency (de Moustier and Allen, 2012; Mohammadloo et al., 2019). This method obtains a high-resolution backscatter image corresponding to the water depth data space, which can achieve an accurate fusion of water depth and backward imaging data for comprehensive terrain detection (Li et al., 2012). Research has shown that the combined method of side-scan sonar and MBES meets the measurement standards of the National Oceanic and Atmospheric Administration (NOAA) (Mohammadloo et al., 2019). Using a combined approach of side-scan sonar and MBES can obtain more accurate measurement data than using each technique in isolation. However, the cost of operating this combined approach is high.
A low-cost method involves combining MBES with a dual-frequency differential high-precision Global Navigation Satellite System (GNSS) to superimpose the two data sets. Evaluation of vertical accuracy at orbital intersections and known depth positions has shown that the average square error is reliable and meets the highest standards for hydrographic surveys (Rowley et al., 2020). Obtaining a more extensive range of DEM data is typically time-consuming, expensive, and complicated. The method of combining LiDAR with MBES has also been extensively studied and has been shown to produce more accurate data than using MBES alone (Do et al., 2020; Lebrec et al., 2021).
2.3 Side-scan sonar (SSS)
SSS generates images that intuitively reflect the underwater microtopography (Coiras et al., 2007). The intensity of the seabed echo can be used to qualitatively analyze the composition of the seabed (Wu et al., 2021). SSS can be classified into ship-borne and towed types. While USVs can tow the SSS, they are affected by ocean currents during actual work, and the tow attitude varies greatly. AUVs can be used as ship-borne carriers and adjust the heading in real-time to improve the SSS’s attitude effectively. SSS has the advantages of low cost, high resolution, and continuous acquisition of two-dimensional seabed images, and the performance parameters of two SSS products are shown in Table 3. However, because the towed SSS’s body must be as close to the seabed as possible, the detection efficiency is low (Wu et al., 2021). Therefore, several noteworthy features of SSS are:
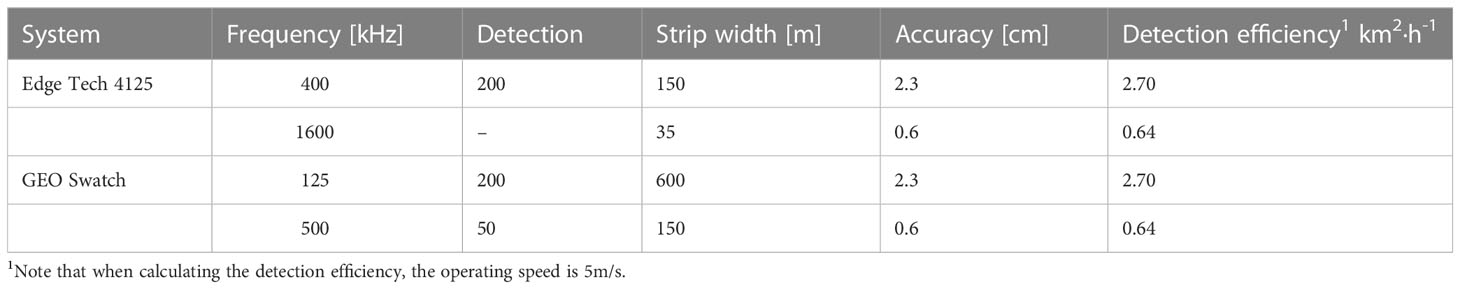
Table 3 Side-scan sonar systems.
1. Underwater positioning: The issue of achieving high-precision underwater positioning of a SSS has not been effectively resolved. The traditional method uses GPS or ultra-short baseline (USBL) systems to determine the tow’s position. Wu et al. (2021) analyzed the impact of speed on tow body positioning and developed a correction model to improve the accuracy of GPS positioning. Le Bas and Huvenne (2009) analyzed the impact of calibration and environmental errors on ultra-short baseline positioning. Sahafi (2013) discussed terrain mapping using AUVs equipped with sonar instruments and used USBL to improve the accuracy of long-term underwater navigation. Researchers have suggested that an AUV based on the long baseline (LBL) and integrated with multiple sensors can achieve more precise terrain detection (Thompson et al., 2001; Melo and Matos, 2017).
2. Image processing: Image processing is required to denoise the side-scan image after noise estimation. Zhou et al. (2015) verified the noise reduction effect of the wavelet function, and compared with functions such as median filtering, the smoothness and edge preservation effects are better. Huang et al. (2020) used the curvelet transform to process side-scan sonar images, and the effects of noise reduction and edge preservation were better than those of the wavelet transform. Aiming at the problems of low segmentation efficiency and poor accuracy, a neutrosophic set (NS) algorithm and quantum particle swarm optimization (QPSO) algorithm was proposed (Jianhu et al., 2016; Zhao et al., 2016). To avoid the influence of noise, researchers found that the improved Ostu algorithm can quickly extract the noise (Yuan et al., 2016). To enhance the applicability of image segmentation, researchers used bidimensional empirical mode decomposition (BEMD) and Gaussian-Markov random field (GMRF) texture to improve the clustering algorithm (Ye et al., 2011).
2.4 Gravity satellite altimeter (SA) bathymetry
The altimeter measures the height of the ocean surface, which is influenced by the underlying topography rather than the ocean’s depth. Satellite gravity measurements can provide large-scale gravity data, offering an opportunity to study the seafloor’s structure (Guan et al., 2016). However, this type of bathymetry data has a considerably lower horizontal resolution than ship-borne bathymetry measurements, resulting in inherently uncertain depth estimates. In an ideal deep ocean strip, the horizontal resolution can be as small as 6-9km (Watts et al., 2006). In this section, we discuss the various applications and limitations of satellite altimeters in bathymetry
Satellite altimeter missions, such as ERS-1 and ERS-2 from the European Space Agency, and TOPEX/Poseidon, Jason-1, Jason-2, and Jason-3 from NASA, as well as CryoSat-2 from the European Space Agency, have provided valuable data for bathymetry estimation (Ablain et al., 2017; Shu et al., 2021). These missions have extensively gathered data on sea surface heights, which can be utilized to calculate gravity anomaly grids and estimate seafloor topography.
Estimating bathymetry from satellite altimetry data involves several techniques that aim to derive seafloor topography by analyzing underwater terrain variations.
1. Retracking: The method involves analyzing the radar altimeter waveform to determine the precise time delay between the satellite and the underwater terrain. The height can be calculated by measuring this delay, and this value can be used to estimate the seafloor topography. Due to potential interference from noise and other factors, retracking algorithms have been developed to enhance the accuracy of bathymetric data (Deng and Featherstone, 2006).
2. Estimation: Dense satellite gravity data is often used by researchers to complement sparsely available sounding data in remote regions, thus providing additional details in areas where no sounding data is available (McMillan et al., 2009). To evaluate the uncertainty of satellite data, the Monte Carlo method is commonly employed (McMillan et al., 2009). The availability of free satellite data enables researchers to generate various bathymetry maps promptly
3. Submarine Topography and Sediment Structures: Submarine topography covered by sediments, which are not visible in soundings, can be revealed by satellite gravity measurements (Guan et al., 2016). In a particular study, researchers projected satellite bathymetry data obtained from ocean gravity measurements onto a vertical grid to produce a precise three-dimensional model of the Mendocino fault zone (Kim and Wessel, 2016).
4. Deep Learning Applications: According to recent research, when combined with satellite data, deep learning can accurately estimate ocean depths under various simulation scenarios. Multiple data sources, such as variations in sea surface height, gravity anomalies, and other geophysical or oceanographic parameters, can be incorporated into these methods to forecast seafloor topography. Sophisticated algorithms, including deep learning, neural networks, and random forests, are employed to model complex relationships between input data and seafloor depths, resulting in better bathymetry estimates (Jena et al., 2012; Annan and Wan, 2022).
5. Combining Satellite Data and ship-borne bathymetry: By combining comprehensive satellite and multi-beam bathymetry data, researchers have determined bathymetry and structural trends, measured seamount heights, calculated seamount base areas and volumes, and constructed large-scale submarine bathymetry maps (Rodrigo et al., 2014). In a separate study, the Gravity Geological Method (GGM) was utilized with shipborne bathymetry data to enhance the accuracy of bathymetry measurements (Kim and Yun, 2018).Further research is necessary for different water types to draw definitive conclusions regarding the requirements and limitations of this method for estimating bathymetry.
Global and regional bathymetric models, including the GEBCO (General Bathymetric Chart of the Oceans), SRTM30_PLUS, and ETOPO1, have been developed using these methods. These models provide valuable information on seafloor topography in areas where direct measurements are scarce or unavailable. Despite providing valuable information on seafloor topography, gravity satellite altimeter bathymetry has some limitations, including:
● Resolution: Gravity satellite altimeter bathymetry generally has a lower spatial resolution than direct measurement methods, such as multibeam echo sounders. This limitation makes it less suitable for applications that require high-resolution bathymetric data, such as detailed seafloor mapping or habitat studies.
● Accuracy: The accuracy of gravity satellite altimeter bathymetry can vary based on several factors, including the density of the altimetry data, the quality of the inversion method, and the local geophysical properties of the seafloor.
● Sensitivity to Sediment Thickness: In areas with thick sediment layers, the gravity anomaly signal from seafloor topography can be obscured, resulting in reduced accuracy in bathymetry estimation.
Despite these limitations, gravity satellite altimeter bathymetry remains valuable for acquiring seafloor topography information in remote or poorly surveyed areas, supplementing other bathymetric data sources and methods.
2.5 Air-borne LiDAR bathymetry (ALB)
Air-borne LiDAR bathymetry has several advantages over sonar ship-borne detection technology, including high precision, a large investigation range, high point cloud density, high efficiency, low cost, and high mobility (Hilldale and Raff, 2008). Furthermore, the maximum detection depth is 90 m, the accuracy is less than 0.30 m, and the maximum measurement density can reach 0.12×0.12 m (Guenther, 2007).
In the late 1970s, the Swedish National Defense Research Institute successfully developed an air-borne FLASH laser-sounding system with a detection depth of 35 m (Wehr and Lohr, 1999). The Optech company developed the SHOALS 200 (Scanned Hydrographic Operational Airborne Lidar Survey) submarine geomorphological mapping system, which was mounted on a helicopter for actual measurement (Irish and Lillycrop, 1999). The detection source is a Nd: YAG laser, which can emit 0.532 µm green light and 1.064 µm infrared laser (Dubey and Yadava, 2008). In 2002, the Chinese Academy of Sciences developed a set of air-borne dual-frequency LiDAR (LADM-I) (Chen et al., 2003). The system has a depth measurement range of 0.5-50 m, a depth measurement accuracy of 0.3 m, a flight measurement accuracy of 0.25m, a flight height of 250-500m, a scanning width of 250m, a grid point density of 5 m × 5 m, and a horizontal positioning accuracy of 3 m (Chen et al., 2003). After that, the Shanghai Institute of Optics and Fine Mechanics of the Chinese Academy of Sciences continued to optimize the system and successfully developed a new LiDAR Mapper5000 in 2017 (Xing et al., 2019). The vertical accuracy is 0.23m, the horizontal positioning accuracy is 0.26m, and the grid point density is 1.1m × 1.1m, significantly improving shallow water detection ability.
In September 2018, the ICESat-2 was launched, carrying the Advanced Topographic Laser Altimeter System (ATLAS), which can accurately measure water depth with high precision and is a new approach for global nearshore bathymetry (Neuenschwander and Magruder, 2016; Neumann et al., 2020). Although ATLAS was not designed specifically for bathymetry, its high-resolution elevation data can be valuable for mapping shallow water bodies, such as coastal areas, rivers, and lakes (Neuenschwander and Magruder, 2016; Neumann et al., 2020). Combining ATLAS data with other bathymetric datasets and techniques enables researchers to obtain more accurate and comprehensive bathymetric maps, contributing to a better understanding of underwater terrain and associated processes (Parrish et al., 2019). However, the applicability of ATLAS for bathymetry is limited by the penetration depth of its laser pulses (Forfinski-Sarkozi and Parrish, 2016; Parrish et al., 2019), and its performance is influenced by water clarity. As water turbidity increases, ATLAS’s ability to measure water depth decreases (Thomas et al., 2021). Therefore, ATLAS is most effective for bathymetry in clear, shallow waters, and its utility in deeper or turbid waters is limited.
Table 4 shows the commonly used airborne LiDAR bathymetry (ALB) systems, which have broad application prospects for acquiring high-precision and high-resolution underwater topographic and geomorphological data in shallow waters, especially offshore. However, further breakthroughs are necessary for key technologies to improve detection accuracy and meet the basic requirements of the IHO S-44 standard and the actual needs of detection tasks.
1. Precise positioning and orientation: The precise positioning and orientation of detection points by ALB is achieved using high-precision aerial remote sensing Position and Orientation Systems (POS) (Wang et al., 2013). These systems include the Symmetrical 8-point vibration-damping and inertial-sensitive component structure with time delay compensation method (Cheng et al., 2014), the tightly coupled navigation system using pseudo-range and pseudo-range rate (Iqbal et al., 2013), and the forward and backward smoothing algorithm suitable for the close combination of Precise Point Positioning (PPP) and Inertial Navigation Systems (INS) (Gu et al., 2021).
2. Wave and tidal correction: Various methods for wave and tidal correction have been developed, including tidal constituent and residual interpolation (TCARI) (Brennan et al., 2005) and inertial navigation-aided correction methods (Stammer et al., 2014). These methods aim to solve the issue of converting between the instantaneous sea surface and the depth reference level by using the mean sea level elevation to calculate the seabed elevation of the detection point and improve the detection accuracy.
3. Errors: Analyzing and correcting detection data errors is crucial for obtaining high-precision and high-resolution underwater topographic information. Previous studies by Hilldale and Raff (2008) and Eren et al. (2018) have focused on depth reduction technology, providing a reference for evaluating detection accuracy.
4. Multi-source data: When processing detection data, it is essential to compensate for multi-source data, including coverage detection at the edge of the route, segment detection at different times, and combined detection from various equipment to improve overall detection accuracy (Gao et al., 2019).
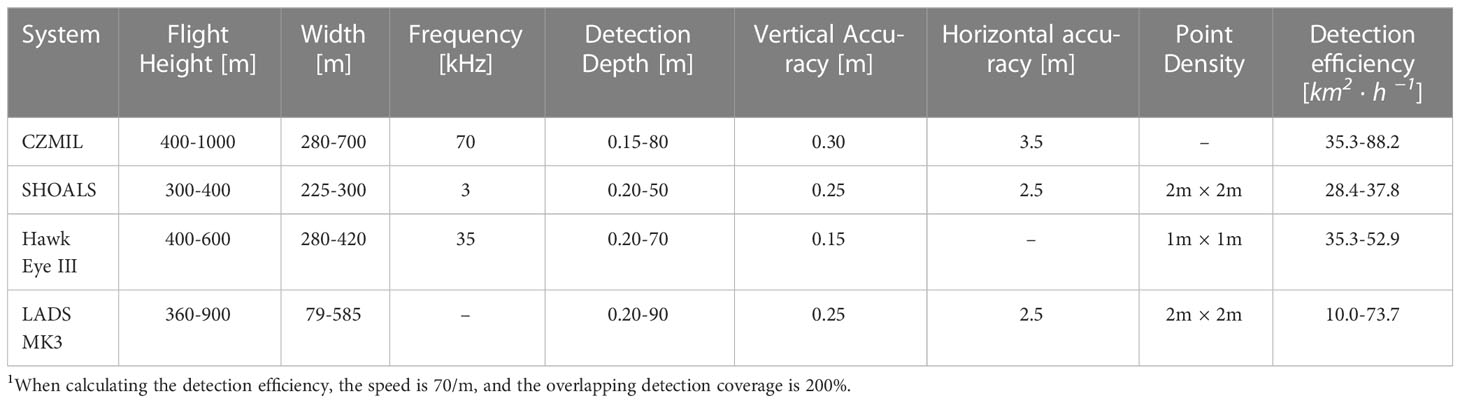
Table 4 Air-borne LiDAR bathymetry systems.
2.6 Bathymetry inversion based on remote sensing imagery
Bathymetry technology based on remote sensing images includes two detection technologies: synthetic aperture radar and optical image information.
2.6.1 Synthetic aperture radar (SAR)
Table 5 presents commonly used Synthetic Aperture Radar (SAR) systems. A corresponding relationship exists between shallow sea topography and SAR images in Ka-band air-borne side-view radar images (Barr, 1969). Subsequently, extensive SAR data, including underwater terrain, have been used to conduct research from three aspects: (1)the relationship between SAR image information and radar and detection environment factors (Henderson, 1995; Henderson and Xia, 1997), (2) the theory of underwater terrain SAR imaging mechanisms (Alpers and Hennings, 1984), and (3) imaging experiments (Schuler et al., 1996). To address the AH model’s shortcomings, which only considers first-order disturbance and constant relaxation time while ignoring the advection term, various improved models have been proposed, such as the SLM model (Bourqui et al., 2008), the HSM model (Wang et al., 2016), LB model(Dong et al., 2019), and the BRM and GBRM models (Cooper et al., 1994).

Table 5 SAR.
Research has shown that the P-band is the most suitable band for underwater terrain detection, followed by the L-band, while the C-band is slightly better than the X-band (Pereira et al., 2019). The difference in radar polarization is not significant, and the VV polarization is slightly more robust than the HH polarization (Fan et al., 2008). SAR can measure water depths up to 100-200 meters regarding considerable underwater terrain slopes. The underwater terrain that can be obtained from SAR images depends on the height of the underwater terrain.
2.6.2 Optical image
Optical Satellite-Driven Bathymetry (SDB) is a method used to estimate water depth by analyzing remotely sensed data from satellites equipped with optical sensors. The process involves analyzing the changes in light properties as it interacts with the water column and the seabed. This technique works on the principle that the color of the water’s surface can indicate its turbidity, which is related to its depth. By analyzing the color of the water surface in satellite images, it is possible to estimate the water depth and bottom topography.
Multispectral and hyperspectral SDB methods differ in the number of spectral bands and the satellite sensors’ spectral resolution. Both types of sensors have been employed for SDB applications, and their differences have implications for the accuracy and applicability of SDB techniques (see Table 6).
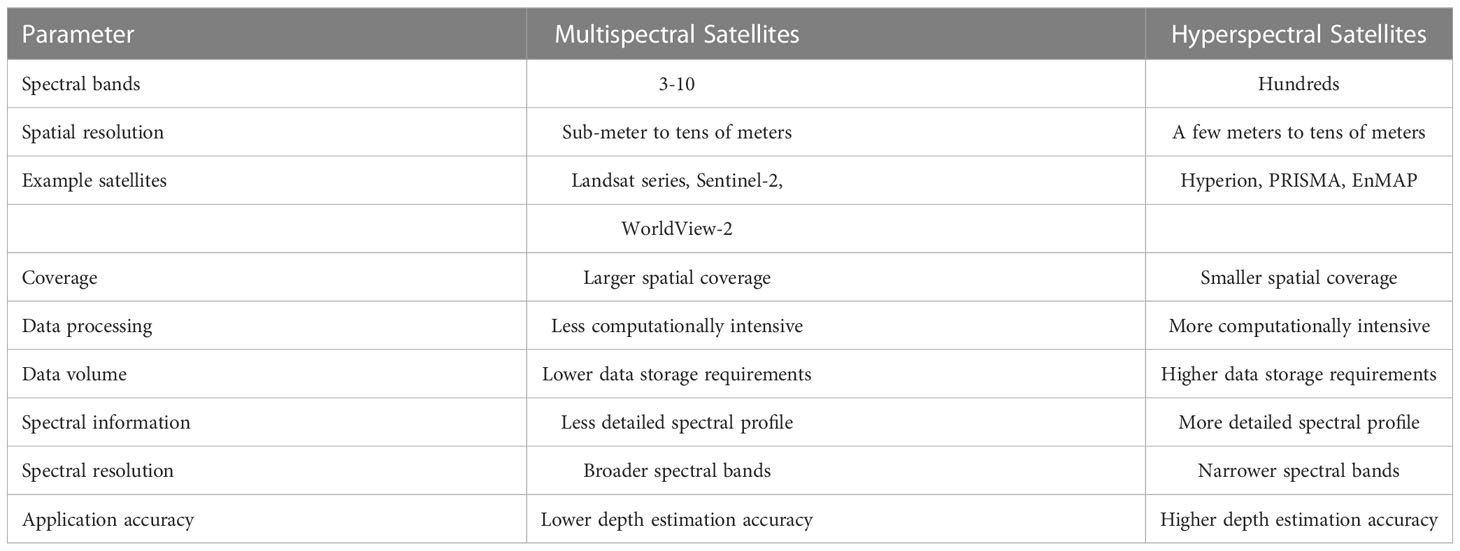
Table 6 Comparison of multispectral and hyperspectral SDB satellites.
Table 7 lists the comparison of Multispectral and Hyperspectral SDB algorithms, and factors such as water clarity, bottom type, atmospheric conditions, and satellite sensor characteristics can influence their performance. When selecting an SDB algorithm, it is important to consider the application’s specific needs, the availability of ground truth data for calibration, and the potential trade-offs between simplicity and accuracy.
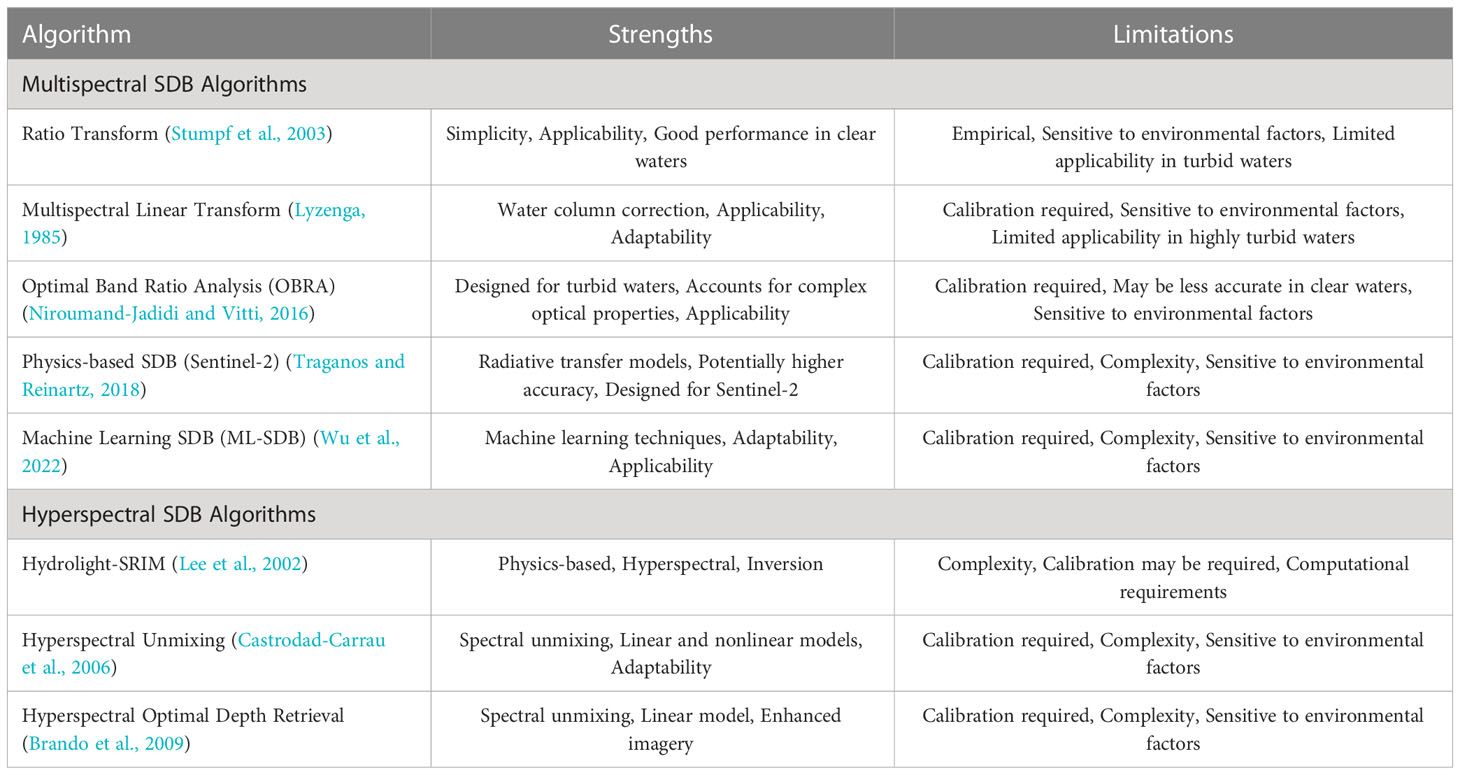
Table 7 Summary of multispectral and hyperspectral SDB algorithms.
3 DEM data interpolation
Interpolating water depth data is essential for obtaining higher-resolution Bathymetric Digital Elevation Models (BDEMs) or for smoothing current BDEM topography information. While interpolation methods used for terrestrial Digital Elevation Models (DEMs)can be applied to BDEMs, differences in data acquisition and underwater environments must be considered. When using SBES to obtain water depth data, the choice of interpolation method becomes crucial. Studies have shown that error, accuracy, and data quality are three important indicators for verifying interpolation quality, as proposed by Wood and Fisher (1993). Therefore, different interpolation methods have been extensively studied under various conditions by researchers (Polidori and Chorowicz, 1993; Erdogan, 2009; Heritage et al., 2009; Hu et al., 2009; Drouin and Saint-Laurent, 2010; Zhang, 2013; Shi et al., 2014).
3.1 Traditional interpolation algorithms
Table 8 shows the summary of commonly used interpolation methods for DEM data. Previous studies have shown that interpolation methods commonly used for terrestrial DEM can also be applied to BDEMs (Amante and Eakins, 2016; Diaconu et al., 2019). However, it is crucial to consider the differences in data acquisition and underwater environments when selecting an appropriate interpolation method. This section provides a comprehensive review of different interpolation methods for DEM data. The requirement for DEM interpolation was first proposed by Wood and Fisher (1993), and error, accuracy, and data quality are three critical indicators used to assess the quality of the interpolation.
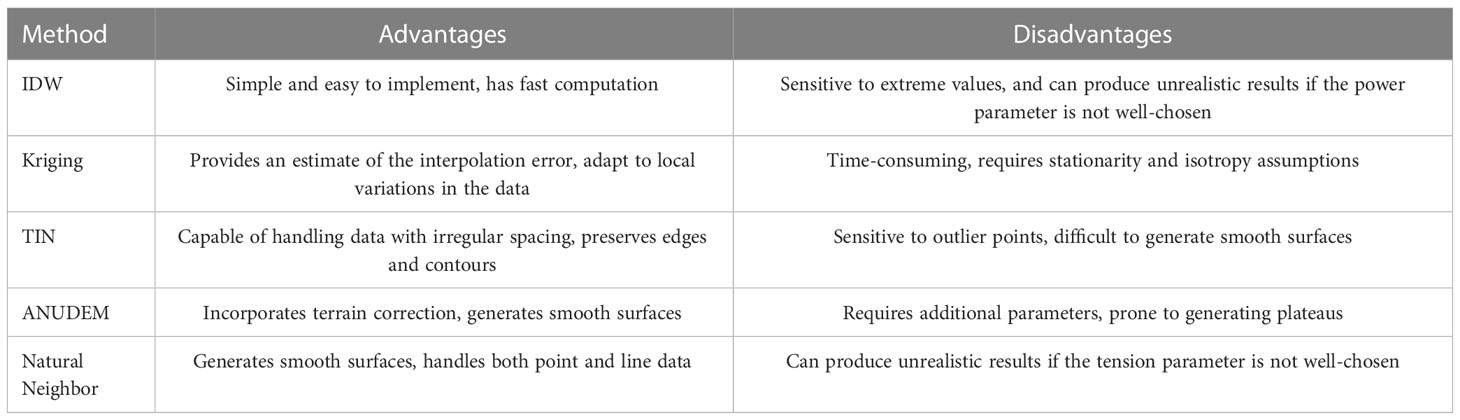
Table 8 Summary of interpolation methods for DEM data.
In a study by Zhang and You (2010), the interpolation parameters of the distance-weighted interpolation method were analyzed, and the RMSE of the generated DEM was measured. The study concluded that the weighting index and accuracy of the interpolated data are positively correlated. In contrast, the search points involved in the interpolation calculation and the accuracy of the interpolated data are negatively correlated. Regarding the uncertainty of seabed topography, Rishikeshan et al. (2014) found that the IDW method performs better in flat and slope areas, while the natural neighbor (NN) method performs better in steep slopes and the whole area. Additionally, the choice of survey configuration significantly impacts the terrain’s accuracy rather than the interpolation method because unevenly collecting elevation data points will affect the interpolated surface and the final generated model (Santillan et al., 2016).
Zheng et al. (2016) proposed an improved ANUDEM interpolation method to address voids and anomalies caused by uneven measurement coverage. This method incorporates the idea of terrain correction, which is highly correlated with the topological structure of multi-scale DEM contours. Liu et al. (2017) proposed a new plane correction/removal algorithm, which can effectively remove/correct the terrain plane and create a flat-free DEM. To solve the problem of severe surface distortion caused by interpolation in areas lacking terrain data, Wang et al. (2021) proposed a strategy combining high-accuracy surface modelling (HASM) with classic interpolation methods to construct a DEM.
When the selection of interpolation points contains many adjacent points, the root mean square error (RMSE) may not be sensitive enough to detect topographical differences (Zhu et al., 2019b). As a result, interpolating large-scale DEM data has become another research direction in recent years. Habib et al. (2020) used various graphs to represent DEM and employed a cross-validation method to compare and verify each interpolation. The study found that the ANUDEM and TIN models were similar and significantly better than the IDW model.
Different interpolation algorithms can significantly impact the accuracy and efficiency of large-scale interpolations. Therefore, it is essential to carefully choose the appropriate algorithm based on the specific characteristics of the interpolation scene, including the terrain type, initial data density, and distribution mode. These factors can affect both the accuracy and computational efficiency of the interpolation (Tu et al., 2020). However, traditional methods may not be able to handle the non-linear errors in elevation for large-scale datasets such as SDB and satellite LiDAR (Salah, 2021).
Increasing the sampling density improves the accuracy of the generated DEM and increases the raster resolution (Zhu et al., 2019b). However, surface reconstruction of scattered data is an ill-posed problem, and as the number of sample points increases, most calculation algorithms become too time-consuming (Kim et al., 2016). Kriging methods with low-resolution DEM data are preferred for underwater terrain as they provide superior terrain roughness accuracy (Zhang et al., 2015). Kalimuthu et al. (2016) found that ordinary kriging (OK) and general kriging produced an average absolute difference of 13.99m and 13.95m, respectively, when generating high-resolution DEM from low-resolution data. This indicates that interpolated DEM generated from low-resolution data can be used for low-cost underwater modelling research when high-resolution DEM collection is required.
3.2 Interpolation algorithms with machine learning
Traditional DEM interpolation algorithms take input from given sampling points and calculate missing points one by one based on local terrain similarity without considering the overall terrain change trend (Hao et al., 2021). In contrast, Bagheri et al. (2014) optimized sample interpolation using a combination of genetic algorithm (GA) and artificial neural network (ANN). Results demonstrate high potential for AI methods in elevation interpolation. Chen et al. (2016) proposed the robust multi-quadratic (MQ) algorithm o reduce the impact of outliers on DEM construction while preserving specific details, unlike traditional interpolation methods such as NN and OK. Meanwhile, Hao et al. (2021) connected the unknown elevation points of the entire calculation area and introduced terrain change trend features into the DEM construction process to achieve morphological consistency with the actual terrain surface.
Most traditional methods are unable to deal with non-linear elevation errors in large-scale data. To address this limitation, an artificial neural network (ANN) classification model is used to correct DEM data, reducing the RMSE of the interpolated elevation by 45% (Salah, 2021). Recently, generative adversarial networks (GANs) have proven more effective than traditional methods. While the convolutional neural network (CNN) method provides better quantitative accuracy, the technique based on GAN produces better visual quality under complex terrain (Yan et al., 2021).
4 Case study 1: accuracy evaluation of bathymetry models
The study area in the northern Gulf of Mexico (longitude 93°W - 91°W, latitude 28°N - 25°N) was selected (Figure 1A). ETOPO, GEBCO, and SRTM are existing water depth models based on a fusion of ship survey (sonar) and satellite bathymetry data. To evaluate the accuracy of ETOPO1, GEBCO2022, and SRTM15+V2.3 in the study area, SBES ship survey data provided by NOAA were selected as reference values (Figure 1B).
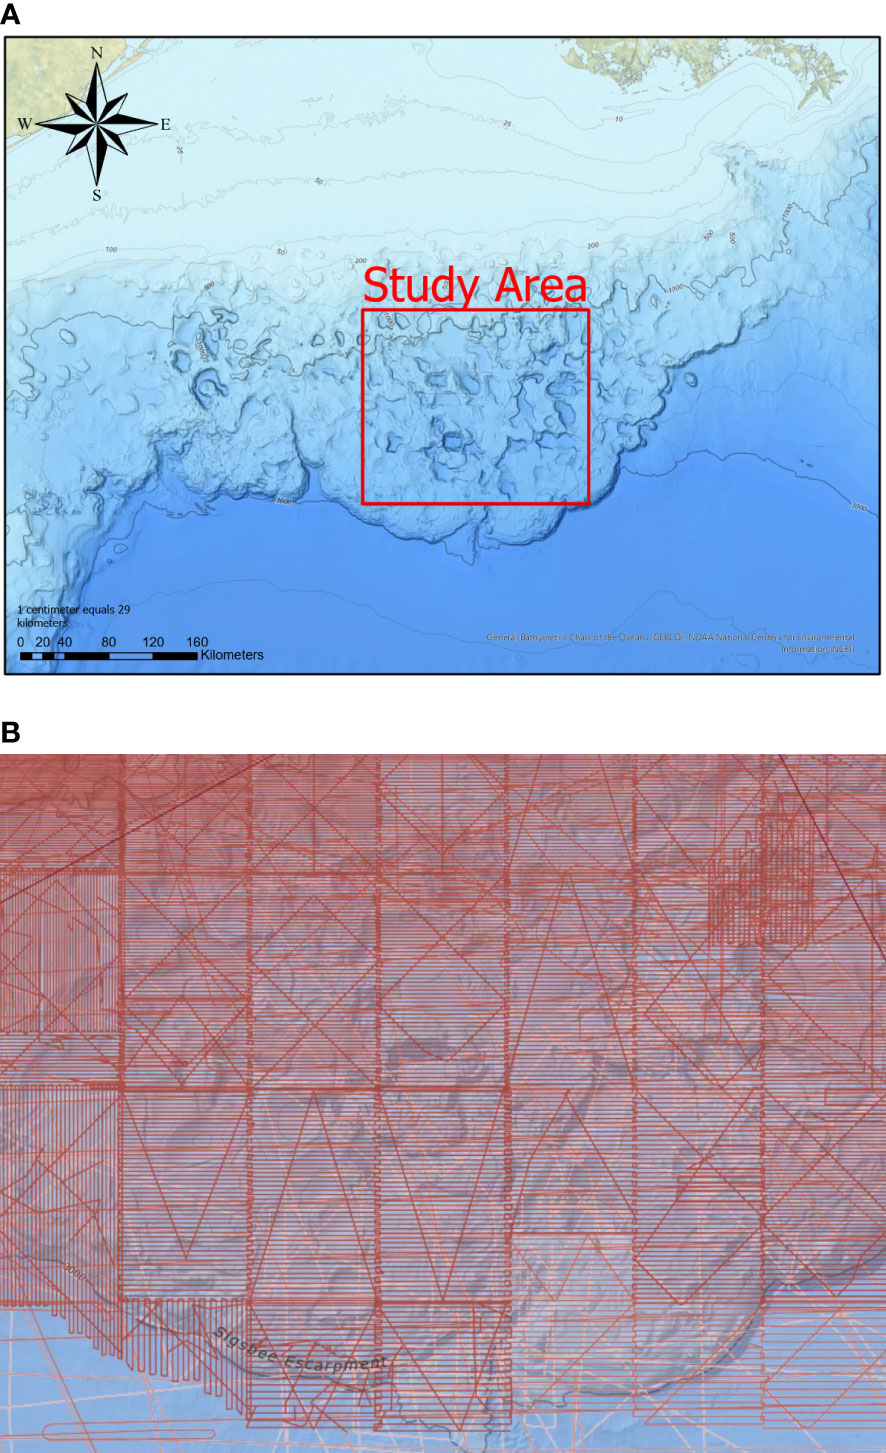
Figure 1 The study area was selected in the Gulf of Mexico. (A) Study area(longitude 93°W - 91°W). (B) SBES bathymetric data point distribution map (from NOAA).
Table 9 summarizes bathymetry information on three models and SBES points in the study area. The average water depth in the study area is approximately -1624 m, with a standard deviation of around 1345 m. The error statistics on SBES exclude points over three times the mean error value. After calculating deviations between three models and SBES, GEBCO_2022 has the smallest systematic error, with a mean deviation of -2.840 m, a mean absolute deviation of 29.667 m, and a standard deviation of 34.177 m. SRTM15+V2.3 has a mean deviation of -3.541 m and a standard deviation of error of 41.486 m, which is slightly worse than GEBCO_2022. The mean and standard deviation of ETOPO1 are higher than the other models. In comparing the accuracy between the models, ETOPO1 has the most significant deviation in both the mean and standard deviation of the difference compared to other models.
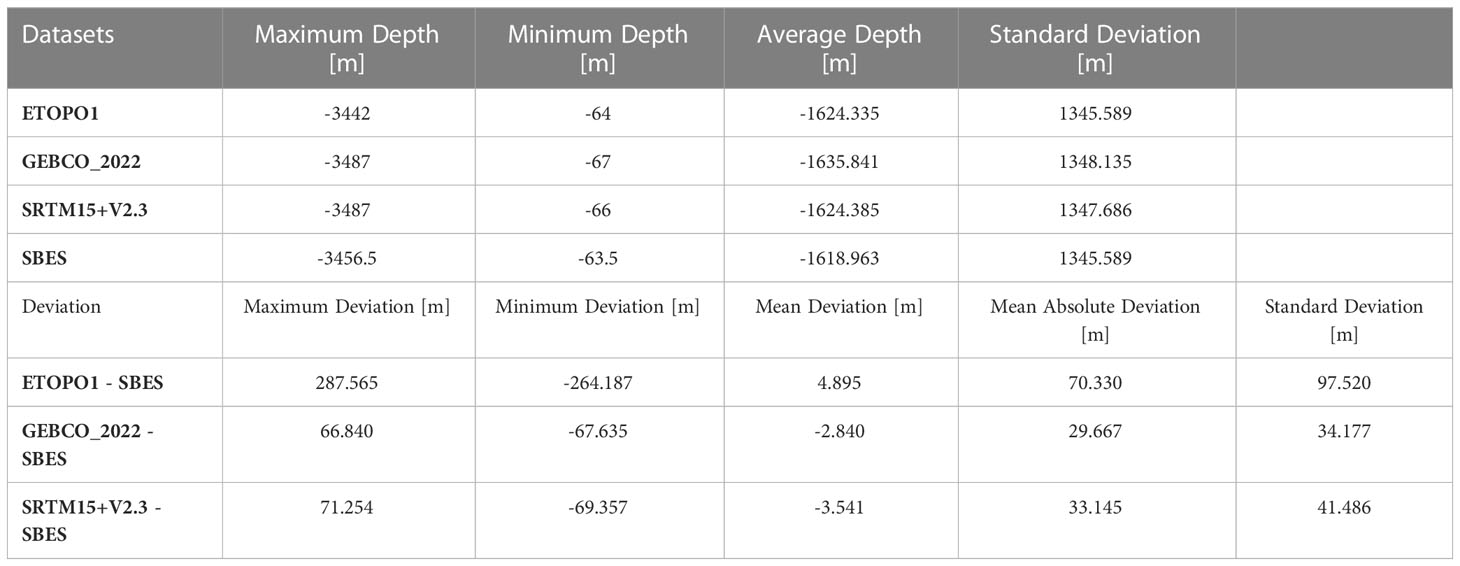
Table 9 Data statistics: bathymetry models and ship survey data.
Figure 2A displays statistics on the absolute value of the error. The data volume with an absolute error value less than 50 m in the ETOPO1 model is only 65.87%, while GEBCO 2022 and SRTM15+V2.3 have volumes of 99.21% and 98.88%, respectively. GEBCO 2022 achieves 86.42% when the absolute error value is less than 30 m. Figure 2B shows the standard deviation of each model in different water depths. ETOPO1 has the lowest accuracy in each water depth range, and the other two models have close accuracy. In general, GEBCO 2022 has the highest accuracy. The three models’ standard deviation shows a trend of decreasing first, then increasing, and then decreasing. The combination of Figure 2 and Table 9 indicates that the GEBCO_2022 model has the highest accuracy in the study area, followed by SRTM15+V2.3. ETOPO1, due to its earliest release time and the small amount of measured and satellite data used, has relatively large errors. These results are consistent with the experimental data conducted by Hao et al. (2022) in offshore China.
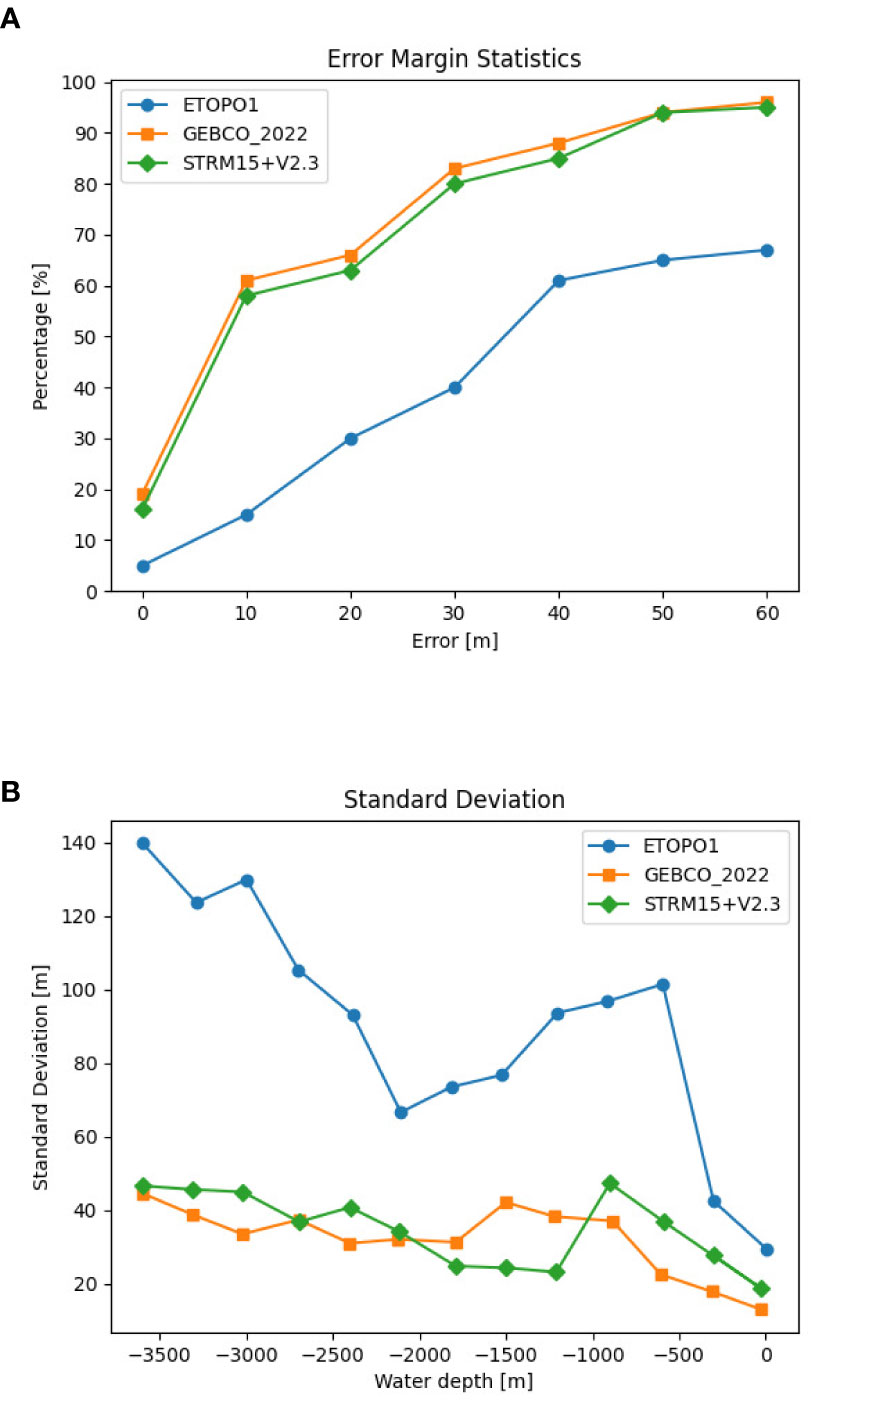
Figure 2 Errors and standard deviation. (A) Error margin statistics. (B) The standard deviation of each model in different water depths.
5 Case study 2: accuracy evaluation of DEM spatial interpolation algorithm for different underwater topography
The experiment selected three underwater areas with different landforms in the Gulf of Mexico, including hills (with an elevation difference of 80-300m), mountains (with an elevation difference of 300-600m), and mountain peaks (with an elevation difference of over 600m) (Figure 3). This study utilizes the sampling point analysis method to evaluate the accuracy of the interpolated BDEM data. The data used is from the BDEM of GEBCO_2022. Contour data with 50 m spacing is initially generated over the selected area, and these data are downsampled by a factor of four (downsample = 4). Finally, the accuracy gap between the DEM data obtained by interpolation using different methods and the original resolution BDEM is examined. This experiment ensures that the only variable was different interpolation methods. The parameter selection of various interpolation methods uses the default parameters in GIS software.
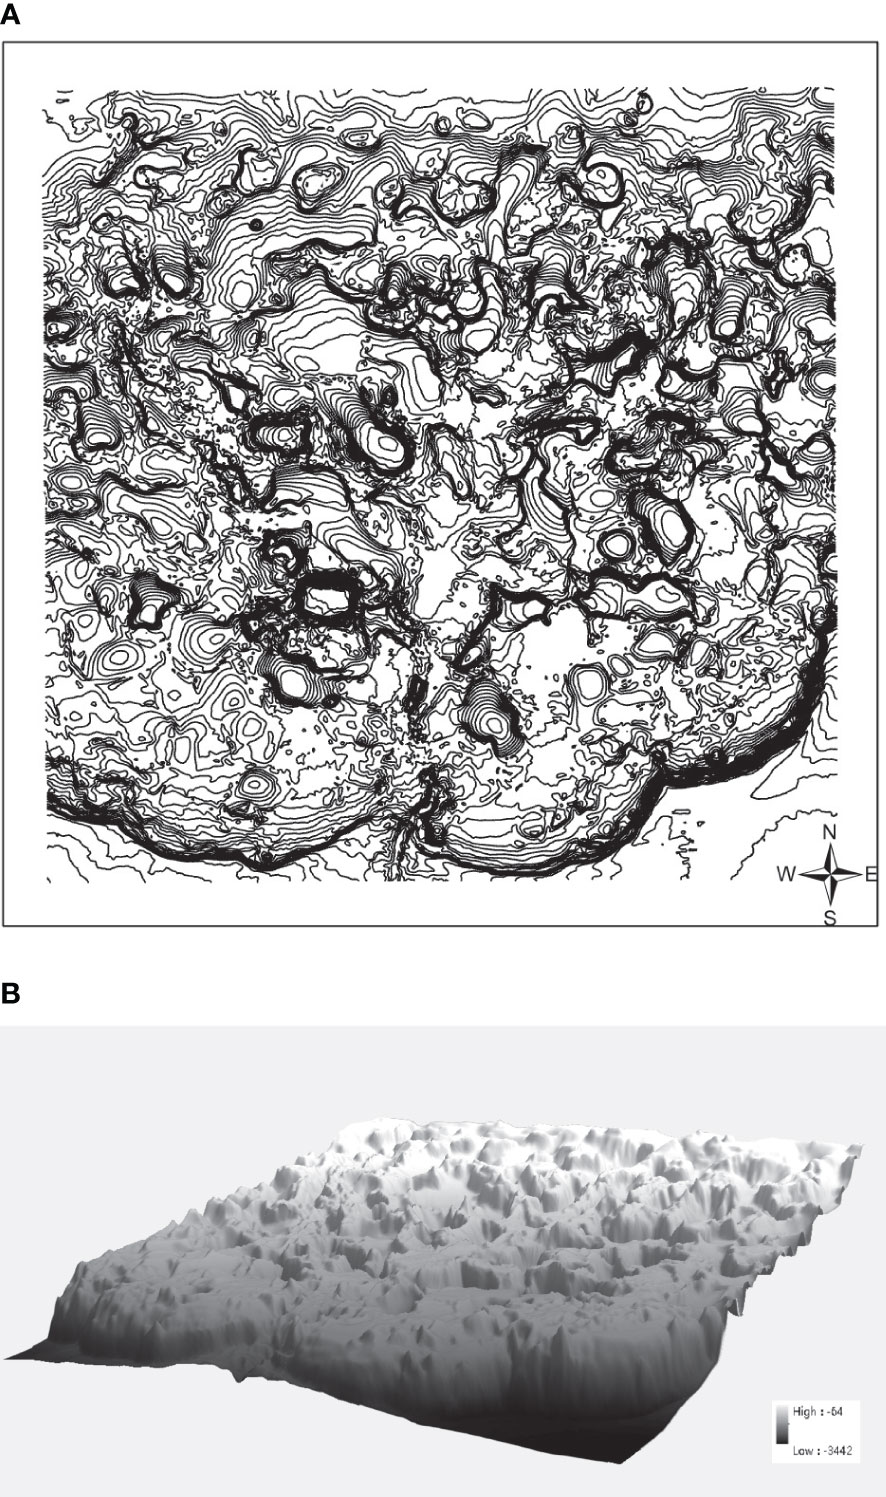
Figure 3 (A) Countour map of study area DEM (GEBCO 2022). (B) Study area 3D visualization.
5.1 Hilly landform area
The selected hilly landform has a minimum elevation of -887m and a maximum elevation of -362m (see Figure 4B). Thirty-two elevation checkpoints, uniformly distributed over the entire study area, were randomly selected on the original BDEM (see Figure 4A) to record the elevation values of each point as reference data for analyzing the BDEM accuracy after interpolation. Table 10 displays the average error, root mean square error, and fitting condition of the BDEM obtained by different interpolation algorithms. The ANUDEM interpolation algorithm is the most suitable for hilly landforms, with higher accuracy and a smaller elevation error. The IDW algorithm is second in accuracy but has a poor fit. The difference between Kriging and NN is smaller, and the accuracy is similar.
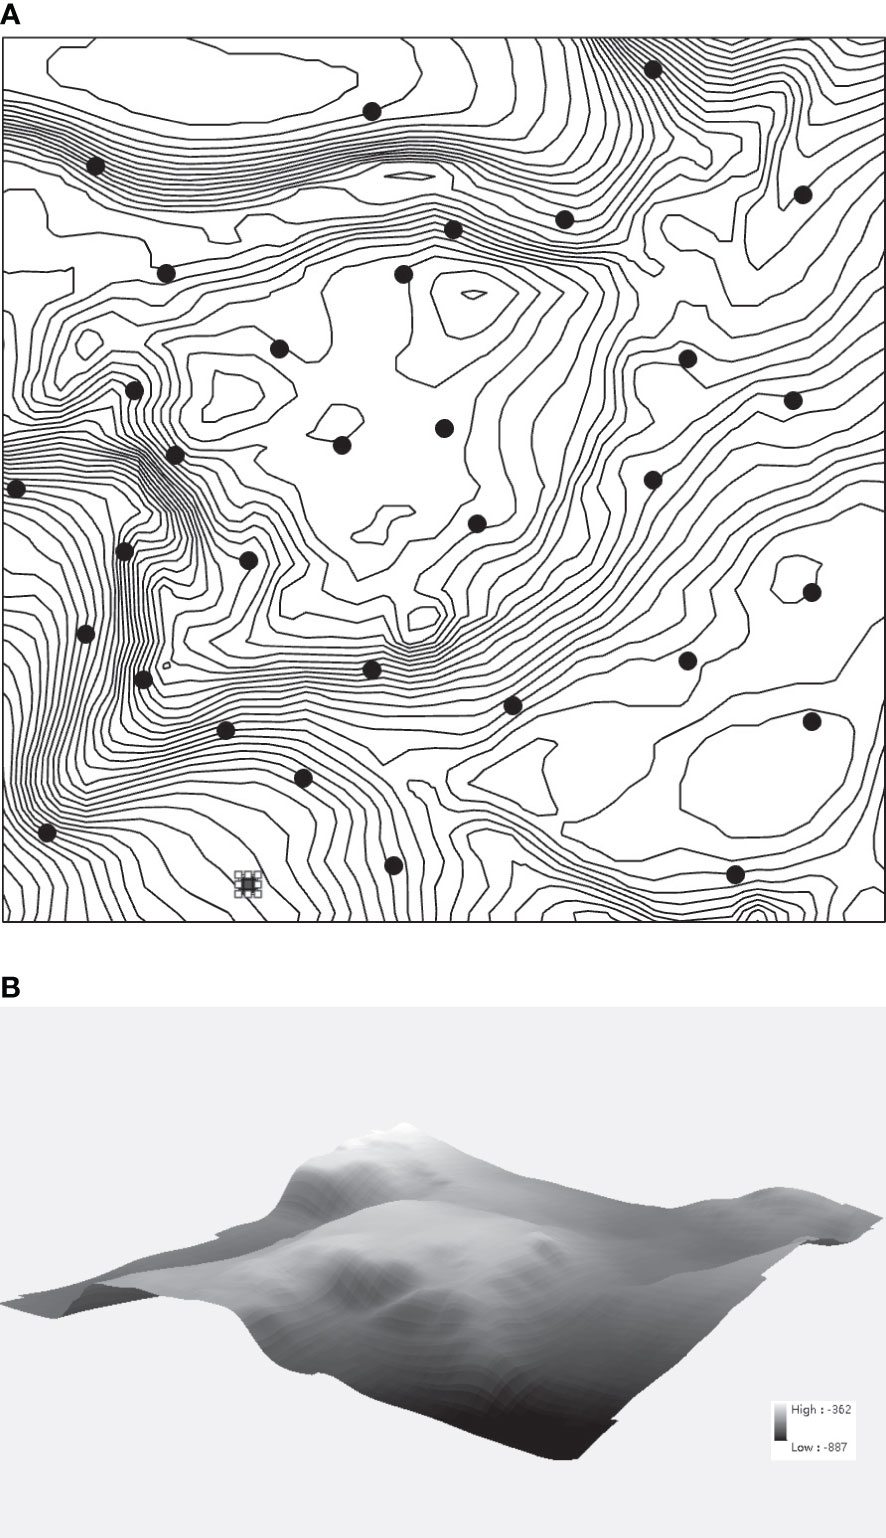
Figure 4 (A) Countour map and checkpoints. (B) Hilly area 3D visualization.
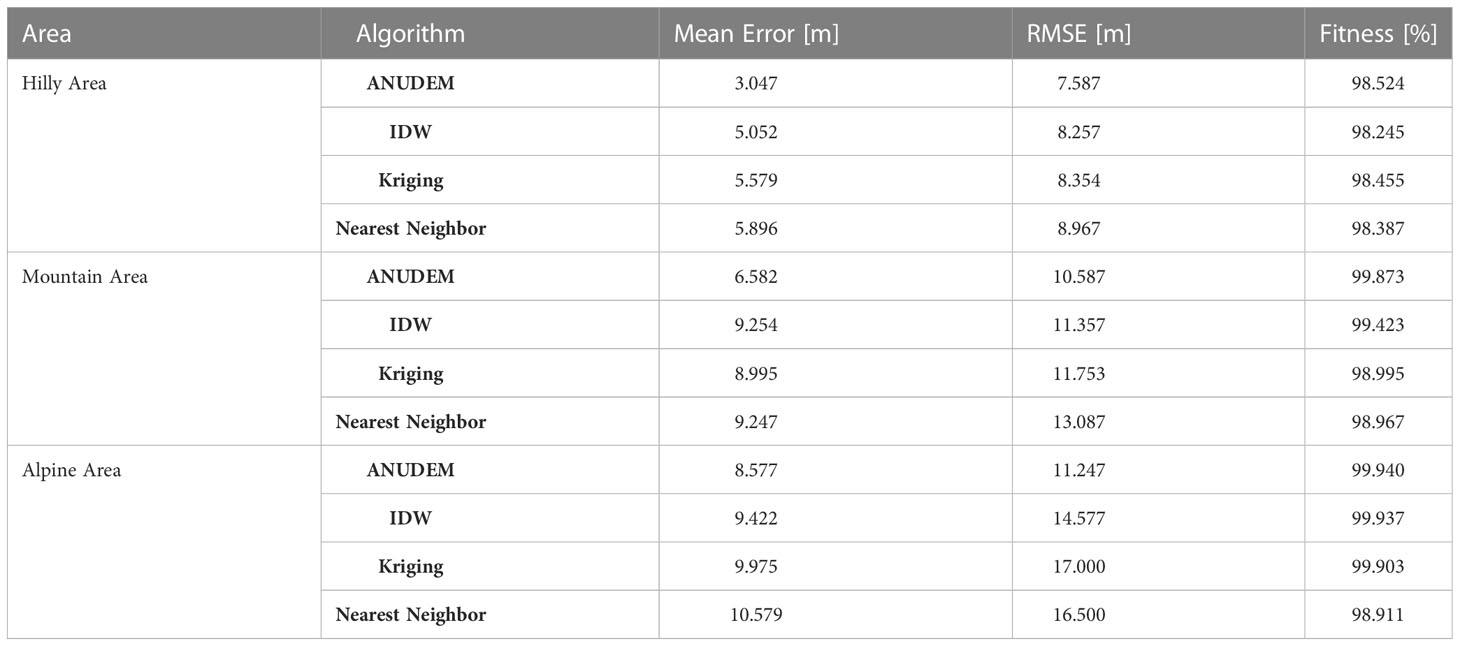
Table 10 Performance of four DEM interpolation algorithms.
5.2 Mountain landform area
A typical mountainous landform area with a 390m elevation difference is selected (see Figure 5B). Thirty-two elevation sampling checkpoints, evenly distributed throughout the study area, were randomly selected on the topographic map of the area (see Figure 5A). The elevation values of each point were recorded as reference data for comparative analysis of DEM accuracy.
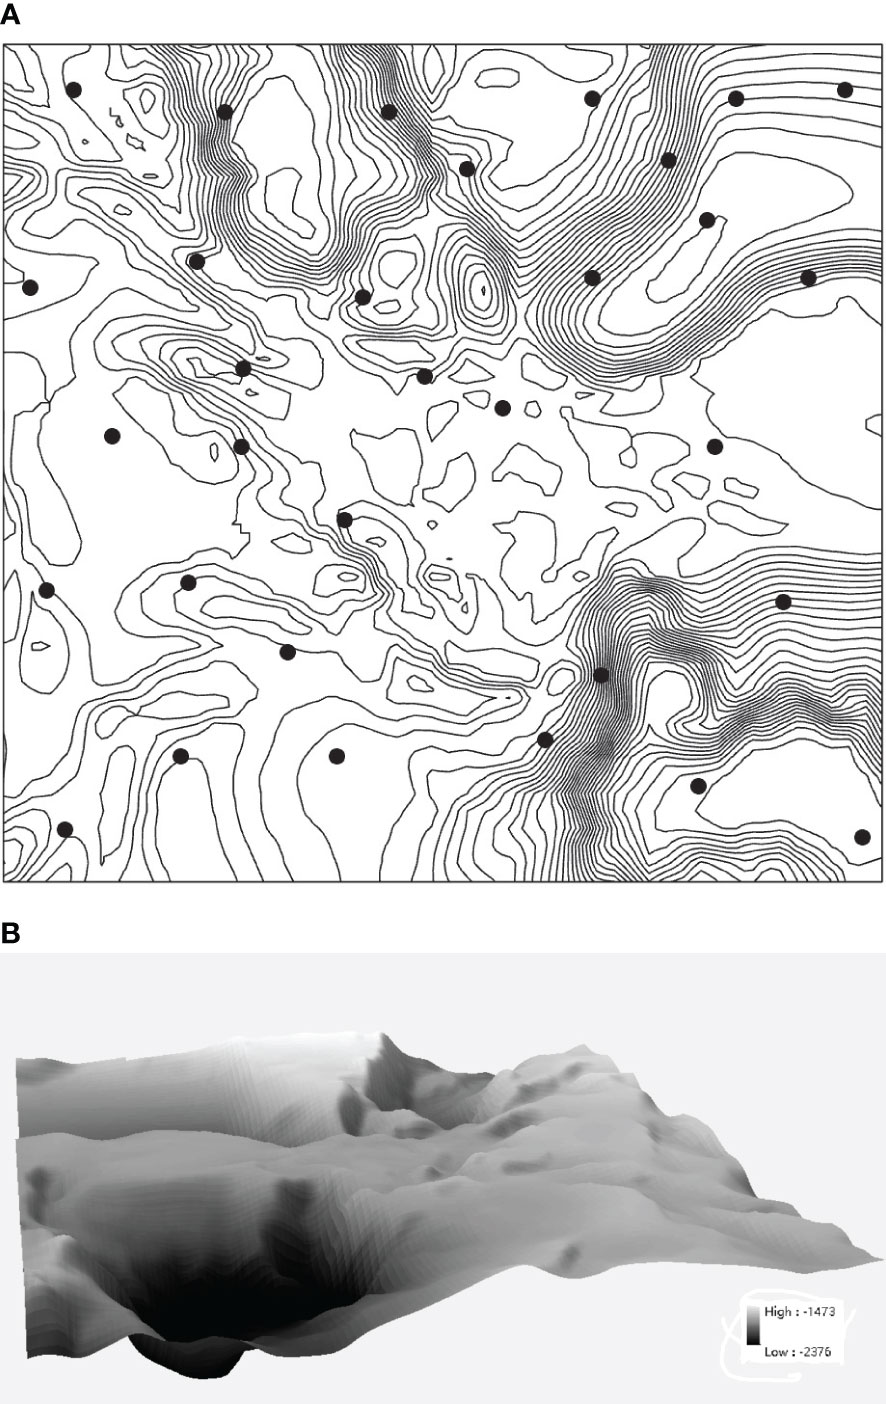
Figure 5 (A) Countour map and checkpoints. (B) Mountain area 3D visualization.
It can be seen from Table 10 that the RMSE of various interpolation methods is less than 11m. Statistics on the errors of various interpolations show that the error values of the ANUDEM algorithm are smaller than those of other methods, and the errors of other algorithms are relatively close. The results of the comparative analysis are similar to those in the hilly landform area; that is, the ANUDEM interpolation algorithm has the highest accuracy, all error indicators are small, and the fitting degree is also the highest. The second is the IDW algorithm, but its fit is poor. The error indicators of Kriging and the natural neighbor method have small differences and similar accuracy.
5.3 Alpine landform area
The selected alpine landform area for the test has an elevation difference of 1214m (see Figure 6B). Thirty-two elevation sampling points were randomly selected on the topographic map of this area to be evenly distributed throughout the entire study area (see Table 6A). Table 10 shows that the RMSE of each method is less than 19m.
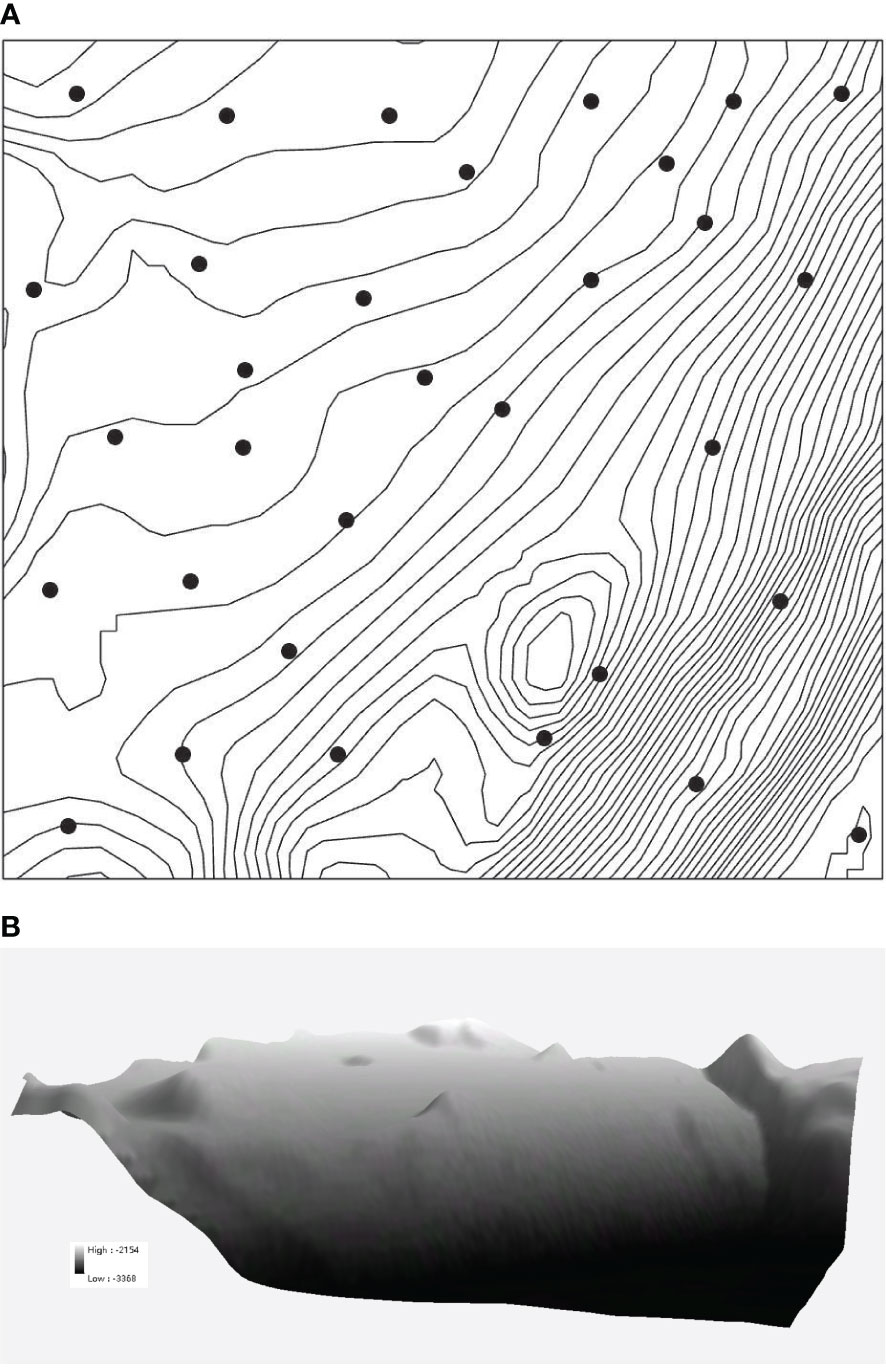
Figure 6 (A) Countour map and checkpoints. (B) Alpine area 3D visualization.
The error value obtained by the ANUDEM algorithm is smaller than the other three interpolation methods. The error values obtained by IDW, Kriging, and the natural neighbor methods are similar. Overall, the accuracy analysis results are similar to those of the hilly and mountainous landforms. The ANUDEM interpolation algorithm has the highest accuracy, with minor elevation errors in various indicators and the highest fitting degree. The DEM accuracies generated by IDW, Kriging, and the natural neighbor method are similar, and the IDW accuracy is slightly better than the other three algorithms.
Table 10 presents the results of the experiments of the four commonly used DEM algorithms in different terrains. The table shows that the ANUDEM algorithm can achieve better interpolation results under various terrain conditions. The IDW, Kriging, and Nearest Neighbor methods have different performances in dealing with different terrain conditions. However, the correlation between the error of the interpolation algorithm and whether the 3-D topographic map generated after interpolation matches the target terrain is not positive.
6 Discussion
6.1 Comparison of data acquisition techniques
This section aims to compare various data acquisition sensors, and their summaries are presented in Tables 11, 12. The assessment of these techniques is based on their suitability for different underwater environments, spatial resolution and coverage, as well as operational costs and complexity.

Table 11 Overview of different bathymetry sensors in marine and inland waterbody environments.
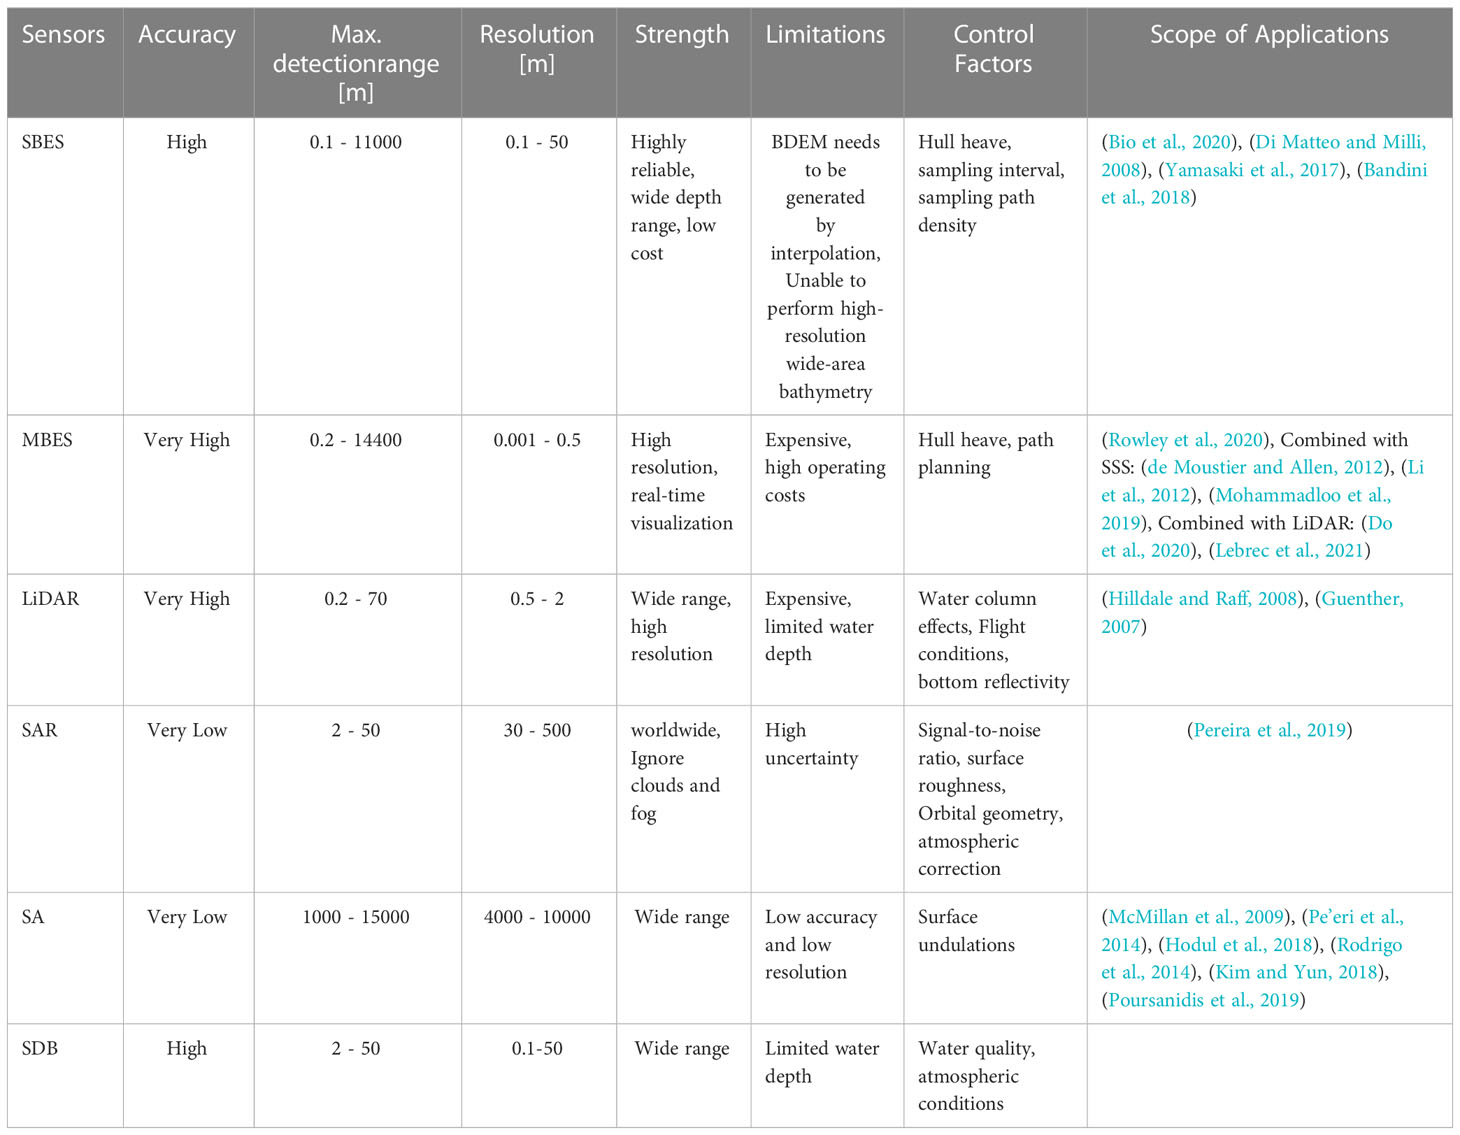
Table 12 Comparison of bathymetry sensors.
6.1.1 Suitability for different underwater environments
Table 11 provides a comparison of the effectiveness of various bathymetric data acquisition in marine and inland water bodies. Marine environments are characterized by vast areas with diverse underwater topography, water depth, and clarity, ranging from shallow coastal regions to deep ocean basins. Inland water body environments, on the other hand, have smaller spatial scales, shallower water depths, and more variable water clarity compared to marine environments Liu et al. (2020); Zhu et al. (2019a). Accurate bathymetry information is critical for understanding sediment transport, water quality, and ecological processes in both marine and inland water body environments Liu et al. (2020); Zhu et al. (2019a).
● SBES is best suited for small-scale marine surveys and targeted depth measurements, particularly in shallow coastal regions. It is also ideal for small-scale bathymetric surveys in inland lakes that require high-resolution and precise depth measurements. However, SBES is limited in deeper waters and regions with complex underwater topography, where it may miss critical features due to its narrow beam.
● MBES is versatile and can be used in various underwater environments, including shallow coastal areas and deep ocean basins. Its capability to collect data from multiple beams simultaneously provides better coverage and accuracy, making it suitable for mapping complex seafloors and larger inland lakes that require more extensive coverage and detailed underwater topography. It is ideal for mapping complex underwater topography and conducting large-scale surveys.
● Side-scan sonar is well-suited for mapping seafloor features and submerged inland lake features and detecting underwater objects across a wide range of water depths. It can provide high-resolution imagery of the seafloor, inland lakes, and reservoirs, making it useful for applications such as habitat mapping, underwater archaeology, and geological studies. However, it does not directly measure depth and requires additional processing or integration with other bathymetric data to derive depth information.
● Airborne bathymetry can compensate for the limitations of ship-borne sonar. Airborne LiDAR is well-suited for mapping shallow coastal environments, inland lakes, and intertidal zones. However, its efficiency decreases with increasing water depth, making it generally unsuitable for deep-water environments. Additionally, LiDAR’s performance is influenced by water clarity, which makes it less effective in turbid or murky waters. Nevertheless, the distribution of measurement points is uneven due to the influence of the flight path. While the LiDAR on ICESat-2 has excellent potential to measure the global nearshore water depth, the technology is not yet fully mature, and its accuracy is somewhat limited.
● Satellite gravity altimeters are limited by their lower resolution compared to other techniques. Nevertheless, they are ideal for mapping large-scale bathymetric features, such as mid-ocean ridges and deep ocean basins, and can provide valuable data for studying tectonic processes and large-scale ocean circulation patterns. However, gravity data are sensitive only to underwater topographic fluctuations in the wavelength range of 20-200 km and cannot distinguish severe topographic changes less than 2 km. While less useful for small-scale inland lake environments, they can still provide valuable information for large lakes and reservoirs where large-scale bathymetric features are of interest.
● SAR has the ability to image all-day and in all-weather, regardless of meteorological conditions, with high measurement efficiency and accuracy. It can be utilized for bathymetry of coastal and shallow waters and is most effective in calm and clear waters, where the interaction between radar waves and the water surface can reveal bathymetric information. Under appropriate conditions, SAR can supply significant bathymetric data for shallow lakes and support water quality monitoring and ecological assessments.
● Optical satellite-driven bathymetry is well-suited for mapping shallow and clear water environments. Its performance is influenced by water clarity and light penetration, making it less effective in deeper or turbid waters. Nevertheless, it can provide valuable data for coastal zone management, coral reef mapping, inland lake mapping, and reservoir environmental monitoring under suitable conditions.
6.1.2 Spatial resolution and coverage
SBES systems provide high-resolution depth measurements but have limited coverage due to their narrow swath width. This results in a lower overall data density, requiring more survey lines and longer survey time to achieve adequate coverage. SBES best suits small-scale bathymetric model surveys and targeted depth measurements in shallow water environments. MBES systems offer superior spatial resolution and coverage compared to SBES. By measuring multiple depth points simultaneously, enable faster and more efficient surveys, providing a more detailed and comprehensive representation of the seafloor. MBES is particularly useful for large-scale surveys and mapping complex underwater topography. Side scan sonar provides high-resolution imagery of the seafloor, with wide coverage that can be adjusted based on the altitude and range settings of the system. The quality and resolution of the images depend on factors such as frequency, range, and altitude, as well as the system’s processing capabilities. Airborne LiDAR has the advantage of rapid data collection over large areas, resulting in wide coverage and high-resolution datasets. Satellite gravity altimeters provide global coverage of the ocean floor, but their resolution is lower than other techniques. They are best suited for mapping large-scale bathymetric features and providing a broad overview of the seafloor’s general topography. While satellite gravity altimeters cannot provide the detailed data necessary for some applications, they are invaluable for studying tectonic processes and large-scale ocean circulation patterns. SAR bathymetry has limited spatial resolution and coverage compared to other techniques, with its performance dependent on environmental factors such as water depth, clarity, and surface conditions. Optical satellite-driven bathymetry can provide high-resolution bathymetric data in shallow, clear water environments. The coverage of optical satellite-driven bathymetry is determined by the satellite’s field of view and revisit time, making it suitable for large-scale surveys in favorable conditions.
6.1.3 Operational costs and complexity
SBES and side scan sonar systems are relatively simple to operate and maintain, making them cost-effective for small-scale surveys and shallow water environments. MBES systems have higher upfront costs due to the complexity of the equipment and software involved. However, the increased efficiency, coverage, and data quality offered by MBES can offset these costs in the long run. Airborne LiDAR can be expensive to deploy and operate, requiring specialized aircraft, sensor equipment, and skilled personnel. Its cost-effectiveness depends on the specific survey requirements and environmental conditions. Satellite-based techniques, such as gravity altimeters, SAR, and optical satellite-driven bathymetry, have lower operational costs but may have limitations in terms of resolution and accuracy, depending on the application.
6.2 The challenge of high-precision bathymetry
At present, gravity altimetry satellites have covered the whole world, and the inversion of ocean gravity data has the advantage of obtaining global bathymetry. Most of the published bathymetry models were constructed based on this technology. In addition, inversion requires certain prior information, so bathymetry inversion based on gravity data is more effective in open sea areas with ship bathymetry data constraints or flat seabed terrain.
Using satellite remote sensing to retrieve terrain can collect data on a large scale worldwide and obtain shallow sea areas that are difficult for survey ships to reach. However, it is currently only limited to sea areas shallower than 50 m, and remote sensing images are greatly affected by radar and spectrometer parameters and the marine environment. Matching ship bathymetry and hydrological conditions for verification can improve the accuracy of terrain inversion, but it is still in the scientific exploration stage.
6.3 Future trends
Altimetry satellite gravity data inversion of seabed topography is the main contributor to the current global terrain model products, and the proportion of ship bathymetry data is deficient. Although the results of gravity inversion of high-resolution seafloor topography models are limited, it will still be the primary method for fine modelling of global seafloor topography in the future until the use of sonar technology to complete global sea area surveys. As necessary auxiliary means for global submarine terrain information acquisition, ship-based sonar technology, ALB technology, and remote sensing image inversion technology will be further developed in various technical fields. Global seabed terrain detection generally presents a multi-source measurement situation, developing towards high-precision, high-resolution, high-efficiency, automation, intelligence, and clustering.
6.3.1 Emerging technologies in bathymetric data acquisition
Emerging technologies are expected to improve bathymetric data acquisition by enhancing the accuracy, resolution, and efficiency of underwater mapping.
1. Unmanned Surface Vehicles (USVs): USVs are autonomous or remotely-controlled surface vessels that can be equipped with various bathymetric sensors, including multi-beam echo sounders and LiDAR systems. USVs offer increased coverage, endurance, and reduced operational costs compared to traditional survey vessels, making them an attractive option for bathymetric data acquisition.
2. Swarms of Autonomous Underwater Vehicles (AUVs): The deployment of coordinated swarms of AUVs can lead to more efficient and rapid bathymetric data acquisition. By operating in parallel, AUV swarms can cover larger areas in less time, enabling high-resolution mapping of the seafloor.
3. High-resolution Satellite-derived Bathymetry (SDB): Advancements in satellite remote sensing technologies and image processing algorithms are expected to improve the resolution and accuracy of SDB. By combining multispectral data, machine learning techniques, and improved atmospheric and water column corrections, future SDB approaches may offer a cost-effective and efficient way to map shallow coastal areas.
4. Underwater LiDAR Systems: Emerging underwater LiDAR systems, such as blue or green laser systems, promise to enhance the accuracy and depth penetration of bathymetric data in clear or moderately turbid waters. These systems may provide higher-resolution data and improved performance in complex underwater environments compared to traditional acoustic methods.
5. Integration of Geophysical and Geospatial Data: The integration of bathymetric data with other geophysical and geospatial datasets, such as gravity, magnetic, and sub-bottom profiler data, can provide a more comprehensive understanding of the seafloor and its underlying structures. This interdisciplinary approach may enable the development of more accurate and detailed underwater maps.
6. Machine Learning and Artificial Intelligence: The application of machine learning and artificial intelligence techniques can improve the processing, analysis, and interpretation of bathymetric data. These approaches can help automate data quality assessment, identify features of interest, and optimize interpolation techniques, leading to more accurate and efficient mapping processes.
7. New Altimeter Satellites: The limitation of the current satellite altimetry technology is mainly that the actual resolution accuracy of the source data is low, and the correlation and filtering smoothing in the seabed terrain inversion hinder the improvement of the actual resolution and accuracy. How to effectively improve the resolution and accuracy of satellite altimetry and marine gravity data, optimize the theoretical method of seabed terrain inversion, and improve the resolution and accuracy of seabed topography models will be the focus of future fine modelling of global seabed topography. In the future, it will be improved in the research of new altimetry satellites, optimizing the seabed terrain inversion theory under the consideration of terrain complexity and using artificial intelligence technology to invert the seabed terrain.
6.3.2 Enhancements in interpolation techniques
As bathymetric data acquisition methods continue to advance, there is an increasing need for improved interpolation techniques to generate accurate and high-resolution underwater maps.
1. Adaptive Interpolation Methods: Adaptive interpolation techniques are designed to account for spatial variability in the underlying data, adjusting their parameters based on local conditions. This can lead to more accurate predictions, particularly in areas with complex seafloor topography or data gaps.
2. Machine Learning-based Interpolation: Machine learning algorithms, such as Support Vector Machines, Random Forests, and Neural Networks, are increasingly being used for bathymetric data interpolation. These methods can model complex relationships between variables, identify patterns in the data, and provide more accurate predictions than traditional interpolation techniques.
3. Scalable Interpolation Techniques: As the volume of bathymetric data continues to grow, there is a need for interpolation techniques that can efficiently handle large datasets. Scalable techniques, such as parallel computing and distributed processing algorithms, can help speed up the interpolation process and generate high-resolution maps in a timely manner.
4. Integration of Multiscale and Multisource Data: Interpolation techniques that can effectively integrate multiscale and multisource data, such as satellite-derived bathymetry, airborne LiDAR, and in-situ acoustic measurements, are essential for creating comprehensive and seamless underwater maps. These methods should account for spatial resolution, accuracy, and data quality differences among the various datasets.
5. Real-time and Dynamic Interpolation: With the increasing availability of real-time bathymetric data, there is a growing need for interpolation techniques to update underwater maps as new data becomes available dynamically. These methods should be able to incorporate new measurements quickly, account for changes in the seafloor over time, and provide updated maps in near real-time.
7 Conclusion
This review comprehensively analyzed state-of-the-art bathymetry methods, focusing on data acquisition techniques, model accuracy, and interpolation algorithms for underwater terrain mapping. Our primary aim was to compare these methods, assess their merits and drawbacks, and identify potential areas for future research. We examine various data acquisition techniques, including single-beam and multi-beam echo sounders and LiDAR systems. We found that each technique has its own advantages and limitations in terms of accuracy, resolution, and applicability in different water conditions.
We also analyzed the accuracy of three different bathymetry models and found that the choice of model depends on the specific application and available data. The integration of multiple data sources can improve the accuracy and completeness of bathymetric maps. Furthermore, we evaluated four interpolation algorithms, comparing their applicability, reliability, and accuracy in various underwater environments. Our findings indicate that there is no one-size-fits-all solution, and the choice of interpolation method should be based on the specific characteristics of the dataset and the intended application.
Finally, we discussed the development trends and challenges faced by underwater bathymetry technology, offering a forward-looking perspective on the future of this essential field. Our review highlights the importance of continued research into novel data acquisition techniques, improved interpolation algorithms, and the integration of multiple data sources to advance bathymetric mapping techniques and applications.
In conclusion, our review serves as a valuable resource for researchers and practitioners aiming to advance bathymetric mapping techniques and applications. We believe that future research should focus on addressing the limitations of current methods and exploring innovative approaches to improve the accuracy, efficiency, and applicability of bathymetry data in various underwater environments.
Author contributions
ZL completed the idea of the review and completed the draft. ZP, ZZ, ÁG-F, and YC made suggestions for the second chapter of the article and completed the draft revision. SY and CX provided advice on the content of the tables in the article. XZ and YY made suggestions and completed revisions to the final draft. All authors contributed to the discussion part and provided guidance and editing for the complete work. All authors contributed to the article and approved the submitted version.
Funding
This research was supported by Suzhou Municipal Key Laboratory for Intelligent Virtual Engineering (SZS2022004), Suzhou Science and Technology Project-Key Industrial Technology Innovation (SYG202122), Key Program Special Fund of XJTLU (KSF-A-19) and the Research Development Fund of XJTLU (RDF-19-02-23).
Conflict of interest
The authors declare that the research was conducted in the absence of any commercial or financial relationships that could be construed as a potential conflict of interest.
Publisher’s note
All claims expressed in this article are solely those of the authors and do not necessarily represent those of their affiliated organizations, or those of the publisher, the editors and the reviewers. Any product that may be evaluated in this article, or claim that may be made by its manufacturer, is not guaranteed or endorsed by the publisher.
References
Ablain M., Legeais J., Prandi P., Marcos M., Fenoglio-Marc L., Dieng H., et al. (2017). “Satellite altimetry-based sea level at global and regional scales,” in Integrative study of the mean sea level and its components (Springer) 38, 9–33.
Alpers W., Hennings I. (1984). A theory of the imaging mechanism of underwater bottom topography by real and synthetic aperture radar. J. Geophysical Research: Oceans 89, 10529–10546. doi: 10.1029/JC089iC06p10529
Amante C. J., Eakins B. W. (2016). Accuracy of interpolated bathymetry in digital elevation models. J. Coast. Res. 76, 123–133. doi: 10.2112/SI76-011
Annan R. F., Wan X. (2022). Recovering bathymetry of the gulf of guinea using altimetry-derived gravity field products combined via convolutional neural network. Surveys Geophysics 43, 1541–1561. doi: 10.1007/s10712-022-09720-5
Bagheri H., Sadeghian S., Sadjadi S. Y. (2014). The assessment of using an intelligent algorithm for the interpolation of elevation in the DTM generation. Photogrammetrie Fernerkundung Geoinformation 3, 197–208. doi: 10.1127/1432-8364/2014/0220
Bandini F., Olesen D., Jakobsen J., Kittel C. M. M., Wang S., Garcia M., et al. (2018). Bathymetry observations of inland water bodies using a tethered single-beam sonar controlled by an unmanned aerial vehicle. Hydrology Earth System Sci. 22, 4165–4181. doi: 10.5194/hess-22-4165-2018
Barr D. J. (1969). Use of side-looking airborne radar (SLAR) imagery for engineering soils studies. Tech. Rep. doi: 10.21236/AD0701902
Bio A., Gonçalves J., Magalhães A., Pinheiro J., Bastos L. (2020). Combining low-cost sonar and high-precision global navigation satellite system for shallow water bathymetry. Estuaries Coasts 45, 1–12. doi: 10.1007/s12237-020-00703-6
Bourqui P., Harnisch B., Marchese L., Bergeron A. (2008). Optical sar processor for space applications. Sensors Syst. Space Appl. II 6958, 134–143. doi: 10.1117/12.778047
Brando V. E., Anstee J. M., Wettle M., Dekker A. G., Phinn S. R., Roelfsema C. (2009). A physics based retrieval and quality assessment of bathymetry from suboptimal hyperspectral data. Remote Sens. Environ. 113, 755–770. doi: 10.1016/j.rse.2008.12.003
Brennan R., Hess K., Huff L. C., Gill S. (2005). The design of an uncertainty model for the tidal constituent and residual interpolation (tcari) method for tidal correction of bathymetric data. US Hydrographic Conference. (Hydrographic Society of America).
Castrodad-Carrau A., Vélez-Reyes M., Goodman J. A. (2006). “An algorithm to retrieve coastal water optical properties, bathymetry, and bottom albedo from hyperspectral imagery,” In DeWeert MJSaito TTGuthmuller HL Photonics for port and harbor security II, (SPIE), 128–139. doi: 10.1117/12.667968
Chang H.-C., Li X., Ge L. (2010). “Assessment of SRTM, ACE2 and aster GDEM using RTK-GPS,” in 5th australasian remote sensing & photogrammetry conference, (Australia: Springer) 13–17.
Chen C., Liu F., Li Y. Y., Yan C. Q., Liu G. L. (2016). A robust interpolation method for constructing digital elevation models from remote sensing data. Geomorphology 268, 275–287. doi: 10.1016/j.geomorph.2016.06.025
Chen W., Lu Y., Li J., Jian H., Cui X., Yin S., et al. (2003). “Developing of laser airborne depth mapping in china,” in Lidar Remote Sensing for Industry and Environment Monitoring III, (SPIE) 414–421.
Cheng J., Fang J., Wu W., Li J. (2014). Temperature drift modeling and compensation of rlg based on pso tuning svm. Measurement 55, 246–254. doi: 10.1016/j.measurement.2014.05.013
Chenier R., Faucher M. A., Ahola R. (2018). Satellite-derived bathymetry for improving Canadian hydrographic service charts. Isprs Int. J. Geo-Information 7, 306. doi: 10.3390/ijgi7080306
Chowdhury E. H., Hassan Q. K., Achari G., Gupta A. (2017). Use of bathymetric and LiDAR data in generating digital elevation model over the lower athabasca river watershed in Alberta, Canada. Water 9, 19. doi: 10.3390/w9010019
Coiras E., Petillot Y., Lane D. M. (2007). Multiresolution 3-d reconstruction from side-scan sonar images. IEEE Trans. Image Process. 16, 382–390. doi: 10.1109/TIP.2006.888337
Cooper A., Chubb S., Askari F., Valenzuela G., Bennett J., Keller W. (1994). Radar surface signatures for the two-dimensional tidal circulation over phelps bank, nantucket shoals: a comparison between theory and experiment. J. Geophysical Research: Oceans 99, 7865–7883. doi: 10.1029/94JC00056
da Silveira C. B. L., Strenzel G. M. R., Maida M., Araujo T. C. M., Ferreira B. P. (2020). Multiresolution satellite-derived bathymetry in shallow coral reefs: improving linear algorithms with geographical analysis. J. Coast. Res. 36, 1247–1265. doi: 10.2112/Jcoastres-D-19-00029.1
de Moustier C., Allen R. (2012). Swath mapping with a unipulse hybrid sonar. 2012 Oceans, 1–4. doi: 10.1109/OCEANS.2012.6405045
Deng X., Featherstone W. (2006). A coastal retracking system for satellite radar altimeter waveforms: application to ers-2 around Australia. J. Geophysical Research: Oceans 111. doi: 10.1029/2005JC003039
Diaconu D. C., Bretcan P., Peptenatu D., Tanislav D., Mailat E. (2019). The importance of the number of points, transect location and interpolation techniques in the analysis of bathymetric measurements. J. hydrology 570, 774–785. doi: 10.1016/j.jhydrol.2018.12.070
Di Matteo A., Milli M. (2008). Morphological, bathymetric and sedimentological surveys used to assess the coastline defensive measures. Int. J. Environ. Sci. Technol. 5, 415–424. doi: 10.1007/Bf03326037
Do J. D., Jint J. Y., Kim C. H., Kim W. H., Lee B. G., Wie G. J., et al. (2020). Measurement of nearshore seabed bathymetry using airborne/mobile LiDAR and multibeam sonar at hujeong beach, Korea. J. Coast. Res. 95, 1067–1071. doi: 10.2112/Si95-208.1
Dong J., Shen Q., Jiang L., Jiang H., Li D., Wang H., et al. (2019). An analysis of spatiotemporal baseline and effective spatial coverage for lunar-based sar repeat-track interferometry. IEEE J. Selected Topics Appl. Earth Observations Remote Sens. 12, 3458–3469. doi: 10.1109/JSTARS.2019.2928439
Drouin A., Saint-Laurent D. (2010). Comparison of interpolation methods to produce high precision digital elevation models (DEM) for the representation of floodplain micro-topography. Hydrological Sci. Journal-Journal Des. Sci. Hydrologiques 55, 526–539. doi: 10.1080/02626667.2010.481088
Dubey A. K., Yadava V. (2008). Experimental study of nd: yag laser beam machining–an overview. J. materials Process. Technol. 195, 15–26. doi: 10.1016/j.jmatprotec.2007.05.041
Dunham S. J., Handal J. T., Peterson T., O’Brien M. (2005). “High resolution bathymetric survey system,” in Oceans’ 04 MTS/IEEE Techno-Ocean’04 (IEEE Cat. No. 04CH37600), (IEEE). 1139–1146.
Eleftherakis D., Berger L., Le Bouffant N., Pacault A., Augustin J.-M., Lurton X. (2018). Backscatter calibration of high-frequency multibeam echosounder using a reference single-beam system, on natural seafloor. Marine Geophysical Research 39, 55–73. doi: 10.1007/s11001-018-9348-5
Erdogan S. (2009). A comparision of interpolation methods for producing digital elevation models at the field scale. Earth Surface Processes Landforms 34, 366–376. doi: 10.1002/esp.1731
Eren F., Pe’eri S., Rzhanov Y., Ward L. (2018). Bottom characterization by using airborne lidar bathymetry (alb) waveform features obtained from bottom return residual analysis. Remote Sens. Environ. 206, 260–274. doi: 10.1016/j.rse.2017.12.035
Ernstsen V. B., Noormets R., Hebbeln D., Bartholomä A., Flemming B. W. (2006). Precision of high-resolution multibeam echo sounding coupled with high-accuracy positioning in a shallow water coastal environment 26, 141–149. doi: 10.1007/s00367-006-0025-3
Evans I. S. (2012). Geomorphometry and landform mapping: what is a landform? Geomorphology 137, 94–106. doi: 10.1016/j.geomorph.2010.09.029
Fan K., Huang W., Fu B., He M. (2008). “Simulation study on the optimal conditions for shallow water bathymetry observation by sar,” in IGARSS 2008-2008 IEEE International Geoscience and Remote Sensing Symposium, (IEEE) I–454.
Forfinski-Sarkozi N. A., Parrish C. E. (2016). Analysis of mabel bathymetry in keweenaw bay and implications for icesat-2 atlas. Remote Sens. 8, 772. doi: 10.3390/rs8090772
Gao X., Shen S., Hu Z., Wang Z. (2019). Ground and aerial meta-data integration for localization and reconstruction: a review. Pattern Recognition Lett. 127, 202–214. doi: 10.1016/j.patrec.2018.07.036
Giorgi G., Teunissen P. J., Gourlay T. (2012). Instantaneous global navigation satellite system (gnss)-based attitude determination for maritime applications. IEEE Journal of oceanic engineering 37, 348–362. doi: 10.1109/JOE.2012.2191996
Gu S., Dai C., Fang W., Zheng F., Wang Y., Zhang Q., et al. (2021). Multi-gnss ppp/ins tightly coupled integration with atmospheric augmentation and its application in urban vehicle navigation. J. Geodesy 95, 1–15. doi: 10.1007/s00190-021-01514-8
Guan D. L., Ke X. P., Wang Y. (2016). Basement structures of East and south China seas and adjacent regions from gravity inversion. J. Asian Earth Sci. 117, 242–255. doi: 10.1016/j.jseaes.2015.12.017
Guenther G. C. (2007). “Airborne lidar bathymetry,” in Digital elevation model technologies and applications: the DEM users manual (ASPRS), 253–320.
Habib M., Yazan A., Malkawi A., Awwad M. (2020). Impact of interpolation techniques on the accuracy of large-scale digital elevation model. Open Geosciences 12, 190–202. doi: 10.1515/geo-2020-0012
Hao R. J., Wan X. Y., Sui X. H., Jia Y. J., Wu X. (2022). Research status and analysis of seafloor topography survey and model development. reviews ofgeophysics and planetary physics. Rev. Geophysics Planetary Phys. 53, 172–186. doi: 10.19975/j.dqyxx.2021-061
Hao Z. C., Wu Q., Zhao Y. W., Du Z. L., Yao Y., Xu H., et al. (2021). An interpolation method for the floor elevation of coal seams based on a local anisotropy radial basis function. Environ. Earth Sci. 80, 691. doi: 10.1007/s12665-021-09902-1
Henderson F. (1995). Environmental factors and the detection of open surface water areas with x-band radar imagery. Int. J. Remote Sens. 16, 2423–2437. doi: 10.1080/01431169508954567
Henderson F. M., Xia Z.-G. (1997). Sar applications in human settlement detection, population estimation and urban land use pattern analysis: a status report. IEEE Trans. Geosci. Remote Sens. 35, 79–85. doi: 10.1109/36.551936
Heritage G. L., Milan D. J., Large A. R. G., Fuller I. C. (2009). Influence of survey strategy and interpolation model on DEM quality. Geomorphology 112, 334–344. doi: 10.1016/j.geomorph.2009.06.024
Hilldale R. C., Raff D. (2008). Assessing the ability of airborne lidar to map river bathymetry. Earth Surface Processes Landforms 33, 773–783. doi: 10.1002/esp.1575
Hodul M., Bird S., Knudby A., Chenier R. (2018). Satellite derived photogrammetric bathymetry. Isprs J. Photogrammetry Remote Sens. 142, 268–277. doi: 10.1016/j.isprsjprs.2018.06.015
Hu P., Liu X. H., Hu H. (2009). Isomorphism in digital elevation models and its implication to interpolation functions. Photogrammetric Eng. Remote Sens. 75, 713–721. doi: 10.14358/Pers.75.6.713
Huang Y., Li W., Yuan F. (2020). Speckle noise reduction in sonar image based on adaptive redundant dictionary. J. Mar. Sci. Eng. 8, 761. doi: 10.3390/jmse8100761
Iqbal U., Georgy J., Abdelfatah W. F., Korenberg M. J., Noureldin A. (2013). Pseudoranges error correction in partial gps outages for a nonlinear tightly coupled integrated system. IEEE Trans. Intelligent Transportation Syst. 14, 1510–1525. doi: 10.1109/TITS.2013.2264474
Irish J. L., Lillycrop W. J. (1999). Scanning laser mapping of the coastal zone: the shoals system. ISPRS J. Photogrammetry Remote Sens. 54, 123–129. doi: 10.1016/S0924-2716(99)00003-9
Jena B., Kurian P., Swain D., Tyagi A., Ravindra R. (2012). Prediction of bathymetry from satellite altimeter based gravity in the arabian sea: mapping of two unnamed deep seamounts. Int. J. Appl. Earth Observation Geoinformation 16, 1–4. doi: 10.1016/j.jag.2011.11.008
Jianhu Z., Xiao W., Hongmei Z., Jun H., Xiaomin J. (2016). The neutrosophic set and quantum-behaved particle swarm optimization algorithm of side scan sonar image segmentation. Acta Geodaetica Cartographica Sin. 45, 935. doi: 10.11947/j.AGCS.2016.20150555
Kalimuthu H., Tan W. N., Lim S. L., Fauzi M. F. A. (2016). “Interpolation of low resolution digital elevation models: a comparison,” in 2016 8th Computer Science and Electronic Engineering Conference. 71–76 (Ceec). doi: 10.1109/CEEC.2016.7835891
Kiesel K. C. (2000). “A new pitch/yaw stabilized bathymetric survey system,” in OCEANS 2000 MTS/IEEE Conference and Exhibition. Conference Proceedings (Cat. No. 00CH37158), (IEEE) 201–205. doi: 10.1109/OCEANS.2000.881261
Kim S. S., Wessel P. (2016). New analytic solutions for modeling vertical gravity gradient anomalies. Geochemistry Geophysics Geosystems 17, 1915–1924. doi: 10.1002/2016gc006263
Kim H., Willers J. L., Kim S. (2016). Digital elevation modeling via curvature interpolation for lidar data. Electronic J. Differential Equations 23, 47–57. doi: 10.1002/2016GC006263
Kim K. B., Yun H. S. (2018). Satellite-derived bathymetry prediction in shallow waters using the gravity-geologic method: a case study in the west sea of Korea. Ksce J. Civil Eng. 22, 2560–2568. doi: 10.1007/s12205-017-0487-z
Kinzel P. J., Legleiter C. J., Nelson J. M. (2013). Mapping river bathymetry with a small footprint green lidar: applications and challenges 1. JAWRA J. Am. Water Resour. Assoc. 49, 183–204. doi: 10.1111/jawr.12008
Kuperman W., Roux P. (2007). Underwater acoustics. Springer Handbook of Acoustics 149–204. doi: 10.1007/978-0-387-30425-0_5
Le Bas T., Huvenne V. (2009). Acquisition and processing of backscatter data for habitat mapping–comparison of multibeam and sidescan systems. Appl. Acoustics 70, 1248–1257. doi: 10.1016/j.apacoust.2008.07.010
Lebrec U., Paumard V., O’Leary M. J., Lang S. C. (2021). Towards a regional high-resolution bathymetry of the north west shelf of Australia based on sentinel-2 satellite images, 3D seismic surveys, and historical datasets. Earth System Sci. Data 13, 5191–5212. doi: 10.5194/essd-13-5191-2021
Lee Z., Carder K. L., Arnone R. A. (2002). Deriving inherent optical properties from water color: a multiband quasi-analytical algorithm for optically deep waters. Appl. optics 41, 5755–5772. doi: 10.1364/AO.41.005755
Li H., Wei B., Zhu J., Li C., Xing S. J. I. S. J. (2018). Calibration of multibeam echo sounder transducer array based on focused beamforming. IEEE Sensors Journal 18, 10199–10207. doi: 10.1109/JSEN.2018.2875198
Li H. S., Xu C., Zhou T. (2012). High-resolution integrated detection of underwater topography and geomorphology based on multibeam interferometric echo sounder. Adv. Hydrology Hydraulic Eng. 212-213, 345–350. doi: 10.4028/www.scientific.net/AMM.212-213.345
Liu W., Shao J. L., Chu X. F. (2017). An automated processing algorithm for flat areas resulting from DEM filling and interpolation. Isprs Int. J. Geo-Information 6, 376. doi: 10.3390/ijgi6110376
Liu K., Song C., Wang J., Ke L., Zhu Y., Zhu J., et al. (2020). Remote sensing-based modeling of the bathymetry and water storage for channel-type reservoirs worldwide. Water Resour. Res. 56, e2020WR027147. doi: 10.1029/2020WR027147
Lyzenga D. R. (1985). Shallow-water bathymetry using combined lidar and passive multispectral scanner data. Int. J. Remote Sens. 6, 115–125. doi: 10.1080/01431168508948428
MacMillan R., Shary P. (2009). Landforms and landform elements in geomorphometry. Developments Soil Sci. 33, 227–254. doi: 10.1016/S0166-2481(08)00009-3
McMillan M., Shepherd A., Vaughan D. G., Laxon S., McAdoo D. (2009). Amundsen sea bathymetry: the benefits of using gravity data for bathymetric prediction. IEEE Trans. Geosci. Remote Sens. 47, 4223–4228. doi: 10.1109/TGRS.2009.2023665
Melo J., Matos A. (2017). Survey on advances on terrain based navigation for autonomous underwater vehicles. Ocean Eng. 139, 250–264. doi: 10.1016/j.oceaneng.2017.04.047
Mohammadloo T. H., Snellen M., Simons G., D. G. (2020). Assessing the performance of the multi-beam echo-sounder bathymetric uncertainty prediction model. Appl. Sci. 10, 4671. doi: 10.3390/app10134671
Mohammadloo T. H., Snellen M., Simons D. G., Dierikx B., Bicknese S. (2019). Using alternatives to determine the shallowest depth for bathymetric charting: case study. J. Surveying Eng. 145, 05019004. doi: 10.1061/(Asce)Su.1943-5428.0000278
Mopin I, Marchal J, Legris M, Le Chenadec G, Blondel P, Zer B. (2022). Design and field testing of a non-linear single-beam echosounder for multi-frequency seabed characterization. Applied Acoustics 187, 108490. doi: 10.1016/j.apacoust.2021.108490
Neuenschwander A. L., Magruder L. A. (2016). The potential impact of vertical sampling uncertainty on icesat-2/atlas terrain and canopy height retrievals for multiple ecosystems. Remote Sens. 8, 1039. doi: 10.3390/rs8121039
Neumann T., Brenner A., Hancock D., Robbins J., Saba J., Harbeck K., et al. (2020). Atlas/icesat-2 l2a global geolocated photon data, version 3. Boulder, CO: NASA National Snow and Ice Data Center Distributed Active Archive Center. 10.
Niroumand-Jadidi M., Bovolo F., Bruzzone L. (2020). Smart-sdb: sample-specific multiple band ratio technique for satellite- derived bathymetry. Remote Sens. Environ. 251, 112091. doi: 10.1016/j.rse.2020.112091
Niroumand-Jadidi M., Vitti A. (2016). Optimal band ratio analysis of worldview-3 imagery for bathymetry of shallow rivers (case study: sarca river, italy). Int. Arch. Photogramm. Remote Sens. Spat. Inf. Sci. 41, B8. doi: 10.1016/j.rse.2020.112091
Parrish C. E., Magruder L. A., Neuenschwander A. L., Forfinski-Sarkozi N., Alonzo M., Jasinski M. (2019). Validation of icesat-2 atlas bathymetry and analysis of atlas’s bathymetric mapping performance. Remote Sens. 11, 1634. doi: 10.3390/rs11141634
Pe’eri S., Parrish C., Azuike C., Alexander L., Armstrong A. (2014). Satellite remote sensing as a reconnaissance tool for assessing nautical chart adequacy and completeness. Mar. Geodesy 37, 293–314. doi: 10.1080/01490419.2014.902880
Pereira P., Baptista P., Cunha T., Silva P. A., Romão S., Lafon V. (2019). Estimation of the nearshore bathymetry from high temporal resolution sentinel-1a c-band sar data-a case study. Remote Sens. Environ. 223, 166–178. doi: 10.1016/j.rse.2019.01.003
Polidori L., Chorowicz J. (1993). Comparison of bilinear and brownian interpolation for digital elevation models. Isprs J. Photogrammetry Remote Sens. 48, 18–23. doi: 10.1016/0924-2716(93)90036-M
Popielarczyk D. (2022). Determination of survey boat” heave” motion with the use of rts technique. Environ. Engineering. Proc. Int. Conf. Environ. Engineering. ICEE 10, 1–6. doi: 10.3846/enviro.2017.229
Poursanidis D., Traganos D., Chrysoulakis N., Reinartz P. (2019). Cubesats allow high spatiotemporal estimates of satellite-derived bathymetry. Remote Sens. 11, 1299. doi: 10.3390/rs11111299
Rishikeshan C. A., Katiyar S. K., Mahesh V. N. V. (2014). “Detailed evaluation of DEM interpolation methods in GIS using DGPS data,” in 2014 6th International Conference on Computational Intelligence and Communication Networks. (IEEE) 666–671. doi: 10.1109/Cicn.2014.148
Rodrigo C., Diaz J., Gonzalez-Fernandez A. (2014). Origin of the Easter submarine alignment: morphology and structural lineaments. Latin Am. J. Aquat. Res. 42, 857–870. doi: 10.3856/vol42-issue4-fulltext-12
Rossi L., Mammi I., Pelliccia F. (2020). Uav-derived multispectral bathymetry. Remote Sens. 12, 3897. doi: 10.3390/rs12233897
Rowley T., Ursic M., Konsoer K., Langendoen E., Mutschler M., Sampey J., et al. (2020). Comparison of terrestrial lidar, sfm, and mbes resolution and accuracy for geomorphic analyses in physical systems that experience subaerial and subaqueous conditions. Geomorphology 355, 107056. doi: 10.1016/j.geomorph.2020.107056
Sahafi L. (2013). Cost effective navigation of autonomous underwater vehicles. (The University of Adelaide).
Salah M. (2021). Srtm dem correction over dense urban areas using inverse probability weighted interpolation and sentinel-2 multispectral imagery. Arabian J. Geosciences 14, 801. doi: 10.1007/s12517-021-07148-6
Samad A. M., Kamarulzaman N., Hamdani M. A., Mastor T. A., Hashim K. A. (2013). “The potential of unmanned aerial vehicle (UAV) for civilian and mapping application,” in 2013 IEEE 3rd International Conference on System Engineering and Technology. 313–318 (IEEE).
Santillan J. R., Serviano J. L., Makinano-Santillan M., Marqueso J. T. (2016). Influence of river bed elevation survey configurations and interpolation methods on the accuracy of lidar DTM-based river flow simulations. Int. Conf. Geomatic Geospatial Technol. (Ggt) 2016, 225–235. doi: 10.5194/isprs-archives-XLII-4-W1-225-2016
Schuler D. L., Lee J.-S., De Grandi G. (1996). Measurement of topography using polarimetric sar images. IEEE Trans. Geosci. Remote Sens. 34, 1266–1277. doi: 10.1109/36.536542
Shi W. Z., Wang B., Tian Y. (2014). Accuracy analysis of digital elevation model relating to spatial resolution and terrain slope by bilinear interpolation. Math. Geosciences 46, 445–481. doi: 10.1007/s11004-013-9508-8
Shu S., Liu H., Beck R. A., Frappart F., Korhonen J., Lan M., et al. (2021). Evaluation of historic and operational satellite radar altimetry missions for constructing consistent long-term lake water level records. Hydrology Earth System Sci. 25, 1643–1670. doi: 10.5194/hess-25-1643-2021
Simons D. G., Snellen M. J. A. A. (2009). A bayesian approach to seafloor classification using multi-beam echo-sounder backscatter data. Applied Acoustics 70, 1258–1268. doi: 10.1016/j.apacoust.2008.07.013
Smith W. H., Sandwell D. T. (1994). Bathymetric prediction from dense satellite altimetry and sparse shipboard bathymetry. J. Geophysical Research: Solid Earth 99, 21803–21824. doi: 10.1029/94JB00988
Smith W. H., Sandwell D. T. (1997). Global sea floor topography from satellite altimetry and ship depth soundings. Science 277, 1956–1962. doi: 10.1126/science.277.5334.1956
Stammer D., Ray R., Andersen O. B., Arbic B., Bosch W., Carrère L., et al. (2014). Accuracy assessment of global barotropic ocean tide models. Rev. Geophysics 52, 243–282. doi: 10.1002/2014RG000450
Stumpf R. P., Holderied K., Sinclair M. (2003). Determination of water depth with high-resolution satellite imagery over variable bottom types. Limnology Oceanography 48, 547–556. doi: 10.4319/lo.2003.48.1_part_2.0547
Thomas N., Pertiwi A. P., Traganos D., Lagomasino D., Poursanidis D., Moreno S., et al. (2021). Space-borne cloud-native satellite-derived bathymetry (sdb) models using icesat-2 and sentinel-2. Geophysical Res. Lett. 48, e2020GL092170. doi: 10.1029/2020GL092170
Thompson J. A., Bell J. C., Butler C. A. (2001). Digital elevation model resolution: effects on terrain attribute calculation and quantitative soil-landscape modeling. Geoderma 100, 67–89. doi: 10.1016/S0016-7061(00)00081-1
Traganos D., Reinartz P. (2018). Mapping mediterranean seagrasses with sentinel-2 imagery. Mar. pollut. Bull. 134, 197–209. doi: 10.1016/j.marpolbul.2017.06.075
Tu J. Z., Yang G. X., Qi P., Ding Z. Y., Mei G. (2020). Comparative investigation of parallel spatial interpolation algorithms for building large-scale digital elevation models. Peerj Comput. Sci. 6, e263. doi: 10.7717/peerj-cs.263
Veng T., Andersen O. B. (2021). Consolidating sea level acceleration estimates from satellite altimetry. Adv. Space Res. 68, 496–503. doi: 10.1016/j.asr.2020.01.016
Wang L., Liu J., Yang L., Chen Z., Wang X., Ouyang B. (2013). Applications of unmanned aerial vehicle images on agricultural remote sensing monitoring. Trans. Chin. Soc. Agric. Eng. 29, 136–145.
Wang S., Wang M., Yang S., Jiao L. (2016). New hierarchical saliency filtering for fast ship detection in high-resolution sar images. IEEE Trans. Geosci. Remote Sens. 55, 351–362. doi: 10.1109/TGRS.2016.2606481
Wang J., Zhao M. W., Jiang L., Yang C. C., Huang X. L., Xu Y., et al. (2021). A new strategy combined hasm and classical interpolation methods for DEM construction in areas without sufficient terrain data. J. Mountain Sci. 18, 2761–2775. doi: 10.1007/s11629-020-6655-5
Watts A. B., Sandwell D. T., Smith W. H. F., Wessel P. (2006). Global gravity, bathymetry, and the distribution of submarine volcanism through space and time. J. Geophysical Research-Solid Earth 111, B08408. doi: 10.1029/2005jb004083
Wehr A., Lohr U. (1999). Airborne laser scanning–an introduction and overview. ISPRS J. photogrammetry Remote Sens. 54, 68–82. doi: 10.1016/S0924-2716(99)00011-8
Wei B., Li H., Zhou T., Xing S. J. R. S. (2019). Obtaining 3d high-resolution underwater acoustic images by synthesizing virtual aperture on the 2d transducer array of multibeam echo sounder. Remote Sensing 11, 2615. doi: 10.3390/rs11222615
Wood J. D., Fisher P. F. (1993). Assessing interpolation accuracy in elevation models. IEEE Comput. Graphics Appl. 13, 48–56. doi: 10.1109/38.204967
Wu Z., Mao Z., Shen W., Yuan D., Zhang X., Huang H. (2022). Satellite-derived bathymetry based on machine learning models and an updated quasi-analytical algorithm approach. Optics Express 30, 16773–16793. doi: 10.1364/OE.456094
Wu Z., Yang F., Tang Y. (2021). “Side-scan sonar and sub-bottom profiler surveying,” in High-resolution seafloor survey and applications (Singapore: Springer), 95–122.
Xing S., Wang D., Xu Q., Lin Y., Li P., Liu C. (2019). “Characteristic analysis of the green-channel waveforms with alb mapper5000,” in 2019 IEEE International Conference on Signal, Information and Data Processing (ICSIDP). (IEEE) 1–4
Yamasaki S., Tabusa T., Iwasaki S., Hiramatsu M. (2017). Acoustic water bottom investigation with a remotely operated watercraft survey system. Prog. Earth Planetary Sci. 4, 1–9. doi: 10.1186/s40645-017-0140-y
Yan L., Tang X. F., Zhang Y. (2021). High accuracy interpolation of dem using generative adversarial network. Remote Sens. 13, 676. doi: 10.3390/rs13040676
Ye X., Wang L., Wang T., Wang G. (2011). “A level-set model driven by bidimensional emd for sonar image segmentation,” in 2011 IEEE International Conference on Mechatronics and Automation. (IEEE) 703–708. doi: 10.1109/ICMA.2011.5985747
Yuan X., Martínez J.-F., Eckert M., López-Santidrián L. (2016). An improved otsu threshold segmentation method for underwater simultaneous localization and mapping-based navigation. Sensors 16, 1148. doi: 10.3390/s16071148
Zhang J. M. (2013). “Research on DEM interpolation algorithm adaptability with local terrain features,” in 2013 21st International Conference on Geoinformatics (Geoinformatics), 1–8.
Zhang T., Xu X., Xu B. (2015). Method of establishing an underwater digital elevation terrain based on kriging interpolation. Measurement 63, 287–298. doi: 10.1016/j.measurement.2014.12.025
Zhang, You X. (2010). “Effects of interpolation parameters in distance weighted method on DEM accuracy,” in 2011 International Conference on Computers, Communications, Control and Automation, (Ccca) 561–565.
Zhao J., Wang X., Zhang H., Hu J., Jian X. (2016). Side scan sonar image segmentation based on neutrosophic set and quantum-behaved particle swarm optimization algorithm. Mar. Geophysical Res. 37, 229–241. doi: 10.1007/s11001-016-9276-1
Zheng X. W., Xiong H. J., Yue L. W., Gong J. Y. (2016). An improved ANUDEM method combining topographic correction and DEM interpolation. Geocarto Int. 31, 492–505. doi: 10.1080/10106049.2015.1059899
Zhou Y., Li Q., Huo G. (2015). Automatic side-scan sonar image enhancement in curvelet transform domain. Math. Problems Eng. 2015, 493142. doi: 10.1155/2015/493142
Zhu S., Liu B., Wan W., Xie H., Fang Y., Chen X., et al. (2019a). A new digital lake bathymetry model using the step-wise water recession method to generate 3d lake bathymetric maps based on dems. Water 11, 1151. doi: 10.3390/w11061151
Zhu Y., Liu X. J., Zhao J., Cao J. J., Wang X. L., Li D. L. (2019b). Effect of DEM interpolation neighbourhood on terrain factors. Isprs International Journal of Geo-Information 8, 30. doi: 10.3390/ijgi8010030
Zongjian L. (2008). Uav for mapping low altitude photogrammetric survey. Int. Arch. Photogrammetry Remote Sensing Beijing China 37, 1183–1186.
Appendix: list of acronyms
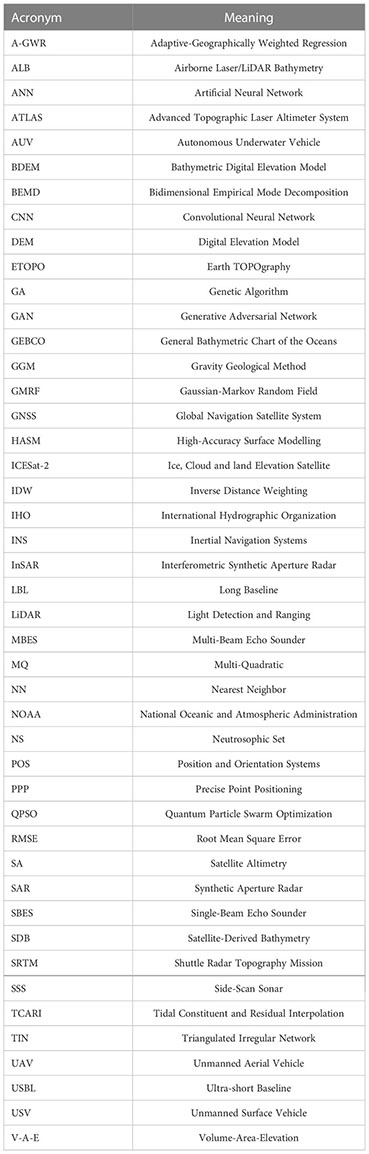
Keywords: underwater, terrain, BDEM, interpolation, bathymetry, MBES bathymetry, SBES bathymetry, LiDAR bathymetry
Citation: Li Z, Peng Z, Zhang Z, Chu Y, Xu C, Yao S, García-Fernández ÁF, Zhu X, Yue Y, Levers A, Zhang J and Ma J (2023) Exploring modern bathymetry: A comprehensive review of data acquisition devices, model accuracy, and interpolation techniques for enhanced underwater mapping. Front. Mar. Sci. 10:1178845. doi: 10.3389/fmars.2023.1178845
Received: 03 March 2023; Accepted: 25 April 2023;
Published: 15 May 2023.
Edited by:
Jaroslaw Tegowski, University of Gdansk, PolandReviewed by:
Chunqiao Song, Chinese Academy of Sciences (CAS), ChinaCarlos Pérez-Collazo, University of Vigo, Spain
Copyright © 2023 Li, Peng, Zhang, Chu, Xu, Yao, García-Fernández, Zhu, Yue, Levers, Zhang and Ma. This is an open-access article distributed under the terms of the Creative Commons Attribution License (CC BY). The use, distribution or reproduction in other forums is permitted, provided the original author(s) and the copyright owner(s) are credited and that the original publication in this journal is cited, in accordance with accepted academic practice. No use, distribution or reproduction is permitted which does not comply with these terms.
*Correspondence: Xiaohui Zhu, Xiaohui.Zhu@xjtlu.edu.cn