Deep-sea benthic megafauna hotspot shows indication of resilience to impact from massive turbidity flow
 Katharine T. Bigham1,2*
  Ashley A. Rowden1,2
  David A. Bowden1
  Daniel Leduc1
  Arne Pallentin1†
  Caroline Chin1
  Joshu J. Mountjoy1
  Scott D. Nodder1
  Alan R. Orpin1
- 1National Institute of Water and Atmospheric Research (NIWA), Wellington, New Zealand
- 2School of Biological Sciences, Victoria University of Wellington, Wellington, New Zealand
Sediment density flows are large scale disturbances that can have dramatic impacts on seafloor animal communities in the deep sea. Seafloor imagery collected in Kaikōura Canyon (New Zealand), before and after a sediment density flow event that included debris and turbidity flows triggered by a 2016 Mw 7.8 Kaikōura Earthquake, shows the recovery trajectory of the animal community in the canyon head in the weeks, months, and years following the disturbance. The canyon community appears resilient to this event, with models estimating full recovery within a minimum of 4.5–5.1 years and as long as 12 years. The implications of the resilience of this deep-sea community are discussed in the context of the local marine protected area, the surrounding fishery, and global seabed mining.
1 Introduction
Disturbance structures all marine communities by freeing limiting resources (space, refuge, nutrients, etc.) and creating habitat heterogeneity, which influences succession and enhances biodiversity (Sousa, 1984; Willig and Walker, 1999; Sousa, 2001). Subaqueous sediment-density flows are one of the largest and potentially the most pervasive and persistent physical disturbances in the deep sea (Meiburg and Kneller, 2010; Talling et al., 2013; Azpiroz-Zabala et al., 2017; Bigham et al., 2021). Sediment density flows occur when the material in submarine landslides disintegrates and mixes with water creating high-density bodies of turbid water filled with suspended sediment that travel downslope beneath less dense water (Kuenen and Migliorini, 1950; Talling, 2014). Sediment density flows are complex and a single event can contain multiple flow types such as debris flows and turbidity flows (Haughton et al., 2003; Talling et al., 2007; Paull et al., 2018). As such, many terms and classification schemes have been proposed to differentiate flow types, although confusion around the use of these terms still occurs (Kuenen and Migliorini, 1950; Lowe, 1979; Talling et al., 2012). Here we will mainly use the term “turbidity flow” sensu (Kuenen and Migliorini, 1950) because it is the common overarching term used for sediment density flows in the ecological literature.
Turbidity flows occur worldwide and transport large volumes of sediment and associated organic matter across long distances, from the continental slope to the abyssal plain (e.g., the earthquake-triggered Grand Banks turbidity flow transported and deposited >175 km3 sediment across an area of 240 000 km2 (Piper and Aksu, 1987)). These flows impact the benthic faunal communities in their path across a range of spatial scales through both erosional and depositional processes. The immediate pulse-type of impact from the high velocity flows can entrain bottom substrates, leading to mass benthic mortality through dislodgment by erosion, and sediment smothering or transport and burial by sediment deposition as flow velocities wane (Young and Richardson, 1998; Oguri et al., 2013; Bigham et al., 2021). Longer term press-type impacts include persistent turbid waters which can form benthic nepheloid layers (distinct near-bed layers that contain elevated suspended sediment concentrations), which can also be derived from resuspension by secondary disturbances from storms or earthquake aftershocks (Kawagucci et al., 2012; Wakita et al., 2022). Prolonged elevated benthic turbidity can impair feeding and cause mortalities, especially for suspension and filter feeders (Rubenstein and Koehl, 1977; Schönberg, 2016; Abdul Wahab et al., 2017), and can delay an organism’s ability to colonize the disturbed patches of the seafloor (Clark et al., 2016) or even, in the case of aftershocks, cause additional mortalities of colonizing fauna (Heezen et al., 1964; Tyler and Ramirez-Llodra, 2002; Harris, 2014). Turbidity flows can also create completely new habitats in the deep sea by uncovering or creating new resources. For example, chemosynthetic communities, unique assemblages of organisms that are fuelled by reduced chemical compounds rather than photosynthetic detritus (Sibuet and Olu, 1998), will occur where there is enough decaying organic material to support reducing conditions (Gooday et al., 1990). Turbidity flows can transport labile organic matter into the deep sea (Stetten et al., 2015; Pruski et al., 2017; Gibbs et al., 2020; Hage et al., 2020) which can in turn initiate the development of reducing habitats, and thus chemosynthetic communities, both through the burial of large volumes of organic material and through exposure of methane-bearing sediments by erosion (Rathburn et al., 2009). In general, whether by transport of coastal and slope sediments, or exposure from down-cutting, turbidity flows can increase the availability of organic matter and create nutrient-enriched environments in the deep sea. The availability of this organic matter has been hypothesized to influence benthic communities at abyssal depths in the deep sea (Heezen et al., 1955).
While it is evident that disturbance from turbidity flows can have an impact on deep-sea benthic communities, it is less clear to what extent these communities are resilient to the impacts of turbidity flows. Here the definition of resilience used is Holing’s “ecological resilience” which refers to the amount of disturbance that a system can experience before changing to an alternative state (Holling, 1996) and considers both the community’s resistance (how similar it remains to the pre-disturbance state despite the disturbance (Walker et al., 2004)) and recovery (ability to return to pre-disturbance state (Folke et al., 2004)). Studies following the Mw 9.0 2011 Tōhoku Earthquake-triggered turbidity flow showed rapid recovery of the meiofaunal communities (Kitahashi et al., 2014; Kitahashi et al., 2016; Nomaki et al., 2016). In contrast, studies of ancient turbidity flows, hundreds to many thousands of years old, inferred that the impact of flows on mega- and macrofauna communities may still be detectable (Griggs et al., 1969; Huggett, 1987; Briggs et al., 1996). However, studies of older turbidity flows are often confounded by local patterns of organic matter input from surface productivity and/or terrigenous inputs that have occurred in the intervening time (Richardson et al., 1985; Richardson and Young, 1987; Thurston et al., 1994; Thurston et al., 1998). Many studies, even ones of more recent turbidity flows, lack sufficient pre-disturbance data and high temporal resolution post-disturbance data to disentangle the impacts of turbidity flows on benthic communities and assess their likely resilience to these disturbances (Galéron et al., 2009; van Gaever et al., 2009). Kaikōura Canyon off eastern New Zealand is the site of a recent and major earthquake-triggered turbidity flow, with the additional context of pre-event benthic data.
Kaikōura Canyon was identified previously as a globally significant benthic productivity hotspot due to an abundant macro- and megafaunal biological community with biomasses 100 times higher than other (non-chemosynthetic) deep-sea habitats below 500 m water depth (De Leo et al., 2010). The reasons proposed for such a hotspot include habitat heterogeneity, high food availability via channelling of pelagic and terrestrial organic matter, and physical disturbance from past submarine landslides and turbidity flows (De Leo et al., 2010). Kaikōura Canyon also supports a distinct meiofaunal community that is believed to reflect high food availability and high frequency of disturbance, and which contributes significantly to regional meiofaunal diversity (Leduc et al., 2014).
On 14th November 2016, the Mw 7.8 Kaikōura Earthquake triggered a 1-in-140 year highly complex “full canyon-flushing event” that reshaped the canyon floor and transported an estimated 850 metric megatons of sediment and 7.5 metric megatons of carbon through the canyon and out along the Hikurangi Channel (Mountjoy et al., 2018). This event included submarine landslides, and other local mass-wasting episodes, as well as debris flow and turbidity flows from the canyon walls and along the canyon floor. Comparison of pre- and post-event multibeam echosounder-derived bathymetric data showed that in some locations up to 50 m of the canyon floor was eroded, while deposition was apparently more localized and at most up to a few metres. Preliminary analysis of camera imagery collected 10 weeks after this event indicated that the turbidity flow had been catastrophic for the once productive benthic community on the canyon floor (Mountjoy et al., 2018). Repeat photographic transects were subsequently collected at previously sampled sites 10 months and 4 years after the event. With these data from before and after the turbidity flow, Kaikōura Canyon provides a unique opportunity to examine the resilience of benthic communities to such large disturbances in the deep sea over time scales of weeks to years.
The aim of the present study is to compare seabed megafauna community structure before and after the Kaikōura Canyon turbidity flow to determine the community response to the large-scale disturbance. The management implications for the Hikurangi Marine Reserve, which includes most of Kaikōura Canyon, and the region’s productive deep-sea fishery are considered, along with the potential of turbidity flows to be used as proxies for predicting the impacts of large physical disturbances caused by global deep-sea mining in the future.
2 Methods
2.1 Study site
Kaikōura Canyon is located off the northeastern coast of New Zealand’s South Island (Figure 1). The canyon is 60 km long, ranges in water depth from around 20 m to > 2000 m, is generally U-shaped in profile, and is the primary source for the 1500 km-long Hikurangi Channel, which transports erosional sediments from the Southern Alps to a distal abyssal plain. The head of the canyon cuts deeply into a narrow shelf, bringing it within 500 m of the shore (Lewis and Barnes, 1999). Photographic data used in this study were collected from the head of the canyon, near the beginning of the turbidity flow path and where significant erosion occurred (Figure 1).
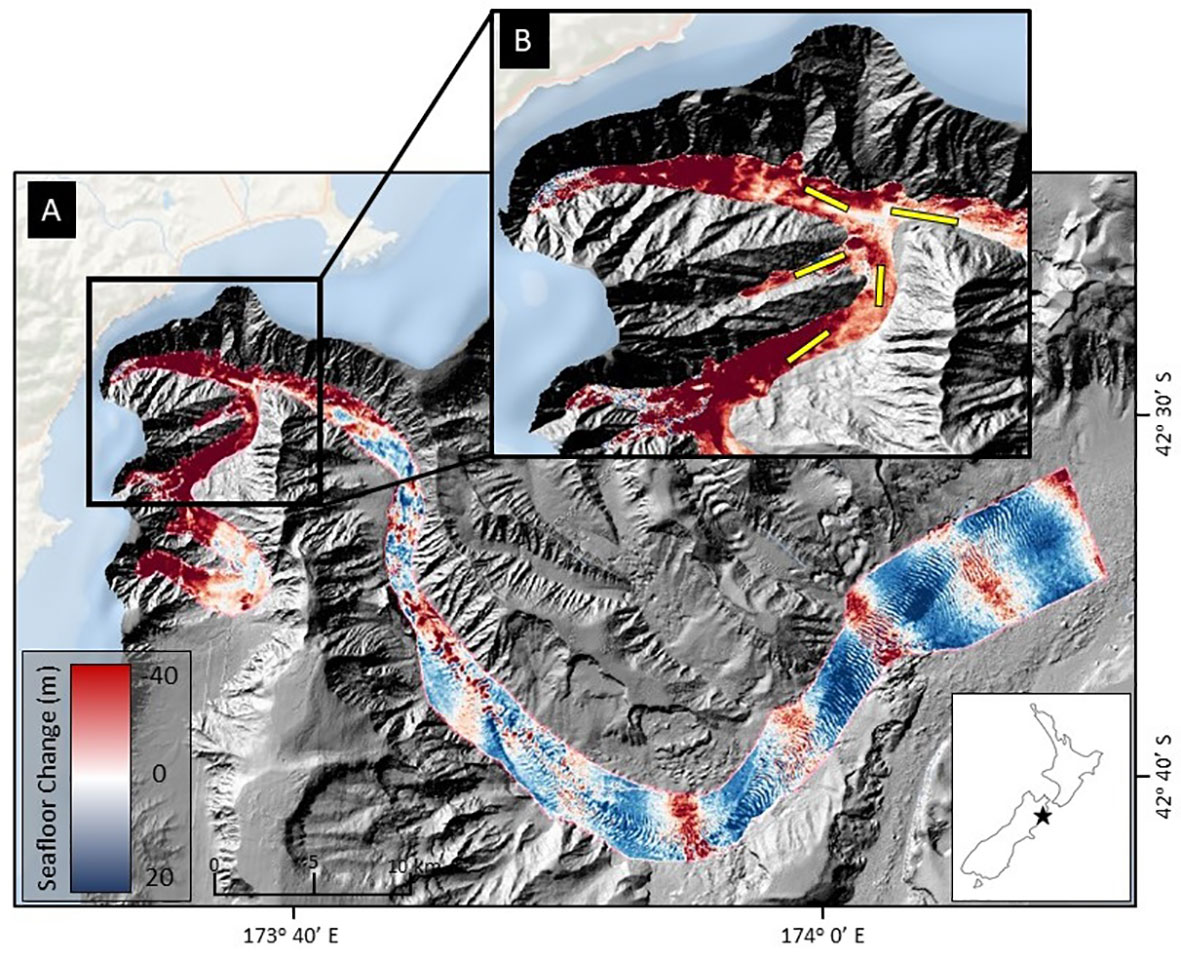
Figure 1 Location of photographic transects in upper Kaikōura Canyon overlayed on sediment density flow-induced bathymetry changes, following the November 2016 Mw 7.8 Kaikōura Earthquake. (A) Magnitude of erosion (red) and deposition (blue) within Kaikōura Canyon caused by the earthquake-triggered canyon flushing event, measured by the differencing the pre- and post-earthquake bathymetry data sets (Mountjoy et al., 2018). In this figure, the shelf break occurs where the pale blue bathymetry meets the gray canyon edge, generally around 80-100 m. The floor of the canyon ranges between 400 m and 2000 m. (B) Location of the time-series of towed camera transects (yellow lines) within the head of Kaikōura Canyon. The floor of the canyon in this figure ranges between 400 and 1200 m. Inset shows the location of Kaikōura Canyon (star) relative to New Zealand.
2.2 Image collection
Photographic surveys of the seafloor were conducted in Kaikōura Canyon from the R/V Tangaroa 10 years before the turbidity flow in November 2006 (De Leo et al., 2010), and 10 weeks, 10 months, and 4 years after the turbidity flow event in February 2017 (Mountjoy et al., 2018), September 2017, and October 2020, respectively. These surveys were all carried out using NIWA’s towed camera system, DTIS (deep-towed imaging system) (Hill 2009). DTIS is a battery-powered towed camera frame that records both high-definition video and high definition still images taken every 15 seconds. The downward facing still image camera resolution was 8 megapixels (Canon EOS 350D) in 2006 and 24 megapixels (Nikon D3200) in 2017 and 2020. Target speed and height above seafloor were 0.3-0.5 ms-1 and 2-3 m, respectively. Parallel lasers 20 cm apart were projected onto the seabed and used to calculate the seafloor area in each image. Five of the transects conducted in the 2006 survey at the head of the canyon were repeated during the subsequent voyages using the R/V Tangaroa’s dynamic positioning (Figure 1). Positioning of DTIS is monitored in real time using an acoustic ultra-short baseline (USBL) transponder system (Kongsberg HiPAP). Distance between repeated transects ranged between 0 and 50 m, and was mostly < 20 m. Transects varied in length between 1.02 and 1.52 km and were between water depths of 900 and 1200 m (see Table S4 for transect details).
2.3 Bathymetric data collection
Bathymetric data were collected using hull-mounted multibeam echosounders on the R/V Tangaroa 10 years before (Kongsberg EM300) and 8 months after the turbidity flow (Kongsberg EM302). Bathymetric data was also collected 4 years after the turbidity flow using a multibeam echosounder mounted on a HUGIN 3000 Autonomous Underwater Vehicle (AUV RAN; Kongsberg EM2040) deployed from R/V Tangaroa. Processed data were gridded at 25 m cell size resolution and exported to ESRI grid formats for use in ArcGIS Pro. From these grids, using the benthic terrain modeler package (Walbridge et al., 2018) seafloor terrain variables were generated: mean and standard deviation of depth, “Northness” (cosine of the aspect), “Eastness” (sine of aspect), seafloor ruggedness calculated as the vector ruggedness measure (VRM), mean, plan, and profile curvature, and mean and standard deviation of slope. All seafloor terrain variables were generated at five focal means (number of cells: 1 x 1, 3 x 3, 5 x 5, 15 x 15, 25 x 25), and standard deviations and ruggedness measures were calculated at grid sizes of 3 x 3, 5 x 5, 7 x 7, 15 x 15 for each focal mean. Due to AUV-collected bathymetry covering a smaller area than the shipboard multibeam it was not possible to get full overlapping coverage of all computed variables at all focal means for all times.
Pressure values were obtained from a SeaBird MicroCat Conductivity-Temperature-Depth (CTD) instrument (Model: SBE 37) attached to DTIS during each transect. The CTD took measurements at 15 second increments 10 years before, 10 weeks after, and 4 years after, and at 180 second increments 10 months after the turbidity flow. These pressure measurements were converted to depth in metres (+/- 0.01 m).
2.4 Image annotations
The online image analysis tool BIIGLE 2.0 (Langenkämper et al., 2017) was used to annotate all visible megafauna (invertebrates and fish > 2 cm; 40 labels), life traces of both epi- and infauna known as ‘lebensspuren’ (tracks, mounds, burrow holes etc; 20 labels), and substrate types (muddy sediment, dark grey sediment, blocky sediment, boulder, cobble, pebble, and bacterial mat; 7 labels) in all images for the five transects repeated at the four times (5,795 images in total). High densities of lebensspuren were noted in the canyon prior to the turbidity flow (De Leo et al., 2010). These biogenic structures provide insights into community function such as those related to bioturbation (turnover of sediments and nutrients) (Belley et al., 2010). Bioturbation is a critical controlling factor for oxygen penetration and organic carbon reworking in sediments (Meysman et al., 2006) and including the factor in analysis of community structure provides insight not otherwise attainable from the environmental metrics obtained from the bathymetry or imagery. The abundance of lebensspuren believed to not be associated with megafauna also annotated in the imagery (mounded and nested faecal casts and all dwelling traces except for elongated depressions; 9 labels, Table S2) were summed to represent “bioturbation” and included as an environmental factor in subsequent analysis (see below).
Visible fauna were identified to the lowest possible taxonomic level using standard taxonomic guides for the area (Tracey et al., 2011; McMillan et al., 2019) and with the assistance of taxonomists and para-taxonomists (see Acknowledgements). Some of the initial taxa identifications were combined to a higher taxonomic level before the final analysis to ensure consistency of identification across all times (Table S1). Best practices recommended for annotation labels of image- derived data were used where possible (Horton et al., 2021). Lebensspuren were identified using a regional guide ((Przeslawski et al., 2012); Table S2), and sediment substrates were categorized according to the Wentworth Scale (Wentworth, 1922). Counting the number of individuals or individual colonies was straightforward for most taxa, except for burrowing ophiuroids and the foraminiferan Bathysiphon filiformis. Burrowing ophiuroids were only partially observable, and so counts for this taxon were determined by dividing the number of arms observed above the seafloor by two, the number of arms typically observed above the sediment in aquaria studies (Hollertz et al., 1998). Due to large numbers of B. filiformis observed 4 years after the turbidity flow, total counts per image of this species for this time point were determined by making counts from subsets of the image. The images were gridded into nine equal rectangles (3 x 3 grid), and then a sub-set of four of the rectangles were randomly selected using a random number generator. All B. filiformis within the four randomly selected rectangles were then counted and the total number of individuals in the images four years after were estimated by scaling up from the subset (i.e., sum of B. filiformis in subset was multiplied by 9/4 = 2.25). Four rectangles was chosen as the number to analyze for its balance between sampling enough of the image and the amount of time necessary to obtain a reliable estimate of abundance (based on comparing counts of B. filiformis in each rectangle to the total number per image for those images taken before the turbidity flow).
Fauna abundances were standardized to 1 m2 of the seafloor and substrate area was standardized to percentage of the full image area prior to analysis.
2.5 Image data treatment
Only images from portions of transect that overlapped between surveys and with imaged seafloor areas between 0.5 and 2.5 m2 were selected from the five transects at the four times (2,768 images in total). The selected image area range was determined by first making plots of the numbers of taxa and individuals annotated per image by the area of each image (for transects collected 10 years before, 10 weeks after, and 10 months after the turbidity flow event). These plots were used to identify the area range where the two univariate community metrics were not influenced by the area of the image analyzed (Figure S1). Images outside this identified range were excluded to reduce any effect of seafloor area on the analysis, including to ensure that smaller organisms only detectable when the camera is close to the seafloor, or in later years when the camera quality improved, did not bias identification and abundance data. Data from 4 years after the turbidity flow event were not used to identify the seafloor area range to use for the data analysis because image analysis had begun before these data were collected.
The contiguous images along the transect were assigned to ‘sample groups’ with a maximum of ten images and a minimum of four images per group. Sample group membership was determined using a multivariate measure of pseudo standard error known as “MultiSE” (Anderson and Santana-Garcon, 2015) applied to the Kaikōura Canyon megafauna data. MultiSE evaluates the amount of variation in the position of group centroids in the space of the chosen dissimilarity measure (in this case Bray-Curtis) under repeated sampling. When applied to a series of sample group sizes MultSE can be used to determine when increasing the sample group size no longer results in greater precision (Anderson and Santana-Garcon, 2015). Creating sample groups allows for less computer intensive statistical analyses to be run while still accounting for variation along the transects as opposed to using data for every image in each transect. An alternative could have been to use average data for each transect; however, using average data would have caused issues for some of the selected analyses. For example, using the sample groups was necessary for running the DISTLM analysis (see below) because this analysis cannot be run if the ratio of variables to samples is too low (as would be the case with transect centroids).
Environmental variables derived from the bathymetry layers were extracted for each image based on the latitude and longitude of each image, and the average of these values was taken for each sample group. Water depth measurements derived from the CTD were assigned to each image or sample group (only done for 10 months after the turbidity flow when CTD sampling increment was larger and more aligned with sample group increments then individual image increments) based on timestamps associated with each image/sample group and the CTD measurements.
2.6 Statistical analysis
Unless noted, statistical analyses were carried out using routines in PRIMER 7 (Clarke and Gorley, 2018) with PERMANOVA + (Anderson et al., 2008).
2.6.1 Data treatment
Prior to running statistical tests, data transformation for down-weighting of abundances and the use of a zero-adjusted Bray-Curtis measure were applied to image level data. Down-weighting via transformation (square root or fourth root) lowers the influence of highly abundant taxa and makes the influence of rarer taxa to the community structure clearer (Clarke and Green, 1988; Clarke et al., 2006). Fourth root transformation was used for fauna abundances. The zero-adjusted Bray-Curtis measure adds a constant or “dummy species” of uniform abundance (1 individual) to all samples, which results in any comparisons between pairs of samples in which no fauna were recorded yielding zero dissimilarity. This method assumes such samples are that way for the same reason (Clarke and Gorley, 2018). This assumption is reasonable for samples in the Kaikōura Canyon time-series dataset because the samples with no records are primarily from the time point immediately after the turbidity flow and are assumed to be due to the disturbance.
2.6.2 Community structure
Variability in community structure through time was tested using main and pair-wise permutational multivariate analysis of variance (PERMANOVA). Sample group centroids were calculated from the zero-adjusted Bray-Curtis similarities between the transformed fauna abundances from the images providing similarity matrices for multivariate community structure data. The PERMANOVA was run on this sample group centroid similarity matrix with Type III (partial) sums of squares, unrestricted permutation of raw data and 9999 permutations. The results of this multivariate community structure analysis were visualized using three- and two-dimensional non-metric multi-dimensional (nMDS) ordination plots for fauna. The nMDS plots were made using data for sample group centroids and transect centroids. While the centroids allow for faster computation of tests, they also provide multiple ways of visualizing the data cloud and greater clarity of overall patterns. The RELATE, MVDISP, and PERMDISP routines were used to evaluate the patterns observed in the nMDS plot for sample group centroids and were therefore based on these data.
The recovery trajectory of fauna was evaluated with a RELATE test of cyclicity (Correlation method: Spearman rank (ρ), Number of permutations: 9999). This test measures how closely the fauna community structure through time matches a simple cyclical model (Ho: no cyclicity exists, ρ ≈ 0), i.e., community recovery towards original community state (Clarke and Gorley, 2018). Other patterns of recovery are possible, but in general communities follow a gradual progressive return to their original state that is described by a cyclical model (Holling, 1973).
The MVDISP routine determines the multivariate dispersion of the samples at each time point. This dispersion can be interpreted as the relative amount of heterogeneity or homogeneity at each time point and is an indication of a community’s response to disturbance, with higher variability being expected at disturbed sites (Warwick and Clarke, 1993). Permutational Analysis of Multivariate Dispersion (PERMDISP) (Number of permutations: 9999) was used to determine the significance of differences in the multivariate dispersion (Anderson et al., 2008). The SIMPER routine was run on all images and used to determine the contribution of the fauna to within and between community similarity for each time point. It was not possible to run the SIMPER analysis on the sample group centroids since both SIMPER and calculating centroids are run on the abundance matrix and generate a similarity/dissimilarity of the resemblance matrix (Anderson et al., 2008; Clarke and Gorley, 2018). Since centroids are not the same as averages (Anderson et al., 2008), the SIMPER analysis was done on the image level data to match the data used to generate the sample group centroids.
2.6.3 Environmental drivers
Distance-based multivariate linear regression models (DISTLM) were used to assess the relationship between environmental parameters and the faunal community structure for four of the five transects (the Gully site was not used because it lacked bathymetry data from the 4 years after time point). The DISTLM method creates regression models of the relationship between a multivariate data cloud and multiple predictor values (McArdle and Anderson, 2001). Correlation between environmental variables was checked before running the DISTLM using draftsman plots and correlation matrices. When Pearson’s r was >0.8 between variables, the variable which was correlated with the greater number of other variables was excluded from the analysis. If more than one variable correlated with others, the variable with the most correlations was kept and where possible the variable with the least missing data for the sample groups was kept (generally the variable with the smaller focal mean). In addition, variables with missing data for sample groups, primarily those variables at the larger focal means (25x25 and 15x15), were also omitted from the analysis. Values for the sediment and bioturbation variables derived from the images, except for muddy sediment, were transformed by log10(0.1+variable) to normalize their distribution. Following this process, 27 environmental variables (see bolded variables in Table S3) were used in a DISTLM for megafauna. The DISTLM was run with distance among sample group centroids as input data, stepwise variable selection, the Akaike Information Criterion (AIC) and 9999 permutations. Distance-based redundancy analysis (dbRDA) plots were used on sample group centroids to visualize the results of the DISTLM. dbRDA performs an ordination of fitted data based on the best model proposed by the DISTLM test (Anderson et al., 2008).
2.7 Predicting recovery
To estimate when the post-turbidity flow community in Kaikōura Canyon may recover to be similar to the pre-disturbance community, rates of recovery were predicted by fitting the observed similarities between the pre-turbidity and three post-turbidity communities to three common models of population growth [linear, exponential, logistic; (Lundquist et al., 2010; Solé et al., 2010)] using the generalized linear model and nonlinear least squares functions in R (R Core Team, 2022). Recovery in deep-sea habitats has been best modelled by a variety of population models (Barnthouse, 2004; Sciberras et al., 2018). Individual taxa within a community can display different population growth responses (McClanahan et al., 2007), and therefore to estimate the recovery of communities made up of many populations it is sensible to use a multiple population model approach. Studies generally consider a community recovered when it is no longer statistically different from the pre-disturbance or reference community (Bluhm, 2001; Jones et al., 2012; Wan Hussin et al., 2012; Jones et al., 2017). This recovery threshold has not yet been reached by the Kaikōura Canyon benthic community 4 years after the turbidity flow. Studies of shallow marine environments have found this point to be when the disturbed community is anywhere between 50 and 80% similar to an undisturbed community (Blyth et al., 2004; Smale et al., 2008). Rather than use an arbitrary similarity threshold, for the purposes of this predictive analysis it was assumed that the community could be considered recovered when it at least reaches the level of within-group similarity exhibited by the pre-turbidity flow community (i.e., 60%). That is, the difference between the average similarity of the post-turbidity flow community and the pre-turbidity community should be equivalent or greater than the variation expressed within the community before the disturbance. This recovery threshold is considered a minimum, and the level of similarity achieved when the pre- and post-turbidity are no longer significantly different may be higher.
3 Results
3.1 Community response to the turbidity flow
The Kaikōura Canyon megafauna community is recovering following the impact of the turbidity flow, though it is not identical in structure to the pre-disturbance community. This recovery is illustrated in multivariate ordinations of community similarity that show clustering of megafauna samples by time point (Figures 2A, B). The community was only 11-14% similar to the pre-disturbance community in the weeks and months after the turbidity flow, but by 4 years after the event, the community was 51% similar (Table 1). The recovery appears cyclical in nature in the ordination plots, though not yet complete, which is supported by the result of a test for cyclicity (ρ = 0.57, p < 0.01%). The community structure differed significantly between all time points (PERMANOVA, p<0.0001 for all comparisons, Table 2). Community variability (dispersion) (Figure 2A) was greatest 10 months after the turbidity flow (1.265), then decreased as recovery progressed towards the pre-earthquake community structure (, 4 years after: 0.628), and was significantly different between all time points (Pseudo-F = 40.721, P(perm) = 0.0001).
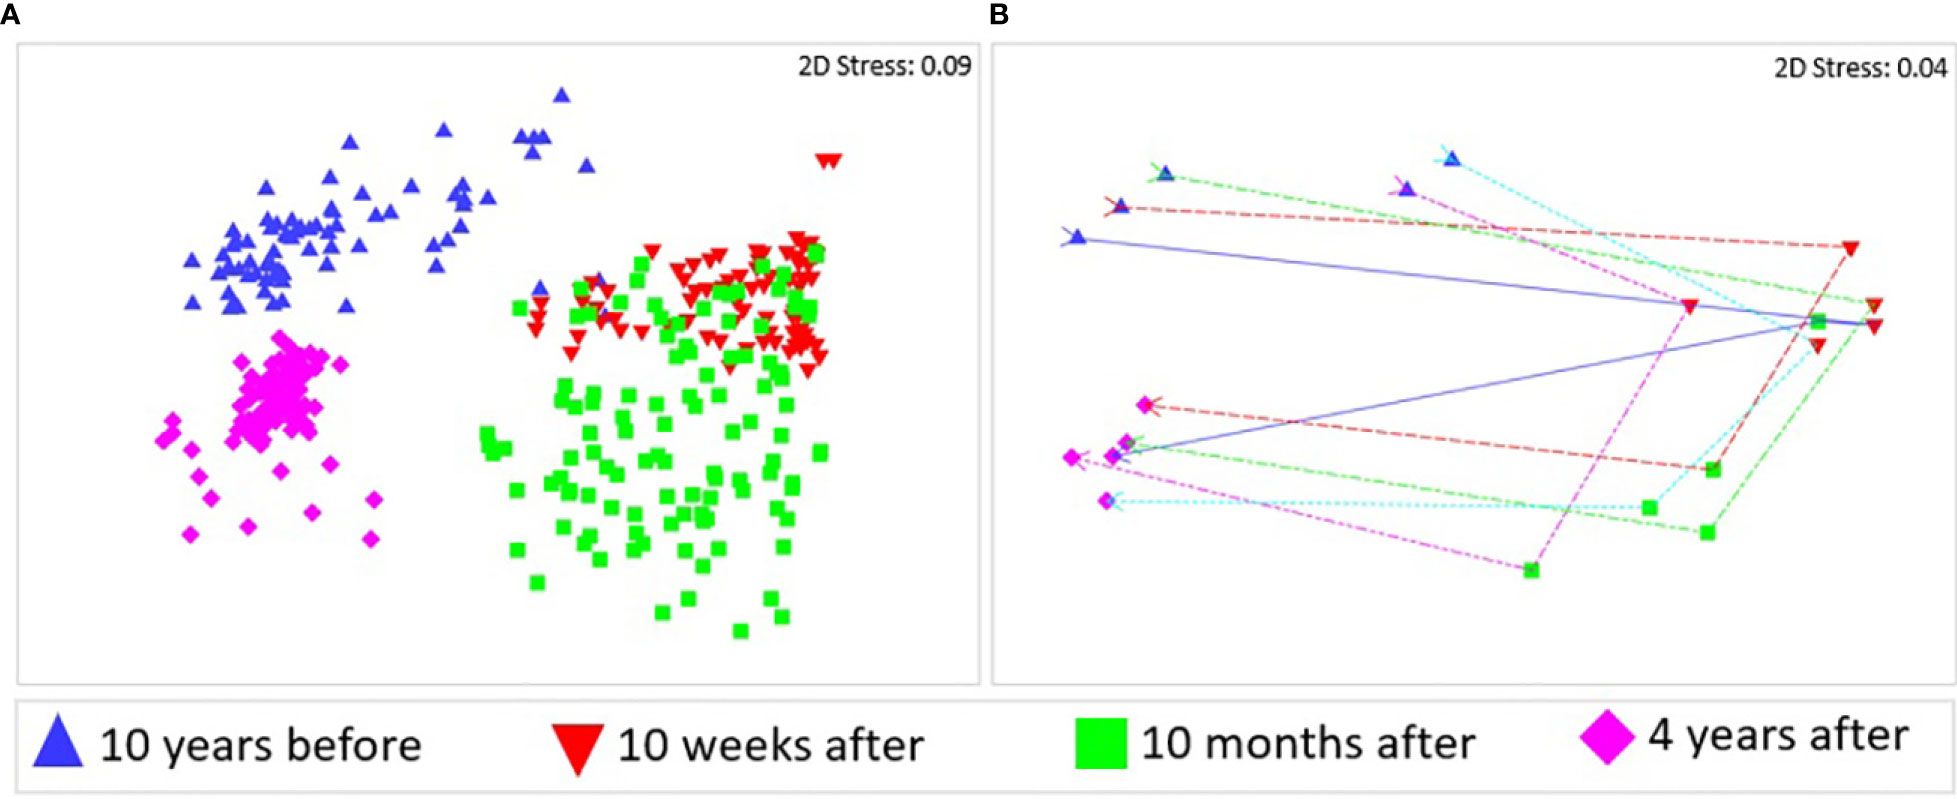
Figure 2 Non-metric multidimensional scaling (nMDS) ordinations of megafauna community similarity 10 years before the turbidity flow event and at 10 weeks, 10 months, and 4 years after it. (A) using centroids of sample groups (clusters of images), and (B) using centroids of transects. The lines follow transects through time. Similarities were calculated from zero adjusted, fourth root transformed fauna abundances and all stress values are <0.2, indicating that the plots are acceptable representations of the similarity patterns.
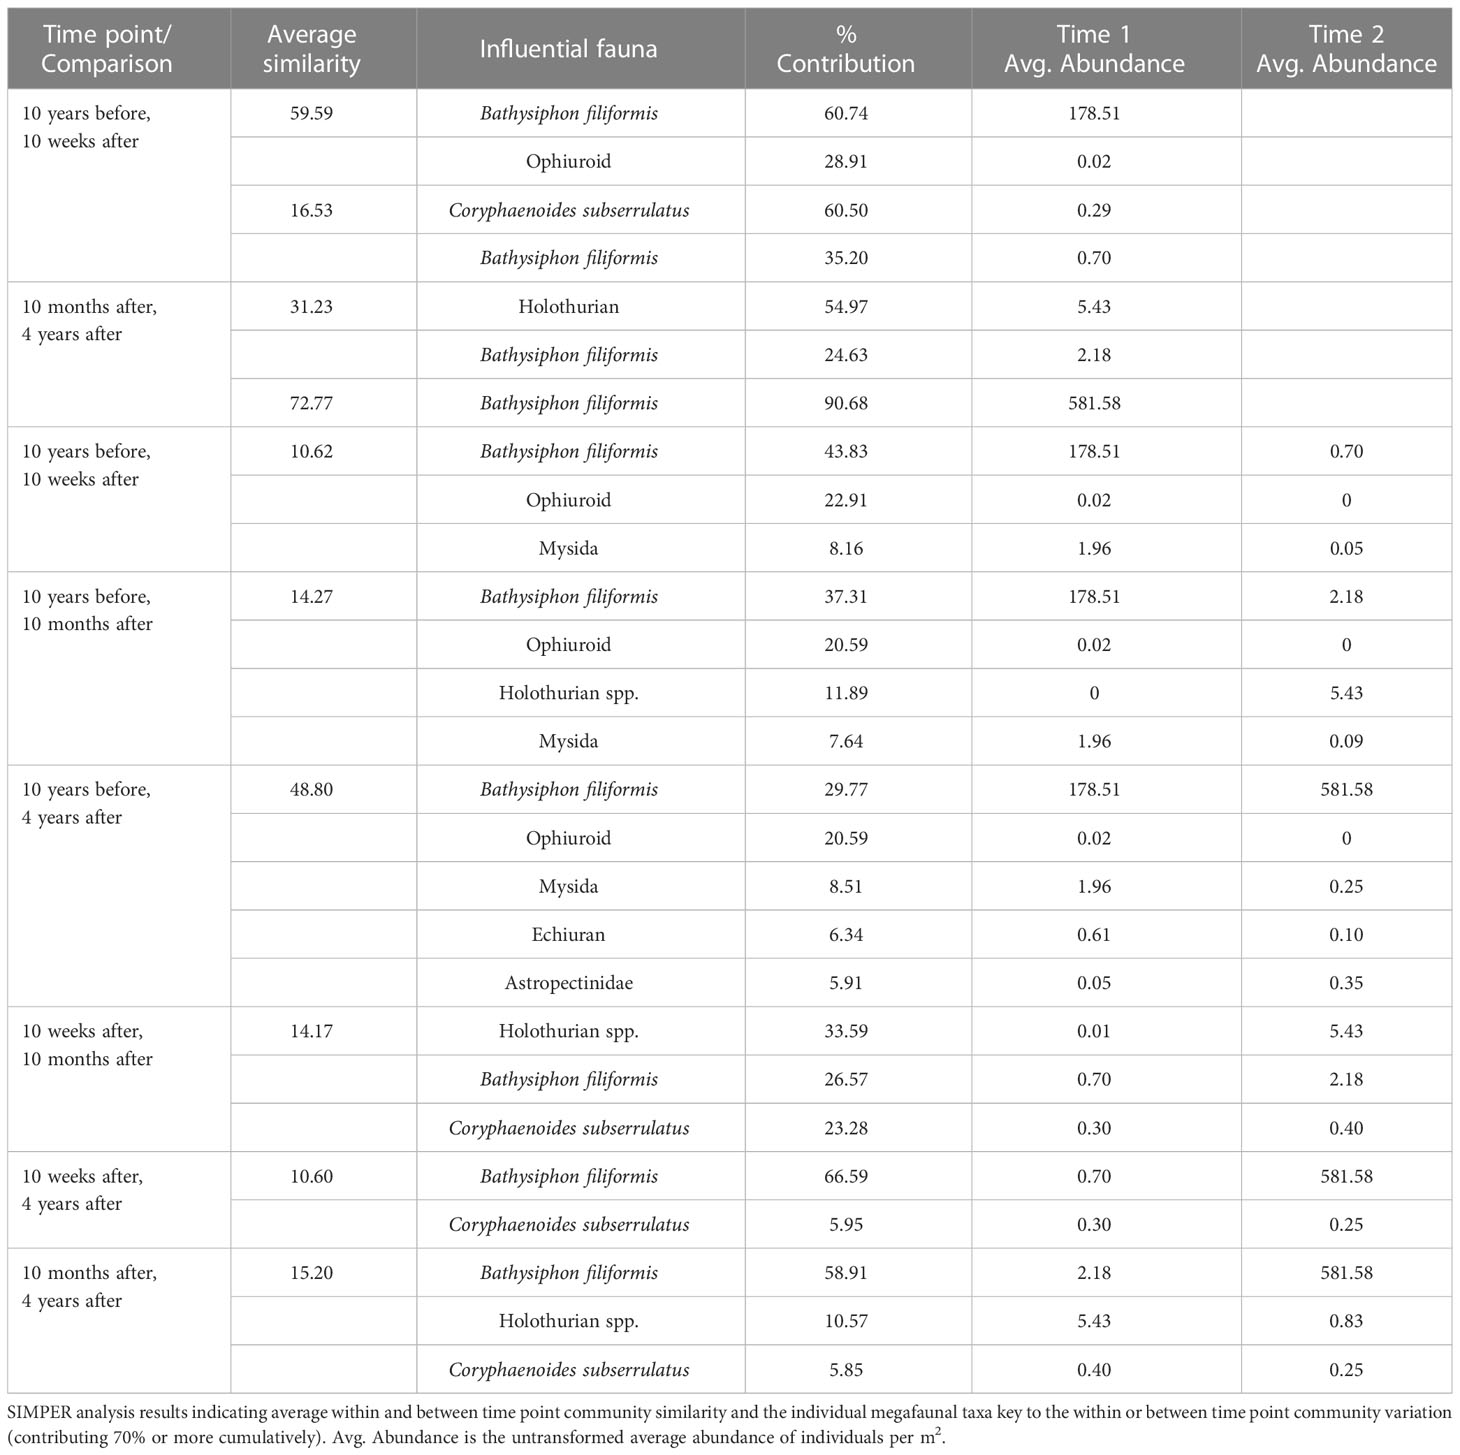
Table 1 SIMPER analysis results.
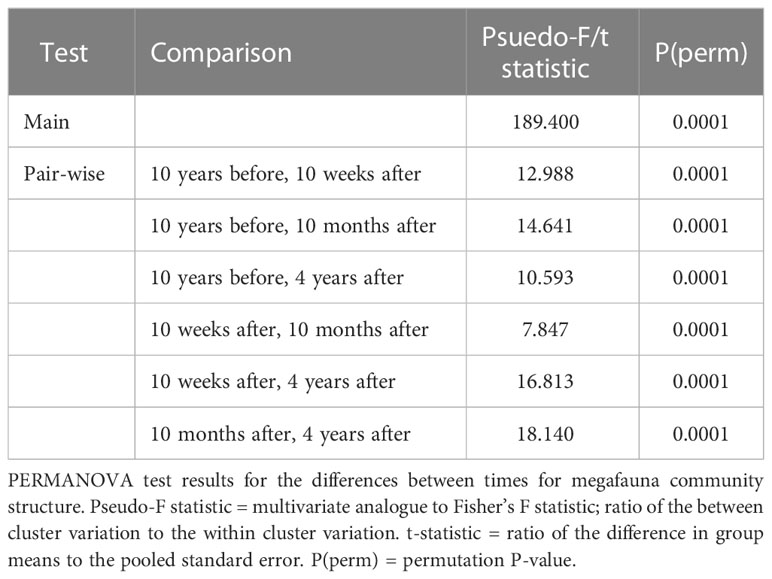
Table 2 Main and pair-wise PERMANVOA tests results.
3.2 Individual taxa contribution to the observed community response
The foraminiferan Bathysiphon filiformis was the only taxon that contributed consistently to the similarity of the communities at each time point. This species was the highest contributor to community similarity both 10 years before and 4 years after the turbidity flow, contributing 60% and 91% of the within time point similarity, respectively (Table 1).
Community dissimilarity among time points was generally explained by two to five taxa. Bathysiphon filiformis had the highest contribution to all dissimilarities among times, except for between 10 weeks after and 10 months after the turbidity flow, when it was the second highest contributor behind Holothuroidea spp. Other taxa that contributed to the community dissimilarity included Astropectinidae sea stars, Mysida crustaceans, Echiura spoon worms, and the rattail fish Coryphaenoides subserrulatus (Table 1). Abundances for B. filiformis, Astropectinidae, Mysida, Echiura, and Ophiuroidea decreased in the weeks and months following the turbidity flow and then increased towards recovery 4 years after the event. However, only B. filiformis and Astropectinidae abundances increased above pre-event levels (Figure 3A). The two exceptions to the general trend seen in the key taxa were C. subserralatus and Holothuroidea spp. Abundance of C. subserralatus increased above pre-disturbance levels 10 weeks and 10 months after the turbidity flow before decreasing to around pre-turbidity flow levels by 4 years after the event (Figure 3B). While Holuthuroidea spp. abundances increased considerably 10 months after the turbidity flow and remained higher than pre-event levels by 4 years after the disturbance (Figure 3B).
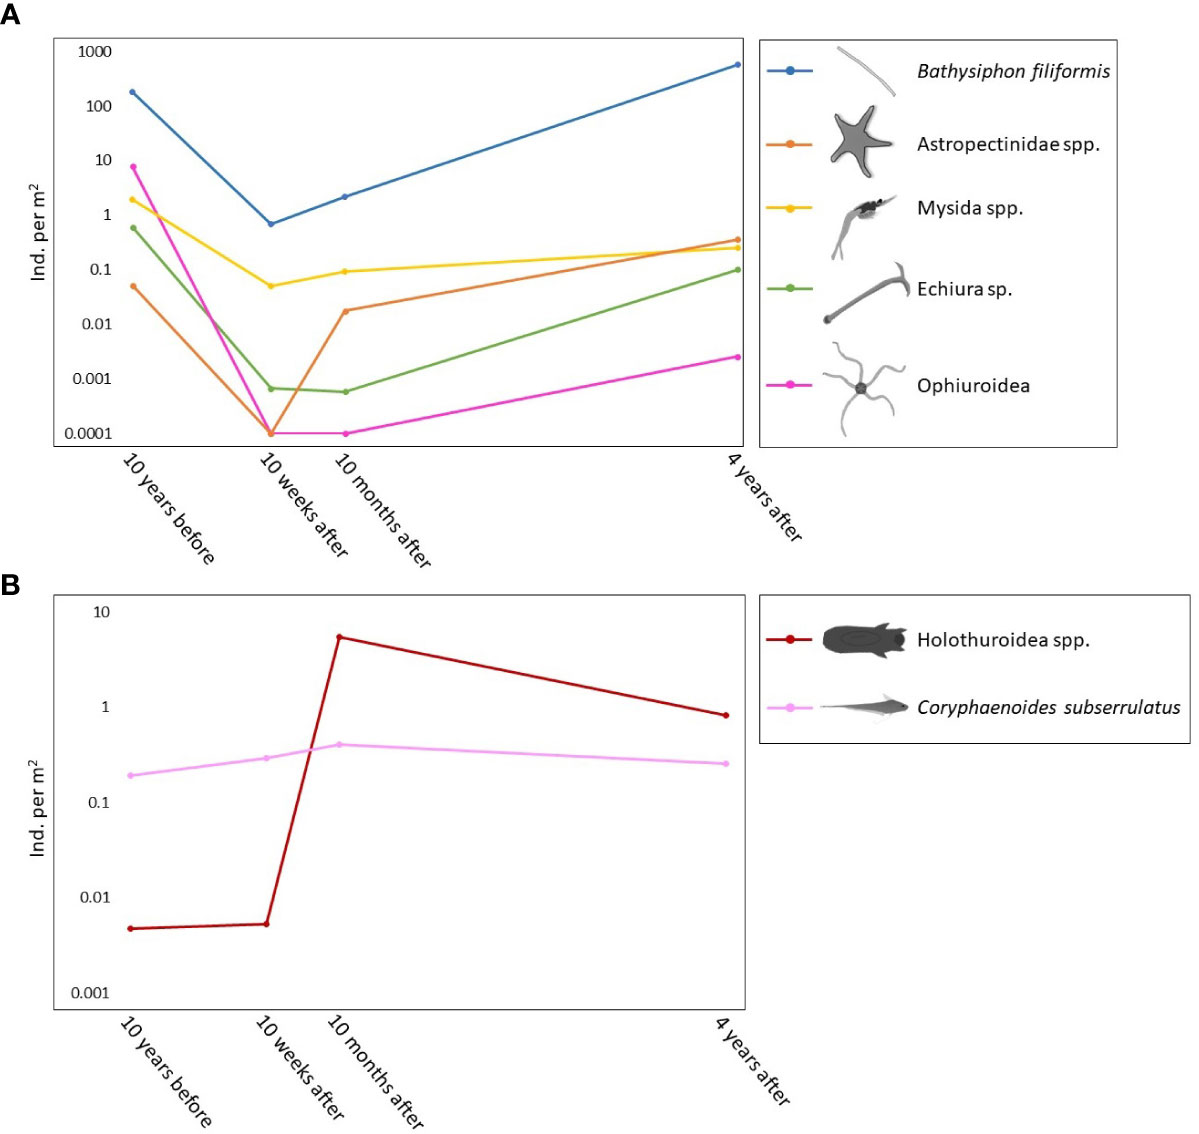
Figure 3 Line plots showing the change in abundance of key megafaunal taxa identified by the SIMPER analysis. (A) Primary pattern for five of the seven key taxa (B. filiformis, Astropectinidae, Mysida, Echiura, and Ophiuroidea); abundances decreased immediately after the turbidity flow but increased towards or above pre-event levels by 4 years after the event. The two exceptions to this pattern were (B) the rattail fish Coryphaenoides subserrulatus, which increased in abundance above pre-event levels 10 weeks and 10 months after the turbidity flow and Holothuroidea spp. which increased considerably in abundance 10 months after the turbidity flow and remained higher than pre-event levels by 4 years after the event. Scale for both plots is logarithmic.
3.3 Environmental variation related to the benthic community response
The best distance-based multivariate multiple regression model (AIC = 1953.6, R2 = 0.4910, RSS = 222,860) for megafauna included 18 environmental variables derived from bathymetry, physical oceanography, and imagery data, 14 of which were significantly correlated to the community structure (p-value ≤ 0.05) and explained 49.1% of the sample variation across all time points. The dbRDA visualization of this model is available in the supplementary material (Figure S2). Bioturbation and the standard deviation of water depth (FM: 3 x 3, GS: 3 x 3) explained most of the community variation (11.1% and 8.9%, respectively) (Table 3). Bioturbation and standard deviation of depth were much lower and higher (respectively) 10 weeks, 10 months after, and 4 years after the turbidity flow compared to 10 years before the event (Figure 4). While the depth (measured by the seafloor imaging vehicle’s onboard Conductivity-Temperature-Depth instrument), and substrate areas and lebensspuren (visible life traces of infauna used as proxy for bioturbation) were measured at the same spatial scale as the taxa, there was a discrepancy in spatial scale between the images (meter scale) and the multibeam echosounder-derived bathymetric variables (tens to hundreds of metres scale). This discrepancy may be why the regression model did not account for larger proportion of the total variation, although there are also other possible reasons for the model explaining only half of the variation in community structure across all time points (see Discussion). It must be noted that the highly correlated variables removed from this analysis could also likely explain the same variation in community structure; generally, the variables in Table 3 were correlated with the same variables at higher focal means.
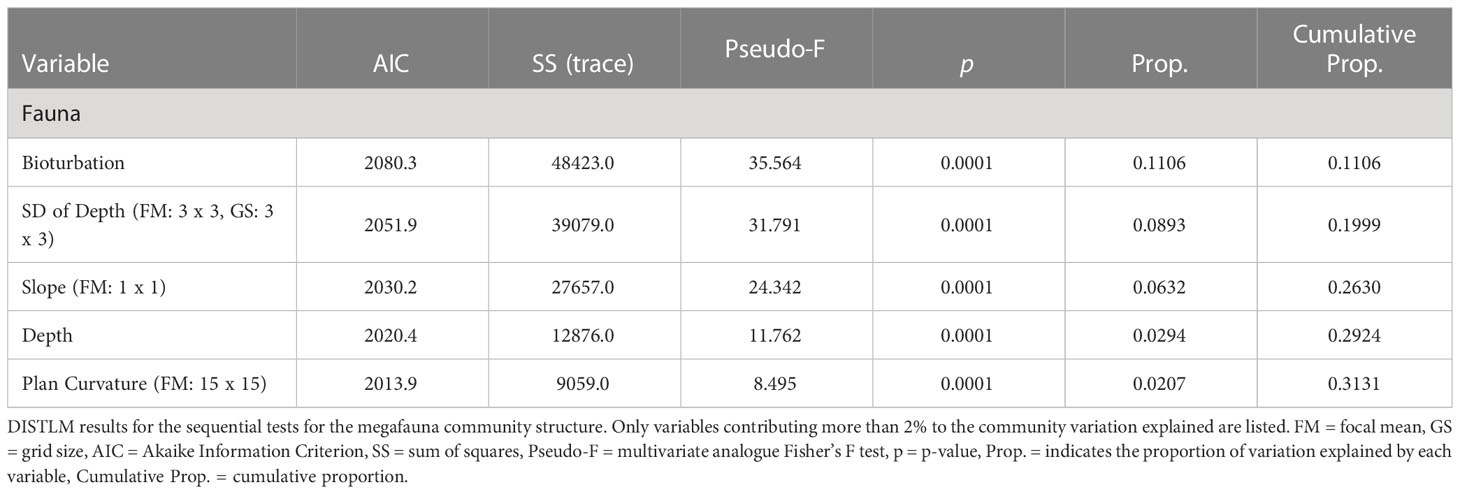
Table 3 DISTLM results.
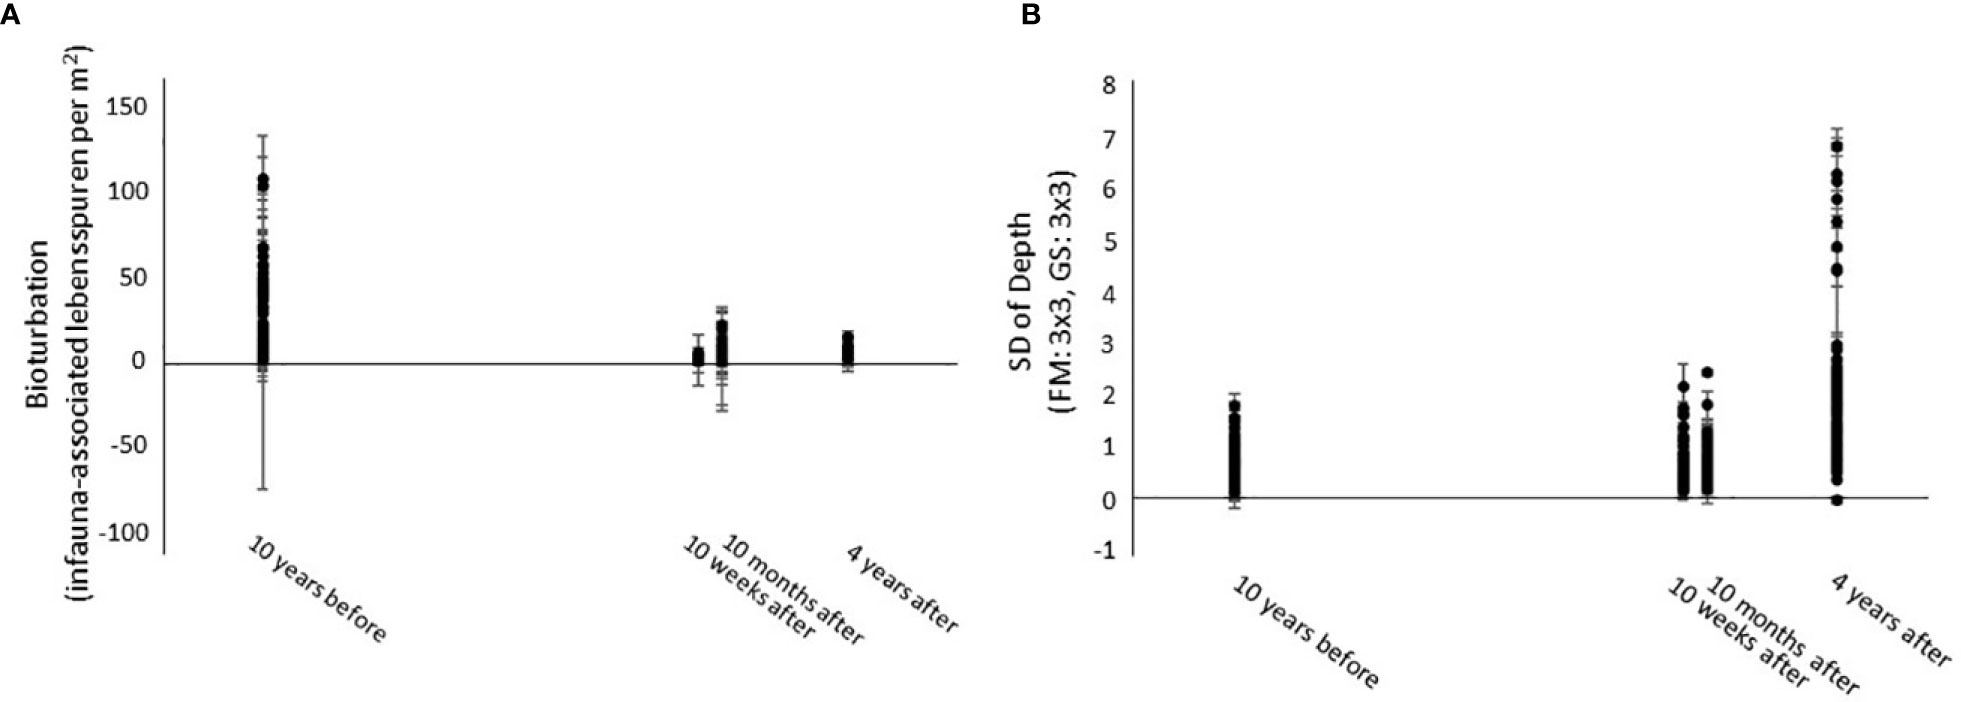
Figure 4 Scatter plots of the two most important environmental factors identified by the DISTLM analysis as influencing megafauna community structure. (A) Bioturbation (infauna-associated lebensspuren per m2) and (B) Standard deviation of depth (FM: 3x3, GS: 3x3).
3.4 Predicting the recovery of the megafauna community
Rates of recovery for the megafauna community were estimated using three different population growth models (linear, exponential, and logistic). These models estimate that the impacted benthic community could become as similar to the pre-disturbance community as the pre-disturbance community is to itself (60% within-group similarity) between 4.5 to 5.1 years after the turbidity flow. The shortest time to this predicted recovery threshold is modelled by both exponential and logistic growth and the longest is modelled by linear growth. However, achieving levels of similarity with the pre-disturbance community above this minimum threshold of recovery were predicted to take up to 12 years (Figure 5).
Figure 5 Predictions of megafauna community recovery in Kaikōura Canyon. Three hypothetical models of population growth (linear, exponential, and logistic) were used to predict the time to community recovery for the Kaikōura Canyon megafauna community (i.e., indicated by the grey area on the plot, where the lower threshold is defined by the 60% within-group similarity of the pre-turbidity flow community; see Methods for detailed justification for recovery threshold).
4 Discussion
4.1 Impact of the turbidity flow on megafauna community structure
The benthic megafauna community in Kaikōura Canyon was not resistant to disturbance caused by the 2016 Kaikōura Earthquake-triggered turbidity flow, but it appears that the community is resilient because it has begun to recover. Preliminary examination of seafloor imagery taken 10 weeks after the turbidity flow in the canyon suggested that the highly productive deep-sea community had been “wiped out” (Mountjoy et al., 2018). However, a full analysis of these images in the present study showed that while the community was very much affected by the benthic disturbance, occasional patches of the foraminiferan Bathysiphon filiformis were observed, as well as white bacterial mats similar to those observed at methane hydrate seeps (Baco et al., 2010), and there was a notable increase in abundance of small rattail fish, particularly Coryphaenoides subserrulatus, at 10 weeks after the event. At 10 months after the benthic disturbance event, the primary fauna were a large number of small holothurians, along with the highest abundance of rattails, primarily C. subserrulatus along with juvenile Coelorinchus spp., observed over the whole the study period (Figure 6C). Four years after the disturbance, the community appeared similar to the pre-disturbance community. However, while several key taxa, such as B. filiformis and Astropectinidae sea stars, were still present, they had become the dominant fauna and were observed at higher abundances than before the turbidity flow (Figure 6D). Furthermore. some pre-event fauna had not returned (e.g., ophiuroids, visible in Figure 6A but not in 6D) while other fauna observed were unique to this study’s final time point (e.g., sea pens, although not pictured in Figure 6). These findings were supported by the cyclicity correlation test, which indicated recovery was occurring but has not been fully achieved, and by the sample dispersion values, which were lowest 4 years after the event due to an increase in community homogenization over time since the disturbance.
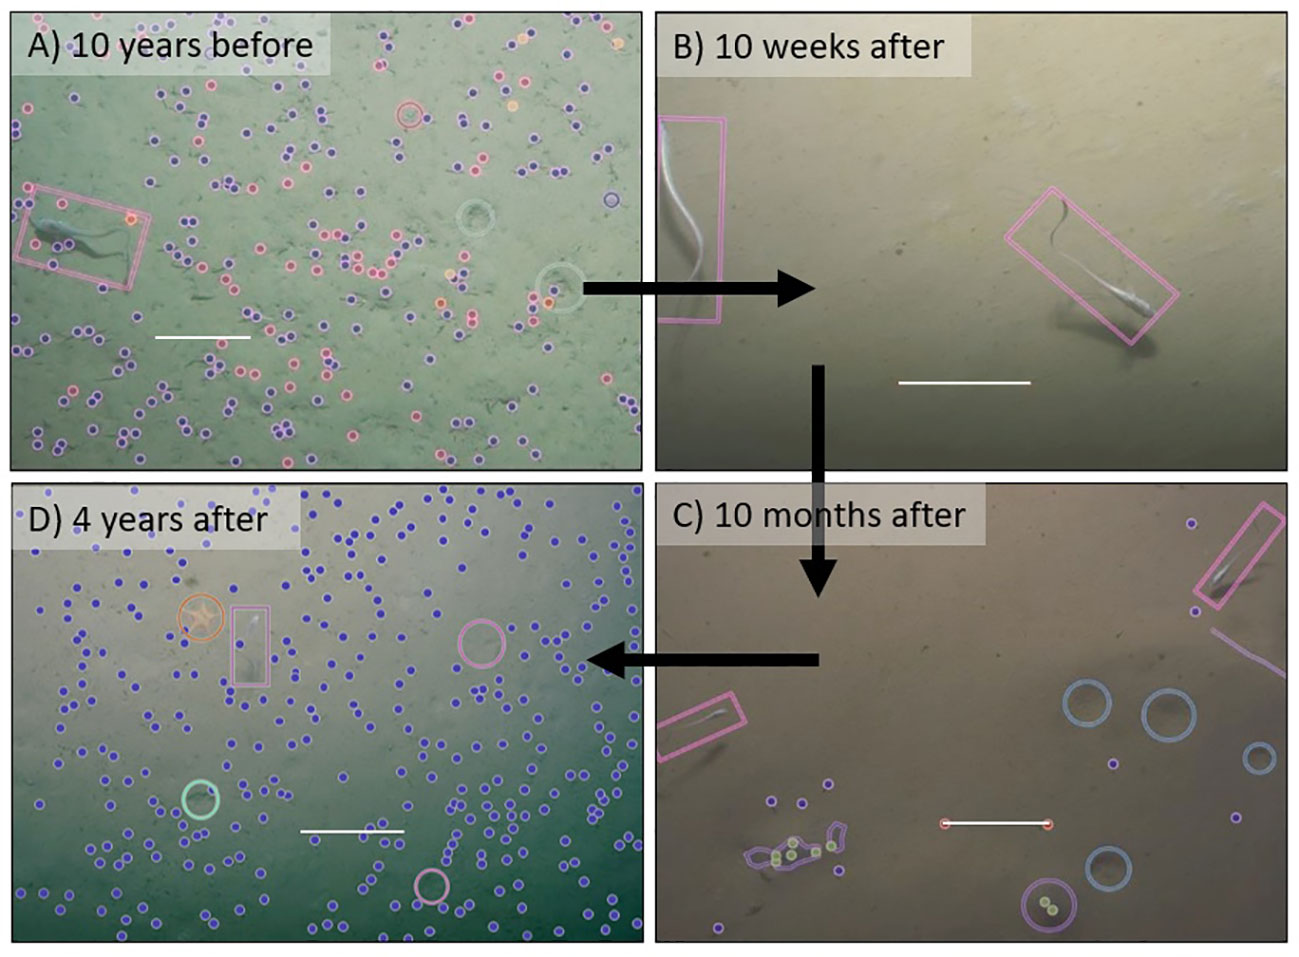
Figure 6 Seafloor images taken at the same location in Kaikōura Canyon at times before and after the earthquake-triggered turbidity flow illustrating relative changes in the occurrence and abundance of megafaunal taxa. Scale bars (white line) in all images are 20 cm. Images include annotations. Key: blue dots = B. filiformis, magenta dots = burrowing ophiuroid arms, red dots = single burrow, pink rectangles = fish, yellow dots = Mysida crustaceans, dark pink circles = oblique burrow, green circles = rattail feeding marks, cyan circles = large depressions, purple outline = dark grey sediment, green dots = burrow with grey sediment, light pink circles = sea star resting marks, orange circles = sea stars.
The foraminiferan B. filiformis is a key organism for understanding the recovery dynamics from the turbidity flow in Kaikōura Canyon. Bathysiphon filiformis were present at all sample times and contributed significantly to the similarity patterns among times. Abundances for B. filiformis 10 weeks after the turbidity event were approximately a hundredth of what they were prior to the event (10 years before: 178.51 ind. per m2, 10 weeks after: 0.7 ind. per m2) but had increased to greater than pre-event abundances by 4 years after the turbidity flow (581.58 ind. per m2). This finding may indicate that the canyon is still in a relatively early successional stage, which is generally characterized by high abundances of early arrival taxa (Odum, 1969). Bathysiphon filiformis and other Bathysiphon species have been found in organic-rich and sometimes low oxygen environments, such as canyons, continental slopes, and methane seeps (Gooday et al., 1992; Hecker, 1994; Hess et al., 2005; Koho et al., 2007; Grupe et al., 2015; Sen et al., 2017), and in stratigraphic studies of turbidites (Crimes and Uchman, 1993; Saja et al., 2009; Grunert et al., 2013), and are considered an indicator of disturbance (Ortiz et al., 2011). As an early colonizer of disturbed environments, B. filiformis may be providing important substrate for small and larval fauna (Gooday et al., 1992) and promoting deeper oxygen penetration or reworking of surface organic carbon (Schaff and Levin, 1994).
High abundances of the rattail C. subserrulatus 10 weeks and 10 months after the turbidity flow, and juvenile Coelorinchus spp. 10 months after, are likely due to these mobile faunas being able to quickly return to the canyon floor habitat after the disturbance (Lefèvre and Bellwood, 2015). Similarly, an increase in fish activity described as a “feeding frenzy” was observed after the Loma Prieta earthquake in the Monterey Canyon (Okey, 1997). However, little is known about the timing of reproduction for C. subserrulatus (Neat, 2017), so an increase in individuals due to a local spawning event instead cannot be ruled out. The dominance of smaller rattail species [which eat benthic and benthopelagic macrofauna (Jones, 2008a; Jones, 2008b)] in the weeks and months after the event, while larger rattail species (which eat smaller fish along with macrofauna (Jones, 2008b)) had not returned until 4 years after, suggests challenges for animals feeding at higher trophic levels to find the necessary size or quantity of prey items after the benthic disturbance event.
While overall the megafauna community at the head of Kaikōura Canyon appears to be on the path to recovery, 4 years after the turbidity flow the response of specific taxa was variable. Some taxa such as echiurans (possibly the deposit-feeding echiuran Alomasoma nordpacificum noted as a biomass dominant in Kaikoura Canyon prior to the turbidity flow by De Leo et al., 2010, but physical samples were not collected so identification could not be confirmed) and mysids were present but at lower abundance levels than before the turbidity flow event, while other taxa (e.g., burrowing ophiuroids from the family Amphiuridae, an isopod species from the family Arcturidae, and an unidentified polychaete (Polychaete sp. 1)) had yet to return to the upper canyon site even 4 years after the turbidity flow. Furthermore, other taxa (including two unidentified polychaetes (Polychaete sp. 2 and Phyllodocidae sp.), two nemertean species (Nemertea sp. 1 and Nemertea sp. 2), sea pens, and the echinoids Brissopsis oldhami and Paramaretia peloria) were only observed at the final time point of the present study.
The burrowing ophiuroids and the Arcturidae isopods may not have returned yet because many species within the Amphiuridae family and the Isopoda order are brooders (Hendler, 1975; Hendler and Tran, 2001; Johnson et al., 2001; Tyler and Gage, 2020), meaning that eggs are retained by adults until hatching. Therefore, adult individuals would need to return and reproduce in the canyon before the population could re-establish. Conversely, free-spawning species, such as nemerteans and sea pens (Stricker et al., 2001; Pires et al., 2009; Servetto et al., 2013), which release free swimming larva into the water may have an advantage after a disturbance as both adults and juveniles can independently establish in the ‘opened’ habitat patches (Grassle and Morse-Porteous, 1987). Another reason that some taxa have not returned may be that other taxa that arrived sooner after the disturbance filled the same niche and outcompeted or prevented the previous taxa from returning (Sousa, 1979). This inhibition may be the case for Polychaete sp. 1, as there were two other unidentified polychaetes that were seen 4 years after but not 10 years before, which may have replaced Polychaete sp. 1. However, there were relatively few nemertean, sea pen, and new polychaete individuals observed, so data from future surveys would be necessary to determine whether or not they become established members of the benthic megafauna community.
In the case of the apparently unique presence of the echinoids B. oldhami and P. peloria 4 years after the turbidity flow, the observations of these taxa in the images may be more about the change in distribution of nutrients or oxygen in the sediments as an effect of the turbidity flow rather than the arrival of new species. Brissopsis oldhami were present in Kaikōura Canyon prior to the turbidity flow but only recorded below the sediment surface in sediment samples taken using grabs (De Leo et al., 2010). Studies of deep-sea imagery and modern ichnofacies (an assemblage of trace fossils that are indicative of habitat conditions) have shown shifts in echinoid foraging behavior in response to high quality food (Wetzel, 2008; Miguez-Salas et al., 2022). Natural sedimentation in the Conway Trough arm of the canyon has been estimated as high as 1.7 m (1000 yr)-1 (Carter et al., 1982), and sediments in Kaikōura Canyon are known to have higher organic matter content than surrounding regions (Leduc et al., 2014). In addition, tens of thousands of shallow terrestrial landslides, also triggered by the Kaikōura Earthquake (Dellow et al., 2017; Massey et al., 2020), may have increased riverine suspended sediment loads and direct sediment flux to the marine environment for a period after the earthquake (Croissant et al., 2019) along with the presumed transport of dead fauna and macroalgae from intertidal waters (resulting from uplift caused by the earthquake (Thomsen et al., 2020)) to deeper waters. Overall, a large amount of sediment and associated organic carbon would likely have been deposited on the canyon floor at the time or soon after the turbidity flow event. Further, oxygen levels are typically quickly depleted where oxidation of organic carbon occurs (Reimers et al., 1986) (Glud, 2008) and bioturbation is the most important vector for oxygen transport into sediments (Revsbech et al., 1980), so it would be expected that sediment oxygen levels would be reduced after the turbidity flow, when higher levels of organic carbon are present and lower levels of bioturbation are reworking the sediment (see below). Therefore, the presence of B. oldhami on the seafloor surface 4 years after the turbidity flow (and therefore in images taken by the towed camera) may be due to organic carbon being more readily available on the surface for deposit feeding and/or they might be avoiding lower oxygen levels at depth within the sediment even 4 years after the turbidity flow. Additionally, the influx of small epibenthic holothurians seen 10 months after the turbidity flow may also have been due to the increased organic carbon availability following the turbidity flow. The relative abundance of the holothurians 10 months after the disturbance rivalled that of all other key taxa (except for B. filiformis) at all time points. Similar holothurians have been seen in other canyon systems (ascribed to the Elpidiidae family (Rowe, 1971; Amaro et al., 2015)) where they have been linked to the presences of fresh phytodetritus (Amaro et al., 2015) with reproductive strategies that promote reproduction and recruitment in response to favorable food conditions (FitzGeorge-Balfour et al., 2010).
The presence of fauna not observed before the turbidity flow along with the absence of some taxa observed before the event may indicate that an alternative megafauna community state is forming at the head of the Kaikōura Canyon. Alternative stable states occur when the community crosses an alteration threshold - often attributed to large-scale disturbance (Scheffer et al., 2001) - and state-type shifts occur in species composition (Holling, 1973; May, 1977). However, whether the observed changes in the overall structure of the benthic community following the “full canyon flushing” event represent an alternative stable state rather than a path to the previously observed pre-event state, which itself could be a “relic of a former disaster” (87), remains to be determined by future sampling.
4.2 Time to recovery of the megafauna community
Estimates of the minimum time until recovery for the megafauna community in Kaikōura Canyon were between 4.5-5.1 years, although recovery could take up to 12 years if higher levels of similarity between a pre-disturbance and recovered community are used (e.g., 80%, Blyth et al., 2004) or observed when there is no significance difference between pre- and post-disturbed communities. Previous studies of modern turbidity flows have not focused on megafauna. However, indications of recovery and estimates of minimum time until recovery from the present study are longer than what has been observed in other modern turbidity flow studies of meiofauna (1.5 years; (Kitahashi et al., 2014; Kitahashi et al., 2016; Nomaki et al., 2016)). Recovery indications from the present study, however, are significantly shorter than studies of ancient turbidity flows, which have suggested impacts from the turbidity flows on mega- and macrofauna benthic communities were still observable hundreds to thousands of years later (Griggs et al., 1969; Huggett, 1987; Briggs et al., 1996).
One reason that Kaikōura Canyon megafauna do not fit the previous slow recovery paradigm may be because they are in the head of a physically active canyon in the bathyal zone (905-1190 m) rather than deeper abyssal, submarine fan environments (between 2900-5050 m) which have been the focus of previous studies on ancient turbidity flows. With increasing depth there is a decrease in abundance and size of organisms due to decreased nutrient availability and slower growth rates compared to shallower waters (Thiel, 1992; Rex et al., 2006), and it is therefore probable that communities in abyssal environments may be more susceptible to impact from large-scale disturbances (Radziejewska and Stoyanova, 2000; Stratmann et al., 2018). In addition, submarine canyons are high energy environments that are frequently disturbed by strong bottom currents, internal tidal mixing, and mass wasting events of various sizes (Fernandez-Arcaya et al., 2017), such that communities in these environments are expected to be resilient to physical disturbances on a range of temporal scales (Rowe, 1971). As already noted, full canyon flushing events in Kaikōura Canyon, like the example studied here, might reoccur at centennial intervals (Mountjoy et al., 2018) with smaller, more localized submarine landslides, debris flows, and turbidity flows occurring more often (Lewis and Barnes, 1999; Mountjoy and Micallef, 2018). This difference in disturbance regimes is important to keep in mind when considering our understanding of the broader impact of turbidity flows on deep-sea ecosystems, as many early studies were of distal abyssal, submarine channel, and distil fan environments which are only reached periodically by very large turbidity flows on millennial timescales (Bigham et al., 2021). As such, fauna at these distal sites will likely have experienced less pressure to adapt to regular disturbances than fauna undergoing more frequent disturbance at canyon heads. While beyond the scope afforded by the dataset of the present, there may well be a difference in the impact from the sediment density flow in the head of Kaikōura Canyon, where the primary disturbance was mass erosion, compared to further along the flow path in the Hikurangi Channel or the abyssal submarine fan where it would be expected that the disturbance would be more depositional in nature, and where historical disturbances are typically less frequent.
4.3 Changes in environmental factors and potential influences on megafauna community
Lebensspuren indicative of infauna (not directly counted as visible megafauna) were almost non-existent immediately after the turbidity flow and by 4 years after the event the abundance of these life traces was around half that of pre-disturbance. This finding may mean that the infauna community [such as the biomass dominant, mound building holothurian Molpadia musculus sampled by sediment grabs before the turbidity flow (De Leo et al., 2010)] may not be recovering as rapidly as the visible megafauna community and that even 4 years after the turbidity flow, organic carbon in the sediment is not being reworked by the infauna in the way it was 10 years before the event. As such, low rates of bioturbation may be preventing or slowing the recovery of some megafauna. For example, as discussed above, vertical shifts in urchin distribution may be related to the reduced bioturbation that would facilitate organic carbon and oxygen reaching deeper depths. Modelling of the influence of environmental variables on the megafauna community identified ‘bioturbation’, a factor calculated from the sum of infauna and faecal lebensspuren, as the most important variable. However, it is also possible that the correlation was just coincident with the changes brought about independently in the infauna. Future studies focused on the infauna will hopefully resolve these speculations.
Though the overwhelming change to the seafloor bathymetry at the head of the Kaikōura Canyon was erosional (10s of metres of sediment removed (Mountjoy et al., 2018), the imagery of the seafloor 10 weeks after the event showed a relatively smooth seafloor characteristic of freshly deposited material (for a field of view of between 0.5 and 2.5 m2). This apparent deposition of sediment may be due to the complex nature of turbidity flows and other components of sediment density flows (Maier et al., 2019; Ge et al., 2022), subsequent sediment deposition from small landslides caused by after-shocks (Völker et al., 2011), or the naturally high sedimentation rate within the canyon driven by the combination of oceanographic processes such as along-shore drift, tidal flows, wave-resuspension, and seaward sediment advection (Thiel, 1992). In general, the turbidity flow increased the rugosity of the canyon floor by increasing the variability in the slope and depth, and from visual observations apparently dislodged large blocks of angular sediment and exposed or redeposited boulders and gravel. These more rugged terrain features were still evident at least 10 months after the disturbance event. While rugged terrain has been identified as a significant environmental factor in structuring faunal communities in other deep-sea environments (du Preez et al., 2016; Post et al., 2017; Gutt et al., 2019), it has typically been due the presence or absence of rocks and other hard substrates. In Kaikōura Canyon there was no evidence of unique fauna associated with the exposed boulders and cobbles on the seafloor, and taxa observed throughout the surveys were all soft sediment taxa. One unique feature observed only 10 weeks after the event was small patches of white bacterial mats, probably indicative of reducing conditions associated with elevated levels of available organic carbon (Baco et al., 2010). These short-lived mats were similar to those seen between 5 months and 1.5 years after the Tōhoku Earthquake-triggered turbidity flow in the Japan Trench, which were fuelled by the breakdown of megafauna carcasses (Tsuji et al., 2013). Despite the presence of hard rocky substrates and bacterial mats soon after the turbidity flow, by 4 years post-event the substrate of within Kaikōura Canyon was predominantly muddy sediments as it was before the event, presumably due to the naturally high sedimentation rates within the canyon.
Overall, the modelling of the influence of environmental variables on the benthic community only accounted for half the variation in the community structure over time, which may be because other unmeasured environmental factors were responsible for the recovery process. These may include: (1) non-local environmental factors that influence recruitment (i.e. larval dispersal) including the distance to nearest undisturbed patch and currents (Lundquist et al., 2010); and, (2) the unmeasured chemical conditions of the sediments and/or overlying water column which can be influenced by infauna bioturbation rates as well as subsequent sediment remobilization by aftershocks or slope instability (14).
4.4 Management implications
Many submarine canyons support important deep-sea ecosystems but are subjected to impacts from human activities including fishing, dumping of land-based mine tailings, oil and gas extraction, and litter. As such, some canyons have been designated marine protected areas to conserve their important ecological function (Fernandez-Arcaya et al., 2017). Kaikōura Canyon was designated a part of the Hikurangi Marine Reserve in 2014 due to recognition as a benthic productivity hotspot (De Leo et al., 2010) and of the wider ecosystem services it provides (Fernandez-Arcaya et al., 2017). The reserve is the deepest and largest of New Zealand’s marine protected areas on the main islands, and the only one that protects a deep-sea submarine canyon. The full canyon flushing event triggered by the 2016 Kaikōura Earthquake could have impacted the conservation efficacy of this reserve. While the megafauna community in the canyon head is showing clear signs of recovery, the community is yet to reach full recovery 4 years after the event. As such, it is not yet certain whether or not the ecosystem services once provided have returned. The original community may have had a high degree of functional redundancy, and so the return of some taxa may not be critical for maintaining previous functions (Tilman and Downing, 1994). However, previous functions mediated by bioturbation, which apparently remains reduced, have probably yet to fully return. Furthermore, the decreased local diversity and abundances of the megafauna community currently observed during the recovery phase means that the functional redundancy of the benthos is likely much reduced. This likelihood in turn makes the canyon’s benthic community, and thereby the marine reserve’s efficacy, vulnerable to further impact from subsequent perturbations until full recovery is achieved (Rosenfeld, 2002). Anthropogenic and environmental disturbances are increasing in many ecosystems (Oliver et al., 2015), and the seafloor communities in Kaikōura Canyon will not be immune from such disturbances; for example, riverine sediment input is increasing in other parts of New Zealand due to increased rainfall and land erosion because of climate change (Crozier, 2010). Additionally, while bottom trawling is not allowed in the reserve, it does occur in the surrounding areas (Ministry for Primary Industries, 2022) and studies elsewhere have shown that nearby bottom trawling can focus and increase sedimentation within submarine canyons (Puig et al., 2012; Paradis et al., 2018). Therefore, additional protection of the benthic communities surrounding the reserve may be needed while the full ecosystem services provided by the communities of Kaikōura Canyon are re-established.
Despite the increase in abundance of small and juvenile rattail species in the weeks and months after the turbidity flow, few large rattail species or other fish were observed by the end of the study, which may indicate a temporary decline in the upward trophic movement of organic carbon in the canyon. This potential impact on trophic pathways may be the reason why sperm whales – an important tourist attraction nationally - were absent from the upper canyon and had moved to nearby canyon and gully features to forage for pelagic prey (squid and demersal fish (Gaskin and Cawthorn, 1967)) for up to a year after the turbidity flow (Guerra et al., 2020). This decline may have also impacted local fisheries, if rattail abundances and sizes are reflective of other benthic and benthopelagic feeding fish. A number of demersal fish species – which are generally carnivorous, feeding on crustaceans, squid, and fish smaller than themselves (Rosecchi et al., 1988; Connell et al., 2010) - are caught in both recreational and commercial fishing around Kaikōura Canyon (Francis, 1979; Doonan and Dunn, 2011; Parker et al., 2011), with rattails being a common New Zealand-wide bycatch species (Ballara et al., 2010).
Debris and turbidity flows create large-scale erosional and depositional disturbances, and thus, could be considered as proxies for some anthropogenic disturbances, such as deep-sea seabed mining. Estimates from this study put recovery of the megafauna community in Kaikōura Canyon within a minimum of 4.5-5.1 years and as long as 12 years. This prediction indicates that the community is likely to be relatively resilient to large-scale disturbances from turbidity flows, which is encouraging for the long-term efficacy of the Hikurangi Marine Reserve. However, studies looking at the small-scale experimental impact of seabed mining type activity on deep-sea fauna have found that megafauna communities can take up to 3-7 years before showing signs of recovery (Bluhm, 2001) or show no signs of recovery two decades after the simulated mining event (Jones et al., 2017). However, there are a number of reasons why the estimate of community recovery from the turbidity flow in Kaikōura Canyon is not a useful proxy for understanding recovery from deep-sea mining. First, locational variation in environment and fauna will play a part in the observed differences in recovery rates noted above (as already discussed), and this difference between indications of benthic community resilience is also likely due to discrepancies in the scale of the two types of disturbances. Erosion and deposition of sediment by the sediment density flow was on the scale of metres to tens of metres (Mountjoy et al., 2018), much greater than the tens of centimetres to metres of erosion (Levin et al., 2001) and millimeters of deposition (Thiel et al., 2001) that are expected to occur from seabed mining. The minimum areal extent of the impact from the turbidity flow in Kaikōura Canyon was approximately 220 km2 (Mountjoy et al., 2018), which although it is comparable to the hundreds km2 per year impacted area envisaged for manganese nodule mining in the abyss (Ardron et al., 2019) seabed mining is expected to occur over successive and multiple years, and therefore it may ultimately extend hundreds to thousands of square kilometers (Smith et al., 2008). Large areas of disturbance can take longer to recolonize than smaller ones (Bluhm, 2001). Furthermore, some areas of Kaikōura Canyon were untouched by the disturbance and thereby provide refuge for fauna, and potential sources for faunal recolonization of impacted areas. Commercial mining disturbance is generally expected to be more contiguous than the impact of a turbidity flow, although some mining plans do envisage leaving refuge areas (Wedding et al., 2013). Nonetheless, re-suspension and subsequent settling of sediments via the mining vehicle and tailing plume will cause widespread disturbance on surrounding unmined benthic habitats, potentially dispersed up to hundreds of kilometers away (Sharma et al., 2001; Smith et al., 2008).
In conclusion, the megafauna community visible in seafloor imagery from Kaikōura Canyon appears to be a resilient to the 2016 Kaikōura Earthquake-triggered turbidity flow. That is, four years after the event the community has somewhat recovered and is now similar to the once highly productive community present before the turbidity flow. Simple population growth models predict that the community could fully recover in a minimum of 4.5 years, although full recovery may take up to 12 years after the disturbance. Future sampling at the same sites remains key to ascertain if the community is on a trajectory to an identical pre-earthquake state or developing an alternative state. Analysis of the visible lebensspuren suggests that the infauna has been impacted more by the turbidity flow and that recovery is not as advanced as for the megafauna. Additional research focused on the infauna will further resolve this provisional observation. While the results of the present study are encouraging for the long-term efficacy of the Hikurangi Marine Reserve, some supportive management actions may still be warranted. Questions remain about the impact of the turbidity flow on the local demersal fishery. And finally, findings from the studies of impacts on benthic communities by turbidity flows are not readily transferable to understanding about the impact of future deep-sea mining.
Data availability statement
The original contributions presented in the study are included in the article/Supplementary Material. Further inquiries can be directed to the corresponding author.
Author contributions
AR, DB, DL, JM, SN, and AO obtained funding for the study and were leads on data collection voyages. AP collected and processed the bathymetric data. CC assisted with the setup of the image annotation environment, annotation troubleshooting, and identified taxa. KB performed the data analysis and wrote the first manuscript draft. AR, DB, and DL advised KB on the analyses and contributed significantly to manuscript revision and preparation. All authors contributed to the article and approved the submitted version.
Funding
Funding for this project came from NOAA Ocean Exploration and NIWA, with co-funding from Woods Hole Oceanographic Institution, Scripps Oceanographic Institution, and the University of Hawaii (TAN0616), New Zealand Ministry for Primary Industries with additional funding from NIWA Strategic Science Investment Fund (SSIF) project COES1701 (TAN1701), NIWA SSIF, NIWA Oceans Centre and TRG (TAN1707, TAN1708), NIWA Marine Geological Processes programme, TRG, and Eurofleets+ (TAN2011). KB was supported by the NIWA-VUW PhD scholarship in marine sciences.
Acknowledgments
We would like to thank the captain, crew, and scientific parties of the five R/V Tangaroa voyages TAN0616, TAN1701, TAN1707, TAN1708, and TAN2011. Several NIWA taxonomists and parataxonomists were integral in identifying taxa in the images: Sadie Mills (ophiuroids), Kate Neill (asteroids), Jeff Forman (decapods), and Dennis Gordon (general taxa), as well as Te Papa taxonomist Andrew Stewart (fish). We also thank the two reviewers for providing constructive criticisms on the manuscript.
Conflict of interest
The authors declare that the research was conducted in the absence of any commercial or financial relationships that could be construed as a potential conflict of interest.
Publisher’s note
All claims expressed in this article are solely those of the authors and do not necessarily represent those of their affiliated organizations, or those of the publisher, the editors and the reviewers. Any product that may be evaluated in this article, or claim that may be made by its manufacturer, is not guaranteed or endorsed by the publisher.
Supplementary material
The Supplementary Material for this article can be found online at: https://www.frontiersin.org/articles/10.3389/fmars.2023.1180334/full#supplementary-material
References
Abdul Wahab M. A., Fromont J., Gomez O., Fisher R., Jones R. (2017). Comparisons of benthic filter feeder communities before and after a large-scale capital dredging program. Mar. pollut. Bull. 122, 176–193. doi: 10.1016/j.marpolbul.2017.06.041
Amaro T., de Stigter H., Lavaleye M., Duineveld G. (2015). Organic matter enrichment in the whittard channel; its origin and possible effects on benthic megafauna. Deep Sea Res. 1 Oceanogr Res. Pap 102, 90–100. doi: 10.1016/j.dsr.2015.04.014
Anderson M. J., Gorley R. N., Clarke K. R. (2008). PERMANOVA+ for PRIMER: guide to software and statistical methods (Plymouth, UK).
Anderson M. J., Santana-Garcon J. (2015). Measures of precision for dissimilarity-based multivariate analysis of ecological communities. Ecol. Lett. 18, 66–73. doi: 10.1111/ele.12385
Ardron J. A., Simon-Lledó E., Jones D. O. B., Ruhl H. A. (2019). Detecting the effects of deep-seabed nodule mining: simulations using megafaunal data from the clarion-clipperton zone. Front. Mar. Sci. 6. doi: 10.3389/fmars.2019.00604
Azpiroz-Zabala M., Cartigny M. J. B., Talling P. J., Parsons D. R., Sumner E. J., Clare M. A., et al. (2017). Newly recognized turbidity current structure can explain prolonged flushing of submarine canyons. Sci. Adv. 3. doi: 10.1126/sciadv.1700200
Baco A. R., Rowden A. A., Levin L. A., Smith C. R., Bowden D. A. (2010). Initial characterization of cold seep faunal communities on the new Zealand hikurangi margin. Mar. Geol 272, 251–259. doi: 10.1016/j.margeo.2009.06.015
Ballara S. L., O’Driscoll R. L., Anderson O. F. (2010). Fish discards and non-target fish catch in the trawl fisheries for hoki, hake, and ling in new Zealand waters (Wellington).
Barnthouse L. W. (2004). Quantifying population recovery rates for ecological risk assessment. Environ. Toxicol. Chem. 23, 500–508. doi: 10.1897/02-521
Belley R., Archambault P., Sundby B., Gilbert F., Gagnon J. M. (2010). Effects of hypoxia on benthic macrofauna and bioturbation in the estuary and gulf of st. Lawrence, Canada. Cont Shelf Res. 30, 1302–1313. doi: 10.1016/j.csr.2010.04.010
Bigham K. T., Rowden A. A., Leduc D., Bowden D. A. (2021). Review and syntheses: impacts of turbidity flows on deep-sea benthic communities. Biogeosciences 18, 1893–1908. doi: 10.5194/bg-18-1893-2021
Bluhm H. (2001). Re-establishment of an abyssal megabenthic community after experimental physical disturbance of the seafloor. Deep Sea Res. 2 Top. Stud. Oceanogr 48, 3841–3868. doi: 10.1016/S0967-0645(01)00070-4
Blyth R. E., Kaiser M. J., Edwards-Jones G., Hart P. J. B. (2004). Implications of a zoned fishery management system for marine benthic communities. J. Appl. Ecol. 41 (5), 951–961. doi: 10.1111/j.0021-8901.2004.00945.x.
Briggs K. B., Richardson M. D., Young D. K. (1996). The classification and structure of megafaunal assemblages in the Venezuela basin, Caribbean Sea. J. Mar. Res. 54, 705–730. doi: 10.1357/0022240963213736
Carter L., Carter R. M., Griggs G. B. (1982). Sedimentation in the Conway trough, a deep near-shore marine basin at the junction of the alpine transform and hikurangi subduction plate boundary, new Zealand. Sedimentology 29, 405–429. doi: 10.1111/j.1365-3091.1982.tb01731.x
Clark M. R., Althaus F., Schlacher T. A., Williams A., Bowden D. A., Rowden A. A. (2016). The impacts of deep-sea fisheries on benthic communities: a review. ICES J. Mar. Sci. 73. doi: 10.1093/icesjms/fsv123
Clarke K. R., Chapman M. G., Somerfield P. J., Needham H. R. (2006). Dispersion-based weighting of species counts in assemblage analyses. Mar. Ecol. Prog. Ser. 320, 11–27. doi: 10.3354/meps320011
Clarke K., Green R. (1988). Statistical design and analysis for a “biological effects” study. Mar. Ecol. Prog. Ser. 46, 213–226. doi: 10.3354/meps046213
Connell A. M., Dunn M. R., Forman J. (2010). Diet and dietary variation of new Zealand hoki Macruronus novaezelandiae. N Z J. Mar. Freshw. Res. 44, 289–308. doi: 10.1080/00288330.2010.515232
Crimes T. P., Uchman A. (1993). A concentration of exceptionally well-preserved large tubular foraminifera in the Eocene zumaya flysch, northern Spain. Geol Mag 130, 851–853. doi: 10.1017/S0016756800023219
Croissant T., Steer P., Lague D., Davy P., Jeandet L., Hilton R. G. (2019). Seismic cycles, earthquakes, landslides and sediment fluxes: linking tectonics to surface processes using a reduced-complexity model. Geomorphology 339, 87–103. doi: 10.1016/j.geomorph.2019.04.017
Crozier M. J. (2010). Deciphering the effect of climate change on landslide activity: a review. Geomorphology 124, 260–267. doi: 10.1016/j.geomorph.2010.04.009
De Leo F. C., Smith C. R., Rowden A. A., Bowden D. A., Clark M. R. (2010). Submarine canyons: hotspots of benthic biomass and productivity in the deep sea. Proc. R. Soc. B: Biol. Sci. 277, 2783–2792. doi: 10.1098/rspb.2010.0462
Dellow S., Massey C., Cox S., Archibald G., Begg J., Bruce Z., et al. (2017). Landslides caused by the Mw7.8 kaikōura earthquake and the immediate response. Bull. New Z. Soc. Earthquake Eng. 50. doi: 10.5459/bnzsee.50.2.106-116
Doonan I. J., Dunn M. R. (2011). Trawl survey of mid-East coast orange roughy, march-April 2010. New Zealand Fisheries Assessment Report 20 (Wellington).
du Preez C., Curtis J. M. R., Clarke M. E. (2016). The structure and distribution of benthic communities on a shallow seamount (Cobb seamount, northeast pacific ocean). PloS One 11. doi: 10.1371/journal.pone.0165513
Fernandez-Arcaya U., Ramirez-Llodra E., Aguzzi J., Allcock A. L., Davies J. S., Dissanayake A., et al. (2017). Ecological role of submarine canyons and need for canyon conservation: a review. Front. Mar. Sci. 4. doi: 10.3389/fmars.2017.00005
FitzGeorge-Balfour T., Billett D. S. M., Wolff G. A., Thompson A., Tyler P. A. (2010). Phytopigments as biomarkers of selectivity in abyssal holothurians; interspecific differences in response to a changing food supply. Deep Sea Res. 2 Top. Stud. Oceanogr 57, 1418–1428. doi: 10.1016/j.dsr2.2010.01.013
Folke C., Carpenter S., Walker B., Scheffer M., Elmqvist T., Gunderson L., et al. (2004). Regime shifts, resilience, and biodiversity in ecosystem management. Annu. Rev. Ecol. Evol. Syst. 35, 557–581. doi: 10.1146/annurev.ecolsys.35.021103.105711
Galéron J., Menot L., Renaud N., Crassous P., Khripounoff A., Treignier C., et al. (2009). Spatial and temporal patterns of benthic macrofaunal communities on the deep continental margin in the gulf of Guinea. Deep Sea Res. 2 Top. Stud. Oceanogr 56, 2299–2312. doi: 10.1016/j.dsr2.2009.04.011
Gaskin D. E., Cawthorn M. W. (1967). Diet and feeding habits of the sperm whale (Physeter catodon l.) in the cook strait region of new Zealand. N Z J. Mar. Freshw. Res. 1, 156–179. doi: 10.1080/00288330.1967.9515201
Ge Z., Nemec W., Vellinga A. J., Gawthorpe R. L. (2022). How is a turbidite actually deposited? Sci. Adv. 8. doi: 10.1126/sciadv.abl9124
Gibbs M., Leduc D., Nodder S. D., Kingston A., Swales A., Rowden A. A., et al. (2020). Novel application of a compound-specific stable isotope (CSSI) tracking technique demonstrates connectivity between terrestrial and deep-Sea ecosystems via submarine canyons. Front. Mar. Sci. 7. doi: 10.3389/fmars.2020.00608
Glud R. N. (2008). Oxygen dynamics of marine sediments. Mar. Biol. Res. 4, 243–289. doi: 10.1080/17451000801888726
Gooday A. J., Levin L. A., Thomas C. L., Hecker B. (1992). The distribution and ecology of Bathysiphon filiformis sars and b. major de folin (Protista, foraminiferida) on the continental slope off north Carolina. J. Foraminifer Res. 22. doi: 10.2113/gsjfr.22.2.129
Gooday A. J., Turley C. M., Allen J. A. (1990). Responses by benthic organisms to inputs of organic material to the ocean floor: a review. Philos. Trans. R. Soc. A: Mathematical Phys. Eng. Sci. 331, 119–138. doi: 10.1098/rsta.1990.0060
Grassle J. F., Morse-Porteous L. S. (1987). Macrofaunal colonization of disturbed deep-sea environments and the structure of deep-sea benthic communities. Deep Sea Res. Part A Oceanog. Res. Papers 34, 1911–1950. doi: 10.1016/0198-0149(87)90091-4
Griggs G. B., Carey A. G., Kulm L. D. (1969). Deep-sea sedimentation and sediment-fauna interaction in cascadia channel and on cascadia abyssal plain. Deep Sea Res. Oceanog. Abstracts 16, 157–170. doi: 10.1016/0011-7471(69)90071-0
Grunert P., Hinsch R., Sachsenhofer R. F., Bechtel A., ćorić S., Harzhauser M., et al. (2013). Early burdigalian infill of the puchkirchen trough (North alpine foreland basin, central paratethys): facies development and sequence stratigraphy. Mar. Pet Geol 39, 164–186. doi: 10.1016/j.marpetgeo.2012.08.009
Grupe B. M., Krach M. L., Pasulka A. L., Maloney J. M., Levin L. A., Frieder C. A. (2015). Methane seep ecosystem functions and services from a recently discovered southern California seep. Mar. Ecol. 36, 91–108. doi: 10.1111/maec.12243
Guerra M., Dawson S., Sabadel A., Slooten E., Somerford T., Williams R., et al. (2020). Changes in habitat use by a deep-diving predator in response to a coastal earthquake. Deep Sea Res. 1 Oceanogr Res. Pap 158. doi: 10.1016/j.dsr.2020.103226
Gutt J., Arndt J., Kraan C., Dorschel B., Schröder M., Bracher A., et al. (2019). Benthic communities and their drivers: a spatial analysis off the Antarctic peninsula. Limnol Oceanogr 64, 2341–2357. doi: 10.1002/lno.11187
Hage S., Galy V. V., Cartigny M. J. B., Acikalin S., Clare M. A., Gröcke D. R., et al. (2020). Efficient preservation of young terrestrial organic carbon in sandy turbidity-current deposits. Geology 48, 882–887. doi: 10.1130/g47320.1
Harris P. T. (2014). Shelf and deep-sea sedimentary environments and physical benthic disturbance regimes: a review and synthesis. Mar. Geol 353, 169–184. doi: 10.1016/j.margeo.2014.03.023
Haughton P. D. W., Barker S. P., McCaffrey W. D. (2003). “Linked” debrites in sand-rich turbidite systems - origin and significance. Sedimentology 50, 459–482. doi: 10.1046/j.1365-3091.2003.00560.x
Hecker B. (1994). Unusual megafaunal assemblages on the continental slope off cape hatteras. Deep-Sea Res. Part II 41, 809–834. doi: 10.1016/0967-0645(94)90050-7
Heezen B. C., Ewing M., Menzies R. J. (1955). The influence of submarine turbidity currents on abyssal productivity. Oikos, 170–182. doi: 10.2307/3564853
Heezen B. C., Menzies R. J., Schneider E. D., Ewing M., Granelli N. C. L. (1964). Congo Submarine canyon. Am. Assoc. Pet Geol Bull. 48, 1126–1149. doi: 10.1306/BC743D7F-16BE-11D7-8645000102C1865D
Hendler G. (1975). Adaptational significance of the patterns of ophiuroid development. Integr. Comp. Biol. 15, 691–715. doi: 10.1093/icb/15.3.691
Hendler G., Tran L. U. (2001). Reproductive biology of a deep-sea brittle star Amphiura carchara (Echinodermata: ophiuroidea). Mar. Biol. 138, 113–123. doi: 10.1007/s002270000446
Hess S., Jorrissen F. J., Venet V., Abu-Zied R. (2005). Benthic foraminiferal recovery after recent turbidite deposition in cap Breton canyon, bay of Biscay. J. Foraminiferal Res. 35, 114–129. doi: 10.2113/35.2.114
Hollertz K., Sköld M., Rosenberg R. (1998). Interactions between two deposit feeding echinoderms: the spatangoid brissopsis lyrifera (Forbes) and the ophiuroid amphiura chiajei forbes. in. Hydrobiologia., 287–295. doi: 10.1007/978-94-017-2864-5_23
Holling C. S. (1973). Resilience and stability of ecological systems. Future Nature: Doc. Global Change, 1–24. doi: 10.1146/annurev.es.04.110173.000245
Holling C. S. (1996). ““Engineering resilience versus ecological resilience,”,” in Foundations of ecological resilence, 31–44.
Horton T., Marsh L., Bett B. J., Gates A. R., Jones D. O. B., Benoist N. M. A., et al. (2021). Recommendations for the standardisation of open taxonomic nomenclature for image-based identifications. Front. Mar. Sci. 8. doi: 10.3389/fmars.2021.620702
Huggett Q. J. (1987). Mapping the hemipelagic versus turbiditic muds by feeding traces observed in deep-sea photographs. Geol. Geochem. Abyssal Plains Geological Soc. Special Publ. 31, 105–112. doi: 10.1144/GSL.SP.1987.031.01.09
Johnson W. S., Stevens M., Watling L. (2001). Reproduction and development of marine peracaridans. Adv. Mar. Biol. 39, 105–260. doi: 10.1016/s0065-2881(01)39009-0
Jones M. R. L. (2008a). Biology and diet of Coryphaenoides subserrulatus and Etmopterus baxteri from the puysegur region, southern new Zealand. N Z J. Mar. Freshw. Res. 42, 333–337. doi: 10.1080/00288330809509961
Jones M. R. L. (2008b). Dietary analysis of Coryphaenoides serrulatus, c. subserruiatus and several other species of macrourid fish (Pisces: macrouridae) from northeastern chatham rise, new Zealand. N Z J. Mar. Freshw. Res. 42, 73–84. doi: 10.1080/00288330809509937
Jones D. O. B., Gates A. R., Lausen B. (2012). Recovery of deep-water megafaunal assemblages from hydrocarbon drilling disturbance in the faroe-Shetland channel. Mar. Ecol. Prog. Ser. 461, 71–82. doi: 10.3354/meps09827
Jones D. O. B., Kaiser S., Sweetman A. K., Smith C. R., Menot L., Vink A., et al. (2017). Biological responses to disturbance from simulated deep-sea polymetallic nodule mining. PloS One 12. doi: 10.1371/journal.pone.0171750
Kawagucci S., Yoshida Y. T., Noguchi T., Honda M. C., Uchida H., Ishibashi H., et al. (2012). Disturbance of deep-sea environments induced by the M9.0 tohoku earthquake. Sci. Rep. 2, 1–7. doi: 10.1038/srep00270
Kitahashi T., Jenkins R. G., Nomaki H., Shimanaga M., Fujikura K., Kojima S. (2014). Effect of the 2011 tohoku earthquake on deep-sea meiofaunal assemblages inhabiting the landward slope of the Japan trench. Mar. Geol 358, 128–137. doi: 10.1016/j.margeo.2014.05.004
Kitahashi T., Watanabe H., Ikehara K., Jenkins R. G., Kojima S., Shimanaga M. (2016). Deep-sea meiofauna off the pacific coast of tohoku and other trench slopes around Japan: a comparative study before and after the 2011 off the pacific coast of tohoku earthquake. J. Oceanogr 72, 129–139. doi: 10.1007/s10872-015-0323-3
Koho K. A. A., Kouwenhoven T. J. J., de Stigter H. C. C., van der Zwaan G. J. J. (2007). Benthic foraminifera in the nazaré canyon, Portuguese continental margin: sedimentary environments and disturbance. Mar. Micropaleontol 66, 27–51. doi: 10.1016/j.marmicro.2007.07.005
Kuenen P. H. H., Migliorini C. I. (1950). Turbidity currents as a cause of graded bedding. J. Geol 58, 91–127. doi: 10.1086/625710
Langenkämper D., Zurowietz M., Schoening T., Nattkemper T. W. (2017). BIIGLE 2.0 - browsing and annotating large marine image collections. Front. Mar. Sci. 4. doi: 10.3389/fmars.2017.00083
Leduc D., Rowden A. A., Nodder S. D., Berkenbusch K., Probert P. K., Hadfield M. G. (2014). Unusually high food availability in kaikoura canyon linked to distinct deep-sea nematode community. Deep Sea Res. 2 Top. Stud. Oceanogr 104, 310–318. doi: 10.1016/j.dsr2.2013.06.003
Lefèvre C. D., Bellwood D. R. (2015). Disturbance and recolonisation by small reef fishes: the role of local movement versus recruitment. Mar. Ecol. Prog. Ser. 537, 205–215. doi: 10.3354/meps11457
Levin L. A., Etter R. J., Rex M. A., Gooday A. J., Smith C. R., Pineda J., et al. (2001). Environmental influences on regional deep-Sea species diversity. Annu. Rev. Ecol. Syst. 32, 51–93. doi: 10.1146/annurev.ecolsys.32.081501.114002
Lewis K. B., Barnes P. M. (1999). Kaikoura canyon, new Zealand: active conduit from near-shore sediment zones to trench-axis channel. Mar. Geol 162, 39. doi: 10.1016/S0025-3227(99)00075-4
Lowe D. R. (1979). Sediment gravity flows: their classification and some problems of application to natural flows and deposits. Geol. continental slopes. 27, 75–82. doi: 10.2110/pec.79.27.0075
Lundquist C. J., Thrush S. F., Coco G., Hewitt J. E. (2010). Interactions between disturbance and dispersal reduce persistence thresholds in a benthic community. Mar. Ecol. Prog. Ser. 413, 217–228. doi: 10.3354/meps08578
Maier K. L., Gales J. A., Paull C. K., Rosenberger K., Talling P. J., Simmons S. M., et al. (2019). Linking direct measurements of turbidity currents to submarine canyon-floor deposits. Front. Earth Sci. (Lausanne) 7. doi: 10.3389/feart.2019.00144
Massey C. I., Townsend D., Jones K., Lukovic B., Rhoades D., Morgenstern R., et al. (2020). Volume characteristics of landslides triggered by the MW 7.8 2016 kaikōura earthquake, new Zealand, derived from digital surface difference modeling. J. Geophys Res. Earth Surf 125. doi: 10.1029/2019JF005163
May R. M. (1977). Thresholds and breakpoints in ecosystems with a multiplicity of stable states. Nature 269, 471–477. doi: 10.1038/269471a0
McArdle B. H., Anderson M. J. (2001). Fitting multivariate models to community data: a comment on distance-based redundancy analysis. Ecology 82, 290–297. doi: 10.1890/0012-9658(2001)082[0290:FMMTCD]2.0.CO;2
McClanahan T. R., Graham N. A. J., Calnan J. M., MacNeil M. A. (2007). Toward pristine biomass: reef fish recovery in coral reef marine protected areas in Kenya. Ecol. Appl. 17, 1055–1067. doi: 10.1890/06-1450
McMillan P. J., Francis M. P., James G. D., Paul L. J., Marriott P., MacKay E. J., et al. (2019). New Zealand fishes. a field guide to common species caught by bottom, midwater, and surface fishing (Ministry for Primary Industries).
Meiburg E., Kneller B. (2010). Turbidity currents and their deposits. Annu. Rev. Fluid Mech. 42, 135–156. doi: 10.1146/annurev-fluid-121108-145618
Meysman F. J. R., Middelburg J. J., Heip C. H. R. (2006). Bioturbation: a fresh look at darwin’s last idea. Trends Ecol. Evol. 21, 688–695. doi: 10.1016/j.tree.2006.08.002
Miguez-Salas O., Vardaro M. F., Rodríguez-Tovar F. J., Pérez-Claros J. A., Huffard C. L. (2022). Deep-Sea echinoid trails and seafloor nutrient distribution: present and past implications. Front. Mar. Sci. 9. doi: 10.3389/fmars.2022.903864
Ministry for Primary Industries (2022) Kaikōura area fishing rules. Available at: https://www.mpi.govt.nz/fishing-aquaculture/recreational-fishing/fishing-rules/kaikoura-fishing-rules/ (Accessed May 17, 2022).
Mountjoy J. J., Howarth J. D., Orpin A. R., Barnes P. M., Bowden D. A., Rowden A. A., et al. (2018). Earthquakes drive large-scale submarine canyon development and sediment supply to deep-ocean basins. Sci. Adv. 4 (3). doi: 10.1126/sciadv.aar3748
Neat F. C. (2017). Aggregating behaviour, social interactions and possible spawning in the deep-water fish coryphaenoides rupestris. J. Fish Biol. 91, 975–980. doi: 10.1111/jfb.13386
Nomaki H., Mochizuki T., Kitahashi T., Nunoura T., Arai K., Toyofuku T., et al. (2016). Effects of mass sedimentation events after the 2011 off the pacific coast of tohoku earthquake on benthic prokaryotes and meiofauna inhabiting the upper bathyal sediments. J. Oceanogr 72, 113–128. doi: 10.1007/s10872-015-0293-5
Odum E. P. (1969). The strategy of ecosystem development. Sci. (1979) 164, 262–270. doi: 10.1126/science.164.3877.262
Oguri K., Kawamura K., Sakaguchi A., Toyofuku T., Kasaya T., Murayama M., et al. (2013). Hadal disturbance in the Japan trench induced by the 2011 tohoku-oki earthquake. Sci. Rep. 3, 1–6. doi: 10.1038/srep01915
Okey T. A. (1997). Sediment flushing observations, earthquake slumping, and benthic community changes in Monterey canyon head. Cont Shelf Res. 17, 877–897. doi: 10.1016/S0278-4343(96)00067-2
Oliver T. H., Heard M. S., Isaac N. J. B., Roy D. B., Procter D., Eigenbrod F., et al. (2015). Biodiversity and resilience of ecosystem functions. Trends Ecol. Evol. 30, 673–684. doi: 10.1016/j.tree.2015.08.009
Ortiz S., Alegret L., Payros A., Orue-Etxebarria X., Apellaniz E., Molina E. (2011). Distribution patterns of benthic foraminifera across the ypresian-lutetian gorrondatxe section, northern Spain: response to sedimentary disturbance. Mar. Micropaleontol 78, 1–13. doi: 10.1016/j.marmicro.2010.09.004
Paradis S., Puig P., Sanchez-Vidal A., Masqué P., Garcia-Orellana J., Calafat A., et al. (2018). Spatial distribution of sedimentation-rate increases in blanes canyon caused by technification of bottom trawling fleet. Prog. Oceanogr 169, 241–252. doi: 10.1016/j.pocean.2018.07.001
Parker S. J., Paul L. J., Francis M. (2011). Age structure characteristics of hāpuku polyprion oxygeneios stocks estimated from existing samples of otoliths. New Zealand Fisheries Assessment Report.
Paull C. K., Talling P. J., Maier K. L., Parsons D., Xu J., Caress D. W., et al. (2018). Powerful turbidity currents driven by dense basal layers. Nat. Commun. 9, 4114. doi: 10.1038/s41467-018-06254-6
Piper D. J. W., Aksu A. E. (1987). The source and origin of the 1929 grand banks turbidity current inferred from sediment budgets. Geo-Mar. Lett. 7, 177–182. doi: 10.1007/BF02242769
Pires D. O., Castro C. B., Silva J. C. (2009). Reproductive biology of the deep-sea pennatulacean anthoptilum murrayi (Cnidaria, octocorallia). Mar. Ecol. Prog. Ser. 397, 103–112. doi: 10.3354/meps08322
Post A. L., Lavoie C., Domack E. W., Leventer A., Shevenell A., Fraser A. D. (2017). Environmental drivers of benthic communities and habitat heterogeneity on an East Antarctic shelf. Antarct Sci. 29, 17–32. doi: 10.1017/S0954102016000468
Pruski A. M., Decker C., Stetten E., Vétion G., Martinez P., Charlier K., et al. (2017). Energy transfer in the Congo deep-sea fan: from terrestrially-derived organic matter to chemosynthetic food webs. Deep Sea Res. 2 Top. Stud. Oceanogr 142, 197–218. doi: 10.1016/j.dsr2.2017.05.011
Przeslawski R., Dundas K., Radke L., Anderson T. J. (2012). Deep-sea lebensspuren of the Australian continental margins. Deep Sea Res. 1 Oceanogr Res. Pap 65, 26–35. doi: 10.1016/j.dsr.2012.03.006
Puig P., Canals M., Company J. B., Martín J., Amblas D., Lastras G., et al. (2012). Ploughing the deep sea floor. Nature 489, 286–289. doi: 10.1038/nature11410
Radziejewska T., Stoyanova V. (2000). Abyssal epibenthic megafauna of the clarion-clipperton area (NE pacific): changes in time and space versus anthropogenic environmental disturbance. Oceanol. Stud. 29, 83–101.
Rathburn A. E., Levin L. A., Tryon M., Gieskes J. M., Martin J. B., Pérez M. E., et al. (2009). Geological and biological heterogeneity of the Aleutian margin, (1965-4822 m). Prog. Oceanogr 80, 22–50. doi: 10.1016/j.pocean.2008.12.002
R Core Team (2022). R: a language and environment for statistical computing (R Foundation for Statistical Computing).
Reimers C. E., Fischer K. M., Merewether R., Smith K. L., Jahnke R. A. (1986). Oxygen microprofiles measured in situ in deep ocean sediments. Nature 320, 741–744. doi: 10.1038/320741a0
Revsbech N. P., Sorensen J., Blackburn T. H., Lomholt J. P. (1980). Distribution of oxygen in marine sediments measured with microelectrodes. Limnol Oceanogr 25, 403–411. doi: 10.4319/lo.1980.25.3.0403
Rex M. A., Etter R. J., Morris J. S., Crouse J., McClain C. R., Johnson N. A., et al. (2006). Global bathymetric patterns of standing stock and body size in the deep-sea benthos. Mar. Ecol. Prog. Ser. 317, 1–8. doi: 10.3354/meps317001
Richardson M. D., Briggs K. B., Young D. K. (1985). Effects of biological activity by abyssal benthic macroinvertebrates on a sedimentary structure in the Venezuela basin. Mar. Geol 68, 243–267. doi: 10.1016/0025-3227(85)90015-5
Richardson M. D., Young D. K. (1987). Abyssal benthos of the Venezuela basin, Caribbean Sea: standing stock considerations. Deep Sea Res. Part A. Oceanog. Res. Papers 34, 145–164. doi: 10.1016/0198-0149(87)90079-3
Rosecchi E., Tracey D. M., Webber W. R. (1988). Diet of orange roughy, Hoplostethus atlanticus (Pisces: trachichthyidae) on the challenger plateau, new Zealand. Mar. Biol. 99, 293–306. doi: 10.1007/BF00391992
Rosenfeld J. S. (2002). Functional redundancy in ecology and conservation. Oikos 98, 156–162. doi: 10.1034/j.1600-0706.2002.980116.x
Rowe G. T. (1971). Observations on bottom currents and epibenthic populations in hatteras submarine canyon. Deep-Sea Res. Oceanog. Abstracts 18, 569–581. doi: 10.1016/0011-7471(71)90123-9
Rubenstein D. I., Koehl M. A. R. (1977). The mechanisms of filter feeding: some theoretical considerations. Am. Nat. 111, 981–994. doi: 10.1086/283227
Saja D. B., Pfefferkorn H. W., Phipps S. P. (2009). Bathysiphon (foraminiferida) at Pacheco pass, California: a geopetal, paleocurrent, and paleobathymetric indicator in the Franciscan complex. Palaios 24, 181–191. doi: 10.2110/palo.2008.p08-037r
Schaff T. R., Levin L. A. (1994). Spatial heterogeneity of benthos associated with biogenic structures on the north Carolina continental slope. Deep-Sea Res. Part II 41, 901–918. doi: 10.1016/0967-0645(94)90053-1
Scheffer M., Carpenter S., Foley J. A., Folke C., Walker B. (2001). Catastrophic shifts in ecosystems. Nature 413, 591–596. doi: 10.1038/35098000
Schönberg C. H. L. (2016). “Effects of dredging on benthic filter feeder communities, with a focus on sponges,” in Report of theme 6 - project 6.1.1 prepared for the dredging science node (Perth, Western Australia: Western Australian Marine Science Institution).
Sciberras M., Hiddink J. G., Jennings S., Szostek C. L., Hughes K. M., Kneafsey B., et al. (2018). Response of benthic fauna to experimental bottom fishing: a global meta-analysis. Fish Fish. 19, 698–715. doi: 10.1111/faf.12283
Sen A., Dennielou B., Tourolle J., Arnaubec A., Rabouille C., Olu K. (2017). Fauna and habitat types driven by turbidity currents in the lobe complex of the Congo deep-sea fan. Deep Sea Res. 2 Top. Stud. Oceanogr 142, 167–179. doi: 10.1016/j.dsr2.2017.05.009
Servetto N., Torre L., Sahade R. (2013). Reproductive biology of the antarctic “sea pen” malacobelemnon daytoni (Octocorallia, pennatulacea, kophobelemnidae). Polar Res. 32. doi: 10.3402/polar.v32i0.20040
Sharma R., Nagender Nath B., Parthiban G., Jai Sankar S. (2001). Sediment redistribution during simulated benthic disturbance and its implications on deep seabed mining. Deep Sea Res. 2 Top. Stud. Oceanogr 48, 3363–3380. doi: 10.1016/S0967-0645(01)00046-7
Sibuet M., Olu K. (1998). Biogeography, biodiversity and fluid dependence of deep-sea cold-seep communities at active and passive margins. Deep Sea Res. 1 Oceanogr Res. Pap 45, 517–567. doi: 10.1016/S0967-0645(97)00074-X
Smale D. A., Barnes D. K. A., Fraser K. P. P., Peck L. S. (2008). Benthic community response to iceberg scouring at an intensely disturbed shallow water site at Adelaide island, Antarctica. Mar. Ecol. Prog. Ser. 355, 85–94. doi: 10.3354/meps07311
Smith C. R., Levin L. A., Koslow A., Tyler P. A., Glover A. G. (2008). ““The near future of the deep-sea floor ecosystems,”,” in Aquatic ecosystems: trends and global prospects. doi: 10.1017/CBO9780511751790.030
Solé R. v., Saldaña J., Montoya J. M., Erwin D. H. (2010). Simple model of recovery dynamics after mass extinction. J. Theor. Biol. 267, 193–200. doi: 10.1016/j.jtbi.2010.08.015
Sousa W. P. (1979). Disturbance in marine intertidal boulder fields: the nonequilibrium maintenance of species diversity. Ecology 60, 1225. doi: 10.2307/1936969
Sousa W. P. (1984). The role of disturbance in natural communities. Annu. Rev. Ecol. Syst. 15, 353–391. doi: 10.1146/annurev.es.15.110184.002033
Sousa W. P. (2001). ““Natural disturbance and the dynamics of marine benthic communities,”,” in Marine community ecology. Eds. Bertness M. D., Gaines S. D., Hay M. E. (Sinauer Associates, Inc), 85–130.
Stetten E., Baudin F., Reyss J. L., Martinez P., Charlier K., Schnyder J., et al. (2015). Organic matter characterization and distribution in sediments of the terminal lobes of the Congo deep-sea fan: evidence for the direct influence of the Congo river. Mar. Geol 369, 182–195. doi: 10.1016/j.margeo.2015.08.020
Stratmann T., Lins L., Purser A., Marcon Y., Rodrigues C. F., Ravara A., et al. (2018). Abyssal plain faunal carbon flows remain depressed 26 years after a simulated deep-sea mining disturbance. Biogeosciences 15, 4131–4145. doi: 10.5194/bg-15-4131-2018
Stricker S. A., Smythe T. L., Miller L., Norenburg J. L. (2001). Comparative biology of oogenesis in nemertean worms. Acta Zool. 82, 213–230. doi: 10.1046/j.1463-6395.2000.00080.x
Talling P. J. (2014). On the triggers, resulting flow types and frequencies of subaqueous sediment density flows in different settings. Mar. Geol 352, 155–182. doi: 10.1016/j.margeo.2014.02.006
Talling P. J., Amy L. A., Wynn R. B., Blackbourn G., Gibson O. (2007). Evolution of turbidity currents deduced from extensive thin turbidites: marnoso arenacea formation (Miocene), Italian Apennines. J. Sedimentary Res. 77, 172–196. doi: 10.2110/jsr.2007.018
Talling P. J., Masson D. G., Sumner E. J., Malgesini G. (2012). Subaqueous sediment density flows: depositional processes and deposit types. Sedimentology 59, 1937–2003. doi: 10.1111/j.1365-3091.2012.01353.x
Talling P. J., Paull C. K., Piper D. J. W. (2013). How are subaqueous sediment density flows triggered, what is their internal structure and how does it evolve? direct observations from monitoring of active flows. Earth Sci. Rev. 125, 244–287. doi: 10.1016/j.earscirev.2013.07.005
Thiel H. (1992). Deep-sea environmental disturbance and recovery potential. Internationale Rev. der gesamten Hydrobiol. und Hydrograph. 77, 331–339. doi: 10.1002/iroh.19920770213
Thiel H., Schriever G., Ahnert A., Bluhm H., Borowski C., Vopel K. (2001). The large-scale environmental impact experiment DISCOL - reflection and foresight. Deep Sea Res. 2 Top. Stud. Oceanogr 48, 3869–3882. doi: 10.1016/S0967-0645(01)00071-6
Thomsen M. S., Metcalfe I., Siciliano A., South P. M., Gerrity S., Alestra T., et al. (2020). Earthquake-driven destruction of an intertidal habitat cascade. Aquat Bot. 164. doi: 10.1016/j.aquabot.2020.103217
Thurston M. H., Bett B. J., Rice A. L., Jackson P. A. B. (1994). Variations in the invertebrate abyssal megafauna in the north Atlantic ocean. Deep-Sea Res. Part I 41, 1321–1348. doi: 10.1016/0967-0637(94)90100-7
Thurston M. H., Rice A. L., Bett B. J. (1998). Latitudinal variation in invertebrate megafaunal abundance and biomass in the north Atlantic ocean abyss. Deep Sea Res. 2 Top. Stud. Oceanogr 45, 203–224. doi: 10.1016/S0967-0645(97)00077-5
Tilman D., Downing J. A. (1994). Biodiversity and stability in grasslands. Nature 367, 363–365. doi: 10.1038/367363a0
Tracey D. M., Anderson O. F., Naylor J. R. (2011). A guide to common deepsea invertebrates in new Zealand waters (Wellington).
Tsuji T., Kawamura K., Kanamatsu T., Kasaya T., Fujikura K., Ito Y., et al. (2013). Extension of continental crust by anelastic deformation during the 2011 tohoku-oki earthquake: the role of extensional faulting in the generation of a great tsunami. Earth Planet Sci. Lett. 364, 44–58. doi: 10.1016/j.epsl.2012.12.038
Tyler P. A., Gage J. D. (2020). ““Reproductive patterns in deep sea ophiuroids from the north East atlantic,”,” in Echinoderms: present and past. (CRC Press) doi: 10.1201/9781003078913-79
Tyler P. A., Ramirez-Llodra E. (2002). Larval and reproductive strategies on European continental margins. Ocean Margin Syst., 417–421. doi: 10.1007/978-3-662-05127-6_21
van Gaever S., Galéron J., Sibuet M., Vanreusel A. (2009). Deep-sea habitat heterogeneity influence on meiofaunal communities in the gulf of Guinea. Deep Sea Res. 2 Top. Stud. Oceanogr 56, 2259–2269. doi: 10.1016/j.dsr2.2009.04.008
Völker D., Scholz F., Geersen J. (2011). Analysis of submarine landsliding in the rupture area of the 27 February 2010 maule earthquake, central Chile. Mar. Geol 288, 79–89. doi: 10.1016/j.margeo.2011.08.003
Wakita M., Watanabe S., Yoshino J., Oguri K., Nomaki H., Kawagucci S., et al. (2022). Deep-sea bottom-water environment change caused by sediment resuspension on the continental slope off sanriku, Japan, before and after the 2011 tohoku earthquake. Prog. Earth Planet Sci. 9, 56. doi: 10.1186/s40645-022-00515-1
Walbridge S., Slocum N., Pobuda M., Wright D. J. (2018). Unified geomorphological analysis workflows with benthic terrain modeler. Geosci. (Switzerland) 8. doi: 10.3390/geosciences8030094
Walker B., Holling C. S., Carpenter S. R., Kinzig A. (2004). Resilience, adaptability and transformability in social-ecological systems. Ecol. Soc. 9. doi: 10.5751/ES-00650-090205
Wan Hussin W. M. R., Cooper K. M., Froján C. R. S. B., Defew E. C., Paterson D. M. (2012). Impacts of physical disturbance on the recovery of a macrofaunal community: a comparative analysis using traditional and novel approaches. Ecol. Indic 12, 37–45. doi: 10.1016/j.ecolind.2011.03.016
Warwick R. M., Clarke K. R. (1993). Increased variability as a symptom of stress in marine communities. J. Exp. Mar. Biol. Ecol. 172, 215–226. doi: 10.1016/0022-0981(93)90098-9
Wedding L. M., Friedlander A. M., Kittinger J. N., Watling L., Gaines S. D., Bennett M., et al. (2013). From principles to practice: a spatial approach to systematic conservation planning in the deep sea. Proc. R. Soc. B: Biol. Sci. 280. doi: 10.1098/rspb.2013.1684
Wentworth C. K. (1922). A scale of grade and class terms for clastic sediments. J. Geol 30, 377–392. doi: 10.1086/622910
Wetzel A. (2008). Recent bioturbation in the deep south China Sea: a uniformitarian ichnologic approach. Palaios 23, 601–615. doi: 10.2110/palo.2007.p07-096r
Willig M. R., Walker L. R. (1999). “Disturbance in terrestrial ecosystems: salient themes, synthesis, and future directions,” in. Ecosyst. World, 747–768.
Keywords: deep sea, morphology, resilience (environmental), megafauna, benthic community, disturbance, canyon, turbidity flow
Citation: Bigham KT, Rowden AA, Bowden DA, Leduc D, Pallentin A, Chin C, Mountjoy JJ, Nodder SD and Orpin AR (2023) Deep-sea benthic megafauna hotspot shows indication of resilience to impact from massive turbidity flow. Front. Mar. Sci. 10:1180334. doi: 10.3389/fmars.2023.1180334
Received: 06 March 2023; Accepted: 25 April 2023;
Published: 18 May 2023.
Edited by:
Jaime Selina Davies, University of Plymouth, United KingdomReviewed by:
Chih-Lin Wei, National Taiwan University, TaiwanFabio Cabrera De Leo, University of Victoria, Canada
Copyright © 2023 Bigham, Rowden, Bowden, Leduc, Pallentin, Chin, Mountjoy, Nodder and Orpin. This is an open-access article distributed under the terms of the Creative Commons Attribution License (CC BY). The use, distribution or reproduction in other forums is permitted, provided the original author(s) and the copyright owner(s) are credited and that the original publication in this journal is cited, in accordance with accepted academic practice. No use, distribution or reproduction is permitted which does not comply with these terms.
*Correspondence: Katharine T. Bigham, katie.bigham@vuw.ac.nz
†Present address: Arne Pallentin, Seafloor Maps Ltd., Wellington, New Zealand