Dynamic response of water flow and sediment transport off the Yellow River mouth to tides and waves in winter
 Xinyue Cheng
 Jianrong Zhu
 Shenliang Chen
- 1Shanghai National Engineering Research Center of Urban Water Resources Co., Ltd., Shanghai, China
- 2State Key Laboratory of Estuarine and Coastal Research, East China Normal University, Shanghai, China
- 3College of Environmental Science and Engineering, Tongji University, Shanghai, China
Freshwater and sediments are transported from the Yellow River mouth downstream along the coast into Laizhou Bay under the northeasterly wind in winter. Numerical experiments indicate that sediment transport shows the tendency of convergence in the river mouth, divergence in the downstream area, and convergence in the north of Laizhou Bay. Tides and waves are the two main forcings affecting the transport of water and sediments off river mouths. For the high-turbidity Yellow River mouth and the adjacent sea, tidal forcing enhances the subtidal downstream transport of water and sediments off the river mouth into Laizhou Bay, whereas wave forcing has little effect on the advection of water and sediments. Sediment resuspension is controlled by the bottom shear stress induced by tides and waves. The tide-induced bottom shear stress is higher in the north of Laizhou Bay and south of Bohai Bay due to the stronger bottom tidal current. The wave-induced bottom shear stress plays a more important role in sediment resuspension, which is higher in the nearshore region along the Yellow River Delta away from the coast to some extent on account of the maximum near-bottom wave orbital velocity. Tidal mixing strengthens the upward diffusion of the bottom suspended sediments. Without tidal forcing, there is an interesting phenomenon along the Yellow River Delta. In the nearshore region, the decreased bottom shear stress suspends less sediment above the bed. However, in the offshore region, the enhanced stratification hinders the upward diffusion of the bottom sediment due to the lack of tidal mixing, resulting in higher suspended sediment concentration (SSC) in the bottom layer.
1 Introduction
The Bohai Sea is a shallow semi-enclosed marginal sea in the West Pacific and the only inner sea in China (Figure 1). It receives about 1.5 × 10¹⁰ m3 freshwater and 6.9 × 10⁸ t sediment annually from the Yellow River (Cheng et al., 2021a), the second largest river in China, which is famous for its high sediment concentration. The water and sediment discharge of the Yellow River varies seasonally. Due to the frequent rainfall during the flood season (from July to October), the discharge is higher in the flood season and lower in the dry season (Wang et al., 2007; Yu et al., 2013). Approximately 30%–40% of sediments from the Yellow River are trapped in the river mouth, forming the Yellow River Delta (Li et al., 1998a), which is well known for its rapid erosion–deposition variations (Cui and Li, 2011). The Yellow River Delta and the adjacent sea are of great socioeconomic importance and are rich in biological resources, which are highly influenced by the water and sediment transport of the Yellow River (Kong et al., 2015).
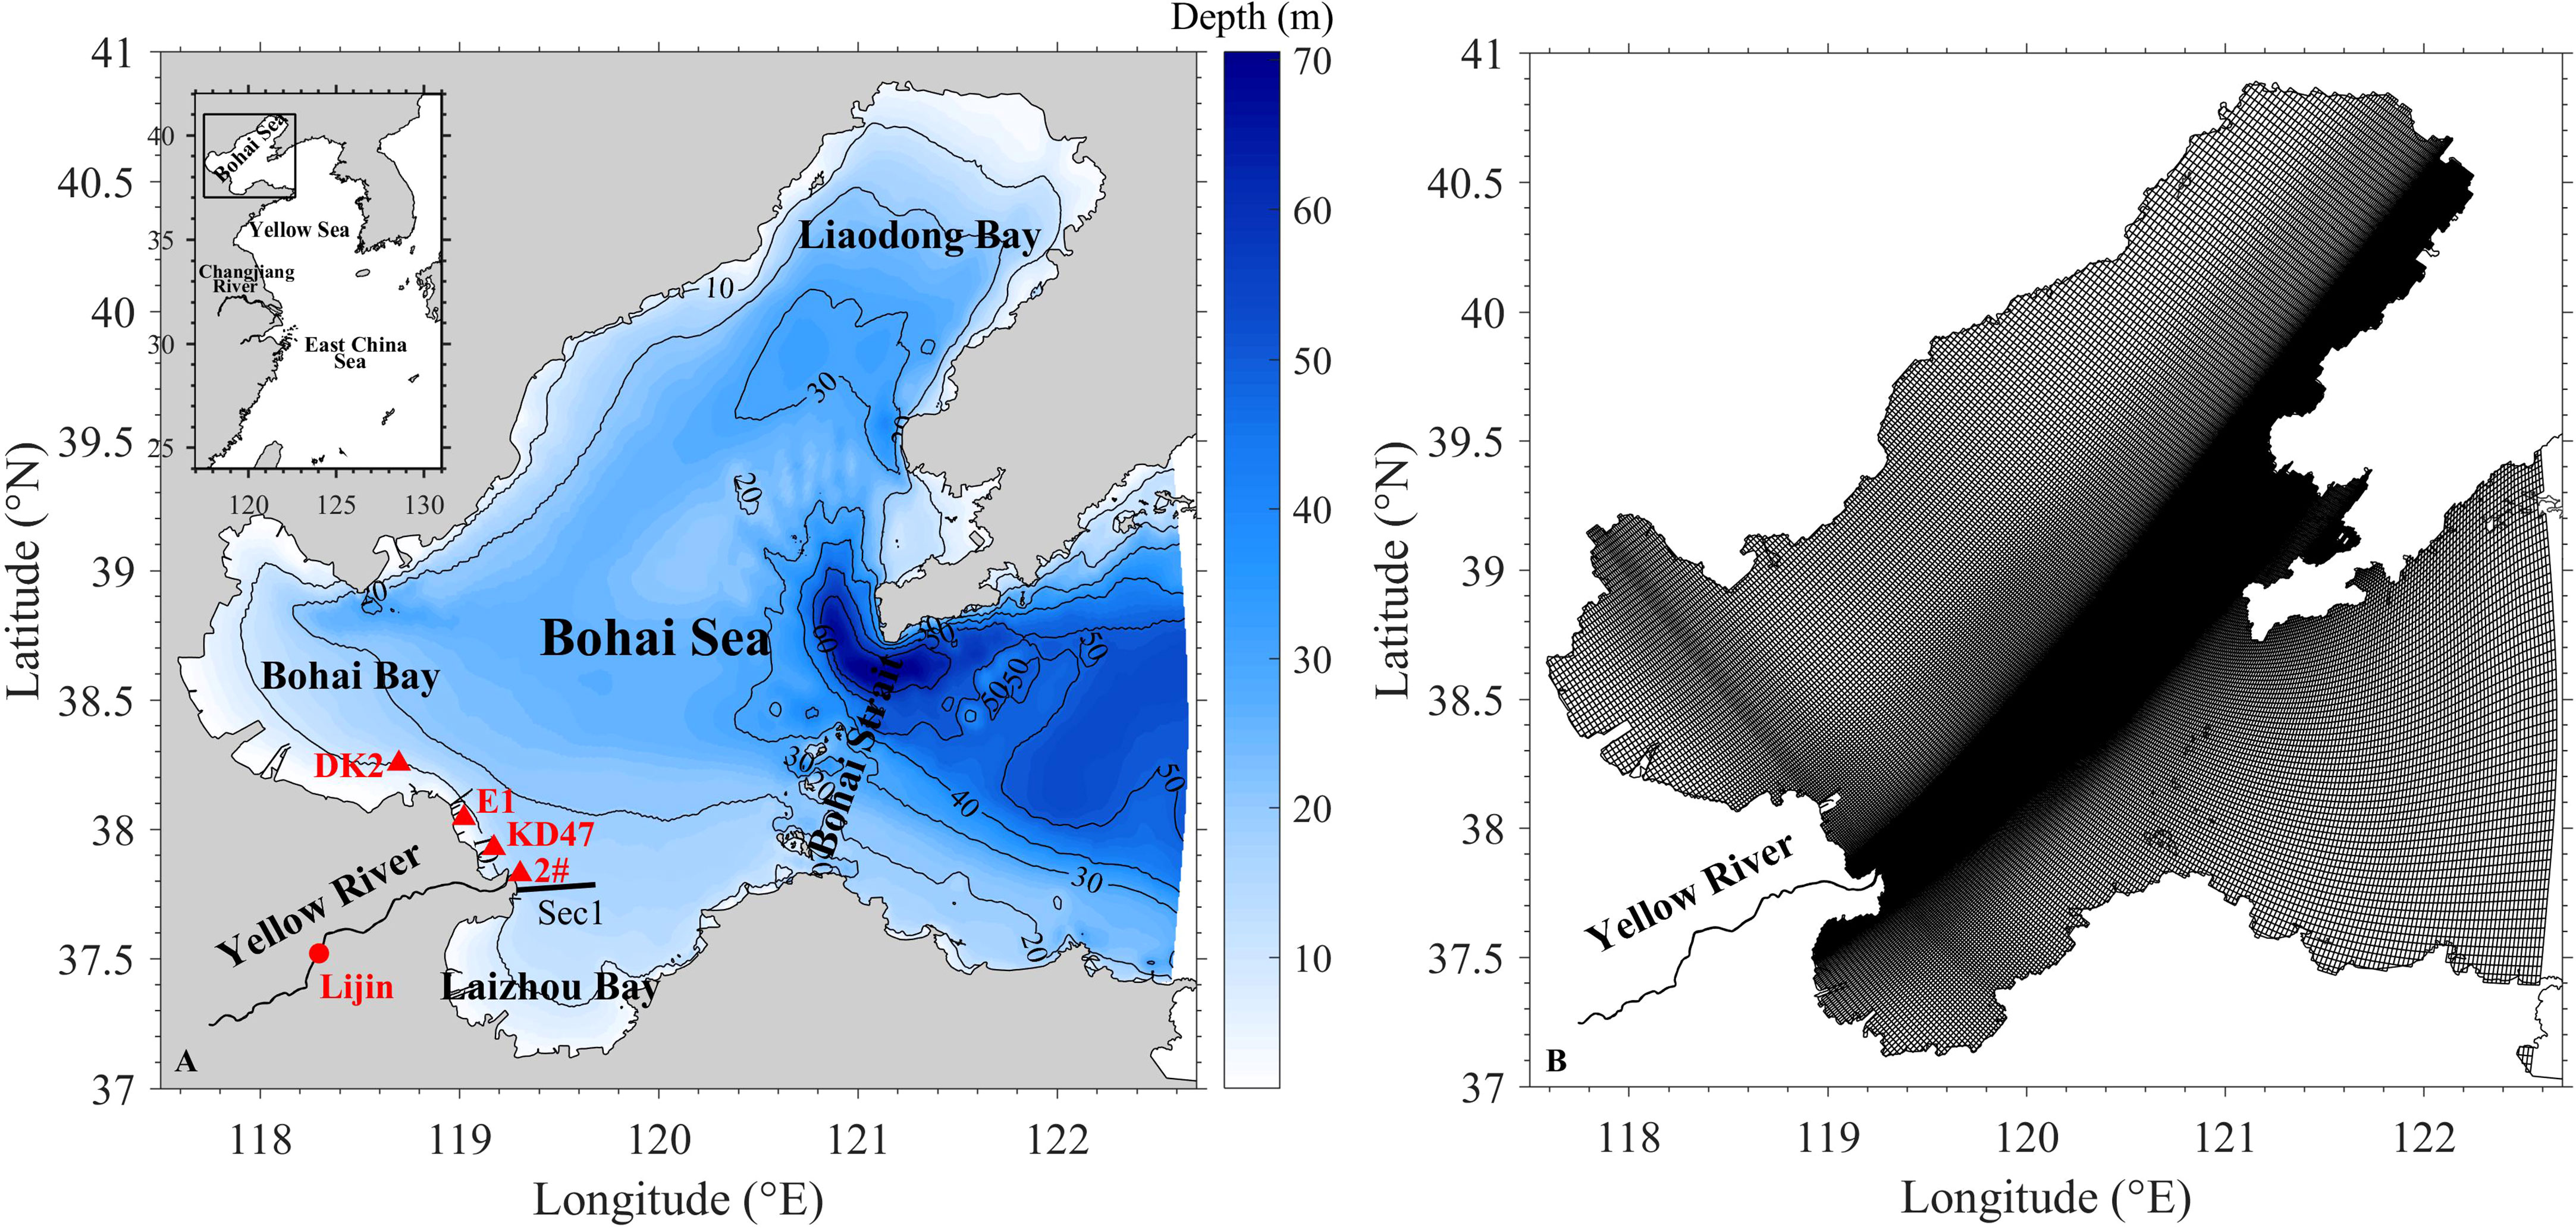
Figure 1 Topography of the Bohai Sea (A) (The black contours are the water depth (in meters), the red solid circle denotes the location of the Lijin hydrological station, and the red triangles signify the locations of the anchored ship measurement sites). The mesh of the domain (B).
The transport of water and sediments off the river mouth is influenced by river discharge, tide, wave, topography, temperature, and salinity, among others (Fettweis et al., 1998). Of these factors, data showed that wave and tidal currents are the two dominant ones affecting the transport of water and sediment, further influencing the suspended sediment concentration (SSC) in the river mouth (Chen, 2001). Wolanski et al. (1995) studied the sediment transport in the Fly River estuary and found that at least three-quarters of the sediment from the river settled in the estuary. Numerical results showed that the turbidity maximum was caused by the simultaneous influence of the baroclinic circulation and the tidal pumping, resulting in the turbidity maximum in the Fly River estuary existing only at spring tides. The vertical stratification caused by the residual baroclinic circulation driven by the along-channel density gradient plays an important role in trapping sediment in the turbidity maximum. As a result, the turbidity maximum is often located at the upstream limit of the salt intrusion (Lin and Kuo, 2001). The turbidity maximum is often accompanied by a bottom pool of easily erodible sediments, formed by further convergent sediment transport beyond the sediment capacity of the water column, which is highly variable in time and in return acts as a restoring force for the turbidity maximum location (Burchard et al., 2018).
The sediment transport shows flood and ebb variability. The eddy viscosity is higher during flood tide and lower during ebb tide in a partially mixed estuarine channel. This strong tidal asymmetry in turbulent mixing due to tidal straining induces more sediments resuspended during flood tide. As a result, there is an up-estuary pumping of sediments despite a net down-estuary advective flux (Simpson et al., 1990; Geyer, 1993; Scully and Friedrichs, 2003; Scully and Friedrichs, 2007). For fine cohesive sediments, the stronger turbulent mixing during flood tide plays a role in the breakup of aggregated flocs, resulting in the change of settling velocity (van Leussen, 1988; Traykovski et al., 2004).
There exists a shear front zone off the Yellow River mouth where sediment is accumulated as a result of the low velocity between flood and ebb (Li et al., 2001). Most of the river-laden sediments deposit inside the shear front with a high accumulation rate, while erosion is dominant outside the shear front due to the lack of sediment supply (Wang et al., 2007). Qin and Li (1983) found that about 80% of the sediments are deposited in the region less than 30 km away from the Yellow River mouth. Only less than 2% of the sediments can be transported to the Yellow Sea through the Bohai Strait (Martin et al., 1993).
Surface waves are assumed to be the major cause of sediment resuspension due to their influence on the bottom shear stress in shallow waters, especially during significant wind events (Luettich et al., 1990). Wave-induced sediment resuspension is three to five times higher than tide-induced resuspension in Upper Chesapeake Bay (Sanford, 1994). The SSC in the bottom layer increases with both wave height and wave bottom orbital velocity (Liu and Cai, 2019). Sediments are resuspended mostly during the flood tides that follow wave events during low water in the shallow waters of South San Francisco Bay. However, the strong sediment transport is a result of the non-linear interaction of wind waves and tidal currents (Brand et al., 2010).
The tidal regime off the Yellow River mouth is irregular semidiurnal tides, and the average tidal range is 0.6–1.0 m (Pang and Si, 1979). There is an amphidromic point of an M2 tidal constituent near Dongying station, north of the current Yellow River mouth. The tidal currents are rectilinear along the Yellow River Delta and rotary in the central Bohai Sea (Li et al., 1998b; Fan and Huang, 2005). The flood current usually flows SSE, while the ebb current directs NNW around the Yellow River mouth (Fan et al., 2006). The prevailing wind in the Bohai Sea is the northerly wind with a speed of 5–10 m/s in winter and southerly wind with a lower speed of 1–3 m/s in summer influenced by the East Asian Monsoon (Bian et al., 2013). As a result, waves are stronger in winter and weaker in summer. The significant wave height and wave period are higher in the central Bohai Sea and decrease shoreward (Lv et al., 2014).
Previous studies have done a lot of work explaining the dynamics of water and sediment transport in river mouths. However, the dynamic mechanism of water and sediment transport in the Yellow River mouth and adjacent seas is little known, especially the responses to tides and waves. This paper explores the influence of tides and waves on the transport of water and sediment in the Yellow River mouth and the adjacent sea in winter using a 3D high-resolution numerical model. The detailed model description and validation are presented in Section 2. The results of the numerical experiments and the dynamics of water and sediment transport are analyzed in Section 3. The responses of water and sediment transport to tide and wave are discussed in Section 4. Finally, the conclusions are presented in Section 5.
2 Materials and methods
2.1 Numerical model
2.1.1 Hydrodynamic model
The 3D hydrodynamic numerical model was based on the ECOM-si (estuarine, coastal and ocean model, semi-implicit) (Blumberg, 1994), which was developed from the Princeton ocean model (POM) (Blumberg and Mellor, 1987) and later improved by Zhu (2003) and Chen et al. (2004). The model adopted the “Arakawa C” grid difference scheme (Arakawa and Lamb, 1977) and the non-orthogonal curvilinear grids in the horizontal direction. In the vertical direction, the model used the σ coordinate system. The vertical eddy viscosity and diffusivity coefficients were calculated using the modified Mellor and Yamada level 2.5 turbulence closure scheme (Mellor and Yamada, 1974; Mellor and Yamada, 1982). The horizontal mixing processes were computed using the parameterization of Smagorinsky’s scheme (Smagorinsky, 1963). The transport equations were solved by third-order spatial interpolation at a moderate temporal resolution coupled with a total variation diminishing (TVD) limiter (HSIMT-TVD) advection scheme to prevent numerical oscillations and reduce numerical dissipation (Wu and Zhu, 2010).
The model domain covered the entire Bohai Sea and part of the north Yellow Sea (Figure 1B). The model grid consisted of 381 × 335 cells in the horizontal dimension. To increase the accuracy and stability of the simulation, the mesh was refined near the Yellow River mouth, with a resolution of 0.3–1 km compared with 2–4 km in the outer sea. The vertical direction was divided by 10 σ layers. The model time step was variable based on the Courant, Friedrichs, and Lewyt (CFL) criterion instead of using a constant value. A wet/dry scheme describing the intertidal flat with a critical depth of 0.2 m was included in the model. The upstream river boundary was set at Lijin hydrological station, and in situ water and sediment discharge was set as the boundary condition. The open-sea boundary in the north Yellow Sea was driven by 16 astronomical tidal constituents—M2, S2, N2, K2, K1, O1, P1, Q1, MU2, NU2, T2, L2, 2N2, J1, M1, and OO1—which were derived from the NaoTide dataset (http://www.miz.nao.ac.jp/). The sea surface wind field was from the European Center for Medium-Range Weather Forecast (ECMWF) reanalysis dataset with a spatial resolution of 0.125 × 0.125 and a temporal resolution of 6 h. The wave boundary conditions were calculated using the simulating waves nearshore (SWAN) model.
2.1.2 Sediment module
The sediment transport equation in the horizontal non-orthogonal curvilinear and vertical σ coordinate system can be written as:
where Csed is the SSC. ωsed is the sediment settling velocity, which was calculated as follows (Mehta and McAnally, 2008):
where Csed0 is the critical sediment concentration for flocculation. According to Huang et al. (1980), Csed0 = 0.2 kg m-3. The empirical coefficients m1, n1, m2, and n2 were set as 0.012, 2.2, 1.7, and 2.8, respectively. ω0 is the free settling velocity.
The SSC initial condition was set as a homogeneous constant value. Ignoring the surface sediment flux, the sea surface boundary was calculated as:
The sea bottom boundary was calculated as:
where qdep and qero are the bottom sediment flux due to deposition and erosion, respectively, which can be calculated as follows (Cao and Wang, 1994):
where τb is the simulated bottom shear stress; τe and τd are the critical shear stresses for erosion and deposition, respectively; a’ is the deposition coefficient, which was generally set as 0.67–0.84; and M is the erosion coefficient, which generally ranged from 1 × 10⁻⁵ to 4 × 10⁻³ kg m−2 s−1.
The bottom shear stress under the influence of wave–current interaction was expressed as (Liang et al., 2008):
where τwm is the maximum wave bed shear stress, τc is the current shear stress, and Фwc is the angle between wave propagation and the current.
The algorithm for wave bed shear stress was:
where p is the water density; fcw is the wave fiction factor, which can be evaluated with the empirical relations according to Signell et al. (1990); and ubm is the maximum near-bottom wave orbital velocity, which can be calculated as:
where k is the wave number; h is the water depth; H = Hrms = Hs/√2; ω = 2π/T; Hs is the significant wave height; and T is the significant wave period.
The current shear stress τc is related to the bottom current velocity uc:
where CD is the bottom drag coefficient under the influence of wave–current interaction, which was solved using an iterative procedure. Additional details about the calculation procedure can be found in Liang et al. (2008).
Critical shear stress is an important parameter for calculation of the bottom sediment flux. The equation by Dou (1999) considered the influence of sediment diameter and water depth on the sediment viscosity, which is suitable for areas with significant water depth variance. In this study, we first collected the distribution of the median particle diameter, D50, and the water content, W, of the surface bed sediment in the Bohai Sea from the literature, book, and atlas (Wang, 2003; Shi, 2008; Marine Atlas of Offshore China—Marine Sediment, 2017). Subsequently, the critical shear stress for erosion, τe, was calculated using the equation by Dou (1999).
In general, the parameter k was set as 0.128. The water density pw = 1,025 kg/m3 and the sediment density ps = 2,650 kg/m3. ϵ0 is the viscosity parameter, which was usually set as 1.75, while δ is the thickness of pellicular water, which was measured as 2.31 × 10⁻⁵ cm in the laboratory. The height of roughness was d’ = 0.5mm. d* = 10mm. γ0 is the sediment dry density, whereas is the stable dry density, the ratio of which represents the compaction rate of bed sediments. The value of referred to Han (1997). The sediment dry density was calculated as:
The components of bed sediments are variable in the Yellow River mouth and the adjacent sea, including grit, fine sand, silt, and clay, among others. The sediment diameter varies between 0.005 and 0.08 mm (Sun, 2013). The water content of the bed sediment is lower (50%–60%) in the north side of the current Yellow River mouth and higher (approximately 80%) in the south side. The critical shear stress for erosion along the Yellow River Delta is lower than 0.5 N/m2, while that in the northeast side of the current Yellow River mouth is approximately 0.8 N/m2 (Supplementary Figure S1). The critical shear stress in some areas north of Laizhou Bay is higher because these areas are dominated by fine cohesive sediment. The critical shear stress for deposition, τd, was calculated as (Cao and Wang, 1994):
Based on the calculated critical shear stress for erosion and deposition, the model was calibrated and validated using measured and remote sensing retrieval SSC data to obtain a better distribution of critical shear stress suitable for the current Yellow River mouth and adjacent sea.
2.2 Model validation
The model has been well calibrated and verified numerous times for elevation, current velocity, and salinity in previous studies (Cheng et al., 2021a; Cheng et al., 2021b). This study further validated the model with current, salinity, SSC, and wave for the SWAN model. The following three skill assessments were used to quantify the validations: correlation coefficient (CC), root mean square error (RMSE), and skill score (SS) (Murphy, 1988; Ralston et al., 2010).
where X is the variable of interest and is the time-averaged value. The agreement between the modeled and the observed results was assessed as follows: SS > 0.65, excellent; SS = 0.65–0.5, very good; SS = 0.5–0.2, good; and SS< 0.2, poor (Maréchal, 2004; Liu et al., 2009).
2.2.1 Current, salinity, and SSC
We used the in situ water velocity, salinity, and SSC data at the anchored ship stations (labeled in Figure 1) to validate the model. Site DK2 was measured from August 29 to 30, 2018; site E1 was measured from October 11 to 12, 2009; and site 2# was measured from August 6 to 7, 2017. The mean water depths at sites DK2, E1, and 2# were 9.3, 6.91, and 5.7 m, respectively.
The comparisons between the observed data and the simulated results are shown in Figure 2. At the measured site DK2, the current was rectilinear, the flood current velocity was almost the same as the ebb current velocity, and the bottom velocity was smaller than the surface velocity due to bottom friction. The salinity was approximately 30.5 at the surface layer (the first σ layer) and was 30.5 at the bottom layer (the last σ layer), with almost little temporal variation. The SSC varied with tide, with maximum values of 0.15 and 0.2 kg/m3 at the surface and bottom, respectively. At the measured site E1, the water velocity was smaller than that of DK2 and 2# due to the artificial dams nearby. The maximum surface water velocity was only 0.6 m/s. The surface salinity was approximately 27.5 and the bottom salinity approximately 28, with a little temporal variation. The maximum SSCs were 0.12 and 0.17 kg/m3 at the surface and bottom layers, respectively, with a downtrend. At the measured site 2#, the maximum water velocities were 0.9 and 0.6 m/s at the surface and bottom layers, respectively. The salinity had a semidiurnal variation, with a minimum 5.1 and a maximum of 29.5 at the surface layer. The maximum SSCs were 0.25 and 0.26 kg/m3 at the surface and bottom layers, respectively.
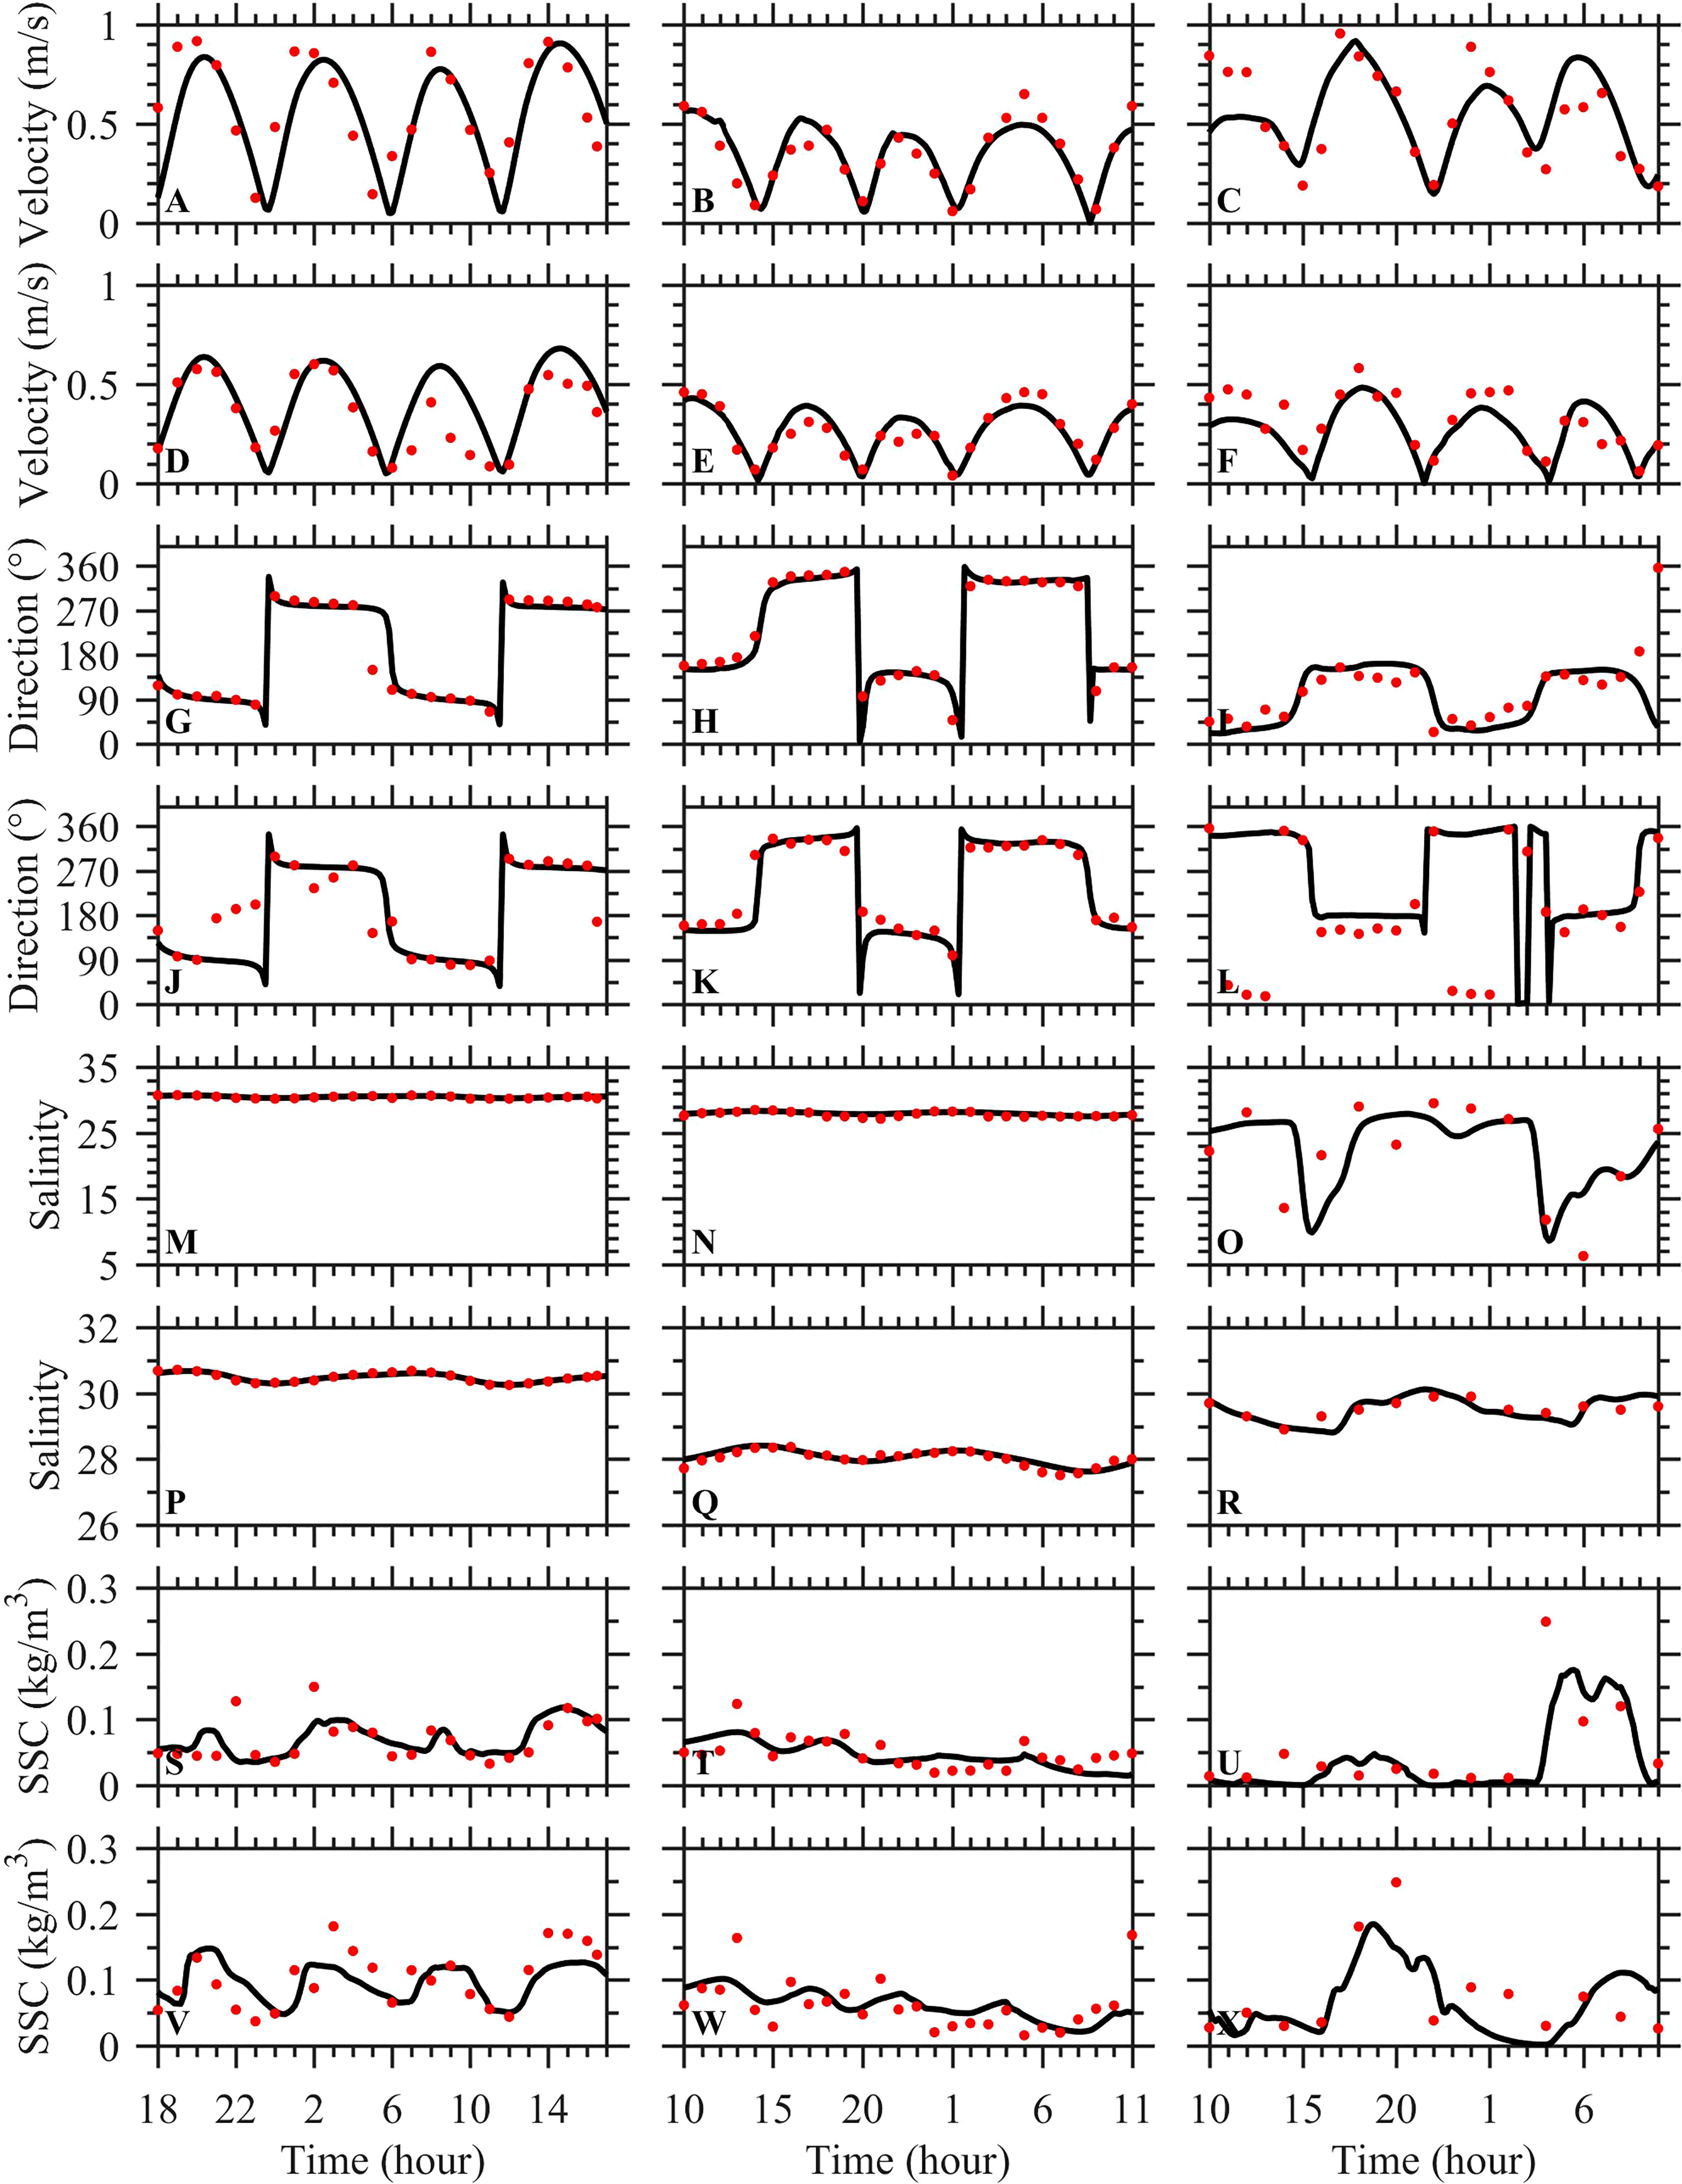
Figure 2 Comparisons between the observed data (red dots) and the simulated results (black line). The left column represents site DK2, the middle column represents site E1, and the right column represents site 2#. (A–C) Surface velocity. (D–F) Bottom velocity. (G–I) Surface direction. (J–L) Bottom direction. (M–O) Surface salinity. (P–R) Bottom salinity. (S–U) Surface suspended sediment concentration (SSC). (V–X) Bottom SSC.
The CC, RMSE, and SS for comparison of the modeled and the observed water velocity and salinity at the measured sites are shown in Supplementary Table S1. For water velocity, the mean CC, RMSE, and SS were 0.79, 0.14 m/s, and 0.57 for the surface water velocity; 0.84, 0.09 m/s, and 0.61 for the bottom water velocity; and 0.82, 0.12 m/s, and 0.59 for the vertically averaged water velocity, respectively. For salinity, the mean CC, RMSE, and SS were 0.76, 2.04, and 0.45 for the surface salinity; 0.88, 0.13, and 0.64 for the bottom salinity; and 0.82, 1.09, and 0.55 for the vertically averaged salinity, respectively. For SSC, the mean of these values were 0.61, 0.04 kg/m3, and 0.31 for the surface SSC; 0.62, 0.04 kg/m3, and 0.35 for the bottom SSC; and 0.62, 0.04 kg/m3, and 0.33 for the vertically averaged SSC, respectively. In general, the model reproduced the processes of water current, salinity, and SSC well and can be used to study the hydrodynamics and sediment transport in the Bohai Sea.
2.2.2 Remote sensing retrieval and validation
The sea surface SSC was validated using remote sensing retrieval in winter and summer of Landsat 8 OLI (Operational Land Imager) imagery, which was downloaded from USGS (http://glovis.usgs.gov/). The remote sensing image was captured in March and August 2018 (Figure 3). Studies have shown that the spectral reflectance range of 700–900 nm in the image is more sensitive to the variation of sea surface SSC (Doxaran et al., 2002). The green or blue band combined with the near-infrared band is more suitable for the retrieval of high-turbidity water near the Yellow River mouth (Long and Pavelsky, 2013). Therefore, the SSC retrieval formula of Zhan et al. (2017) was adopted, which was given by:
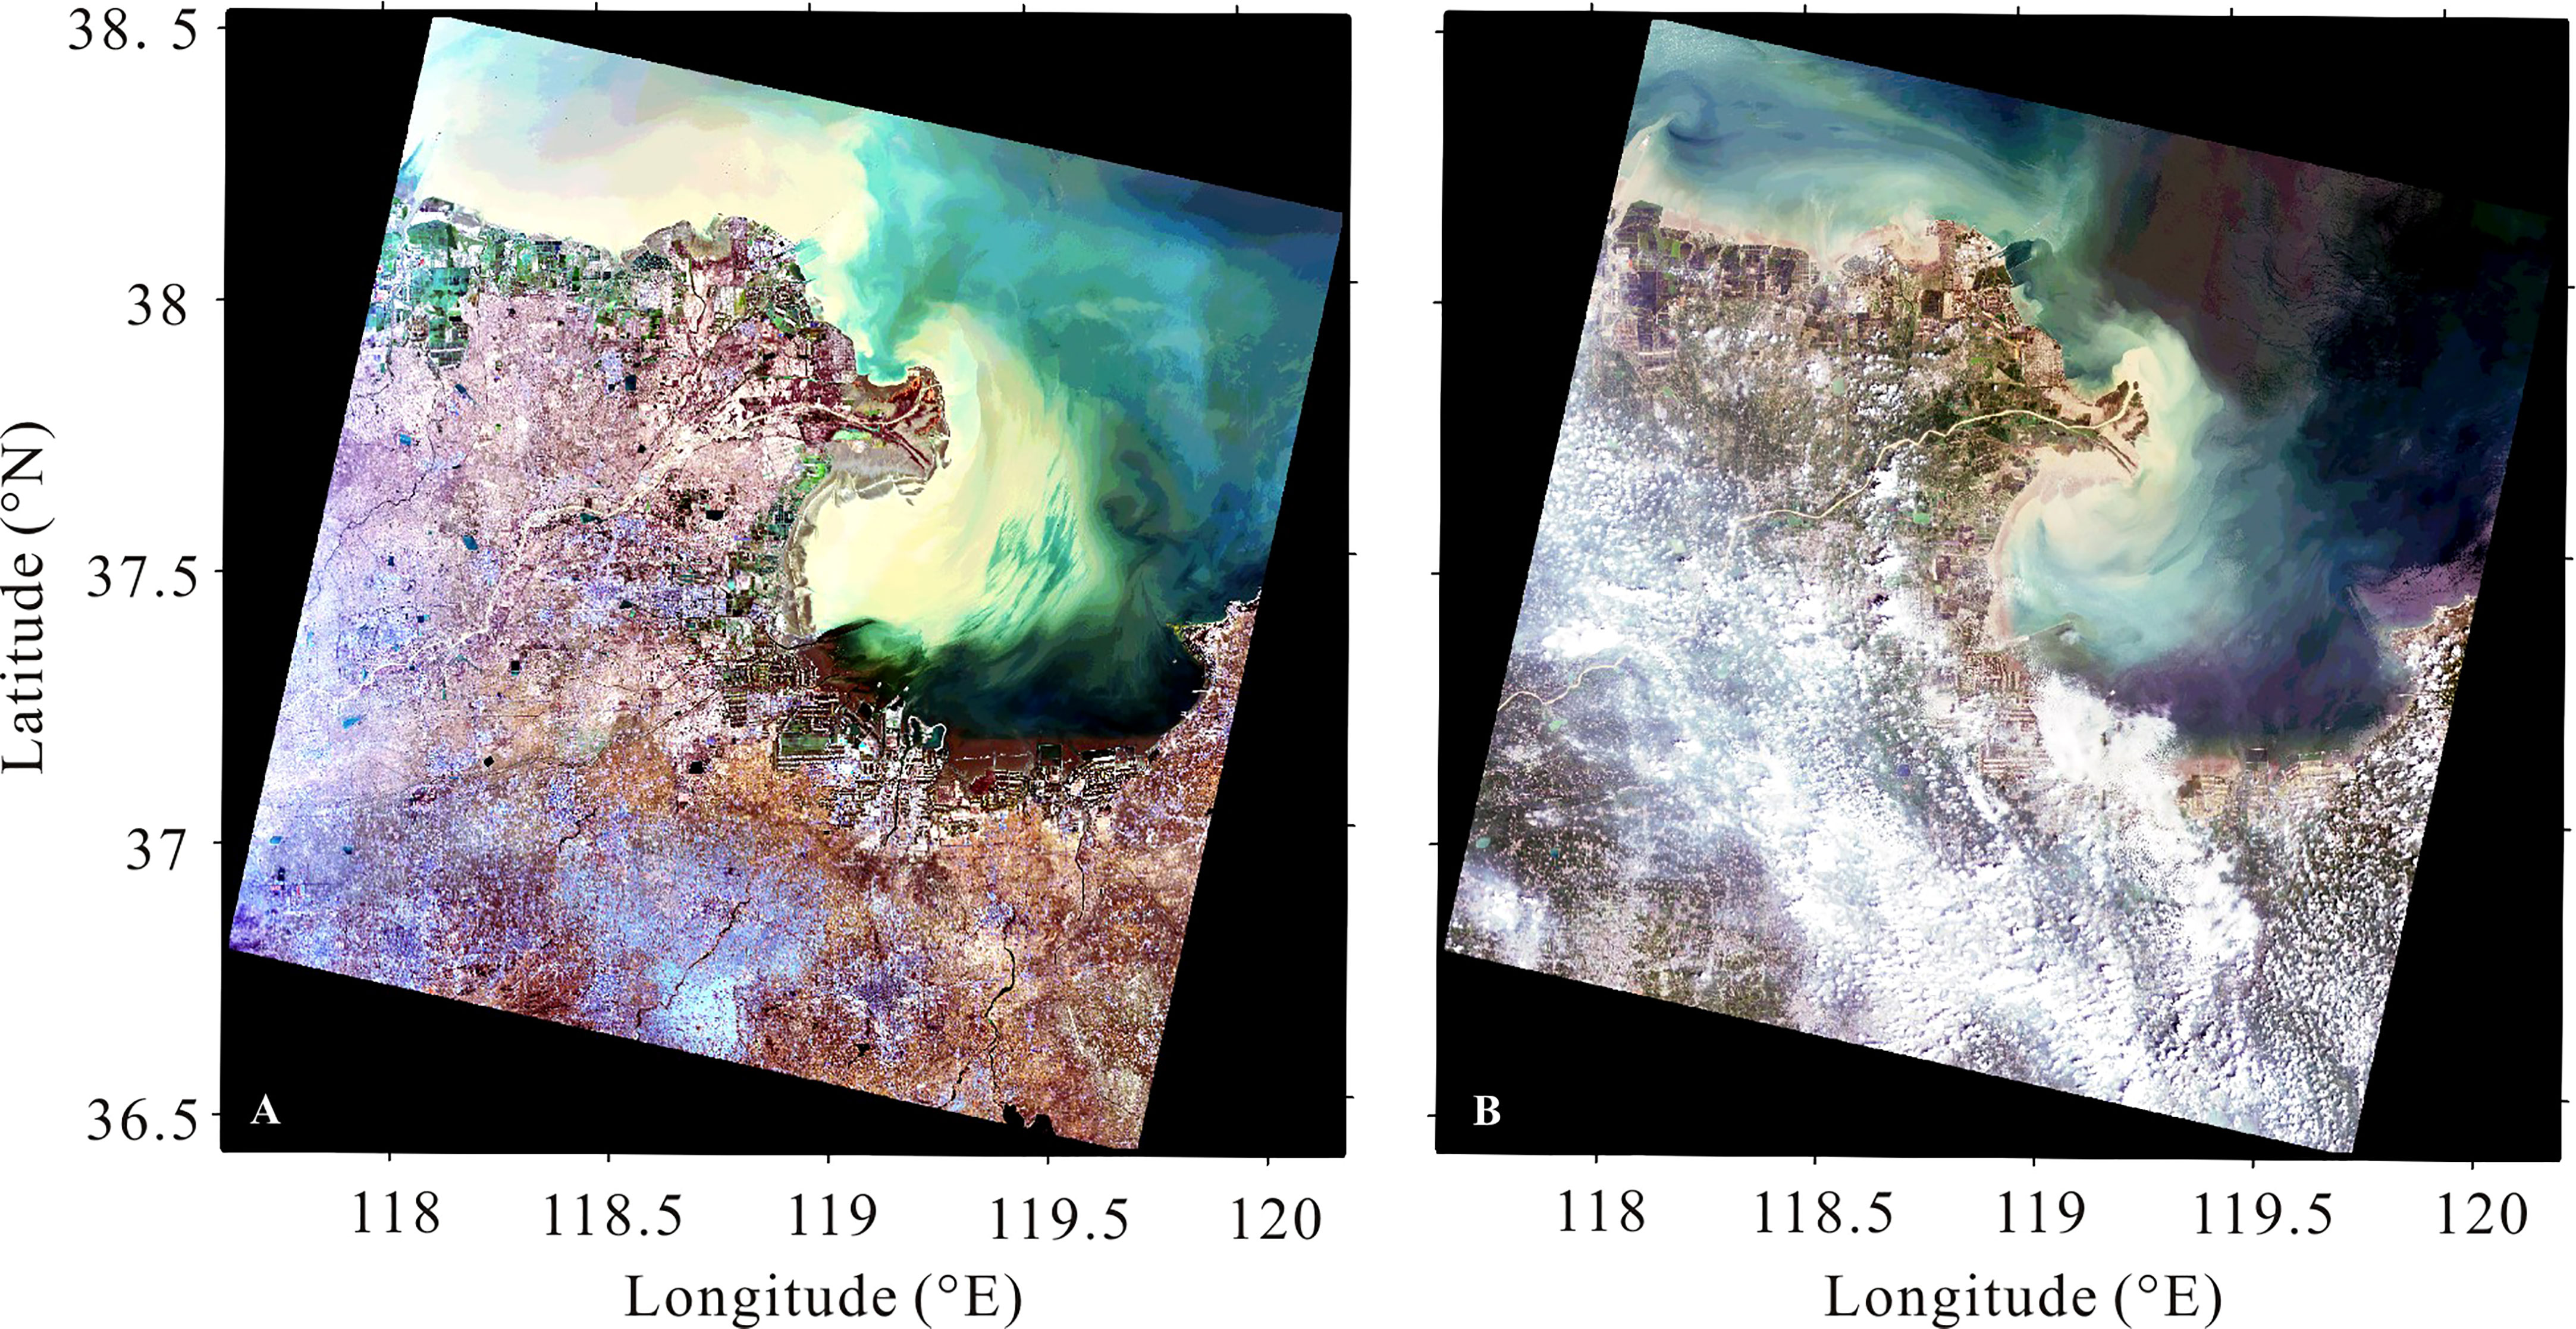
Figure 3 Remote sensing images of Landsat 8 OLI (Operational Land Imager) in the sea near the Yellow River mouth in March (A) and August (B) 2018.
where the unit of SSC was milligrams per liter. X = Rrs (820)/Rrs (490), where Rrs (820) and Rrs (490) are the sea surface spectral reflectance at 820 and 490 nm, respectively.
The remote sensing retrieval and validation of the sea surface SSC is shown in Figure 4. The sea surface SSC was higher in winter and lower in summer. In winter, the sea surface SSC was higher near the Yellow River mouth, north of Laizhou Bay, and south of Bohai Bay. The retrieval SSC corresponded to that of the remote image. In summer, the sea surface SSC was higher in the Yellow River mouth and north of Laizhou Bay, with the highest value lower than 1 kg/m3. The simulated sea surface SSC was close to the retrieval result. The simulated high-SSC areas corresponded to the retrieval, but the magnitude of SSC was a little higher than the retrieval SSC. In general, the remote sensing retrieval and model validation results were good. Therefore, the model can be used to study the variations in SSC in the Yellow River mouth and adjacent sea.
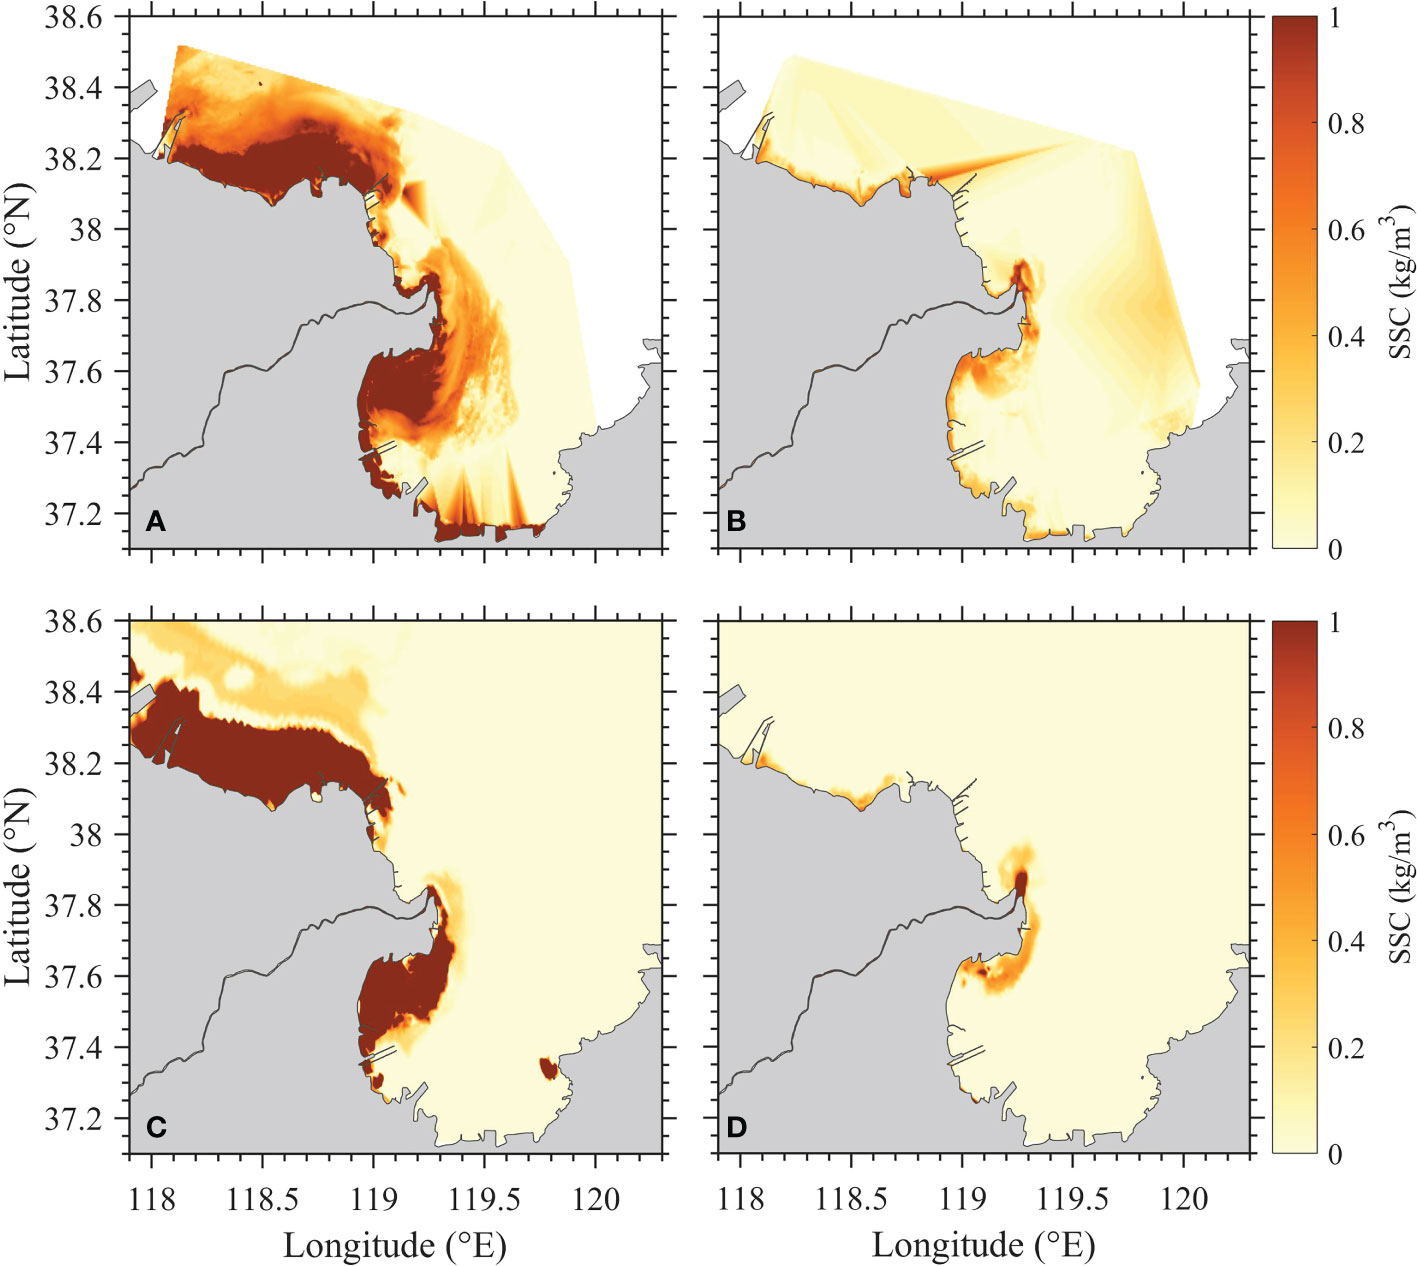
Figure 4 Comparisons between the remote sensing retrievals of the sea surface suspended sediment concentration (SSC) from Landsat 8 images (A, B) and the model results (C, D) in March (A, C) and August (B, D) 2018.
2.2.3 Wave
The wave parameters were simulated by the SWAN model. The SWAN model was driven by the wind field 10 m off the ground downloaded from the ECMWF. The outputs of the SWAN model were significant wave height, wave period, wave direction, wave length, etc. The model was validated using the measured significant wave height and the period November 9–22, 2012 in site KD47 (labeled in Figure 1) (data from Wang, 2014). As shown in Supplementary Figure S2, the variation of the simulated significant wave height and period corresponded to the measured data. However, the simulated crest of significant wave height was lower than the measured data, which might be the result of the low time resolution of the wind data. In general, the SWAN model simulated the wave parameters well. Therefore, it is able to provide the wave boundary condition in the ECOM-si model.
2.3 Numerical experiment settings
Three numerical experiments were set to study the transport of water and sediment off the Yellow River mouth in winter and the responses to tide and wave (Supplementary Table S2). Exp 0 is the control experiment, which considered the river discharge, tide, and wave, among others. Exp 1 excluded the influence of tide in order to study its effect on the transport of water and sediment. Exp 2 excluded the influence of wave in order to study its effect by comparing with Exp 0. The model ran from January to December, and the subtidal results during spring tide in December were analyzed. The river discharge is the monthly mean data recorded in Lijin hydrological station. The wind data were from the ECMWF with a time resolution of 6 h. The wave boundary condition was the simulated result of the SWAN model. The residual sediment flux was used to represent the sediment transport in the shallow sea with tidal rise and fall. This flux was calculated as follows:
where T is the averaged time of six tidal periods, which was approximately 3 days; h2 and h1 are the top and bottom depths of the water layer, respectively; Csed is the SSC; and is the horizontal velocity.
The convergence and divergence of sediment transport (condiv) was used to reflect the sediment transport condition. The formula was given by:
where x and y denote the east and north directions, respectively. u and v represent the velocity in the east and north directions, respectively. The variation of SSC in the water column induced by horizontal sediment transport was calculated by integrating the horizontal sediment transport term vertically. Convergence of sediment transport means that the SSC increased locally, while divergence indicates that the SSC decreased locally.
3 Results
The prevailing wind above the Bohai Sea was northeasterly during spring tide in December 2012, with values of 5–7 m/s. The northeasterly wind induced a northwestward Ekman transport. As a result, the residual water fluxes in the Bohai Sea in the surface layer were mostly westward/northwestward (Figure 5A). The freshwater off the Yellow River flowed downstream (the direction in which a Kelvin wave propagates) into Laizhou Bay, resulting in the lowest salinity value of approximately 25 in Laizhou Bay. The residual water fluxes in Laizhou Bay were lower than 0.01 m3/s due to the weak salinity gradient. The salinity gradient was higher to the east of Laizhou Bay, which was due to the stronger residual water flux from the coast to the northwest induced by the Ekman transport. The salinity distribution in the bottom layer was close to that in the surface layer as a result of the strong vertical mixing in winter (Figure 5B). The bottom salinity to the east of Laizhou Bay was higher than the surface layer salinity, where the bottom residual water fluxes were southward across the salinity gradient induced by the baroclinic gradient force, with values of 0.04–0.1 m3/s. The bottom residual water fluxes in the central area of Bohai Sea were northeastward due to the compensational transport for water conservation, with values lower than 0.04 m3/s. However, the water transport in the south of Bohai Bay and the head of Laizhou Bay was weak due to the homogeneous salinity distribution.
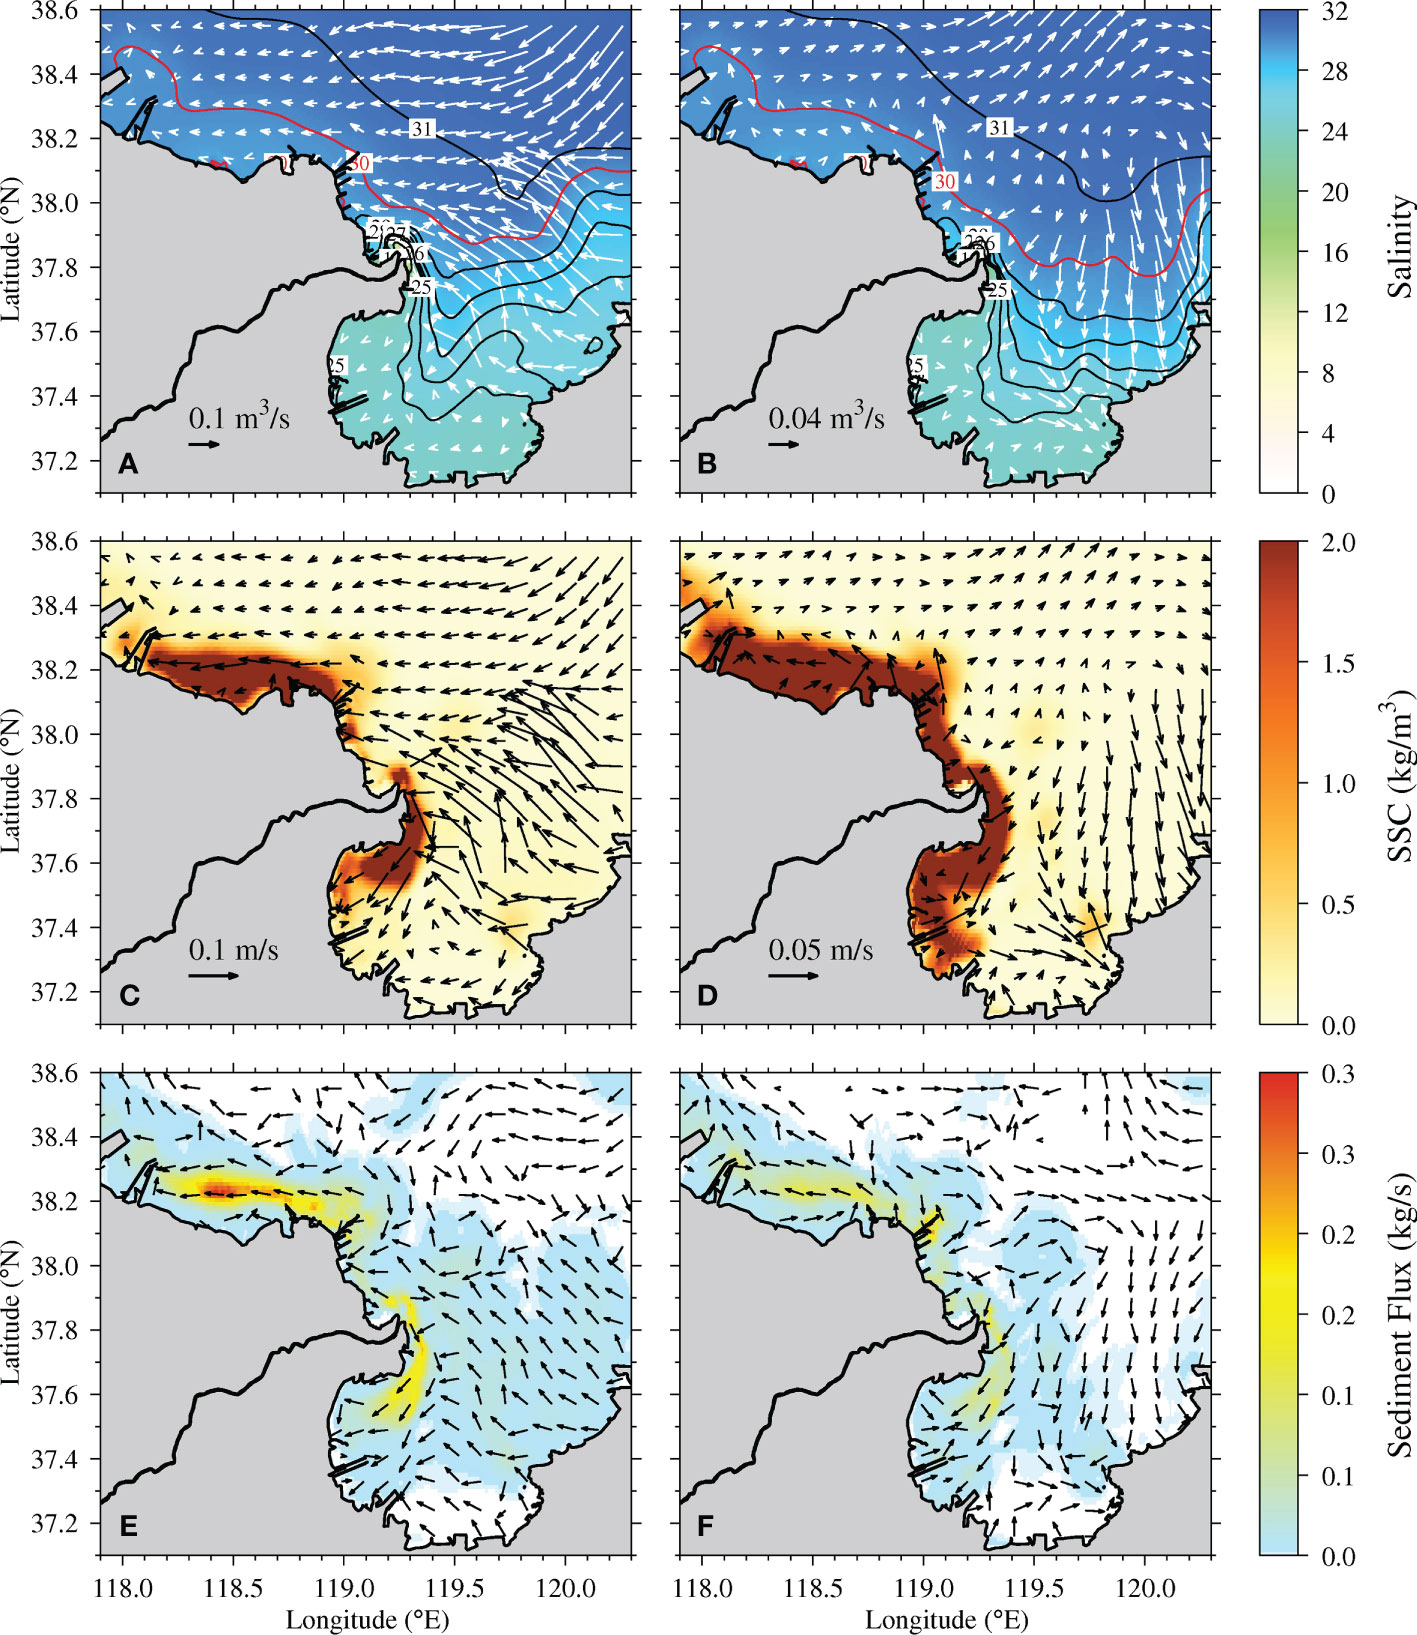
Figure 5 Distributions of residual unit width water flux and salinity (A, B), residual water velocity and suspended sediment concentration (SSC) (C, D), and residual unit width sediment flux (E, F) at the surface (left panel) and bottom (right panel) layers during spring tide in December 2012 in Exp 0. Arrows only signify direction, while color signifies the value of residual sediment flux in (E) and (F).
The strong wind in winter induced a strong wave effect along the coast. As a result, the bottom shear stress induced by wave was higher in the shallow water along the coast of the Yellow River Delta (Figure 6). The bottom shear stress induced by tide was higher in the north of Laizhou Bay and south of Bohai Bay due to the larger water velocities. The total bottom shear stress was strong along the coast of the Yellow River Delta, with maximum values in the north of Laizhou Bay and south of Bohai Bay (approximately 1 N/m2 compared with the critical shear stress for erosion lower than 0.5 N/m2 along the coast, as shown in Supplementary Figure S1). The total bottom shear stress suspended the bed sediment to the upper layer. As a result, the bottom SSC was higher than 2 kg/m3 along the coast of the Yellow River Delta, whereas the surface SSC was higher in the north of Laizhou Bay and south of Bohai Bay, which corresponded to the bottom shear stress induced by tide. The directions of the residual water velocities were similar to those of the residual water fluxes (Figures 5C, D). The water from the Yellow River flowed downstream along the coast, carrying the river sediment into Laizhou Bay. The residual water velocities were 0.05–0.15 m/s, while the residual sediment fluxes were 0.15–0.2 kg/s in the surface layer downstream of the Yellow River mouth (Figure 5E). In the bottom layer, the residual water velocities and sediment fluxes were in the same direction as those in the surface layer, but were weaker than those in the surface. Therefore, the sediment sources of this area were the Yellow River and local bottom sediment resuspension. In the north side of the Yellow River mouth, the surface residual water velocities and sediment fluxes were upstream, but were a lot weaker than those south of the river mouth. Thereby, the surface SSC in the north side of the river mouth was lower than 0.5 kg/m3. In the south of Bohai Bay, the water and sediment transport was westward. The residual water velocities ranged 0.02–0.05 m/s, while the residual sediment fluxes were 0.05–0.3 kg/s. The SSC south of Bohai Bay was higher at the bottom and lower at the surface. However, sediment transport was stronger at the surface and weaker at the bottom. The strong bottom shear stress in the south of Bohai Bay and the far distance from the river mouth suggest that the high SSC was mainly caused by local bottom sediment resuspension.
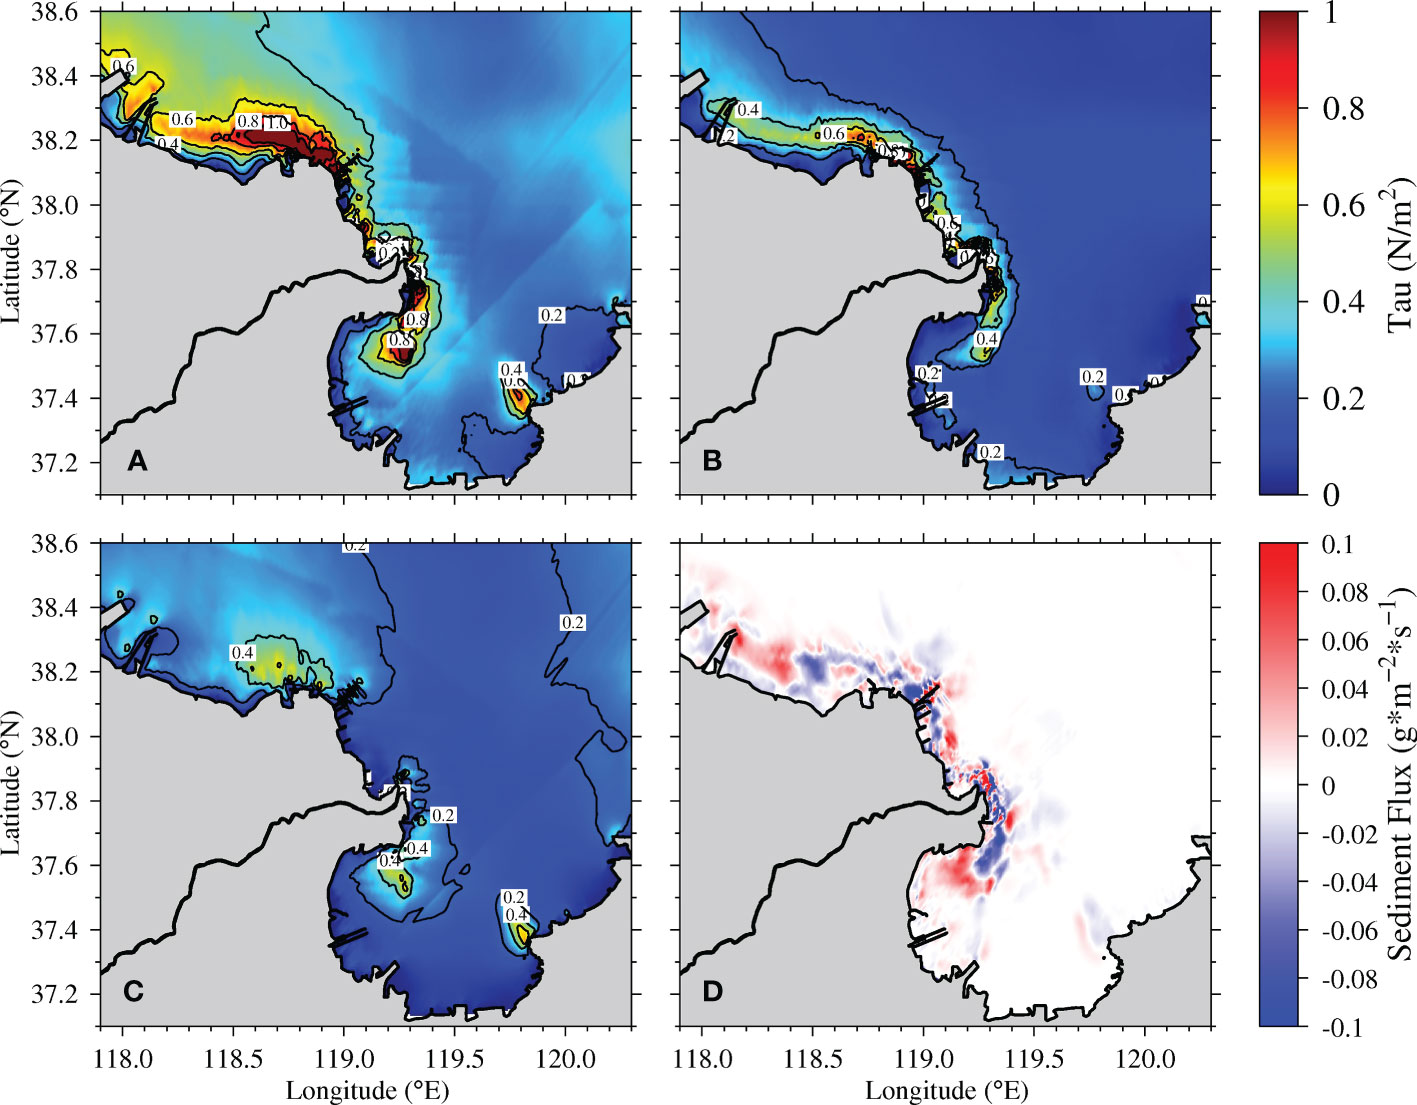
Figure 6 Distributions of the total bottom shear stress (A), bottom shear stress induced by wave (B), bottom shear stress induced by tide (C), and sediment convergence and divergence (D) during spring tide in December 2012 in Exp 0. Positive value and red color indicate convergence, while negative value and blue color indicate divergence in (D).
The sediment transport converged in the Yellow River mouth, with sediment fluxes of approximately 0.1 g m−2 s−1 as a result of river sediment deposition (Figure 6D). There was a divergence area east of the convergence area, indicating that part of the sediments was transported landward to the river mouth. The sediment transport was divergence downstream of the river mouth, with sediment fluxes of approximately 0.08 g m−2 s−1, whereas in the adjacent north of Laizhou Bay, the sediment transport converged with fluxes of 0–0.06 g m−2 s−1. It is presumable that the sediments from the Yellow River were transported downstream along the coast and mainly deposited in the north of Laizhou Bay. To the upstream of the Yellow River mouth, the sediment transport was divergence nearshore and convergence offshore, indicating that sediments were transported from the coast to the sea. In the south of Bohai Bay, the sediment transport was divergence at the east side and convergence at the west side. The residual sediment fluxes were approximately 0.04–0.06 g m−2 s−1. The sediment transport in the south of Bohai Bay was westward, which corresponded to the diagram of the residual sediment flux (Figures 5E, F).
Sec 1 is located at the south side of the Yellow River mouth (labeled in Figure 1). The residual water currents along Sec 1 were mainly landward in the surface layer driven by the westward Ekman transport induced by the northeasterly wind. The surface residual water velocities along Sec 1 were approximately 1–8 cm/s. In the bottom layer, the along-section residual water currents were also landward due to the baroclinic gradient force. However, the velocities were much smaller than those in the surface layer, with values lower than 1 m/s. The strong landward surface currents induced an upwelling at about 28 km away from the coast and a downwelling at 10 km away from the coast, which was suggested to be the result of the convergence and divergence of the Ekman transport in the bottom boundary layer during the trapping of the river plume front (Chapman and Lentz, 1994; Wu and Wu, 2018; Cheng et al., 2021a). As for the cross-section currents, the residual water flowed downstream within 8 km away from the coast, with velocities larger than 6 cm/s. At the seaward side of Sec 1, the residual water flowed upstream in the surface layer due to the Ekman transport and downstream in the bottom layer as compensational flow across the section. The maximum cross-section water velocities were higher than 6 cm/s at the surface and lower than 4 cm/s at the bottom.
The strong wind wave in winter induced strong vertical mixing in the shallow water. As a result, the salinity was well mixed at the nearshore side of Sec 1 (Figure 7). Within 4 km away from the coast, the salinity in the surface layer was approximately 23 as a result of the freshwater flowing downstream across Sec 1. At the seaward side of the section, the salinity was stratified in the water column due to the downstream transport of saline water in the bottom layer induced by the baroclinic gradient force, with surface salinity lower than 29 and bottom salinity close to 30. The SSC profile indicated that the high-SSC area is located 10 km away from the coast. The SSC in the water column was stratified within 5 km and mixed over 5 km away from the coast. The maximum SSC along Sec 1 was approximately 5 kg/m3 in the near-bed layer at about 1–3 km away from the coast, decreasing upward to approximately 3–4 kg/m3 in the surface layer. It was predictable that the nearshore high SSC was mainly derived from bottom sediment resuspension rather than along-shelf sediment transport.
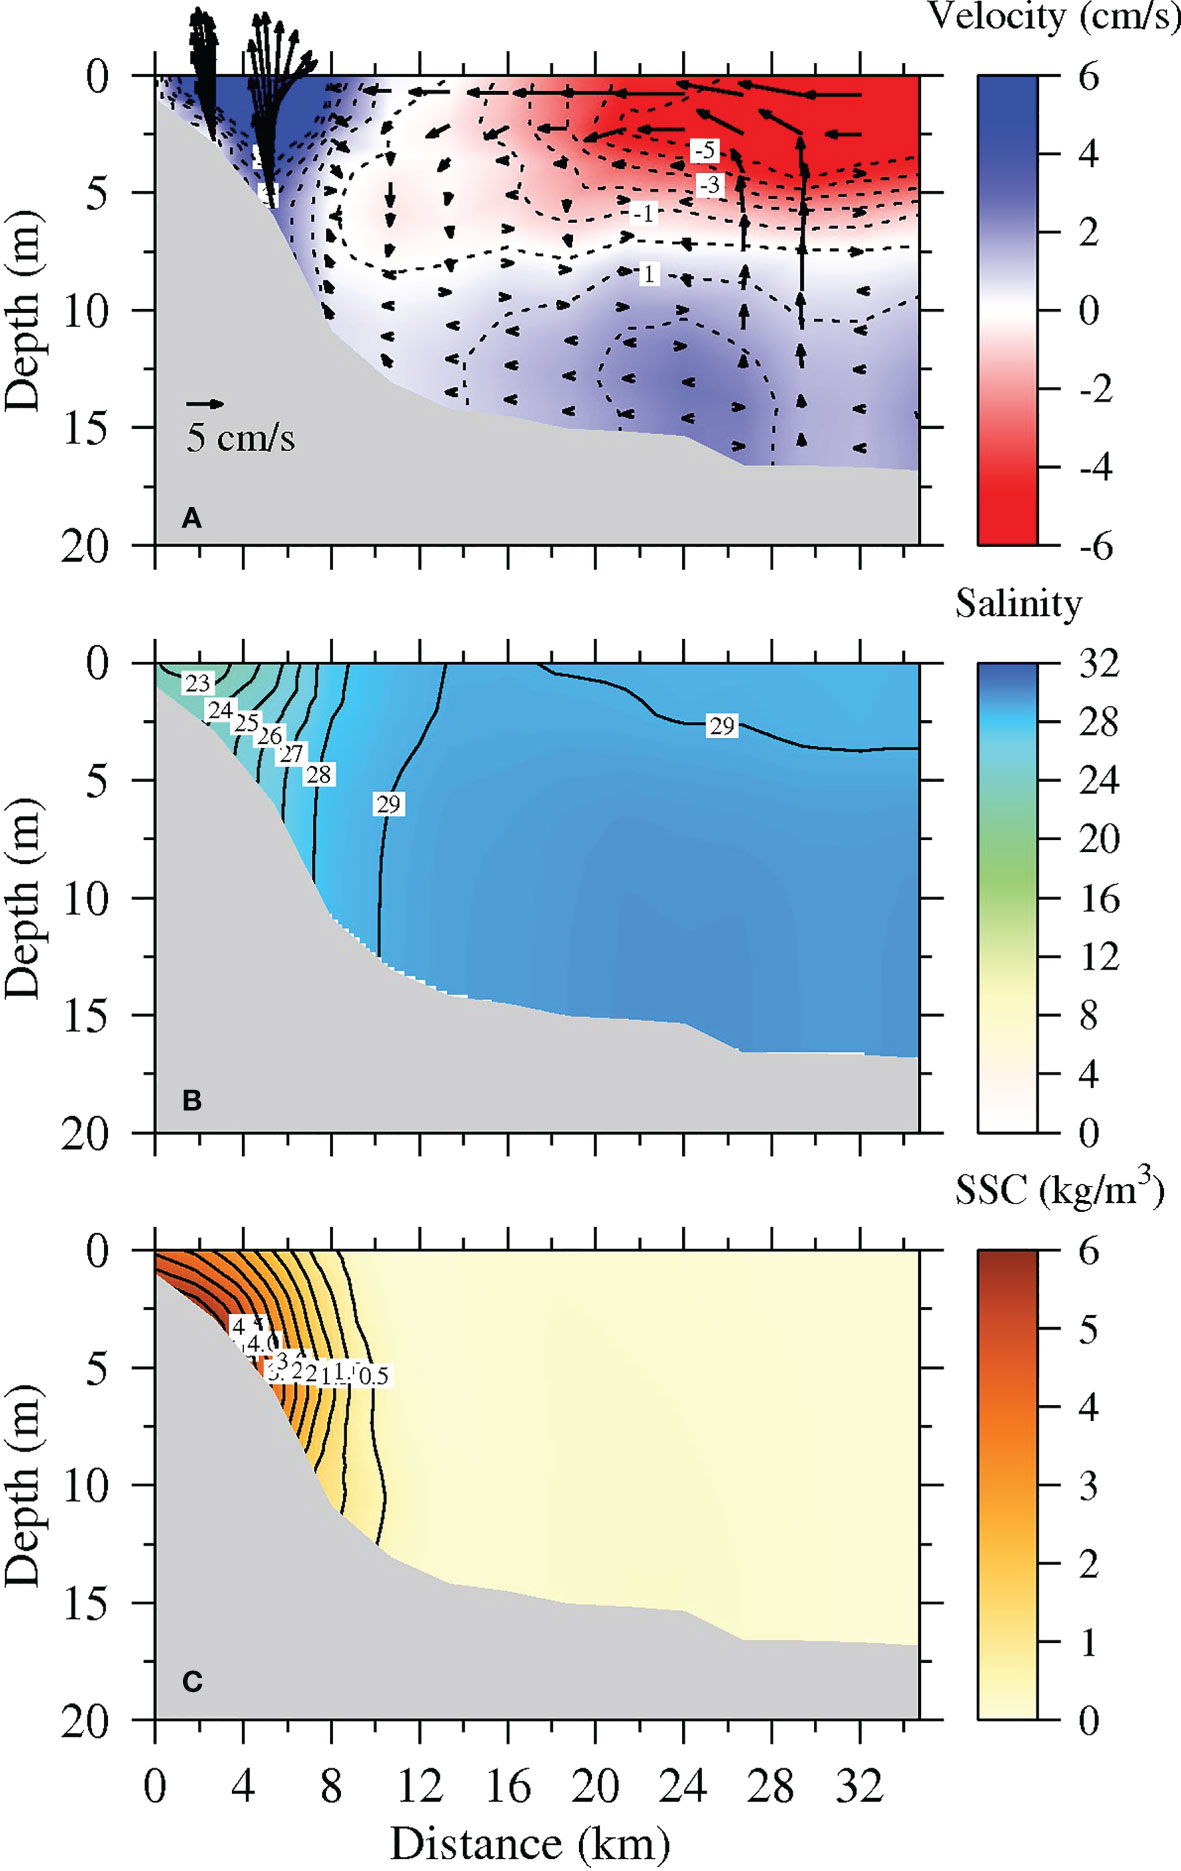
Figure 7 Vertical profile distributions of residual velocity (A), salinity (B), and suspended sediment concentration (SSC) (C) along Sec 1 in Exp 0 during spring tide in December 2012. Arrows in (A) denote current vectors along the section, while the contours signify current velocities perpendicular to the section (positive values indicate downstream current).
The water flux and salinity flux across Sec 1 showed similar temporal variations (Figures 8A, B). The water and salt transport was mainly downstream in December 2012, especially during the early part of the month. During spring tide, the total water and salt fluxes across Sec 1 were firstly upstream, which then turned downstream, then once again diverting upstream. The maximum water flux was approximately 0.8 × 10⁴ m3/s, while the maximum salt flux was approximately 200 kg/s, both in the downstream direction. However, the sediment flux across Sec 1 was mainly in the downstream direction in December because the sediment from the Yellow River was transported downstream across the section. During spring tide, sediments were transported downstream across Sec 1 with fluxes of approximately 0–1 × 10⁴ kg/s.
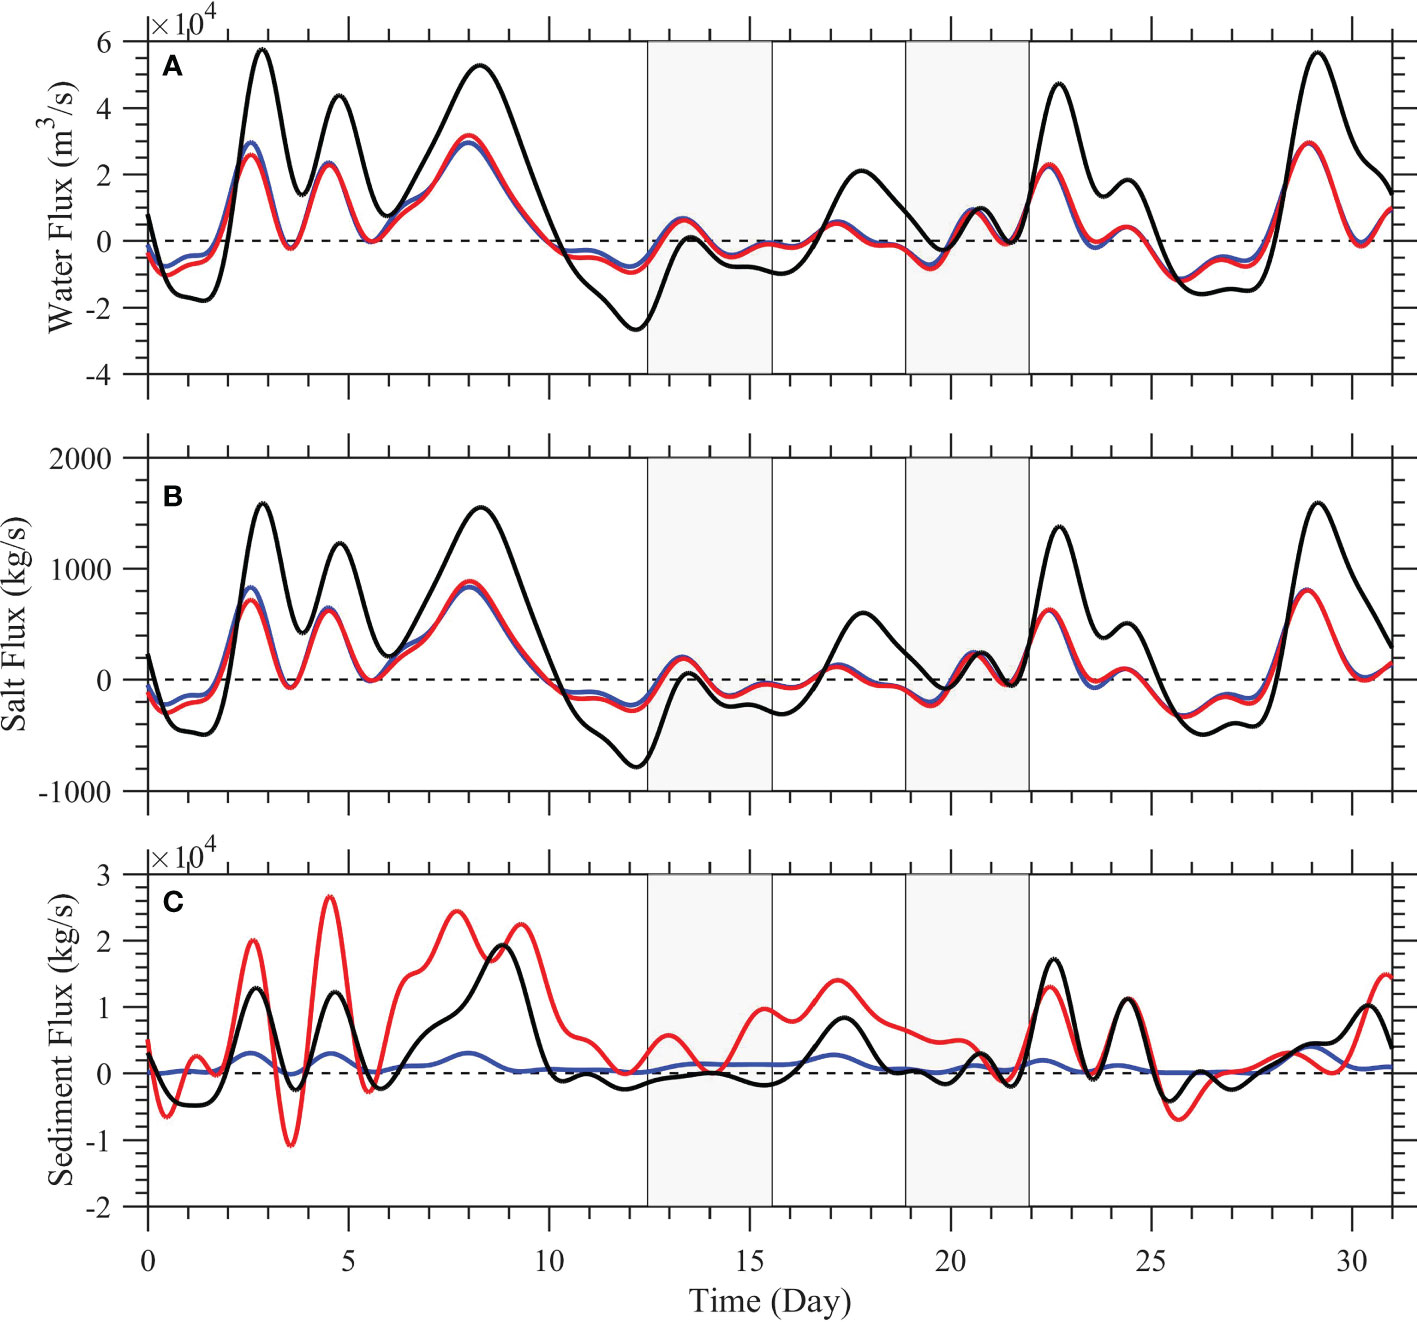
Figure 8 Temporal variations in water flux (A), salt flux (B), and sediment flux (C) across Sec 1 in December 2012 in Exp 0 (red line), Exp 1 (black line), and Exp 2 (blue line). Positive values indicate downstream transport, the left shadow indicates the duration of spring tide, and the right shadow indicates the duration of neap tide.
4 Discussion
4.1 The effect of tides on the transport of water flow and sediments
Exp 1 excluded tide as a driving force, and the results were compared with those of Exp 0. Without tidal forcing, the surface water currents were mainly driven by the northwestward Ekman transport induced by the northeasterly wind in winter. The residual water fluxes were larger in the central area of Bohai Sea, with values of 0.2–0.3 m3/s, but were smaller in Laizhou Bay with values lower than 0.1 m3/s due to the special shoreline and topography. The low-salinity water was transported upstream to some extent. However, the majority of the low-salinity water penetrated downstream along the coast due to the geostrophic adjustment. In the bottom layer, the residual water fluxes were mainly downgradient of salinity induced by the baroclinic pressure gradient. The salinity was higher than that in the surface layer, and low-salinity water was mostly transported downstream rather than upstream. The differences between Exp 0 and Exp 1 indicated the effect of tide. Tide induced downstream residual water fluxes along the coast of the Yellow River Delta in the surface layer, but northward water fluxes in the central area of Bohai Sea in the bottom layer. The salinity differences between Exp 0 and Exp 1 were positive in the surface layer near the Yellow River mouth, especially in the north side, with values of 0–3, higher in the river mouth and decreasing offshore. This was induced by the combined effect of vertical mixing and more freshwater transported downstream due to tidal forcing. As a result, the salinity differences were negative in Laizhou Bay and extended northeast along the coast in both surface and bottom layers due to the shallow depth in Laizhou Bay (Figure 9).
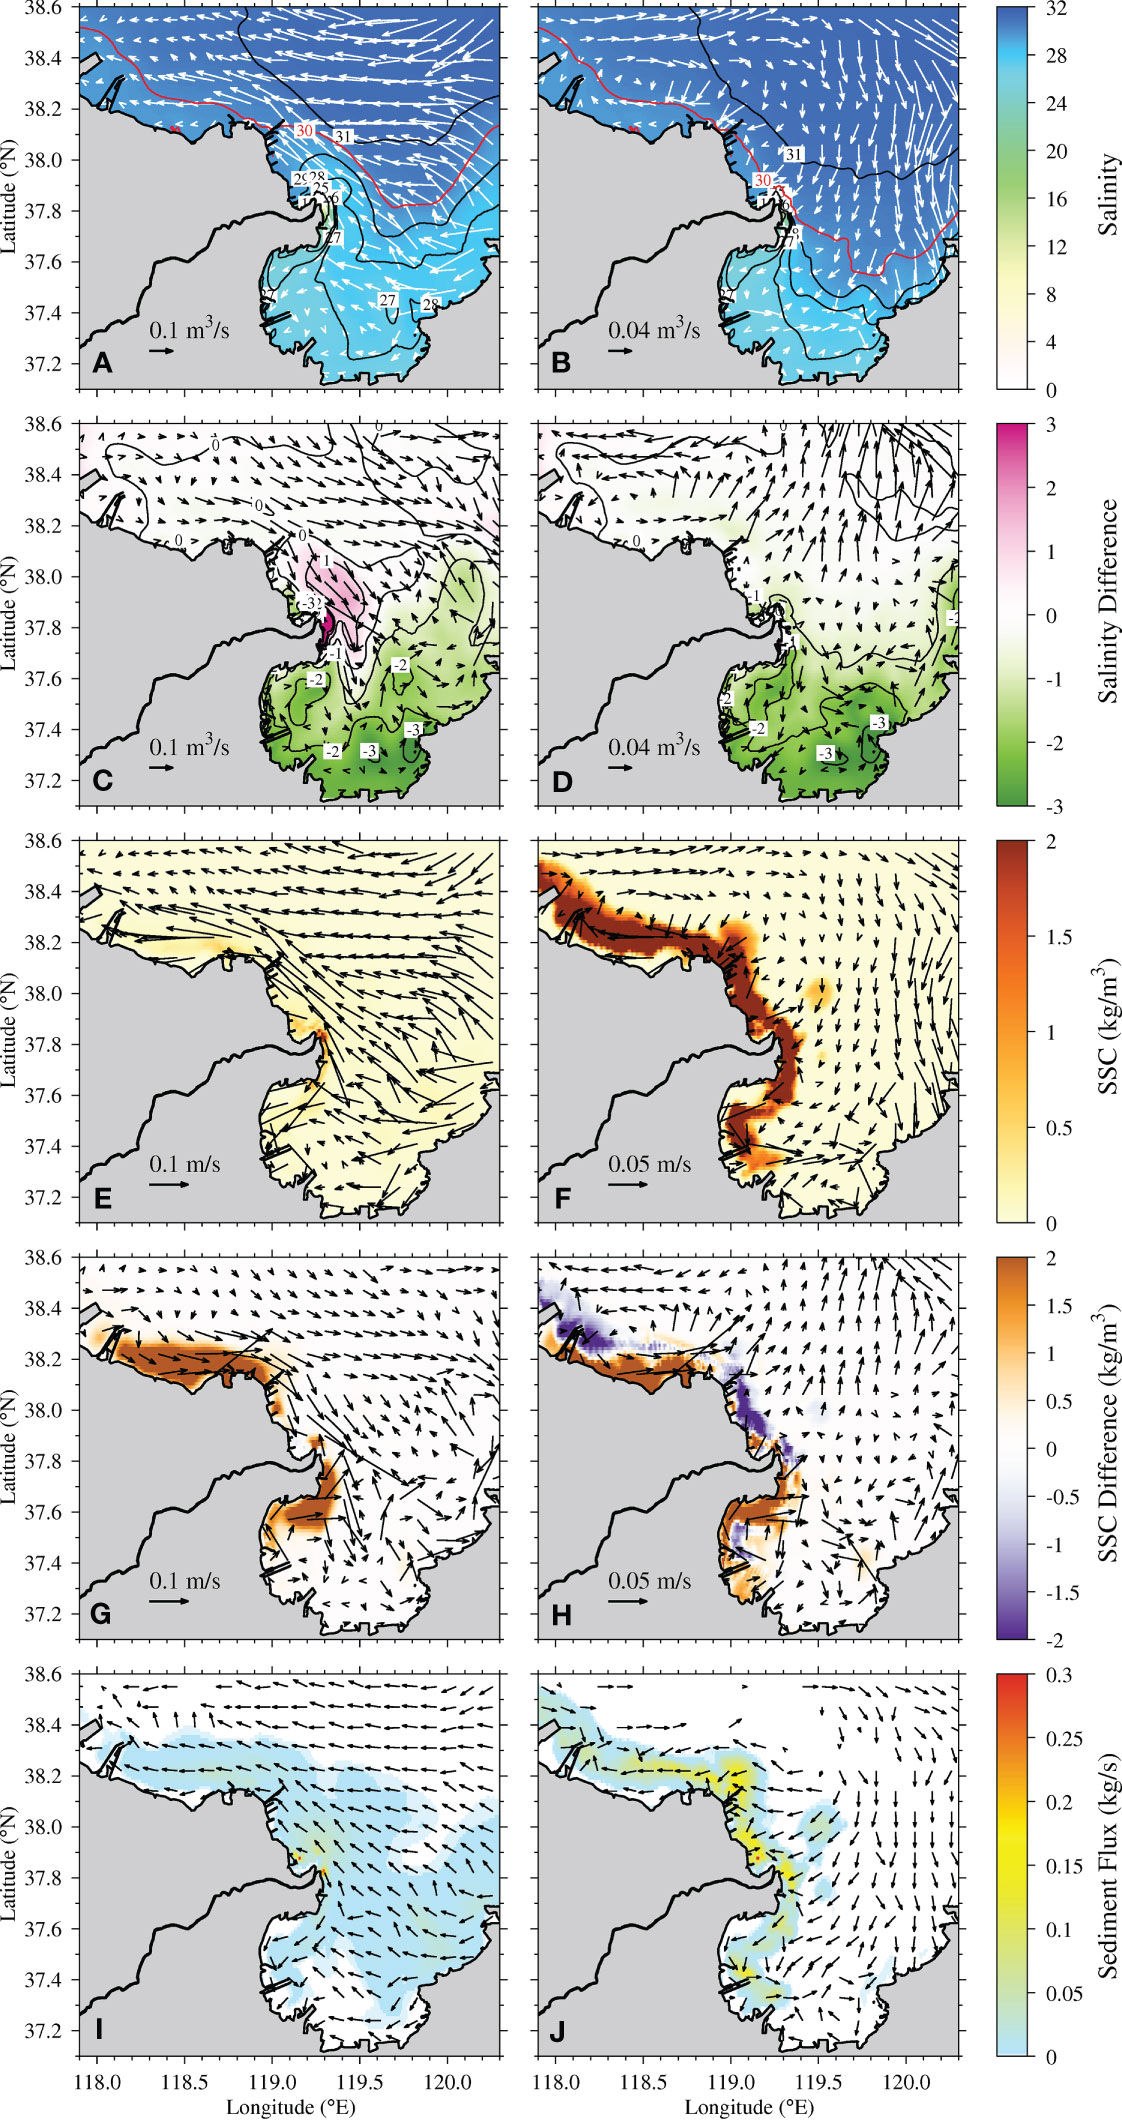
Figure 9 Distributions of residual unit width water flux and salinity (A, B), residual water velocity and suspended sediment concentration (SSC) (E, F), and residual unit width sediment flux (I, J) in Exp 1 and differences in residual unit width water flux and salinity (C, D) and residual water velocity and SSC (G, H) of Exp 0 (control run) − Exp 1 (without tide) at the surface (left panel) and bottom (right panel) layers during spring tide in December 2012. Arrows only signify direction, while color signifies the value of residual sediment flux in (I) and (J).
Without tidal forcing, the SSC decreased a lot in the surface layer, especially in the south of Bohai Bay and downstream of the Yellow River mouth (Figure 9G). The maximum SSC in the surface layer was approximately 1.5 kg/m3 in the river mouth. In other areas along the Yellow River Delta with suspended sediments in the surface layer, the SSCs were approximately 0–1 kg/m3. The bottom shear stress induced by wave remained unchanged, whereas the bottom shear stress induced by tide decreased approximately 0–0.5 N/m2 in the south side of the Yellow River mouth, the east head of Laizhou Bay, and the south of Bohai Bay (Figure 10). The bottom shear stress induced by tide was lower than 0.2 N/m2. As a result, the total bottom shear stress was 0–1 N/m2 along the Yellow River Delta, mainly induced by wave. The lower bottom shear stress resuspended less sediment above the bed. In the bottom layer, the SSCs were higher than 2 kg/m3 along the Yellow River Delta. There was an interesting phenomenon along the Yellow River Delta. Compared with Exp 0, the bottom SSCs decreased in the nearshore region, but increased in the offshore region. This was because stratification hindered the upward diffusion of the bottom suspended sediment due to the lack of tidal mixing. As a result, most of the sediments can only be advected in the horizontal direction. Due to the less decreased bottom shear stress in the north of the Yellow River mouth, nearly the same amount of sediments was resuspended compared with Exp 0. Therefore, the increase in the bottom SSC was more significant. On the other hand, the bottom shear stress decreased a lot in the south of the river mouth, resulting in a large-scale SSC decrease and a localized SSC increase in the bottom layer. The sediments in the surface layer were transported upstream with fluxes of 0.05–0.1 kg/s and downstream with fluxes lower than 0.05 kg/s from the Yellow River mouth. The surface sediment fluxes in the south of Bohai Bay were westward, with fluxes of 0–0.05 kg/s. In the bottom layer, the sediments were transported onshore in the north side of the Yellow River mouth, downstream in the northwest of Laizhou Bay, and westward in the south of Bohai Bay. More sediments were transported upstream without than with tidal forcing.
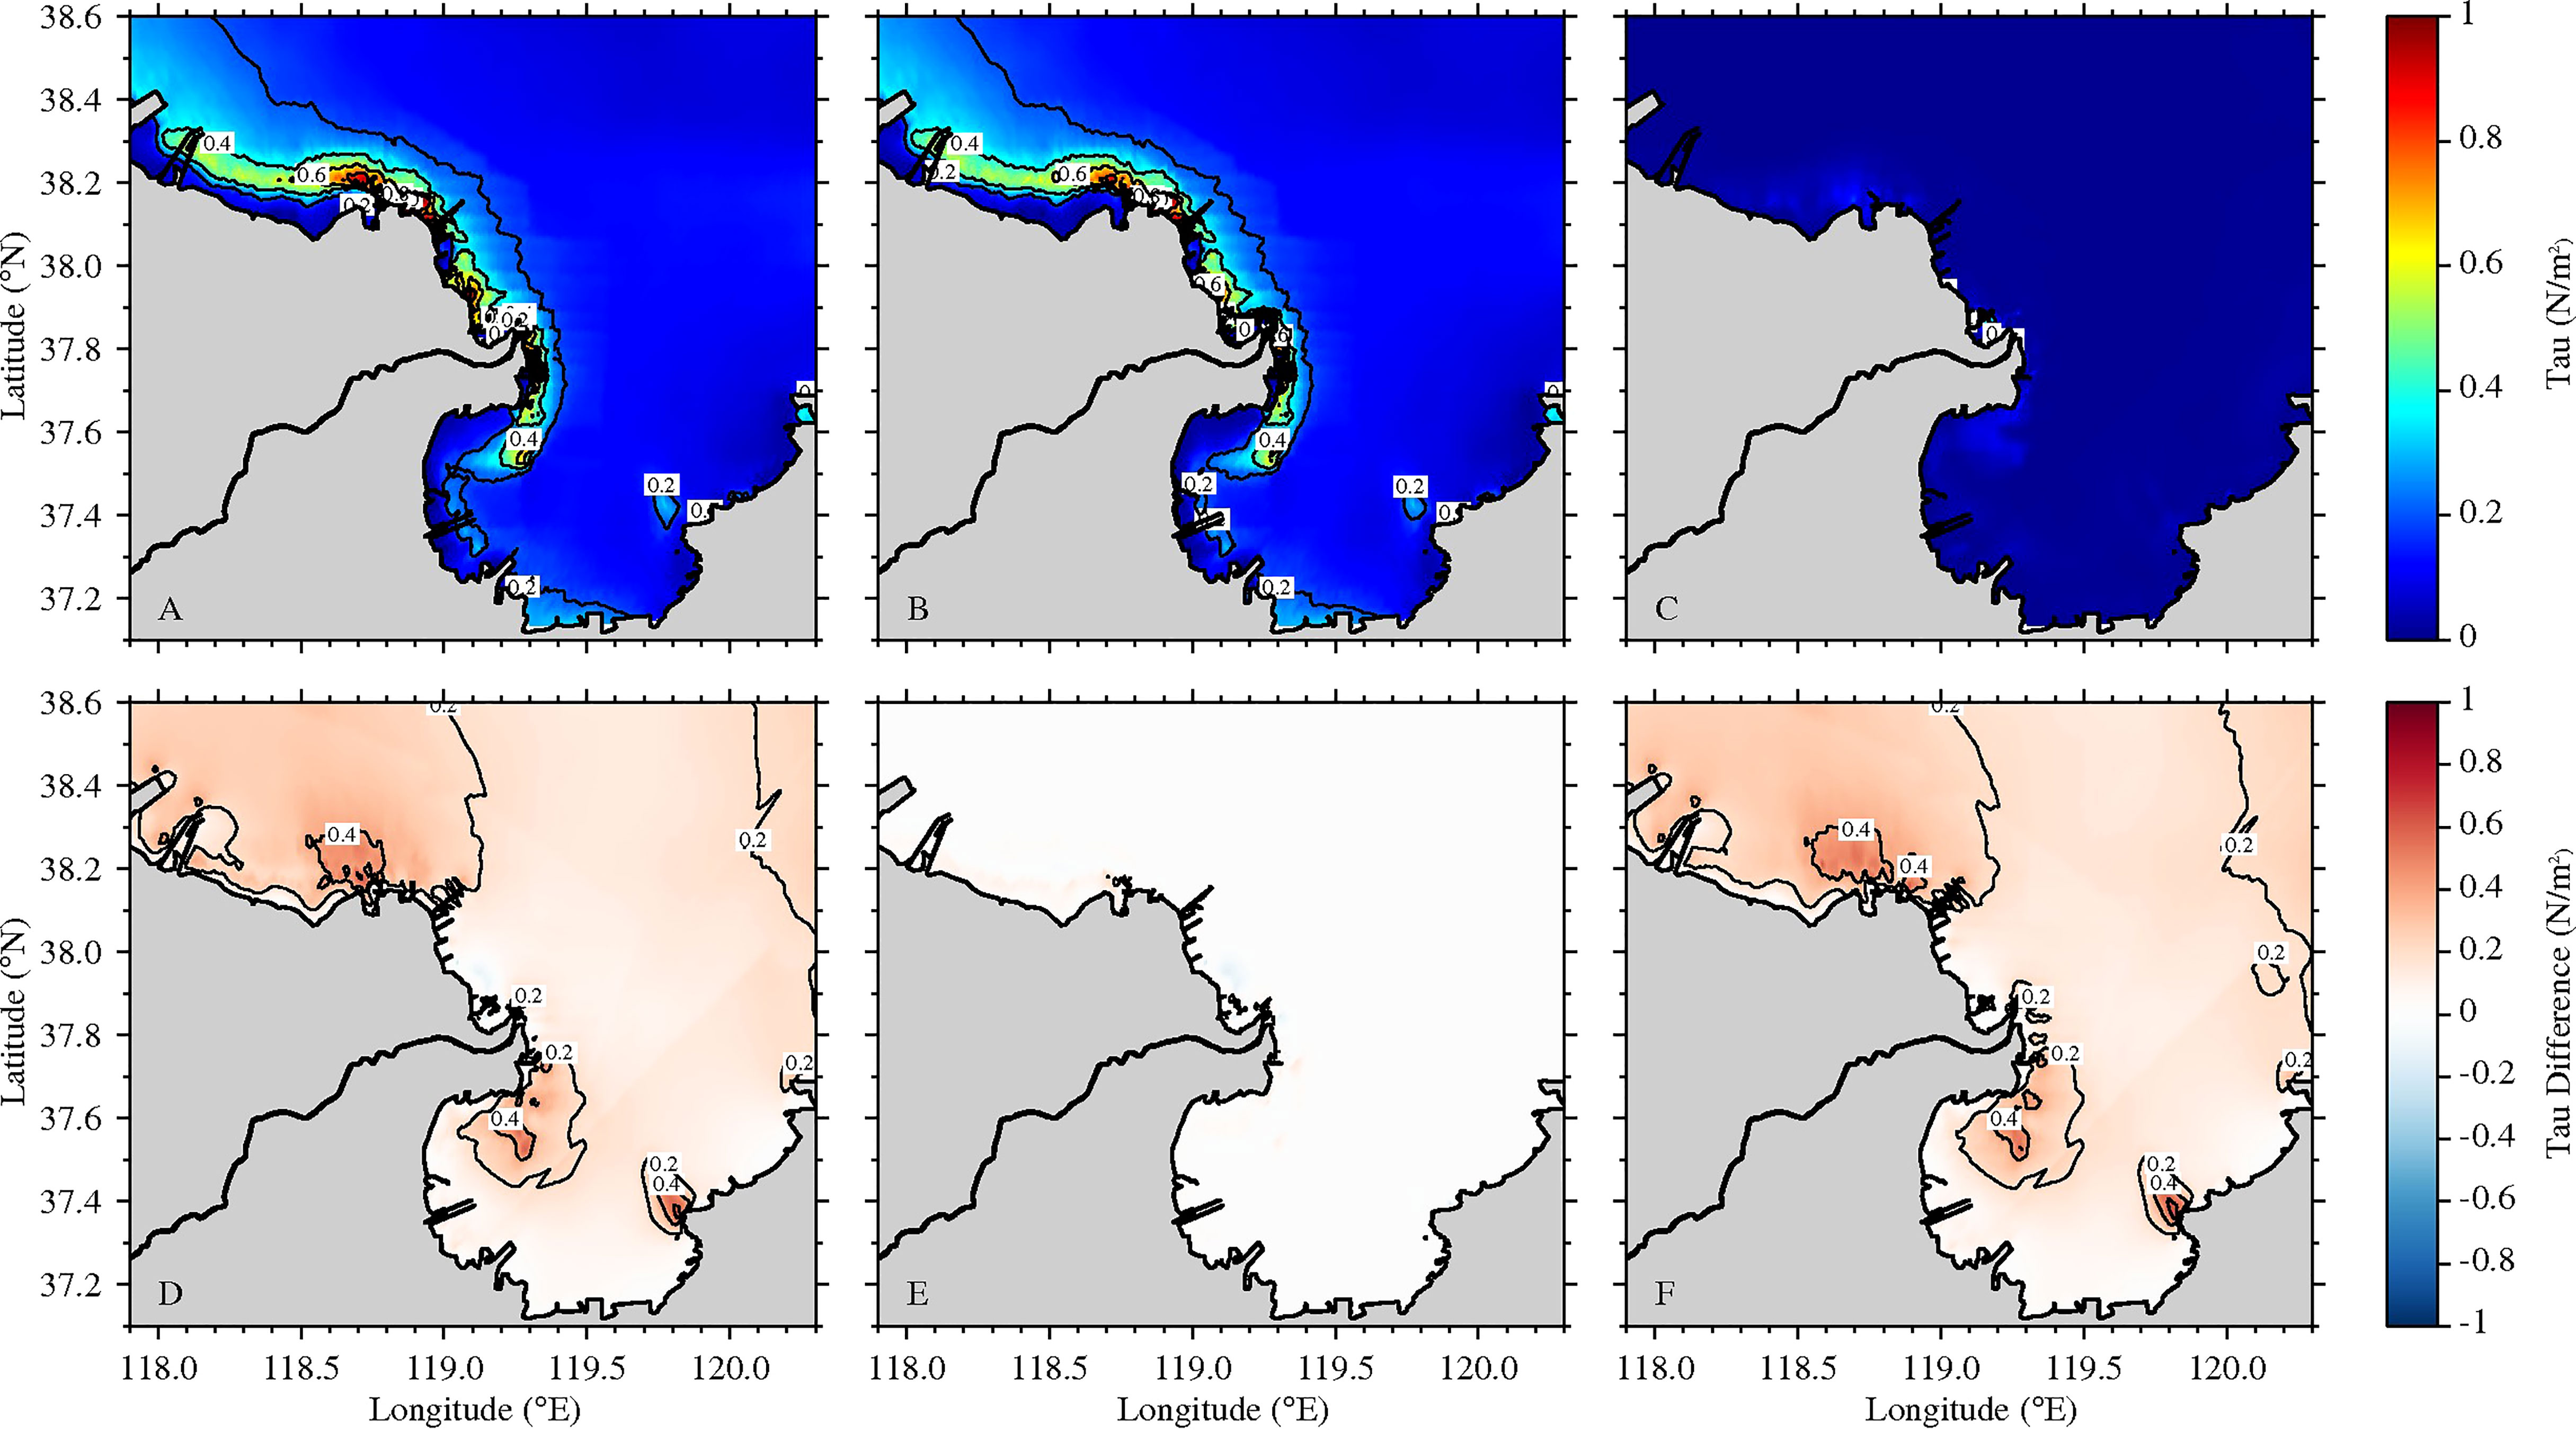
Figure 10 Distributions of total bottom shear stress (A), bottom shear stress induced by wave (B), and bottom shear stress induced by tide (C) in Exp 1 and differences in total bottom shear stress (D), bottom shear stress induced by wave (E), and bottom shear stress induced by tide (F) of Exp 0 (control run) − Exp 1 (without tide) during spring tide in December 2012.
The residual water from the Yellow River mouth flowed downstream across Sec 1 in the upper layer within 7 km away from the coast, with velocities of approximately 0–8 m/s (Figure 11). Over 7 km, the residual water was transported upstream in the upper layer and downstream in the lower layer. The surface along-section currents were shoreward, with velocities of 5–8 m/s driven by the northwestward Ekman transport induced by the northeasterly wind. The bottom currents flowed onshore along Sec 1 driven by the baroclinic gradient force. The low-salinity water was transported downstream to Sec 1, forming a salinity variance of 17–31. The water column was well mixed in the surface layer due to the wave mixing and was stratified in the middle and bottom layers due to the lack of tidal mixing. The differences between Exp 0 and Exp 1 indicated the effect of tide. Tidal forcing induced more residual water transported downstream across Sec 1 within 28 km away from the coast. As a result, the salinity of Exp 0 in most areas along Sec 1, especially in the bottom layer, was lower than that of Exp 1. However, in the upper layer, the salinity of Exp 0 with tidal forcing was higher than that of Exp 1 without tidal forcing. This was caused by the mixing of bottom saline water with surface freshwater induced by tidal mixing. The salinity differences between Exp 0 and Exp 1 were approximately 0–4 in the upper layer within 26 km and from −2 to 0 in the bottom layer along Sec 1.
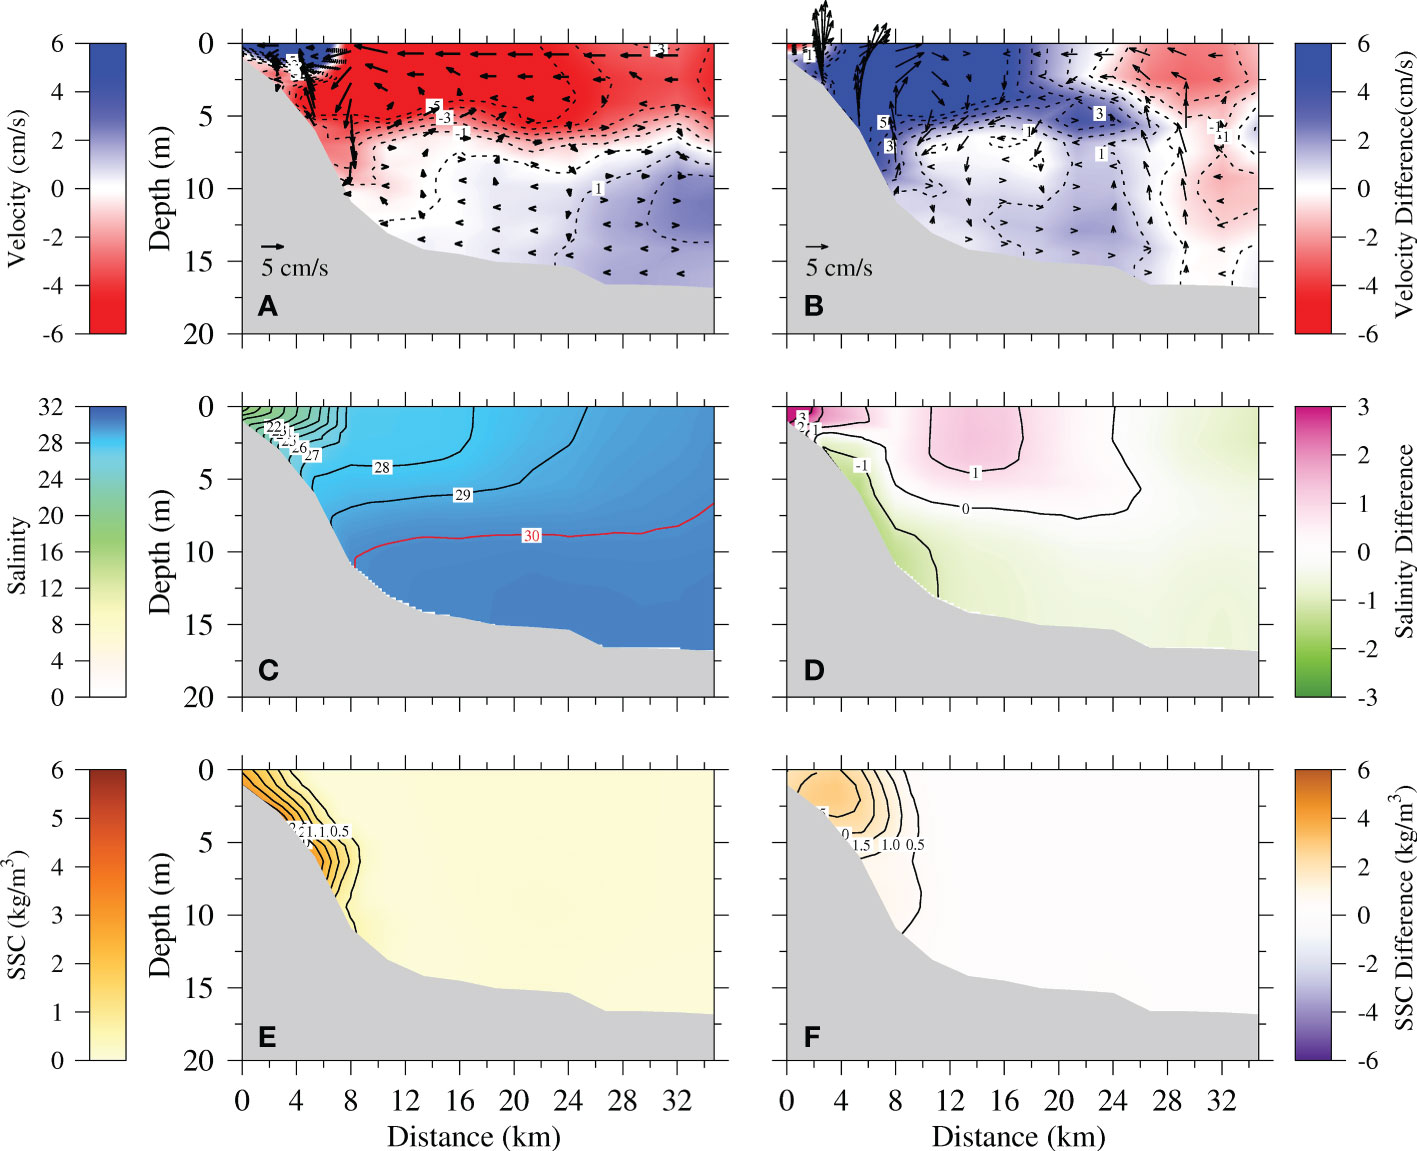
Figure 11 Vertical profile distributions of residual velocity (A), salinity (C), and suspended sediment concentration (SSC) (E) in Exp 1 and differences in the residual velocity (B), salinity (D), and SSC (F) in Exp 0 (control run) − Exp 1 (without tide) along Sec 1 during spring tide in December 2012. Arrows in (A, B) signify current vectors along the section, while the contours signify the current velocities perpendicular to the section (positive values indicate downstream current).
The SSCs along Sec 1 were approximately 0–3 kg/m3 within 10 km away from the coast, with higher values in the bottom and declining upward. Due to the decrease of the bottom shear stress induced by tide, the SSCs of Exp 1 were reduced approximately 0–2.5 kg/m3 compared with those of Exp 0. The reduction of SSC was highest in the middle layer at about 3 km away from the coast as a result of the lack of tidal mixing and the tide-induced sediment resuspension.
4.2 The effect of waves on the transport of water flow and sediments
Exp 2 considered the effect of tide and excluded wave forcing. The residual water velocities and fluxes were similar to those of Exp 0. Except for the central area of Bohai Sea, where wave induced a northwestward transport in the surface layer, carrying more low-salinity water from the coast to the sea. As a result, the salinity of Exp 0 was approximately 0–1 lower than that of Exp 2. The salinity differences between Exp 0 and Exp 2 were higher than 3 near the Yellow River mouth in the whole water column due to the mixing of surface freshwater with the bottom saline water induced by wave. As a result, more freshwater extended upstream and downstream, resulting in the lower salinity in the northwest side of the Yellow River mouth and in the center and northeast of Laizhou Bay (Figure 12).
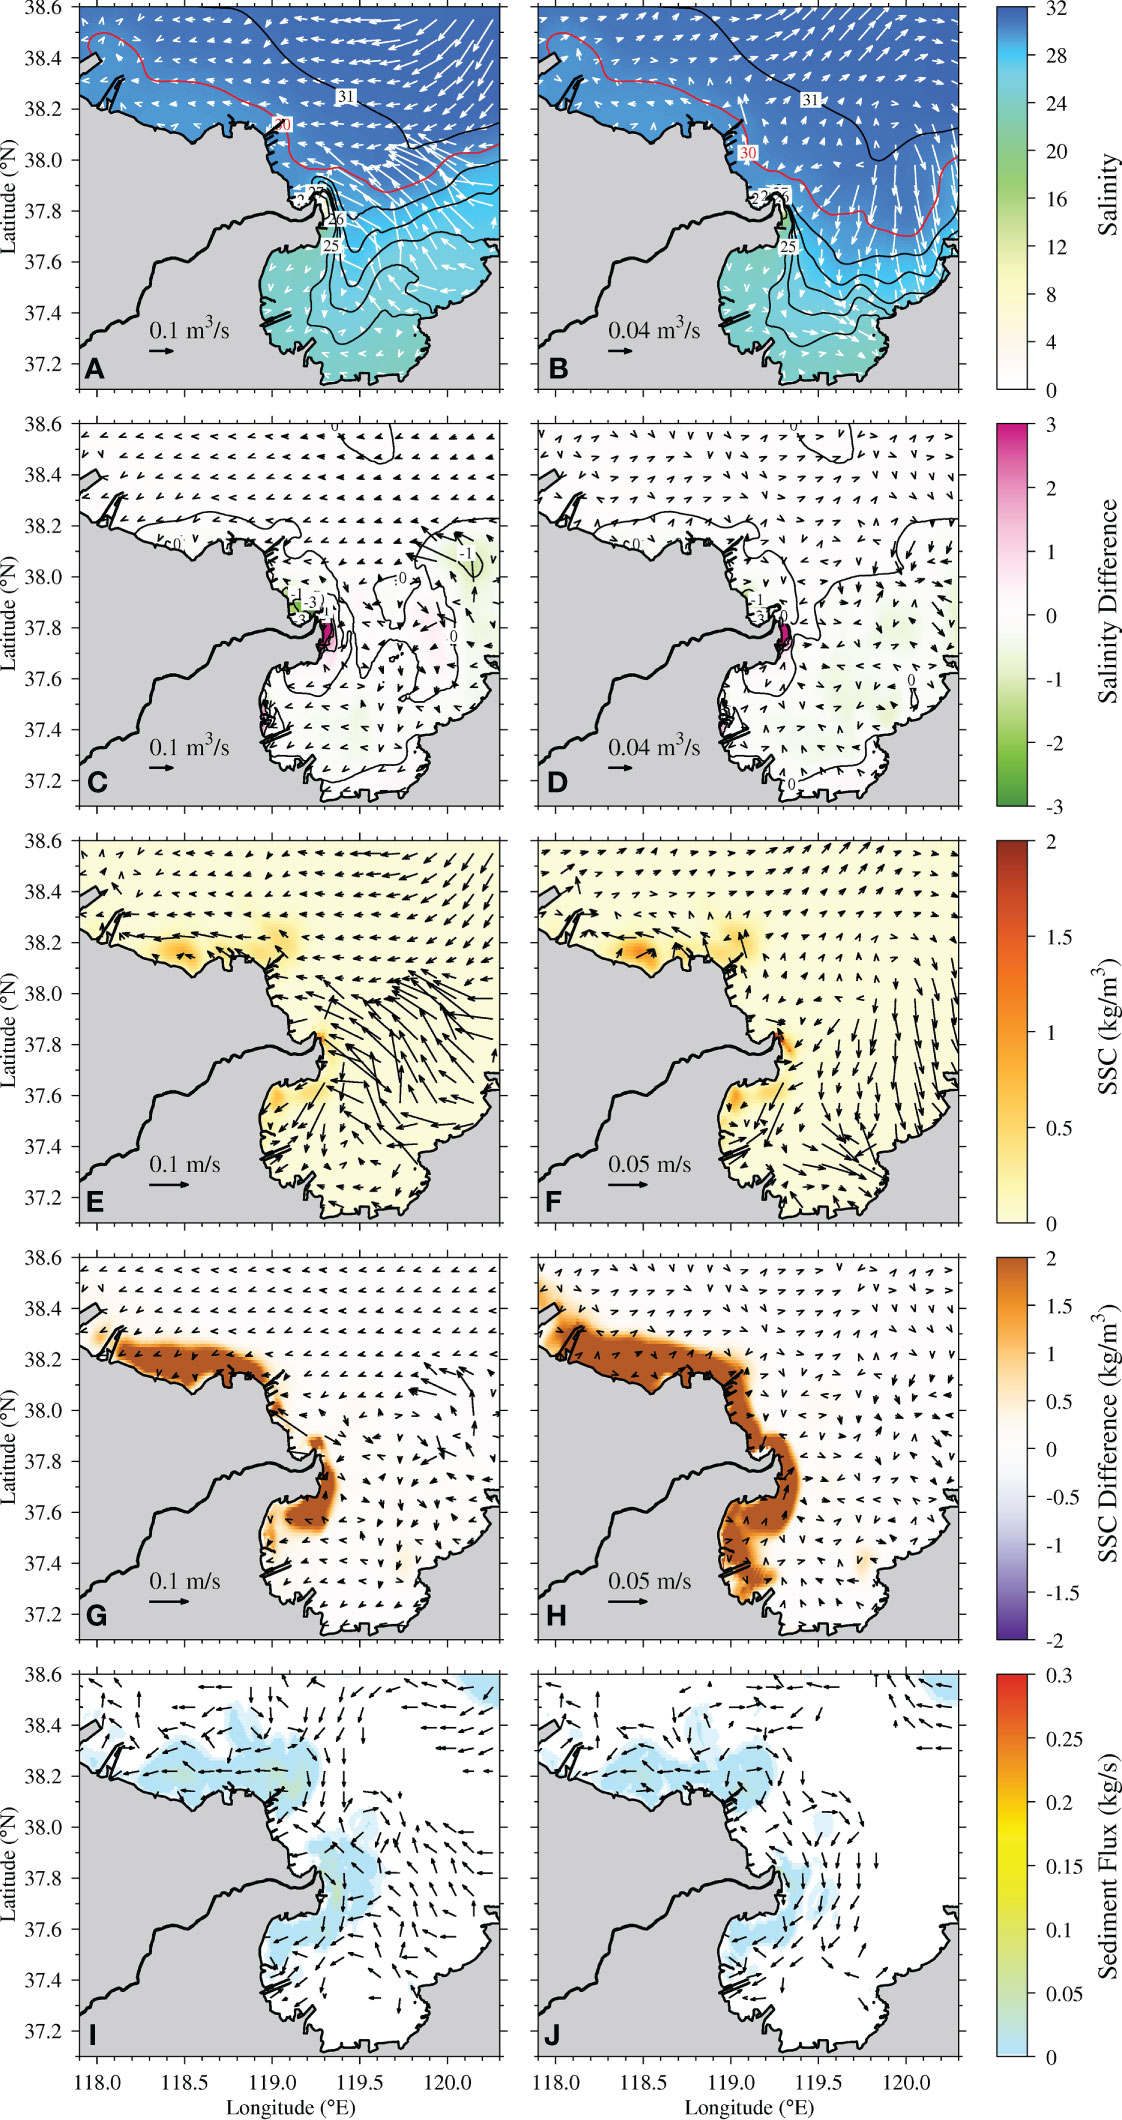
Figure 12 Distributions of residual unit width water flux and salinity (A, B), residual water velocity and suspended sediment concentration (SSC) (E, F), and residual unit width sediment flux (I, J) in Exp 2 and differences in residual unit width water flux and salinity (C, D) and residual water velocity and SSC (G, H) of Exp 0 (control run) − Exp 2 (without wave) at the surface (left panel) and bottom (right panel) layers during spring tide in December 2012. Arrows only signify direction, while color signifies the value of residual sediment flux in (I) and (J).
Without wave forcing, the bottom shear stress induced by wave was zero (Figure 13). The reduction of the bottom shear stress was approximately 0–1 N/m2 along the Yellow River Delta. The maximum total bottom shear stress was approximately 0.2 N/m2 near the Yellow River mouth and on the downstream side, while it was approximately 0.4 N/m2 in the south of Bohai Bay. The bottom shear stress induced by tide also decreased approximately 0–0.2 in the south of Bohai Bay, from the Yellow River mouth downstream to the north of Laizhou Bay, and in the east head of Laizhou Bay as a result of the change of the bottom water current. The weaker bottom shear stress resuspended less sediment above the bed. The bottom SSCs decreased more than 2 kg/m3 along the Yellow River Delta, while the surface SSCs decreased approximately 2 kg/m3 from the Yellow River mouth downstream to the north of Laizhou Bay and in the south of Bohai Bay (Figures 12G, H). As a result, the suspended sediments were mostly in the south of Bohai Bay and from the Yellow River mouth downstream to the north of Laizhou Bay, with values of 0–1.5 kg/m3. The surface SSC was slightly lower than the bottom SSC due to the tidal mixing enhancing the upward diffusion of the bottom suspended sediments. The reduction of the bottom shear stress in Exp 2 was several orders higher than that in Exp 1, indicating that the influence of waves in winter was stronger than that of tides.
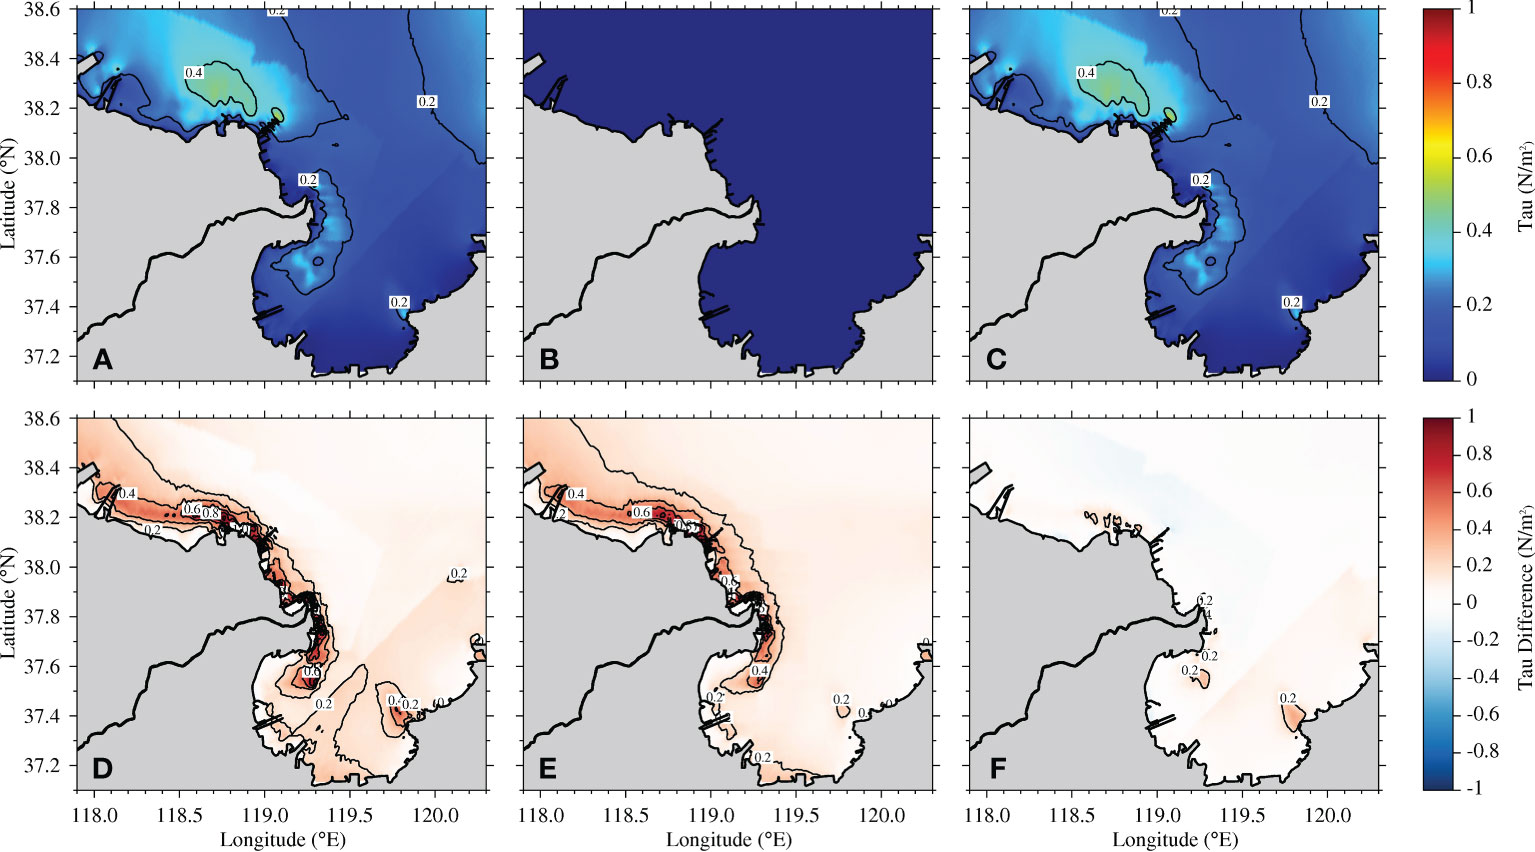
Figure 13 Distributions of the total bottom shear stress (A), bottom shear stress induced by wave (B), and bottom shear stress induced by tide (C) in Exp 2 and differences in total bottom shear stress (D), bottom shear stress induced by wave (E), and bottom shear stress induced by tide (F) in Exp 0 (control run) − Exp 2 (without wave) during spring tide in December 2012.
The SSCs were low, resulting in the weak sediment transport along the Yellow River Delta. The sediments from the Yellow River mouth were transported downstream into Laizhou Bay, with the largest fluxes of 0.05 and 0.02 kg/s in the surface and bottom layers, respectively. In the south of Bohai Bay, the sediment fluxes were westward, with the largest values of 0.06 and 0.03 kg/s in the surface and bottom layers, respectively. Unlike Exp 1, the sediment fluxes in the surface layer were larger than those in the bottom layer because the surface SSCs were similar to the bottom SSCs and the surface water transport was stronger than the bottom layer.
Without tidal forcing, the sediment transport of Exp 1 was weaker than that of Exp 0, which included tidal forcing. The sediment transport converged in the Yellow River mouth due to the river sediment deposition. Part of the river sediments was transported downstream and settled north of Laizhou Bay, forming a divergence area in the south side of the river mouth and a convergence area in Laizhou Bay (Figure 14A). The downstream sediment transport weakened and the upstream sediment transport strengthened without tidal forcing compared with Exp 0. Therefore, the sediment converged in the north side of the river mouth with fluxes of 0.1 g m−2 s−1. In the south of Bohai Bay, the coastal sediments were transported seaward and the marine sediments transported landward. As a result, the sediment transport showed a divergence–convergence–divergence pattern, with fluxes of 0–0.05 g m−2 s−1 from the coast to the sea. When tidal forcing was considered and wave forcing was excluded, the bottom shear stress decreased a lot and less sediment was suspended. As a result, the sediment transport weakened, except for the river sediment deposition in the Yellow River mouth (Figure 14B). In other areas along the Yellow River Delta, the sediment fluxes were lower than 0.06 g m−2 s−1.
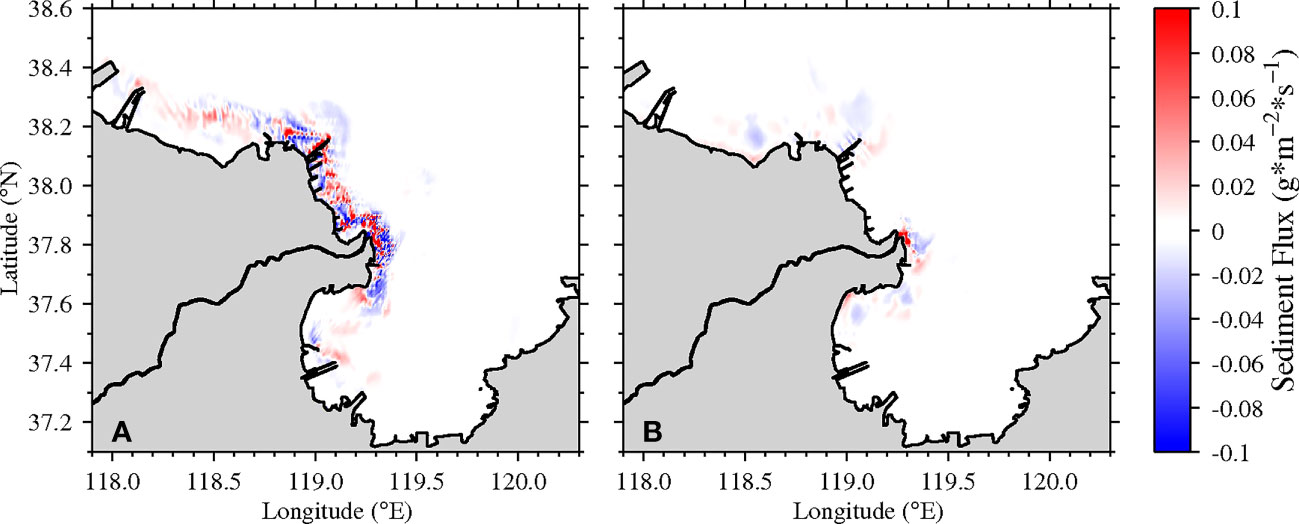
Figure 14 Distributions of sediment convergence and divergence during spring tide in December 2012 in Exp 1 (A) and Exp 2 (B) (positive value and red color indicate convergence, while negative value and blue color indicate divergence).
The wave induced a downstream transport of surface water within 5 km away from the coast and an upstream transport between 5 and 10 km across Sec 1 (Figure 15). Without wave forcing, the water column was well mixed in the near-shore region and stratified in the offshore area. The salinity within 8 km away from the coast was lower than that in Exp 0 with wave forcing, meaning that the surface freshwater was mixed with the bottom saline water due to the wave mixing. The water column of Sec 1 in Exp 2 was vertically more mixed than that in Exp 1, indicating that tidal mixing was stronger than wave mixing (Figure 15C). Due to the weak bottom shear stress in the absence of wave forcing, the SSCs in Sec 1 decreased approximately 5 kg/m3 in the nearshore bottom. In the bottom layer, the maximum residual SSC in Sec 1 was higher than 0.5 kg/m3 and lower than 1 kg/m3 between 2 and 7 km away from the coast (Figure 15E).
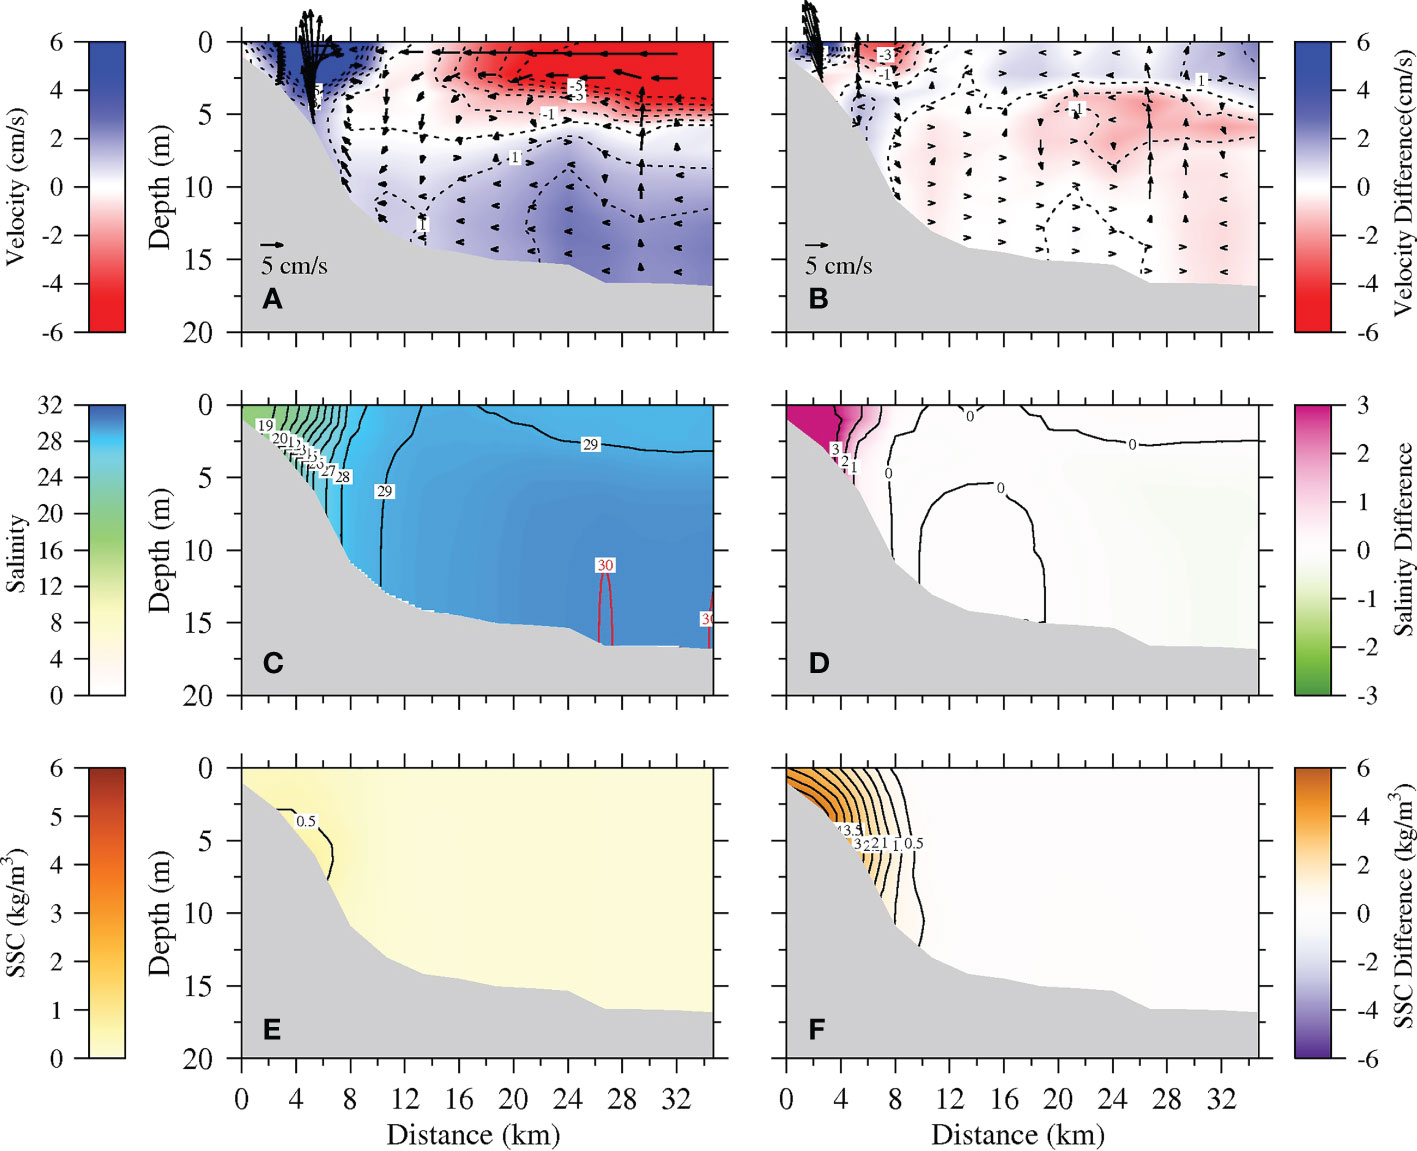
Figure 15 Vertical profile distributions of residual velocity (A), salinity (C), and suspended sediment concentration (SSC) (E) in Exp 2 and differences in residual velocity (B), salinity (D), and SSC (F) in Exp 0 (control run) − Exp 2 (without wave) along Sec 1 during spring tide in December 2012. Arrows in (A, B) signify current vectors along section, while the contours signify the current velocities perpendicular to the section (positive values indicate downstream current).
The water, salt, and sediment fluxes across Sec 1 in Exp 0, Exp 1, and Exp 2 were mainly in the downstream direction, especially in the beginning and at the end of December 2012 (Figure 8). The water and salt transport patterns with and without wave were similar. However, tidal forcing played an important role in changing the water and salt fluxes. In Exp 1, the water and salt fluxes across Sec 1 increased due to the stratification in the water column without tidal mixing. During spring tide, the net water fluxes in the upstream direction increased from 1.3 × 10⁸ to 1.9 × 10⁹ m3, while the net salt fluxes increased from 5.0 × 10⁶ to 5.4 × 10⁷ kg, both rising one order of magnitude when tidal forcing was removed from the experiment (Supplementary Table S3). On the other hand, wave forcing strengthened the net upstream transport of water and salt during spring tide. Without tidal forcing, the decreased bottom shear stress resuspended less sediment, resulting in weaker sediment transport across Sec 1. The net sediment flux across Sec 1 in Exp 0 during spring tide was 1.3 × 10⁹ kg in the downstream direction. Without tidal forcing, the sediment flux decreased to 1.9 × 10⁸ kg and turned in the upstream direction. Without wave forcing, the sediment transport was weaker than that without tidal forcing due to the lower bottom shear stress. Therefore, the influence of waves on sediment transport in winter was greater than that of tides. Compared with that in Exp 0, the net sediment flux across Sec 1 in Exp 2 was in the same downstream direction and was reduced to 3.7 × 10⁸ kg during spring tide.
Waves are highly dependent on winds, which vary seasonally. In general, wind waves are stronger in winter and weaker in summer. This paper discusses the effect of waves in winter and the comparison with tides because the sediment transport and resuspension are more significant and the effect of waves is more obvious. On the other hand, the waves in summer may play a less important role in sediment transport compared to tides.
5 Conclusions
In this paper, the transport of water and sediment from the Yellow River mouth was studied and the effects of tide and wave discussed using a 3D numerical model coupled with a hydrodynamic and sediment module. The model was validated using current, salinity, measured, and remote sensing retrieval SSC data. The wave parameters simulated by the SWAN model were validated using measured significant wave height and period data.
The transport of water and sediment under the northeasterly prevailing wind in the Bohai Sea during spring tide in December 2012 was simulated. The freshwater off the Yellow River flowed downstream, carrying the river sediment and suspended sediment into Laizhou Bay. The bottom shear stress induced by wave was higher in the shallow water along the coast of the Yellow River Delta. The bottom shear stress induced by tide was higher in the north of Laizhou Bay and south of Bohai Bay due to the larger water velocities.
Tidal forcing induced more freshwater transport downstream along the coast of the Yellow River Delta. Without tidal forcing, the bottom shear stress decreased 0–0.4 N/m2 in the south of the Yellow River mouth and south of Bohai Bay, resulting in less sediment resuspension in the bottom. The stratification in the water column hindered the upward diffusion of the bottom suspended sediment due to the lack of tidal mixing. Wave forcing had little impact on the water transport. However, without wave forcing, the bottom shear stress decreased 0–1 N/m2 along the Yellow River Delta, causing less suspended sediment along the delta, which also weakened the sediment transport. Wave mixing was weaker than tidal mixing in the vertical direction. This study explained the effects of tides and waves on the transport of water and sediments off the Yellow River mouth in winter.
Sediment transport is a complicated study that involves sediment flocculation, breakup, erosion, and deposition, among others. This paper mainly concentrated on the dynamic effect of tides and waves on the movement of sediments. It is focused, but not all-inclusive. There are still a lot of aspects of sediment behaviors that are worth a thorough investigation, which are under consideration of the authors’ future works.
Data availability statement
The raw data supporting the conclusions of this article will be made available by the authors, without undue reservation.
Author contributions
XC and JZ designed the research and revised the manuscript. XC collected the remote sensing data, conducted the numerical experiments, and wrote an original draft of the manuscript. XC and JZ analyzed the results. SC collected the observed data and acquired the funding. All authors contributed to the article and approved the submitted version.
Funding
This study was supported by the National Key Research and Development Program of China (No. 2017YFC0405503), and the National Natural Science Foundation of China (NSFC) (No. U1706214).
Acknowledgments
We also acknowledge the reviewers for their valuable comments and suggestions. The sea surface wind data obtained from ECMWF are available at http://apps.ecmwf.int/datasets/. The open-ocean boundary water flux and salinity data were provided by SODA and can be found at http://iridl.ldeo.columbia.edu/SOURCES/.CARTON-GIESE/.SODA/.v2p0p2-4/. Tidal constituents were obtained from the NaoTide dataset (http://www.miz.nao.ac.jp/). The topographic data of the Bohai Sea were observational data from the Yellow River Water Commission. The remote sensing images of Landsat 8 OLI were downloaded from USGS (http://glovis.usgs.gov/).
Conflict of interest
Author XC is employed by Shanghai National Engineering Research Center of Urban Water Resources Co., Ltd.
The remaining authors declare that the research was conducted in the absence of any commercial or financial relationships that could be construed as a potential conflict of interest.
Publisher’s note
All claims expressed in this article are solely those of the authors and do not necessarily represent those of their affiliated organizations, or those of the publisher, the editors and the reviewers. Any product that may be evaluated in this article, or claim that may be made by its manufacturer, is not guaranteed or endorsed by the publisher.
Supplementary material
The Supplementary Material for this article can be found online at: https://www.frontiersin.org/articles/10.3389/fmars.2023.1181347/full#supplementary-material
References
Arakawa A., Lamb V. R. (1977). Computational design of the basic dynamical processes of the UCLA general circulation model. Gen. Circ. Models Atmosphere 17, 173–265. doi: 10.1016/B978-0-12-460817-7.50009-4
Bian C., Jiang W., Greatbatch R. J. (2013). An exploratory model study of sediment transport sources and deposits in the bohai Sea, yellow Sea, and East China Sea. J. Geophysical Res.: Oceans 118, 5908–5923. doi: 10.1002/2013JC009116
Blumberg A. F. (1994). “A primer for ECOM-si,” in Technical report of HydroQual, vol. 66. (Mahwah, New Jersey).
Blumberg A. F., Mellor G. L. (1987). “A description of a threedimensional coastal ocean circulation model,” in Coastal and estuarine science, volume 4, three-dimensional coastal ocean models. Ed. Heaps N. S. (Washington, DC: American Geophysical Union), 1–16.
Brand A., Lacy J. R., Hsu K., Hoover D., Gladding S., Stacey M. T. (2010). Wind-enhanced resuspension in the shallow waters of south San Francisco bay: mechanisms and potential implications for cohesive sediment transport. J. Geophysical Res. 115, C11024. doi: 10.1029/2010JC006172
Burchard H., Schuttelaars H. M., Ralston D. K. (2018). Sediment trapping in estuaries. Annu. Rev. Mar. Sci. 10, 371–395. doi: 10.1146/annurev-marine-010816-060535
Cao Z., Wang Y. (1994). Hydrodynamic and sediment transport numerical simulation (in Chinese) (Tianjin, China: Tianjin University Press).
Chapman D. C., Lentz S. J. (1994). Trapping of a coastal density front by the bottom boundary layer. J. Phys. Oceanography 24 (7), 1464–1479. doi: 10.1175/1520-0485(1994)024<1464:TOACDF>2.0.CO;2
Chen S. (2001). Seasonal, neap-spring variation of sediment concentration in the joint area between Yangtze estuary and hangzhou bay. Sci. China Ser. B.: Chem. 44, 57–62. doi: 10.1007/BF02884809
Chen C., Zhu J., Zheng L., Ralph E., Budd J. W. (2004). A non-orthogonal primitive equation coastal ocean circulation model: application to lake superior. J. Great Lakes Res. 30 (supp-S1), 41–54. doi: 10.1016/S0380-1330(04)70376-7
Cheng X., Zhu J., Chen S. (2021a). Dynamics of the extension of the yellow river plume in the bohai Sea. Continental Shelf Res. 222 (9), 104438. doi: 10.1016/j.csr.2021.104438
Cheng X., Zhu J., Chen S. (2021b). Extensions of the river plume under various yellow river courses into the bohai Sea at different times. Estuarine Coast. Shelf Sci. 249 (107092). doi: 10.1016/j.ecss.2020.107092
Cui B. L., Li X.-Y. (2011). Coastline change of the yellow river estuary and its response to the sediment and runoff, (1976–2005) Geomorphology 127, 1-2, 0–40. doi: 10.1016/j.geomorph.2010.12.001
Doxaran D., Froidefond J. M., Castaing P. (2002). A reflectance band ratio used to estimate suspended matter concentrations in sediment-dominated coastal waters. Int. J. Remote Sens. 23 (23), 5079–5085. doi: 10.1080/0143116021000009912
Fan H., Huang H. (2005). Changes in huanghe (Yellow) river estuary since artificial re-routing in 1996. Chin. J. Oceanol. Limnol. 23 (3), 299–305. doi: 10.1007/BF02847152
Fan H., Huang H., Zeng T. Q., Wang K. (2006). River mouth bar formation, riverbed aggradation and channel migration in the modern huanghe (Yellow) river delta, China. Geomorphology 74, 124–136. doi: 10.1016/j.geomorph.2005.08.015
Fettweis M., Sas M., Monbaliu J. (1998). Seasonal, neap-spring and tidal variation of cohesive sediment concentration in the scheldt estuary, Belgium. Estuarine Coast. Shelf Sci. 47, 21–36. doi: 10.1006/ecss.1998.0338
Geyer W. R. (1993). The importance of suppression of turbulence by stra tification on the estuarine turbidity maximum. Estuaries 16, 113–125. doi: 10.2307/1352769
Han Q. (1997). The distribution and application of sediment dry density (in Chinese). J. Sediment Res. 2, 10–16.
Huang S., Han N., Zhong X. (1980). “Analysis of siltation at mouth bar of the Yangtze river estuary,” in Proceedings of the international symposium on river sedimentation, paper C6 (Beijing, China: Chinese Society of Hydraulic Engineering).
Kong D., Miao C., Borthwick A. G. L., Duan Q., Liu H., Sun Q., et al. (2015). Evolution of the yellow river delta and its relationship with runoff and sediment load from 1983 to 2011. J. Hydrol. 520, 157–167. doi: 10.1016/j.jhydrol.2014.09.038
Li G., Tang Z., Yue S., Zhuang K., Wei H. (2001). Sedimentation in the shear front off the yellow river mouth. Continental Shelf Res. 21, 607–625. doi: 10.1016/S0278-4343(00)00097-2
Li G., Wei H., Han Y., Chen Y. (1998a). Sedimentation in the yellow river delta, part I: flow and suspended sediment structure in the upper distributary and the estuary. Mar. Geol. 149, 93–111. doi: 10.1016/S0025-3227(98)00031-0
Li G., Wei H., Yue S., Cheng Y., Han Y. (1998b). Sedimentation in the yellow river delta, part II: suspended sediment dispersal and deposition on the subaqueous delta. Mar. Geol. 149, 113–131. doi: 10.1016/S0025-3227(98)00032-2
Liang B., Li H., Lee D. (2008). Bottom shear stress under wave-current interaction. J. Hydrodynamics 20 (1), 88–95. doi: 10.1016/S1001-6058(08)60032-3
Lin J., Kuo A. Y. (2001). Secondary turbidity maximum in a partially mixed microtidal estuary. Estuaries 24, 707–720. doi: 10.2307/1352879
Liu G., Cai S. (2019). Modeling of suspended sediment by coupled wave-current model in the zhujiang (Pearl) river estuary. Acta Oceanol. Sin. 38 (7), 22–35. doi: 10.1007/s13131-019-1455-3
Liu Y., Maccready P., Hickey B. M., Dever E. P., Banas N. S. (2009). Evaluation of a coastal ocean circulation model for the Columbia river plume in summer 2004. J. Geophysical Res. Oceans. 114(C2). doi: 10.1029/2008JC004929
Long C. M., Pavelsky T. M. (2013). Remote sensing of suspended sediment concentration and hydrologic connectivity in a complex wetland environment. Remote Sens. Environ. 129, 197–209. doi: 10.1016/j.rse.2012.10.019
Luettich R. A. J., Harleman D. R. F., Somlyódy L. (1990). Dynamic behavior of suspended sediment concentrations in a shallow lake perturbed by episodic wind events. Limnol. Oceanography 35 (5), 1050–1067. doi: 10.4319/lo.1990.35.5.1050
Lv X., Yuan D., Ma X., Tao J. (2014). Wave characteristics analysis in bohai Sea based on ECMWF wind field. Ocean Eng. 91, 159–171. doi: 10.1016/j.oceaneng.2014.09.010
Maréchal D. (2004). A soil-based approach to rainfall-runoff modeling in ungauged catchments for England and Wales (PhD thesis) (Cranfield, UK: Cranfield University).
Martin J. M., Zhang J., Shi M. C., Zhou Q. (1993). Actual flux of the huanghe (Yellow river) sediment to the western pacific ocean. J. Sea Res. 31 (93), 243–254. doi: 10.1016/0077-7579(93)90025-N
Mehta A. J., McAnally W. H. (2008). “Fine grained sediment transport,” in Sedimentation engineering: processes, management, modeling, and practice, 253–307.
Mellor G. L., Yamada T. (1974). A hierarchy of turbulence closure models for planetary boundary layers. J. Atmospheric Sci. 31 (7), 1791–1806. doi: 10.1175/1520-0469(1974)031<1791:AHOTCM>2.0.CO;2
Mellor G. L., Yamada T. (1982). Development of a turbulence closure model for geophysical fluid problems. Rev. Geophysics Space Phys. 20 (4), 851–875. doi: 10.1029/RG020i004p00851
Murphy A. H. (1988). Skill scores based on the mean square error and their relationships to the correlation coefficient Monthly Weather Review 116, 12, 990–991. doi: 10.1175/1520-0493(1988)116<2417:SSBOTM>2.0.CO;2
Pang J. Z., Si S. H. (1979). Evolution of the yellow river mouth: i. historical shifts. Oceanol. Et. Limnol. Sin. 10 (2), 136–141.
Qin Y. S., Li F. (1983). “Study of influence of sediment loads discharged from huanghe river on sedimentation in bohai Sea and huanghai Sea,” in International symposium on sedimentation on the continental shelf, with special reference to East China Sea (Hangzhou, China).
Ralston D. K., Geyer W. R., Lerczak J. A. (2010). Structure, variability, and salt flux in a strongly forced salt wedge estuary. J. Geophysical Res. Atmospheres 115 (C6). doi: 10.1029/2009JC005806
Sanford L. P. (1994). Wave-forced resuspension of upper Chesapeake bay muds. Estuaries Coasts 17 (1), 148–165. doi: 10.2307/1352564
Scully M. E., Friedrichs C. T. (2003). The influence of asymmetries in overlying stratification on near-bed turbulence and sediment suspension in a partially-mixed estuary. Ocean Dynamics 53, 208–218. doi: 10.1007/s10236-003-0034-y
Scully M. E., Friedrichs C. T. (2007). Sediment pumping by tidal asymmetry in a partially mixed estuary. J. Geophysical Res. 112, C07028. doi: 10.1029/2006JC003784
Shi W. (2008). 3D numerical simulation and analysis of the transportation of suspended sediment in the huanghe estuary, Ph.D. thesis (Shandong, China: Ocean University of China).
Signell R. P., Beardsley R. C., Graber H. C., Capotondi A. (1990). Effect of wave-current interaction on wind-driven circulation in narrow, shallow embayments. J. Geophysical Res. 95, 9671–9678. doi: 10.1029/JC095iC06p09671
Simpson J. H., Brown J., Matthews J., Allen G. (1990). Tidal straining, density currents, and stirring in the control of estuarine stratification. Estuaries 13, 125–132. doi: 10.2307/1351581
Smagorinsky J. (1963). General circulation experiments with the primitive equations: i. the basic experiment. Monthly Weather Rev. 91 (3), 99–164. doi: 10.1175/1520-0493(1963)091<0099:GCEWTP>2.3.CO;2
Sun X. (2013). The impact of wave on the sediment erosion and deposition near the yellow river mouth (Qingdao: Ocean University of China).
Traykovski P., Geyer W. R., Sommerfield C. (2004). Rapid sediment deposition and fine-scale strata formation in the Hudson estuary. J. Geophysical Res. 109, F02004. doi: 10.1029/2003JF000096
van Leussen W. (1988). “Aggregation of particles, settling velocity of mud flocs: a review,” in Physical processes in estuaries. Eds. Dronkers J., van Leussen W. (Springer-Verlag) 347, 403.
Wang K. (2003). Study on yellow river estuary sediment transport and it's distributing regulation, master thesis (Xi'an, China: Xi'an University of Technology).
Wang N. (2014). Sedimentary dynamics process and topographic evolution in the modern yellow river mouth (Shandong: Ocean University of China).
Wang H., Yang Z., Li Y., Guo Z., Sun X., Wang Y. (2007). Dispersal pattern of suspended sediment in the shear frontal zone off the huanghe (Yellow river) mouth. Continental Shelf Res. 27, 854–871. doi: 10.1016/j.csr.2006.12.002
Wolanski E., King B. A., Galloway D. (1995). Dynamics of the turbidity maximum in the fly river estuary, Papua new Guinea. Estuarine Coast. Shelf Sci. 40 (3), 321–337. doi: 10.1016/S0272-7714(05)80013-7
Wu T., Wu H. (2018). Tidal mixing sustains a bottom-trapped river plume and buoyant coastal current on an energetic continental shelf. J. Geophysical Res.: Oceans 123 (11), 8026–8051. doi: 10.1029/2018JC014105
Wu H., Zhu J. (2010). Advection scheme with 3rd high-order spatial interpolation at the middle temporal level and its application to saltwater intrusion in the changjiang estuary. Ocean Model. 33 (1-2), 33–51. doi: 10.1016/j.ocemod.2009.12.001
Yu Y., Wang H., Shi X., Ran X., Cui T., Qiao S., et al. (2013). New discharge regime of the huanghe (Yellow river): causes and implications. Continental Shelf Res. 69, 62–72. doi: 10.1016/j.csr.2013.09.013
Zhan C., Yu J., Wang Q., Li Y., Zhou D., Xing Q., et al. (2017). Remote sensing retrieval of surface suspended sediment concentration in the yellow river estuary. Chin. Geographical Sci. 27 (6), 934–947. doi: 10.1007/s11769-017-0921-7
Keywords: water and sediment transport, suspended sediment, bottom shear stress, tide, wave
Citation: Cheng X, Zhu J and Chen S (2023) Dynamic response of water flow and sediment transport off the Yellow River mouth to tides and waves in winter. Front. Mar. Sci. 10:1181347. doi: 10.3389/fmars.2023.1181347
Received: 07 March 2023; Accepted: 17 April 2023;
Published: 09 May 2023.
Edited by:
Zeng Zhou, Hohai University, ChinaCopyright © 2023 Cheng, Zhu and Chen. This is an open-access article distributed under the terms of the Creative Commons Attribution License (CC BY). The use, distribution or reproduction in other forums is permitted, provided the original author(s) and the copyright owner(s) are credited and that the original publication in this journal is cited, in accordance with accepted academic practice. No use, distribution or reproduction is permitted which does not comply with these terms.
*Correspondence: Jianrong Zhu, jrzhu@sklec.ecnu.edu.cn