Sandy shoreline recovery ability after breakwater removal
 Shanhang Chi
 Chi Zhang
 Jinhai Zheng
- 1State Key Laboratory of Hydrology-Water Resources and Hydraulic Engineering, Hohai University, Nanjing, China
- 2College of Harbour, Coastal and Offshore Engineering, Hohai University, Nanjing, China
- 3Key Laboratory of Ministry of Education for Coastal Disaster and Protection, Hohai University, Nanjing, China
The removal of coastal structures has emerged as an increasingly considered alternative nature-based solution to sandy coastal erosion due to unsuited structure construction. However, its effectiveness remains uncertain because the ability of natural beach recovery is unclear due to little understanding of shoreline response to the structure removal. In this study, we use a recently developed numerical model to explore the sandy shoreline recovery ability after the removal of an attached breakwater. Both recovery duration and recovery ratio are analyzed concerning various breakwater configurations and environmental settings in a simplified and generalized framework. We find that the sandy shoreline has the ability to naturally recover after breakwater removal but with different recovery durations (years to centuries) and recovery ratios (full to partial). A higher shoreline recovery ability (i.e., shorter duration and larger ratio) is related to shorter effective breakwater length, downdrift inclined breakwater direction, lower angle of wave incidence, and greater longshore sediment transport rate. We reveal that the behavior of sand spit evolution, including the extension and split of the sand spit, is the dominant mechanism for distinct shoreline recovery processes. Two simple formulas are finally proposed to preliminarily estimate shoreline recovery ability for practical purposes. The results of the present study provide new insights into coastal morphological resilience to engineering interventions.
1 Introduction
Coastal regions are distinctive places for the human population to live because of their abundant resources. Approximately 40% of the world’s population lives within 100 km of the coastline and the trends of coastward urbanization and population growth will continue in the future (WRI, 2000). To protect facilities and properties under the increasing threat of coastal disasters due to climate change and human interventions, or to meet the demands of economic development, maritime transportation, resource utilization, and recreational activities, a mass of coastal structures, including seawalls, breakwaters, inlet jetties, wharves, and artificial islands, have been built along the coastline. For example, over 60% of the coastline along the Chinese mainland has been covered by seawalls, which is called the new “Great Wall” of China (Ma et al., 2014). Approximately 14% of the continental US shoreline is armored and the rate is predicted to double by 2100 (Gittman et al., 2015). A high and increasing proportion of armored shorelines is also present in some large urban centers (Davis et al., 2002; Dugan et al., 2008; Patrick et al., 2016).
A high proportion of artificial coastlines has already been considered an important factor affecting coastal erosion vulnerability (Cai et al., 2022). Adverse impacts posed by these hard structures have been recognized. Specifically for sandy coastlines, the erosion of adjacent beaches is of great concern, which may threaten coastal properties and lead to the loss of natural landscapes. After the construction of the harbor structures at Nouakchott, Mauritania, a downdrift beach erosion rate of 20 m/yr was observed, which was 10 times larger than the value in its natural state (Luijendijk et al., 2018). A more than 4 km long shoreline is retreating in response to a mega offshore artificial island (Liu et al., 2022). Disturbances in longshore sediment transport patterns caused by an inlet jetty, a breakwater, and an artificial island led to the rapid degradation of a pair of sand spits at the Fudu River mouth (Chi et al., 2023).
Coastal managers and scientists are seeking more nature-based solutions to the adverse impacts of hard structures. Beach replenishment, including beach, dune, and shoreface nourishments (e.g., Hanson et al., 2002; de Schipper et al., 2016; Li et al., 2022; Pinto et al., 2022), has been widely used to mitigate beach erosion and rebuild landscapes. Sand bypass systems have also been implemented to cope with the littoral drift interruption by transporting the updrift sand through a pipeline network to the downdrift of coastal structures (Boswood and Murray, 2001; Loza, 2008; Silva et al., 2021). Besides the above well-recognized approaches, a potential yet less studied alternative option is the direct removal of unsuited coastal structures, i.e., removing the original cause of disturbance to trigger natural recovery. This has recently emerged as an increasingly attractive option being considered and implemented in coastal restoration engineering (Carpi et al., 2021), and in managed retreat (Abel et al., 2011; Nordstrom et al., 2015) with respect to the increasing coastal disaster risk and protection cost due to the changing climate. The criteria for making the decision on coastal structure removal include the condition of structures, the influence on natural processes, environmental impacts, public safety, and visitor access and use (Nordstrom et al., 2016). The removal of unsuited coastal structures might be beneficial not only for the improvement of aquatic-terrestrial connectivity and sediment exchange but also for the restoration of landforms and ecosystems (Berry et al., 2013; Lee et al., 2018).
While this approach could be promising for natural beach morphology recovery, little understanding or estimation of the recovery ability remains a bottleneck for evaluating its effectiveness, and creates uncertainty for its planning and application in different sites. More specifically, there are key questions related to the process of beach morphological response to structure removal, including whether and to what extent the shoreline will recover to the state without features caused by the structures, how long the recovery will take, and which factors will influence the recovery ability. These questions are more complex considering that some unique morphological features developed near the structures (Kristensen et al., 2013; Vaidya et al., 2015), e.g., the sharply discontinuous shoreline on the two lateral sides of an attached breakwater or the tombolo behind a detached breakwater, will be exposed to very inadaptive hydrodynamic environment after structure removal, and thus exhibit dramatic evolution with possibly shoreline discontinuity, spit formation, and shoreline merging processes. However, previous studies have focused on the influence of structure construction, and knowledge about the physical mechanism of beach morphological evolution after structure removal has rarely been documented.
The prediction and evaluation of shoreline recovery ability after structure removal are not easy tasks. The recovery process is expected to take quite a long time (e.g., several years to several decades) which limits the use of most process-based numerical models. The traditional shoreline evolution models based on the one-line theory (e.g., Hanson, 1989; Kristensen et al., 2016) are simple and have been widely used for long-term modeling, but two limitations hinder their direct application in predicting the shoreline recovery after structure removal. First, in the traditional one-line models the shoreline is not allowed to evolve freely but rather towards the original shape of the reference line or grid. It is difficult to deal with shorelines with high curvatures and to simulate the sand spit formation. Second, these models often treat a shoreline with a complex shape as disparate sections so the interactions between different parts of the shoreline are hard to simulate, such as the shoreline split, merging, and shielding effect. Both spit formation and interactions between different shoreline sections are expected to play important roles in shoreline recovery after structure removal because of the sharp change in shoreline direction near the structure and the great difference in shoreline positions on the updrift and downdrift sides of the structure. Fortunately, these limitations have been overcome by recently developed shoreline evolution models (e.g., Ashton and Murray, 2006; Robinet et al., 2018; Roelvink et al., 2020) which account for many unique features in a simplified way to handle more complex shoreline behaviors, including shoreline instability caused by high-angle waves, sand spit formation and migration, and cross-shore sediment transport. This provides a good opportunity to investigate shoreline recovery ability after the removal of coastal structures.
As an exploratory work, this study focuses on sandy shoreline evolution after the removal of an attached breakwater, a classic coastal structure extending from the shore, blocking longshore sediment transport and causing significant downdrift beach erosion. The recently developed ShorelineS model was used to reveal the shoreline recovery ability under simplified and generalized conditions. The model is introduced in Section 2. Section 3 describes the simulated shoreline evolution and recovery ability under different settings. Dominant processes influencing shoreline recovery ability and a preliminary method to estimate the ability are discussed in Section 4. Conclusions are drawn in Section 5.
2 Numerical model
2.1 Model description
The numerical model ShorelineS (Roelvink et al., 2020) was adopted in this study. It is based on the principle of one-line theory and improves the vector-based approach (Kaergaard and Fredsoe, 2013; Hurst et al., 2015) to simulate complex shoreline behaviors and interactions, with a reasonable computation cost over temporal scales of years to centuries.
The input data of the model include the initial shoreline position, location of the coastal structures, and wave climate. If applicable, information on nourishment, including the time, position, and volume, or information on sources and sinks is also needed. Together with the additional data including the grid size, boundary condition, and the start and end times of the simulation, all the input data are introduced to the model in a structure array. The model then generates a shoreline-following grid automatically. Within each time step, the grid sizes are automatically adjusted to be bigger than half and smaller than twice the initial grid size. The largest time step that keeps the model stable based on the stability criteria (Elghandour, 2018) is determined for each loop to ensure computational efficiency. The Longshore Sediment Transport (LST) is calculated with the chosen formulation and adjusted with the boundary condition, structures, and upwind correction (Sections 2.3 and 2.4). The new shoreline position is then calculated explicitly from the previous position. The shoreline is allowed to split at narrow sections if the retreat is severe, and different sections of the shoreline are allowed to merge when they intersect. This is essential to simulate the migration of spits.
2.2 Main equation
The shoreline evolution is modeled with the mass conservation equation:
where n is the cross-shore coordinate of the grid point, t is time, Dc is the height of the active profile which extends from the closure depth to the berm crest, Qs is the longshore sediment transport rate, s is the longshore coordinate of the grid point, RSLR is the relative sea level rise, tanβ is the slope of the active profile, and qi represents sources and sinks including cross-shore sediment transport, sand nourishment and mining, and exchange with fluvial sediment at rivers and tidal inlets. As we are focused on shoreline evolution under longshore sediment transport, no RSLR or source/sink is considered in this study.
The CERC formula (USACE, 1984), which is the simplest and most efficient transport formula and is mainly meant for exploring the behaviors of the shoreline, is used to calculate the longshore sediment transport rate. The formula is written as:
where Hs0 is the significant wave height, φloc is the incident wave angle, b is the transport coefficient, k is the calibration coefficient, g is the gravitational acceleration, ρ and ρs are densities of water and sediment respectively, and p is the bed porosity.
2.3 Treatment of breakwater
To reliably simulate the local shoreline evolution around the breakwater, additional shoreline grid points exactly on the updrift and downdrift sides of the breakwater are generated. Then the shoreline grid points on both sides of the breakwater are forced to move along the breakwater. The breakwater is treated as an obstacle preventing longshore sediment transport within the surf zone causing sedimentation at the updrift side and erosion at the downdrift side until the occurrence of sand bypassing when the updrift shoreline position gets close to the tip of the breakwater. Sand bypassing factor (BPF), which is defined as the ratio of sediment bypassing transport rate Qby to the sediment transport rate at the breakwater Qg and varies between 0 and 1, is calculated as (Kamphuis, 2000):
where Lr is the remaining length of the breakwater calculated by the length of the breakwater Lb and the distance of sediment depositing seaward on the updrift side of the breakwater yb, DLT and yLT are the water depth and the seaward distance of the active longshore sediment transport respectively, and Hsb is the significant breaking wave height. The parameter Aw and the breaker index γ are 1.27 and 0.78 respectively. The sediment scale parameter Ap can be estimated by the median grain size D50. The bypassed sediment is transported to the end of the sheltered area at the downdrift of the breakwater. Due to sand bypassing, the erosion at the downdrift side slows down as the updrift of the breakwater is filled with sediment.
The shadowed zone is determined by extending the wave ray at the tips of structures or shoreline sections to create a projection on the adjacent shoreline. In the shadow zone, the longshore sediment transport is set to zero.
2.4 Spit development
Spits can form at abrupt interruptions of a shoreline or small bumps on a straight shoreline due to the high-angle wave instability mechanism (Ashton et al., 2001). However, the central difference scheme often used in one-line models becomes unstable or gives unreasonable outcomes under high-angle wave situations. Local upwind correction (Mudde, 2018) is adopted in ShorelineS to stabilize the model under high-angle waves and ensure a smooth development into a spit. This upwind correction is implemented in the shoreline sections where the local wave angle changes from smaller than the critical angle (roughly 45°) to exceeding the critical angle. As a spit grows, the shoreline is allowed to split when severe erosion takes place at the seaward side of the spit. It is also allowed to merge shoreline sections when they intersect with each other (Roelvink et al., 2020).
2.5 Model validation
The ability of ShorelineS to simulate complex shoreline evolution has been validated through field cases at Al-Gamil Beach, IJmuiden, Sand Engine, and Tomis South (Mudde, 2018; Ghonim, 2019; Roelvink et al., 2020; Overgaauw, 2021). As an example, here we show the model performance by comparing the predicted results with the well-known analytical solution (Pelnard-Considere, 1956) for shoreline evolution after breakwater construction. The analytical solution is expressed as:
where t represents time, φloc is the angle of wave incidence, sx is the coastal constant determined in the S-φ relation (Roelvink and Reniers, 2012), and Dc is the active profile height.
The accretion and erosion of a straight shoreline near a 200 m shore-normal breakwater under oblique incident waves with an angle of 10° are calculated using ShorelineS and the analytical solution (Figure 1). The simulated accretion on the updrift side of the breakwater perfectly agrees with the analytical solution while the erosion on the downdrift side of the breakwater is slightly different due to the shielding effect, which is not considered in the analytical solution. The values of maximum erosion are consistent, but the locations are at the downdrift of the breakwater for the simulation and the breakwater foot for the analytical solution. When the updrift shoreline approaches the breakwater tip, the sand bypassing slows down the accretion and erosion and thus, the analytical solution loses its validity.
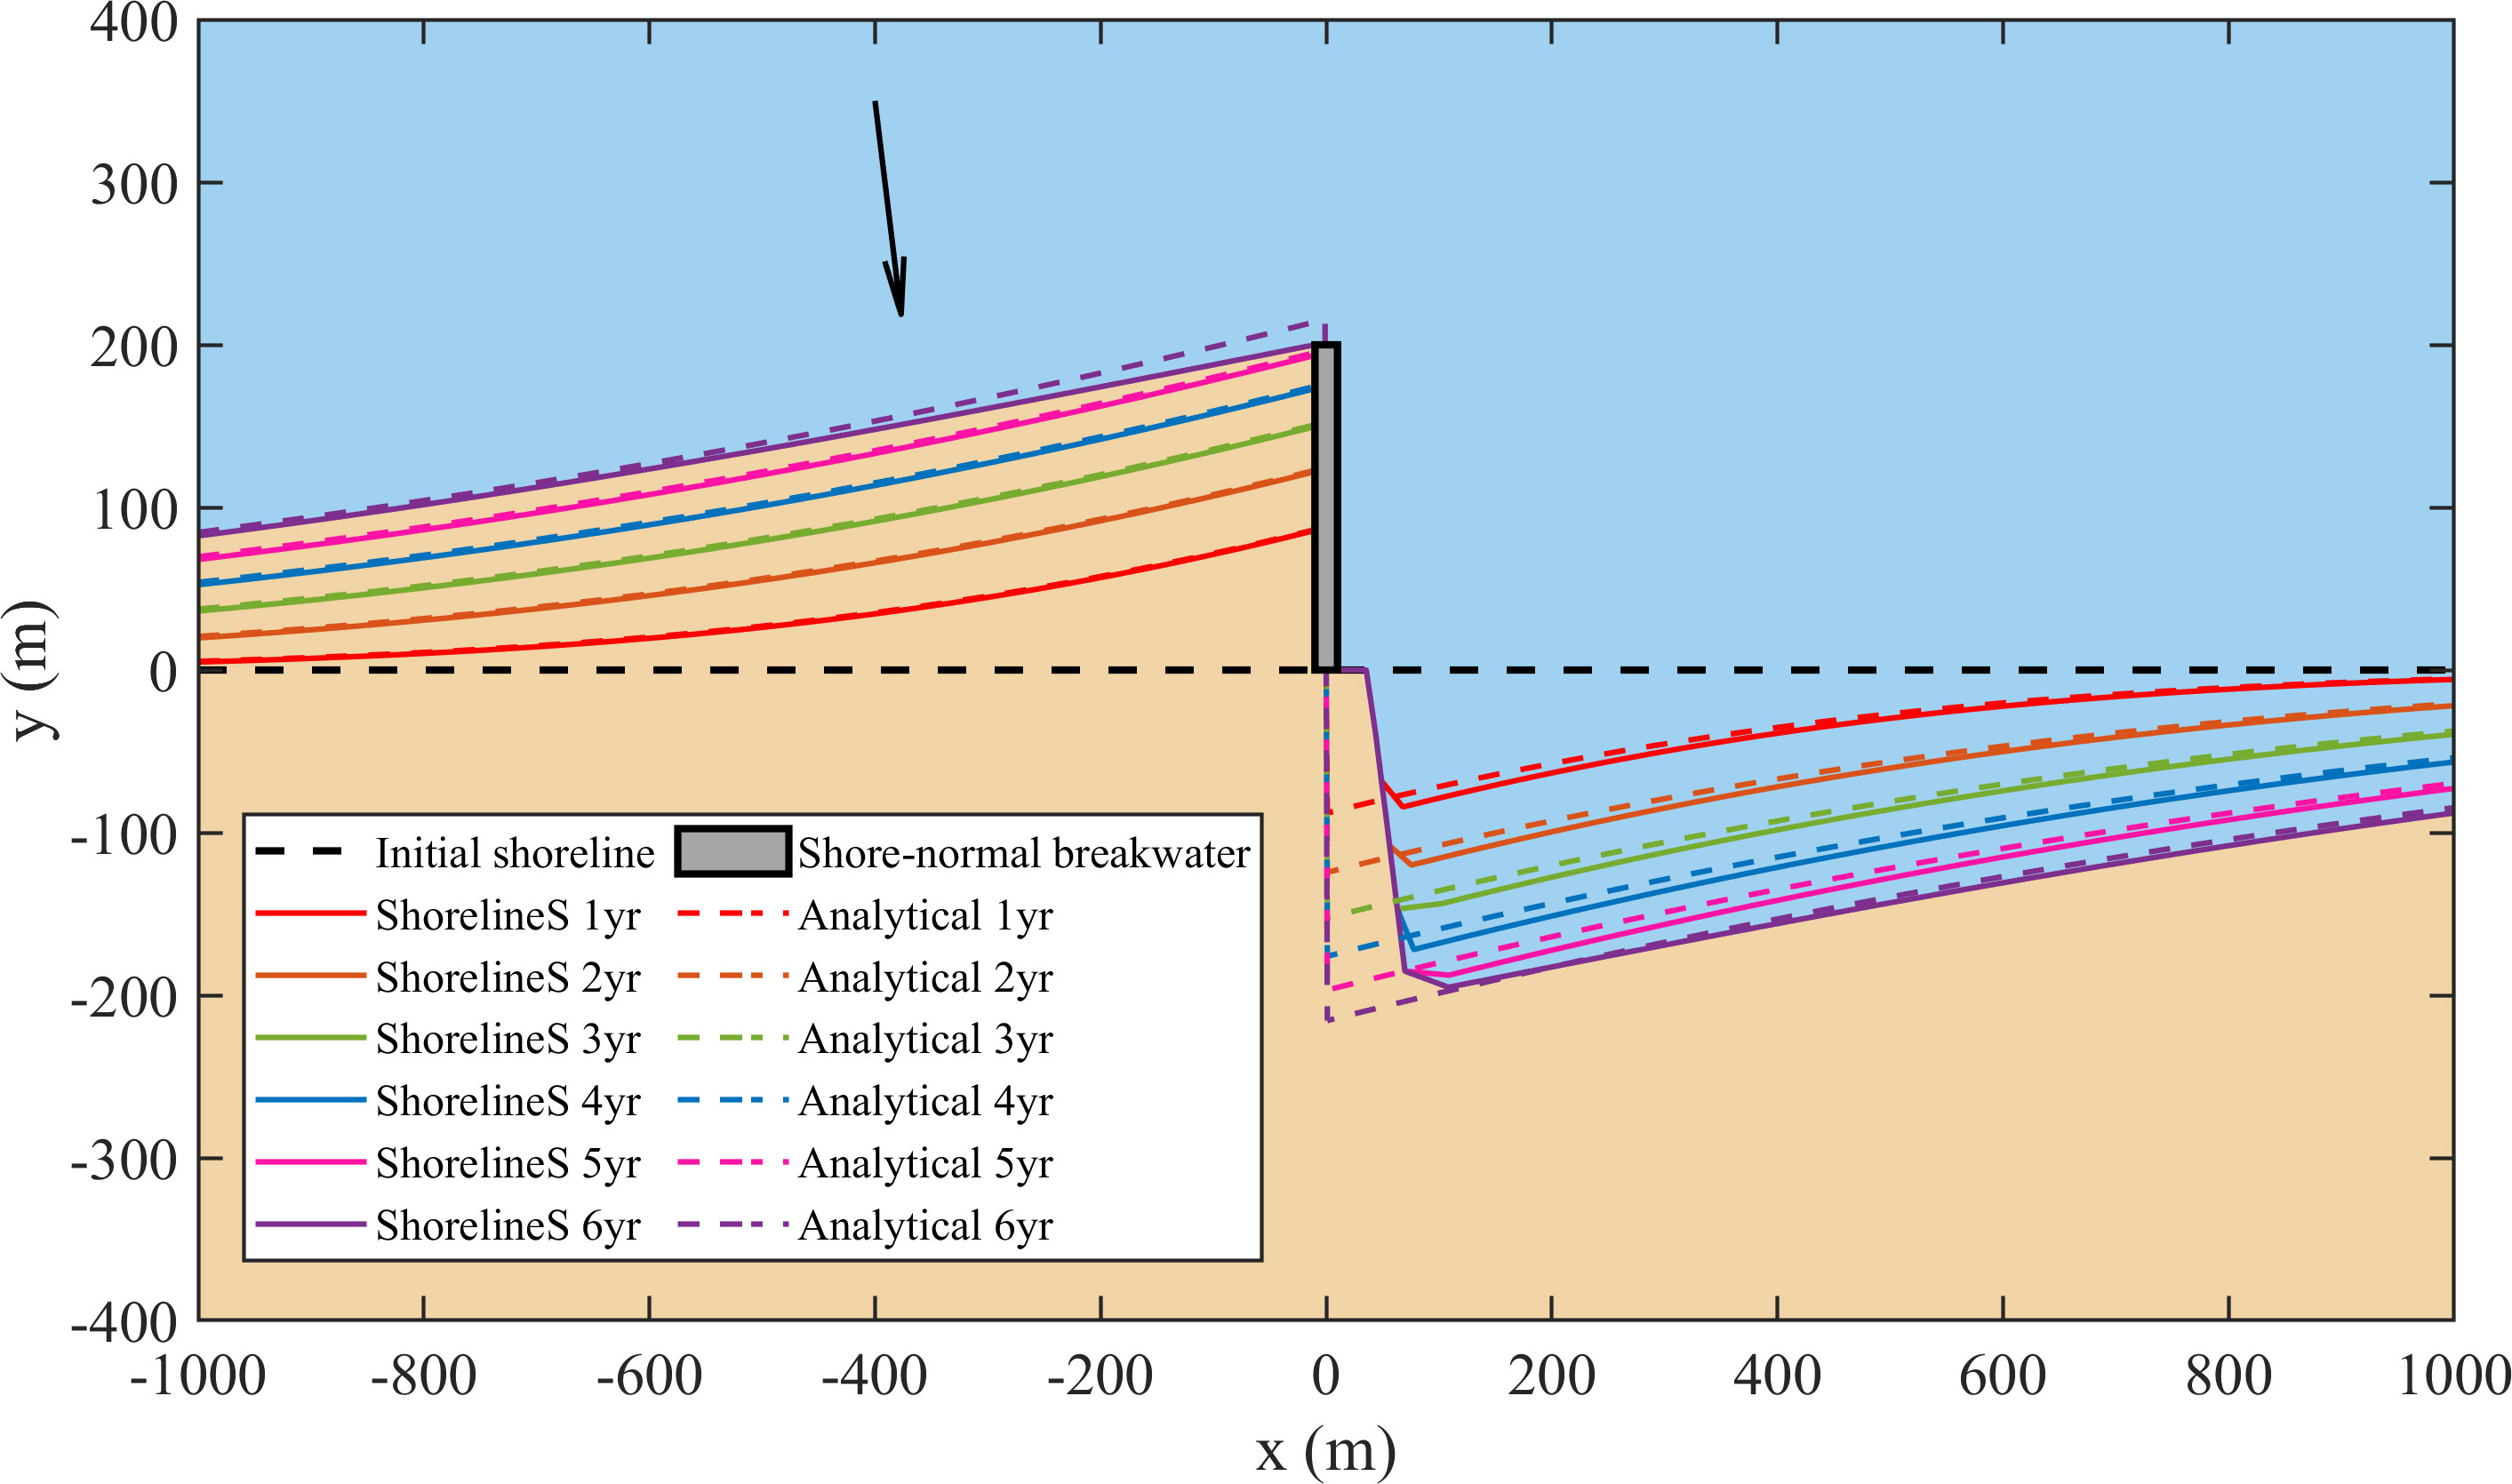
Figure 1 Shoreline evolution after breakwater construction in ShorelineS and analytical solution. The black arrow represents the incident waves.
3 Results
The process of shoreline recovery after the removal of an attached breakwater was investigated numerically under a simplified and generalized framework. Taking a straight shoreline as the original shape, the shoreline evolution after construction and removal of the breakwater was simulated by stages, considering various lengths and directions of the breakwater, incident wave angles, and max LST rates, assuming sufficient sediment supply from the updrift coast. A total of 28 computational runs were implemented (Table 1). The breakwater length varied from 200 m to 600 m and the breakwater direction rotated from updrift to downdrift, according to the common breakwater forms. Incident wave angles less than 40° were considered to avoid large-scale shoreline instability under high-angle waves, and the directional spreading of the wave climate was set as zero to represent constant wave climates. The max longshore sediment transport rate varied from 1×10⁵ to 5×10⁶ m3yr-1, covering weak and strong transport situations. The active profile height, which is usually determined by field investigation, was set as 10 m in the present numerical investigation. The critical width relevant for overwash processes was set as zero, which means that overwash was not considered in the evolution.

Table 1 Computational runs.
3.1 Shoreline evolution pattern
Taking run 3 as an example, the main process of shoreline evolution in the simulation is depicted in Figure 2. First, the accretion and erosion of straight shoreline caused by a breakwater were simulated to form the initial shoreline (Figure 2A). Then the breakwater was removed when it was filled with sediments. After breakwater removal, a sand spit formed at the tip of the breakwater deposition because of the sharp change of shoreline orientation, and extended roughly along the critical direction (Figure 2B). At the downdrift of the shadow zone of the sand spit, erosion continued until the spit connected to the downdrift shoreline, supplying sediment from the deposition to the eroded shoreline. At the same time, a lagoon was closed by the spit at the foot of the deposition. With the retreat of the updrift shoreline, the spit narrowed and split at the updrift end and retreated to the downdrift shoreline. A new spit formed at the deposition and extended to the downdrift, reducing the area of the lagoon (Figure 2C). The extension and split of the spit circulated until the lagoon retreated behind the original straight shoreline. After that, the shape of the lagoon remained unchanged and the shoreline accretion and erosion caused by the breakwater flattened gradually (Figure 2D). In other words, the shoreline recovered to its original straight shape, but the volume of sediment only partly recovered to the state before the construction of breakwater due to the existence of an unrecoverable lagoon.
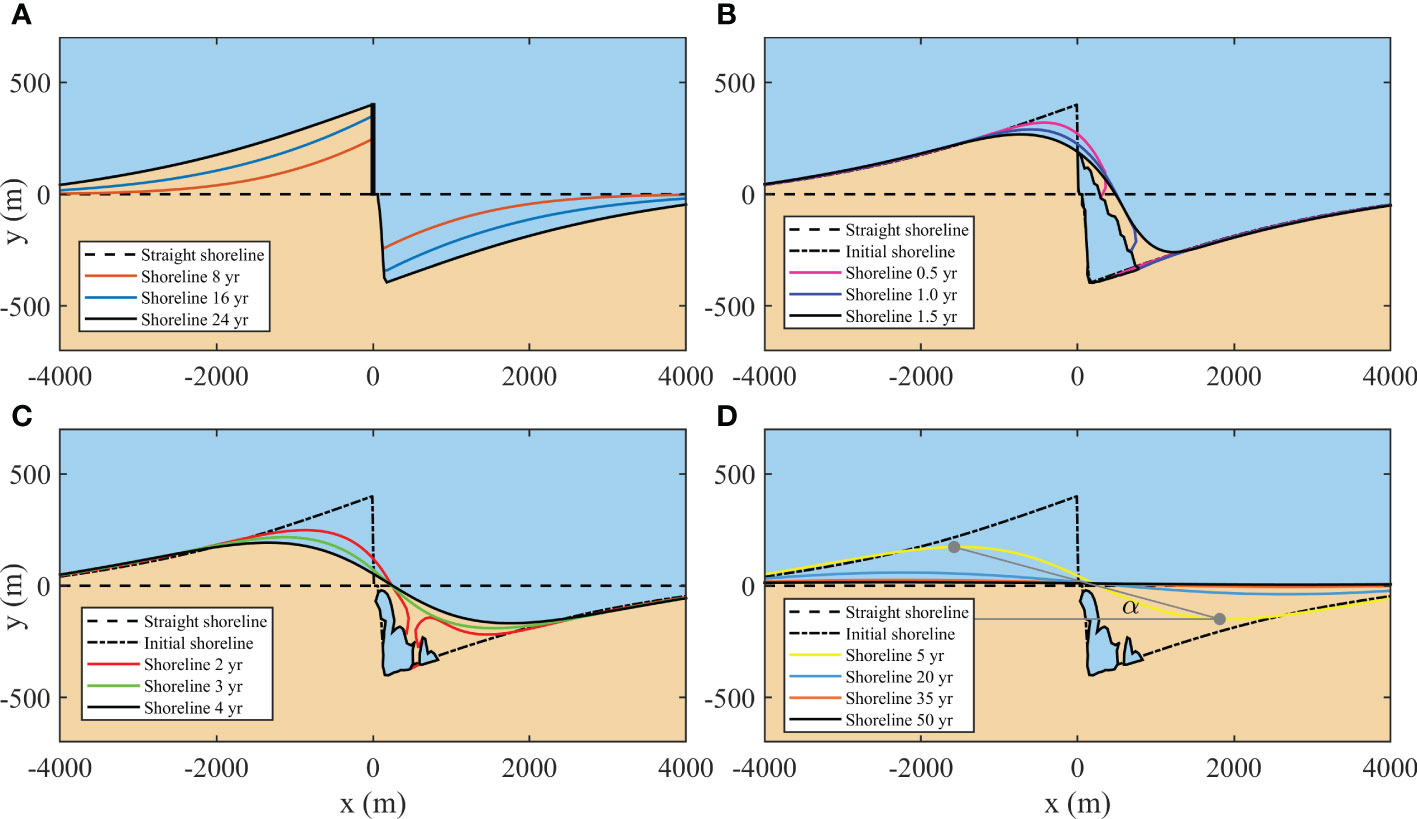
Figure 2 Shoreline evolution processes in Run 3, including the accretion and erosion of a straight shoreline caused by the breakwater (A), spit development and merging with the downdrift shoreline section (B), the splitting of the spit (C), and the gradual flattening of the shoreline (D). The gray dots are the most seaward and landward shoreline points. The angle alpha is defined to evaluate the recovery duration.
The shoreline recovery ability can be described quantitatively by the recovery duration (Tr) and the recovery ratio (Rr). The recovery duration was evaluated based on the angle α (illustrated in Figure 2D), which is calculated as
where (xs, ys) and (xl, yl) are the coordinates of the most seaward and landward shoreline points, respectively (the gray dots in Figure 2D). This angle can describe the extent to which the shoreline shape deviated from the straight line. It decreases in the process of shoreline recovery as the shoreline flattened. When the shoreline totally recovers to a straight line, the angle will go to zero. Considering the computational accuracy, the shoreline was considered to have recovered to a straight line when the angle decreased to 1 degree. The recovery duration (Tr) is defined as the duration between structure removal and the total recovery of the shoreline to a straight line (Figure 3).

Figure 3 Temporal variation of α. The recovery moment is represented by the black circle.
The recovery ratio is simply calculated by dividing the recovered area (Arecover) by the initial eroded area (Aerosion) in the downdrift section
3.2 Influence of breakwater configuration
Different breakwater lengths and directions under the same incident wave angle and max LST rate (Run 1-4, 11-13, 20-22) were considered to investigate the influence of breakwater configuration on shoreline recovery after breakwater removal. Three breakwater directions were considered: normal to the shoreline, inclining to the updrift, and downdrift with an angle of 45° to the shore-normal direction. Three breakwater lengths, including 200, 400, and 600 m, were considered for each breakwater direction, and an additional breakwater length of 283 m was considered for the shore-normal breakwater to get the same effective breakwater length with 400 m updrift inclined and downdrift inclined breakwaters.
As shown in Figure 4A, the recovery duration increased with the breakwater length. Under the same breakwater length, the recovery duration of updrift inclined and downdrift inclined breakwaters was less than that of the shore-normal breakwater. The recovery duration of the 283 m shore-normal breakwater was close to the recovery duration of the 400 m updrift inclined and downdrift inclined breakwaters, indicating that the recovery duration is related to the effective breakwater length, which is the projected breakwater length in the direction normal to the shoreline. Under the same effective breakwater length, the recovery duration of the updrift inclined breakwater was slightly larger than that of the shore-normal breakwater, and both of them were larger than that of the downdrift inclined breakwater. As the breakwater direction rotated to the downdrift, the sediment deposited by the breakwater moved close to the erosion section (Figure 5A, C, E), resulting in a large local sediment transport gradient and accelerating shoreline recovery.
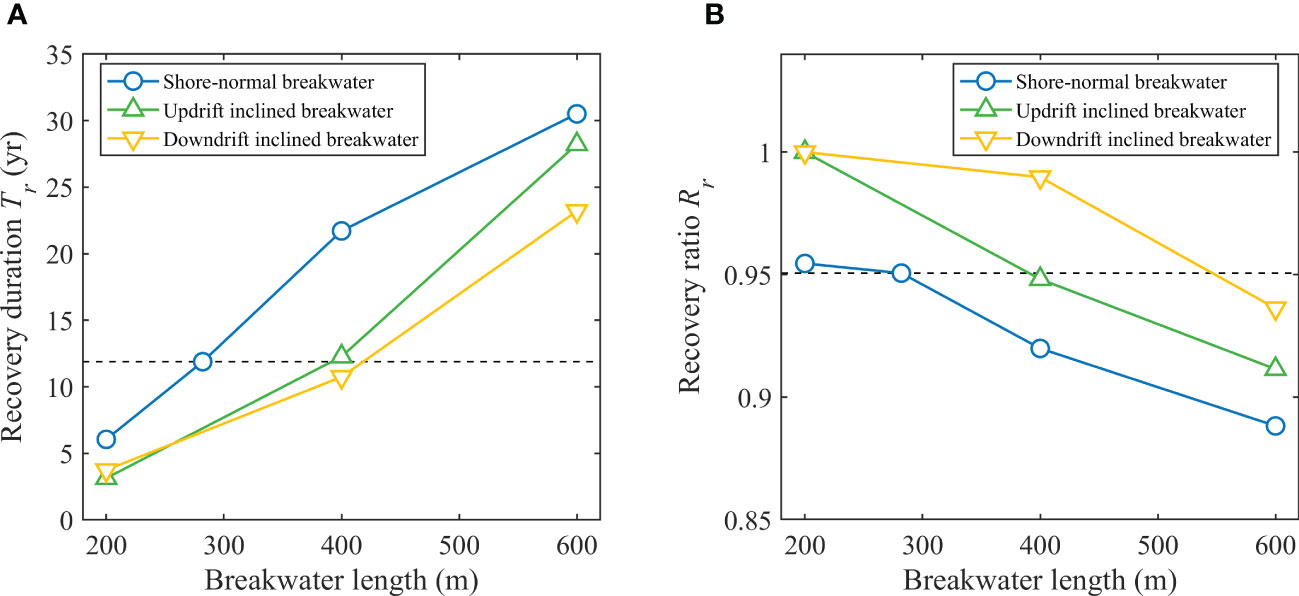
Figure 4 Influence of breakwater configuration on recovery duration (A) and recovery ratio (B).
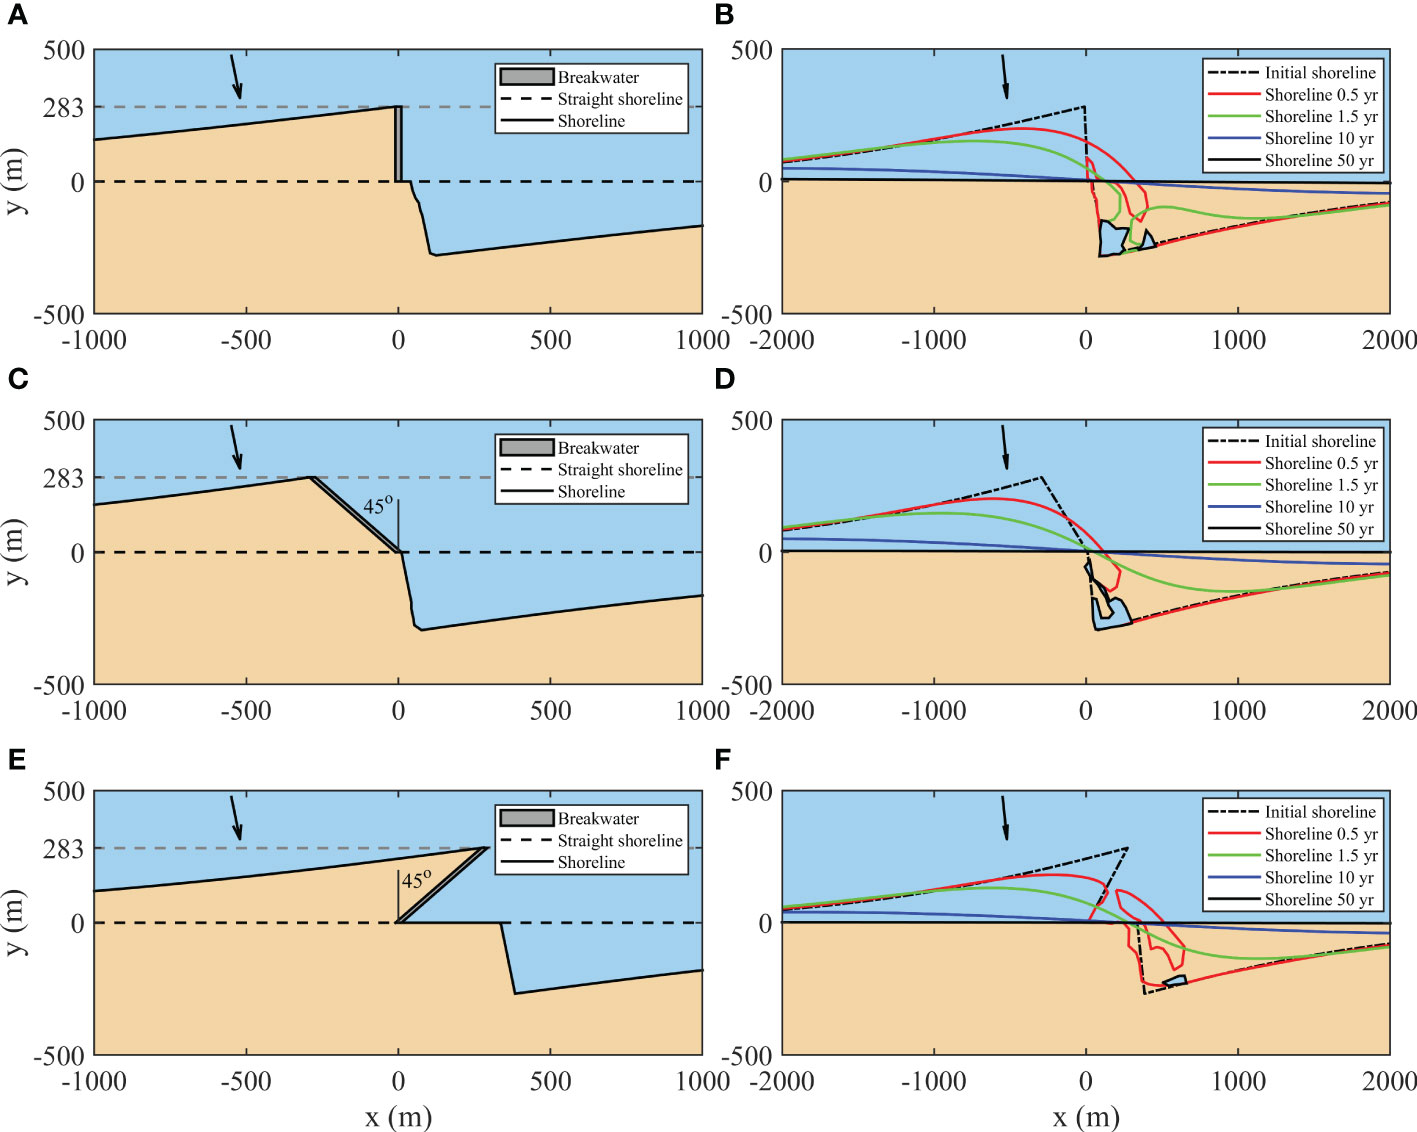
Figure 5 Shoreline evolution before and after removal of the shore-normal breakwater of 283 m long (A, B), updrift inclined breakwater of 400 m long (C, D) and downdrift inclined breakwater of 400 m long (E, F). The black arrow represents the incident waves.
It is depicted in Figure 4B that the recovery ratio decreased with the breakwater length. For the cases of the 200 m updrift inclined and downdrift inclined breakwaters, the erosion sections were totally filled and recovered to the state before the existence of breakwaters, indicating that the shoreline can fully recover naturally. Under the same effective breakwater length, the recovery ratio of the downdrift inclined breakwater was much larger than that of the updrift inclined and shore-normal breakwaters. For the downdrift inclined breakwater, the sand spit formed in the recovery process was more likely to split because the sediment deposited by the breakwater was narrower than in the cases of the shore-normal and updrift inclined breakwaters (Figure 5F). The splitting of the spit opened the lagoon, allowing sediment to be transported into the lagoon, which was beneficial for the recovery of the erosion sections. For the updrift inclined breakwater, as shown in Figure 5D, the shadow zone of the deposition was small and two sand spits formed at the tip and foot of the deposition, limiting the size of the lagoon. However, the sand spit was difficult to split as the deposition was wide. Therefore, the lagoon shape was fixed once it was closed, resulting in a low recovery ratio. Although the splitting of spits also happened in the shore-normal breakwater cases (Figure 5B), the shadow zones were larger than that of the updrift inclined breakwater cases, leading to similar recovery ratios to the updrift inclined breakwater cases.
3.3 Influence of incident wave angle
It is widely reported that incident wave angle is an essential factor for shoreline evolution, thus its influence on shoreline recovery after breakwater removal was investigated in Runs 3, 5-7, 12, 14-16, 21, and 23-25, in which the breakwater length and max LST were identical. The shoreline recovery processes under incident wave angles of 10°, 20°, 30°, and 40° were simulated.
As shown in Figure 6A, the recovery duration decreased with incident wave angle when the angle was low (φloc ≤ 20°), and increased with incident wave angle when the angle was in the range of 20° - 40°. When the angle was larger than 30°, the recovery duration increased significantly. The recovery ratio decreased with incident wave angle (Figure 6B). When the angle was larger than 30°, the recovery ratio decreased remarkably and decreased to negative values when the angle reached 40°, i.e., the final lagoon area was larger than the initial eroded area.
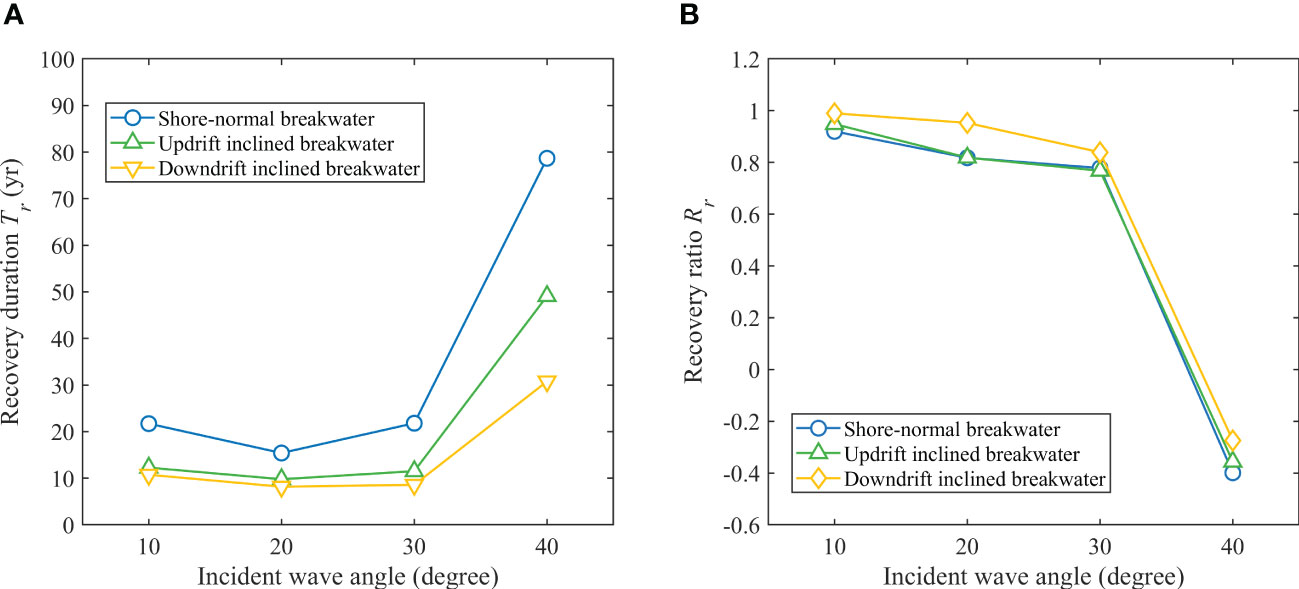
Figure 6 Influence of incident wave angle on recovery duration (A) and recovery ratio (B).
On the one hand, the longshore sediment transport was enhanced by the increase in incident wave angle, promoting the extension of sand spit and sediment replenishment in the erosion section. But on the other hand, the extension direction of sand spit rotated to the downdrift direction with increased incident wave angle, delaying the sediment supply to the erosion section (Figure 7). The influence of the latter was quite significant when the incident wave angle was high. The rotation of the spit extension direction, and the downdrift erosion before the sand spit connecting to the downdrift shoreline, increased the final lagoon area. The initial eroded area decreased with the increase in incident wave angle because the higher the incident wave angle was, the earlier the breakwater was filled. Therefore, under high incident wave angles (30° - 40°), downdrift erosion can be intensified after the breakwater removal. Under this situation, although the shoreline can recover to a straight shape after a long period, sediment loss has happened. If the incident wave angle exceeds the critical angle (about 45°), a flying spit will develop due to the high-angle wave instability mechanism (not shown). In this case, the shoreline will never recover to the state before the construction of the breakwater both in shape and sediment volume.
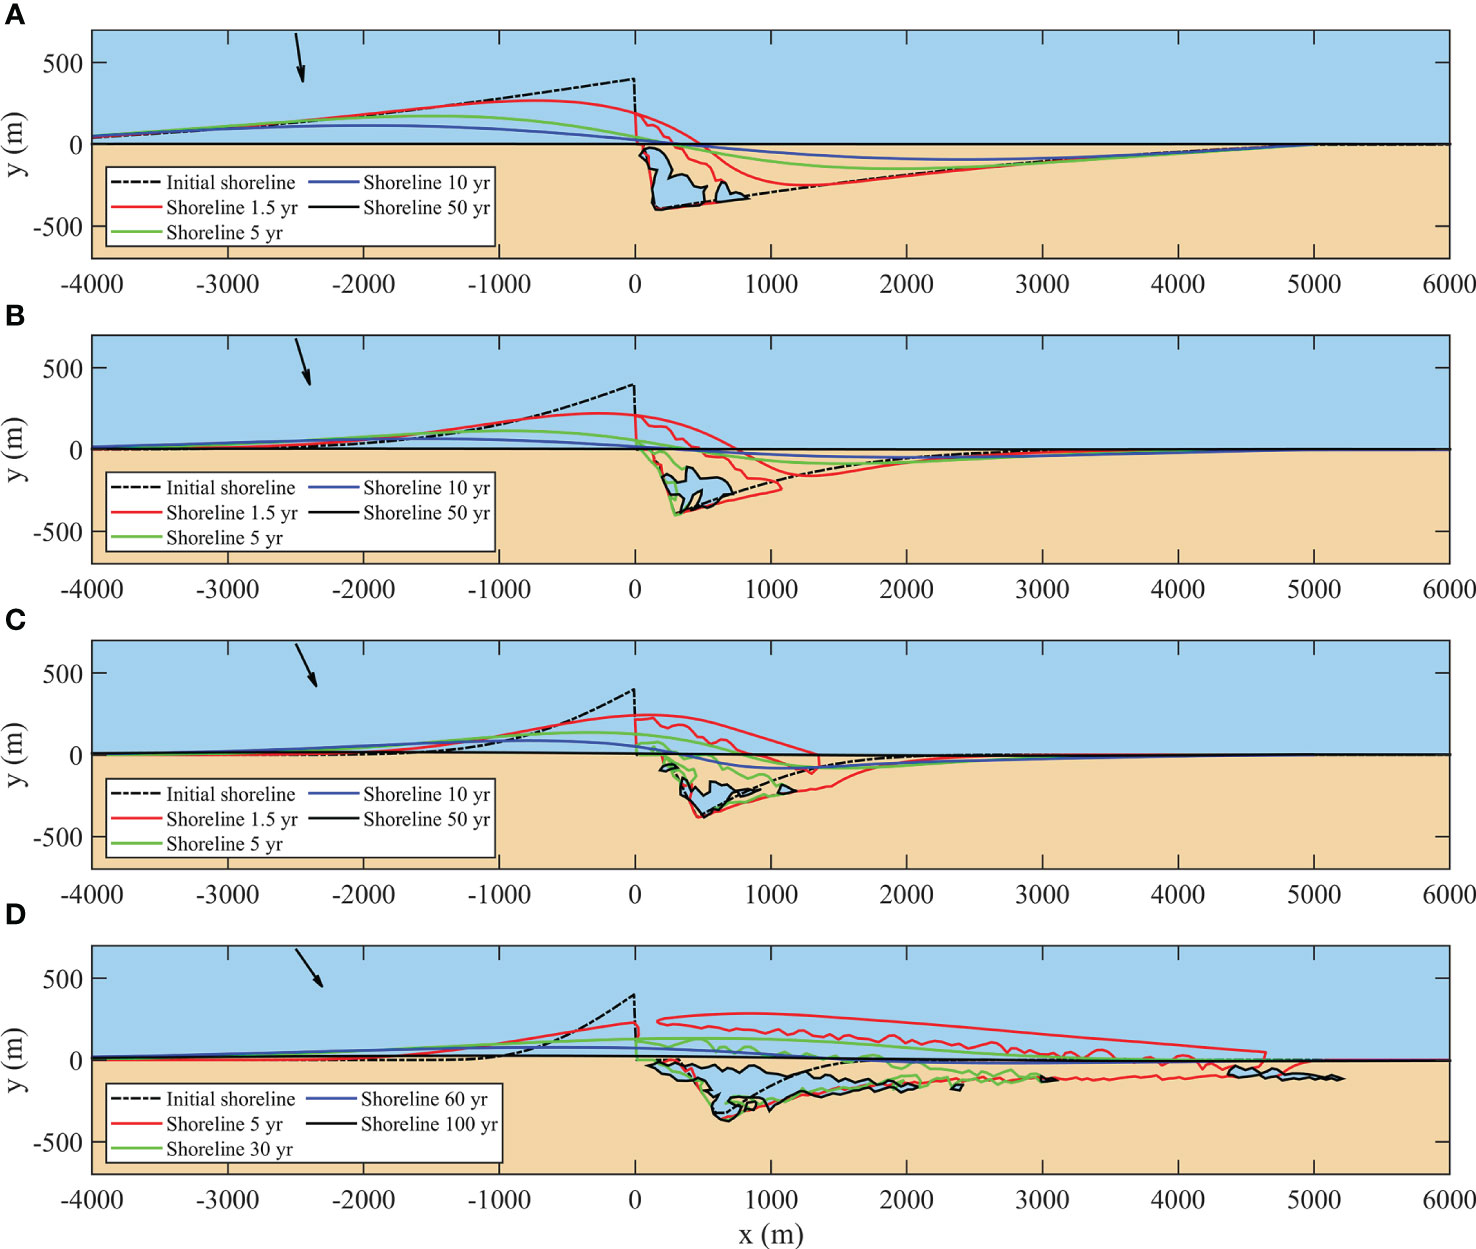
Figure 7 Shoreline evolution after removal of the shore-normal breakwater of 400 m long under incident wave angles of 10° (A), 20° (B), 30° (C), and 40° (D). The black arrow represents the incident waves.
3.4 Influence of the max LST rate
The max longshore sediment transport rate (Qsmax) refers to the longshore transport rate under the critical angle, often used to describe the magnitude of coastal sediment transport. Its influence on shoreline recovery after breakwater removal was investigated under the same breakwater length and incident wave angle (Run 3, 8-10, 12, 17-19, 21, 26-28). Four different values of max longshore sediment transport rate were considered, including 1×10⁵, 5×10⁵, 1×10⁶ and 5×10⁶ m3yr-1. It was found that the recovery duration was in direct proportion to the reciprocal value of the max LST rate (Figure 8A) but the recovery ratio showed no relationship with the max LST rate (Figure 8B), which indicates that the max longshore sediment transport rate affects the speed but does not affect the pattern of shoreline recovery after breakwater removal.

Figure 8 Influence of max LST rate on recovery duration (A) and recovery ratio (B).
4 Discussion
In this study, a numerical model was used to investigate the shoreline evolution behaviors after breakwater removal, which has been an important knowledge gap for coastal management and beach restoration. It was shown that, after the removal of an attached breakwater, the shoreline has the potential to naturally recover to the state before the construction of the breakwater. The shoreline recovery ability is highly related to behaviors of the sand spit which develops at the tip of the updrift deposition of the breakwater due to shoreline discontinuity. The direction of spit extension, which is controlled by the incident wave angle, plays a key role in the shoreline recovery process. For cases of low incident wave angle, the spit extends to the downdrift shoreline and supplies sediments to the erosion section, and the shoreline recovers quickly and may totally recover both in shape and sediment volume. If the spit extends nearly parallel to the shoreline under a relatively high incident wave angle, it will take a long time for the shoreline to recover naturally, and serious sediment loss may occur due to erosion in the downdrift of the spit shadow zone. If the spit extends offshore forming a flying spit (Ashton and Murray, 2006), the shoreline will not recover even if the initial erosion is slight. The splitting of the sand spit is another process that affects the shoreline recovery ability. Sediment can be transported into the lagoon at the foot of the deposition only after the lagoon is opened by the splitting of the spit, which is more likely to appear in cases of downdrift inclined breakwaters as the breakwater deposition is narrow in shape. However, an unrecoverable lagoon still appears if the shoreline retreat on the downdrift side of the breakwater is so large that sediment replenishment may be needed to achieve total recovery of sediment volume.
In addition to the above processes, overwash on sand spits (which maintains the continuity of sand spits through onshore sediment transport), wave diffraction (which can transport sediment to the shadow zones), cross-shore sediment transport (which modifies the beach profile), and sediment-starved environmental setting (which affects the sediment storage of the breakwater deposition) are expected to have an important influence on shoreline recovery ability. Efforts are still needed to include these processes in the numerical model in an efficient way. Sand spits are highly dynamic coastal landforms in the real world. The geometry of sand spits is sensitive to many hydrodynamic and geomorphic factors, such as the wave climate, tide, storm, fluvial sediment discharge, sediment size, and geological framework. They exhibit variant morphology over different years in response to the annual variation of these factors. When taking the randomness and morphological instability of sand spits into account, the shoreline recovery ability may increase or decrease, depending on the instability of the wave-induced sediment transport direction. In this case, a probabilistic description of shoreline recovery ability may be needed. To numerically reproduce the variant sand spit behaviors, one of the most important points is to deal with the wave climate randomness. This can be specified 1) by use of a mean wave direction and a directional spreading sector; 2) by randomly choosing wave parameters in a number of wave conditions with equal probability of occurrence; and 3) by using the time series of real wave conditions. It is recommended that future numerical studies should account for these variabilities to predict the more complex behaviors of sand spit evolution affected by structure removal. Moreover, field data of shoreline evolution after breakwater removal for different structures and environmental settings are needed to further validate the numerical results and to deepen the insights into coastal morphological recovery. Unfortunately, to the best of our knowledge, no field measurement on this subject has been reported till now.
As an exploratory work, this study aimed to reveal the dominant mechanisms and influencing factors of shoreline evolution after the structure removal, while reducing the natural complexity by using a set of constant driving variables. The influence of sediment size is implicitly embedded in the max longshore sediment transport rate. According to most longshore sediment transport formulas, the longshore sediment transport rate is negatively correlated to sediment size. Therefore, a positive correlation between the recovery duration and the sediment size can be inferred. Constant angles of wave incidence are used to represent continuous and stable wave climates in this study. When wave spreading is imposed on the dominant wave direction, the morphology of the sand spit will be complex. The elongation rate of the spit may be slowed down which delays the sediment supply to the erosion sections, but the curvature of the spit will increase which promotes its merging with the shoreline. The split of the sand spit, which influences the recovery ratio, may become frequent or rare, depending on variations in the gradient of the longshore sediment transport rate. When considering a multidirectional wave climate, the initial shoreline shape may differ significantly, in which both accretion and erosion can appear on both sides of the breakwater. As a result, the shoreline recovery ability becomes elusory. In addition, wave overwash on the sand spit may be intensified with sea level rise, accelerating the onshore migration of the sand spit and enhancing the shoreline recovery ability to some extent. On the other hand, sea level rise will adjust the active profile shape, part of the sediment will be transported away from the active profile which reduces the sediment input to the eroded shoreline section and thus the recovery ratio. That is to say, the relative magnitudes of the sea level rise rate and the longshore sediment transport rate affect the shoreline recovery ability. Therefore, more detailed studies considering all temporal and spatial variabilities of the highly complex coastal morphodynamic environments are indeed valuable in future research.
In the present study, the recovery duration and recovery ratio were defined to quantitively describe the shoreline recovery ability. It was revealed that the recovery duration was positively related to the effective breakwater length and was inversely proportional to the max longshore sediment transport rate. It decreased with incident wave angle if the angle was less than 20°, and increased significantly with incident wave angle if the angle was in the range of 30° to 40°. For the recovery ratio, negative relationships with breakwater length and incident wave angle were found. It shows no relationship with longshore sediment transport magnitude. Based on these relations and the modeled results, formulas can be proposed to preliminarily estimate the shoreline recovery duration and recovery ratio:
where Le is the effective breakwater length calculated as Le=Lcos(αg); Dc is the active profile height; Sw is the width of the spit fitted by multiple nonlinear regression; αg is the angle between the breakwater direction and shoreline normal direction, and for an updrift inclined breakwater, αg > 0; φ is the incident wave angle; and Qsmax is the max longshore sediment transport rate.
Figure 9 shows that both shoreline recovery duration and recovery ratio calculated with Eq. 12 and 13 agreed well with the model results. In Eq. 12, the recovery duration is in fact calculated as the quotient of eroded sediment volume in the downdrift of the breakwater and the max longshore sediment transport rate, and then rectified by the breakwater direction (k2) and a calibrated coefficient (k1). In Eq. 13, considering the importance of the sand spit at the tip of breakwater deposition in the recovery process, the spit width is adopted to make Le dimensionless. Notably, Le in Eq. 13 denotes the accretion length at the breakwater, which is different from the physical significance of Le in Eq. 12. Although based on a limited number of numerical test cases and simplified modeling conditions, Eq. 12 and 13 do reflect some important physical mechanisms and serve as simple but useful tools for the planning of a breakwater removal project, when a quick evaluation of the shoreline recovery ability (i.e., engineering effectiveness) is needed. When the field data are available, these formulas can be further tested and improved.
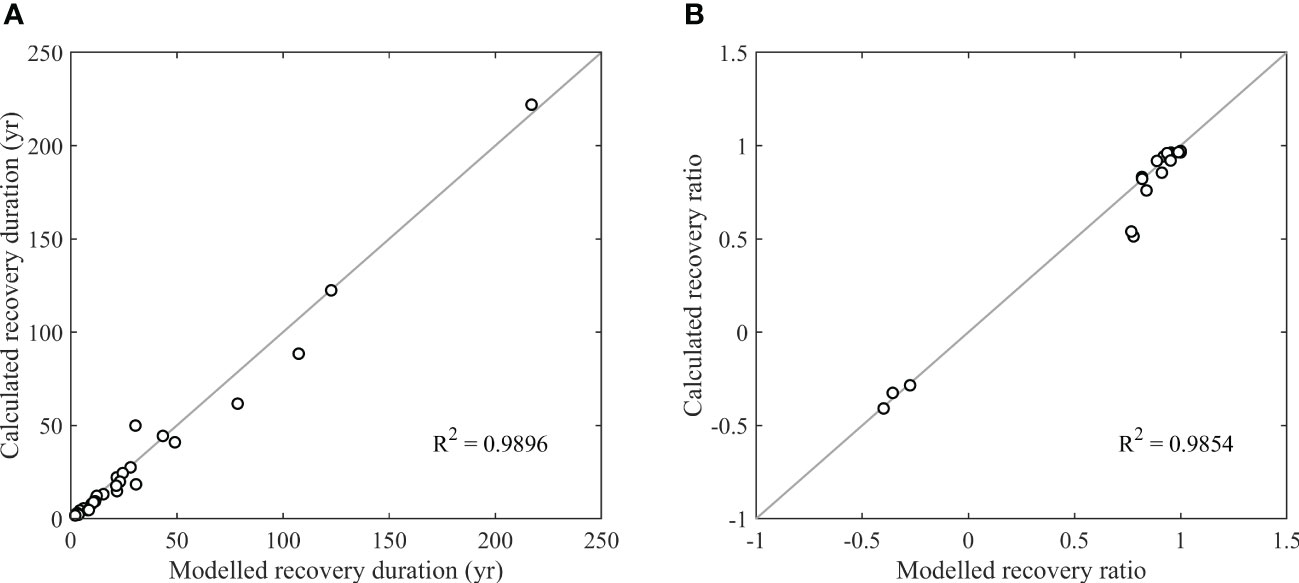
Figure 9 Comparison of calculated shoreline recovery duration (A) and recovery ratio (B) using Eq. 12 and 13 with ShorelineS simulated results.
5 Conclusions
We used a numerical model to explore the sandy shoreline recovery after the removal of an attached breakwater, considering various breakwater configurations and hydro-sedimentary conditions in a simplified and generalized framework. This is an important topic in coastal restoration because of the growing concern worldwide about the negative impacts of many coastal structures on the neighboring beaches and the poor understanding of shoreline response to the structure removal. New knowledge on the physical mechanism of beach morphological evolution after the structure removal was generated. This includes 1) the verification of natural shoreline recovery ability, 2) the influences of important morphodynamic and structure parameters on the recovery ability, 3) the dominant role of sand spit morphological behaviors in the recovery processes, and 4) the practical formulas to estimate the recovery time and ratio as a function of these parameters.
Sandy shorelines have the ability to naturally recover after the removal of an attached breakwater, that is, the accretion and erosion caused by the breakwater will be flattened after breakwater removal and the shoreline can recover to the original straight shape. The recovery duration was found to range from years to centuries, and the recovery ratio can range from full recovery to partial recovery (or even none recovery), both of which depend on the site-specific structure and environmental conditions. Overall, a higher shoreline recovery ability (i.e., shorter duration and larger ratio) is related to shorter effective breakwater length, downdrift inclined breakwater direction, lower angle of wave incidence, and greater longshore sediment transport rate. In the case of large initial downdrift erosion and a high angle of wave incidence (e.g., higher than 30°), the loss of sediment volume (rather than recovery) may occur with the formation of an unrecoverable lagoon in the downdrift area.
The behavior of the sand spit evolution, which initially forms at the tip of the breakwater deposition, is the dominant mechanism that leads to distinct shoreline recovery processes. The direction of spit extension, mostly controlled by the incident wave angle, represents the path of sediment supply and determines the variation trend of sediment volume in the downdrift section after breakwater removal. The splitting of the sand spit, which is affected by the initial spit width and breakwater direction, is the key factor in the sediment filling of the lagoon which reduces the unrecoverable lagoon area and increases recovery ability.
Preliminary formulas were proposed to quantitatively estimate shoreline recovery duration and recovery ratio, which account for the important mechanisms for recovery ability. They are simple and allow for a quick evaluation of shoreline recovery ability supporting coastal management and project planning.
Data availability statement
The original contributions presented in the study are included in the article/supplementary material. Further inquiries can be directed to the corresponding author.
Author contributions
SC and CZ contributed to the conception of the study, the numerical investigation, the construction of the practical formulas, and manuscript preparation. JZ contributed significantly to constructive discussions, and manuscript writing, and supervised SC. All authors contributed to the article and approved the submitted version.
Funding
This work was supported by the National Key Research and Development Program of China (2022YFC3106102), the Key Program of National Natural Science Foundation of China (41930538), the Fundamental Research Funds for the Central Universities (B220203004).
Acknowledgments
The authors thank Dano Roelvink for sharing the ShorelineS program.
Conflict of interest
The authors declare that the research was conducted in the absence of any commercial or financial relationships that could be construed as a potential conflict of interest.
Publisher’s note
All claims expressed in this article are solely those of the authors and do not necessarily represent those of their affiliated organizations, or those of the publisher, the editors and the reviewers. Any product that may be evaluated in this article, or claim that may be made by its manufacturer, is not guaranteed or endorsed by the publisher.
References
Abel N., Gorddard R., Harman B., Leitch A., Langridge J., Ryan A., et al. (2011). Sea Level rise, coastal development and planned retreat: analytical framework, governance principles and an Australian case study. Environ. Sci. Policy 14 (3), 279–288. doi: 10.1016/j.envsci.2010.12.002
Ashton A. D., Murray A. B. (2006). High-angle wave instability and emergent shoreline shapes: 1. modelling of sand waves, flying spits, and capes. J. Geophys. Research-Earth Surface 111 (F4), F04011. doi: 10.1029/2005JF000422
Ashton A. D., Murray A. B., Arnoult O. (2001). Formation of coastline features by large-scale instabilities induced by high-angle waves. Nature 414, 296–300. doi: 10.1038/35104541
Berry A., Fahey S., Meyers N. (2013). Changing of the guard: adaptation options that maintain ecologically resilient sandy beach ecosystems. J. Coast. Res. 29 (4), 899–908. doi: 10.2112/JCOASTRES-D-12-00150.1
Boswood P. K., Murray R. J. (2001). Worldwide sand bypassing system: data report (Queensland, Australia), 1037–4701.
Cai F., Cao C., Qi H., Su X., Lei G., Liu J., et al. (2022). Rapid migration of mainland china’s coastal erosion vulnerability due to anthropogenic changes. J. Environ. Manage. 319, 115632. doi: 10.1016/j.jenvman.2022.115632
Carpi L., Bicenio M., Mucerino L., Ferrari M. (2021). Detached breakwaters, yes or not? a modelling approach to evaluate and plan their removal. Ocean Coast. Manage. 210, 105668. doi: 10.1016/j.ocecoaman.2021.105668
Chi S., Zhang C., Wang P., Shi J., Li F., Li Y., et al. (2023). Morphological evolution of paired sand spits at the fudu river mouth: wave effects and anthropogenic factors. Mar. Geol. 456, 106991. doi: 10.1016/j.margeo.2023.106991
Davis J. L. D., Levin L. A., Walther S. M. (2002). Artificial armored shorelines: sites for open-coast species in a southern California bay. Mar. Biol. 140 (6), 1249–1262. doi: 10.1007/s00227-002-0779-8
de Schipper M. A., de Vries S., Ruessink G., de Zeeuw R. C., Rutten J., van Gelder-Maas C., et al. (2016). Initial spreading of a mega feeder nourishment: observations of the sand engine pilot project. Coast. Eng. 111, 23–38. doi: 10.1016/j.coastaleng.2015.10.011
Dugan J. E., Hubbard D. M., Rodil I. F., Revell D. L., Schroeter S. (2008). Ecological effects of coastal armoring on sandy beaches. Mar. Ecol. 29 (s1), 160–170. doi: 10.1111/j.1439-0485.2008.00231.x
Elghandour A. M. (2018). Efficient modelling of coastal evolution: development, verification and validation of ShorelineS model (Netherlands: Delft University of Technology).
Ghonim M. E. (2019). Recent developments in numerical modelling of coastline evolution: advanced development and evaluation of ShorelineS coastline model (Netherlands: Delft University of Technology).
Gittman R. K., Fodrie F. J., Popowich A. M., Keller D. A., Bruno J. F., Currin C. A., et al. (2015). Engineering away our natural defenses: an analysis of shoreline hardening in the US. Front. Ecol. Environ. 13 (6), 301–307. doi: 10.1890/150065
Hanson H., Brampton A., Capobianco M., Dette H. H., Hamm L., Laustrup C., et al. (2002). Beach nourishment projects, practices, and objectives–a European overview. Coast. Eng. 47 (2), 81–111. doi: 10.1016/S0378-3839(02)00122-9
Hurst M. D., Barkwith A., Ellis M. A., Thomas C. W., Murray A. B. (2015). Exploring the sensitivities of crenulate bay shorelines to wave climates using a new vector-based one-line model. J. Geophys. Research-Earth Surface 120, 2586–2608. doi: 10.1002/2015JF003704
Kaergaard K., Fredsoe J. (2013). A numerical shoreline model for shorelines with large curvature. Coast. Eng. 74, 19–32. doi: 10.1016/j.coastaleng.2012.11.011
Kamphuis J. W. (2000). Introduction to coastal engineering and management (Singapore: World Scientific).
Kristensen S. E., Dronen N., Deigaard R., Fredsoe J. (2013). Hybrid morphological modelling of shoreline response to a detached breakwater. Coast. Eng. 71, 13–27. doi: 10.1016/j.coastaleng.2012.06.005
Kristensen S. E., Dronen N., Deigaard R., Fredsoe J. (2016). Impact of groyne fields on the littoral drift: a hybrid morphological modelling study. Coast. Eng. 111, 13–22. doi: 10.1016/j.coastaleng.2016.01.009
Lee T. S., Toft J. D., Cordell J. R., Dethier M. M., Adams J. W., Kelly R. P. (2018). Quantifying the effectiveness of shoreline armoring removal on coastal biota of puget sound. PeerJ 6, e4275. doi: 10.7717/peerj.4275
Li Y., Zhang C., Dai W., Chen D., Sui T., Xie M., et al. (2022). Laboratory investigation on morphology response of submerged artificial sandbar and its impact on beach evolution under storm wave condition. Mar. Geol. 443, 106668. doi: 10.1016/j.margeo.2021.106668
Liu G., Qi H., Cai F., Zhu J., Zhao S., Liu J., et al. (2022). Initial morphological responses of coastal beaches to a mega offshore artificial island. Earth Surface Proc. Landforms 47 (6), 1355–1370. doi: 10.1002/esp.5320
Loza P. (2008). “Sand bypassing systems,” in Environmental engineering (Portugal: Porto University), 106.
Luijendijk A., Hagenaars G., Ranasinghe R., Baart F., Donchyts G., Aarninkhof S. (2018). The state of the world’s beaches. Sci. Rep. 8, 6641. doi: 10.1038/s41598-018-24630-6
Ma Z., Melville D. S., Liu J., Chen Y., Yang H., Ren W., et al. (2014). Rethinking china’s new great wall. Science 346 (6212), 912–914. doi: 10.1126/science.1257258
Mudde C. (2018). Development and verification of ShorelineS on longshore sediment transport and spit formation (Netherlands: Delft University of Technology).
Nordstrom K. F., Armaroli C., Jackson N. L., Ciavola P. (2015). Opportunities and constraints for managed retreat on exposed sandy shores: examples from Emilia-romagna, Italy. Ocean Coast. Manage. 104, 11–21. doi: 10.1016/j.ocecoaman.2014.11.010
Nordstrom K. F., Jackson N. L., Roman C. T. (2016). Facilitating landform migration by removing shore protection structures: opportunities and constraints. Environ. Sci. Policy 66, 217–226. doi: 10.1016/j.envsci.2016.07.012
Overgaauw T. S. F. (2021). Modelling shoreline evolution in the vicinity of shore normal structures: implementation and validation of ShorelineS model using the case study of constanta, Romania (Netherlands: Delft University of Technology).
Patrick C. J., Weller D. E., Ryder M. (2016). The relationship between shoreline armoring and adjacent submerged aquatic vegetation in Chesapeake bay and nearby Atlantic coastal bays. Estuar. Coast. 39 (1), 158–170. doi: 10.1007/s12237-015-9970-2
Pelnard-Considere R. (1956). Essai de theorie de l’evolution des forms de rivage en plages de sable et de galets. Les Energies la Mer 1, 13–15. Available at: http://resolver.tudelft.nl/uuid:c6e1ce87-23ef-4a3d-86d0-47f3c96518cc
Pinto C. A., Taborda R., Andrade C., Baptista P., Silva P. A., Mendes D., et al. (2022). Morphological development and behaviour of a shoreface nourishment in the Portuguese western coast. J. Mar. Sci. Eng. 10, 146. doi: 10.3390/jmse10020146
Robinet A., Idier D., Castelle B., Marieu V. (2018). A reduced-complexity shoreline change model combining longshore and cross-shore processes: the LX-shore model. Environ. Model. Soft. 109, 1–16. doi: 10.1016/j.envsoft.2018.08.010
Roelvink D., Huisman B., Elghandour A., Ghonim M., Reyns J. (2020). Efficient modeling of complex sandy coastal evolution at monthly to century time scales. Front. Mar. Sci. 7, 535. doi: 10.3389/fmars.2020.00535
Roelvink D., Reniers A. (2012). A guide to modelling coastal morphology (Singapore: World Scientific).
Silva A. P., da Silva G. V., Strauss D., Murray T., Tomlinson R. (2021). Updrift morphological impacts of a coastal protection strategy how far and for how long? Mar. Geol. 441, 106625. doi: 10.1016/j.margeo.2021.106625
Vaidya A. M., Kori S. K., Kudale M. D. (2015). Shoreline response to coastal structures. Aquat. Proc. 4, 333–340. doi: 10.1016/j.aqpro.2015.02.045
Keywords: shoreline evolution, recovery ability, structure removal, numerical model, coastal resilience
Citation: Chi S, Zhang C and Zheng J (2023) Sandy shoreline recovery ability after breakwater removal. Front. Mar. Sci. 10:1191386. doi: 10.3389/fmars.2023.1191386
Received: 23 March 2023; Accepted: 04 May 2023;
Published: 17 May 2023.
Edited by:
Jose A. Jimenez, Universitat Politecnica de Catalunya, SpainReviewed by:
Edgar Mendoza, National Autonomous University of Mexico, MexicoDano Roelvink, IHE Delft Institute for Water Education, Netherlands
Christopher Koutitas, Aristotle University of Thessaloniki, Greece
Copyright © 2023 Chi, Zhang and Zheng. This is an open-access article distributed under the terms of the Creative Commons Attribution License (CC BY). The use, distribution or reproduction in other forums is permitted, provided the original author(s) and the copyright owner(s) are credited and that the original publication in this journal is cited, in accordance with accepted academic practice. No use, distribution or reproduction is permitted which does not comply with these terms.
*Correspondence: Chi Zhang, zhangchi@hhu.edu.cn