Physical properties and in situ geoacoustic properties of seafloor surface sediments in the East China Sea
 Jingqiang Wang1,2 Guangming Kan1,2 Guanbao Li1,2
  Xiangmei Meng1,2* Linqing Zhang1,2 Mujun Chen1,2 Chenguang Liu1,2 Baohua Liu2,3
- 1Key Laboratory of Marine Geology and Metallogeny, First Institute of Oceanography, Ministry of Natural Resources, Qingdao, Shandong, China
- 2Laboratory for Marine Geology, Laoshan Laboratory, Qingdao, Shandong, China
- 3National Deep Sea Center, Ministry of Natural Resources (MNR), Qingdao, Shandong, China
Seafloor sediment acoustics is a burgeoning field of marine scientific research. In situ measurement technique is a key technique for investigating sediment acoustic properties. Establishing a correlation between in situ acoustic parameters and physical parameters is of great scientific significance for advancing the theory of seafloor acoustics. This study employed an in situ sediment acoustic measurement system to measure the sound speed and attenuation of various types of sediment, such as sand, silty sand, silty clay, and clayey silt. The results showed that in situ sound speed and attenuation were strongly curvilinear correlated with physical properties, such as wet bulk density, porosity, and mean grain size. Empirical regression relationships between in situ acoustic properties and physical properties were derived. These findings supplement the in situ measurement data of acoustic properties of seafloor sediments, compensate for the lack of an empirical relationship of in situ attenuation in previous studies, and broaden the predicting theory and method of the acoustic properties of seafloor sediments.
Introduction
Seafloor sediment acoustics is a frontier and hotspot of marine acoustics and marine geology research. In situ measurement of the acoustic properties of seafloor sediment (including sound speed and attenuation) is a key technical approach for investigating marine sediment acoustics. Correlating the acoustic properties and the physical properties of seafloor sediment is of great scientific significance for refining the theory of seafloor acoustics. Since the 1970s, the correlation between the acoustic and physical properties of seafloor sediment has been a focus of seafloor acoustic studies (Chaytor et al., 2022). The empirical equation describing the correlation between acoustic properties and physical properties is akin to constructing a bridge between acoustic parameters and physical properties (Dumke and Berndt, 2019), which can be used to predict acoustic parameters based on physical property parameters and to invert physical parameters from acoustic parameters to classify sediments. Therefore, the correlation between the acoustic and physical properties of seafloor sediment has an important application value in the fields of marine acoustics and marine geophysics.
Generally, the correlation between the acoustic and physical properties of seafloor sediment is mainly constructed through statistical analysis and regression of numerous data. Since the main measurement methods of seafloor acoustic properties include laboratory measurement and in situ measurement, seafloor research on the correlation between acoustic properties and physical properties also includes two main methods that are based on laboratory measurement data and in situ measurement data. In terms of laboratory measurement research, Hamilton (1980) obtained numerous sediment acoustic parameters through laboratory measurement and combined them with the depositional environment. According to the sedimentary environment, empirical equations for the correlation between the sound speed, attenuation, and physical parameters, such as the porosity, density, and grain size of sediments in different types of marine areas, including continental terraces, abyssal plains, and abyssal hills, were established. Orsi and Dunn (1991); Lu et al. (2010); Arthur et al. (2013); Hou et al. (2015); Kim et al. (2018), and Li et al. (2021a) also analyzed laboratory measurement data. The empirical equations for predicting acoustic properties based on physical properties have been established in many marine areas around the world. Among the above series of empirical equations, the empirical equation constructed by Hamilton and Bachman (1982) has usually been used as the main equation for comparison in subsequent studies. Hereafter referred to as the H&B equation, studies have found varying degrees of difference between the Hamilton and Bachman (H&B) equation and other empirical equations. Hamilton (1971) proposed using the sound speed ratio instead of the sound speed under the same conditions to account for the sound speed in seafloor sediment being affected by temperature and pressure. Bachman (1989) further improved the H&B equation by using the sound speed ratio. Hamilton (1972) proposed an empirical correlative curve between acoustic attenuation and physical properties, but due to the difficulty in obtaining an accurate sediment attenuation by the laboratory measurement method, research on the empirical relationship between attenuation and physical properties is still scarce.
With the development of the in situ sediment acoustic measurement system, more in situ data are being used to determine the correlation between the seafloor’s acoustic properties and physical properties. Jackson and Richardson (2007) constructed correlations between the in situ sound speed and in situ attenuation factor with physical properties, which will be referred to as the R&B equation hereinafter. Liu et al. (2013) and Li et al. (2021b) determined the correlation of the in situ sound speed and the in situ sound speed ratio with the physical properties of the seafloor sediment in the South Yellow Sea, respectively. Zhang et al. (2017) also used the in situ measurement method to construct the correlation equation between the in situ sound speed and the physical properties of the Qingdao offshore seafloor sediment. Megan et al. (2019) summarized the literature data and measured the in situ data using the acoustic coring system to construct a fitting formula for the sound speed ratio, porosity, and mean grain size. This analysis indicates that in situ measurement technology has higher accuracy in acquiring the sound speed and attenuation factor, however, research on the correlation between attenuation and physical properties is still scarce. For example, Liu et al. (2013) found that the attenuation and physical properties are relatively disconnected, and no good correlation holds between the two properties. In addition, compared with the laboratory measurement study, the data reported by the in situ measurement study are still relatively scarce, and more in situ measurement data must be supplied to construct a reliable correlation equation.
This study utilized the newly developed Ballast In Situ Sediment Acoustic Measurement System (BISSAMS) to obtain in situ sound speed and attenuation data from 48 seafloor sediment stations in the East China Sea shelf area. Physical properties were measured by collecting sediment samples. An empirical fitting formula was constructed based on the correlation between the in situ attenuation and physical properties, which was then compared with existing empirical relational equations to expand and improve the seafloor sediment acoustic property prediction method system.
Data and methods
The research data was collected during spring and autumn voyages in 2021, funded by the National Natural Science Foundation of China Open Research Cruise (Cruise No. NORC2021-02+NORC2021-301). The data included the in situ sound speed, in situ sound speed ratio, and in situ attenuation, as well as the wet density, porosity, mean grain size, median grain size, sand content, and clay content obtained from sediment samples. Three typical measurement areas (A, B and C in Figure 1) were selected in the East China Sea shelf area, representing silty sand, fine sand, and clay silt, respectively. The water depths of the survey areas ranged from 26-103 m, with area A located in the northern part of the East China Sea shelf (61-74 m), area B in the middle of the East China Sea shelf (76-103 m), and area C close to the coast of Fujian and Zhejiang in mainland China (26-76 m). Each survey area contained sixteen survey stations, for a total of 48 stations, arranged in a 4×4 grid with equal spacing.
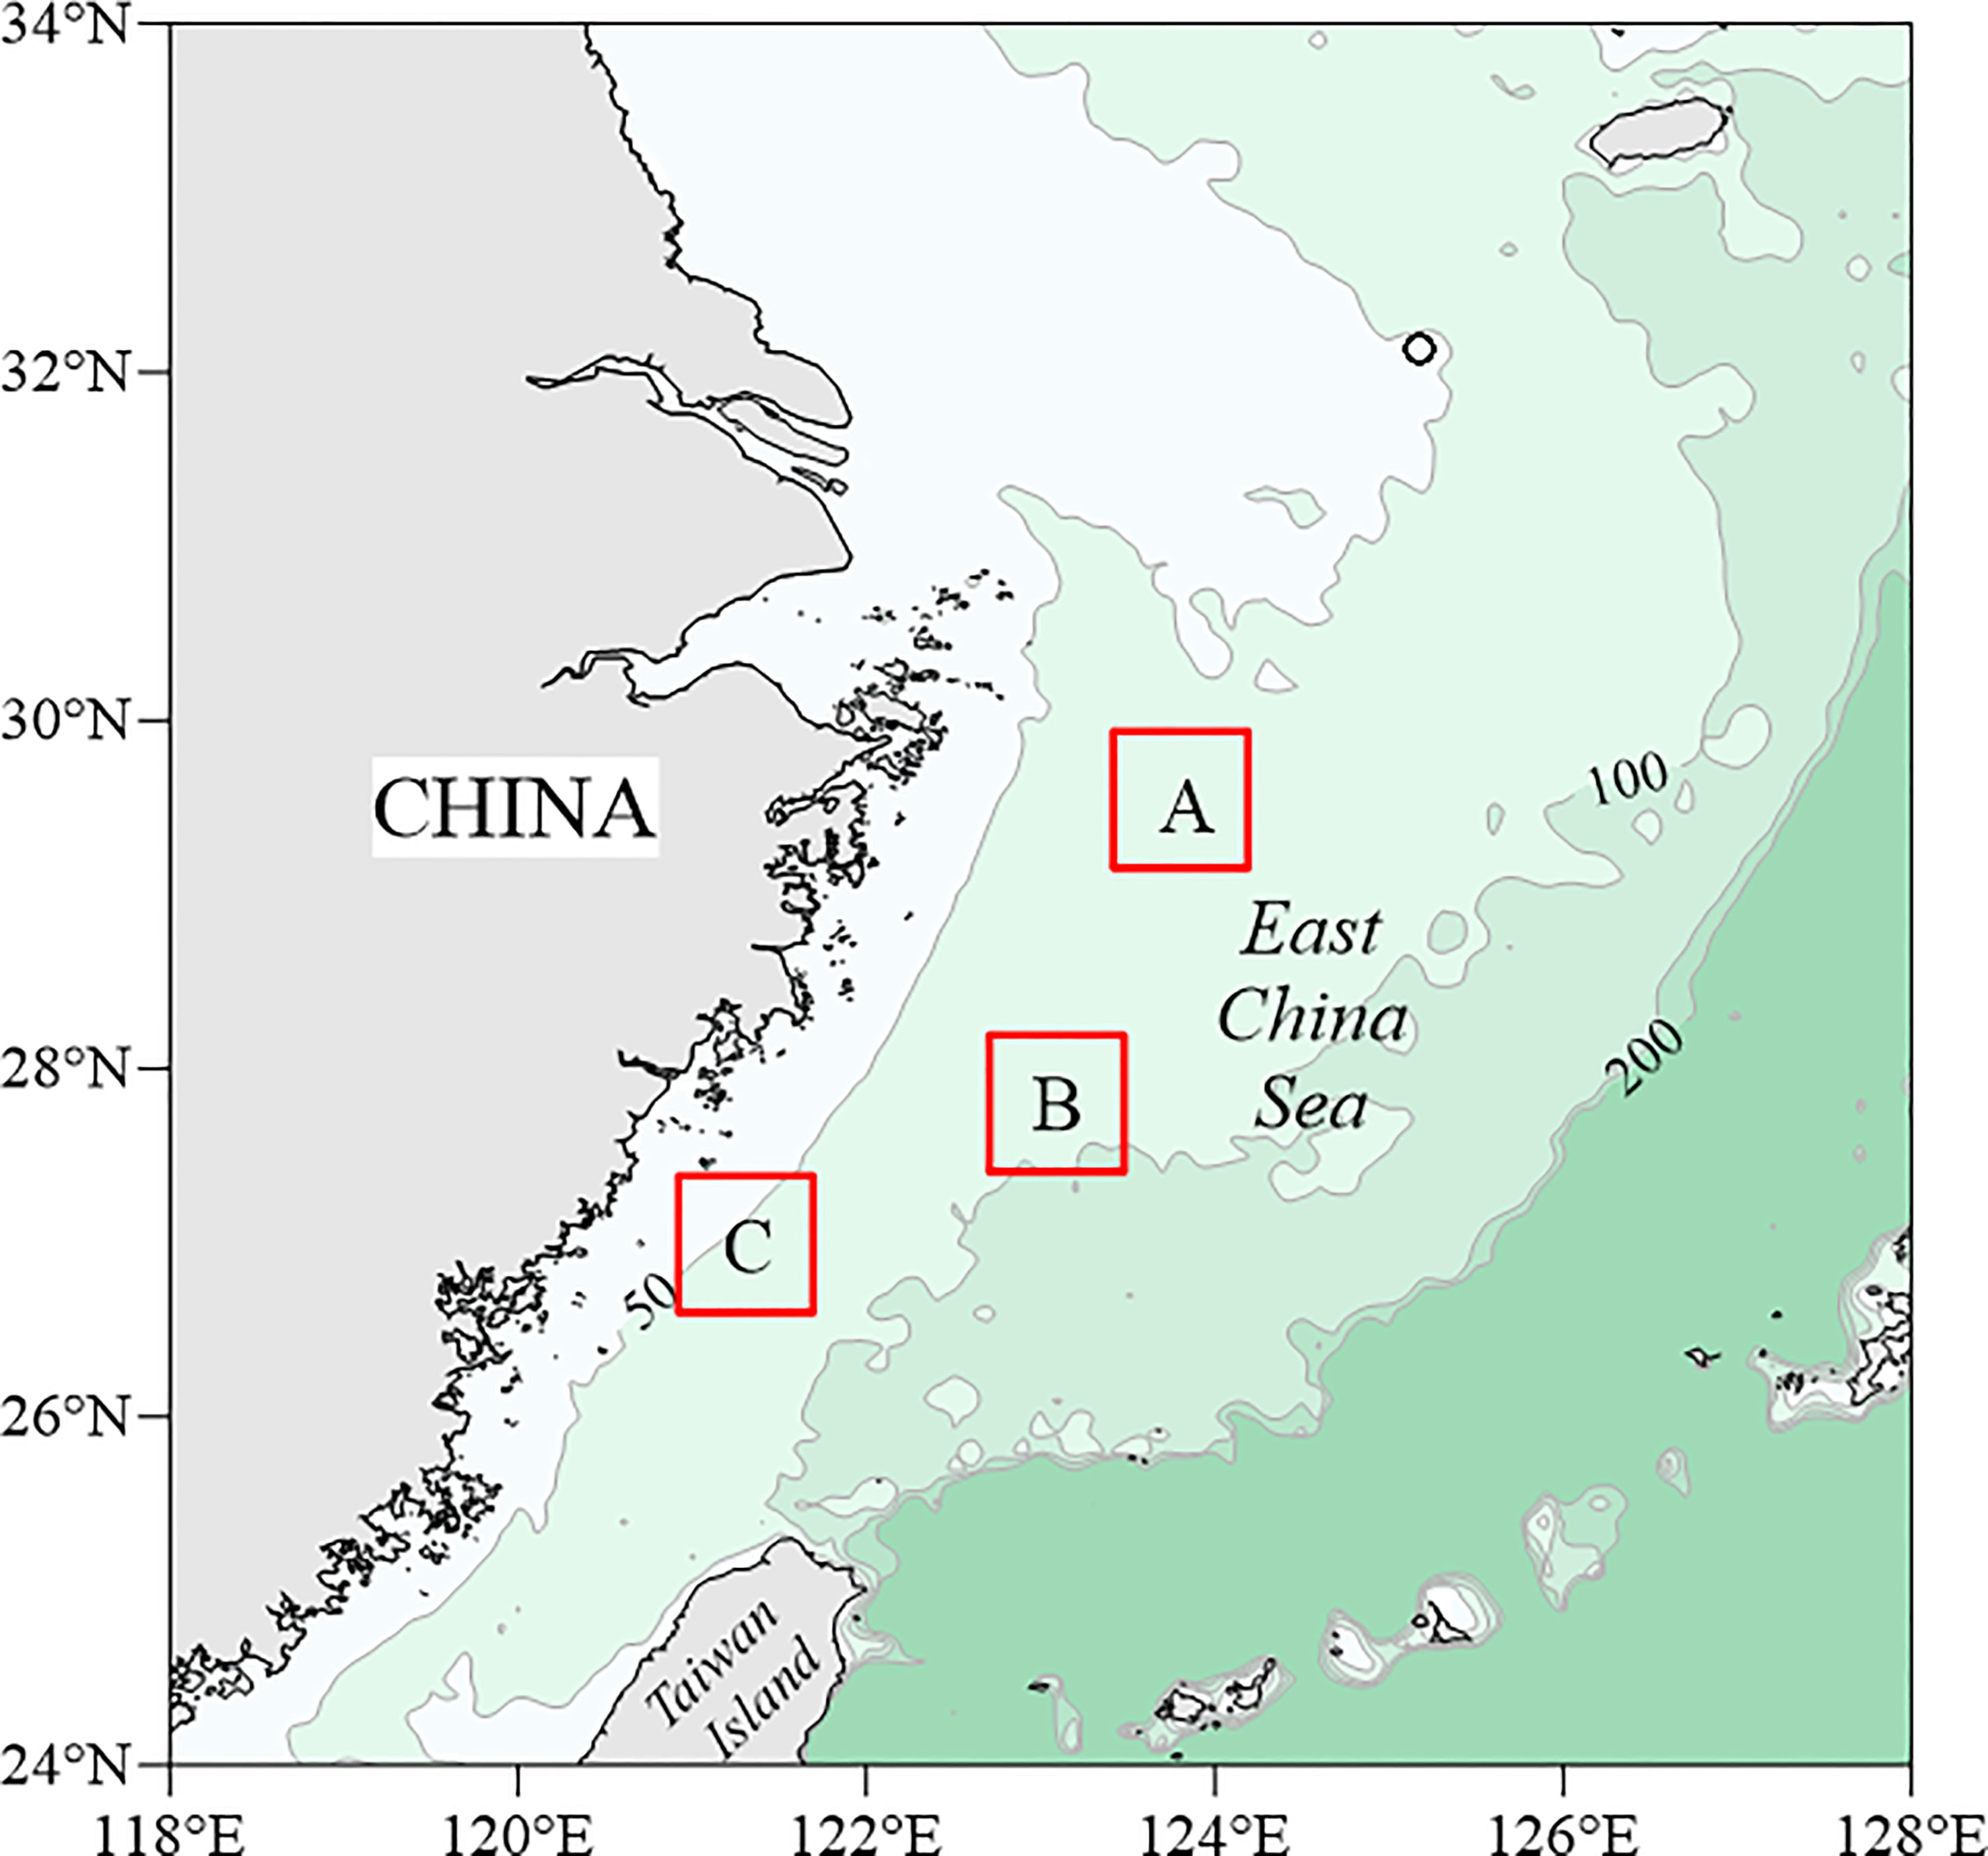
Figure 1 Distribution of the three study areas.
The measurement of seafloor sediment acoustic properties is conducted using BISSAMS, which was previously described in detail in Wang et al. (2018); Li et al. (2019), and Wang et al. (2020). This technology is capable of measuring in situ sound speed and attenuation at a depth of 80 cm below the seafloor, using a 30 kHz central frequency and a 10 MHz sampling frequency. The sound wave signal, which is excited by the transmitting transducer, passes through the sediment and is received by three receiving transducers. To reduce measurement error, the average value of the three channels is used. Figure 2 shows the acoustic signals collected by in situ measurement in three types of sediments. These waveforms demonstrate that, with increasing receiving distance, the acoustic travel time increases approximately linearly, and the acoustic amplitude gradually weakens. Using the same transmitting and receiving parameters, the acoustic signal of coarse-grained sediments is considerably weaker than that of fine-grained sediments. The acoustic signal of the channel indicates that the acoustic wave passing through the coarse-grained sediment has a more substantial energy attenuation phenomenon.
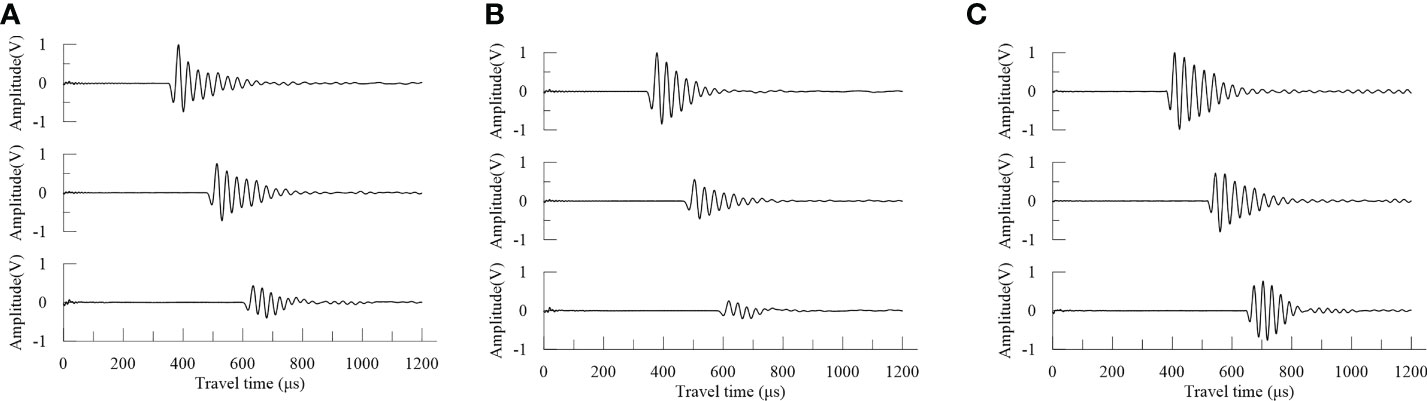
Figure 2 Acoustic signals collected from different types of sediments (A) silty sand in area A; (B) sandy sediment in area B; (C) silty clay and clayey silt in area C.
The sound speed and attenuation can be calculated by using the travel time difference and amplitude difference of the three-channel received signal. The calculation formula for the seafloor sediment sound speed is as follows:
In this formula, Vp (m/s) is the sound speed of the sediment; Vw (m/s) is the sound speed of the bottom seawater, which is determined by measuring the sound speed profile; d is the distance between the transmitting transducer and different receiving transducers; and tp and tw (s) are the time required for the acoustic waves to reach the three receiving transducers in the sediment and the seawater, respectively. tp and tw were calculated using the cross-correlation method.
The attenuation calculation formula for seafloor sediment is as follows:
where αp (dB/m) is the sediment attenuation; l (m) is the distance from the transmitting transducer to the three receiving transducers; and Ap and Aw are the peak amplitudes of the signals in the sediment and seawater collected by the same channel, respectively.
The ratio of sediment sound speed to the seawater sound speed under the same temperature and pressure conditions is defined as the sound speed ratio R, which is usually considered to remain constant (Hamilton, 1971; Zou et al., 2015). Thus, the measured value of the sediment sound speed can be corrected according to the seawater sound speed under different temperature and pressure conditions. During the measurement, the seawater sound speed profile was measured synchronously at each station, allowing for the accurate determination of the sound speed of seawater near-seafloor in consistency with the sediment temperature and pressure environment. The ratio of sediment sound speed to the seawater sound speed near-seafloor is the sound speed ratio R:
where Vpi is the sound speed of sediments under in situ temperature and pressure conditions on the seafloor and Vwi is the sound speed of seawater measured under in situ temperature and pressure conditions near the seafloor.
After conducting an acoustic test, the physical properties of the sample were measured, including particle composition, mean grain size, bulk density, and water content. The porosity of the sample was then calculated based on the particle density, bulk density, and water content. The ring knife method (inner diameter 6 cm, height 2 cm) was used to measure the sample density, while the drying method was used to measure the water content, which was determined by the ratio of the mass loss of the sample caused by drying to the mass of the sample after drying. The sieving method and the graphical method were employed to classify and name the samples. The three particle size values corresponding to d16, d50, and d84 were averaged as the mean grain size, and the particle size value corresponding to d50 was used as the median grain size. The Shepard taxonomy was used to name and classify the sediments.
Analysis of results
The study area is located in the widely distributed continental shelf region of the East China Sea. The sedimentary type is generally considered to be terrigenous, with the sediments mainly originating from the terrigenous debris of the mainland and surrounding island arcs, such as the Yangtze River. Based on the sampling site and particle size measurement results (Figure 3), the sediment samples in this area include sandy sediments, silty sand, silty clay, and clayey silt; they have no irritating odor, are mainly brownish yellow, and have plasticity, high water content, and a uniform structure. The test results of physical property parameters (Table 1) show that in area A, the wet density of the sediments is 1.84-2.01 g/cm3, with an average value of 1.95 g/cm3, and the porosity is 0.40-0.51, averaging 0.43. Sand content is 22.9-80.5%, averaging 62.83%; silt content is 5.2-56.9%, averaging 21.07%; clay content is 8.1-21.6%, averaging 15.82%; the mean grain size is 3.39-5.80ϕ, averaging 4.39ϕ; and the median grain size is 1.95-5.27ϕ, averaging 3.14ϕ. In area B, the sediment wet density is 1.86-2.02 g/cm3, averaging 1.97 g/cm3; the porosity is 0.38-0.48, averaging 0.41; the sand content is 68.3-89.8%, averaging 78.08%; the silt content is 4.1-19.9%, averaging 12.71%; the clay content is 3.8-15.1%, averaging 9.27%; the mean grain size is 2.18-4.20ϕ, averaging 3.29ϕ; and the median grain size is 1.93-2.97ϕ, averaging 2.60ϕ. In area C, the sediment wet density is 1.53-1.77 g/cm3, averaging 1.66 g/cm3; the porosity is 0.55-0.69, averaging 0.62; the sand content is 0.3-5.3%, averaging 2.03%; the silt content is 40.2-77.0%, averaging 58.96%; the clay content is 19.1-57.0%, averaging 38.96%; the mean grain size is 6.24-8.42ϕ, averaging 7.15ϕ; and the median grain size is 5.43-8.26ϕ, averaging 7.06ϕ. The physical properties of the sediments in the three study areas are quite different. Sediments in area B are mainly sandy sediments, with relatively coarse grain size, high density, and low porosity characteristics; sediments in area C are dominated by clayey silt and silty clay sediments, with relatively fine grain size, low density, and high porosity characteristics; sediments in area A are dominated by silty sand, and their properties are between those of areas B and C.
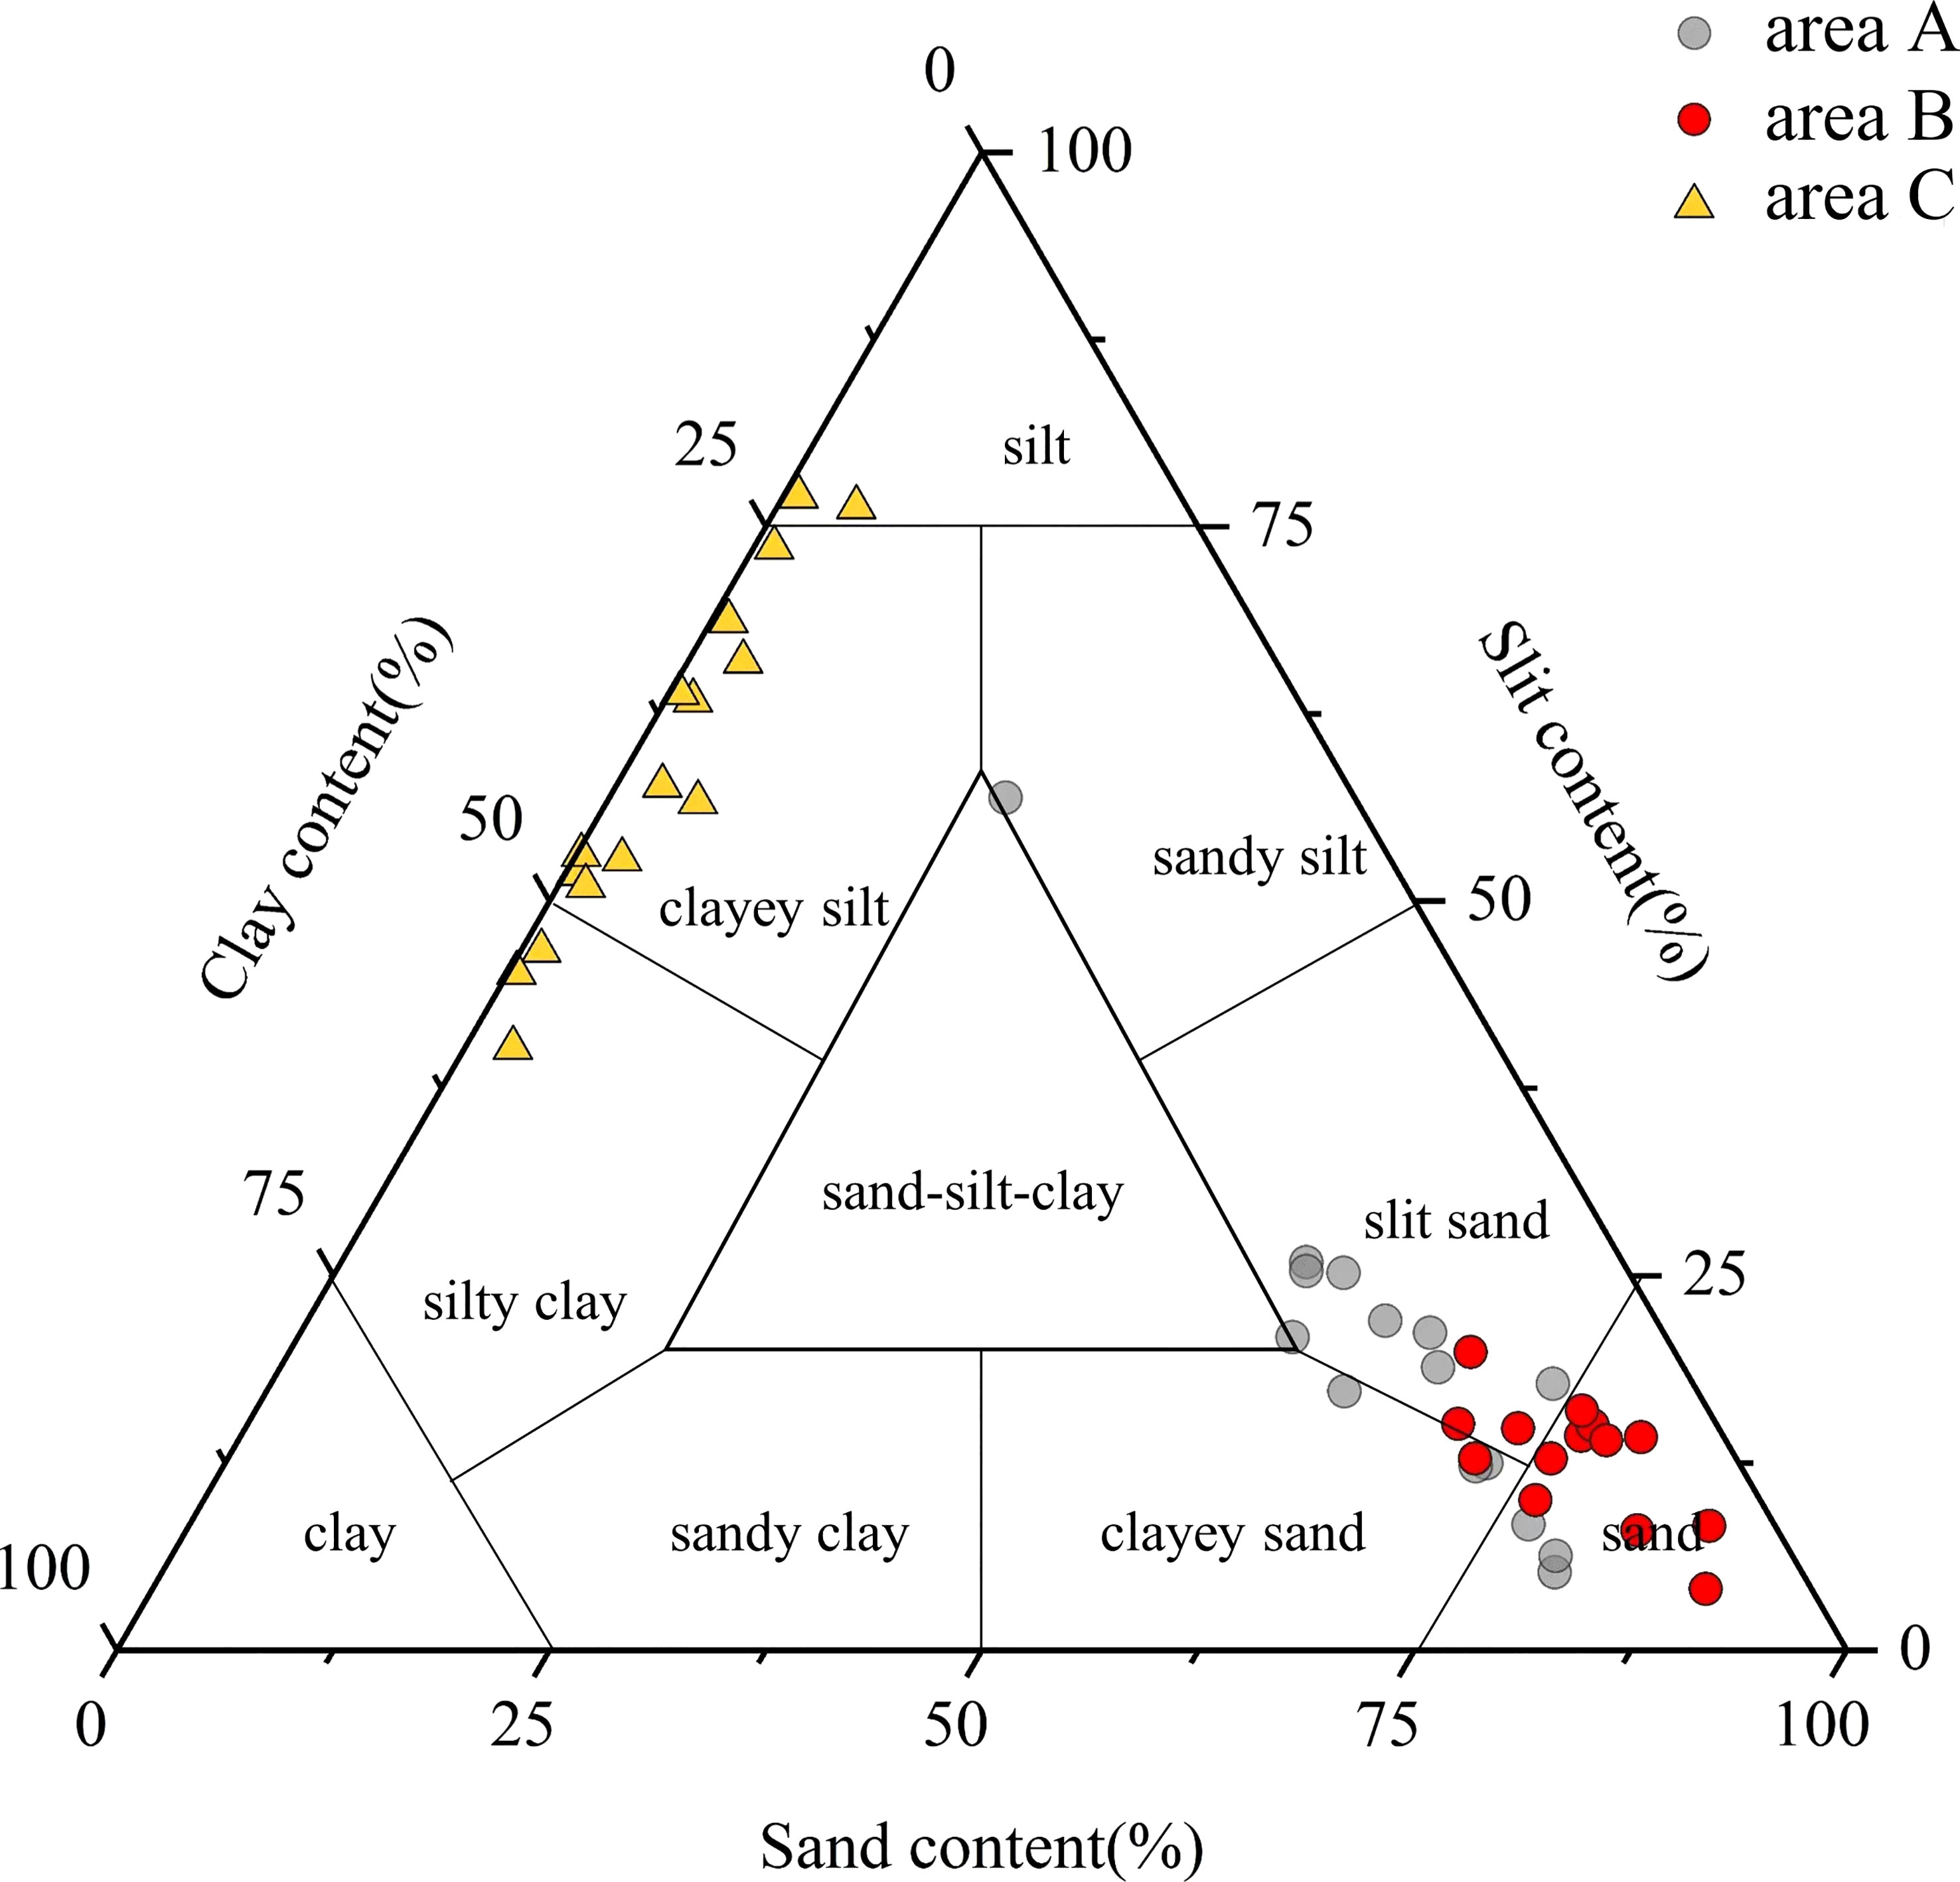
Figure 3 Sediment types in the study area (according to the Shepard classification).
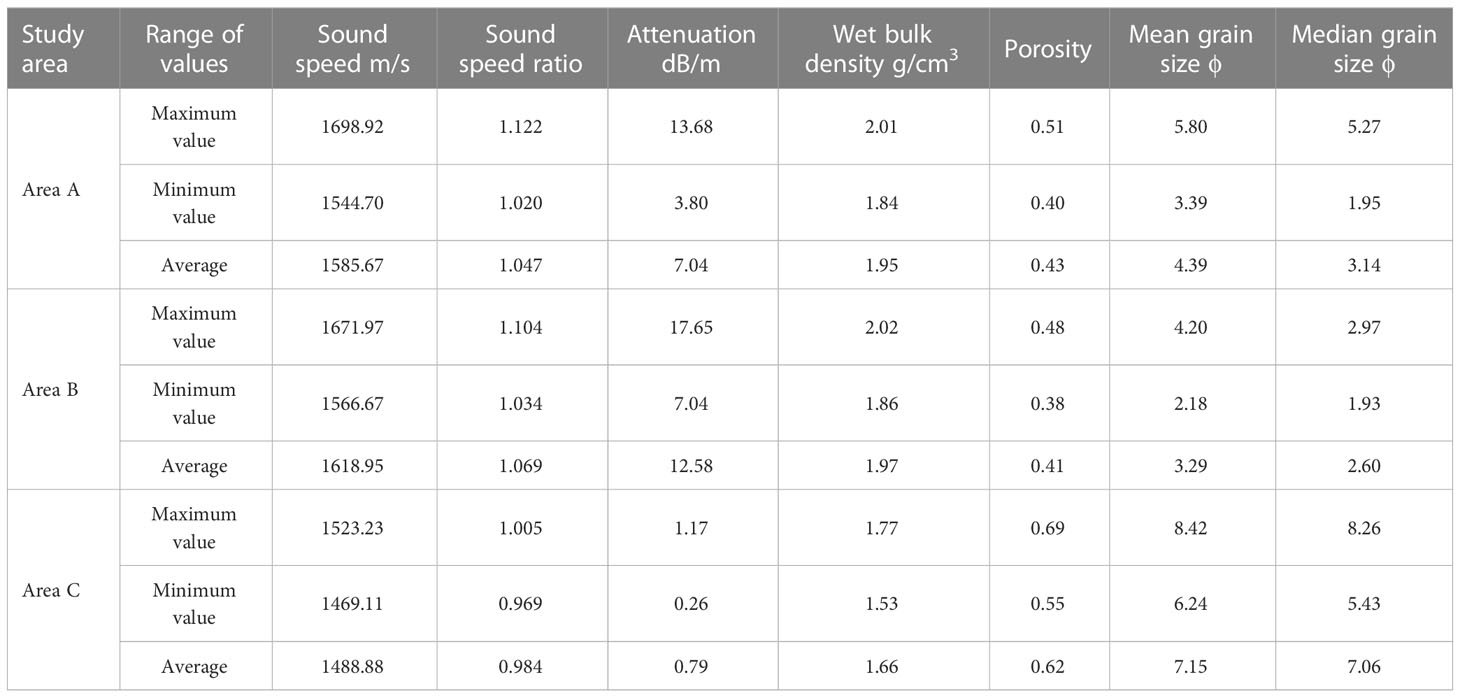
Table 1 Measured results of seafloor sediment acoustic and physical properties.
The seafloor sediment acoustic characteristic test results (Table 1) indicate that the in situ sound speed of sediments in area A ranges from 1544.70 to 1698.92 m/s, averaging 1585.67 m/s; the in situ sound speed ratio, 1.020 to 1.122, averaging 1.047; and the in situ attenuation, 3.80 to 13.68 dB/m, averaging 7.04 dB/m. The in situ sound speed of the sediment in area B ranges from 1566.67 to 1671.97 m/s, averaging 1618.95 m/s; the in situ sound speed ratio, 1.034 to 1.104, averaging 1.069; and the in situ attenuation, 7.04 to 17.65 dB/m, averaging 12.58 dB/m. The in situ sound speed of sediments in area C ranges from 1469.11 to 1523.23 m/s, averaging 1488.88 m/s; the in situ sound speed ratio, 0.969 to 1.005, averaging 0.984; and the in situ attenuation, 0.26 to 1.17 dB/m, averaging 0.79 dB/m. The acoustic properties of the sediments in the three study areas were found to be distinct. The sediments in Area B exhibited high sound speed and high attenuation; those in Area C had low sound speed and low attenuation, while those in Area A had properties that were intermediate between those of Areas B and C. The sound speed ratio of the sediments in Area C was less than 1, indicating low sound speed. This analysis suggests that the compressibility and stiffness of the pore fluid, mineral particles, and mineral skeleton are determinants of sound speed propagation, as sediments with high water content and high porosity have lower stiffness and higher compressibility (Dall'Osto and Tang, 2022). The bulk modulus of the sediment is close to that of seawater, but its higher density results in a lower sound speed than that of seawater, leading to the phenomenon of low sound speed sediments. A good correlation between sound speed and physical properties was observed, providing data support for constructing prediction equations of sound speed and attenuation based on physical properties.
Discussion
Curvilinear correlation between sound speed and the physical properties of sediments
The curvilinear correlation between sound speed and physical properties of seafloor sediment has long been a major component of seafloor sediment acoustics research. Regression analysis of sound speed and physical properties parameters was conducted using the least squares method to establish an empirical model, which can provide an effective means for sound speed prediction and seafloor parameter inversion. In the 1980s, Hamilton and Bachman (1982) sampled numerous sediments and conducted acoustic measurements on them, while also performing statistical analysis with data obtained in the past. Based on the depositional environment of the sediments, they established an empirical relationship between the sound speed and physical properties of sediments from a continental terrace, abyssal plains, and abyssal hills (H&B equation). The empirical relationship between the sound speed ratio and the physical properties of sediments from the continental terrace (for the convenience of subsequent comparison with the measured data in this study) was obtained as follows (Bachman, 1989):
Where ρ is density, n is porosity, and Mz is the mean grain size (ϕ value). Although the H&B equation has been widely used, recent comparative studies on measured data and models in many marine areas have found that this empirical model has limitations in its application (Kim et al., 2011; Li et al., 2021a; Li et al., 2021b).
Richardson and Briggs (2004) established in situ regression equations based on in situ measured data at 38 kHz or 58 kHz using ISSAMS (R&B equation)(Jackson and Richardson, 2007). The equations of the sound speed ratio R versus the wet bulk density ρ, porosity n, and mean grain size Mz are listed as follows:
In this study, the measured data are compared with the H&B equation and the R&B equation to explore the curvilinear correlation between the sound speed ratio and the physical properties of sediments and to construct an empirical fitting formula. Figure 4 shows the sediment sound speed and the correlation between the sound speed ratio and density, porosity, mean grain size, median grain size, sand content, and clay content. Table 2 lists the fitting formulae for sound speed ratio, density, and other physical properties of sediments. Except for the clay content, the sound speed ratio is related to the physical properties. All coefficients are higher than 0.80, indicating high correlations.
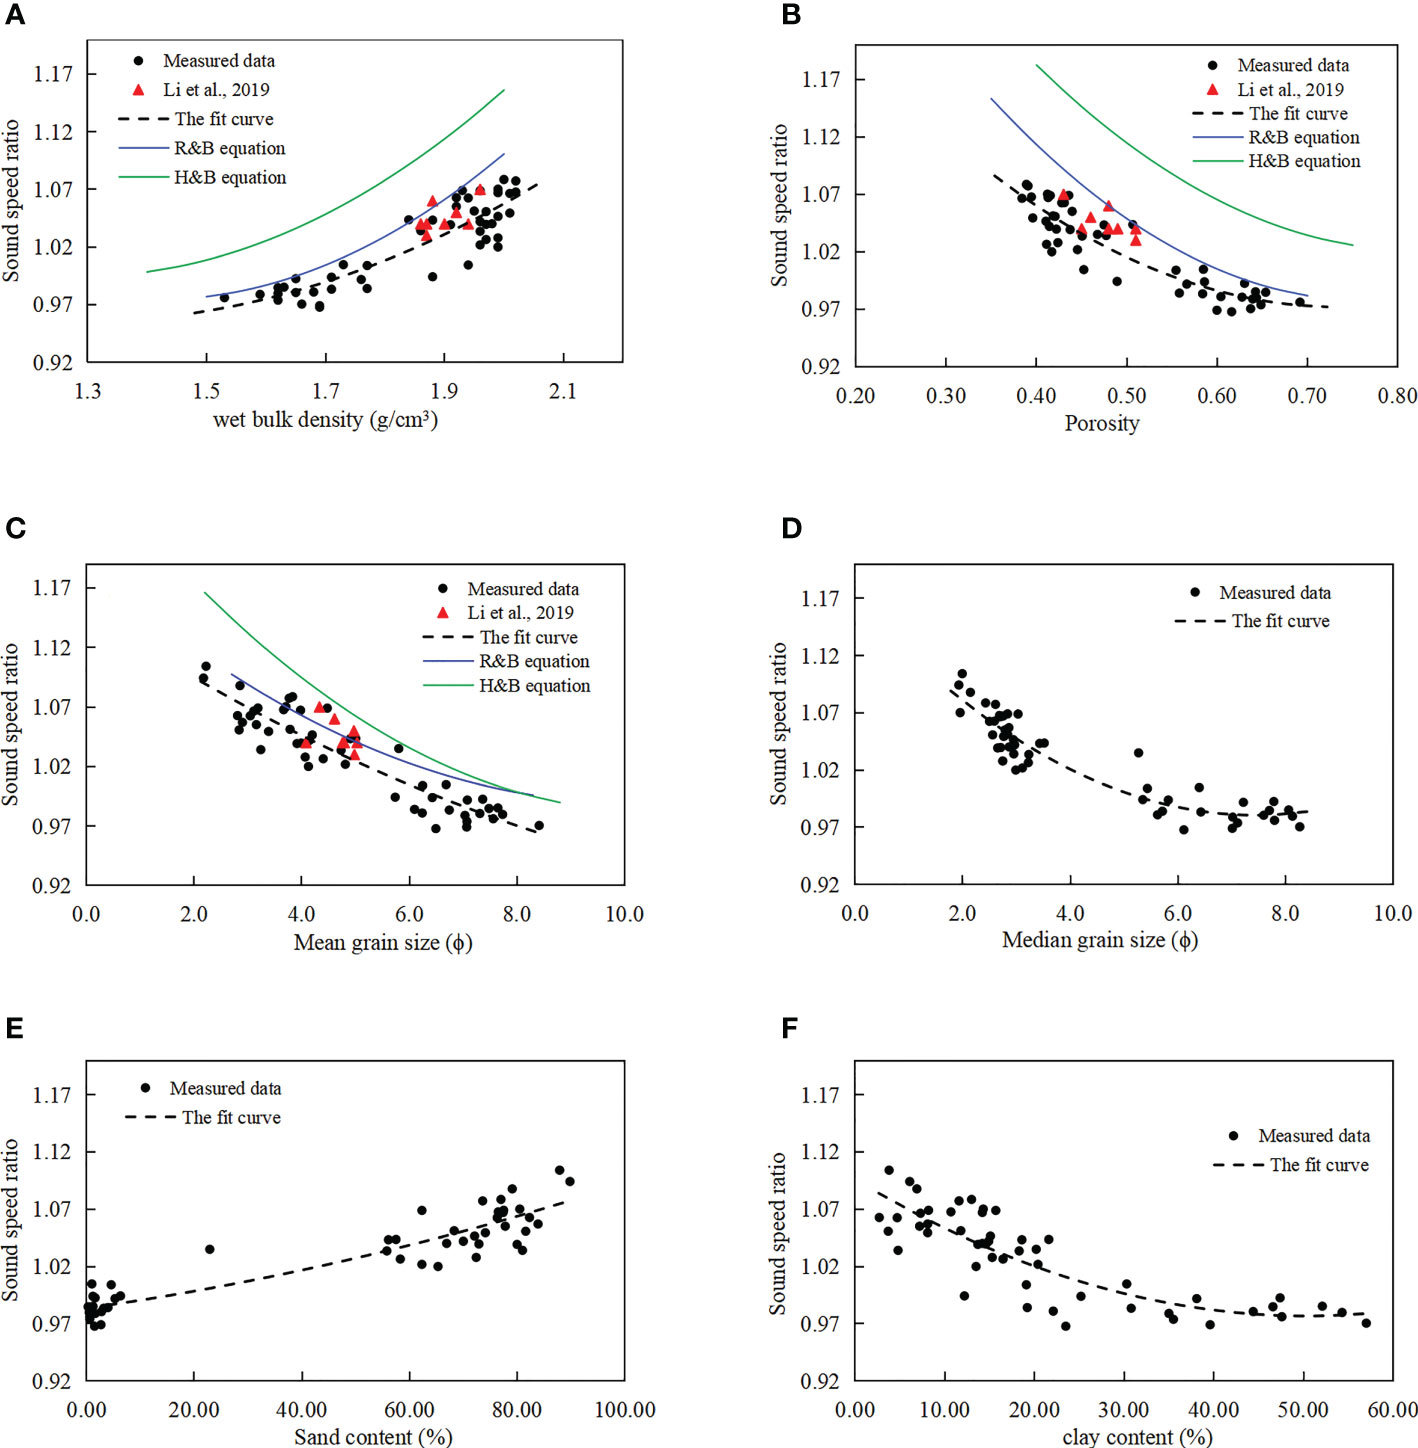
Figure 4 Correlation between the sound speed ratio and the physical properties of sediments. (A. Correlation between the sound speed ratio and the wet bulk density; B. Correlation between the sound speed ratio and the porosity; C. Correlation between the sound speed ratio and the mean grain size; D. Correlation between the sound speed ratio and the median grain size; E. Correlation between the sound speed ratio and the sand content; F. Correlation between the sound speed ratio and the clay content.)
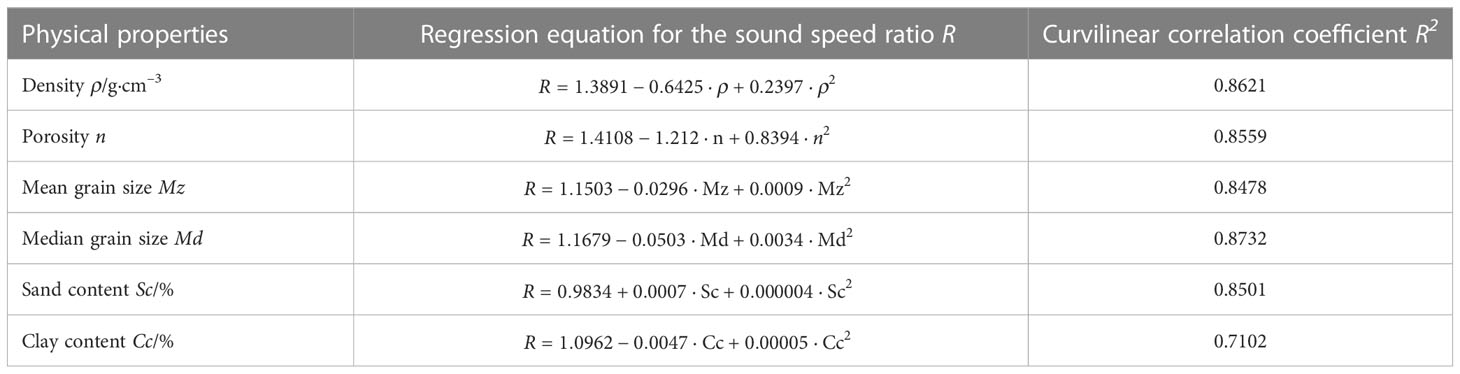
Table 2 Fitting formula for the curvilinear correlation between the sediments’ sound speed ratio and physical properties.
Saturated seafloor sediment is composed of particles and pore water and exhibits the characteristics of a two-phase medium (Jackson and Richardson, 2007). Wet bulk density and porosity indicate the ratio of particle specific gravity and pore water and the degree of compaction. When a sound wave passes through the sediment, both the particles and pore water transmit the sound wave. Therefore, the sound speed of sediment is closely related to density and porosity. Figures 4A, B demonstrate that the sound speed ratio of sediment increases with increasing density and decreasing porosity. Comparing the measured data and the empirical model reveals that the sound speed ratio of the sediments in the study area is in good agreement with the R&B equation, but is higher than the H&B equation result. This study also found that the sound speed ratio predicted by the H&B equation is usually higher than the measured value. This discrepancy is likely due to the difference between the acoustic measurement technology and the physical property measurement technology (Jackson and Richardson, 2007). Imperfections in the measurement technology and data processing standards of Hamilton and other early works may lead to large errors in the measurement results. With the advancement of technology in the past decade, the empirical formula has been gradually improved based on new measurement data, while Hamilton’s concept of constructing an empirical equation remains essential. This comparison also shows that the measured data in the East China Sea are slightly lower than the predicted result of the R&B equation, with an overall difference of approximately 0.02-0.05 (the contrast between the solid color line and the black dotted line of Figure 5A, B blue). The difference increases with increasing density and decreases with increasing porosity. This comparison result is comparable to that of Li et al. (2021b) in the South Yellow Sea. Similarly, the predicted results in the high density and low porosity intervals have a large difference with the measured data. This difference may be attributed to two causes. One is that the sediment density and porosity are collected in the laboratory after sample collection. During the measurement, disturbances in the sample collection and measurement process can lead to measurement errors in physical properties. Another cause may be related to the R&B equation. The research object includes siliceous deposits and carbonate calcareous deposits. Generally, the porosity of siliceous sediments is believed to be larger than that of calcareous sediments, which may also lead to larger discrepancies between the empirical equations.
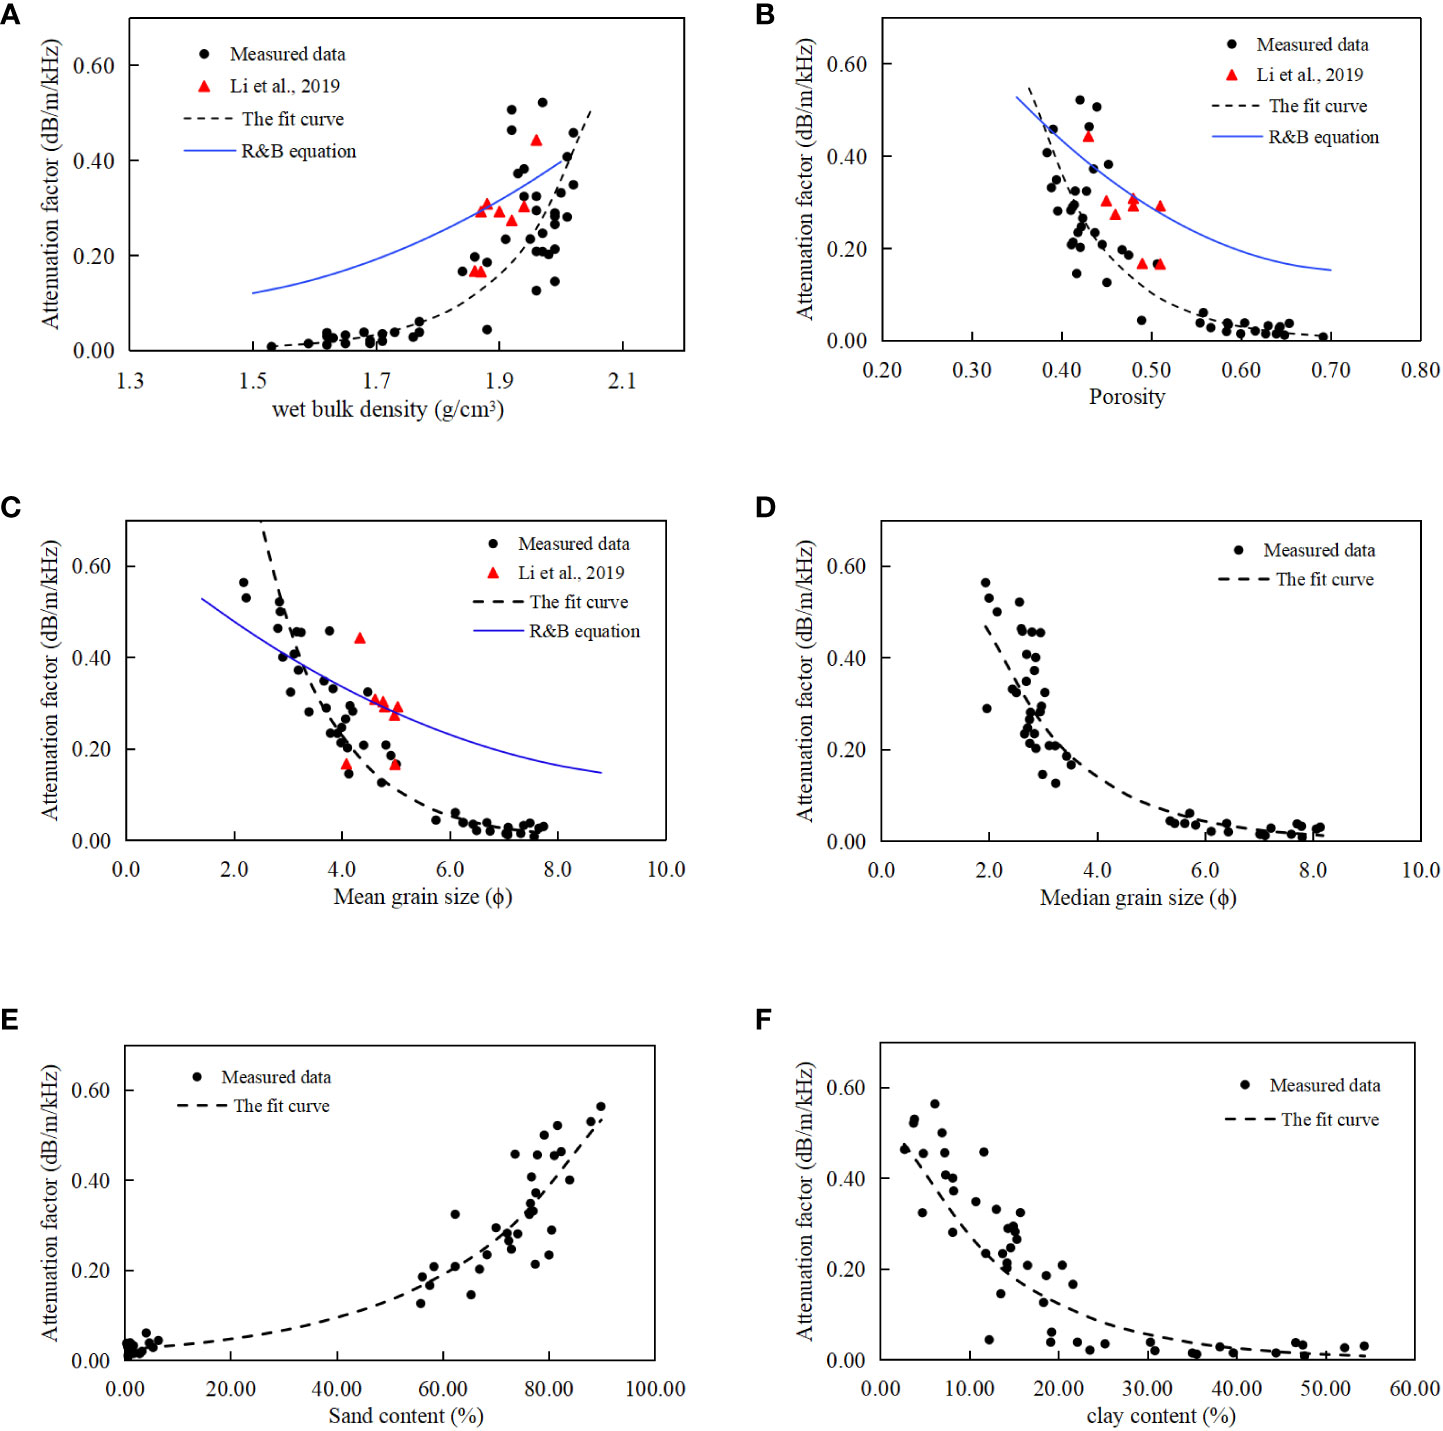
Figure 5 Correlation between the attenuation and the physical properties of sediments. (A. Correlation between the attenuation and the wet bulk density; B. Correlation between the attenuation and the porosity; C. Correlation between the attenuation and the mean grain size; D. Correlation between the attenuation and the median grain size; E. Correlation between the attenuation and the sand content; F. Correlation between the attenuation and the clay content.)
The particle size of seafloor sediment remains unchanged throughout the sampling and testing processes, making it an effective indicator for predicting sound speed and classifying sediments. The sound speed ratio of sediments decreases with increasing mean grain size ϕ value, and a good curvilinear correlation between the sound speed ratio and the mean grain size is observed. The measured sound speed ratio of the sediment is lower than the prediction of the H&B equation (Figure 4C, but closer to the predictions of the R&B equation. This difference is attributed to the simplified properties of the mean grain size itself. In the natural state, seafloor sediment composition is heterogeneous, ranging from gravel to clay, and thus the medium is usually considered homogeneous for simplification, with the average value of a certain particle size component (e.g. mean grain size) used as a parameter for the composition of all sediment particles. Comparisons between medium sand with good sorting, silty clay and clayey silt with poor sorting, and the sandy mud mixture with extremely poor sorting, revealed that sediments with the same mean grain size but different sorting degrees have different sound velocities (Richardson and Briggs, 2004). Therefore, using the mean grain size to predict the sound speed of sediments has certain limitations. The fitting equation between the empirical equation and the measured data essentially maintains a systematic difference of 0.02 throughout the mean grain size range (the contrast between the blue solid line and black dashed line in Figure 5C, which was also confirmed in Li et al. (2021b). The median grain size is also an important indicator of particle size, and a strong correlation between the sound speed ratio and median grain size is observed (Figure 5D). Furthermore, Figures 5E, F show that the sound speed ratio of sediments increases with the sand content and decreases with increasing clay content, with the correlation between the sound speed ratio and the sand content being better than that of the clay content.
Measurements from different periods in the same marine area are more meaningful for comparison. Li et al. (2019) reported in situ sound speed and attenuation measurements in sandy sediments in the East China Sea in 2017, using the same method as this paper. As the in situ measurement equipment was located in the East China Sea shelf area, these published measurements were compared with the measured data and empirical equations in this paper, including in situ sound speed, original in situ attenuation, density, porosity, mean grain size, and other physical property data. The comparison results showed that the measured data for these two periods were in good agreement. The data published in the literature were consistent with the empirical equation constructed in the present study, compared to the H&B equation and R&B equation. Although the measured data collected in these two periods had a slight error, this may have been due to the sample collection process. According to Li et al. (2019), the sample collection process was simultaneous to the in situ measurement process. The in situ measurement system was used to collect sediment samples for laboratory measurement. This study collected the sediment samples using a sediment sampler after in situ acoustic measurement was performed. The sediments studied through in situ acoustic measurement and the sediments in the sample collection may have had a slight error, which may have caused the error in the results of the two measurement experiments.
To further confirm the application of these correlations in other sea areas, sediment acoustic data or correlation results have been collected. Figure 4A shown the correlation result established in Li et al. (2021b) in South Yellow Sea (Orange solid line) and the measured data published by Bae et al. (2014) (Red ∗points). Both the correlation line of Li et al. (2021b) and the data of Bae et al. (2014) match well to the empirical equation in this study. Therefore, the general application of the correlations established in this study to analyze seafloor sediments in other sea areas was further confirmed.
Curvilinear correlation between sediment attenuation characteristics and physical properties
Relative to the sound speed of sediments, research results on the correlation between the attenuation characteristics of sediments and physical properties are scarce. Since the attenuation characteristics are closely related to the measurement frequency, to compare the data and research results obtained by different frequency measurement techniques, Hamilton (1972) consistently maintained that attenuation in sediments obeys a frequency dependence of f1 with an attenuation factor k. In addition to the relationship between attenuation characteristics and physical properties reported by Hamilton (1972); Richardson and Briggs (2004) gave the exact regression fitting equations of the in situ acoustic attenuation characteristics and physical properties. The equations for the attenuation factor k (dB·m−1·kHz−1) versus the wet bulk density ρ, porosity n, and mean grain size Mz are listed as follows:
Equations (10) to (12) show that although the empirical regression formulas of the attenuation factor and density, porosity, and mean grain size are reported in the literature, their correlation coefficients are lower than 0.5, indicating a low correlation.
Figure 5 illustrates the curvilinear correlation between the sediment attenuation factor and porosity, mean grain size, median grain size, sand content, and clay content. Table 3 presents the fitting formulas between the sediment attenuation characteristics and physical properties such as density, excluding clay content. The correlation coefficients between the attenuation factor and the physical properties were higher than 0.80, indicating strong correlations. The correlation between the attenuation characteristics and the physical properties of sediments was significantly improved compared to the R&B equation. Previous research reports have found that the correlation between the acoustic attenuation characteristics of sediments and the physical properties is poor or relatively discrete, with no obvious correlation trend (Liu et al., 2013). This is likely due to the inconsistency of the measurement frequencies used by different studies, as the measured attenuation includes intrinsic attenuation and volume scattering from large particles or larger inhomogeneous bodies. For example, Jackson and Richardson (2007) summarized numerous studies and constructed the correlation of the attenuation factor with porosity and mean grain size using mainly laboratory measurement data at 400 kHz. The results indicated that the correlation coefficients of the regression fitting formula were only 0.10 and 0.19, respectively. Hamilton (1980) compiled different measurement data, including high-frequency laboratory measurement data and low-frequency in situ measurement data. The inconsistency of the attenuation measurement frequency may have caused the low correlation between the attenuation factor and the physical properties. Especially for high-frequency measurements at several hundred kHz, the mechanism of attenuation depends not only on physical properties such as pores and particles but also on the microstructure and inhomogeneity of the sediment medium. Therefore, the fitting formula constructed from high frequency attenuation characteristics and physical properties is generally considered to have no predictive value.
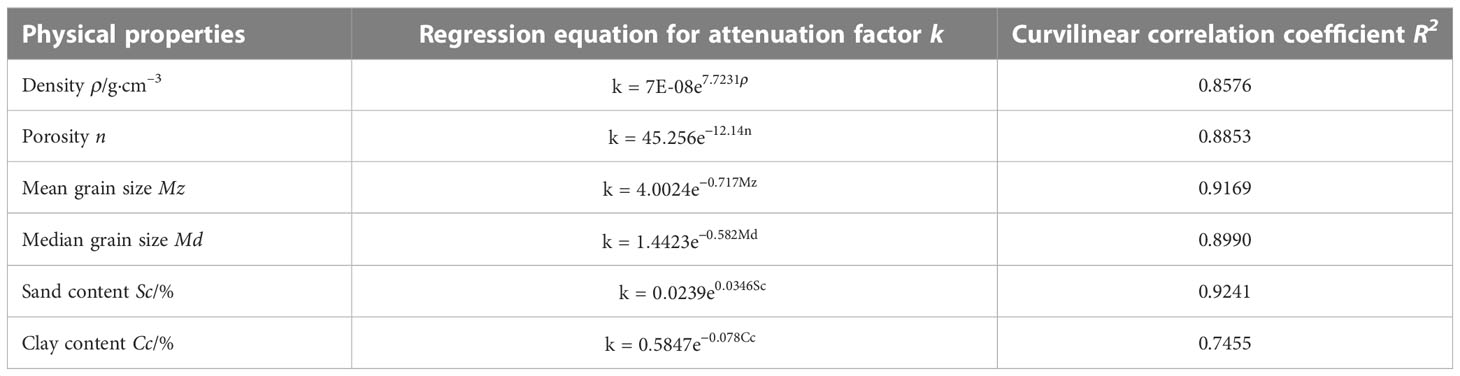
Table 3 Fitting formula for the curvilinear correlation between the attenuation characteristics and physical properties.
The in situ measurement data used in this study, collected at a frequency of 30 kHz, covered various sediment types with high accuracy. This data was generally considered to be the inherent attenuation of sediments, making the empirical fitting formula of attenuation–physical properties of research importance. The R&B equation, which also uses the in situ measurement data, is consistent with the results of this study, showing an increase in density and particle size, a decrease in porosity, and a gradual increase in sediment acoustic attenuation (Richardson and Briggs, 2004). This trend contradicts the conclusion of Hamilton (1972), who argued that acoustic attenuation is smaller in coarse sand and clay sediments and higher in fine sand and silt sediments. It also suggests that these studies’ conclusions are different depending on the attenuation measurement method. As analyzed above, the main reason for these differences is that the attenuation characteristics are highly dependent on the measurement frequency (Yang and Tang, 2017). Therefore, the fitting formula of attenuation and physical properties can only provide approximate empirical values, which should be used in conjunction with actual measurements.
In contrast to the R&B equation, the two fitting formulas demonstrate higher consistency in the prediction results for high density, low porosity, and coarse particle intervals. Li et al. (2019) provide an example of this. In the case of low wet bulk density, high porosity, and fine particle intervals, the attenuation characteristics measured in this study are lower than those predicted by the R&B equation. This can be attributed to the different sediment types used in the two studies. Richardson and Briggs (2004) studied two types of siliceous sediments and two types of calcareous sediments, which are generally believed to have relatively low density and high porosity, resulting in relatively high attenuation values when particle sizes are similar. This attribute may explain the deviation of the prediction results of the fitting formula from the measured results of siliceous sediments.
Additionally, the types of sediment covered in this study area are more varied, particularly in the low and high bulk density ranges, as described in this section. The porosity and fine particle intervals have more measurement samples than Richardson and Briggs (2004) in this physical property range, which may account for the difference between the two fitting formulas. Furthermore, this study also constructed a correlation between the sediment attenuation factor and physical properties such as median grain size, sand content, and clay content, which has a high correlation coefficient; this result also explains why the attenuation fitting formula constructed in this study has higher reliability than previous study.
The prediction accuracy of empirical equations
In order to verify the accuracy of empirical equations, we compared the measured values with the predicted values of the empirical equations and calculated the errors using the following equation:
Here the predicted values are predicted by the empirical equations, the measured values are the measured sound speed ratios and attenuation factors. The error calculating results are listed in Tables 4, 5. For sound speed ratio, the empirical equations established in this study have smaller errors, the average error of these equations range from 0.98% to 1.68%, and the standard deviation range from 0.78% to 1.32%. The empirical equation of clay content has the maximum error among these equations of different physical properties, which is consistent with the comparison results of correlation coefficients R2. For attenuation factor, the prediction error was larger than that of sound speed ratio. The average errors of the predicted values range from 23.03% to 38.38%, and the standard deviations range from 15.38% to 22.72%. The empirical equation of clay content also has the maximum error. The attenuation factor has relatively larger range value, which may be the main cause of the larger error for attenuation factor prediction. The actual average difference of predicted value to measured value was 0.042 dB·m−1·kHz−1, and the standard deviation was 0.077 dB·m−1·kHz−1. Compared with the sound speed ratio ranging from 0.95 to 1.10, the attenuation factor has the relatively larger range value, ranging approximately from 0 to 0.60 dB·m−1·kHz−1. In this event, it is possible that the empirical equation for attenuation have relatively larger prediction error. As mentioned above, the sound speed ratio can be predicted by these empirical equations well, while only the approximate empirical attenuation factor can be predicted by these empirical equations.
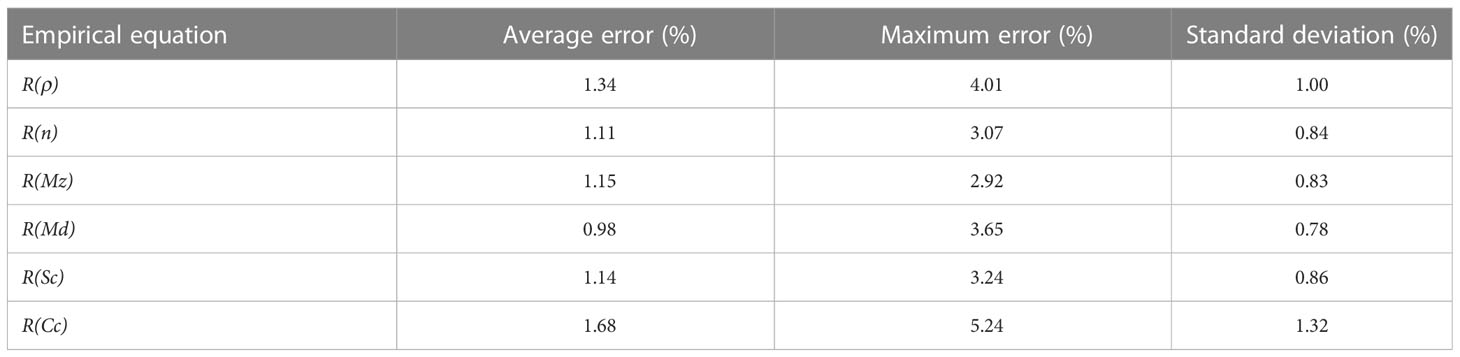
Table 4 Error comparison of empirical equations for sound speed ratio.
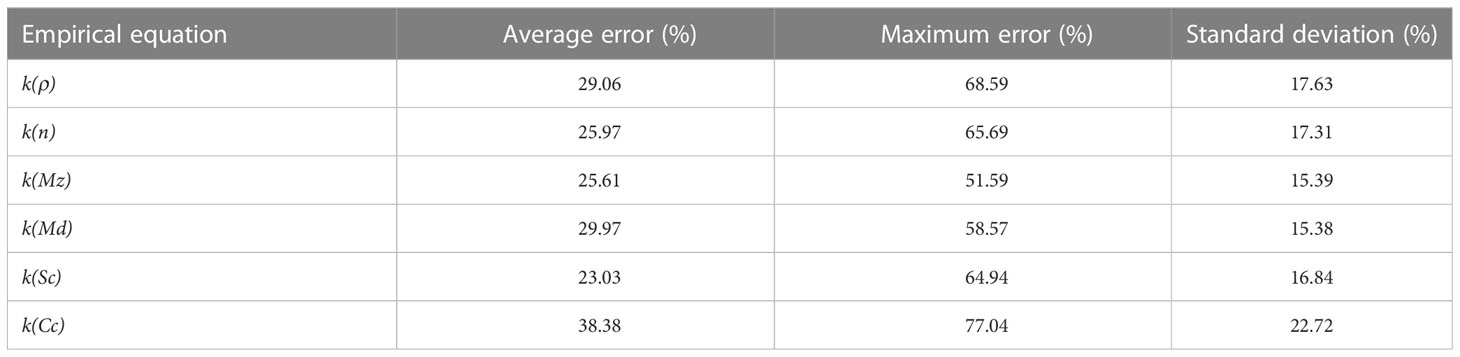
Table 5 Error comparison of empirical equations for attenuation factor.
Conclusion
In this study, the in situ sound speed and in situ acoustic attenuation factor of various types of seafloor sediments in the East China Sea were obtained using in situ measurement technology, and curvilinear correlations of the in situ sound speed ratio and in situ acoustic attenuation factor with density, porosity, mean grain size, median grain size, sand content, and clay content were constructed. This study’s conclusions are as follows:
(1) The empirical formulas of sound speed constructed in this study have a high correlation. Except for clay content, the correlation coefficients between sound speed and other physical properties are higher than 0.80. The sound speed fitting formula is close to the R&B equation and has a large deviation from the H&B equation. This difference is attributed to the difference in the measurement technology for acoustic properties, the measurement process for physical properties such as density and porosity, which may be affected by a disturbance of sample collection and transportation, and the difference in the research objects, with the calcareous sediment data possibly contributing to the local difference between the R&B equation and the empirical formula of this study.
(2) Additionally, a highly correlated attenuation characteristic empirical formula was constructed. The correlation coefficients between the attenuation factor and the main physical properties except clay content were higher than 0.85. This study believed that the attenuation was highly dependent on the measurement frequency; this dependence may be an important reason for the poor correlation between attenuation and physical properties in previous studies. Compared with the R&B equation constructed with the in situ measurement data, the two fitting curves have similar trends. The fitting formula substantially improves the curvilinear correlation between attenuation and physical properties and the high correlation between attenuation and six physical properties at the same time, as well as the verification of the measured data in the literature, demonstrating that the formula has high reliability. Though the attenuation empirical equations have high correlation, they should be used in conjunction with actual measurements, such as the measurement frequency, etc.
Data availability statement
The original contributions presented in the study are included in the article/supplementary materials. Further inquiries can be directed to the corresponding author.
Author contributions
All authors listed have made a substantial, direct, and intellectual contribution to the work and approved it for publication.
Funding
This study was supported by the Basic Scientific Fund for National Public Research Institutes of China under contract No. 2022S01, the National Natural Science Foundation of China under contracts Nos. 42049902, 42176191 and 42076082, and the Shandong Provincial Natural Science Foundation, China under contract No. ZR2022YQ40.
Acknowledgments
Data acquisition and sample collections were supported by the National Natural Science Foundation of China Open Research Cruise (Cruise No. NORC2021-02+NORC2021-301), funded by the Shiptime Sharing Project of the National Natural Science Foundation of China. This cruise was conducted onboard R/V “XiangYangHong 18” by First Institute of Oceanography, Ministry of Natural Resources, China.
Conflict of interest
The authors declare that the research was conducted in the absence of any commercial or financial relationships that could be construed as a potential conflict of interest.
Publisher’s note
All claims expressed in this article are solely those of the authors and do not necessarily represent those of their affiliated organizations, or those of the publisher, the editors and the reviewers. Any product that may be evaluated in this article, or claim that may be made by its manufacturer, is not guaranteed or endorsed by the publisher.
References
Arthur A. N., de Noronha Teixeira Mendes J., Redusino M. Jr., Bastos Pontes R. L. (2013). Geotechnical influence on the acoustic properties of marine sediments of the santos basin, Brazil. Mar. Georesources Geotechnol. 31 (2), 125–136. doi: 10.1080/1064119X.2012.669815
Bachman R. T. (1989). Estimating velocity ratio in seafloor sediment. J. Acoustical Soc. America 86 (5), 2029–2032. doi: 10.1121/1.398585
Bae S. H., Kim D. C., Lee G. S., Kim G. Y., Kim S. P., Seo Y. K., et al. (2014). Physical and acoustic properties of inner shelf sediments in the south Sea, Korea. Quaternary Int. 344, 125–142. doi: 10.1016/j.quaint.2014.03.058
Chaytor J. D., Ballard M. S., Buczkowski B. J., Goff J. A., Lee K. M., Reed A. H., et al. (2022). Measurements of geologic characteristics and geophysical properties of sediments from the new England mud patch. IEEE J. Oceanic Eng. 47 (3), 503–530. doi: 10.1109/JOE.2021.3101013
Dall'Osto D. R., Tang D. J. (2022). Acoustic resonances within the surficial layer of a muddy seafloor. J. Acoustical Soc. America 151 (5), 3473–3480. doi: 10.1121/10.0011472
Dumke I., Berndt C. (2019). Prediction of seismic p-wave velocity using machine learning. Solid Earth 10, 1989–2000. doi: 10.5194/se-10-1989-2019
Hamilton E. L. (1971). Prediction of in situ acoustic and elastic properties of seafloor sediments. Geophysics 36 (2), 266–284. doi: 10.1190/1.1440168
Hamilton E. L. (1972). Compressional wave attenuation in seafloor sediments. Geophysics 37, 620–646. doi: 10.1190/1.1440287
Hamilton E. L. (1980). Geoacoustic modeling of the sea floor. J. Acoust. Soc Am. 68, 1313–1340. doi: 10.1121/1.385100
Hamilton E. L., Bachman R. T. (1982). Sound speed and related properties of seafloor sediments. J. Acoust. Soc Am. 72, 1891–1904. doi: 10.1121/1.388539
Hou Z. Y., Guo C. S., Wang J. Q., Chen W. J., Fu Y. T., Li T. G. (2015). Seafloor sediment study from south China Sea: acoustic & physical property relationship. Remote Sens. 7), 11570–11585. doi: 10.3390/rs70911570
Kim G. Y., Kim D. C., Yong D. G., Shin B. K. (2011). Physical and geoacoustic properties of surface sediments off eastern geoje island, south Sea of Korea. Quaternary Int. 230 (1), 21–33. doi: 10.1016/j.quaint.2009.07.028
Kim G. Y., Narantsetseg B., Lee J. Y., Chang T. S., Lee G. S., Yoo D. G., et al. (2018). Physical and geotechnical properties of drill core sediments in the heuksan mud belt off SW Korea. Quaternary Int. 468, 33–48. doi: 10.1016/j.quaint.2017.06.018
Li G. B., Hou Z. Y., Wang J. Q., Kan G. M., Liu B. H. (2021a). Empirical equations of p-wave velocity in the shallow and semi-deep sea sediments from the south China Sea. J. Ocean Univ. China. 20 (3), 532–538. doi: 10.1007/s11802-021-4476-y
Li G. B., Wang J. Q., Liu B. H., Meng X. M., Kan G. M., Pei Y. L. (2019). Measurement and modeling of high-frequency acoustic properties in fine sandy sediments. Earth Space Sci. 6 (11), 2057–2070. doi: 10.1029/2019EA000656
Li G. B., Wang J. Q., Meng X. M., Liu B. H., Kan G. M., Han G. Z., et al. (2021b). Relationships between the ratio of sound speed and physical properties of surface sediments in the south yellow Sea. Acta Oceanol. Sin. 40 (4), 65–73. doi: 10.1007/s13131-021-1764-8
Liu B., Han T., Kan G., Li G. (2013). Correlations between the in situ acoustic properties and geotechnical parameters of sediments in the yellow Sea, China. J. Asian Earth Sci. 77, 83–90. doi: 10.1016/j.jseaes.2013.07.040
Lu B., Liu Q., Li G. X. (2010). Grain and pore factors in acoustic response to seafloor sediments. Mar. Georesources Geotechnol. 28 (2), 115–129. doi: 10.1080/10641191003780724
Megan S. B., Kevin M. L., Andrew R. M., Preston S. W., Jason D. C., John A. G., et al. (2019). In situ measurements of compressional wave speed during gravity coring operations in the new England mud patch. IEEE J. Oceanic Eng. 45 (1), 26–38. doi: 10.1109/JOE.2019.2924560
Orsi T. H., Dunn D. A. (1991). Correlations between sound velocity and related properties of glacio-marine sediments: barents sea. Geo-Marine Lett. 11 (2), 79–83. doi: 10.1007/BF02431033
Richardson M. D., Briggs K. B. (2004). “Empirical predictions of seafloor properties based on remotely measured sediment impedance,” in High frequency ocean acoustic conference, vol. 728 . Eds. Porter M. B., Siderius M. (Melville: AIP press), 12–21.
Wang J. Q., Li G. B., Kan G. M., Liu B. H., Meng X. M. (2020). Experiment study of the in situ acoustic measurement in seafloor sediments from deep sea. Chin. J. Geophys. (in Chinese) 63 (12), 4463–4472. doi: 10.6038/cjg2020N0427
Wang J. Q., Li G. B., Liu B. H., Kan G. M., Sun Z. W., Meng X. M., et al. (2018). Experimental study of the ballast in situ sediment acoustic measurement system in south China Sea. Mar. Georesources Geotechnol. 36 (5), 515–521. doi: 10.1080/1064119X.2017.1348413
Yang J., Tang D. J. (2017). Direct measurements of sediment sound speed and attenuation in the frequency band of 2–8 kHz at the target and reverberation experiment site. IEEE J. Oceanic Eng. 42 (4), 1102–1109. doi: 10.1109/JOE.2017.2714722
Zhang Y. X., Guo C. S., Wang J. Q., Hou Z. Y., Chen W. J. (2017). Relationship between in situ sound speed and granular characteristics of seafloor sediments in the qingdao offshore region. J. Oceanol. Limnol. 35 (3), 704–711. doi: 10.1007/s00343-017-5374-4
Keywords: seafloor sediment, in situ measurement, sound speed, attenuation, empirical equation
Citation: Wang J, Kan G, Li G, Meng X, Zhang L, Chen M, Liu C and Liu B (2023) Physical properties and in situ geoacoustic properties of seafloor surface sediments in the East China Sea. Front. Mar. Sci. 10:1195651. doi: 10.3389/fmars.2023.1195651
Received: 28 March 2023; Accepted: 24 April 2023;
Published: 12 May 2023.
Edited by:
Fei Han, University of New Hampshire, United StatesReviewed by:
Tingkai Nian, Dalian University of Technology, ChinaAmir Hosein Taherkhani, University of New Hampshire, United States
Copyright © 2023 Wang, Kan, Li, Meng, Zhang, Chen, Liu and Liu. This is an open-access article distributed under the terms of the Creative Commons Attribution License (CC BY). The use, distribution or reproduction in other forums is permitted, provided the original author(s) and the copyright owner(s) are credited and that the original publication in this journal is cited, in accordance with accepted academic practice. No use, distribution or reproduction is permitted which does not comply with these terms.
*Correspondence: Xiangmei Meng, mxmeng@fio.org.cn