Evaluation and obstacle factors of marine resources and environment carrying capacity in Beibu Gulf Urban Agglomeration
 Yan Li
 Liang Sun
 Zongnan Wu2
 - 1Beibu Gulf Ocean Development Research Center, Beibu Gulf University, Qinzhou, Guangxi, China
- 2School of Economics and Management, Beibu Gulf University, Qinzhou, Guangxi, China
With the strong support of the Chinese government, the Beibu Gulf Urban Agglomeration has responded positively to the national call to vigorously develop the marine economy. However, a series of marine resource and environmental problems such as over-exploitation of marine resources and excessive discharge of marine pollutants in the Beibu Gulf Urban Agglomeration has also arisen along with the rapid development of the marine economy, limiting the space for the development of the marine economy in the Beibu Gulf Urban Agglomeration. Based on the panel data of seven coastal cities in the Beibu Gulf urban agglomeration from 2011-2021, the DPSIR model was used to construct a marine resources environmental carrying capacity evaluation index system including five dimensions of driving force, pressure, state, impact and response, and the TOPSIS model with combined weighting was used to make a comprehensive evaluation of the marine resources carrying capacity of the Beibu Gulf urban agglomeration, and then the barrier degree model was used to explore the barriers to the carrying capacity of marine resources and environment in the Beibu Gulf Urban Agglomeration. The empirical results show that, on the whole, the marine resources and environment carrying capacity of the seven coastal cities in the Beibu Gulf Urban Agglomeration show an upward trend. From the situation of each subsystem, the pressure subsystem and response subsystem have greater evaluation values, while the evaluation of the driving force, state, and influence subsystem needs to be improved; from the analysis of obstacle factors, the main single indicator obstacle factors include per capita coastline length, total import and export volume, and port cargo throughput, etc. The status subsystem is the main classification indicator barrier factor affecting the improvement of the marine resource and environmental carrying capacity of the Beibu Gulf Urban Agglomeration. Based on the results of the empirical analysis, corresponding suggestions are put forward.
1 Introduction
Since the beginning of the 21st century, China has been paying more attention to the marine economy, and various marine undertakings are developing steadily, with China's gross marine product reaching RMB 9.04 trillion in 2021 (Liu et al., 2023). With the strong support of the Chinese government, the Beibu Gulf Urban Agglomeration has responded to the national call to vigorously develop the maritime economy, with the initial formation of port-side industrial clusters with petrochemicals, metallurgy, energy, and grain and oil processing as pillars, and the accelerated development of new industries and modern services (Li, 2022). 6,117 trains of the Western Land and Sea New Corridor were operated in 2021, an increase of 33% year-on-year. The urban agglomeration's backbone road network has formed, the growth rate of port cargo throughput is among the highest in China, and the route network covers ASEAN and major domestic ports (Qi et al., 2022). With the deepening of opening up to the outside world, the total import and export volume of the Beibu Gulf Urban Agglomeration has increased significantly, with the total import and export volume of Nanning, the 'leading' city of the cluster, exceeding RMB 120 billion in 2021 (Wang and Liao, 2022). At the same time, the construction of major open platforms such as China (Guangxi) Pilot Free Trade Zone is steadily advancing, and economic, trade, humanistic exchanges, and maritime cooperation between the Beibu Gulf Urban Agglomeration and ASEAN countries continue to deepen. However, a series of marine resource and environmental problems such as overexploitation of marine resources and excessive discharge of marine pollutants have also arisen along with the rapid development of the marine economy. The overexploitation of marine resources and the continuous destruction of the marine environment in the Beibu Gulf Urban Agglomeration will limit the space for the development of the marine economy in the Beibu Gulf Urban Agglomeration (Batty, 2000). Therefore, while achieving the rapid development of the marine economy in the Beibu Gulf Urban Agglomeration, attention should also be paid to the construction of marine resources and the environment. How to improve the carrying capacity of the marine resources and environment and achieve sustainable development of the marine resources and environment while maintaining the rapid development of the marine economy in the Beibu Gulf Urban Agglomeration has become a hot issue of social concern (Li et al., 2022).
The carrying capacity of marine resources and the environment can be divided into three types: industrial carrying capacity, natural carrying capacity, and economic carrying capacity (Song and Du, 2019), which refers to the capacity or limit of marine resources to support human economic activities and social development within a certain period time, provided that the marine environment is not damaged (Stojanovic and Farmer, 2013). Scholars have studied the composition and measurement of the carrying capacity of marine resources and environment, such as the construction of a composite economic-resource-environment system to study the carrying capacity of Guangdong's marine resources and environment (Zhang et al., 2020); the incorporation of ecosystem services into the traditional DPSIR model, and the application of the modified EBM-DPSIR model to the Florida Keys and the Dry Tortugas marine ecosystem (Kelble et al., 2013); measuring marine resource carrying capacity and barriers in 11 coastal provinces of China from 2006-2016 (Song and Ning, 2020); Using image video processing tools and video sequence algorithms to assess the environmental carrying capacity of marine resources (Cisneros et al., 2016); the use of a multidimensional approach to assess the expansion of coastal cities and monitor the process of changes in the carrying capacity of marine resources and the environment, in order to propose solutions to achieve sustainable development goals for coastal cities (Theodora and Spanogianni, 2022). Coordination is an important aspect of the study of the carrying capacity of marine resources and the environment. Using the subjective and objective synthesis method to determine the weight of each indicator, the coupled coordination model can measure the degree of coordination between economic development and the carrying capacity of marine resources and the environment (Wang and Yang, 2021); using the spatiotemporal weight matrix and coupled coordination model can examine the coordination between the marine economy and the carrying capacity of the ocean (Yu and Di, 2020). Integrating spatial data on human activities and ecology and exploring different methods of land-sea interaction are conducive to achieving sustainable development of coastal areas (Hietala et al., 2021); improving the carrying capacity of marine resources and environment should focus on sustainable development of economic, socio-cultural, environmental protection and renewable energy (Liao, 2018), while in concrete practice, coastal area management policies, spatial planning and overall strategic planning generally lack coordination, which affects the improvement of the carrying capacity of the marine environment, and there is a need to develop approaches to marine ecosystem and environmental management and protection (Cantasano et al., 2017); combining scientific, technological, management, legal and policy capabilities across elements can enable dynamic ocean management (Hobday et al., 2014); competing ocean uses and the continued increase in ocean development require ocean management to integrate the environmental, economic and social impacts of all activities to achieve sustainable development of marine resources (Elliott et al., 2017).
The evaluation of the carrying capacity of marine resources and the environment and the study of the barriers are the core and key, and most of the existing research results are based on the determination of index weights through a single subjective or objective assignment method (Wang et al., 2022). At the same time, previous studies have mainly focused on a particular country, province (region), or more mature urban agglomerations, and less research has been conducted on embryonic urban agglomerations with relatively small economic power (Chen and Yao, 2021). Therefore, this paper uses the DPSIR model to construct marine resources and environment carrying capacity evaluation index system that includes five dimensions: driving force, pressure, state, impact, and response, and uses the AHP-entropy method to assign weights to subjective and objective combinations, and adopts the TOPSIS model and barrier degree model to evaluate and analyze the marine resources and environment carrying capacity of the Beibu Gulf urban agglomeration from 2011 to 2020. The study proposes suggestions for further improving the carrying capacity of marine resources and environment in the Beibu Gulf Urban Agglomeration, promoting the high-quality development of the marine economy in the Beibu Gulf Urban Agglomeration, and achieving the development goal of building a first-class blue bay Urban Agglomeration with regional and international influence (Zhang et al., 2022).
2 Materials and methods
2.1 Study area and data sources
According to the Beibu Gulf Urban Agglomeration Development Plan issued in 2017, the planning area of the Beibu Gulf Urban Agglomeration spans Guangxi, Guangdong, and Hainan provinces and includes six prefecture-level cities in the Guangxi Zhuang Autonomous Region: Nanning, Beihai, Qinzhou, Fangchenggang, Yulin, and Chongzuo; three prefecture-level cities in Guangdong Province: Zhanjiang, Maoming, and Yangjiang; and six prefecture (county) level cities in Hainan Province: Haikou, Danzhou, Dongfang, Chengmai, Lingao, and Changjiang. This paper takes its seven coastal cities, namely Zhanjiang, Yangjiang, Maoming, Qinzhou, Beihai, Fangchenggang, and Haikou, as the study area to analyze the level of marine resources and environmental carrying capacity of the Beibu Gulf urban agglomeration and the factors that hinder it. The study area has a land area of 116,600 square kilometers and a coastline of 4,234 kilometers, with the proportion of terrestrial ecological space remaining stable at over 43% and the overall water quality of the near-shore waters reaching Class II standards or above. The Beibu Gulf urban agglomeration, with its back to the southwest, adjacent to Guangdong, Hong Kong, and Macao, and facing Southeast Asia, is an important hub of the Maritime Silk Road and has an important strategic position in the strategic pattern of western development and the general pattern of China's opening up and cooperation with ASEAN (Chen, 2021). 2022, the China Development and Reform Commission officially issued the Fourteenth Five-Year Plan for the Construction of the Beibu Gulf Urban Agglomeration The program states that during the 14th Five-Year Plan period, the maritime economy of the Beibu Gulf Urban Agglomeration will develop at a rapid pace and that it is important to protect the "one bay", that is the coastal area around the Beibu Gulf and the offshore waters, and to strengthen the protection and restoration of the ecosystem. The plan is to strictly delineate the ecological protection red line in the coastal waters and explore the establishment of an integrated coastal, watershed, and sea area management system, setting out a new blueprint for the Beibu Gulf Urban Agglomeration to build a high-level blue ecological bay area (Dong et al., 2022).
Given the relatively short period time for the comprehensive planning and construction of the Beibu Gulf Urban Agglomeration, and because of the availability of data and the principles of objectivity, scientificity, and dynamism, this paper selects the sample data of the Beibu Gulf urban agglomeration from 2011 to 2020 for the study. The original data of the indicators used in this study were obtained from 2011 to 2020 from China Tertiary Industry Statistical Yearbook (http://www.stats.gov.cn/sj/), China Transport Statistical Yearbook (https://www.mot.gov.cn/tongjishuju/), China Transport Yearbook (https://www.mot.gov.cn/tongjishuju/), China Urban Statistical Yearbook (https://data.cnki.net/v3/trade/yearbook/Single/N2022040095?zcode=Z023) and the statistical yearbooks of seven coastal cities; the data on environmental pressure and environmental management were mainly obtained from 2011 to 2020 from China Marine Statistical Yearbook (http://mds.nmdis.org.cn/pages/ocean_list.html), China Environmental Statistical Yearbook (https://navi.cnki.net/knavi/yearbooks/YHJSD/detail), China Urban Construction Statistical Yearbook (http://www.stats.gov.cn/sj/), Guangdong Statistical Yearbook (http://stats.gd.gov.cn/gdtjnj/) and the environmental situation bulletins of seven coastal cities for the past years; Data on resource pressure and resource use were mainly obtained from 2011 to 2020 from the China Energy Statistical Yearbook (https://data.cnki.net/v3/trade/yearbook/Single/N2022060061?zcode=Z023) and the statistical bulletins on national economic and social development of the seven coastal cities in previous years, with data on individual indicators calculated by means of the corresponding formulae.
2.2 Research methodology
2.2.1 The DPSIR model
In 1993, the European Environment Agency (EEA) proposed the DPSIR model by combining two models, DSR (Driving Force-State-Response) and PSR (Pressure-State-Response), and adding an impact factor (Bai et al., 2022). This model has the greatest advantage of explaining the interaction between human and other environmental factors from a system analysis perspective (Shao and Ju, 2010), describing the logical chain between the cause and effect of a problem in a clearer way, and comprehensively constructing the causal relationship between each indicator (Westing, 1989). The DPSIR model, which integrates ecological, economic, and social influences, has been introduced into the field of marine resources and environmental carrying capacity evaluation and is widely used.
In the DPSIR model of the marine resources and environment carrying capacity evaluation system, driving force (D) - pressure (P) - state (S) - impact (I) - response (R) is a series of interacting processes (Figure 1). In this system logic chain, the driving force (D) is the most primitive and critical subsystem of marine resources and environment-carrying capacity change. The driving factors such as regional economic development, intensification of human activities, and population growth drive changes in the marine resources and environment system and exert pressure (P) on the marine resources and environment carrying capacity system (Jia and Wang, 2023). The drivers and pressures cause a series of changes in the state (S) of the marine resource-environment system, resulting in various impacts (I). Ultimately, to adjust the state of the marine resource environment and reduce adverse impacts, the government takes a series of policy measures to respond (R) to the marine resource environment system, and the response (R) backfires on the whole DPSIR system (Shen and Jiang, 2018).
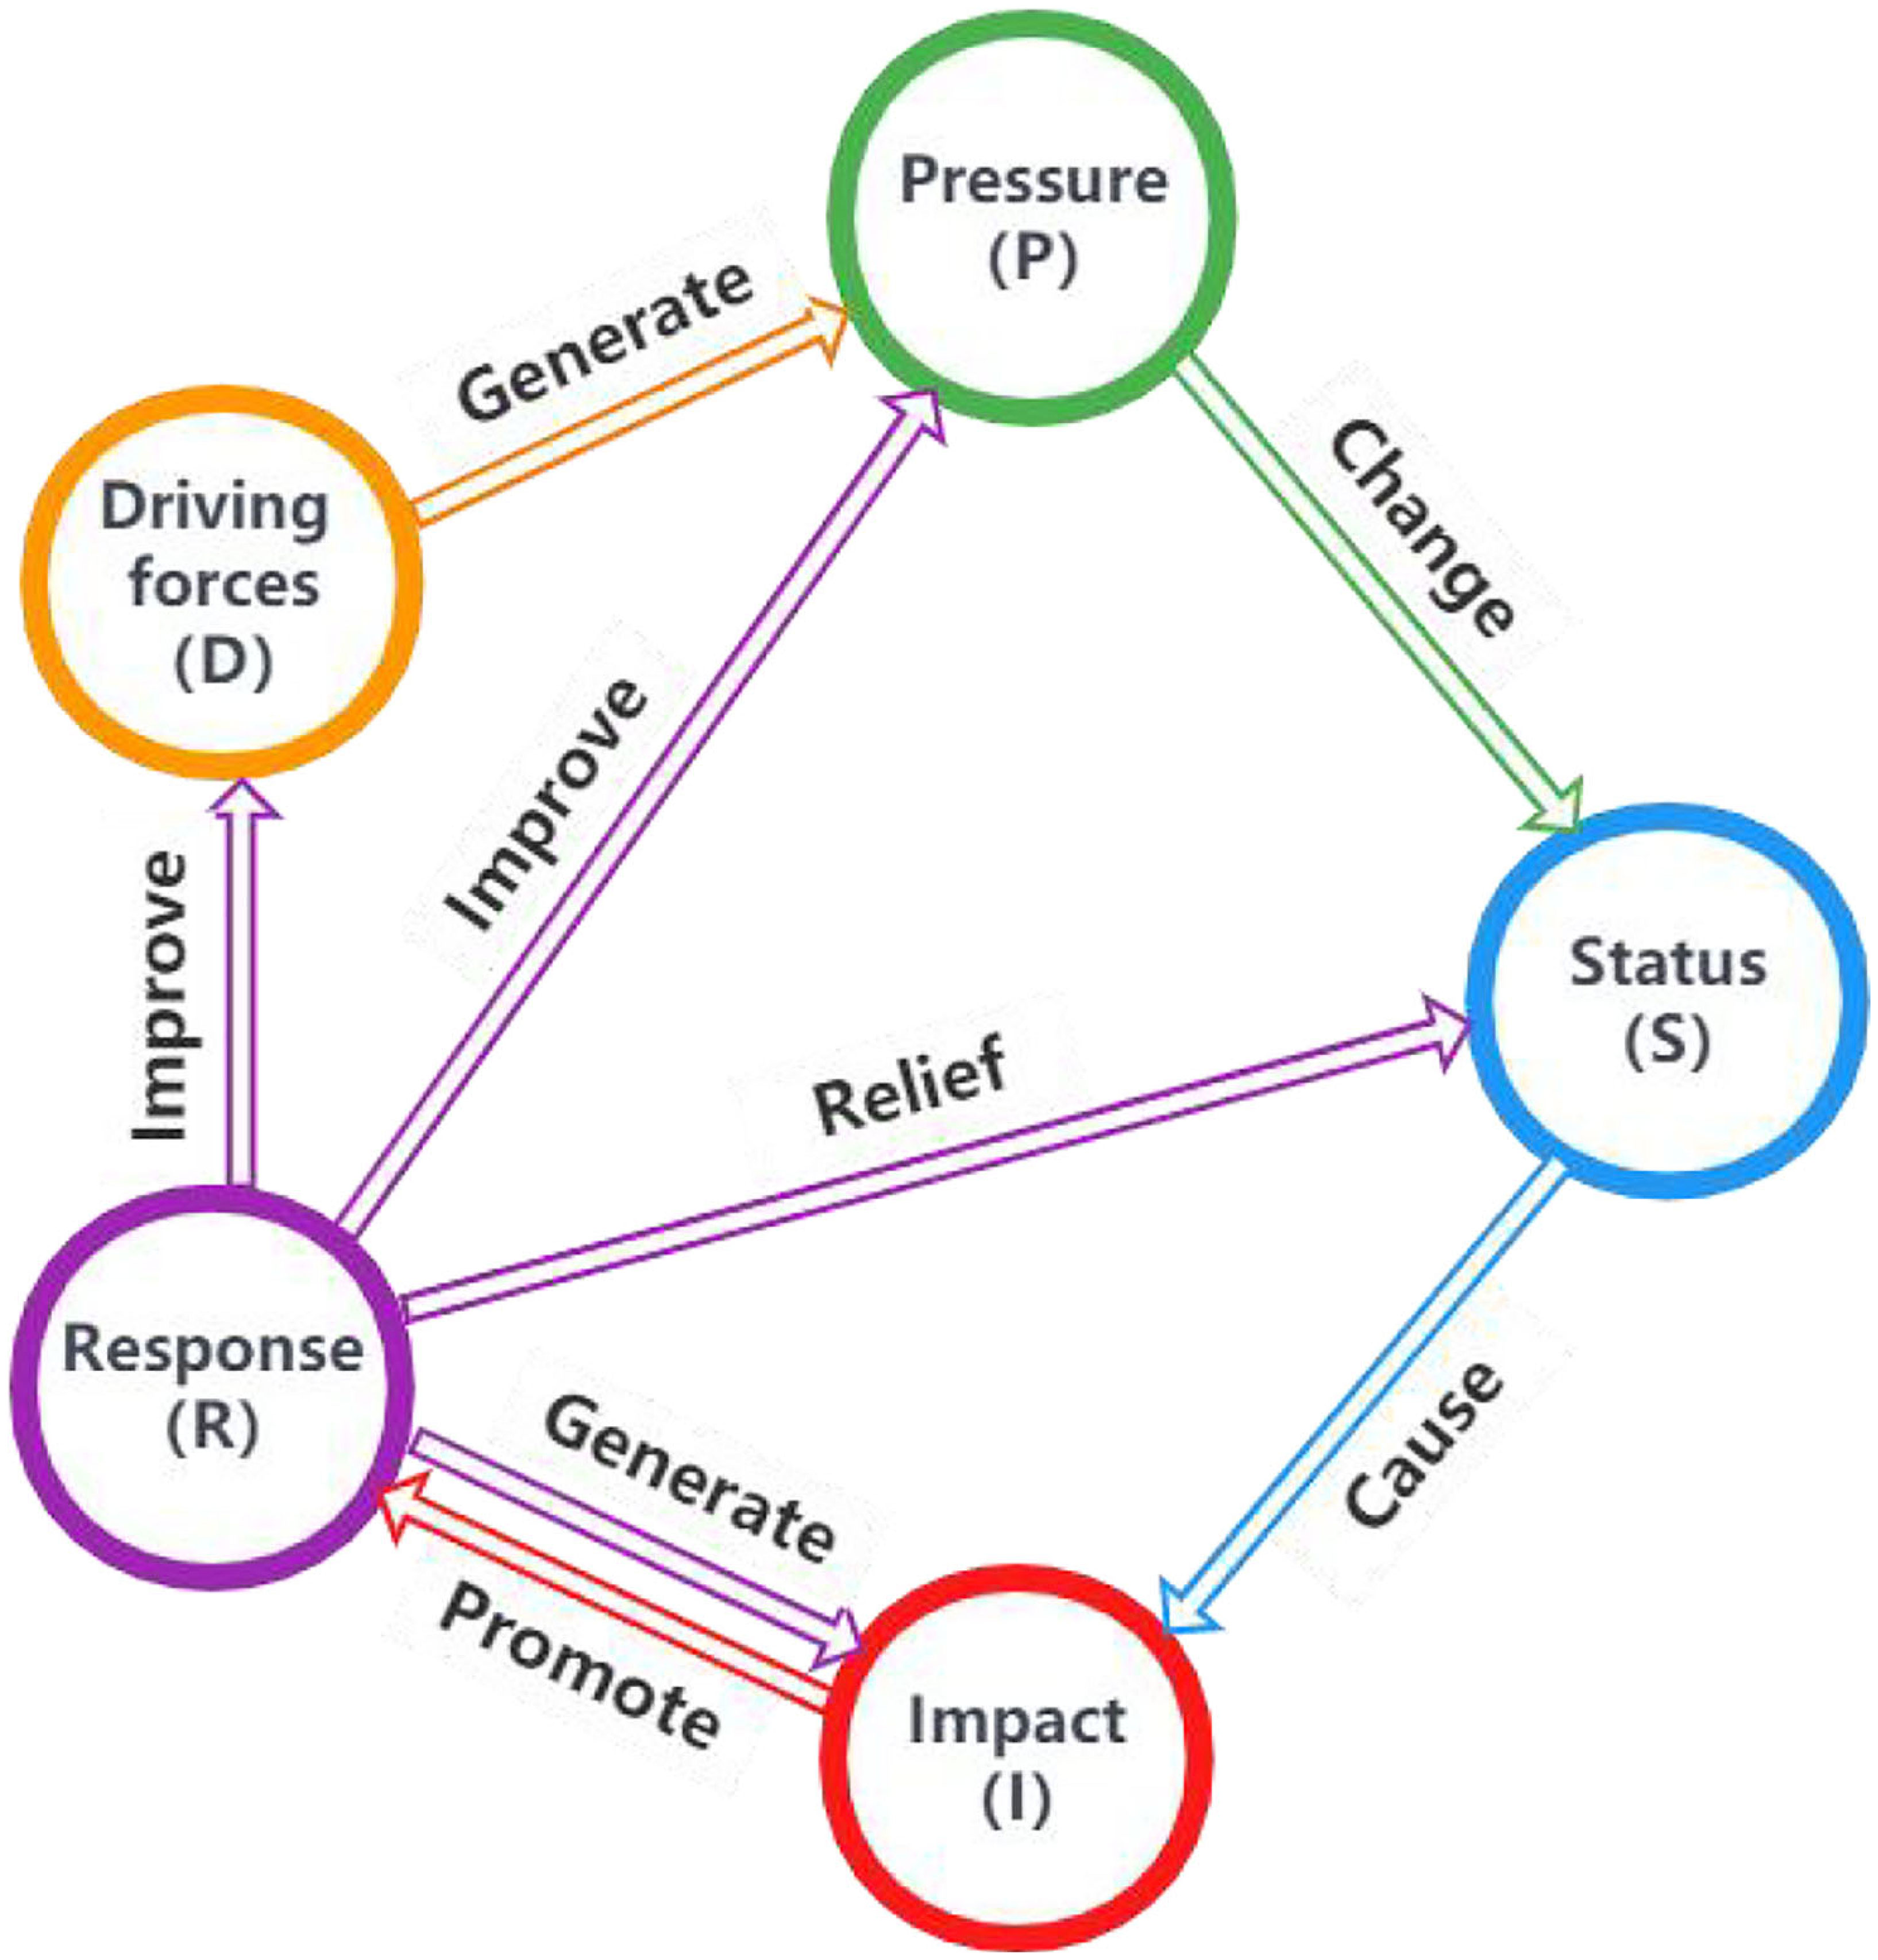
Figure 1 Logical mechanism of the DPSIR model for marine resource and environmental carrying capacity evaluation system.
2.2.2 Indicator system construction
The marine resources and environment carrying capacity evaluation index system cover three aspects: resources, economy, and environment (Di and Wu, 2018), which can measure the carrying capacity of the composite system using the coordinated development model of economy, environment, and resources and reflect the relationship between each subsystem (Gai et al., 2018), and the environmental carrying capacity of water and marine resources can be studied in four dimensions: scale, structure, mode, and network (Zhou et al., 2019). Based on the previous research results, this study starts from the basic framework of the DPSIR model, follows the principles of scientificity, comparability, and systematization, and constructs marine resources and environment carrying capacity evaluation index system from five dimensions of "driving force (D) - pressure (P) - state (S) - impact (I) - response (R)", which is shown in Table 1.
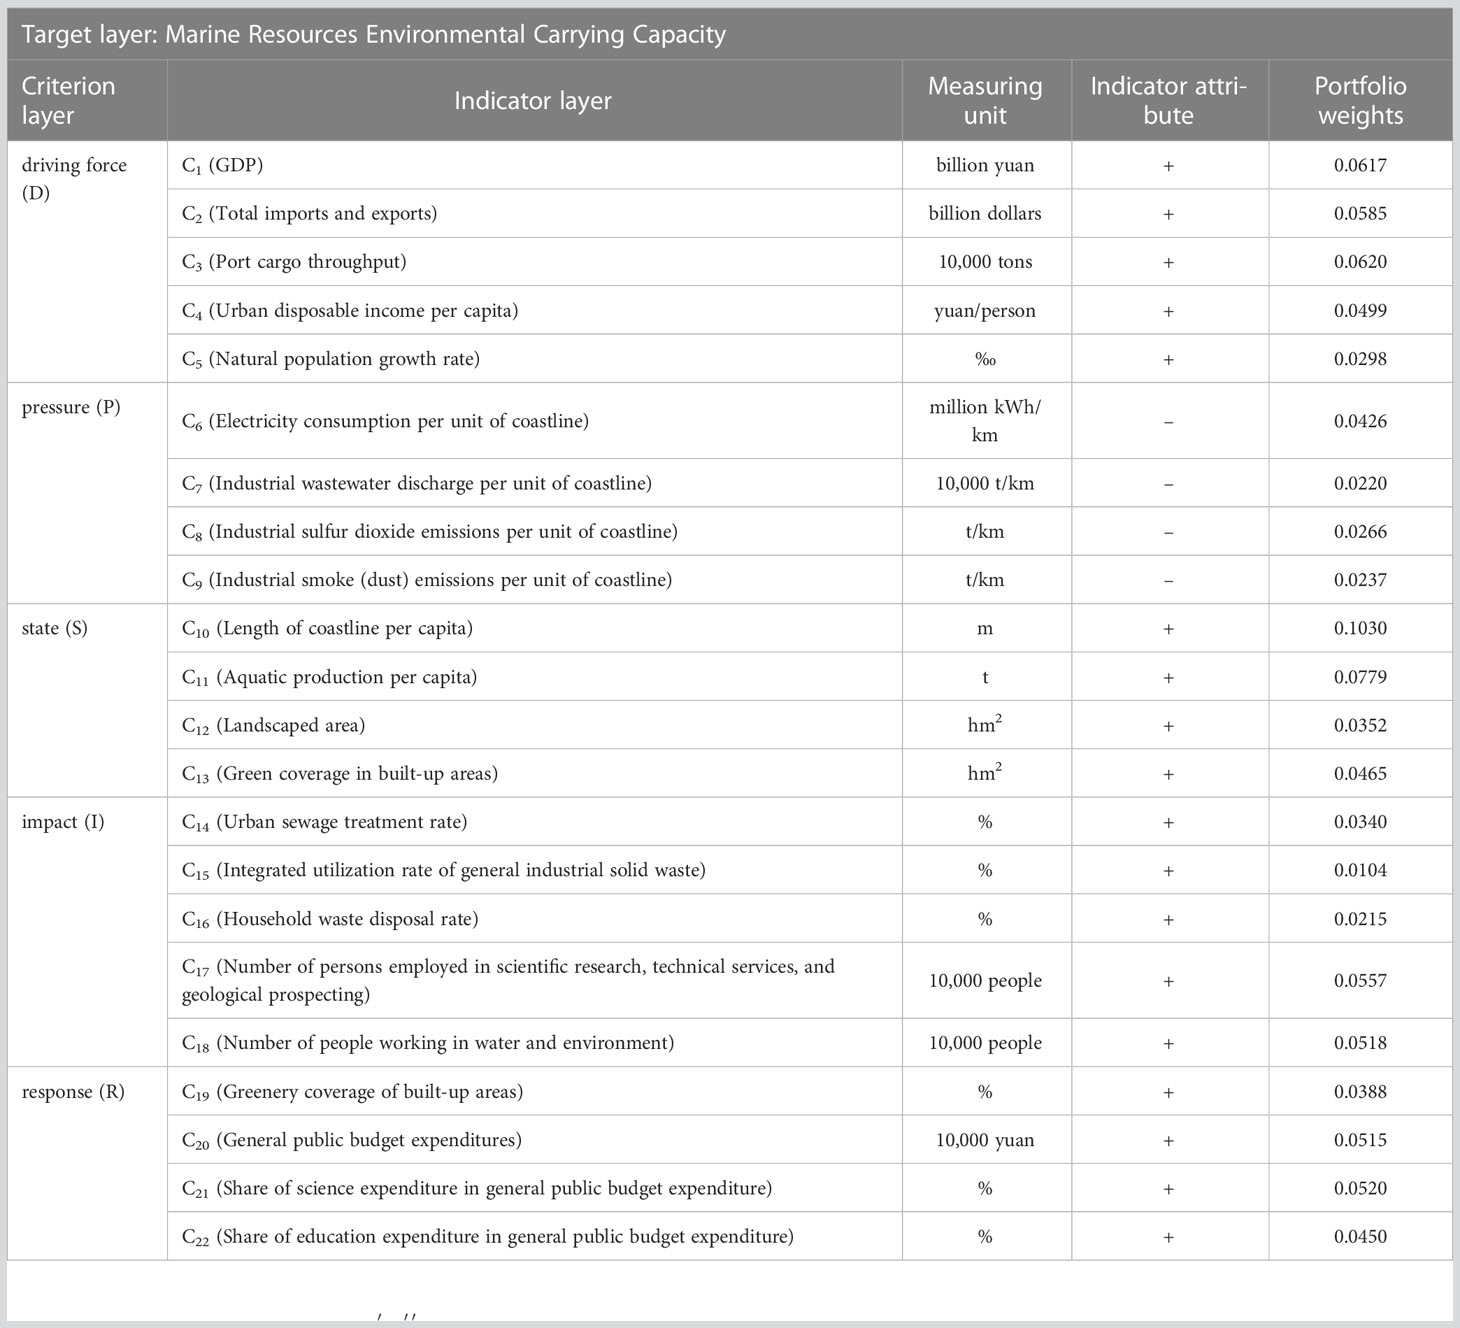
Table 1 Marine resources and environment carrying capacity evaluation index system and index weights.
2.2.3 Combined weighting method
To more accurately reflect the weight of each indicator of the marine resources and environment carrying capacity of the Beibu Gulf Urban Agglomeration, this paper combines the subjective weighting of the hierarchical analysis method with the objective weighting of the entropy weighting method to determine its combined weight (Gou and Lu, 2020).
The Analytic Hierarchy Process (AHP) was proposed by the American scholar T L Saaty, which can combine quantitative and qualitative aspects to determine the subjective weights of each evaluation index (Liu et al., 2020). The entropy weighting method can determine the objective weights of each evaluation indicator based on the information provided by them, avoiding the bias of results caused by the arbitrariness of subjective assignment.
2.2.3.1 Basic steps of AHP
(1) Build a judgment matrix:
The value range for auv is 1 to 9.
(2) Calculate the maximum eigenvector of the judgment matrix:
The maximum eigenvalue λmax and the corresponding eigenvector w of the judgment matrix can be obtained according to Eq.
(3) A consistency test was adopted, and the consistency indicator CR was calculated using the following formula:
When the consistency ratio CR is less than 0.1, it indicates that the judgment matrix passes the consistency test, CI represents the consistency index and RI is the average random consistency index.
(4) The Consistency Index CI is calculated as follows:
(5) After normalization, the weights of each indicator are obtained.
2.2.3.2 Basic steps of entropy weight method
(1) Construction of the original data matrix:
(2) Standardization of data.
Positive indicators:
Negative indicators:
(3) Calculate the information entropy of each indicator, with fij being the characteristic weight of the indicators:
(4) The calculation yields the entropy weights for each indicator:
(5) Using equation (11) (Zhou et al., 2017) to determine the final portfolio weights, the results are shown in Table 1.
2.2.4 TOPSIS model evaluation methods
The TOPSIS model is one of the comprehensive evaluation methods for multi-objective decision making with limited options and is an analytical method applied to the selection of multiple options with multiple indicators (Chen et al., 2022). TOPSIS model obtains more objective evaluation results by calculating the distance between the evaluated object and the corresponding ideal target, and the main evaluation steps are as follows.
(1) Determine the positive and negative ideal solutions. is the maximum value of the i-th indicator during j years, setting as the positive ideal solution; is the minimum value of the i-th indicator during j years, setting as the negative ideal solution.
Positive ideal solutions:
Negative ideal solutions:
(2) Determine the distance between the indicator and the positive and negative ideal solutions. The Euclidean method was used to determine the distances from the indicators to the positive and negative ideal solutions (Hu and Li, 2022), letting be the distance of the i-th indicator from and letting be the distance of the i-th indicator from .
Distance to the positive ideal solution:
Distance to the negative ideal solution:
(3) Calculate the comprehensive evaluation index. Tj represents the comprehensive evaluation index of the bearing capacity of marine resources and environment in year j, and takes the value range (0,1]. The closer the value of the index is to 1, the higher the score of the comprehensive evaluation, while the closer it is to 0, the lower the score of the comprehensive evaluation.
2.2.5 Classification of marine resources environmental carrying capacity
This paper adopts the Jenks best natural fracture method to classify the marine resources and environmental carrying capacity. According to the classification method of minimum intra-class difference and maximum inter-class difference, the marine resources and environmental carrying capacity level of the Beibu Gulf Urban Agglomeration is classified into four levels: good, average, sensitive and fragile, and the evaluation levels and corresponding carrying capacity levels are shown in Table 2.
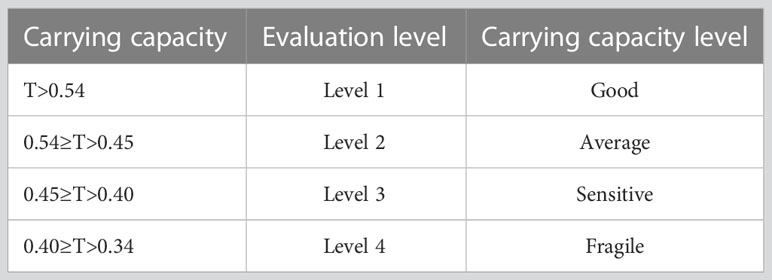
Table 2 Grading criteria for the level of marine resources and environmental carrying capacity of the Beibu Gulf Urban Agglomeration.
2.2.6 Barrier degree model measurement methods
To study the barrier factors in depth, the barrier degree was calculated for each indicator by applying the barrier degree model (Pan et al., 2019).
Factor contribution Fij is the weight of a single indicator:
Deviation Iij is the difference between a single indicator and the target:
Pij is the degree of impairment for disaggregated indicators and individual indicators in year j:
Uj indicates the degree of obstruction of the criterion layer:
wij is the weight of the j-th indicator in the i-th criterion layer, wi is the weight of the i-th criterion layer in which the j-th indicator is located, and Ri is the standard value of the individual indicator.
3 Results and analysis
3.1 Analysis of the results of the evaluation of the bearing capacity of marine resources and environment of the Beibu Gulf Urban Agglomeration
3.1.1 Comprehensive evaluation analysis of the carrying capacity of marine resources and environment
By evaluating and analyzing the marine resources and environmental carrying capacity of the seven coastal cities in the Beibu Gulf Urban Agglomeration, a comprehensive evaluation of the marine resources and environment of the seven coastal cities in the Beibu Gulf Urban Agglomeration from 2011 to 2020 was derived (Figure 2).
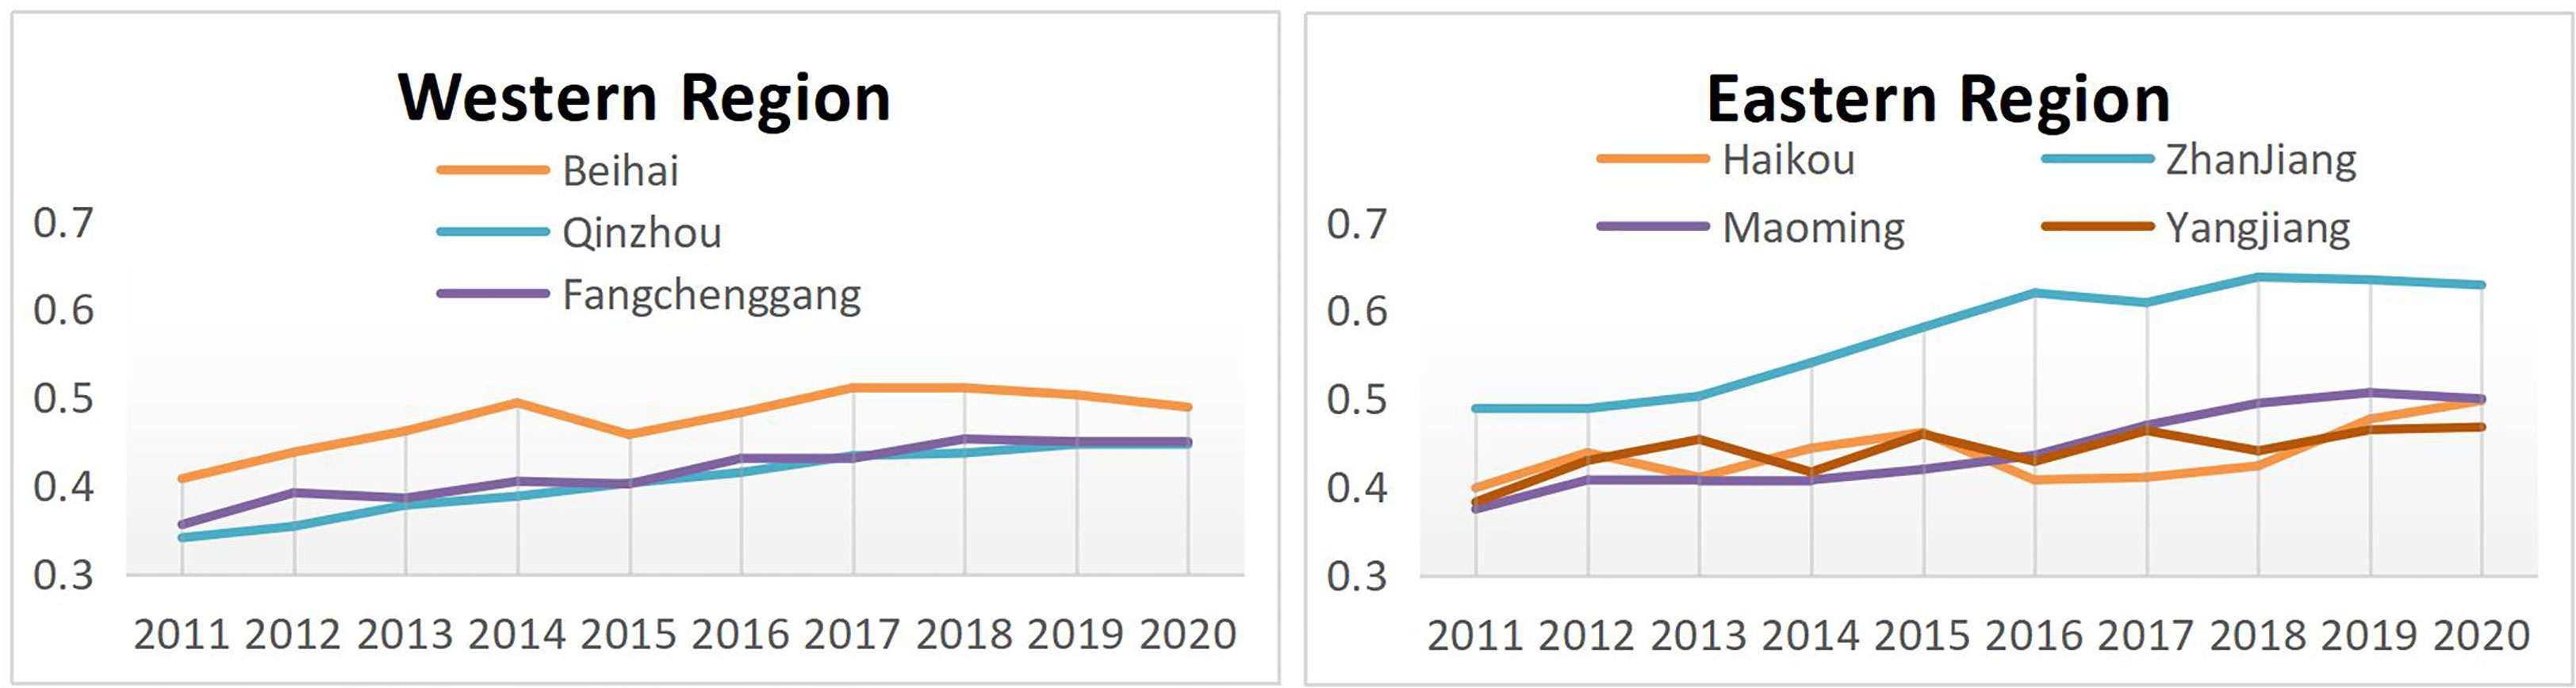
Figure 2 Comprehensive evaluation of the marine resources and environmental carrying capacity of seven coastal cities in the Beibu Gulf Urban Agglomeration, 2011-2020.
On the whole, the marine resource and environmental carrying capacity of the seven coastal cities in the Beibu Gulf Urban Agglomeration showed an upward trend from 2011 to 2020, with Qinzhou, Fangchenggang, Haikou, Maoming and Yangjiang rising from fragile to the average level, Beihai rising from sensitive to average level and Zhanjiang rising from average to the good level. Among them, most of the seven cities showed significant fluctuations during the period 2011-2015. Yangjiang and Haikou showed greater fluctuations, and both experienced significant declines in 2015, with the lowest values in both cities at sensitive levels. the marine resource and environmental carrying capacity of the seven coastal cities gradually increased during 2016-2020 and stabilized at average and good levels during 2019-2020.
In 2013, the 12th Five-Year Plan for the Development of the National Marine Industry was officially published, detailing plans for China's marine development, and the transformation of the coastal region's economic and social development patterns and activities from 2011-2016. The plan clearly states that in 2011, China's gross marine product was RMB 4557 billion, accounting for 9.7% of the gross domestic product. Among them, the added value of marine industries was RMB 2,650.8 billion and the added value of marine-related industries was RMB 1,906.2 billion. The growth rate of the marine economy was remarkable, but at the same time, the rough and sloppy way of marine economic development affected the construction of marine resources and the environment, which was the main reason why the bearing capacity of marine resources and the environment of the seven coastal cities in the Beibu Gulf Urban Agglomeration showed significant fluctuations from 2011 to 2015.
As we entered 2016, the issue of marine resource protection and the marine environment attracted widespread attention from society and governments at all levels. In 2016, the 13th Five-Year Plan for National Marine Standardization was officially issued to improve China's marine standardization system and marine standardization management mechanism. In 2017, China's National Development and Reform Commission and the State Oceanic Administration jointly issued the 13th Five-Year Plan for National Marine Economic Development, which provides a general plan for the layout of China's marine economic development, the structure of the marine industry and marine ecological civilization for the period 2016-2020, and sets higher requirements for the prevention and control of marine pollution and the use of marine resources in the Southern Ocean Economic Circle. In the same year, the Development Plan for the Beibu Gulf Urban Agglomeration was officially issued, detailing the plans for marine resources management, marine ecological protection, and other work and activities in the Beibu Gulf Urban Agglomeration from 2017 to 2020. The seven coastal cities in the Beibu Gulf Urban Agglomeration have actively responded to the State's call to rationally develop and use marine resources and increase their efforts to manage the marine ecological environment following the relevant work plans. As a result, the marine resources and environment of the Beibu Gulf Urban Agglomeration have gradually improved, and the carrying capacity of marine resources and environment has been restored, with an overall upward trend.
3.1.2 DPSIR subsystem marine resources environmental carrying capacity evaluation analysis
By comparing the assessed values of the DPSIR subsystem of the marine resources and environmental carrying capacity of seven coastal cities in the Beibu Gulf Urban Agglomeration from 2011 to 2020, an in-depth analysis of the DPSIR subsystem is carried out, taking into account the specific conditions of the marine resources and environment of the seven coastal cities in the Beibu Gulf Urban Agglomeration.
Driving force subsystem: The evaluation value of the marine resources and environment driving force subsystem of the seven coastal cities in the Beibu Gulf Urban Agglomeration shows an overall upward trend and a large increase. Zhanjiang and Maoming have given full play to their geographical advantages and have great potential for the development of the marine economy, and their economic and social development has provided sufficient impetus for the marine economy, which has led to an increase in the value of each subsystem. The average annual increase of the marine resources and environment driving force subsystem in Beihai, Qinzhou, Fangchenggang, and Haikou is relatively small. The growth rate of various economic and social development indicators is slowing down, and the development of the marine economy is showing a stable trend. In general, the level of the marine resources and environment driving force subsystem of the seven coastal cities in the Beibu Gulf Urban Agglomeration has been improving and has achieved a better driving effect (Figure 3).
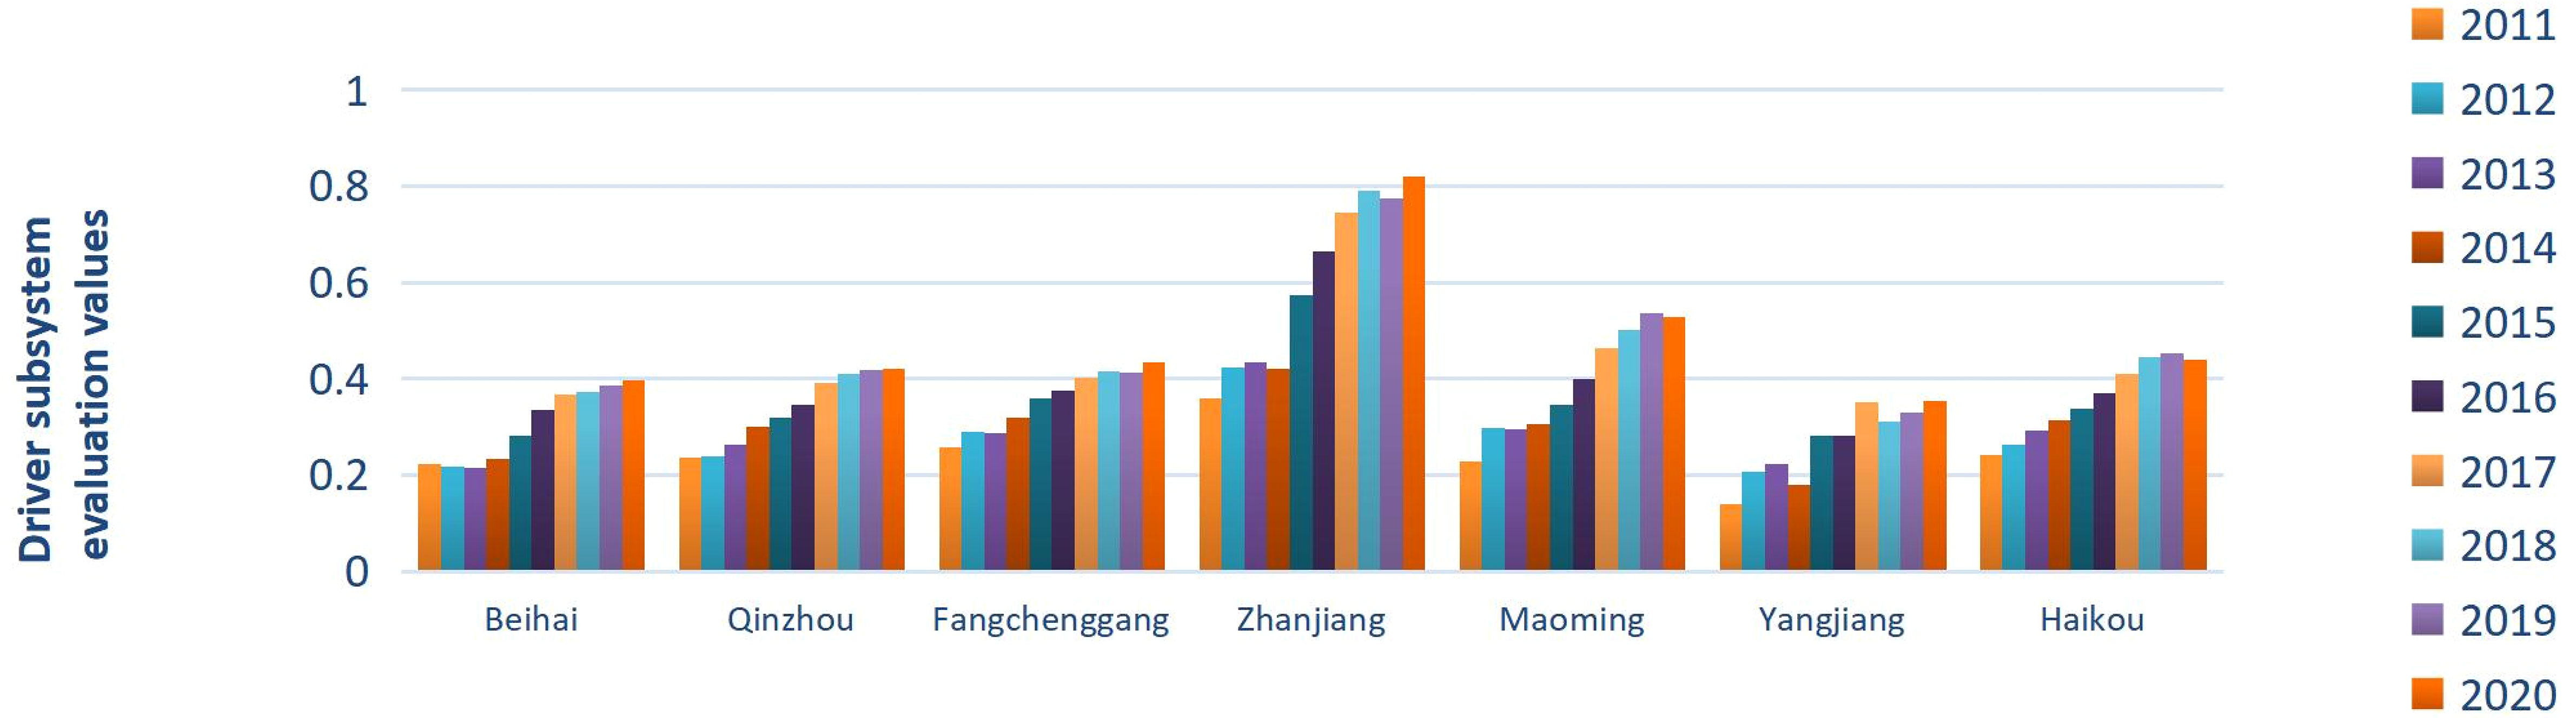
Figure 3 Evaluation of the subsystem of marine resources and environmental drivers in seven coastal cities in the Beibu Gulf Urban Agglomeration, 2011-2020.
Pressure subsystem: During the period 2011-2020, the evaluation value of the marine resources and environment driver subsystem of the seven coastal cities in the Beibu Gulf Urban Agglomeration was generally at a high level, but generally showed a fluctuating trend. Beihai, Qinzhou, and Maoming have improved the quality of the marine environment by promoting the development of marine ecological industries and strictly controlling the discharge of industrial wastewater, waste gas, and waste, and the evaluation value of the marine resources and environment pressure subsystem has been increasing. Fangchenggang, Zhanjiang, Yangjiang, and Haikou are generally on a downward trend in the evaluation value of the marine resources and environment driver subsystem during 2017-2020, with problems such as over-exploitation of marine resources and inadequate marine environment governance and protection coming to the fore, and facing greater pressure on marine resources and marine environment. Overall, marine environmental pollution has put great pressure on the marine resources and environmental carrying capacity of the Beibu Gulf Urban Agglomeration. In recent years, the coastal cities in the Beibu Gulf urban aggressively responded to the national call and gradually increased their investment in marine environmental management, but the problems facing the marine resources and environment can hardly be significantly improved in a short time (Figure 4).

Figure 4 Sub-system evaluation of marine resources and environmental pressure in seven coastal cities in the Beibu Gulf Urban Agglomeration, 2011-2020.
Status subsystem: Under both driving force and pressure, the state of marine resources and the environment in Qinzhou, Maoming, Yangjiang, and Haikou is at a poor level. In the face of marine environmental problems brought about by marine economic development, the effectiveness of the governance measures taken is not significant, resulting in an inadequate supply of marine resources and the lack of obvious advantages of green ecological regulation, and the existing governance measures cannot effectively improve the state of marine resources and environment in which they are located. Beihai, Fangchenggang and Zhanjiang have in recent years strictly implemented marine functional area planning, actively cultivated strategic new marine industries, and improved the marine ecological red line system, effectively eliminating some of the negative impacts and better maintaining the state of marine resources and environment. At present, the state of marine resources and environment in most of the seven coastal cities in the Beibu Gulf Urban Agglomeration is more severe, and the problems of marine resources and environment are prominent. To improve the state of marine resources and environment, marine resources and marine environment need to be further rationalized, managed, and protected (Figure 5).

Figure 5 Sub-system evaluation of the status of marine resources and environment in seven coastal cities in the Beibu Gulf Urban Agglomeration, 2011-2020.
Impact subsystem: From the impact on the quality of the marine environment and the number of related workers in the seven coastal cities of the Beibu Gulf urban agglomeration, the impact subsystem evaluation value of the marine resources and environment of the Beibu Gulf urban agglomeration needs to be improved. In general, the marine resources and environment impact subsystem evaluation value of the Beibu Gulf Urban Agglomeration shows a rising trend year by year, but the rising trend is not obvious. Zhanjiang, Maoming, Yangjiang, and Haikou had relatively good marine resources and environmental impact subsystems in recent years, with high treatment and utilization rates of pollutants and relatively stable increases in the number of relevant practitioners, and the quality of the marine environment and the number of relevant practitioners has not yet imposed limits on the carrying capacity of marine resources and the environment. Beihai, Qinzhou, and Fangchenggang are more negatively affected, the treatment rate and utilization rate of pollutants in the process of marine economic development is low, and the number of relevant employees has gone low, causing difficulties in breaking through the bottleneck in the assessment value of the marine resources and environmental impact subsystem. Therefore, to alleviate the negative impact of marine economic development, attention should be paid to green development and the development and use of new clean energy in the development and use of marine resources; in the monitoring of the marine ecological environment, a reasonable evaluation mechanism of marine resources and environment should be established, the monitoring of the marine environment should be increased, the discharge of marine industrial pollutants should be strictly controlled and the utilization rate of pollutants should be increased (Figure 6).
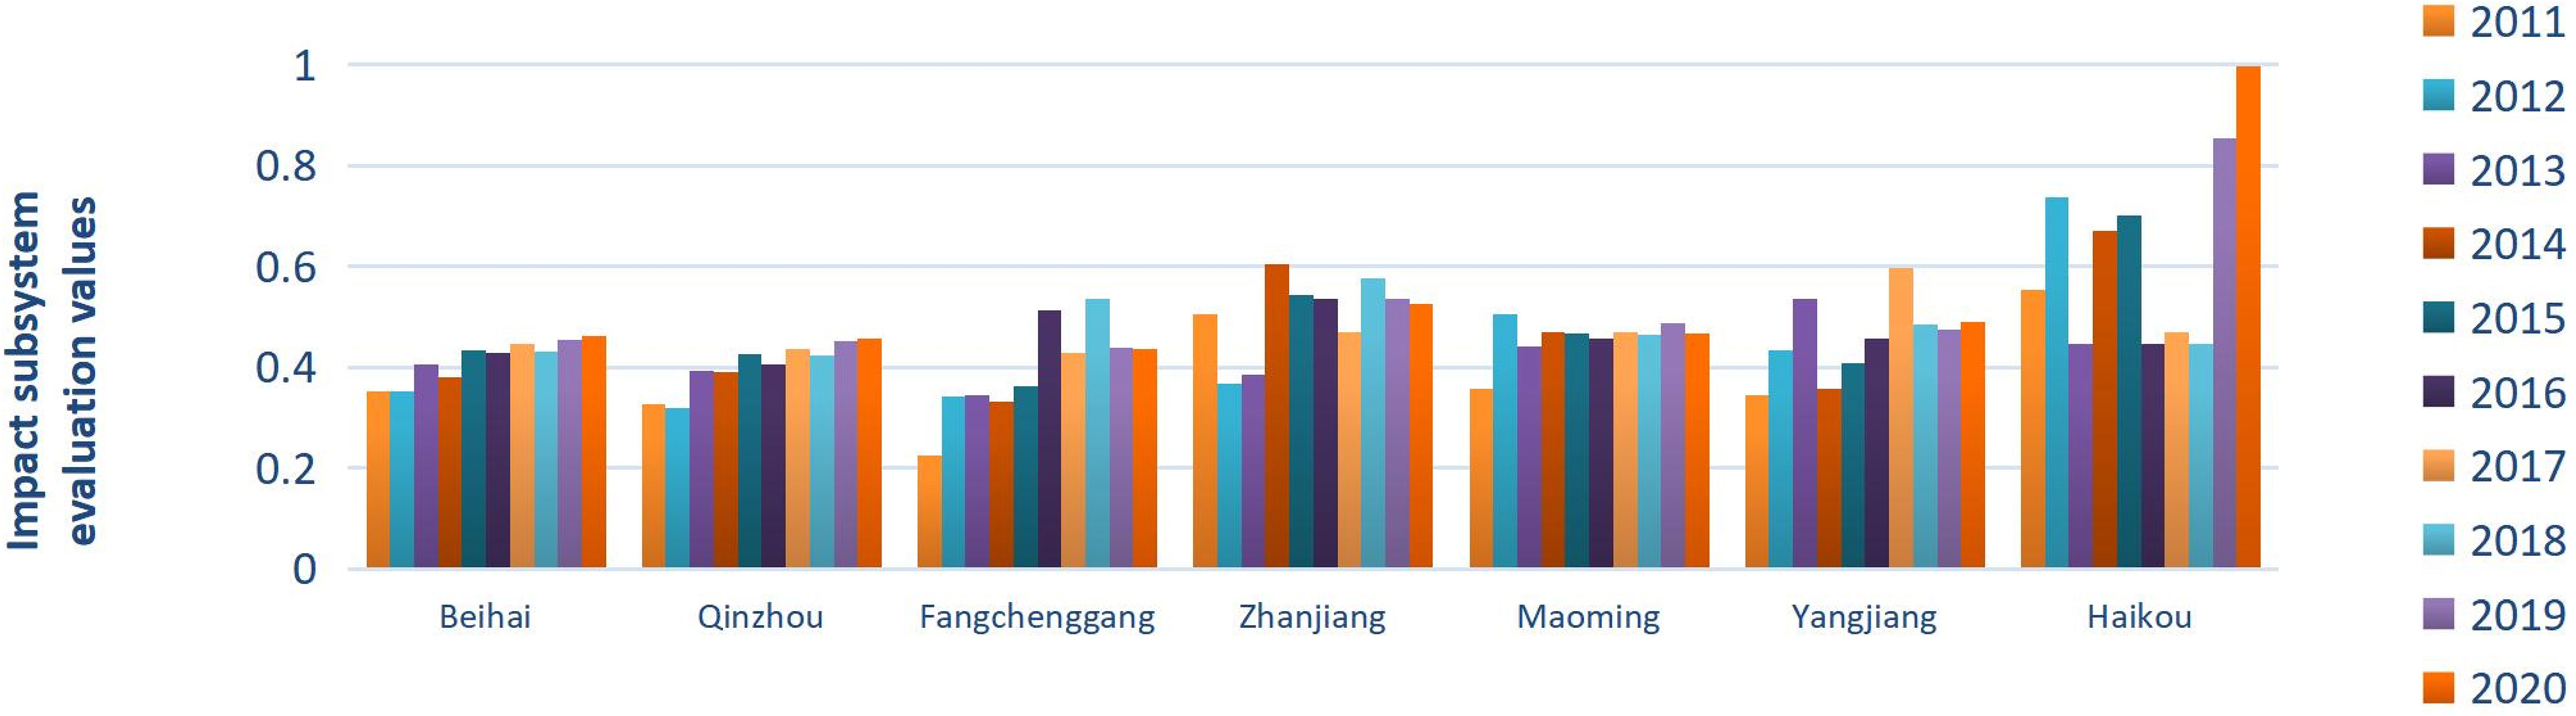
Figure 6 Sub-system evaluation of the environmental impact of marine resources in seven coastal cities in the Beibu Gulf Urban Agglomeration, 2011-2020.
Response subsystem: The seven coastal cities in the Beibu Gulf Urban Agglomeration have taken measures of varying degrees of response in the face of the drivers and pressures on marine resources and the environment. Zhanjiang, Maoming, and Yangjiang have achieved better management results by building marine nature reserves, expanding the greening coverage of built-up areas, promoting the implementation of various marine environmental management projects, increasing government funding for marine environmental management, and increasing investment in marine science and technology to promote the transformation and application of scientific and technological achievements, which has led to the continuous improvement of the marine resources and environment response subsystem assessment value. Beihai, Qinzhou, and Haikou's marine resources and environment response subsystem evaluation value is generally maintained in the range of 0.3-0.5, and the marine management policies and measures have achieved better results and the response factors have continued to improve; the marine management policies and measures implemented by Fangchenggang have achieved lower response effects, and the marine environment governance capacity and marine science and technology research and development level can hardly adapt to the needs of Fangchenggang's rapid marine economic growth in recent years. The government's investment in marine environmental governance, marine science, technology, and education needs to be improved (Figure 7).
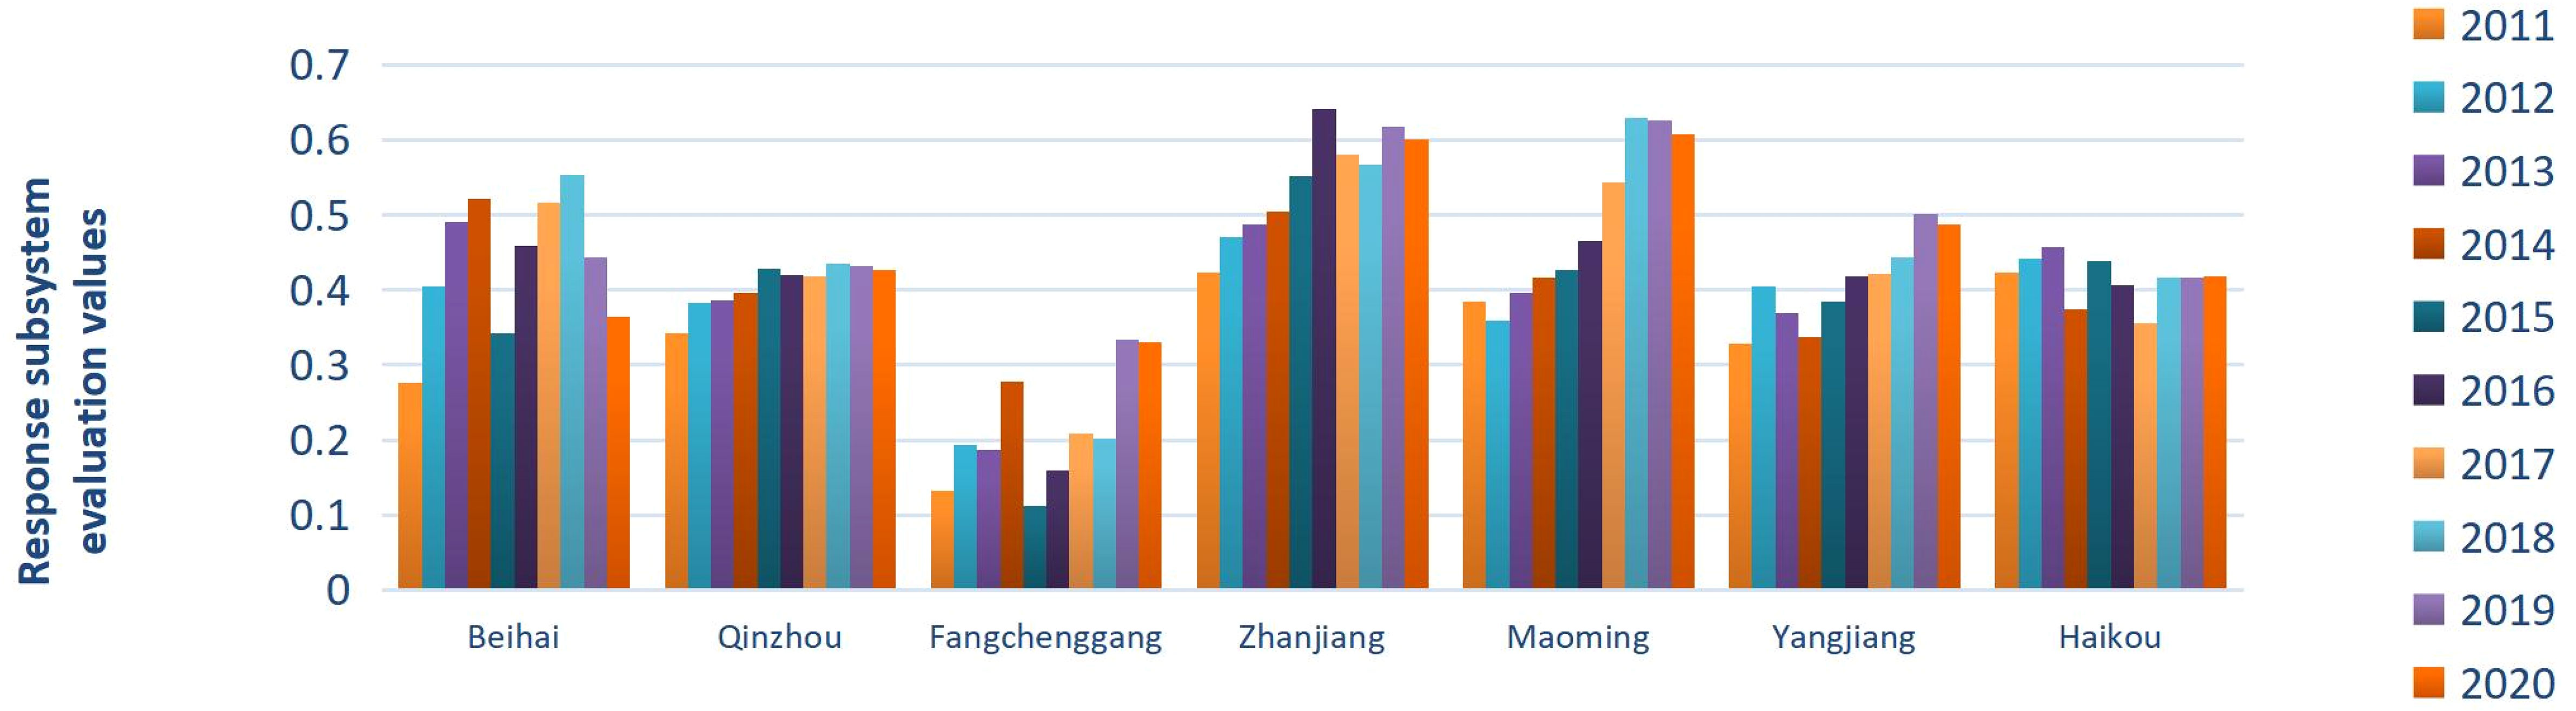
Figure 7 Evaluation of the marine resources and environmental response subsystem of seven coastal cities in the Beibu Gulf Urban Agglomeration, 2011-2020.
3.2 Analysis of barriers to the carrying capacity of marine resources and environment in the Beibu Gulf Urban Agglomeration
3.2.1 Analysis of the barriers to individual indicators
In this paper, we use the barrier degree calculation formula to measure the barrier degree of individual indicators of marine resources and environment-carrying capacity of seven coastal cities in the Beibu Gulf Urban Agglomeration in 2020. As can be seen from Table 3, the main single indicator barriers to the marine resources and environment carrying capacity level of the Beibu Gulf Urban Agglomeration in 2020 include the length of coastline per capita, aquatic production per capita, total import and export volume, port cargo throughput, scientific research and technical services and the number of employees in the geological exploration industry. Combined with the changes in the marine resources and environmental carrying capacity of the seven coastal cities in the Beibu Gulf Urban Agglomeration from 2011 to 2020, although the Beibu Gulf Urban Agglomeration has actively adopted and implemented various policies and measures for the environmental protection and management of marine resources, the implementation of the existing policies and measures has had limited effect with the high growth of the marine economy. To adapt to the rapid development of the marine economy, the Beibu Gulf Urban Agglomeration should mitigate the negative impact of the rapid growth of the marine economy on the marine resources and environment through the rational development and utilization of marine resources, the transformation of the traditional marine industry structure, and increasing the training and introduction of talents in the field of marine development.
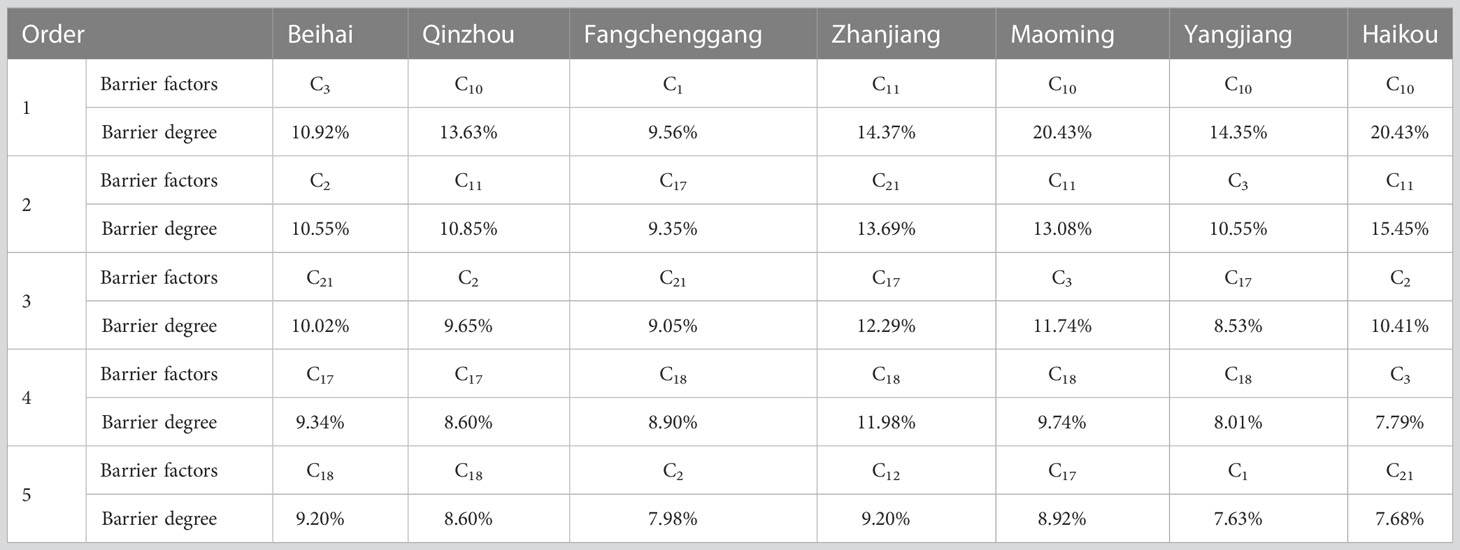
Table 3 Ranking of the barrier degree of individual indicators of marine resources and environmental carrying capacity of seven coastal cities in the Beibu Gulf Urban Agglomeration in 2020.
3.2.2 Analysis of obstacles to classification indicators
According to the calculation results of the barrier degree of individual indicators, further measure the barrier degree of each classification indicator of the marine resources and environment carrying capacity of the seven coastal cities in the Beibu Gulf Urban Agglomeration in 2020, study and analyze the barrier situation of each classification indicator, the specific measurement results are shown in Table 4.
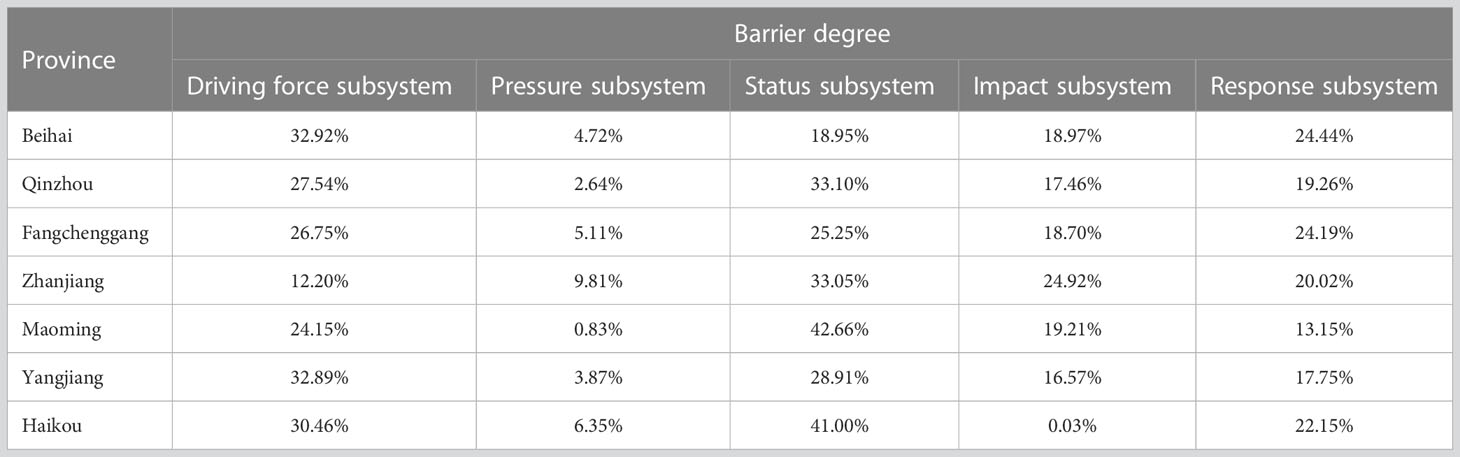
Table 4 Barriers to marine resources and environmental carrying capacity classification indicators for seven coastal cities in the Beibu Gulf Urban Agglomeration in 2020.
According to the measurement results of the barrier degree of the marine resources environment bearing capacity of the seven coastal cities in the Beibu Gulf Urban Agglomeration in 2020, combined with the changes of the marine resources environment subsystem bearing capacity of the seven coastal cities in the Beibu Gulf Urban Agglomeration from 2011 to 2020, we can see that although the specific values of the barrier degree of each subsystem of the marine resources environment bearing capacity of the seven coastal cities in the Beibu Gulf Urban Agglomeration are different, the overall From an overall perspective, the state subsystem is the main categorical indicator obstacle factor for the carrying capacity of marine resources and environment in the seven coastal cities of the Beibu Gulf Urban Agglomeration, followed by the driving force subsystem and the impact subsystem, and the specific ranking of the categorical indicator obstacle degree is: state > driving force > impact > response > pressure. Therefore, against the background of rapid development of the marine economy and increasing pressure on marine resources and the environment, the Beibu Gulf Urban Agglomeration should focus on improving the state subsystem, improving the effectiveness of the governance of marine resources and environment, and optimizing the state of marine resources and environment, while taking into account the driving force subsystem and impact subsystem, to achieve steady economic and social development and strict monitoring of the marine environment, and jointly play an active role in improving the marine resources and environment of the Beibu Gulf Urban Agglomeration. This will help to achieve steady economic and social development and strict monitoring of the marine environment, and together play an active role in improving the marine resource and environmental carrying capacity of the Beibu Gulf Urban Agglomeration.
4 Conclusion
From the evaluation results of the marine resources and environmental carrying capacity, the marine resources and environmental carrying capacity of the seven coastal cities in the Beibu Gulf Urban Agglomeration fluctuated to a certain extent from 2011 to 2020, indicating that socio-economic development has a greater impact on the development of marine resource protection. After entering 2016, marine resources and marine environment issues have attracted more and more attention from society and governments at all levels, and the seven coastal cities in the Beibu Gulf Urban Agglomeration have actively responded to the national call to reasonably develop and use marine resources and increase the management of the marine ecological environment so that the marine resources and environment carrying capacity has been restored and generally shows an upward trend. Among the various subsystems of marine resources and environment, the pressure subsystem and response subsystem have higher evaluation values, while the evaluation of the driving force, state, and impact subsystem needs to be improved, indicating that the marine environment pollution in the Beibu Gulf Urban Agglomeration is more serious and puts greater pressure on the carrying capacity of marine resources and environment, and the Beibu Gulf Urban Agglomeration has actively taken response measures to alleviate the pressure on the carrying capacity of marine resources and environment with better results, but more effective governance measures should be taken to increase the supply of marine resources, give full play to the advantages of green ecological regulation, improve the treatment rate and utilization rate of pollutants, stabilize the increase in the number of relevant practitioners, and promote comprehensive socio-economic development.
From the results of the barrier factor measurement and analysis, among the specific indicators of each subsystem, the main single indicator barrier factors affecting the marine resources and environment carrying capacity of the Beibu Gulf Urban Agglomeration include per capita coastline length, per capita fish production, total import and export volume, port cargo throughput, scientific research and technical services and the number of employees in the geological exploration industry. The measurement results of the barrier degree of each classification indicator reflect that the state subsystem is the main classification indicator barrier factor of the marine resources and environment carrying capacity of the seven coastal cities in the Beibu Gulf Urban Agglomeration, followed by the driving force subsystem and the influence subsystem, and the specific ranking of the classification indicator barrier degree is state > driving force > influence > response > pressure. Therefore, to further improve the marine resources and environment carrying capacity of the Beibu Gulf Urban Agglomeration, we should focus on the state subsystem, balance the driving force subsystem and the impact subsystem, and mitigate the negative impacts brought about by the growth of the marine economy by improving the effectiveness of marine resources and environment management, promoting steady economic and social development, and strictly monitoring the marine environment.
5 Discussion
According to the empirical results and the actual development of the Beibu Gulf urban agglomeration, the three aspects of developing marine industries, building coastal economic zones, and protecting the marine environment should be taken as the starting point to improve the level of marine resources and environmental carrying capacity of the Beibu Gulf urban agglomeration and promote the comprehensive social and economic development of the Beibu Gulf urban agglomeration.
Cultivate and develop modern marine industries and build a modern marine industrial system. Based on the advantages of marine resources in the Beibu Gulf Urban Agglomeration and the actual needs of marine development and utilization, and relying on the manufacturing base and science and technology of each coastal city, we will build a marine industry system with modern marine industries as the core. Through the cultivation and development of modern marine industries, the dependence of economic growth on traditional marine industries will be gradually reduced, making modern marine industries the pillar of the marine industrial system; through the method of steadily optimizing the primary marine industry, strongly supporting the secondary marine industry and focusing on the development of the tertiary marine industry, the proportion of the tertiary marine industry will be increased, realizing the restructuring and optimization of the marine industry and promoting the construction of a modern marine industrial system. The process of the marine industry restructuring and optimization, promoting the construction of a modern marine industry system, and effectively alleviating the pressure on marine resources and environment.
Accelerate the construction of the coastal economic belt and increase the openness of the marine economy. Building the coastal economic belt is a key task for the future development of the Beibu Gulf Urban Agglomeration. We will accelerate the formation of a maritime open channel starting from the Beibu Gulf port cluster and a land open channel supported by border crossings, and orderly promote the construction of open platforms such as key development and opening-up pilot zones, border economic cooperation zones and the "two-country double park" between China and Malaysia. We will give full play to the advantages of land and sea links with ASEAN countries, strengthen the construction of the China - South China Peninsula land-based international corridor, build a hub of international corridors with convenient links to ASEAN countries, strengthen the development of linkages with the Guangdong-Hong Kong-Macao Greater Bay Area and the Pearl River-Xijiang Economic Belt, optimize regional cooperation mechanisms, and accelerate the formation of a new pattern of coordinated interaction and complementary advantages between the eastern, central and western regions. The new development pattern of the Beibu Gulf Urban Agglomeration will improve the degree of openness of the marine economy and provide a sufficient driving force for the development of the marine economy of the Beibu Gulf Urban Agglomeration.
Carry out marine environmental protection comprehensively and holistically to achieve high-quality development of the marine economy. Governments at all levels in the Beibu Gulf Urban Agglomeration should consider all types of ecological factors and carry out marine environmental protection in a holistic manner. At present, the coastal cities in the Beibu Gulf Urban Agglomeration have taken a series of measures and methods to improve the quality of the marine environment through the construction of the "Marine Ecological Civilization Demonstration Zone" and the "Blue Ecological Bay Area", and have achieved certain the expected results have been achieved. Governments at all levels in the Beibu Gulf Urban Agglomeration should ensure all-round protection of the marine environment and realize high-quality development of the marine economy in the Beibu Gulf Urban Agglomeration by improving the ecological monitoring and control mechanism, perfecting the coordination mechanism for pollution control, and emphasizing the combination of systematic restoration and comprehensive treatment.
Data availability statement
The datasets presented in this study can be found in online repositories. The names of the repository/repositories and accession number(s) can be found below: the original data of the indicators used in this study were obtained from 2011 to 2020 from China Tertiary Industry Statistical Yearbook (http://www.stats.gov.cn/sj/), China Transport Statistical Yearbook (https://www.mot.gov.cn/tongjishuju/), China Transport Yearbook (https://www.mot.gov.cn/tongjishuju/), China Urban Statistical Yearbook (https://data.cnki.net/v3/trade/yearbook/Single/N2022040095?zcode=Z023) and the statistical yearbooks of seven coastal cities; the data on environmental pressure and environmental management were mainly obtained from 2011 to 2020 from China Marine Statistical Yearbook (http://mds.nmdis.org.cn/pages/ocean_list.html), China Environmental Statistical Yearbook (https://navi.cnki.net/knavi/yearbooks/YHJSD/detail), China Urban Construction Statistical Yearbook (http://www.stats.gov.cn/sj/), Guangdong Statistical Yearbook (http://stats.gd.gov.cn/gdtjnj/) and the environmental situation bulletins of seven coastal cities for the past years; Data on resource pressure and resource use were mainly obtained from 2011 to 2020 from the China Energy Statistical Yearbook (https://data.cnki.net/v3/trade/yearbook/Single/N2022060061?zcode=Z023) and the statistical bulletins on national economic and social development of the seven coastal cities in previous years, with data on individual indicators calculated by means of the corresponding formulae.
Author contributions
YL and LS conceptualized the study framework and prepared the original draft, acquired funding and supervised the study. ZW organized the data and resources. HL proofread the article for formatting and grammar. All authors contributed to the article and approved the submitted version.
Funding
This study was funded by Beibu Gulf Ocean Development Research Center under Key Research Base of Humanities and Social Sciences in Guangxi Universities and Marine Science Program for Guangxi First-Class Discipline, Beibu Gulf University.
Conflict of interest
The authors declare that the research was conducted in the absence of any commercial or financial relationships that could be construed as a potential conflict of interest.
Publisher’s note
All claims expressed in this article are solely those of the authors and do not necessarily represent those of their affiliated organizations, or those of the publisher, the editors and the reviewers. Any product that may be evaluated in this article, or claim that may be made by its manufacturer, is not guaranteed or endorsed by the publisher.
References
Bai X. W., Zhao P. P., Dai Y. M., Shen X. M. (2022). Carrying capacity of water resources along Yangtze river economic belt under the river chief system. Ecol. Economy 38, 190–197.
Batty M. (2000). Less is more, more is different: complexity, morphology, cities, and emergence. Environ. Plann. B.: Plann. Design 27, 167–168. doi: 10.1068/b2702ed
Cantasano N., Pellicone G., Letto F. (2017). Integrated coastal zone management in Italy: a gap between science and policy. J. Coast. Conserv. 21, 317–325. doi: 10.1007/s11852-016-0479-z
Chen Z. G. (2021). The study of status, factors and spatial analysis of natural capital utilization in the beibu gulf city cluster. Ecol. Economy 37, 171–178.
Chen M. H., Chen F., Tang C. J., Lu Y., Feng Y. X. (2022). Integration of DPSIR framework and TOPSIS model reveals insight into the coastal zone ecosystem health. Ocean Coast. Manage. 226, 106285. doi: 10.1016/j.ocecoaman.2022.106285
Chen Z. G., Yao J. (2021). An empirical study on the spatial and temporal differentiation of ecological footprint, ecological bearing capacity and economic contribution: taking beibu gulf city cluster as an example. Ecol. Economy 37, 156–162.
Cisneros H. M. A., Sarmiento R. N. V., Delrieux C. A., Piccolo M. C., Gerardo P. M. E. (2016). Beach carrying capacity assessment through image processing tools for coastal management. Ocean Coast. Manage. 130, 138–147. doi: 10.1016/j.ocecoaman.2016.06.010
Di Q. B., Wu T. (2018). Spatial-temporal evolution characteristics and influencing factors of carrying capacity of marine resources in China. Geogr. Geo-Information Sci. 34, 121–126.
Dong S. C., Li Z. H., Shi G. Y., Zheng J., Xia B., Guo X. J., et al. (2022). Evaluation of the competitiveness of prefecture-level cities in the west and the layout of national new areas in the 14th five-year plan. J. Natural Resour. 37, 1657–1672.
Elliott M., Burdon D., Atkins J. P., Borja A., Cormier R., de Jonge V. N., et al. (2017). “And DPSIR begat DAPSI(W)R(M)!” - a unifying framework for marine environmental management. Mar. pollut. Bull. 118, 27–40. doi: 10.1016/j.marpolbul.2017.03.049
Gai M., Zhong L. D., Ke L. N. (2018). Spatio-temporal law and coordinated development of the carrying capacity of marine environmental resources and economic system in China. Acta Ecol. Sin. 38, 7921–7932.
Gou Y. J., Lu W. W. (2020). Evaluation of ecological civilization construction based on combinatorial weighted TOPSIS model: a case study of qinghai province. Stat Decision 36, 57–60. doi: 10.13546/j.cnki.tjyjc.2020.24.012
Hietala R., Ijäs A., Pikner T., Kull A., Printsmann A., Kuusik M., et al. (2021). Data integration and participatory process in developing integrated coastal zone management (ICZM) in the northern Baltic Sea. J. Coast. Conserv. 25, 47. doi: 10.1007/s11852-021-00833-4
Hobday A. J., Maxwell S. M., Forgie J., Mcdonald J., Powers A. (2014). Dynamic ocean management: integrating scientific and technological capacity with law, policy and management. Stanford Environ. Law J. 33, 125–165.
Hu S. D., Li Z. H. (2022). Performance analysis of marine ecological environment governance based on dpsir and entropy weight TOPSIS model. Mobile Inf. Syst. 2022, 1–10. doi: 10.1155/2022/9224879
Jia Y. Z., Wang H. (2023). Study on water resource carrying capacity of zhengzhou city based on DPSIR model. Int. J. Environ. Res. Public Health 20, 1394. doi: 10.3390/ijerph20021394
Kelble C. R., Loomis D. K., Lovelace S., Nuttle W. K., Ortner P. B., Fletcher P., et al. (2013). The EBM-DPSER conceptual model: integrating ecosystem services into the DPSIR framework. PloS One 8, e70766. doi: 10.1371/journal.pone.0070766
Li G. P. (2022). Take multiple measures to promote the high-quality development of china's urban agglomerations. Acad. Front. 254, 18–28. doi: 10.16619/j.cnki.rmltxsqy.2022.22.002
Li J. L., Shen M. H., Ma R. F., Yang H. S., Chen Y. N., Sun C. Z., et al. (2022). Marine resource economy and marine strategy in the context of marine ecological civilization construction. J. Natural Resour. 37, 829–849.
Liao V. T. C. (2018). The analysis of maintaining biodiversity, integrated coastal zone management and environmental impact assessment for marine spatial planning. J. Mar. Sci.: Res. Dev. 08.
Liu L. X., Liang H. Y., Zhang J. (2023). Research on the level of quality development and coupling and coordination of china's marine economy. Mar. Economy 13, 115–126. doi: 10.19426/j.cnki.cn12-1424/p.2023.01.008
Liu Y. Y., Wang S. Q., Wang X. B., Jiang D., Ravindranath N. H., Rahman A., et al. (2020). Flood risk assessment in Bangladesh, India and Myanmar based on the AHP weight method and entropy weight method. Geographical Res. 39, 1892–1906. doi: 10.11821/dlyj020190679
Pan S. N., Li B. W., Nie H. G. (2019). Comprehensive evaluation and obstacle factor analysis of the sustainable development of china's low carbon economic transformation. Inq. Into Econom. Issues 443, 165–173.
Qi X., Liu W., Wan X., Song L. L. (2022). Development results and suggestions for new passages of international land and sea trade. J. Int. Econom. Cooperation 420, 14–22+86.
Shao C. F., Ju M. T. (2010). Study of the index system of low-carbon cities based on the DPSIR model. Ecol. Econom. 230, 95–99.
Shen X. M., Jiang M. D. (2018). Study on the comprehensive evaluation system of river chief system based on DPSIRM model. Yellow River 40, 78–84+90.
Song S. B., Du Y. W. (2019). The environmental carrying capacity of marine resources in the offshore areas of the Yangtze river economic belt in China. J. Coast. Res. 98, 14–17, 4.
Song Z. M., Ning L. (2020). Evaluation and obstacle factors of marine resources and environment carrying capacity of coastal provinces and cities in China based on DPSIR-TOPSIS model. Ecol. Economy 36, 154–160+212.
Stojanovic T. A., Farmer C. J. Q. (2013). The development of world oceans & coasts and concepts of sustainability. Mar. Policy 42, 157–165. doi: 10.1016/j.marpol.2013.02.005
Theodora Y., Spanogianni E. (2022). Assessing coastal urban sprawl in the athens’ southern waterfront for reaching sustainability and resilience objectives. Ocean Coast. Manage. 222, 106090. doi: 10.1016/j.ocecoaman.2022.106090
Wang S. L., Liao X. (2022). Construction and promotion path of the hunan and guangxi marine economic corridor. Soc. Scientist 299, 88–97.
Wang M. G., Yang H. (2021). Research on personal credit risk assessment model based on instance-based transfer learning (Cham: Springer International Publishing), 159–169.
Wang J. X., Yang Y. K., Sheng Q. (2022). Evaluation of water resources carrying capacity in gansu province based on improved TOPSIS model. Water Resour. Power 40, 35–39. doi: 10.20040/j.cnki.1000-7709.2022.20220149
Westing A. H. (1989). The environmental component of comprehensive security. Bull. Peace Proposals 20, 129–134. doi: 10.1177/096701068902000203
Yu Z., Di Q. B. (2020). The coordination between maritime economies and marine carrying capacity and their spatiotemporal evolution in the cities of the bohai rim in china. Ecol. Model. 438, 109192. doi: 10.1016/j.ecolmodel.2020.109192
Zhang J., Ning L., Cao Y. C. (2020). Evaluation of the environmental bearing capacity of marine resources based on entropy weight TOPSIS model: taking guangdong province as an example. Ecol. Economy 36, 162–167.
Zhang Q. F., Xiao Y., Tang X., Huang H. (2022). The spatial-temporal evolution and influencing factors of eco-efficiency in the five major urban agglomerations of China. Econom. Geogr. 42, 54–63. doi: 10.15957/j.cnki.jjdl.2022.11.007
Zhou R. X., Pan Z. W., Jin J. L., Li C. H., Ning S. W. (2017). Forewarning model of regional water resources carrying capacity based on combination weights and entropy principles. Entropy 19, 574. doi: 10.3390/e19110574
Keywords: Beibu Gulf Urban Agglomeration, marine resources and environmental carrying capacity, marine economy, DPSIR-TOPSIS model, obstacle model
Citation: Li Y, Sun L, Wu Z and Liu H (2023) Evaluation and obstacle factors of marine resources and environment carrying capacity in Beibu Gulf Urban Agglomeration. Front. Mar. Sci. 10:1196196. doi: 10.3389/fmars.2023.1196196
Received: 29 March 2023; Accepted: 08 May 2023;
Published: 18 May 2023.
Edited by:
Peng Lin, University of Georgia, United StatesReviewed by:
Yi-Che Shih, National Cheng Kung University, TaiwanHu Qiuguang, Ningbo University, China
Copyright © 2023 Li, Sun, Wu and Liu. This is an open-access article distributed under the terms of the Creative Commons Attribution License (CC BY). The use, distribution or reproduction in other forums is permitted, provided the original author(s) and the copyright owner(s) are credited and that the original publication in this journal is cited, in accordance with accepted academic practice. No use, distribution or reproduction is permitted which does not comply with these terms.
*Correspondence: Liang Sun, 1443521987@qq.com