Seascape ecology in the vicinity of a Blake Ridge cold seep
 Kellie Johnson1*
  Avery Taylor1
  Annika Socha1
  Ellie Barkyoumb1
  Koichi Nakamura2† Carl L. Kaiser3†
  Christopher R. German4
  Dana R. Yoerger3
  Cindy Lee Van Dover1
- 1Division of Marine Science and Conservation, Nicholas School of the Environment, Duke University, Beaufort, North Carolina, NC, United States
- 2The Research Institute of Geology and Geoinformation, National Institute of Advanced Industrial Science and Technology, Tsukuba, Japan
- 3Applied Ocean Physics and Engineering, Woods Hole Oceanographic Institution, Woods Hole, Massachusetts, MA, United States
- 4Geology and Geophysics, Woods Hole Oceanographic Institution, Woods Hole, Massachusetts, MA, United States
Systematic surveys of the distribution of epibenthic megafaunal species relative to one another and to environmental variables in the deep sea can lead to inferences and testable hypotheses regarding factors that influence their distributions. Here we use a seascape approach to provide insight into the character and spatial extent of the influence of a chemosynthetic seep on the distribution of epibenthic megafauna and the nature of transition zones (ecotones). Faunal distributions were determined from georeferenced images of the seabed collected during a systematic survey (~ 400 m x 400 m) by the Autonomous Underwater Vehicle Sentry in the vicinity of a newly discovered methane bubble plume on the Blake Ridge Diapir. The survey area was found to include both seep and non-seep habitats. The sphere of influence of seep productivity on the surrounding benthic megafaunal assemblage was limited—on the order of 10’s of meters—based on ecotone analysis. Small but detectable redox anomalies in the water column (5 m above bottom) in the study area occurred on a similar horizontal scale. Distributions of background megafaunal taxa were non-random for many morphotypes and included both positive and negative associations between morphotypes and the seep habitat. Subtle variations in depth (<6 m) correlated with distributions of seep-associated vesicomyid clams, which occupy shallow depressions in the seabed. The seep habitat itself, comprising a patchy mosaic of megafaunal sub-communities (e.g., clam bed, mussel bed, background soft-sediment bathyal taxa) and transition zones, was at least as diverse as the surrounding non-seep habitat and contributes seep endemic morphotypes to regional biodiversity. While seep productivity may support prey fields for deep-diving beaked whales, any relationship between the seeps and whale feeding areas remains intriguing speculation. Like many other regions of the deep sea, Blake Ridge South has accumulated marine litter, including litter likely originating from scientific endeavors. The suite of observations and analyses deployed here underscore the importance of seep habitats in enriching regional biodiversity, provide a glimpse of the non-random complexity of species distributions from a seascape perspective, and establish ecological baselines against which future studies may measure natural and anthropogenic changes in the seascape.
1 Introduction
Study of the seascape ecology of deep-sea ecosystems can provide insight into complex spatial relationships between environmental variables and community structure, as well as inform environmental management of the seabed (Pittman et al., 2021; Swanborn et al., 2022). Similar to landscape ecology, seascape ecological approaches focus on pattern-oriented assessment, with an emphasis on composition, configuration, spatial transitions, and context, and on linking spatial patterns with biodiversity and ecological processes (Swanborn et al., 2022). Advances in the acquisition of systematically collected, georeferenced images and environmental data by remotely operated and autonomous underwater vehicles (Huvenne et al., 2018), enable new assessments of seascape ecology (Pittman, 2017) in the deep sea (Wagner et al., 2013; Price et al., 2019; Sen et al., 2019; Goffredi et al., 2020; Piechaud and Howell, 2022; Swanborn et al., 2022).
Several recent examples of seascape approaches in the deep sea address the “sphere of influence” of chemosynthetic ecosystems (Levin et al., 2016). Such examples include mapping of feather-duster (serpulid) polychaetes hosting methanotrophic symbionts adjacent to seep-endemic taxa (tubeworms, mussels) at the Jaco Scar seep site off the west coast of Costa Rica (Goffredi et al., 2020) and evidence for an ecotone surrounding the Jaco Scar seep and 4 other nearby seeps (Ashford et al., 2021a). Observations of ecotones associated with deep-sea chemosynthetic ecosystems date back to initial descriptions of hydrothermal-vent ecosystems on the Galapagos Spreading Center, where vent-endemic tubeworms, mussels, clams, and associated macroinvertebrates occupied zones in the hydrothermal heart of vent fields, surrounded by peripheral fields of anemones and serpulid worms (Hessler and Smithey, 1982). Increased abundances of predators (Van Dover et al., 1987; MacAvoy et al., 2008) and of infauna (Demopoulos et al., 2018) have also been reported in ecotones associated with chemosynthetic ecosystems. In addition to serving as prey fields for predators, benthic ecotones at deep-sea seeps and vents implicate local export of chemosynthetic energy as particulate organic material or advection of dissolved methane and microbial primary production (Hessler and Smithey, 1982; Goffredi et al., 2020). This larger sphere of influence of chemosynthetic ecosystems is hypothesized to be important in generating ecosystem services (Levin et al., 2016), though for most chemosynthetic systems there is a paucity of detail regarding the nature and extent of these ecotones and the services they provide.
Occupation of seep environments by heterotrophic species from the surrounding benthos does take place, but only a few background species are involved (Carney, 1994). Georeferenced species occurrences can be used to assess the distribution of benthic species across an ecotone, allowing taxa to be characterized in terms of positive (spatially aggregated), negative (spatially segregated) and random associations (Royan et al., 2016; Astarloa et al., 2019; Calatayud et al., 2020) relative to the seep habitat.
Spatial organization data alone does not confirm cause and effect, and spatial associations may be poor proxies for biotic interactions or habitat preferences in the absence of additional information (Blanchet et al., 2020). But spatial organization of species can lead to inferences and testable hypotheses regarding factors that influence their distributions and ecosystem functions that may be reflected in those distributions (Lessard-Pilon et al., 2010; Ashford et al., 2021a). Associations and interactions between and among taxa and environmental variables (e.g., resource use or avoidance) can improve our understanding of factors resulting in non-random species distributions in space and time (Tumolo et al., 2020).
Here we use a seascape approach to i) define the boundary of a seep habitat in an ~400 m x 400 m study area and the location of redox (Eh) anomalies relative to the seep habitat, ii) describe and compare seep and non-seep megafaunal epibenthic community structure, including alpha and beta diversity, rank abundance, and ordination by habitat and within the context of subtle variations in depth, iii) identify positive, negative, and random distributions of taxa relative to the seep boundary, co-occurrences, associations, and networks of benthic morphotypes, and iv) explore evidence for ecotones between seep and non-seep habitats. We also describe the spatial distribution and abundance of purported feeding scars of beaked whales (Ziphius cavirostris; Marsh et al., 2018) and marine litter. Insights gained from this work may inform future environmental management of the Blake Ridge seep system, especially if methane reserves in the region prove to be a target for exploitation (Sahu et al., 2020).
1.1 Blake Ridge study site
Methane seepage and chemosynthetic activity at the Blake Ridge Diapir was first discovered during site surveys by the Ocean Drilling Program (ODP; Site 996, 2155 m) in 1995 (Paull et al., 1996). Evidence for a methane seep included gas (bubble) plumes extending up to 320 m above bottom, sediments consisting of 20-40% authigenic carbonate, high concentrations of porewater methane (1000–3400 μM) and sulfide (1300 μM), and a serendipitous collection of bathymodiolin mussels at the sediment-water interface of a sediment core. Deep Submergence Vehicle (DSV) Alvin dives in 2001 enabled extensive in situ visualization of the geological setting, including gas hydrate formation under a carbonate overhang, and of a chemosynthetic community dominated by dense beds of Bathymodiolus heckerae mussels and Vesicomya cf. venusta clams, at ODP Site 996D (Van Dover et al., 2003). Bacterial mats, preliminarily identified as belonging to the genus Arcobacter (Robinson et al., 2004) were also observed. Live clam beds were found in sediment with a wide range of porewater sulfide concentrations [0.1 to 6.4 mmol/L at 10 cm depth; (Heyl et al., 2007)]. At the pore-water interface of live clam beds, sulfide concentrations were low (<1 mmol/L) compared to the higher concentrations found at shell beds with only dead clams [3.3 to 12.1 mmol/L (Heyl et al., 2007)].
Multiple subsurface conduits evident in chirp echosounder 1.5 to 11.5 kHz profiles suggested the presence of a seep complex (Hornbach et al., 2007) at the Blake Ridge Diapir. Three additional seep communities within 200 m of one another and of ODP hole 996 seep site were subsequently discovered using the Autonomous Underwater Vehicle (AUV) Sentry in 2012 (Brothers et al., 2013). High-resolution maps detailed the relationship of seep-associated bivalves and authigenic carbonates at the Main Blake Ridge seep site (Wagner et al., 2013). This present study is the first to describe benthic communities of the Blake Ridge South (BR South) seep and adjacent habitat in detail.
2 Materials and methods
2.1 Data collection
The Blake Ridge Diapir (Figure 1) was mapped by the AUV Sentry operated by the Woods Hole Oceanographic Institution and deployed from the NOAA Ship Okeanos Explorer (EX1205 Leg 1; CLVD, Chief Scientist) from 11 to 23 July 2012. During this technologically innovative expedition, mission programming, engineering troubleshooting, data processing, and watch standing for Sentry were undertaken from shore using a satellite link (Kaiser et al., 2012; Van Dover et al., 2012). Sentry collected high-resolution multibeam (Reson 7125 echosounder, 400 kHz) bathymetric data ~20 m above bottom at Blake Ridge (Figure 1B). Photo transects (~7-s intervals; 12-bit, 1024 x 1024 pixels, down-looking digital color camera) were conducted at an average speed of 0.7 m s-1 and ~5 m above bottom. Bathymetry and image data were digitally transferred to shore daily to support Sentry mission programming.
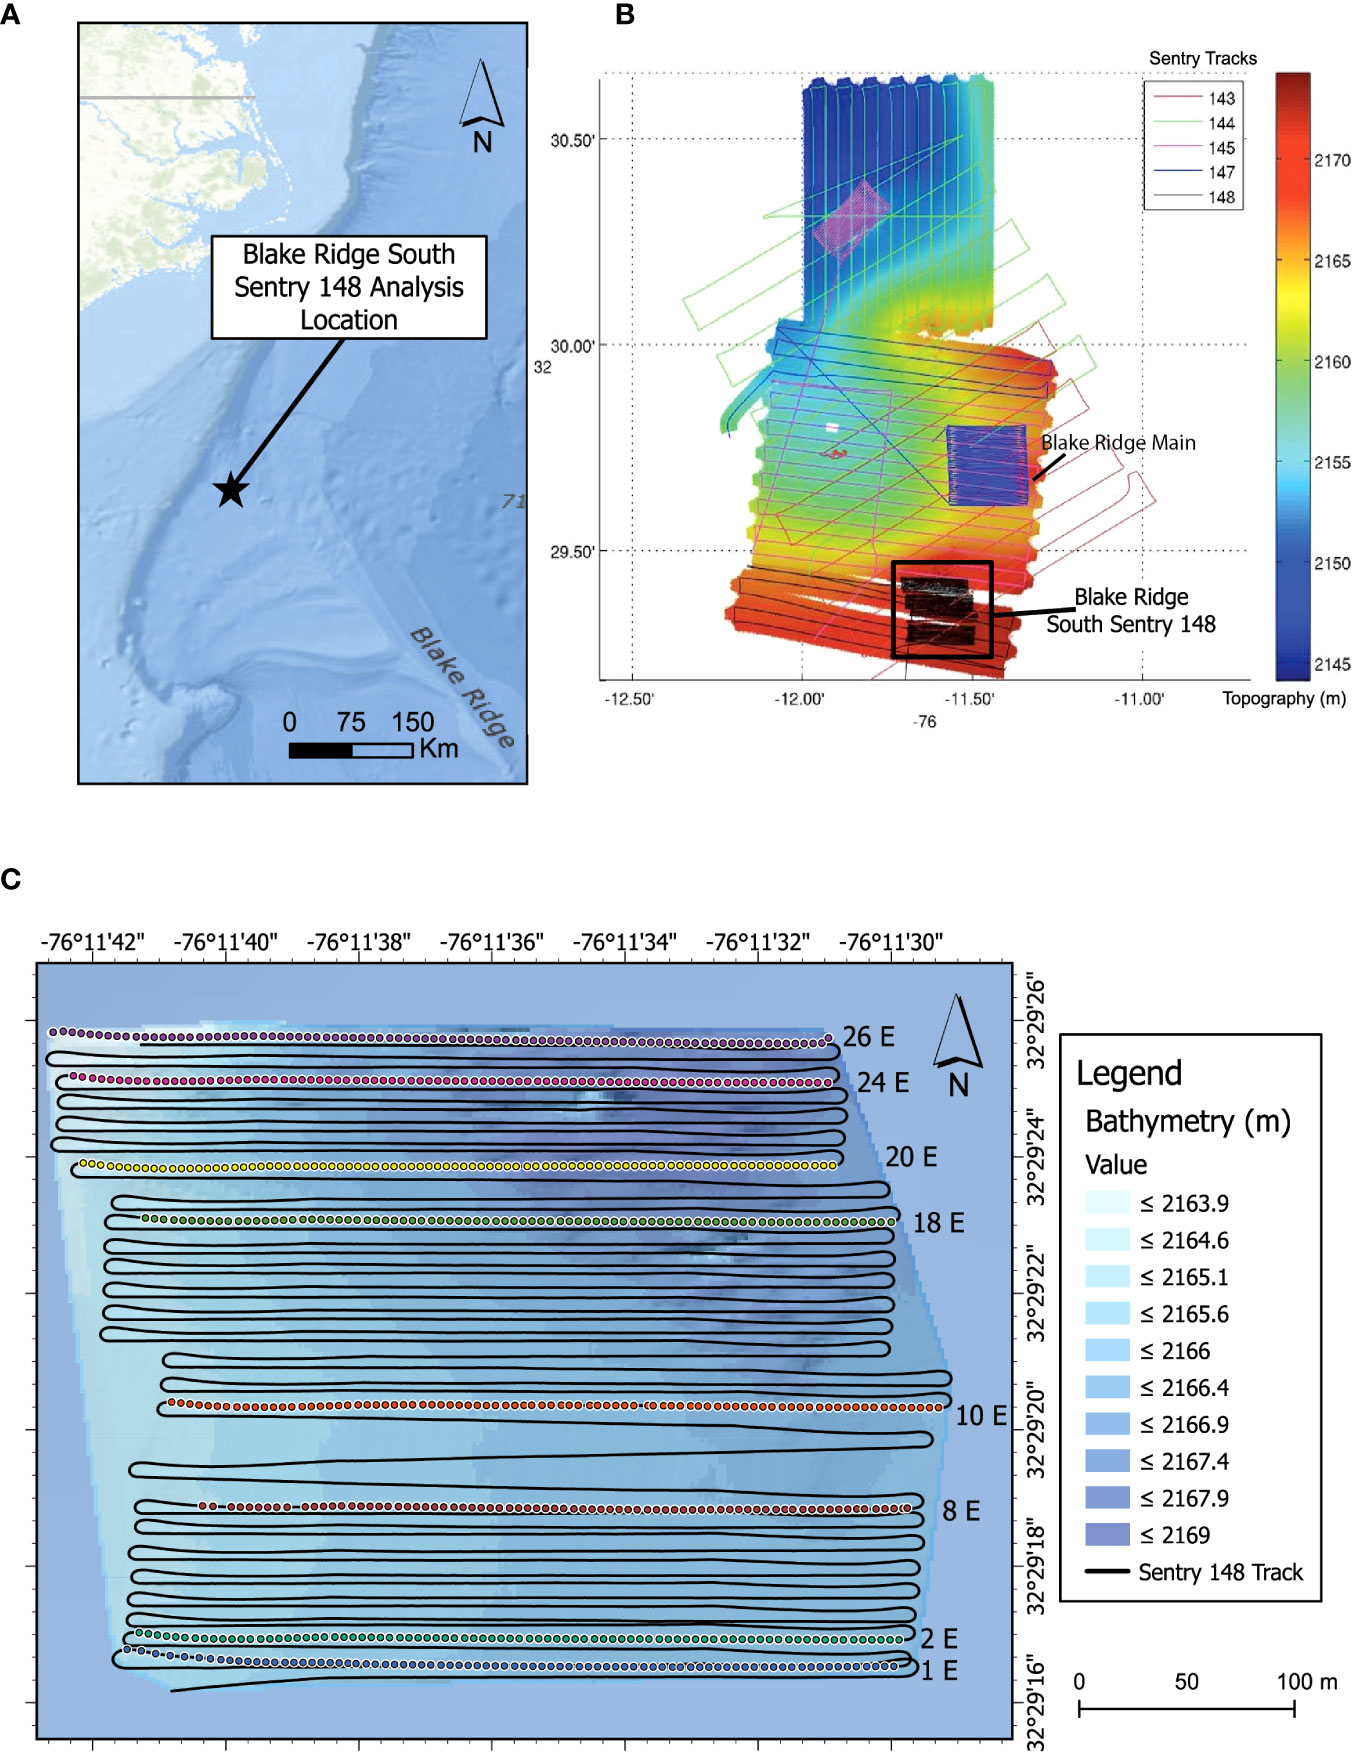
Figure 1 Blake Ridge Study Site. (A) Location relative to the continental margin off the Carolinas (USA). (B) Blake Ridge bathymetry with and all photo transects from the expedition. Colors and numbers indicate different Sentry dives. The black box highlights the location of the Blake Ridge South seep and the photo transects of Sentry 148. White areas: no high-resolution bathymetric data. (C) Bathymetric detail of the Blake Ridge South seep site and location of the eight eastward transect lines used for detailed photo analysis. Colored dots: image locations.
Redox potentials indicative of reducing conditions—a useful exploratory tool for chemosynthetic ecosystems (Henry et al., 2002; Baker et al., 2005; Connelly et al., 2012)—were assessed using an Eh sensor on Sentry. Eh is a measurement of electrical potential indicative of oxidation/reduction potential, and was measured as raw values of platinum electrode voltage against an Ag–AgCl reference electrode in a saturated KCl solution (Nakamura et al., 2000). When the Pt electrode encounters reduced fluids, the Eh value drops rapidly, followed by a logarithmic recovery curve. The sawtooth pattern in the Eh record (Supplementary Figure 1) results from states of disequilibrium experienced by the electrode as the AUV platform moves through the ocean and encounters seawater with differing redox poise. Each rapid drop in Eh voltage is presumed to be related to the moment at which the vehicle encounters fresh sulfide-rich waters at any location as it progresses along a given survey line, resulting in HS- ions reacting at the surface of the Pt electrode. In this context, the recovery curve represents a reverse process during which sulfide deposited on the surface of Pt electrode undergoes oxidation and removal through interaction with well-oxygenated ambient seawater. As such, the recovery curve part of the Eh record has no direct spatial relationship to seafloor fluid flow in the same way as the initial drops in Eh voltage. As an exploration tool, therefore, the negative value of the first derivatives of Eh (i.e., dEh/dt mV s-1) provides a practical approach to identifying locations of rapid Eh drops near the seabed, even though dEh/dt has no direct physical-chemical meaning. An 8-second moving average of dEh/dt was used to avoid analog-digital conversion noise with sufficient spatial resolution. Sentry 148 metadata for the survey area [date, time, depth, latitude, longitude, Eh (mV)] may be found in Supplementary Data 1.
Co-located sensor data collected by Sentry (temperature, salinity) at 5 meters above the bottom varied by fractions of a unit (<0.01C;<0.01 psu) across the survey (very low signal to noise ratio) and were not of ecological interest. While there was a data stream from the dissolved oxygen optode, the sensor was uncalibrated and the signal decayed during the dive by a value equivalent to the variance in the data. Further analysis of the dissolved oxygen data was thus deemed unwarranted.
For this study, only photos from Sentry 148 were analyzed, i.e., from the Blake Ridge South (BR South) seep (Figure 1B, C). A photo atlas (Supplementary Figure 2) was generated to document 46 morphotypes (Supplementary Table 1). Substratum type (soft sediment, carbonate, live mussels, mussel shells, and clams) was noted for each photo. Organisms that were observed but could not be reliably counted due, for example, to their small size or their obscurity among other organisms or background, were not retained in the final data set. Precautions were taken to ensure that the same individual in overlapping photos (either sequentially or between adjacent lines) were not counted twice. We could not estimate the error associated with counting mobile taxa (fish, octopus) more than once, but, based on observation of mobile individuals that did not change their location from one photo to the next, double- (or more) counting was deemed unlikely, except possibly for the halosaurid and synaphobranchid fishes. We also could not distinguish between patches of live and dead clams.
2.1.1 Large-scale mapping
Photo analyses were undertaken at the scale of the entire BR South survey area [~400 m x 400 m (or ~16 hectares, or ~ 22.5 football pitches)] to map the boundaries of the seep habitat, operationally defined here as the polygon encompassing dense live mussels (Bathymodiolus heckerae) and dense clams (Vesicomya cf. venusta)]. Other seep indicators that are obligately restricted to seep environments—authigenic carbonates and bacterial mats on soft sediments—were nested within the mussel and clam bed areas and thus their distribution was not needed to define the seep boundary. Localized fields of short, thready, unsampled tubeworms emergent from soft sediment, tentatively identified as siboglinids based on their morphology and their restricted distribution in the seep habitat, were also assumed to be seep indicators. Distributions of 11 large, reliably, and readily detected invertebrate and fish morphotypes (Supplementary Data 2; Supplementary Figure 3) were mapped for all transect lines (Figure 1C) to visualize their distributions relative to the seep habitat. Observations of sediment ‘gouges’ tentatively attributed to feeding activities of beaked whales ( Ziphius cavirostris; Auster and Watling, 2010) and of marine litter observed during this large-scale mapping effort were also compiled as elements of the Blake Ridge South seascape (Supplementary Data 2).
2.1.2 High-resolution mapping
More detailed photo analyses were undertaken for 8 east-heading transects (lines 1E, 2E, 8E, 10E, 18E, 20E, 24E, 26E; Figure 1C) with overlapping photos. Lines 1E and 2E were south of the seep habitat polygon; all other lines included both seep and non-seep habitats. Photos collected during AUV turns at the end of each transect were excluded from the analysis. The taxon-abundance matrix for 46 morphotypes, together with associated metadata (Supplementary Data 3), was used to analyze differences in community structure in seep and non-seep habitats, to test for significant positive, negative, and random relationships using cooccurrence and associations using PCA and network analysis tools, and to test for the existence of ecotone (transitional) assemblages between seep and non-seep habitats.
2.2 Taxonomic identifications
The vertical, downward-looking angle of the camera, the relatively low image quality, together with the low contrast and small size of some taxa relative to the seabed made it challenging to identify organisms in Sentry photographs to species or sometimes even higher order taxonomic levels. Most taxa were classified using morphotype descriptors. A few of the seep-associated taxa had been sampled on previous expeditions to the Blake Ridge seep area (Van Dover et al., 2003), which allowed us to assign them to taxonomic groups with some confidence. Some provisional identifications of echinoderms were made by D Pawson, octopus by M Vechionne (both of the Smithsonian Museum of Natural History), and fish by S Ross (University of North Carolina, Wilmington). Additional provisional identifications especially at higher taxonomic levels, was assisted by members of the Deep-Ocean Stewardship Initiative (DOSI) in response to a request published in the DOSI weekly newsletter. Despite generous taxonomic assistance, identifications were challenging; the authors accept responsibility for all errors.
2.3 GIS visualization
All GIS maps were generated using ArcGIS Pro software (Esri). Sentry 148 track lines were plotted using AUV-operator-processed navigation data. Vehicle depth and Eh anomalies (8-second moving- average dEh/dt) were interpolated using the Kriging tool to generate continuous surfaces. Distributions of morphotypes were georeferenced by matching timestamps in the photo filename with corresponding navigation timestamps and map coordinates (Supplementary Data 1).
2.4 Statistical analyses
2.4.1 Biodiversity and community structure
Biodiversity and community structure analyses were performed in R (R Core Team, 2020) using the vegan package (Oksanen et al., 2018) except where noted, and ggplot2 (Wickham, 2016) or native R plot scripts. Species richness was calculated on a per-photo basis and randomized accumulation curves for morphotypes (presence-absence matrices) at seep and non-seep habitats within the seascape were generated for high-resolution transect data using the exact method (Lomolino model), with cumulative number of photos as the measure of sampling effort. Morphotypes reported simply as categorical values, i.e., present or absent (mussels, clams, tubeworms, bacterial mat) were included in the total number of morphotypes present in a habitat but were excluded wherever abundance data was used in an analysis.
2.4.2 Morphotype abundance models
Relative Abundance Distributions (RADs) are useful for empirical description and comparison of the distribution of commonness and rarity in a system and convey more information than non-parametric diversity indices such as Shannon’s index of diversity (Matthews and Whittaker, 2015). The best-fit model (null, niche preemption, lognormal, Zipf, or Mandelbrot) for RADs in high-resolution seep and non-seep habitats was determined by the lowest Akaike Information Criterion (AIC) using the radfit function in the vegan package (Oksanen et al., 2018).
2.4.3 Abundance-based analysis of community structure
Non-metric multidimensional scaling (NMDS) ordination was used to generate two-dimensional plots of assemblages based on morphotype composition and abundance (i.e., exclusive of clams, mussels, tubeworms, bacteria mat). Average abundances of a given morphotype per photo within a given habitat (seep, non-seep) were calculated to generate a standardized morphotype-abundance matrix indexed by transect line number and habitat. A Bray-Curtis dissimilarity matrix was then calculated using the metaMDS function in the vegan package. Analysis of similarities (anosim) was used to test for significant differences (R statistic, α< 0.05) between seep and non-seep community composition. Differentially abundant morphotypes across habitats (“indicators”) were assessed using the package indicspecies and the function multipatt (De Cáceres, 2020). In NMDS plots, proximity of any two points conveys the degree of similarity between these data points in the original, high-dimensional space.
2.4.4 Morphotype distributions and environmental variables
Principal Component Analysis (PCA) was performed in R using the vegan package to explore associations among morphotypes, habitat, and depth. Individual photos were treated as sample sites, each with an associated depth and habitat type (seep or non-seep). The morphotype-abundance matrix was transformed to presence/absence data to include both numerical and categorical (presence or absence of clam, mussel, bacterial mat, authigenic carbonate) data. PCA was also performed on Hellinger-transformed abundance data, a transformation that gives low weight to rare species (Legendre and Gallagher, 2001). In contrast to the NMDS analysis, where the relationship between community composition of seep and non-seep habitats and line-by-line variation was explored, the PCA analysis used the “species’’ scaling method (scale = 2) to focus on relationships among morphotypes. Acute angles between morphotype loadings indicate positive correlations, obtuse angles (>90 degrees) indicate negative correlations. Depth data was overlaid on PCA plots as vectors using the function envfit in vegan, which calculates the multiple regression of environmental variables with ordination axes.
2.4.5 Co-Occurrence analysis
Pairwise probabilistic co-occurrence matrices for morphotypes were generated using the cooccur package in R (Griffith et al., 2016). Clams, mussels, tubeworms, bacterial mat, and authigenic carbonates were aggregated into a single measure labeled “Seep Indicators”. Individual photos were used as “samples”. Presence-absence data was filtered using the threshold filter (n=5) in cooccur to eliminate morphotypes with insufficient occurrence data. In addition to “Seep Indicators”, 28 morphotypes (including the seaweed Sargassum) were included in the analysis. Morphotype presence-absence data for each of the 8 transect lines were concatenated to generate the data frame used in cooccur.
2.4.6 Network analysis
Network analysis was performed in R using the asnipe package (Farine, 2013). Morphotypes observed<10 times in the entire data set were removed from the matrix to reduce network noise; abundances were transformed to presence-absence records. Twenty-eight morphotypes were included in the final network analysis, including clams, mussels, and bacterial mat. Association indices that model the probability that two individuals were observed together given that one had been seen (a.k.a. the Simple Ratio Index; ranges from 0 for pairs never observed together, to 1 for pairs always observed together) were calculated for all morphotype pairs to yield an association matrix. The association matrix was visualized as a network, where thicker edge weights correspond to stronger association indices between nodes (morphotypes). To identify sub-communities of morphotypes within the larger network, the fastgreedy community detection function (igraph; Csardi and Nepusz, 2006) was employed (Clauset et al., 2004). Nodes representing each morphotype were colored according to sub-community assignment by fastgreedy and were also visualized as a dendrogram using dendPlot withn igraph.
2.4.7 Ecotone analysis
The existence, location, and extent of ecotones along each high-resolution photo transect were explored using Split-Moving-Window (SMW) analyses. This approach is commonly deployed to detect the extent and location of dissimilarities in ordered data series in terrestrial ecosystems (Panis and Verheyen, 1995). Here, SMW was used to calculate rates of change of morphotype assemblages along phototransects to detect locations of greatest change (breakpoints) and obtain information about the extent of the transition (ecotone). The SMW subroutine of the segRDA package in R (Vieira et al., 2019) detected discontinuities in Bray-Curtis matrices generated from abundance data; categorical data (clams, mussels, tubeworms, bacterial mat) were not included. SMW delivers dissimilarity profiles of mean Zscores (standardized dissimilarity values) plotted against window midpoint locations along each transect. Based on significance tests for SMW peaks in vegetation studies, Zscores > 1.85 were considered significant (Erdős et al., 2014; Vieira et al., 2019;. Breakpoints were identified as the sample position of the maximum dissimilarity in a sequence of significant Zscores; when there was no sequence of significant Zscores, no breakpoint was identified. To determine the optimal window sizes for SMW analysis of each transect, dissimilarity profiles for each transect were generated with even-numbered window sizes of 4 to 30 photos [maximum number of photos in each line ranged from 76 to 88 (Table 1)]. Window sizes that identified an outlier breakpoint undetected by any other window size were eliminated. The remaining window sizes were then used in a pooled analysis that averaged the results to yield a single dissimilarity profile per transect. For transects where no breakpoints were detected for any window size, results are displayed using the two median window sizes (14 and 18).
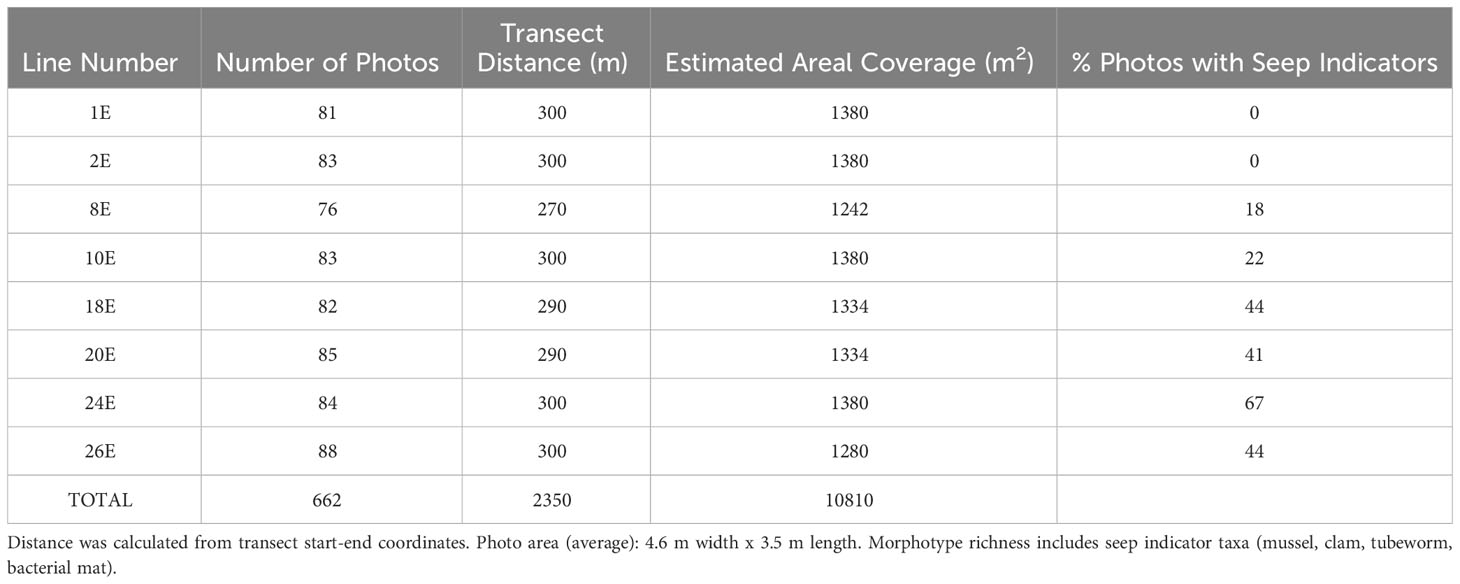
Table 1 High-resolution faunal mapping: Sampling effort (number of photos, transect distance, estimated area), morphotype richness, and percent photos seep indicators for each high-resolution line.
2.4.8 Graphical enhancement
Adobe Illustrator (2020) was used to enhance readability of graphical outputs.
3 Results
3.1 Large-scale mapping
3.1.1 Seep polygons and eh anomalies
Seep polygons were determined from analysis of 4808 images, representing 26 eastward and 27 westward straight-line transects and a seafloor area of ~400 m x 400 m. Subtle depth variations (~6 m; depth range: 2163 to 2169 m) were detected, with highest relief associated with mussel beds on authigenic carbonates, as reported by Wagner et al. (2013) at the Blake Ridge “Main” seep site. The BR South seep polygon (defined here by the presence of “Seep Indicators”: mussels, clams, tubeworms, bacterial mats, authigenic carbonate) was located along the northern border and eastern portions of the photo transect area (Figure 2). Vesicomyid clams have a semi-infaunal habit in soft sediment and thus were absent wherever dense mussels and/or authigenic carbonates covered the seabed. Eh values ranged from 184.7 to 191.7 mV. Steepest drops in dEh/dt at Blake Ridge South (i.e., the most negative values of dEh/dt) were detected along the eastern edge of the study area, especially just east of dense clam beds in the southern part of the seep polygon (Figure 2).
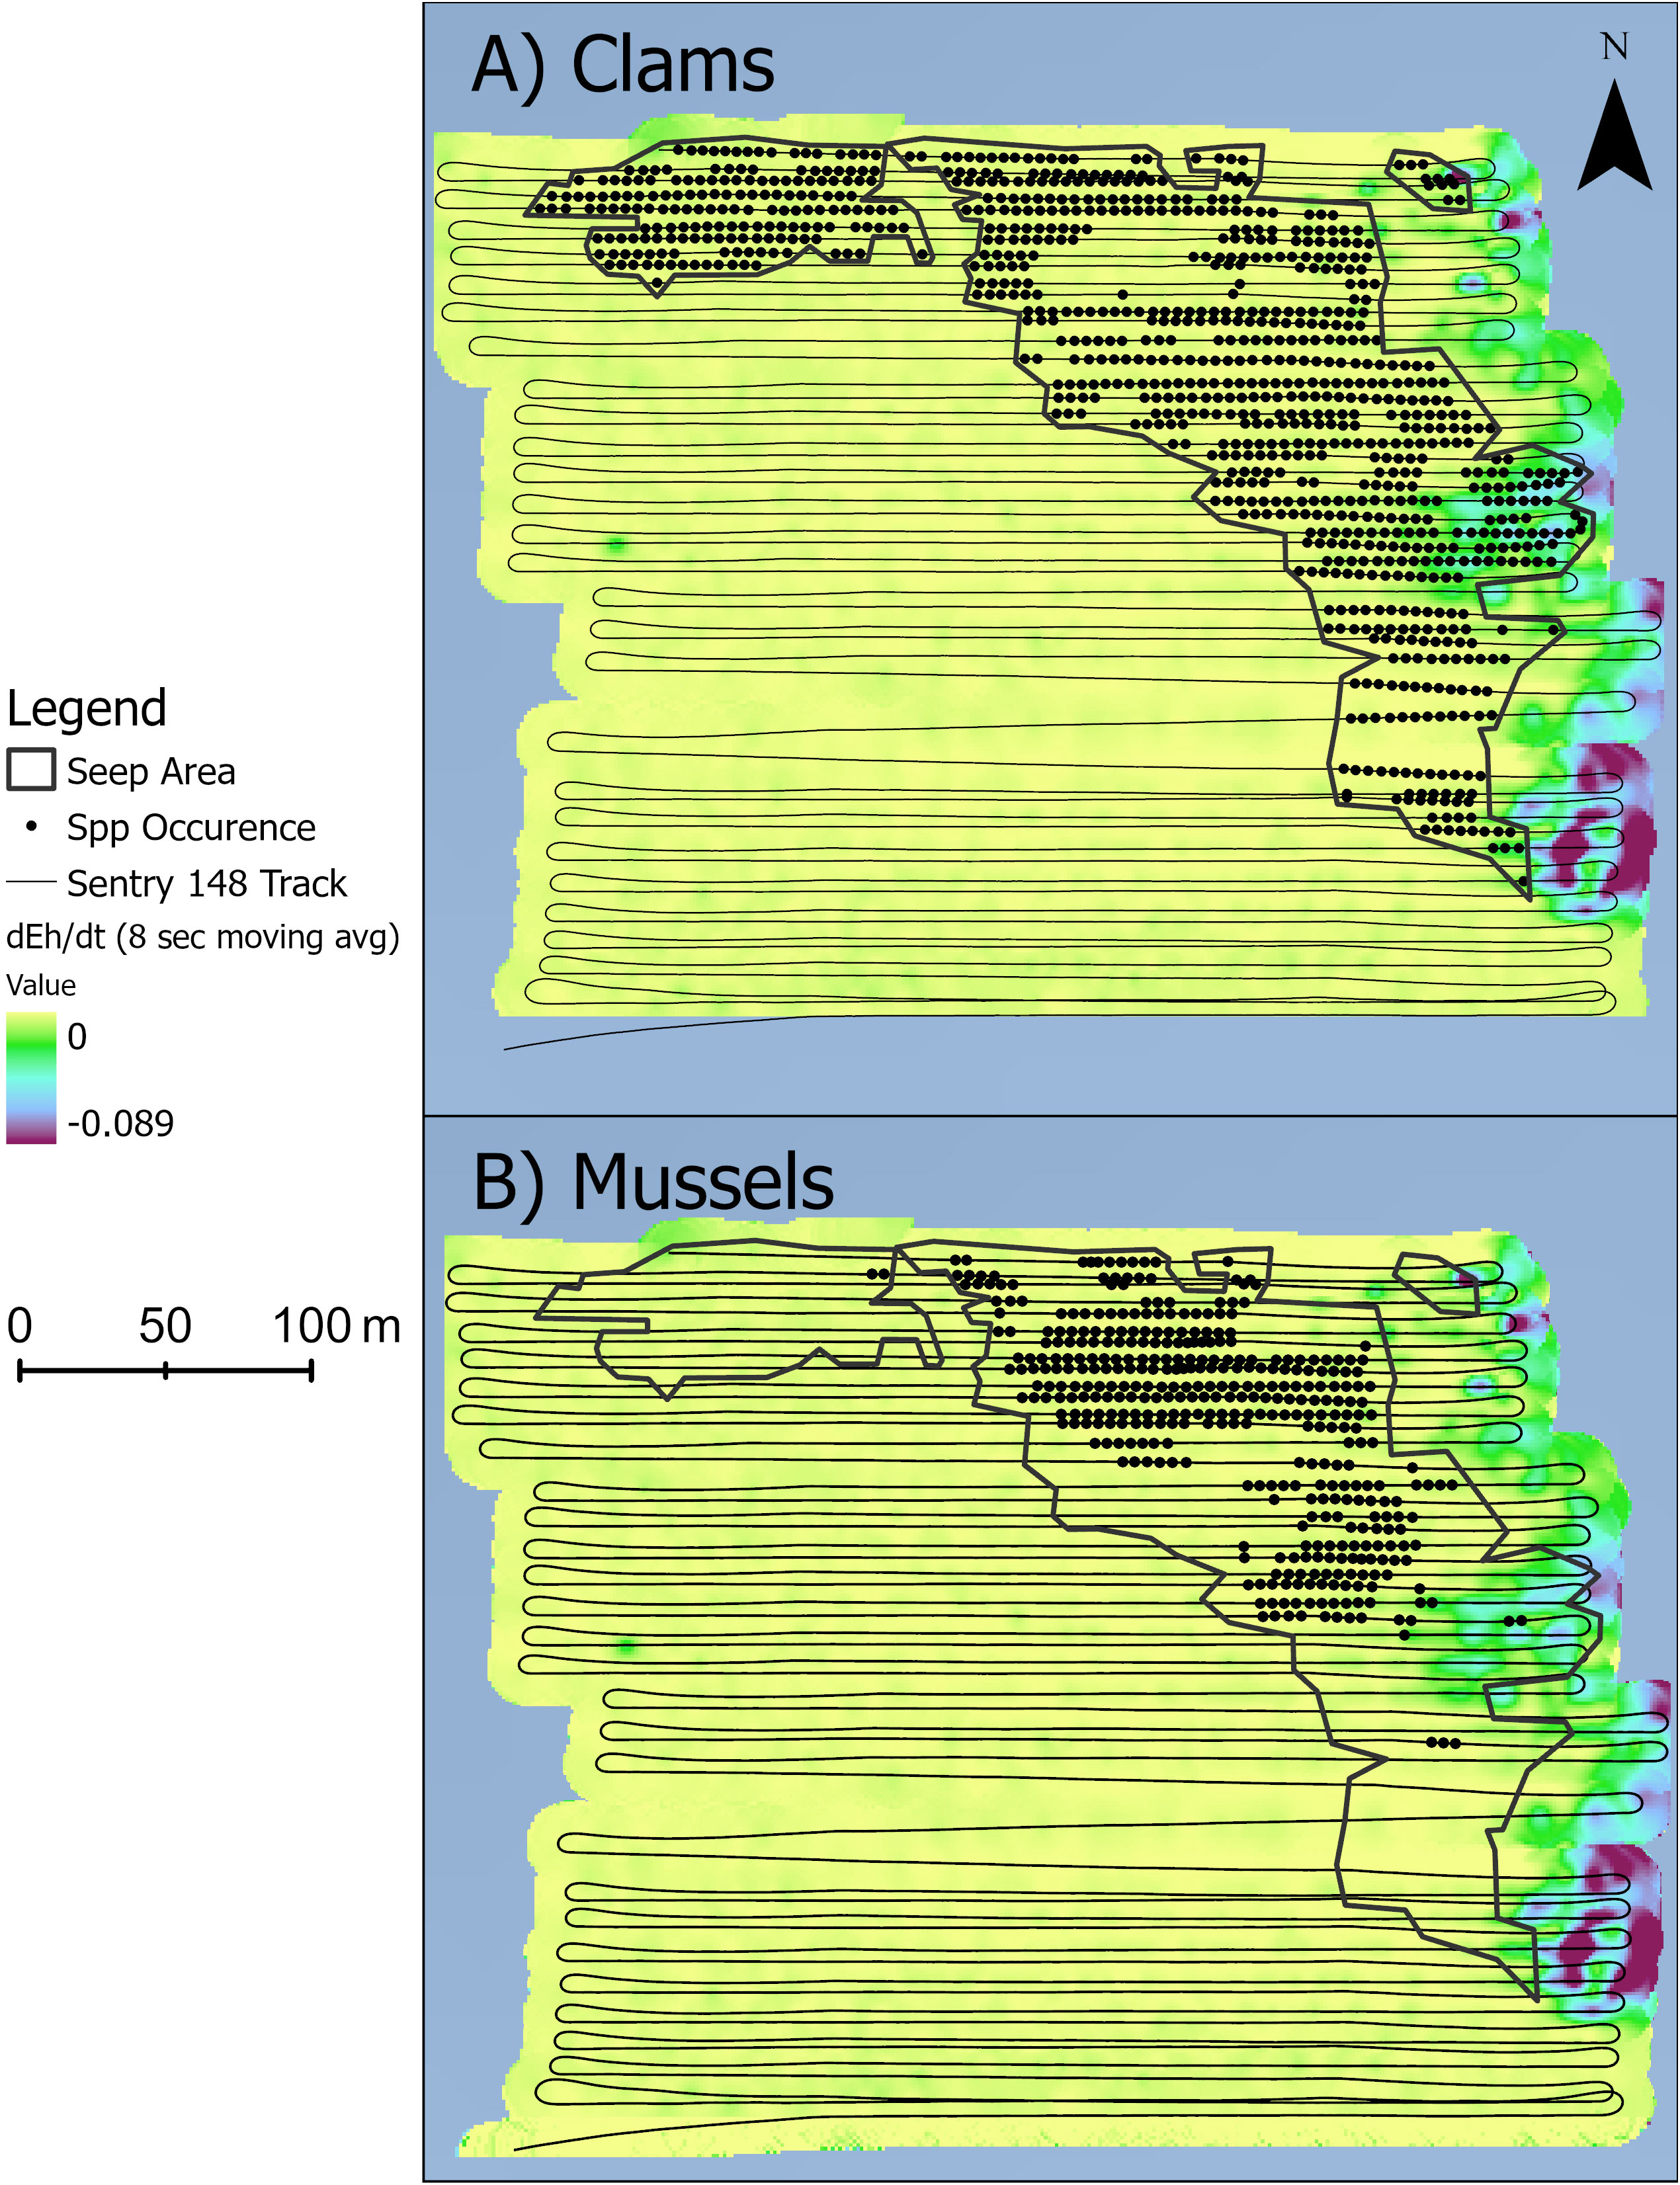
Figure 2 Seep indicators (circles) and the seep habitat (black polygons). Each circle represents one photo with either (A) dense clams or (B) dense mussels. Color ramp is 8-second moving averages of dEh/dt (mV s-1).
3.1.2 Distribution of selected megafauna in the BR South seascape
Eleven readily identified megafaunal taxa (Supplementary Figures 3, 4) differed in their distributions relative to the seep polygon (Figure 3). Octopus [possibly Graneledone verrucosa and/or Muusoctopus johnsonianus; (Pratt et al., 2021)], squat lobsters, nematocarcinid shrimp, and blue hake (Antimora sp.) were more common in the seep habitat than in the non-seep habitat. Benthodytes sp. sea cucumbers, Hygrosoma sp. urchins, brisingid seastars, red ophiuroids, and Synaphobranchus sp. cutthroat eels were more common outside the seep area. Statistical analyses of associations between these taxa and seep indicators are detailed below for the high-resolution mapping effort.
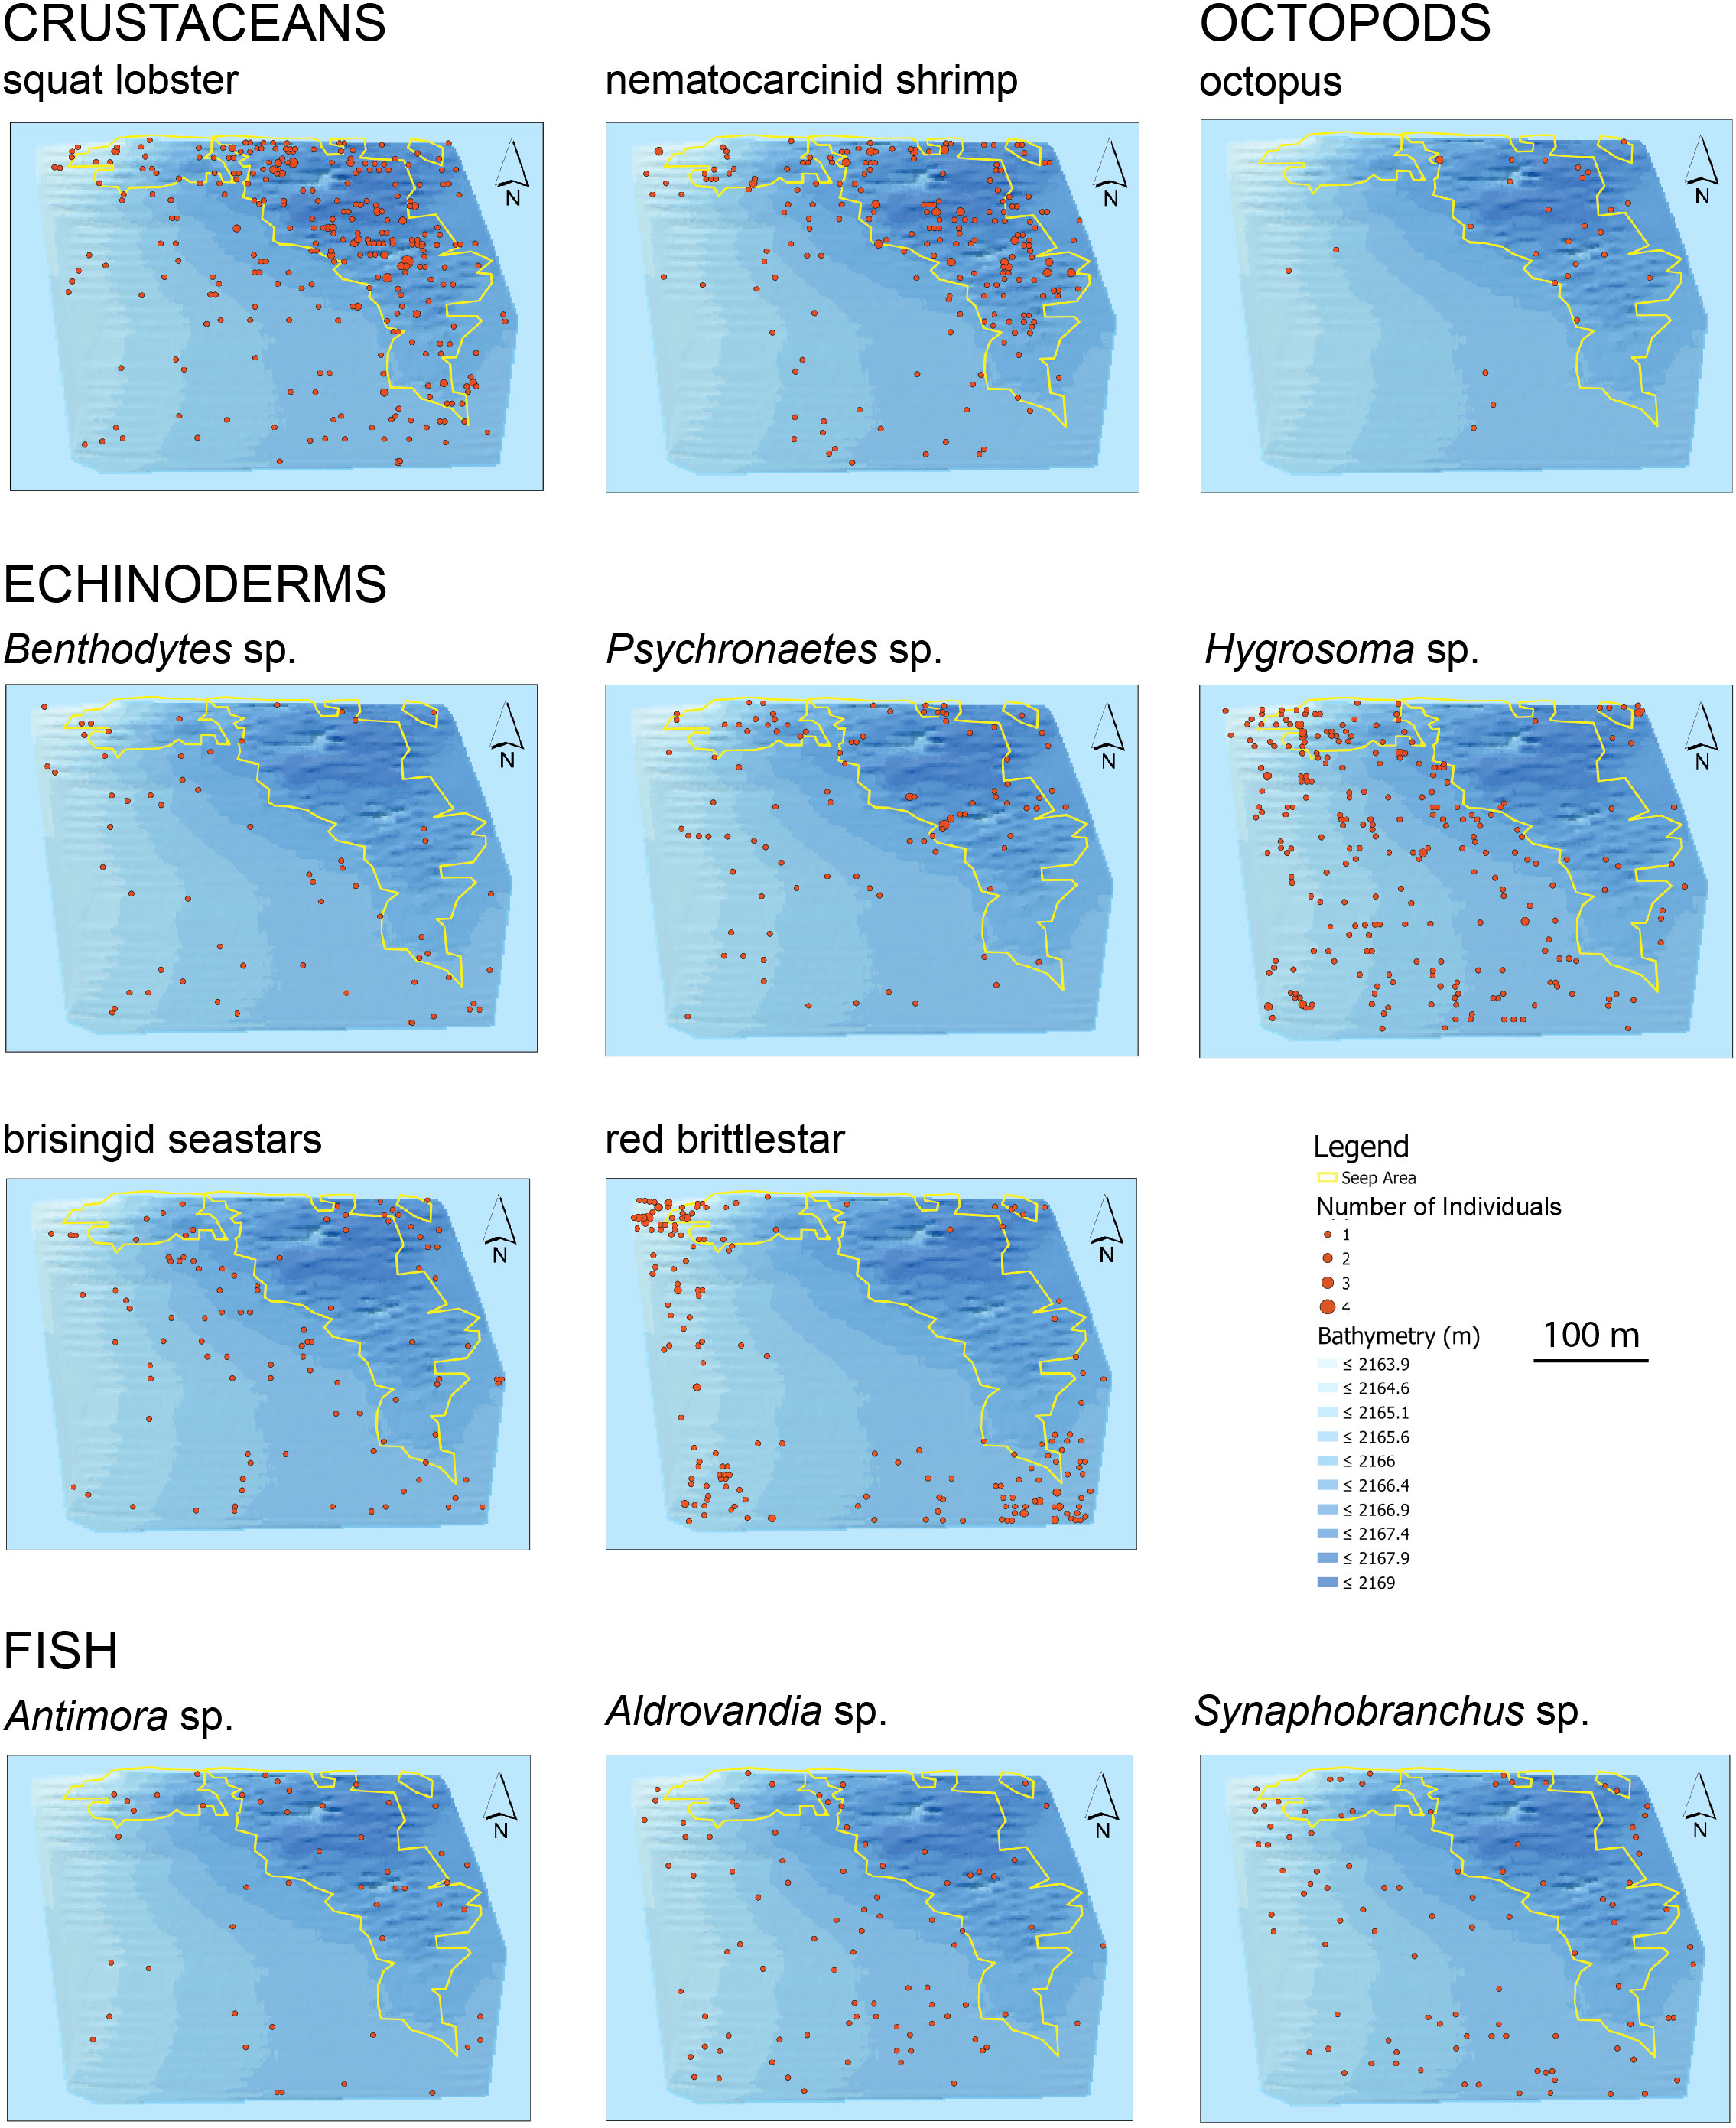
Figure 3 Distribution and abundance of eleven megafaunal taxa in the BR South area. Yellow polygons outline the seep habitat. Each point represents an individual photo. Scale is the same for all maps.
3.1.3 Putative whale-feeding gouges in the BR South seascape
Disturbed sediment with a central linear depression, narrower at one end and approximately 1 m in length were observed in 45 photos (Supplementary Figure 5) and interpreted as possible feeding gouges from beaked whales (Ziphius cavirostris). All feeding gouges were observed outside the seep polygon (Supplementary Figure 6), except the gouge in photo 1197 (Supplementary Figure 5A), which was in soft sediment among scattered clams. The age of the gouges was impossible to determine; two of the putative feeding gouges appeared to be relatively “fresh” (photos 1021, 1197; Supplementary Figure 5A), but most appeared to be older, with accumulations of sediment and other material in the depressions.
3.1.4 Marine litter in the BR South seascape
Within the study area, 17 discrete items of litter were observed (Supplementary Figure 7), equivalent to ~2 pieces of litter per hectare (2 per 0.1 km2). The litter was dominated by glass bottles (n = 7), with 1 coke can, 1 drink carton, 1 piece of corrugated cardboard, 2 spools, 1 rectangular tray (~1 m x 0.5 m), a rectangular piece of metal, and 4 unidentified objects (possibly 3 metallic, 1 wooden).
3.2 High-resolution mapping
3.2.1 Overview of sampling effort
In the eight Sentry 148 transect lines heading eastward selected for detailed analysis, the number of photos per line ranged from 76 to 88. These overlapping photos covered distances ranging from ~270 to 300 m and areas of 1242 m2 to 1380 m2 (Table 1). Seep indicators (clams, mussels, bacteria, tubeworms, authigenic carbonates) were absent in the southernmost pair of lines (Lines 1E, 2E, Figure 1C). On the more northerly lines, the percent of photos with seep indicators ranged from 18% to 67% (Table 1).
3.2.2 Biodiversity and community structure
Xenophyophore protists (Syringammina sp.) were the most abundant morphotype (2,008 individuals), accounting for 57% of total morphotype abundance (excluding non-enumerated mussels, clams, tubeworms, bacterial mat) in the BR South seascape. Abundance maxima of xenophyophores on each transect line were associated with seep indicators (Figure 4). Syringammina sp. was not observed on Lines 1E and 2E, where seep indicators were absent.
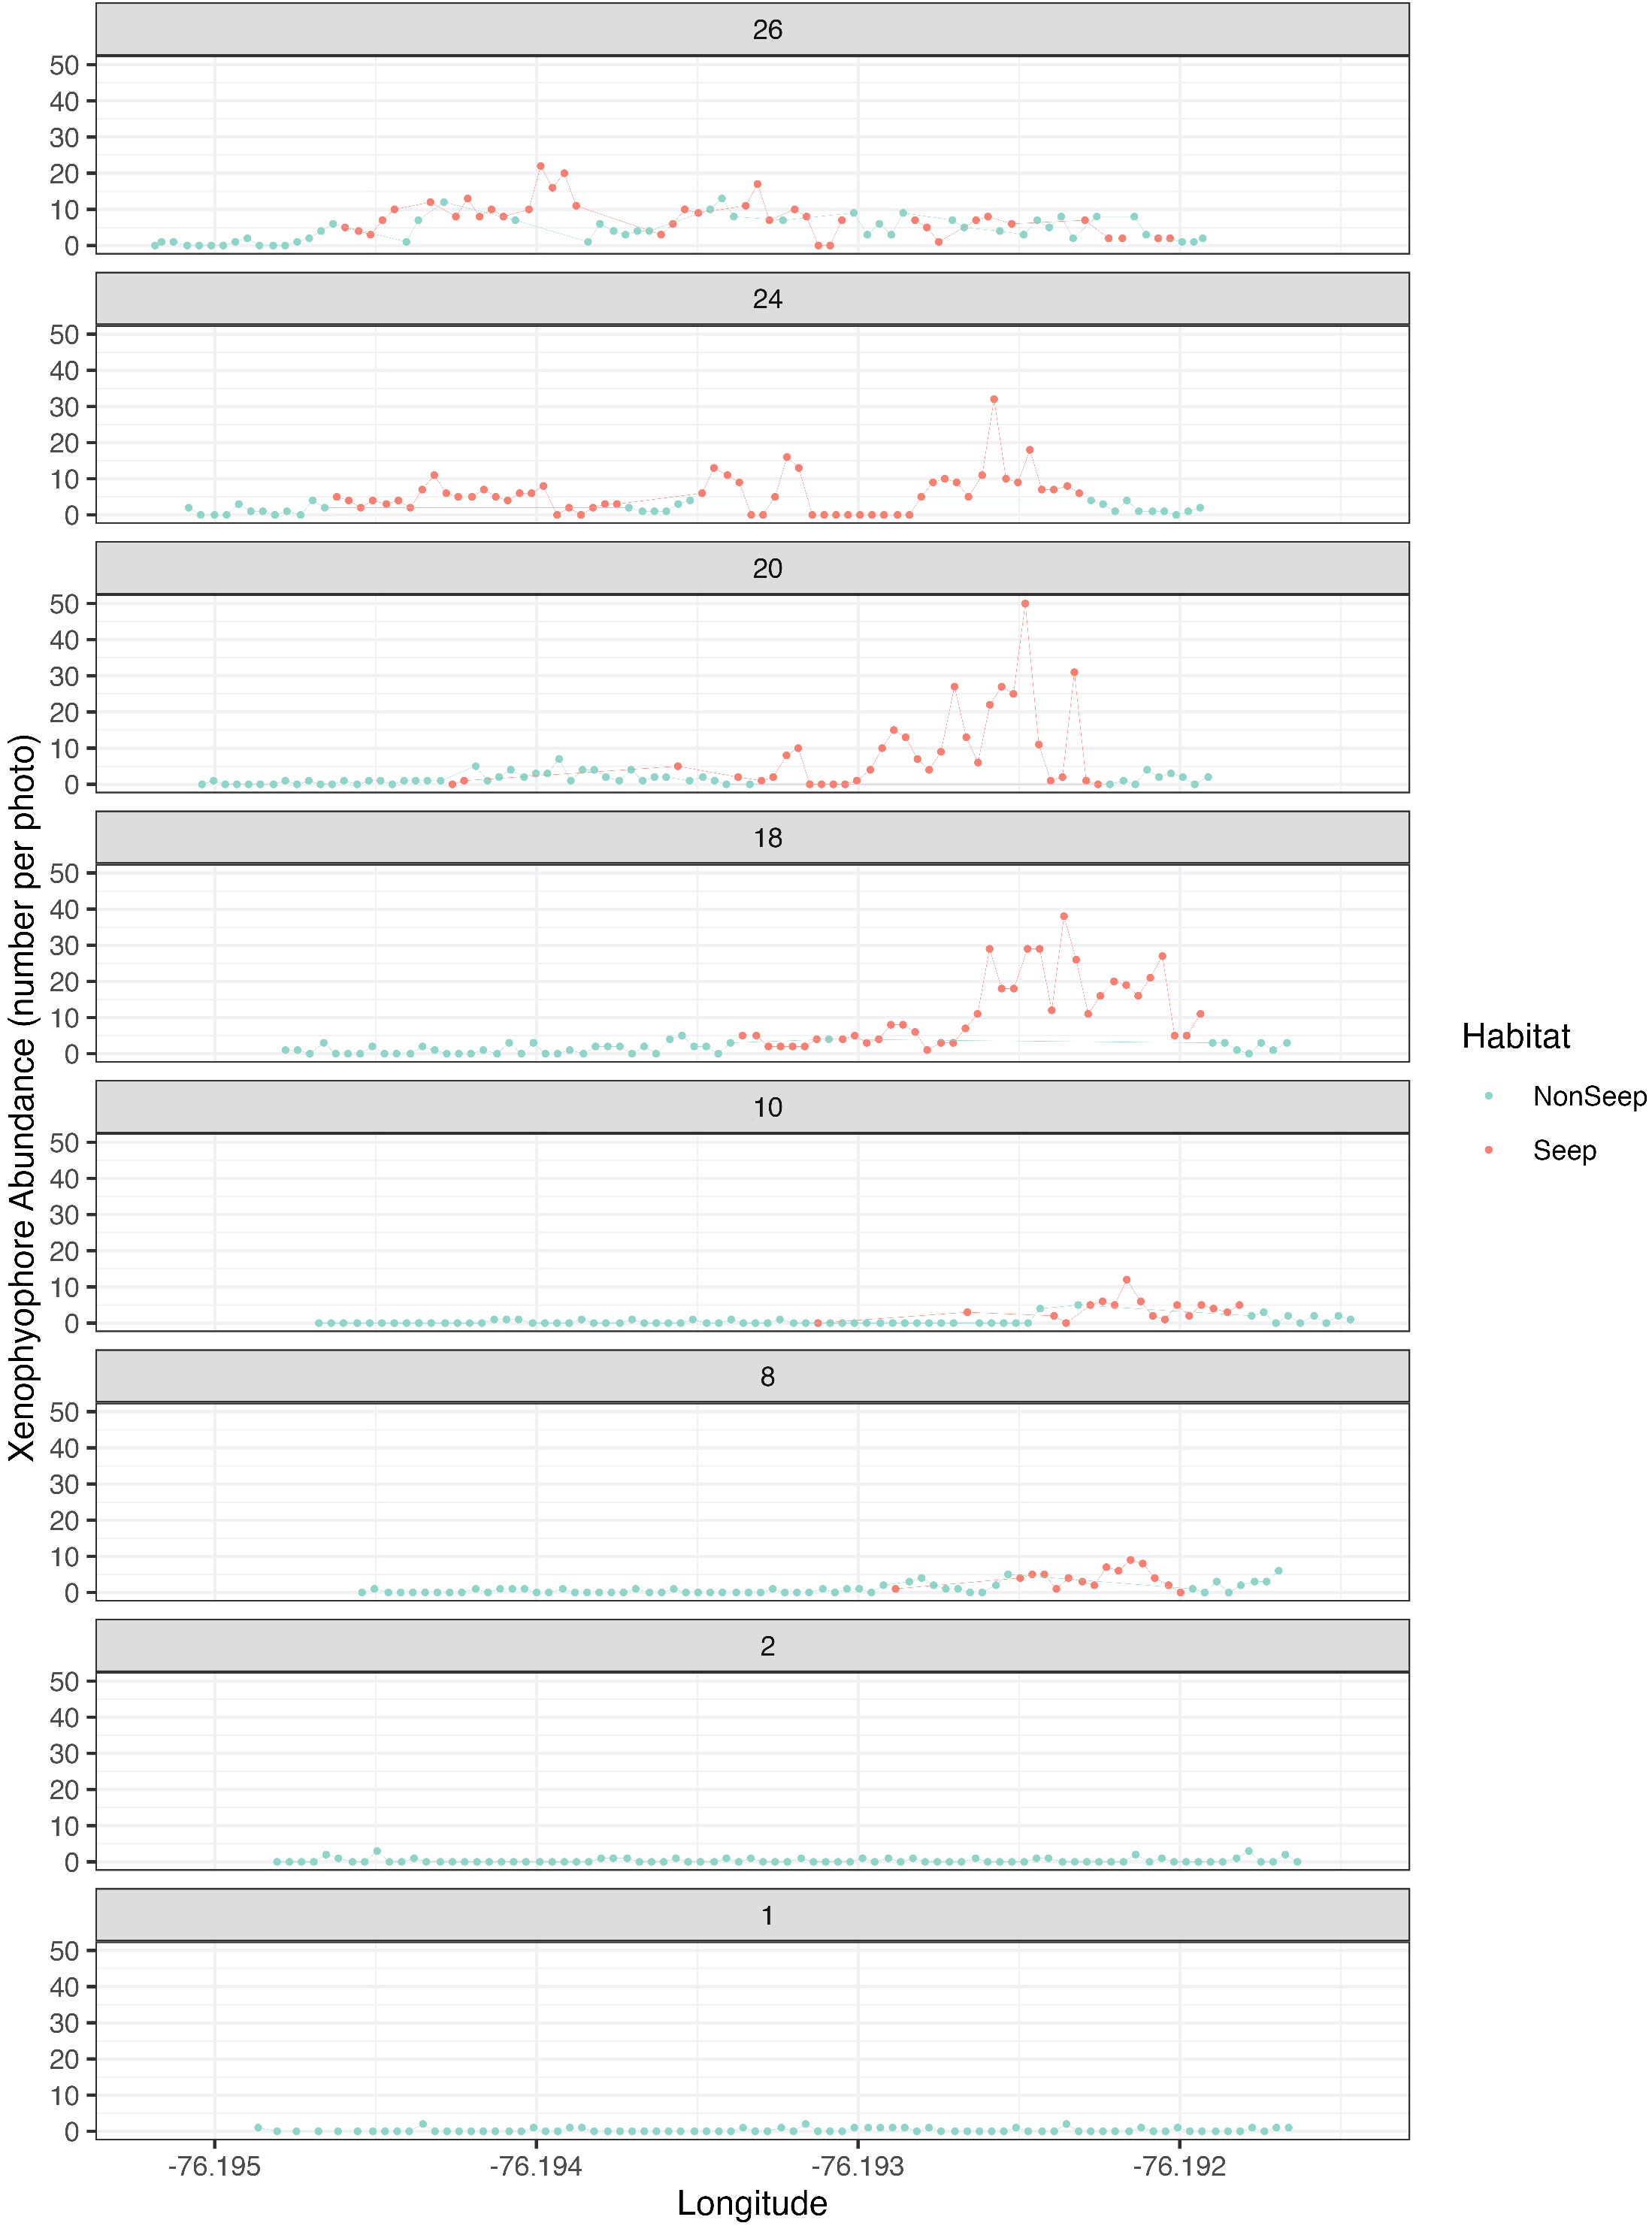
Figure 4 Xenophyophore (Syringammina sp.) abundance in seep and non-seep habitats. Each graph represents one of the 8 high-resolution eastward transects (see Figure 1C) within the BR South study area.
Per-photo morphotype richness was significantly lower (t-test, p< 0.001) in non-seep habitats ( = 1.97) than seep habitats ( = 4.2), though there were similar ranges in non-seep (0 to 6 morphotypes photo) and seep habitats (1 to 8 morphotypes per photo).
Morphotype richness was the same in seep and non-seep habitats (36 morphotypes), despite nearly twice the sampling effort in the non-seep habitat. The steeper slope of the seep habitat accumulation curve, the lack of overlap between confidence intervals of seep and non-seep accumulation curves, and the greater number of morphotypes for a given number of photos in the seep habitat suggest that seep habitat diversity may be higher than non-seep habitat diversity (Figure 5A). Neither curve approached an asymptote, indicating the potential for additional effort to yield additional morphotypes in each habitat.
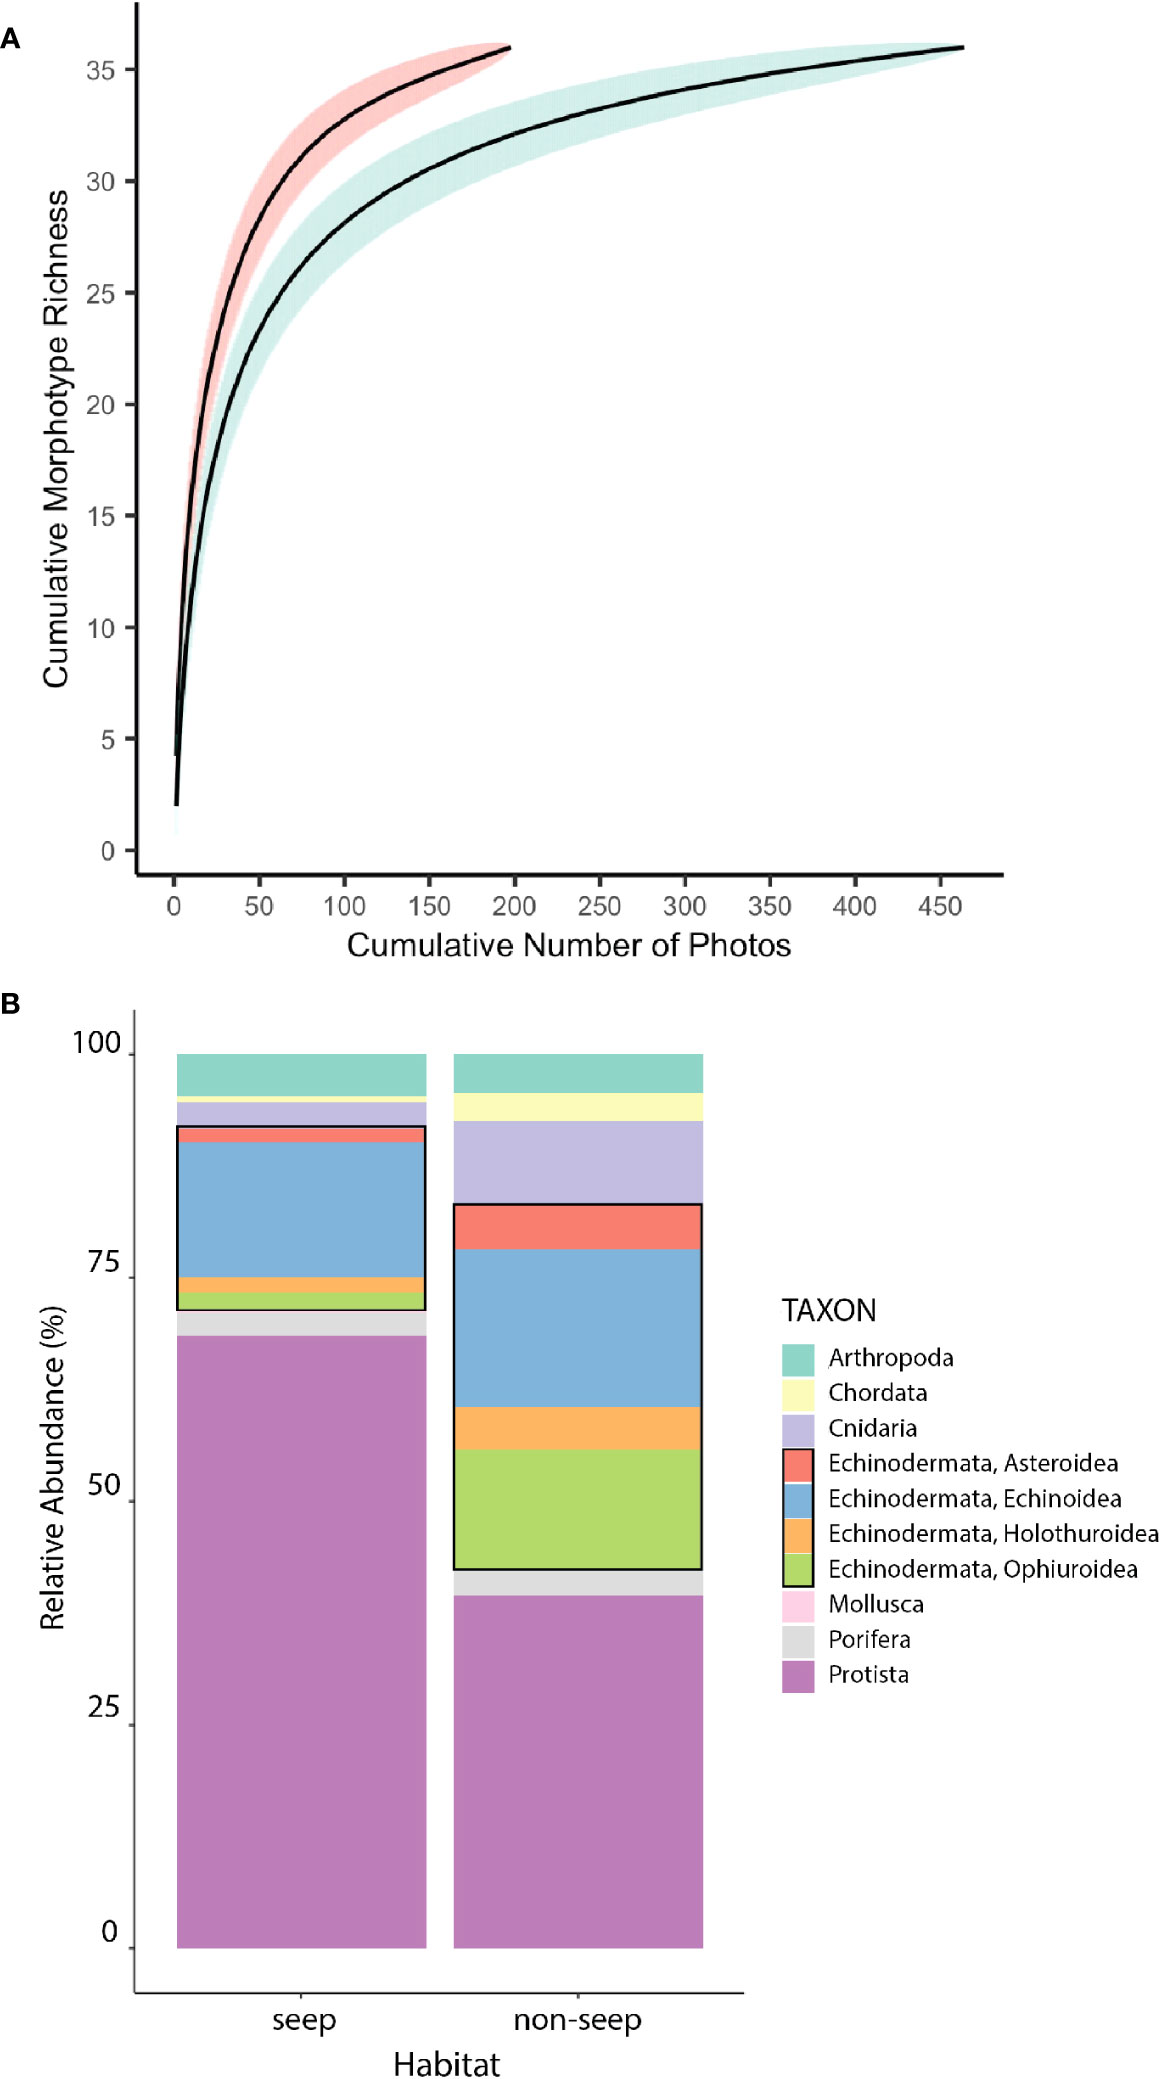
Figure 5 Diversity overview by habitat. (A) Morphotype accumulation curves for seep (red) and non-seep (green) habitats. Shaded areas represent 95% confidence intervals. (B) Relative abundance of higher-level taxa at seep and non-seep habitats. Black rectangles highlight Echinodermata. Excludes mussels, clams, tubeworms, and bacterial mat at seeps, which were not enumerated.
In addition to endemic taxa that are obligate inhabitants of seep (or seep-like) environments (mussels, clams, tubeworms, bacterial mat), differences in the relative abundances of other higher-level taxa at seep and non-seep habitats were evident (Figure 5B). As noted above, seep habitat supported relatively more xenophyophoran protists than non-seep habitats. Non-seep habitats supported greater relative abundances of Echinodermata (especially Holothuroidea, Ophiuroidea and Asteroidea) and Cnidaria than seep habitats.
The total number of eukaryotic morphotypes observed in the BR South seascape (gamma diversity) was 46. Of these morphotypes, 28 were common to both seep and non-seep habitats. The change in morphotype richness between seep and non-seep habitats (absolute Beta diversity) was 16, with 8 morphotypes only found in the seep habitat and 8 morphotypes only found in the non-seep habitat (Table 2).

Table 2 Morphotypes unique to either seep or non-seep habitats in high-resolution photo transects.
3.2.3 Morphotype relative-abundance distributions (RADs)
Best-fit models for RADs differed for the seep (Zipf model) and non-seep (lognormal model) habitats (Figure 6). As expected for Relative Abundance Distributions, both habitats were dominated by a few morphotypes, but the seep habitat had a greater abundance of rare morphotypes than expected from a lognormal distribution.
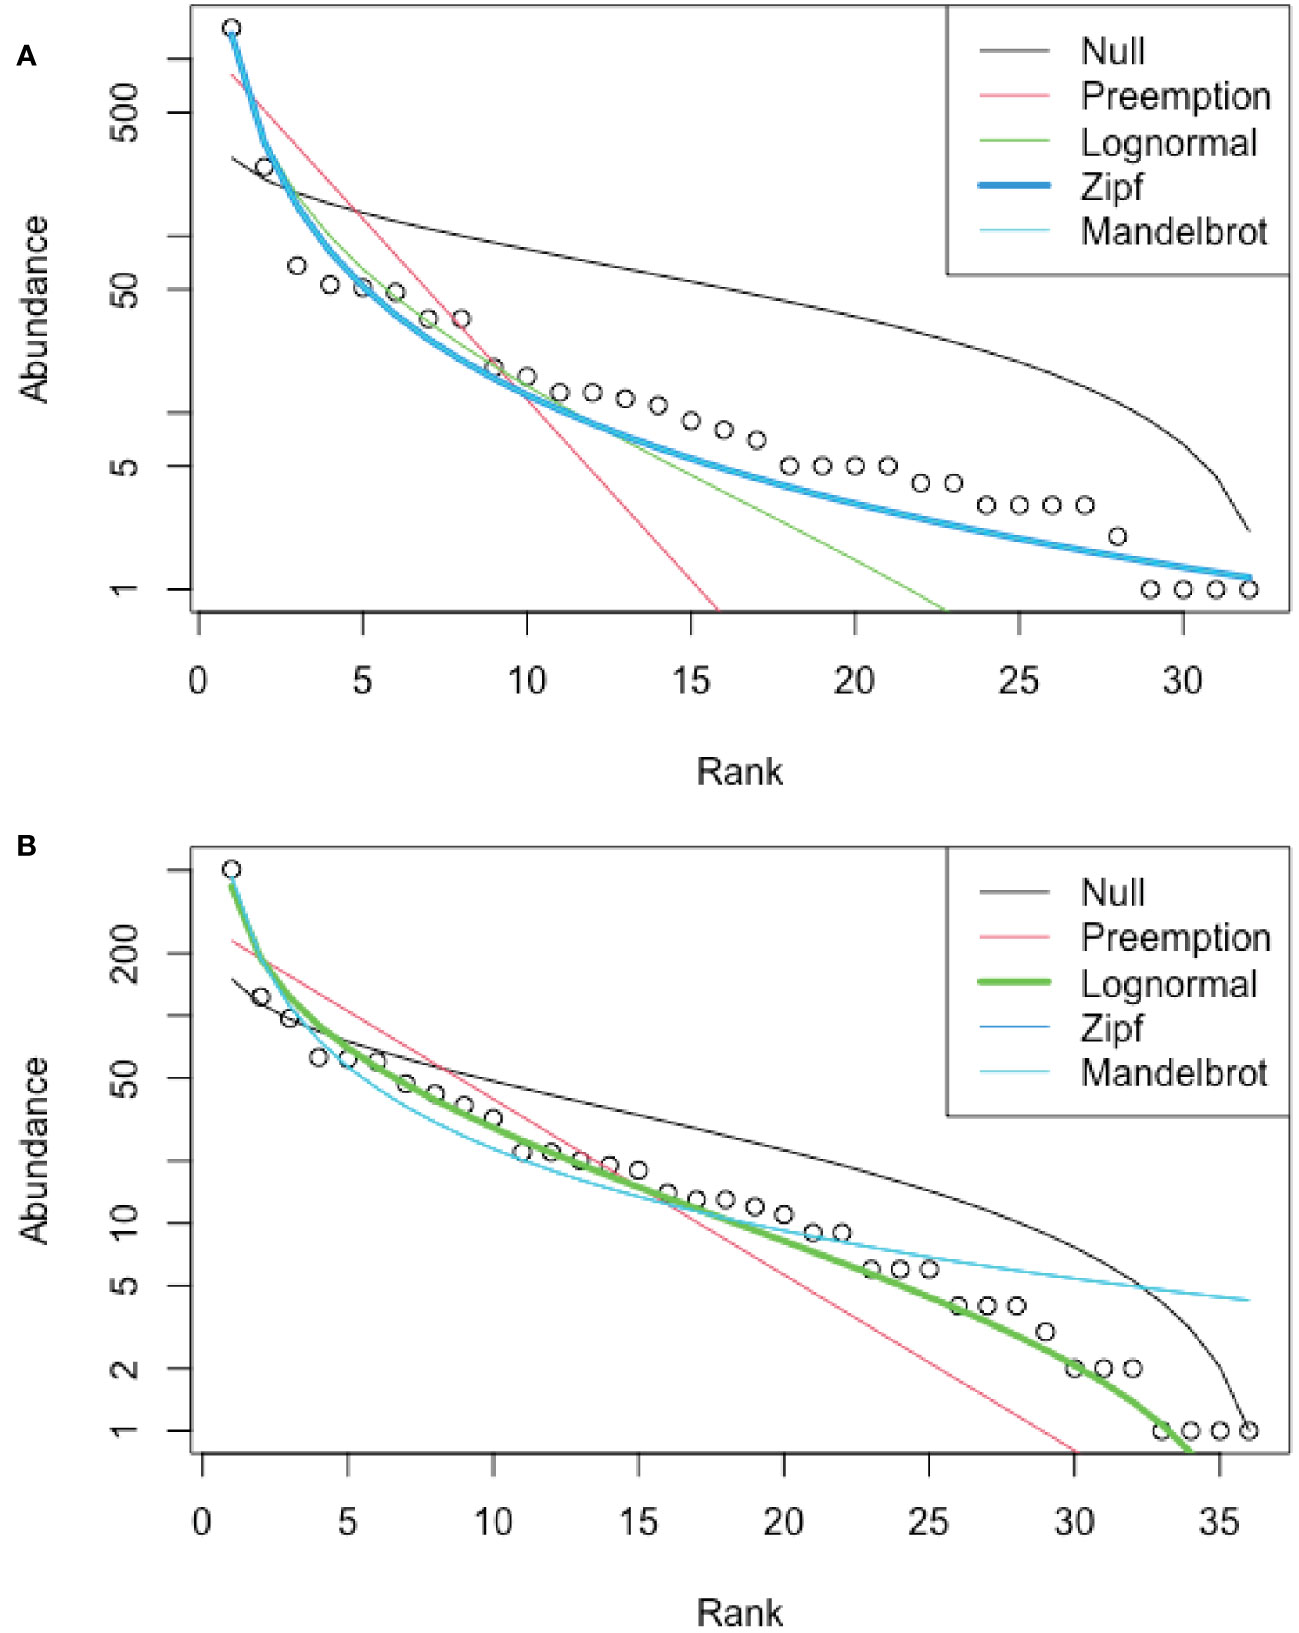
Figure 6 Rank Abundance Distributions (RAD), Blake Ridge South. (A) Seep habitat; best fit: Zipf model. (B) Non-seep habitat; best fit: lognormal. Excludes mussels, clams, tubeworms, and bacterial mat at seeps, for which abundances were not determined.
3.2.4 Community structure and morphotype distributions, associations, networks
The NMDS analysis for Blake Ridge South seep and non-seep habitats indicated that the community compositions of these habitats were distinct (Figure 7). The seep community located along lines 18E, 20E, and 24E grouped together—these lines included patches of both clams and mussels. Four morphotypes were non-endemic taxa closely associated with the seep habitat: xenophyophores (Syringammina sp.), nematocarcinid shrimp, spatangoid urchins (Sarsiaster griegii), and squat lobsters. Two morphotypes were indicator taxa for non-seep habitats: cutthroat eels (Synaphobranchus sp.) and the solitary hydroid.
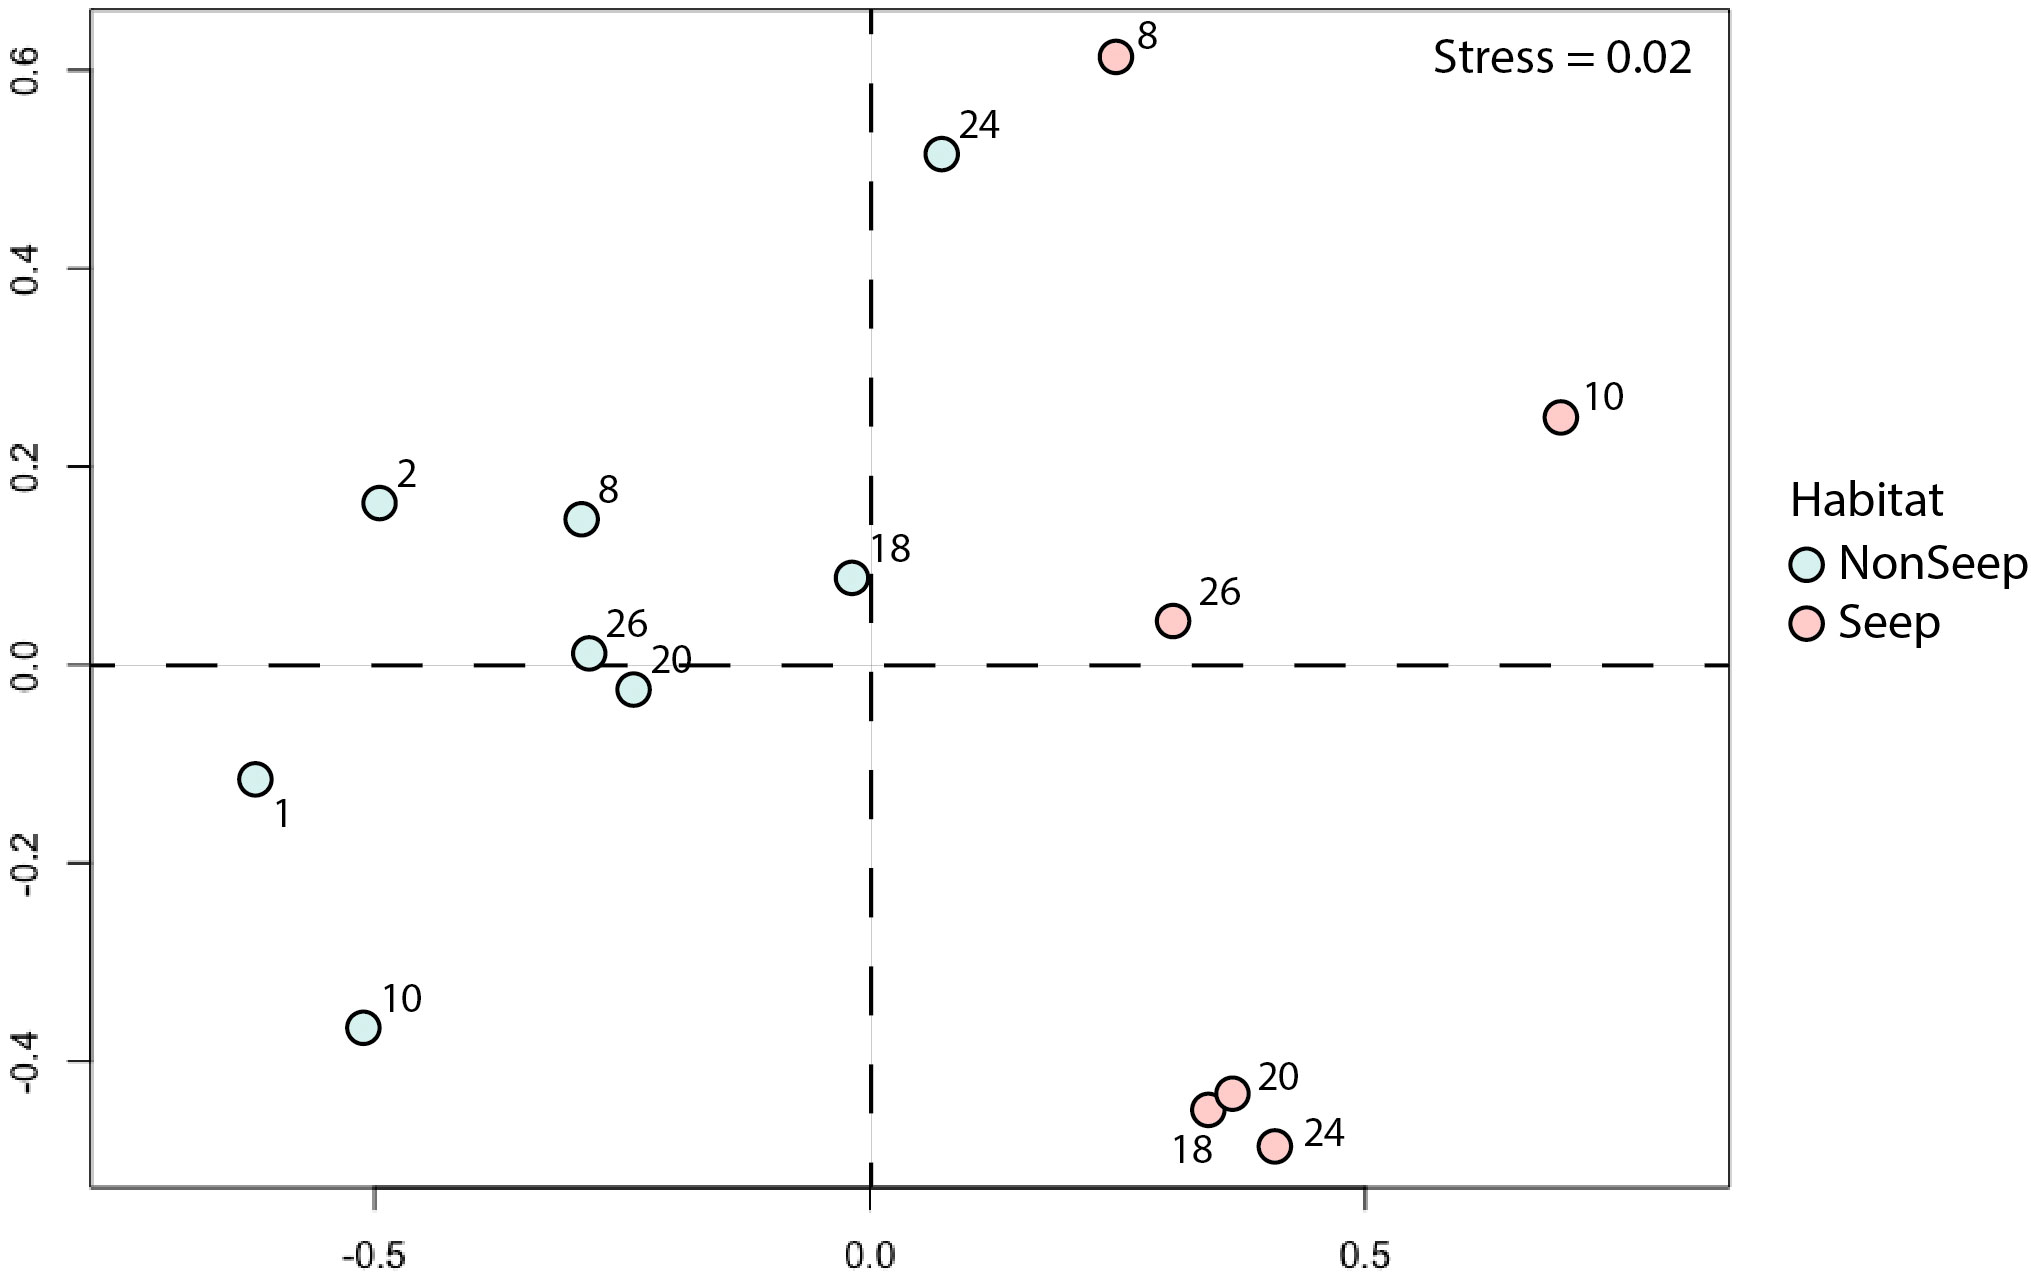
Figure 7 NMDS plot (Bray-Curtis) of seep and non-seep habitats. Numbers: Line numbers for high-resolution transect lines (see Figure 1C). Abundance standardized as ‘per photo’ from high-resolution transects. Global R: 0.722 (p =0.001).
Only 11.4% of the variance in the morphotype occurrence could be explained by principal component axes 1 and 2 for presence-absence data (Figure 8A), suggesting that the data set is inherently complex and cannot be captured by just a few principal components. For abundance data (Figure 8B), even less of the variation in community structure (7.72%) was explained by PC1 and PC2. The depth vector was significantly related to the first two ordination axes (p = 0.001, a = 0.05) in both PCA plots. Photos from non-seep seabed clustered more closely than photos with seep indicators, underscoring greater variation in faunal adjacencies within the seep habitat that is in part attributable to the presence of sub-communities in the seep habitat, as highlighted in the network analysis below (Figure 9A).
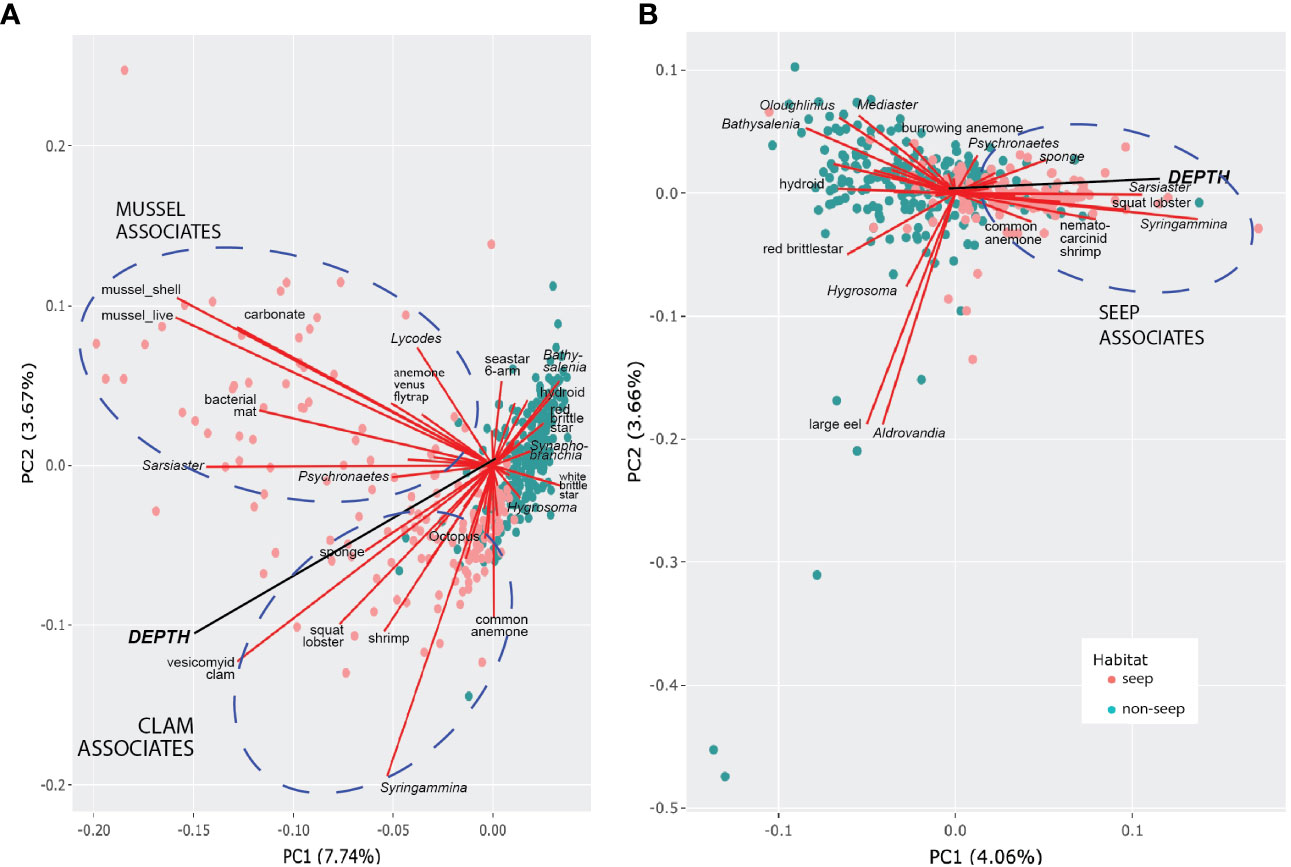
Figure 8 Morphotype-depth PCA biplots. (A) Presence-absence data. (B) Hellinger-transformed abundance data (excludes mussels, shells, clams, bacterial mat, carbonate). Circles represent photos (“sites”) coded by habitat type. Morphotypes contributing most to PC1 and PC2 are labeled. Ellipses highlight morphotypes within seep habitats that are positively associated and contributed to most of the variance.
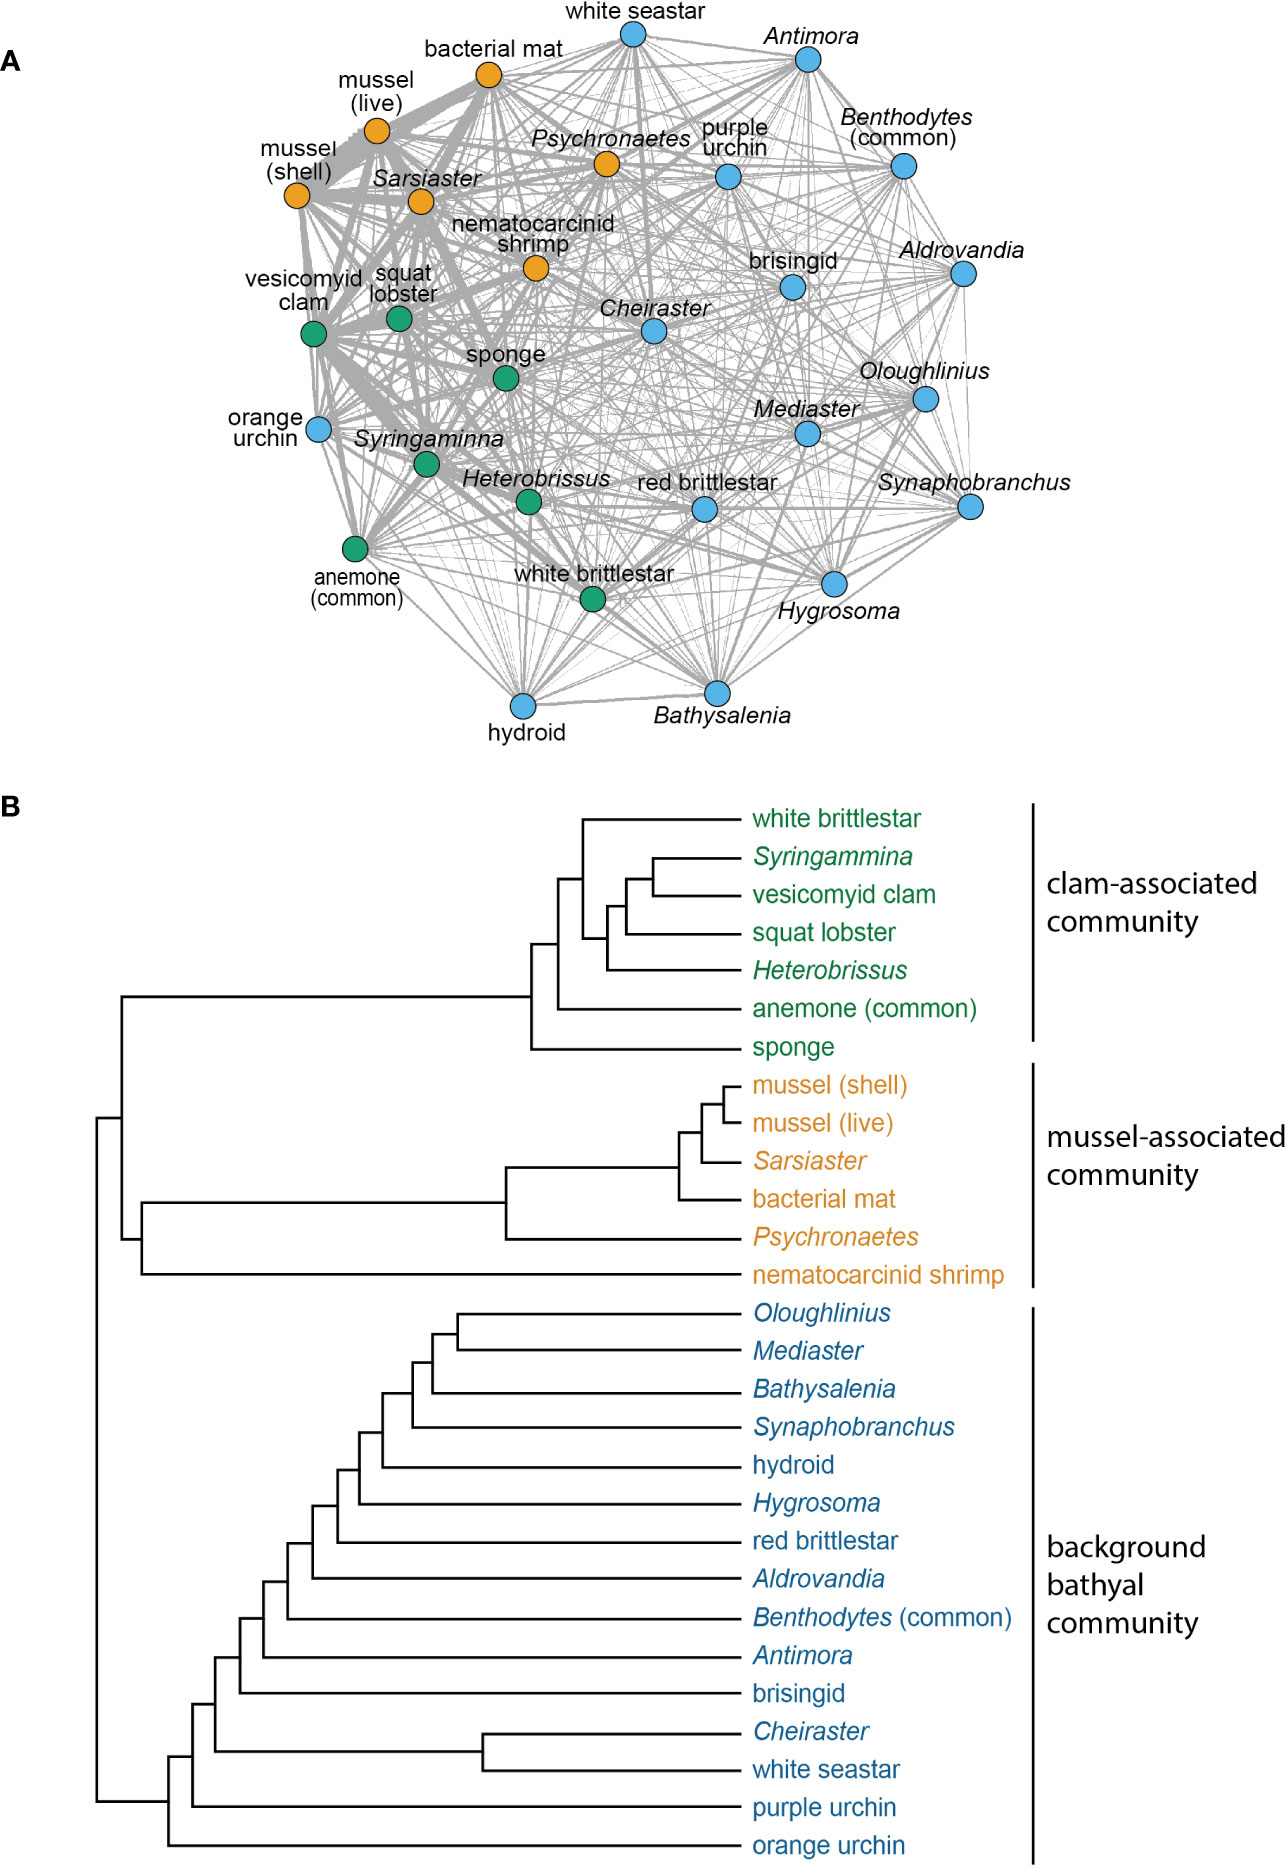
Figure 9 (A) Network analysis for morphotypes with 10 or more occurrences in the high-resolution phototransects. Sub-communities grouped by node color. Edge thicknesses corresponds to the association index values for morphospecies pairs. (B) Dendrogram illustrating similarity relationships in (A), based on agglomerative hierarchical clustering.
For PCA using presence-absence data, clam- and mussel-associated assemblages were evident, as was the association of clams with greater depth. For PCA with quantitative data, abundances of xenophyophores (Syringammina sp.), spatangoid urchins (Sarsiaster griegii), squat lobsters, and nematocarcinid shrimp were associated with increasing depth and clams. Background bathyal megafauna contributing most to the variance of the principal components tended to be negatively associated with seep morphotypes or, as in the case of the “large eel” and the halosaur Aldrovandia sp., were randomly associated with seep morphotypes and closely associated with one another. There were also positive associations between background morphotypes, notably between several echinoderms [red saleniid urchins (Bathysalenia goesiana) and red brittle stars for the presence-absence data; goniasterid seastars (Mediaster sp.), Bathysalenia goesiana, and persiculidan sea cucumbers (Oloughlinius sp.) for the abundance data set, among others)] and the hydroid.
Cooccurrence analysis (Figure 10; Supplementary Table 2) of 662 “samples” (photos) from the 8 high-resolution transect lines identified 19 positive and 30 negative significant associations among 42 morphotypes, where one of these “morphotypes” represented the aggregate of seep indicators (mussels, clams, bacterial mat, tubeworms, and/or authigenic carbonates). There were ten positive associations with seep indicators: xenophyophores (Syringammina sp.), holothurians (Psychronaetes sp.), spatangoid urchins (Sarsiaster griegii), squat lobsters, nematocarcinid shrimp, sponges, Sargassum, the benthopectinid seastar Cheiraster blakei, the octopus, and the Venus Fly-Trap anemone. Four negative associations with seep indicators were identified: the white and red brittle stars, the red saleniid urchins (Bathysalenia goesiana), and the solitary hydroid. Network analysis revealed numerous spatial associations among morphotypes. All 28 morphotypes had some degree of connectivity (Figure 9A), i.e., they cooccurred with one other morphotype in at least one image. The highest association index value (0.72) was between live mussels and mussel shells – they were often observed in the same photo. Relatively high associations (0.21 to 0.42) were detected for a few other morphotype pairs, all primarily or exclusively restricted to the seep habitat (Table 3). Three sub-communities—referred to here as clam-associated, mussel-associated, and background bathyal communities—were identified by the “fastgreedy” community detection function (Figure 9). In this analysis, the background bathyal sub-community was most diverse, with 15 morphotypes, of which 10 were echinoderms.
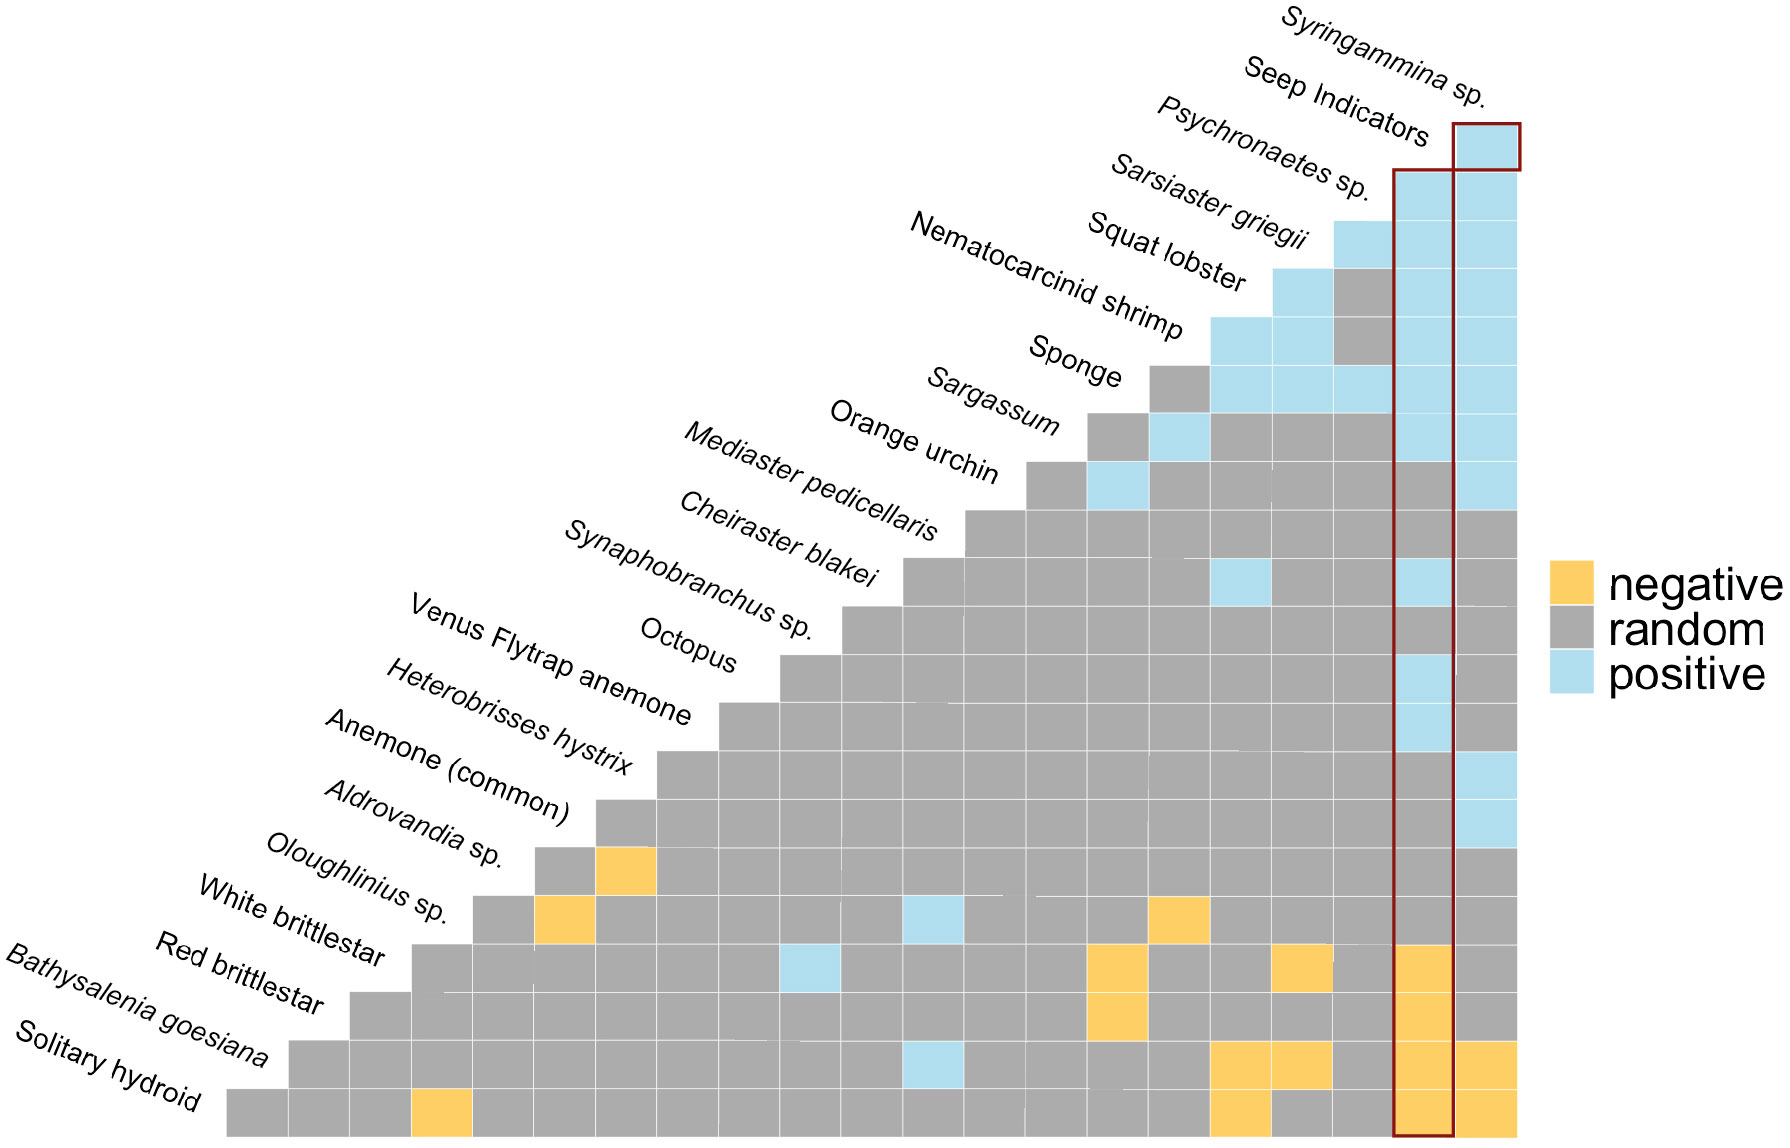
Figure 10 Co-occurrence patterns within individual photos. Positive (blue), negative (yellow), and random (grey) pairwise associations. “Seep Indicators” = clams, mussels, tubeworms, bacterial mat, and/or authigenic carbonates. Red rectangles highlight associations with Seep Indicators. The most negative pairwise associations are on the left-hand side, the most positive pairwise associations are on the right-hand side of the matrix.
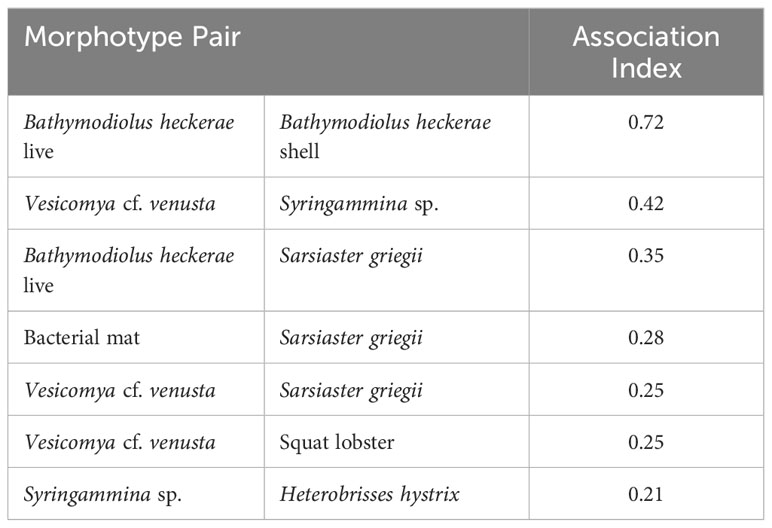
Table 3 Rank order of highly associated morphotype pairs (association index > 0.2) in photos, based on network analysis.
3.2.5 Ecotone analysis
Dissimilarity profiles derived from Split Moving Window analysis of transects 1E and 2E, where no seep indicators were present, showed no evidence of significant dissimilarities in morphotype composition, i.e., no ecotones (Figures 11A, B). In contrast, dissimilarity profiles of other transects had one (8E, 10E, 18E, 26E); two (20E); or three (24E) breakpoints, indicative of transitional (ecotone) assemblages (Figures 11C–H; Supplementary Table 3). Collections of significant dissimilarities with breakpoints extended from 5 to 15 “sample positions” (i.e., photos) or ~15 to 50 m.
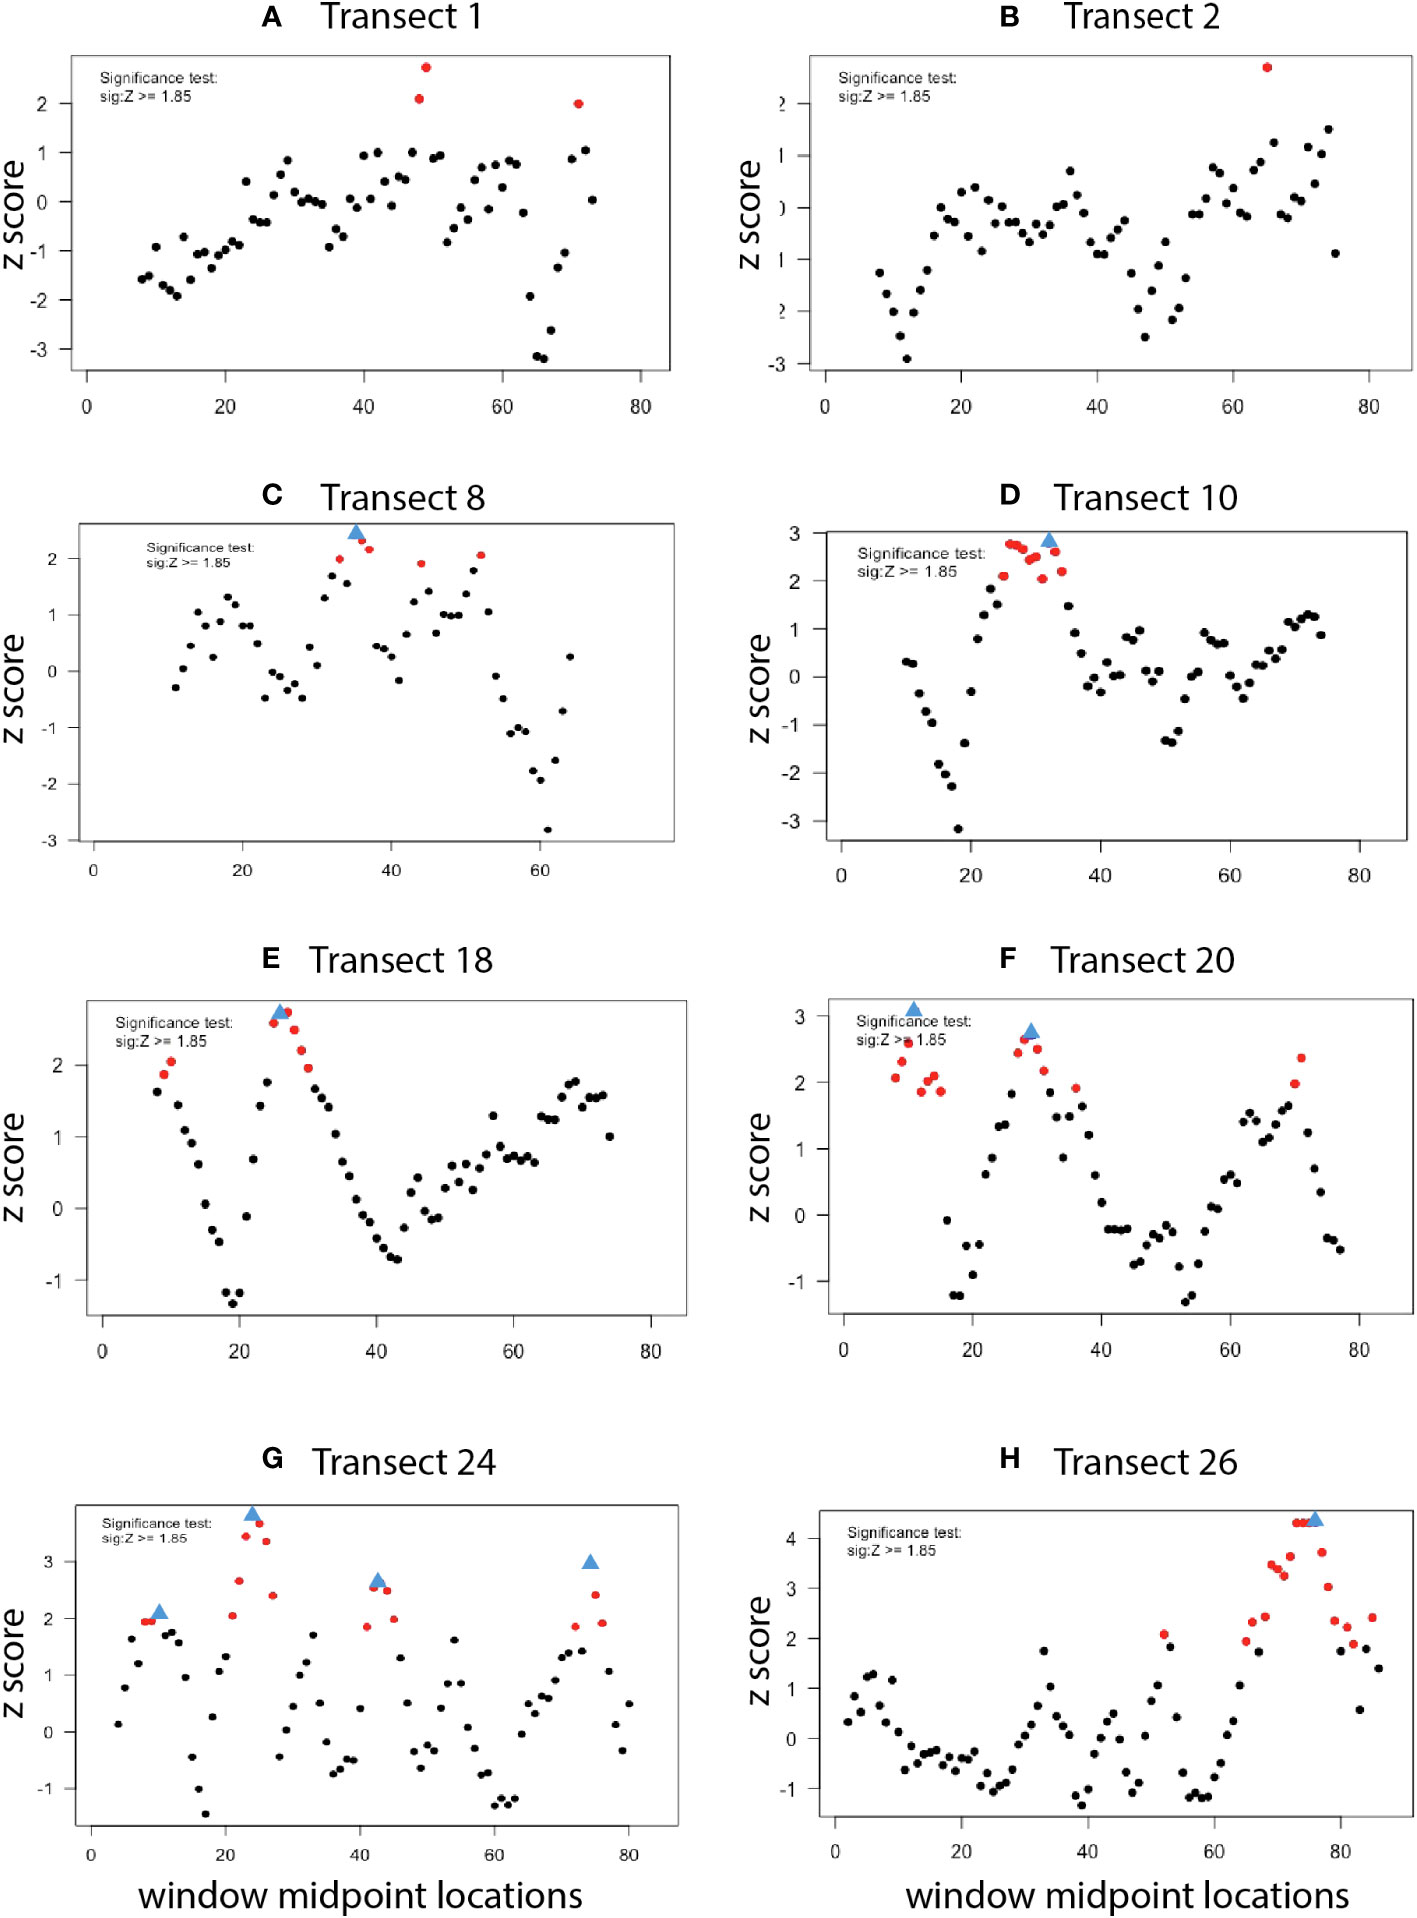
Figure 11 Ecotone analysis (dissimilarity profiles) for high-resolution transects. Red circles: Points of significant dissimilarity (Z score > 1.85). Blue triangles: Ecotone “breakpoints” associated with a collection of significant dissimilarities. Window sizes: (A–C), (F–H): 16, 18; (D, E): 20, 22, 24, 26, 28.
4 Discussion
4.1 Watercolumn variables
Negative dEh/dt anomalies 5 m above bottom were small but consistent with the anomalous redox potential of seep effluents relative to background environments (Henry et al., 2002; Joye, 2020). Eh anomalies at Blake Ridge South were concentrated in the eastern region of the study area, beyond the boundary of the seep habitat defined by seep indicator taxa. Given that only a single water-column anomaly (bubble plume) was detected in the region of BR South during shipboard multibeam surveys undertaken on the same expedition (Brothers et al., 2013), a parsimonious interpretation is that the Eh anomalies reported here likely reflect the intersection of Sentry’s Eh sensor 5 m above bottom with a diluted, advected Eh signal in a boundary layer that is moving eastward from the seep and above a down-sloping seafloor. We expect that environmental variables such as boundary layer and porewater sulfide chemistry may exert a strong influence on species’ distributions in seep and non-seep habitats (Heyl et al., 2007), but these variables were not possible to detect with the remote sensors used in this study.
4.2 Biodiversity and community structure
For a given sampling effort, seep habitats at Blake Ridge South supported greater species richness than adjacent non-seep habitats. This finding supports emerging views of seeps as facilitators of species aggregation (Sen et al., 2019), though other reports document seeps as environments with low diversity (Sibuet and Olu-LeRoy, 2003; Fisher et al., 2007). Biomass at BR South seeps was dominated by endemic taxa hosting chemoautotrophic endosymbionts (bathymodiolin mussels, vesicomyid clams), as is well documented for many other seeps in the deep sea (Stewart et al., 2005; Cavanaugh et al., 2013).
Large-scale mapping provides robust visual evidence that certain background epibenthic megafauna are negatively associated with the seep habitat (i.e., Benthodytes sp., Hygrosoma sp., brisingid seastar, red brittlestar, Aldrovandia sp., Synaphobranchus sp.) while others are positively associated with seeps (i.e., squat lobsters, nematocarcinid shrimp, octopus). Although sulfide toxicity may limit survival of some non-seep-endemic species in areas of active seepage (Levin, 2005; Riesch et al., 2015), a variety of adaptations and mechanisms likely evolved to reduce the toxic effect in some taxa, allowing them to thrive as consumers of other taxa in productive seep habitats (Bagarinao, 1992; Chou et al., 2023).
Faunal differences between seep and adjacent non-seep habitats are evident in NMDS analyses, consistent with observations at seeps throughout the global ocean (e.g., Levin, 2005; Dubilier et al., 2008; Wang et al., 2022). The lognormal relative abundance distribution (RAD) has been proposed as an accurate model for undisturbed communities (Matthews and Whittaker, 2015) and was the best fit to community data for the non-seep habitat at Blake Ridge South. The Zipf distribution has been posited as the outcome of lumping together species belonging to two different ecological communities in microbial studies (Shoemaker et al., 2017). A Zipf distribution model for the Blake Ridge South seep habitat likely reflects the mingling of non-seep taxa with seep taxa. This is consistent with the presence of soft-sediment environments interspersed among the mussels, clams, tubeworms, bacterial mat, and authigenic carbonates, i.e., the seep habitat itself is a mosaic of seep and non-seep patches. In addition, as mentioned above, some non-seep-endemic taxa apparently thrive in close association with seep-endemic taxa.
4.2.1 Morphotype distributions and associations
Only a small percentage (<12%) of the overall variation in morphotype occurrence and distribution can be explained by the first two principal components. Even so, there was a significant association between increased depth and clam beds, despite the narrow range of depths encountered (~6 m). This relationship between clam distribution and local lows on a soft-sediment seabed may reflect hydrogeological processes, including methane escape and sediment instabilities (Rogers, 2015). This relationship was not consistently observed at the Blake Ridge “Main” seep site (Wagner et al., 2013).
Network analysis revealed associations among morphotypes that confirm and expand upon previously described associations among megafaunal morphotypes of seep and non-seep habitats in general (Levin, 2005) and at Blake Ridge in particular (Van Dover et al., 2003; Wagner et al., 2013). Two sub-communities were identified in the seep habitat: one associated with mussel-engineered hard, complex substratum associated with microbially generated authigenic carbonates, the other with clams living in soft sediments. Megafauna associated with mussel or clam beds typically have a trophic relationship with hydrocarbon seepage and primary production by chemoautotrophic microbes (Van Dover et al., 2003; MacAvoy et al., 2005; Sen et al., 2019; Lin et al., 2020; Turner et al., 2020).
Several seep-endemic/non-seep-endemic morphotype pairs had high association. For example, the abundant xenophyophore Syringammina sp. had a high association index with the seep-endemic clam Vesicomya cf. venusta and soft sediments. Syringammina sp. subsists at least partially on microbes (Laureillard et al., 2004), but, since they do not have a high association with bacterial mats (also on soft sediments), mat microbes are unlikely to be important contributors to Syringammina nutrition. The spatangoid urchin Sarsiaster griegii had relatively high association indices with mussels, bacterial mat, and clams. While S. griegii was observed in photos with mussels, it did not occur on the mussels but on soft sediment adjacent to them. We infer that both Syringammina sp. and S. griegii are sulfide-tolerant taxa that aggregate in microbially enriched soft-sediment of the seep environment and that S. griegii may consume the bacterial mat through which it leaves distinctive trails (Supplementary Figure 2, photo 4699). The nemaotcarcinid shrimp was assigned to the mussel community in the network analysis here, but the stable isotopic composition of shrimp from the Blake Ridge Main seep suggests that shrimp in Blake Ridge seep habitats may rely mostly on organic carbon derived from sulfide oxidation (Van Dover et al., 2003). The shrimp may use the habitat complexity of mussel beds as refugia from predation.
To our knowledge, the Blake Ridge South morphotype network is the first of its kind to be created with megafauna occurrence data from a chemosynthetic ecosystem in the deep sea. Insights gained from this effort highlight the information potential of network analysis in the deep sea, as noted elsewhere (Mitchell et al., 2020). Robust biotic networks for threatened deep-sea habitats can inform spatial planning of conservation areas (Jones et al., 2020) and function as important components of Environmental Impact Assessments (Durden et al., 2018).
4.3 Ecotone analysis
Ecologists have often treated habitats in the vicinity of seeps in a binary fashion: being either seep or non-seep (Levin et al., 2016). Ecotone analysis of the Blake Ridge South high-resolution mapping effort revealed multiple transition zones associated with seep habitats. That is, there is a patchwork of seep, non-seep, and ecotone habitats within the seep polygon, as has been reported at seeps elsewhere (e.g., Lessard-Pilon et al., 2010; Åström et al., 2020). Community transitions occur between these habitat patches as well as between the seep community and the background bathyal benthic assemblage. The horizontal extent of ecotone features detected through spatial distributions of epibenthic morphotypes at Blake Ridge South was on the order of 10’s of meters. Elsewhere, measures of the sphere of influence of deep-sea seeps range from 200 m across a “chemotone” (Ashford et al., 2021b) to as much as ~2 km based on carbon isotopic signals of seep carbon in squat lobster tissues (MacAvoy et al., 2008).
This Blake Ridge South study addresses community transitions in one dimension (horizontally west to east) but the sphere of influence of the seep environment on microbial, invertebrate, and fish community assemblages transitions in vertical dimensions as well (Levin et al., 2016; Sisma-Ventura et al., 2022). Multi-dimensional ecotone analyses would provide greater insight into the seascape ecology associated with seep habitats.
4.4 Blake Ridge seeps as a whale foraging area?
Ziphius beaked whales are cosmopolitan species (MacLeod et al., 2006) that dive to depths greater than 1000 m and up to 2500 m to forage on cephalopods and fishes along the continental margin of the western North Atlantic (Shearer et al., 2019), but little is known about their prey fields at depth (Auster and Watling, 2010). These whales are suction feeders (Woodside et al., 2006), but knowledge of their diet is largely from gut contents of dead animals (West et al., 2017). Forty-five discrete depressions in the sediment within the ~16 hectare study area at BR South resemble those interpreted elsewhere as feeding gouges of beaked whales in the vicinity of chemosynthetic ecosystems in the Mediterranean (Woodside et al., 2006). If this interpretation is valid, then densities of near-bottom cephalopods and fishes observed during the Sentry 148 survey may provide insight into prey fields that attract foraging whales (Auster and Watling, 2010).
At the Blake Ridge South study area, blue hake (Antimora sp.; family Moridae), halosaurid fish, and synaphobranchid fish dominated the potential prey field in areas where gouges were observed. Of these families, only Moridae were reported as a prey item in the stomach of a beaked whale from South African waters (West et al., 2017). Although benthic invertebrates at seeps were postulated as a potential food resource for beaked whales (Woodside et al., 2006), the presence of only a single gouge on soft sediments of the Blake Ridge South seep habitat polygon provides little support for this hypothesis. Instead, enhanced primary and secondary production within the seep site and secondary production exported from the seep site may attract and aggregate marauding fish predators and scavengers to the seep ecotone, which in turn serve as prey for beaked whales. Without direct observations of beaked whales making foraging dives on the Blake Ridge, any relationship between the seeps and whales remains intriguing speculation.
4.5 Marine litter at Blake Ridge South
The density of litter in the BR South seascape (~2 items h-1) is within the range of values reported on seabed features elsewhere in the Atlantic and the Indian Ocean [0.6 to 12.2 items ha-1 (Woodall et al., 2015)], though the density of litter reported from hydrothermal-vent ecosystems of the Aeolian volcanic arc off Italy was much higher [~57 items h-1 (Consoli et al., 2021)]. In contrast to litter observed by Woodall et al. (2015) and Consoli et al. (2021) in areas of relatively high fishing activity, no obvious fishing gear was observed at BR South. Instead, much of the litter resembled galley items routinely carried on any vessel (bottle, can, carton); it also included what looks like Expendable BathyThermograph (XBT) spools (scientific gear). This litter is consistent with the site having been occupied by numerous scientific research vessels since the 1990s, including the 2012 Sentry expedition reported here.
4.6 Potential for automated image analysis and environmental impact studies
Autonomous underwater vehicles capture thousands of overlapping images during systematic surveys. Frame-by-frame detailing of morphotype abundances in a study area as undertaken here was a time-consuming, albeit rewarding, effort. A subset of 11 large, distinctive, and common megafaunal taxa could, however, be rapidly and reliably counted and used to visually characterize positive and negative associations of these taxa at a relatively large scale and with relative ease and accuracy. Quantitative assessment of this subset of taxa could readily be undertaken using automated image analysis (Schoening et al., 2012; Piechaud et al., 2019; Piechaud and Howell, 2022), use of artificial intelligence design, and collaborative studies (Bell et al., 2022). Most other taxa in this study, however, were enumerated using a team approach, with multiple pairs of eyes analyzing each photo in the “high-resolution” study [i.e., a fraction (13%) of the total number of photos in the Sentry 148 survey]. With improved camera resolution, some of these taxa may be amenable to enumeration through automated image analysis. Cryptic species may remain under-reported in both manually annotated and automated analyses; rare species will be a particular challenge for automated systems, since training sets may be inadequate for machine learning (Durden et al., 2021). Additionally, infauna of all sizes are missed by such photographic surveys. For baseline and subsequent monitoring to assess environmental impacts of human activities on the seafloor, a practical approach may be to identify a set of indicator taxa that contribute to important ecological functions and that are amenable to automated analysis. Such an approach would be a complement to, not a substitute for, more detailed analyses of ecosystem structure and function prior to and at intervals during the activity.
5 Conclusions
Lack of an aerial view or landscape vista makes it challenging to understand distributions of species in a deep seascape. From frame-by-frame analysis of photo surveys such as those undertaken here, an observer can begin to detect transitions and associations. The resulting large matrix of data—a 662 photo x 46 taxa matrix for the high-resolution analysis undertaken here—benefits from exploration and visualization using multivariate tools. Visual analysis of megafaunal distributions from AUV imaging transects provides quantitative data for seascape perspectives on deep-sea ecology, but it is time-consuming and will benefit immensely from continued development of automated image analysis.
Multiple multivariate analyses used in landscape ecology (e.g., principal component, cooccurrence, network, ecotone analyses) yielded insights into the seascape ecology of the Blake Ridge South. Distributions of background epibenthic megafauna were non-random for many morphotypes, with positive and negative associations between morphotypes and the seep habitat. Distinct benthic megafaunal assemblages were associated with clams, mussels, transition zones, and background habitats. Four morphotypes were non-endemic indicator taxa for the seep habitat: Syringammina sp., nematocarcinid shrimp, Sarsiaster griegii, and squat lobsters; two morphotypes were indicator taxa for non-seep habitats: Synaphobranchus sp. and the solitary hydroid. Further multivariate analyses suggested that binary characterization of Blake Ridge South as comprising seep and non-seep habitats is useful, but simplistic.
The seep area is itself a patchy mosaic of habitats, and transition zones occur within the seep area as well as between seep and non-seep environments. Factors underlying positive associations of background fauna with seep habitats are sometimes easy to infer, as in the case of the octopus, which feed on bivalves; spatangoid urchins, which feed on enriched organic material in sediments; and squat lobsters, which benefit from enhanced secondary productivity and from habitat complexity (escape from predation) associated with mussel beds. Negative associations between morphotypes and seep habitats are more difficult to understand or predict; sulfide toxicity remains the prevalent but untested hypothesis for this pattern of morphotype distribution. The sphere of influence of seep productivity appears to be relatively limited, 10’s of meters, for epibenthic megafauna. Like many other regions of the deep sea, Blake Ridge South has accumulated marine litter, including litter likely originating from scientific endeavors. The suite of analyses deployed here establish ecological baselines against which future studies may measure natural (and anthropogenic) changes in the BR South seascape through time.
Data availability statement
The original contributions presented in the study are included in the article/Supplementary Material. Further inquiries can be directed to the corresponding author.
Author contributions
Field campaign: CG, CK, DY. Eh sensor and analyses: KN. Shore-based analyses: CVD, with contributions from KJ, AT, AS. Analysis, visualization, and interpretation of data: All authors. Drafting of manuscript: KJ, AT, CG, KN, CVD. All authors contributed to the article and approved the submitted version.
Funding
Field work was supported by a National Science Foundation award (BioOce-1031050) and the NOAA Office of Ocean Exploration and Research to CVD. KJ and AT received research funding from the Rachel Carson Scholars Program (Duke University).
Acknowledgments
We thank the 2012 on-shore and at-sea cruise participants and support teams, with special thanks to L Brothers (USGS), J Wagner (Duke), Z McKelvey (Duke), M Shimizu (Duke). We are also grateful to colleagues who assisted with identifications: S Ross (University of North Carolina Wilmington; fish); D Pawson (Smithsonian National Museum of Natural History; echinoderms); C Seid (Scripps Institute of Oceanography; echinoderms); S Auscavitch (Temple University; echinoderms and cnidarians) as well as along with R Centurion (University of Washington), A Hosie (Western Australian Museum), G Oliver (National Museum of Wales), and members of the DOSI community for their participation in the morphospecies identification survey. E Rodríguez (American Museum of Natural History) and J Durden (UK National Oceanography Centre) also provided taxonomic support. We also thank M. Vecchione and three reviewers for insight and thoughtful suggestions that improved the manuscript.
Conflict of interest
The authors declare that the research was conducted in the absence of ay commercial or financial relationships that could be construed as potential conflict of interest.
The handling editor AT declared a past co-authorship with the author CG.
Publisher’s note
All claims expressed in this article are solely those of the authors and do not necessarily represent those of their affiliated organizations, or those of the publisher, the editors and the reviewers. Any product that may be evaluated in this article, or claim that may be made by its manufacturer, is not guaranteed or endorsed by the publisher.
Supplementary material
The Supplementary Material for this article can be found online at: https://www.frontiersin.org/articles/10.3389/fmars.2023.1198226/full#supplementary-material
References
Ashford O. S., Guan S., Capone D., Rigney K., Rowley K., Cordes E. E., et al. (2021a). Relationships between biodiversity and ecosystem functioning proxies strengthen when approaching chemosynthetic deep-sea methane seeps. Proc. R. Soc B Biol. Sci. 288, 4–6. doi: 10.1098/rspb.2021.0950
Ashford O. S., Guan S., Capone D., Rigney K., Rowley K., Orphan V., et al. (2021b). A chemosynthetic ecotone—”chemotone”—in the sediments surrounding deep-sea methane seeps. Limnol. Oceanogr. 66, 1687–1702. doi: 10.1002/lno.11713
Astarloa A., Louzao M., Boyra G., Martinez U., Rubio A., Irigoien X., et al. (2019). Identifying main interactions in marine predator-prey networks of the Bay of Biscay. ICES J. Mar. Sci. 76, 2247–2259. doi: 10.1093/icesjms/fsz140
Åström E. K. L., Sen A., Carroll M. L., Carroll J. L. (2020). Cold seeps in a warming arctic: insights for benthic ecology. Front. Mar. Sci. 7. doi: 10.3389/fmars.2020.00244
Auster P. J., Watling L. (2010). Beaked whale foraging areas inferred by gouges in the seafloor. Mar. Mammal Sci. 26, 226–233. doi: 10.1111/j.1748-7692.2009.00325.x
Bagarinao T. (1992). Sulfide as an environmental factor and toxicant: Tolerance and adaptations in aquatic organisms. Aquat. Toxicol. 24, 21–62. doi: 10.1016/0166-445X(92)90015-F
Baker E. T., Massoth G. J., Nakamura K. I., Embley R. W., De Ronde C. E. J., Arculus R. J. (2005). Hydrothermal activity on near-arc sections of back-arc ridges: Results from the Mariana Trough and Lau Basin. Geochemistry Geophys. Geosystems 6. doi: 10.1029/2005GC000948
Bell K. L. C., Chow J. S., Hope A., Quinzin M. C., Cantner K. A., Amon D. J., et al. (2022). Low-cost, deep-sea imaging and analysis tools for deep-sea exploration: A collaborative design study. Front. Mar. Sci. 9. doi: 10.3389/fmars.2022.873700
Blanchet F. G., Cazelles K., Gravel D. (2020). Co-occurrence is not evidence of ecological interactions. Ecol. Lett. 23, 1050–1063. doi: 10.1111/ele.13525
Brothers L. L., Van Dover C. L., German C. R., Kaiser C. L., Yoerger D. R., Ruppel C. D., et al. (2013). Evidence for extensive methane venting on the southeastern U.S. Atlantic margin. Geology 41, 807–810. doi: 10.1130/G34217.1
Calatayud J., Andivia E., Escudero A., Melián C. J., Bernardo-Madrid R., Stoffel M., et al. (2020). Positive associations among rare species and their persistence in ecological assemblages. Nat. Ecol. Evol. 4, 40–45. doi: 10.1038/s41559-019-1053-5
Carney R. S. (1994). Consideration of the oasis analogy for chemosynthetic communities at Gulf of Mexico hydrocarbon vents. Geo-Marine Lett. 14, 149–159. doi: 10.1007/BF01203726
Cavanaugh C., McKiness Z., Newton I., Stewart F. (2013). “Marine chemosynthetic symbioses,” in The prokaryotes: prokaryotic biology and symbiotic associations. Eds. Rosenberg E., DeLong E. F., Thompson F., Lory S., Stackebrandt E. (New York: Springer), 1–607. doi: 10.1007/978-3-642-30194-0
Chou P. H., Hu M. Y., Guh Y. J., Wu G. C., Yang S. H., Tandon K., et al. (2023). Cellular mechanisms underlying extraordinary sulfide tolerance in a crustacean holobiont from hydrothermal vents. Proc. R. Soc B Biol. Sci. 290, 20221973. doi: 10.1098/rspb.2022.1973
Clauset A., Newman M. E. J., Moore C. (2004). Finding community structure in very large networks. Phys. Rev. E - Stat. Physics Plasmas Fluids Relat. Interdiscip. Top. 70, 6. doi: 10.1103/PhysRevE.70.066111
Connelly D. P., Copley J. T., Murton B. J., Stansfield K., Tyler P. A., German C. R., et al. (2012). Hydrothermal vent fields and chemosynthetic biota on the world’s deepest seafloor spreading centre. Nat. Commun. 3, 620. doi: 10.1038/ncomms1636
Consoli P., Esposito V., Battaglia P., Perzia P., Scotti G., D’Alessandro M., et al. (2021). Marine litter pollution associated with hydrothermal sites in the AEOLIAN archipelago (western Mediterranean Sea). Sci. Total Environ. 773, 108947. doi: 10.1016/j.scitotenv.2021.144968
Csardi G., Nepusz T. (2006). The igraph software package for complex network research. InterJournal Complex Systems. 1695, 1–9.
De Cáceres M. (2020) How to use the indicspecies package (ver. 1.7.8). Available at: https://cran.r-project.org/web/packages/indicspecies/vignettes/indicspeciesTutorial.pdf.
Demopoulos A. W. J., Bourque J. R., Durkin A., Cordes E. E. (2018). The influence of seep habitats on sediment macrofaunal biodiversity and functional traits. Deep. Res. Part I Oceanogr. Res. Pap. 142, 77–93. doi: 10.1016/j.dsr.2018.10.004
Dubilier N., Bergin C., Lott C. (2008). Symbiotic diversity in marine animals: The art of harnessing chemosynthesis. Nat. Rev. Microbiol. 6, 725–740. doi: 10.1038/nrmicro1992
Durden J. M., Hosking B., Bett B. J., Cline D., Ruhl H. A. (2021). Automated classification of fauna in seabed photographs: The impact of training and validation dataset size, with considerations for the class imbalance. Prog. Oceanogr. 196, 102612. doi: 10.1016/j.pocean.2021.102612
Durden J. M., Lallier L. E., Murphy K., Jaeckel A., Gjerde K., Jones D. O. B. (2018). Environmental Impact Assessment process for deep-sea mining in ‘the Area.’. Mar. Policy 87, 194–202. doi: 10.1016/j.marpol.2017.10.013
Erdős L., Zalatnai M., Bátori Z., Körmöczi L. (2014). Transitions between community complexes: a case study analysing gradients through mountain ridges in south Hungary. Acta Botanica Croatica. 73 (1), 63–77. doi: 10.2478/botcro-2013-0009
Farine D. R. (2013). Animal social network inference and permutations for ecologists in R using asnipe. Methods Ecol Evol. 4 (12), 1187–1194. doi: 10.1111/2041-210X.12121
Fisher C., Roberts H., Cordes E., Bernard B. (2007). Cold Seeps and associated communities of the Gulf of Mexico. Oceanography 20, 118–129. doi: 10.5670/oceanog.2007.12
Goffredi S. K., Tilic E., Mullin S. W., Dawson K. S., Keller A., Lee R. W., et al. (2020). Methanotrophic bacterial symbionts fuel dense populations of deep-sea feather duster worms (Sabellida, Annelida) and extend the spatial influence of methane seepage. Sci. Adv. 6, 1–12. doi: 10.1126/sciadv.aay8562
Griffith D. M., Veech J. A., Marsh C. J. (2016). Cooccur: Probabilistic species co-occurrence analysis in R. J. Stat. Software 69, 1–17. doi: 10.18637/jss.v069.c02
Henry P., Lallemant S., Nakamura K. I., Tsunogai U., Mazzotti S., Kobayashi K. (2002). Surface expression of fluid venting at the toe of the Nankai wedge and implications for flow paths. Mar. Geol. 187, 119–143. doi: 10.1016/S0025-3227(02)00262-1
Hessler R., Smithey W. (1982). “The distribution and community structure of megafauna at the Galapagos Rift hydrothermal vents,” in Hydrothermal processes at seafloor spreading centers (Boston: Springer), 735–770.
Heyl T., Gilhooly W., Chambers R., Gilchrist G., Macko S., Ruppel C., et al. (2007). Characteristics of vesicomyid clams and their environment at the Blake Ridge cold seep, South Carolina, USA. Mar. Ecol. Prog. Ser. 339, 169–184. doi: 10.3354/meps339169
Hornbach M. J., Ruppel C., Van Dover C. L. (2007). Three-dimensional structure of fluid conduits sustaining an active deep marine cold seep. Geophys. Res. Lett. 34, L05601. doi: 10.1029/2006GL028859
Huvenne V. A. I., Robert K., Marsh L., Lo Iacono C., Le Bas T., Wynn R. B. (2018). “ROVs and AUVs,” in Submarine geomorphology (Cham: Springer), 93–108. doi: 10.1007/978-3-319-57852-1
Jones D. O. B., Ardron J. A., Colaço A., Durden J. M. (2020). Environmental considerations for impact and preservation reference zones for deep-sea polymetallic nodule mining. Mar. Policy 118, 103312. doi: 10.1016/j.marpol.2018.10.025
Joye S. B. (2020). The geology and biogeochemistry of hydrocarbon seeps. Annu. Rev. Earth Planet. Sci. 48, 205–231. doi: 10.1146/annurev-earth-063016-020052
Kaiser C., Kinsey J., Pinner W., Yoerger D., German C., Van Dover C. (2012). “Satellite based remote management and operation of a 6000m AUV,” in 2012 Oceans. (IEEE), 1–7. doi: 10.1109/OCEANS.2012.6404900
Laureillard J., Méjanelle L., Sibuet M. (2004). Use of lipids to study the trophic ecology of deep-sea xenophyophores. Marine Ecology Progress Series 270, 129–140. doi: 10.3354/meps270129
Legendre P., Gallagher E. D. (2001). Ecologically meaningful transformations for ordination of species data. Oecologia 129, 271–280. doi: 10.1007/s004420100716
Lessard-Pilon S., Porter M. D., Cordes E. E., MacDonald I., Fisher C. R. (2010). Community composition and temporal change at deep Gulf of Mexico cold seeps. Deep. Res. Part II Top. Stud. Oceanogr. 57, 1891–1903. doi: 10.1016/j.dsr2.2010.05.012
Levin L. A. (2005). Ecology of cold seep sediments: Interactions of fauna with flow, chemistry and microbes. Oceanogr. Mar. Biol. Annu. Rev. 43, 1–46. doi: 10.1201/9781420037449.ch1
Levin L. A., Baco A. R., Bowden D. A., Colaco A., Cordes E. E., Cunha M. R., et al. (2016). Hydrothermal vents and methane seeps: Rethinking the sphere of influence. Front. Mar. Sci. 3. doi: 10.3389/fmars.2016.00072
Lin Z. Y., Chen H. W., Lin H. J. (2020). Deep-Sea Research Part I Trophic model of a deep-sea ecosystem with methane seeps in the South China Sea. Deep. Res. Part I 159, 103251. doi: 10.1016/j.dsr.2020.103251
MacAvoy S. E., Fisher C. R., Carney R. S., Macko S. A. (2005). Nutritional associations among fauna at hydrocarbon seep communities in the Gulf of Mexico. Mar. Ecol. Prog. Ser. 292, 51–60. doi: 10.3354/meps292051
MacAvoy S. E., Morgan E., Carney R. S., Macko S. A. (2008). Chemoautotrophic production incorporated by heterotrophs in Gulf of Mexico hydrocarbon seeps: An examination of mobile benthic predators and seep residents. J. Shellfish Res. 27, 153–161. doi: 10.2983/0730-8000(2008)27[153:CPIBHI]2.0.CO;2
MacLeod C. D., Perrin W. F., Pitman R., Barlow J., Balance L. D., Amico A. N., et al (2006). Known and inferred distributions of beaked whale species (Cetacea: Ziphiidae). J. Cetacean Res. Manag. 7, 271–286.
Marsh L., Huvenne V. A. I., Jones O. B. (2018). Geomorphological evidence of large vertebrates interacting with the seafloor at abyssal depths in a region designated for deep-sea mining. R. Soc Open Sci. 5, 180286. doi: 10.6084/m9.figshare.c.4191131
Matthews T. J., Whittaker R. J. (2015). On the species abundance distribution in applied ecology and biodiversity management. J. Appl. Ecol. 52, 443–454. doi: 10.1111/1365-2664.12380
Mitchell E. G., Durden J. M., Ruhl H. A. (2020). First network analysis of interspecific associations of abyssal benthic megafauna reveals potential vulnerability of abyssal hill community. Prog. Oceanogr. 187, 102401. doi: 10.1016/j.pocean.2020.102401
Nakamura K., Veirs S., Sarason C. P., McDuff R. E., Stahr F., Yoerger D. R., et al. (2000). Electrochemical signals in rising buoyant plumes and tidally oscillating plumes at the main Endeavour vent field, Juan de Fuca Ridge. EOS Trans. Am. Geophys. Union 81, 48.
Oksanen J., Blanchet F. G., Kindt R., Legendre P., Minchin P. R., O’Hara R. B., et al. (2018) Vegan: Community Ecology Package R package version 20-7. Available at: http://cran.r-project.org/package=vegan.
Panis L. I., Verheyen R. F. (1995). On the use of split moving window analysis for boundary detection in ordered dataseries from benthic communities. Netherlands J. Aquat. Ecol. 29, 49–53. doi: 10.1007/BF02061788
Paull C., Matsumoto R., Wallace P. (1996). Initial Reports–Gas hydrate sampling on the Blake Ridge and Carolina Rise. Proc. Ocean Drill. Progr. 164, 623.
Piechaud N., Howell K. L. (2022). Fast and accurate mapping of fine scale abundance of a VME in the deep sea with computer vision. Ecol. Inform. 71, 101786. doi: 10.1016/j.ecoinf.2022.101786
Piechaud N., Hunt C., Culverhouse P. F., Foster N. L., Howell K. L. (2019). Automated identification of benthic epifauna with computer vision. Mar. Ecol. Prog. Ser. 615, 15–30. doi: 10.3354/meps12925
Pittman S., Yates K., Bouchet P., Alvarez-Berastegui D., Andréfouët S., Bell S., et al. (2021). Seascape ecology: Identifying research priorities for an emerging ocean sustainability science. Mar. Ecol. Prog. Ser. 663, 1–29. doi: 10.3354/meps13661
Pratt A., France S. C., Vecchione M. (2021). Survey of bathyal incirrate octopods in the western North Atlantic. Mar. Biodivers. 51, 49. doi: 10.1007/s12526-021-01191-y
Price D. M., Robert K., Callaway A., Lo lacono C., Hall R. A., Huvenne V. A. I. (2019). Using 3D photogrammetry from ROV video to quantify cold-water coral reef structural complexity and investigate its influence on biodiversity and community assemblage. Coral Reefs. 38, 1007–1021. doi: 10.1007/s00338-019-01827-3
R Core Team (2020) R: A language and environment for statistical computing. R A Lang. Environ. Stat. Comput. Available at: http://www.r-project.org/.
Riesch R., Tobler M., Plath M. (2015). “Hydrogen sulfide-toxic habitats,” in Extremophile fishes: ecology, evolution, and physiology of teleosts in extreme environments. (Cham: Springer), 137–159. doi: 10.1007/978-3-319-13362-1_7
Robinson C. A., Bernhard J. M., Levin L. A., Mendoza G. F., Blanks J. K. (2004). Surficial hydrocarbon seep infauna from the Blake Ridge (Atlantic Ocean 2150m) and the Gulf of Mexico (690-2240 m). Mar. Ecol. 25, 313–336. doi: 10.1111/j.1439-0485.2004.00034.x
Rogers R. (2015). Offshore gas hydrates: Origins, development, and production (Waltham MA: Gulf Professional Publishing).
Royan A., Reynolds S. J., Hannah D. M., Prudhomme C., Noble D. G., Sadler J. P. (2016). Shared environmental responses drive co-occurrence patterns in river bird communities. Ecography (Cop.). 39, 733–742. doi: 10.1111/ecog.01703
Sahu C., Kumar R., Sangwai J. S. (2020). Comprehensive review on exploration and drilling techniques for natural gas hydrate reservoirs. Energy Fuels 34, 11813–11839. doi: 10.1021/acs.energyfuels.0c02202
Schoening T., Bergmann M., Ontrup J., Taylor J., Dannheim J., Gutt J., et al. (2012). Semi-automated image analysis for the assessment of megafaunal densities at the Artic deep-sea observatory HAUSGARTEN. PloS One 7, 1–14. doi: 10.1371/journal.pone.0038179
Sen A., Chitkara C., Hong W.-L., Lepland A., Cochrane S., di Primio R., et al. (2019). Image based quantitative comparisons indicate heightened megabenthos diversity and abundance at a site of weak hydrocarbon seepage in the southwestern Barents Sea. PeerJ 7, e7398. doi: 10.7717/peerj.7398
Shearer J. M., Quick N. J., Cioffi W. R., Baird R. W., Webster D. L., Foley H. J., et al. (2019). Diving behaviour of Cuvier’s beaked whales (Ziphius cavirostris) off Cape Hatteras, North Carolina. R. Soc Open Sci. 6, 181728. doi: 10.1098/rsos.181728
Shoemaker W. R., Locey K. J., Lennon J. T. (2017). A macroecological theory of microbial biodiversity. Nat. Ecol. Evol. 1, 1–6. doi: 10.1038/s41559-017-0107
Sibuet M., Olu-LeRoy K. (2003). “Cold seep communities on continental cargins: Structure and quantitative distribution relative to geological and fluid venting patterns,” in Ocean margin systems. Eds. Wefer G., Billett D., Hebbeln D., Jørgensen B. B., Schlüter M., Van Weering T. C. E. (Berlin, Heidelberg: Springer Berlin Heidelberg), 235–251. doi: 10.1007/978-3-662-05127-6_15
Sisma-Ventura G., Bialik O. M., Makovsky Y., Rahav E., Ozer T., Kanari M., et al. (2022). Cold seeps alter the near-bottom biogeochemistry in the ultraoligotrophic Southeastern Mediterranean Sea. Deep. Res. Part I Oceanogr. Res. Pap. 183, 103744. doi: 10.1016/j.dsr.2022.103744
Stewart F. J., Newton I. L. G., Cavanaugh C. M. (2005). Chemosynthetic endosymbioses: adaptations to oxic-anoxic interfaces. Trends Microbiol. 13, 439–448. doi: 10.1016/j.tim.2005.07.007
Swanborn D. J. B., Huvenne V. A. I., Pittman S. J., Woodall L. C. (2022). Bringing seascape ecology to the deep seabed: A review and framework for its application. Limnol. Oceanogr. 67, 66–88. doi: 10.1002/lno.11976
Tumolo B. B., Calle L., Anderson H. E., Briggs M. A., Carlson S., MacDonald M. J., et al. (2020). Toward spatio-temporal delineation of positive interactions in ecology. Ecol. Evol. 10, 9026–9036. doi: 10.1002/ece3.6616
Turner P. J., Ball B., Diana Z., Fariñas-Bermejo A., Grace I., Mcveigh D., et al. (2020). Methane seeps on the US atlantic margin and their potential importance to populations of the commercially valuable deep-sea red crab, chaceon quinquedens. Front. Mar. Sci. 7:75. doi: 10.3389/fmars.2020.00075
Van Dover C. L., Aharon P., Bernhard J. M., Caylor E., Doerries M., Flickinger W., et al. (2003). Blake Ridge methane seeps: Characterization of a soft-sediment, chemosynthetically based ecosystem. Deep. Res. Part I Oceanogr. Res. Pap. 50, 281–300. doi: 10.1016/S0967-0637(02)00162-0
Van Dover C., Franks P., Ballard R. (1987). Prediction of hydrothermal vent locations from distributions of brachyuran crabs. Limnol. Oceanogr. 32, 1006–1010. doi: 10.4319/lo.1987.32.4.1006
Van Dover C., German C., Yoerger D., Kaiser C., Brothers L. (2012). “Telepresence field research experience for undergraduate and graduate students: An R/V Okeanos Explorer/AUV Sentry success story,” in AGU fall meeting abstracts, OS51D-1909. (Washington DC: American Geophysical Union),
Vieira D. C., Brustolin M. C., Ferreira F. C., Fonseca G. (2019). segRDA: An R package for performing piecewise redundancy analysis. Methods Ecol. Evol. 10, 2189–2194. doi: 10.1111/2041-210X.13300
Wagner J., McEntee M., Brothers L., German C., Kaiser C., Yoerger D., et al. (2013). Cold-seep habitat mapping: High-resolution spatial characterization of the Blake Ridge Diapir seep field. Deep Sea Res. Part II Top. Stud. Oceanogr. 92, 183–188. doi: 10.1016/j.dsr2.2013.02.008
Wang X., Guan H., Qiu J.-W., Xu T., Peckmann J., Chen D., et al. (2022). Macro-ecology of cold seeps in the South China Sea. Geosystems Geoenvironment 1, 100081. doi: 10.1016/j.geogeo.2022.100081
West K. L., Walker W. A., Baird R. W., Mead J. G., Collins P. W. (2017). Diet of Cuvier’s beaked whales Ziphius cavirostris from the North Pacific and a comparison with their diet world-wide. Mar. Ecol. Prog. Ser. 574, 227–242. doi: 10.3354/meps12214
Wickham H. (2016). ggplot2: elegant graphics for data analysis (New York: Springer-Verlag). Available at: https://ggplot2.tidyverse.org.
Woodall L. C., Robinson L. F., Rogers A. D., Narayanaswamy B. E., Paterson G. L. J. (2015). Deep-sea litter: a comparison of seamounts, banks and a ridge in the Atlantic and Indian Oceans reveals both environmental and anthropogenic factors impact accumulation and composition. Front. Mar. Sci. 2. doi: 10.3389/fmars.2015.00003
Keywords: Blake Ridge seep, cooccurrence, network analysis, ecotone, species distributions, sphere of influence, seascape ecology, marine litter
Citation: Johnson K, Taylor A, Socha A, Barkyoumb E, Nakamura K, Kaiser CL, German CR, Yoerger DR and Van Dover CL (2023) Seascape ecology in the vicinity of a Blake Ridge cold seep. Front. Mar. Sci. 10:1198226. doi: 10.3389/fmars.2023.1198226
Received: 31 March 2023; Accepted: 25 September 2023;
Published: 06 November 2023.
Edited by:
Andrew R. Thurber, Oregon State University, United StatesReviewed by:
Michael Vecchione, National Oceanic and Atmospheric Administration (NOAA), United StatesJill R. Bourque, U.S. Geological Survey, United States
Amanda Demopoulos, Wetland and Aquatic Research Center, United States
Mauricio Shimabukuro, Universidade Federal do Rio Grande, Brazil
Copyright © 2023 Johnson, Taylor, Socha, Barkyoumb, Nakamura, Kaiser, German, Yoerger and Van Dover. This is an open-access article distributed under the terms of the Creative Commons Attribution License (CC BY). The use, distribution or reproduction in other forums is permitted, provided the original author(s) and the copyright owner(s) are credited and that the original publication in this journal is cited, in accordance with accepted academic practice. No use, distribution or reproduction is permitted which does not comply with these terms.
*Correspondence: Kellie Johnson, kellie.a.johnson@alumni.duke.edu
†Present addresses: Koichi Nakamura, Earth and Evolution Sciences, Graduate School of Science and Technology, University of Tsukuba, Tsukuba, Japan
Carl L. Kaiser, 56 Hillcrest Dr, Falmouth, Massachusetts, MA, United States