Comparative analyses of eight primer sets commonly used to target the bacterial 16S rRNA gene for marine metabarcoding-based studies
 Hyeon Been Lee
 Dong Hyuk Jeong
 Byung Cheol Cho2,3
  Jong Soo Park
- 1Department of Oceanography, Kyungpook National University, Daegu, Republic of Korea
- 2School of Earth and Environmental Sciences, Seoul National University, Seoul, Republic of Korea
- 3Saemangeum Environmental Research Center, Kunsan National University, Kunsan, Republic of Korea
Next-generation sequencing (NGS), especially metabarcoding, is commonly used to study the diversity and distribution of microbes in diverse ecosystems. The choice of primer set is critical, given the drawbacks of short amplicons and amplicon sequencing bias inherent to metabarcoding. However, comparative analyses of primer sets have rarely been conducted using field samples. In this study, we compared eight commonly used primer sets, all targeting hypervariable regions in the bacterial 16S rRNA gene: 27F/338R (V1–V2), V2f/V3r (V2–V3), PRK341F/PRK806R (V3–V4), 341F/785R (V3–V4), 515F/806RB (V4), 515F/806R (V4), 515F-Y/926R (V4–V5), and B969F/BA1406R (V6–V8). We conducted NGS in triplicate, with >0.8 billion bases in total using coastal seawater samples. The representation of bacterial community composition varied significantly across the eight primer sets, despite being from the same sample. The 27F/338R primer set showed the highest number of operational taxonomic units (OTUs) and read counts, and accounted for 68% of all the order-level taxa found. Remarkably, a novel complementary combination of two primer sets, 27F/338R and 515F/806RB, covered 89% of all the orders that were present. Compared to other primer sets, this combination detected more OTUs of the orders Pelagibacterales and Rhodobacterales, which are ubiquitous in the oceans. As such, use of this combination in future studies may help to reduce diversity bias in ocean-derived samples, in particular temperate coastal samples.
1 Introduction
Prokaryotes are highly diverse, and play a critical role in pelagic marine food webs and biogeochemical cycles (Cho and Azam, 1988; Azam, 1998; Jiao et al., 2010). Prokaryotes can process large amounts of organic matter, and serve as prey for organisms from higher trophic levels, such as heterotrophic nanoflagellates and ciliates (Cole et al., 1988; Sherr and Sherr, 1994; Nagata, 2008). On Earth, the biomass of prokaryotes accounts for approximately 77 gigatons of carbon (70 gigatons of carbon for bacteria and 7 gigatons for archaea; Bar-On et al., 2018). Moreover, the densities of bacteria and archaea present in the ocean are approximately 2 × 10⁶ and 2 × 10⁴ cells/mL, respectively (Curtis et al., 2002). However, only a small proportion of prokaryotes can be cultured using classic plating methods (Wessner et al., 2013). Due to this bias in cultivation, next-generation sequencing (NGS) technologies, such as the 454 and Illumina platforms, have substantially widened our understanding of prokaryote diversity and evolution (Kirchman et al., 2010; Caporaso et al., 2012). Currently, the most popular NGS method is based on the Illumina platform (Logares et al., 2014; Choi and Park, 2020). Metabarcoding, an amplification method using marker gene primers, is more widely used for biodiversity analysis than metagenomics (or shotgun sequencing), a method of directly sequencing all DNA in the given environment (Johnson et al., 2019; Ruppert et al., 2019). This is due to the challenges of metagenomics, such as the prohibitive costs required to obtain adequate coverage, the lack of a curated genome database, and the requirement for more computing power to process the acquired data.
Metabarcoding generally depends on the sequencing profiles of 16S ribosomal RNA (rRNA) genes, which are effective and widely used biomarkers for comparative and phylogenetic analyses of microbes (Pace, 1997). As several studies have found, the selection of primers targeting 16S rRNA genes is the most critical step for an accurate understanding of the biodiversity of the extant biota in natural samples. Klindworth et al. (2013) conducted an in silico evaluation of 175 primers and 512 primer sets targeting 16S rRNA gene using the SILVA database, and recommended only 10 primers, including 341F and 785R, which could potentially be used to detect a broad range of prokaryotes. However, the detection of prokaryotic taxa is still far from comprehensive, and ecological conclusions regarding the diversity and relative abundance of the species present in a given sample are often questionable, due to the possibility of the use of inappropriate primers. Furthermore, there is a difference between in silico evaluation and field sample analysis using the same primer set. For example, Klindworth et al. (2013) noted that, in their in silico evaluation, the 341F/785R primer set failed to detect SAR11, the most abundant group in the ocean, although the SAR11 group could be detected by the same primers in the corresponding experimental evaluation. Parada et al. (2016) showed that the relative abundances in a mock community were substantially different from those of the corresponding field community.
The selection of primer sets for NGS-based metabarcoding has been limited by the short amplicons produced by NGS. Primer sets for metabarcoding need to be able to amplify short regions that are both unique to and variable between species (Ruppert et al., 2019). Thus, most primer sets have been designed to amplify the hypervariable regions of the 16S rRNA gene, which are sufficiently short for NGS, conserved enough to compare with other organisms, and divergent enough to identify species unambiguously. There are nine hypervariable regions in the 16S rRNA gene (termed V1–V9), and most of these regions are used for metabarcoding in diverse ecosystems (Hongoh et al., 2003; Sahm et al., 2013; Mesa et al., 2017; Willis et al., 2019). Thijs et al. (2017) reported a comparative analysis of four bacteria-specific primer pairs (68F/518R, 341F/785R, 799F/1193R, and 967F/1391R) for soil field samples, and suggested 341F/785R as the optimal primer pair for soil samples. However, data regarding the robustness of other primer sets in field samples are currently insufficient. Simultaneous comparison of multiple commonly used 16S rRNA gene primer sets should provide indispensable information on the choice of primer set, revealing the real composition and diversity of the bacterial community.
In this study, the diversity and relative abundance of bacterial communities present in a coastal seawater sample was investigated using the Illumina sequencing platform with eight primer sets targeting various hypervariable regions of the 16S rRNA gene. We compare the robustness of these eight primer sets as it relates to specific bacterial groups found in diverse field samples. We were able to rank the effectiveness of each primer set, but we also found that a combination of at least two primer sets should be the most effective way to understand extant bacterial taxonomic profiles.
2 Materials and methods
2.1 Sample collection and DNA extraction
Surface seawater was sampled from Yeongildae Beach in Pohang, Republic of Korea (36°03′49″N, 129°23′12″E), in June 2020. To collect the prokaryotes, approximately 5 L of the water sample was prefiltered through a 47-mm 1.2-μm-pore polycarbonate membrane filter (Isopore™, Merck Millipore, Billerica, MA, USA). Subsequently, the prefiltered subsamples were collected on several 47-mm 0.22-μm-pore PVDF membrane filters (Durapore®, Merck Millipore, Billerica, MA, USA) using a vacuum pump (DOA-P704-AC, Gast Manufacturing Inc., Benton Harbor, MI, USA). All filters were stored in a single 50-mL conical tube at –20°C pending further analyses. For eDNA extraction, the filters were thawed, sliced into several pieces, and replaced in the same tube, to which was added 1 mg mL–1 (final concentration) lysozyme (Sigma–Aldrich, St. Louis, MO, USA). The tube was incubated at 37°C for 30 min, and then 0.5 mg mL−1 (final concentration) proteinase K (Sigma–Aldrich, St. Louis, MO, USA) and 1% (final concentration) sodium dodecyl sulfate (Bioneer, Daejeon, Korea) were added. The tube was further incubated at 55°C for 2 h. Nucleic acids were purified using the DNeasy Blood and Tissue Kit (Qiagen, Hilden, Germany) according to the manufacturer’s instructions. The concentration of the extracted DNA was measured using a Quantus™ fluorometer (Promega, Madison, WI, USA). Approximately 341 ng μl−1 DNA was obtained.
2.2 Illumina MiSeq sequencing
Eight primer sets, amplifying the V1–V2, V2–V3, V3–V4, V4, V4–V5, or V6–V8 regions of the 16S rRNA gene, were used in triplicate for Illumina sequencing (Figure 1, Table 1). For the initial PCR process, each reaction mixture (23.5 μl total) contained 0.5 μl of Herculase II Fusion DNA polymerase (Agilent, Waldbronn, Germany), 5 μl of 5× Herculase II reaction buffer, 0.27 mM each dNTP (Agilent, Waldbronn, Germany), 0.5 mM each primer, 14.75 μl of sterile water, and 150 ng of extracted DNA. DNA amplification was performed on a Biometra TRIO thermal cycler (Analytik Jena, Jena, Germany). The PCR steps for each primer set are shown in Table 1. The initial PCR products were purified and concentrated using Agencourt AMPure XP beads (Beckman Coulter, Brea, CA, USA). The second PCR, which attached the dual index primers and Illumina sequencing adapters, was performed using the Nextera XT Index Kit (Illumina, Inc., San Diego, CA, USA) following the manufacturer’s protocol. Amplicon libraries were further purified using Agencourt AMPure XP beads and sequenced using the Illumina MiSeq Reagent Kit v3 (Illumina Inc., San Diego, CA, USA) at Macrogen Inc., Seoul, Republic of Korea.
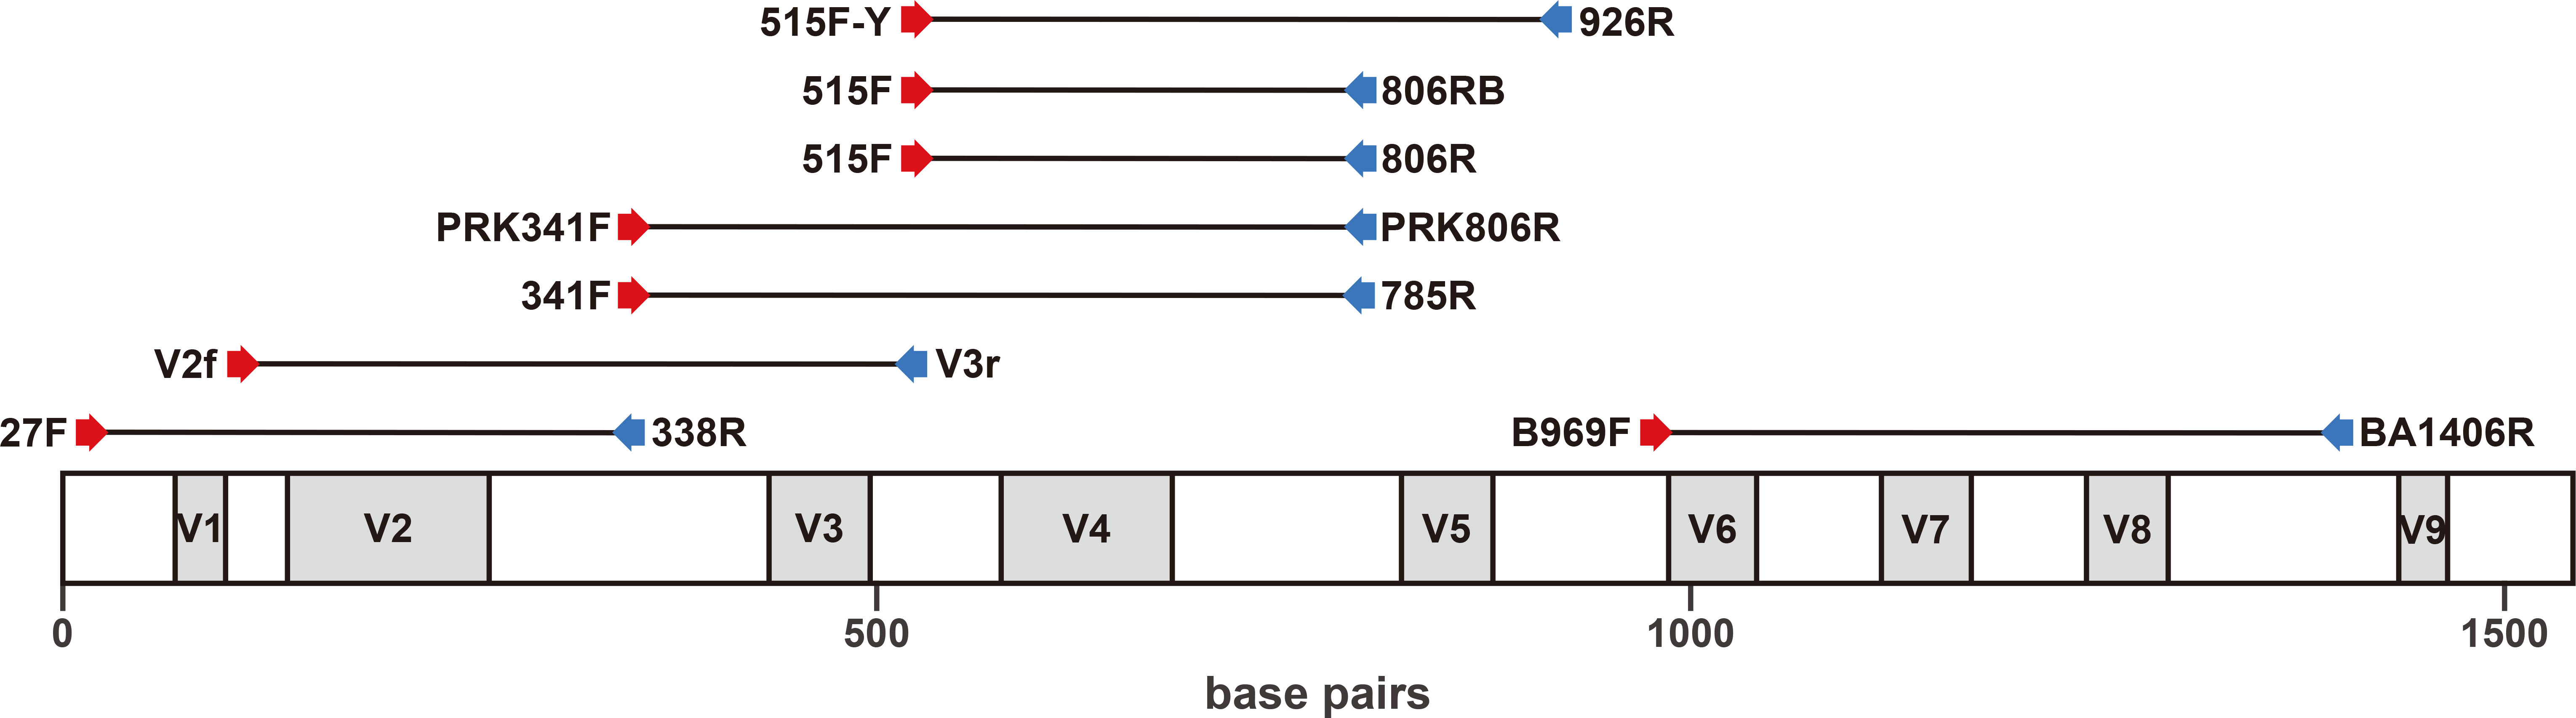
Figure 1 Positions of the eight primer sets used in this study to amplify the 16S rRNA gene region (more information is provided in Table 1).
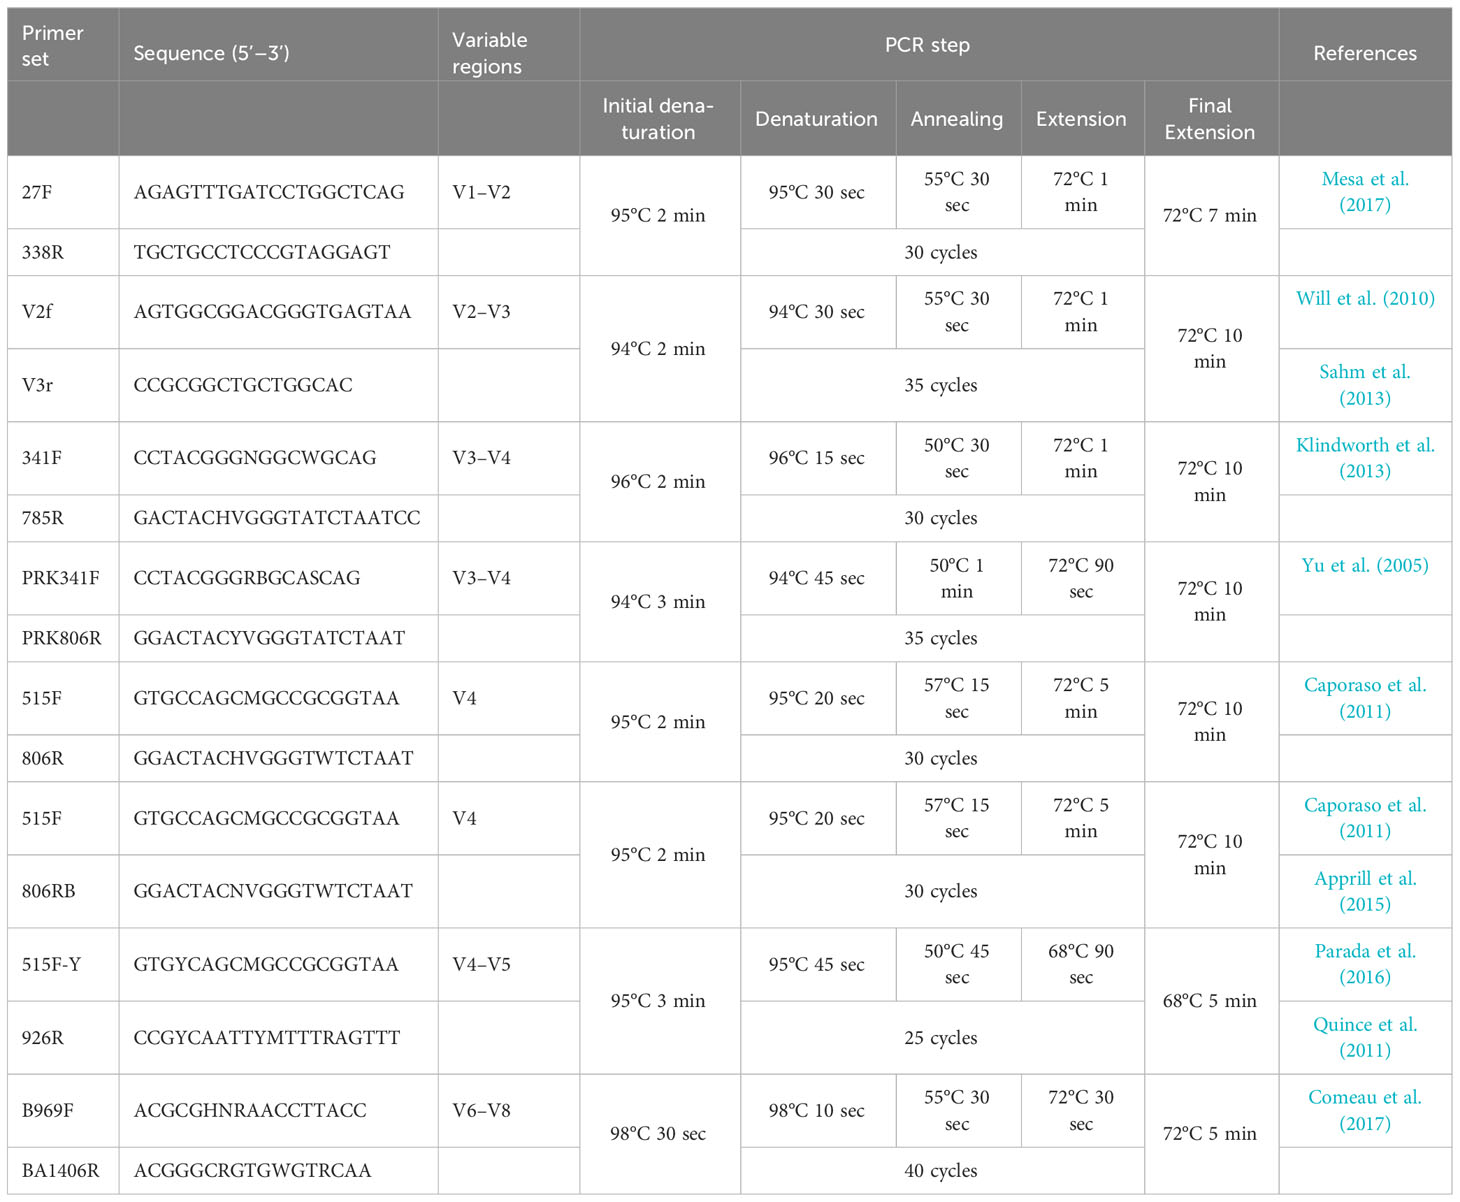
Table 1 The eight primer sets used in this study and the PCR steps used for each primer set.
2.3 Sequencing data analysis and statistical analysis
Paired-end reads were merged using Fast Length Adjustment of Short reads 1.2.11 (FLASH) with default parameters (Magoč and Salzberg, 2011). Size selection and trimming of reads were carried out using CD-HIT-OTU v.0.0.1 (Li et al., 2012). Maximum and minimum sizes for the read selection of each primer set were shown in Table 2. Using the same software, chimeric, low-quality, and ambiguous sequences were removed (Edgar and Flyvbjerg, 2015), and the filtered sequences were clustered into operational taxonomic units (OTUs) using a 97% identity threshold (as suggested by Caporaso et al., 2011). Taxonomic classification of sequences was conducted using QIIME UCLUST (Edgar, 2010), and reference data were obtained from the Ribosomal Database Project (RDP; Cole et al., 2009). Alpha diversity (assessed using Chao1, Shannon, Inverse Simpson, Faith’s Phylogenetic Diversity, and Good’s coverage indices) was analyzed using QIIME with the alpha_diversity.py workflow script (Caporaso et al., 2010). For Faith’s Phylogenetic Diversity analysis, the sequences of OTUs obtained for each primer sets were aligned using MAFFT v.7 (Katoh and Standley, 2013), and phylogenetic trees were constructed using FastTreeMP v.2.1.10 (Price et al., 2010). Rarefaction analysis was performed to assess sampling sufficiency, and to compare species richness and phylogenetic diversity between subsamples (Gotelli and Colwell, 2001; Chao et al., 2015). For beta diversity analysis, insertion tree was constructed using the SEPP method (Janssen et al., 2018) implemented within the QIIME software package, and both unweighted and weighted UniFrac distances (Lozupone and Knight, 2005) were calculated, also using QIIME. The raw sequencing data were deposited in NCBI as BioProject PRJNA901202. The filtered sequences were deposited in GenBank under the accession numbers OP818856–819002, OP819084–819283, OP819309–819424, OP819428–819557, OP819772–819844 and OP834785–835820.
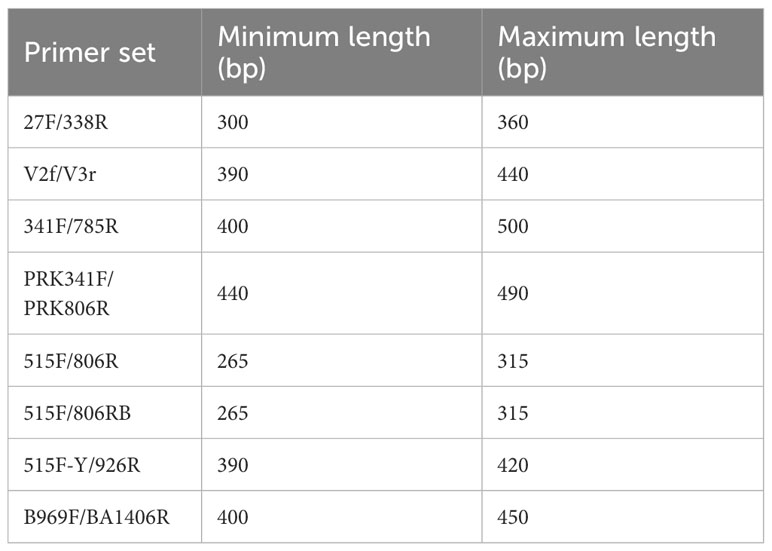
Table 2 Maximum and minimum lengths for read selection of each primer set.
The Shapiro–Wilk test was performed to assess the normality of the dataset, and Levene’s test was used to check for homogeneity of variances. To reveal statistically significant differences among the alpha diversity indices of the eight primer sets, a one-way ANOVA was performed with a Games-Howell test for a nonparametric post hoc analysis. These statistical analyses were performed using SPSS v25.0. Using QIIME (Caporaso et al., 2010), PCoA (principal coordinates analysis) of the conducted unweighted and weighted UniFrac distances were performed, and the statistically significant differences between primer sets were calculated through PERMANOVA.
3 Results and discussion
3.1 General sequencing data from eight primer sets
In this study, each of the eight primer sets used for short-read sequencing encompassed one or more of the V1 to V8 hypervariable regions of the 16S rRNA gene in bacteria (Figure 1, Table 1). The average amplicon lengths were between 292 and 441 bp (Table 3). The average unfiltered read count of the samples ranged from 67,347 to 104,074 (Table 3). After filtering out low-quality data (e.g., ambiguous, low-quality, and chimeric sequences), the highest read counts were generated by the 27F/338R primer set (covering the V1–V2 region), which also detected the highest number of bacterial OTUs (214 ± 52, mean ± standard deviation; Table 3).
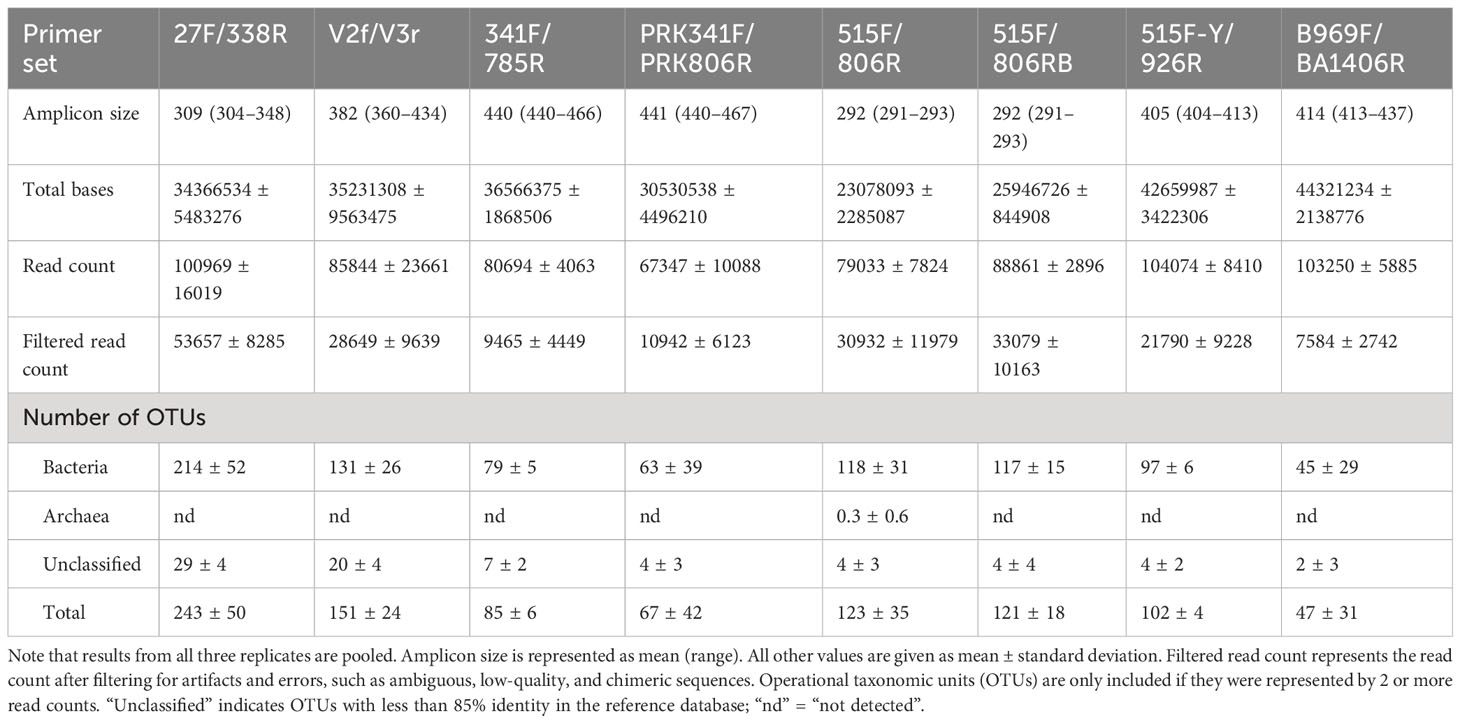
Table 3 Summary of Illumina sequencing results from the 16S rRNA gene primer sets.
The saturation phases of all rarefaction curves based on number of observed OTUs and Faith’s Phylogenetic Diversity index indicated that Illumina sequencing coverage was sufficient in the present study (Figure 2). Both curves showed the highest species richness and phylogenetic diversity for the 27F/338R primer set (Figure 2). Furthermore, various alpha diversity indices (Chao1, Shannon, inverse Simpson, and Good’s coverage) were used to assess the biodiversity of each primer set (Figure 3). Chao1 values, which correlate with species richness, did not show a significant difference among the primer sets (Figure 3). The highest Shannon index was generated by the 27F/338R primer set (Figure 3), indicating that this primer set gave the highest species evenness. The second highest Shannon index was generated by the 515F/806RB primer set, followed by the 515F/806R, 515F-Y/926R, PRK341F/PRK806R, 341F/785R, V2f/V3r, and B969F/BA1406R primer sets (Figure 3). The highest inverse Simpson index (i.e., the probability that two randomly selected sequences belong to the same species) was generated by the 27F/338R, followed by the 515F-Y/926R, 515F/806RB, and 515F/806R primer sets; the remaining inverse Simpson indices followed the same order as the Shannon indices (Figure 3). The Good’s coverage values were almost 100% for each of the eight primer sets (Figure 3), indicating that the number of reads per primer set is sufficient for reliable analysis. For the comparison of diversity among each primer sets, PCoA (principal coordinates analysis) of unweighted and weighted UniFrac distances were computed (Figure S1). The PERMANOVA results for UniFrac data indicated significant differences among primer sets with both unweighted and weighted UniFrac (p = 0.001). Unweighted UniFrac, while exhibiting lower explanatory power compared to weighted UniFrac, revealed more pronounced differences among the primer sets (Figure S1A). Notably, primer sets amplifying similar regions tended to cluster together (Figure S1A). In the case of weighted UniFrac, the repeated data from the B969F/BA1406R primer set appeared as outliers (Figure S1B). It is important to note that read counts can be influenced by 16S rRNA gene copy number per species, which may introduce bias (Lee et al., 2009). Since there are differences in the diversity indices between primer sets, the use of any single primer set studied here led to a significant sequencing bias for the interpretation of the diversity of the inherent bacterial population and community (Thijs et al., 2017; Wear et al., 2018).
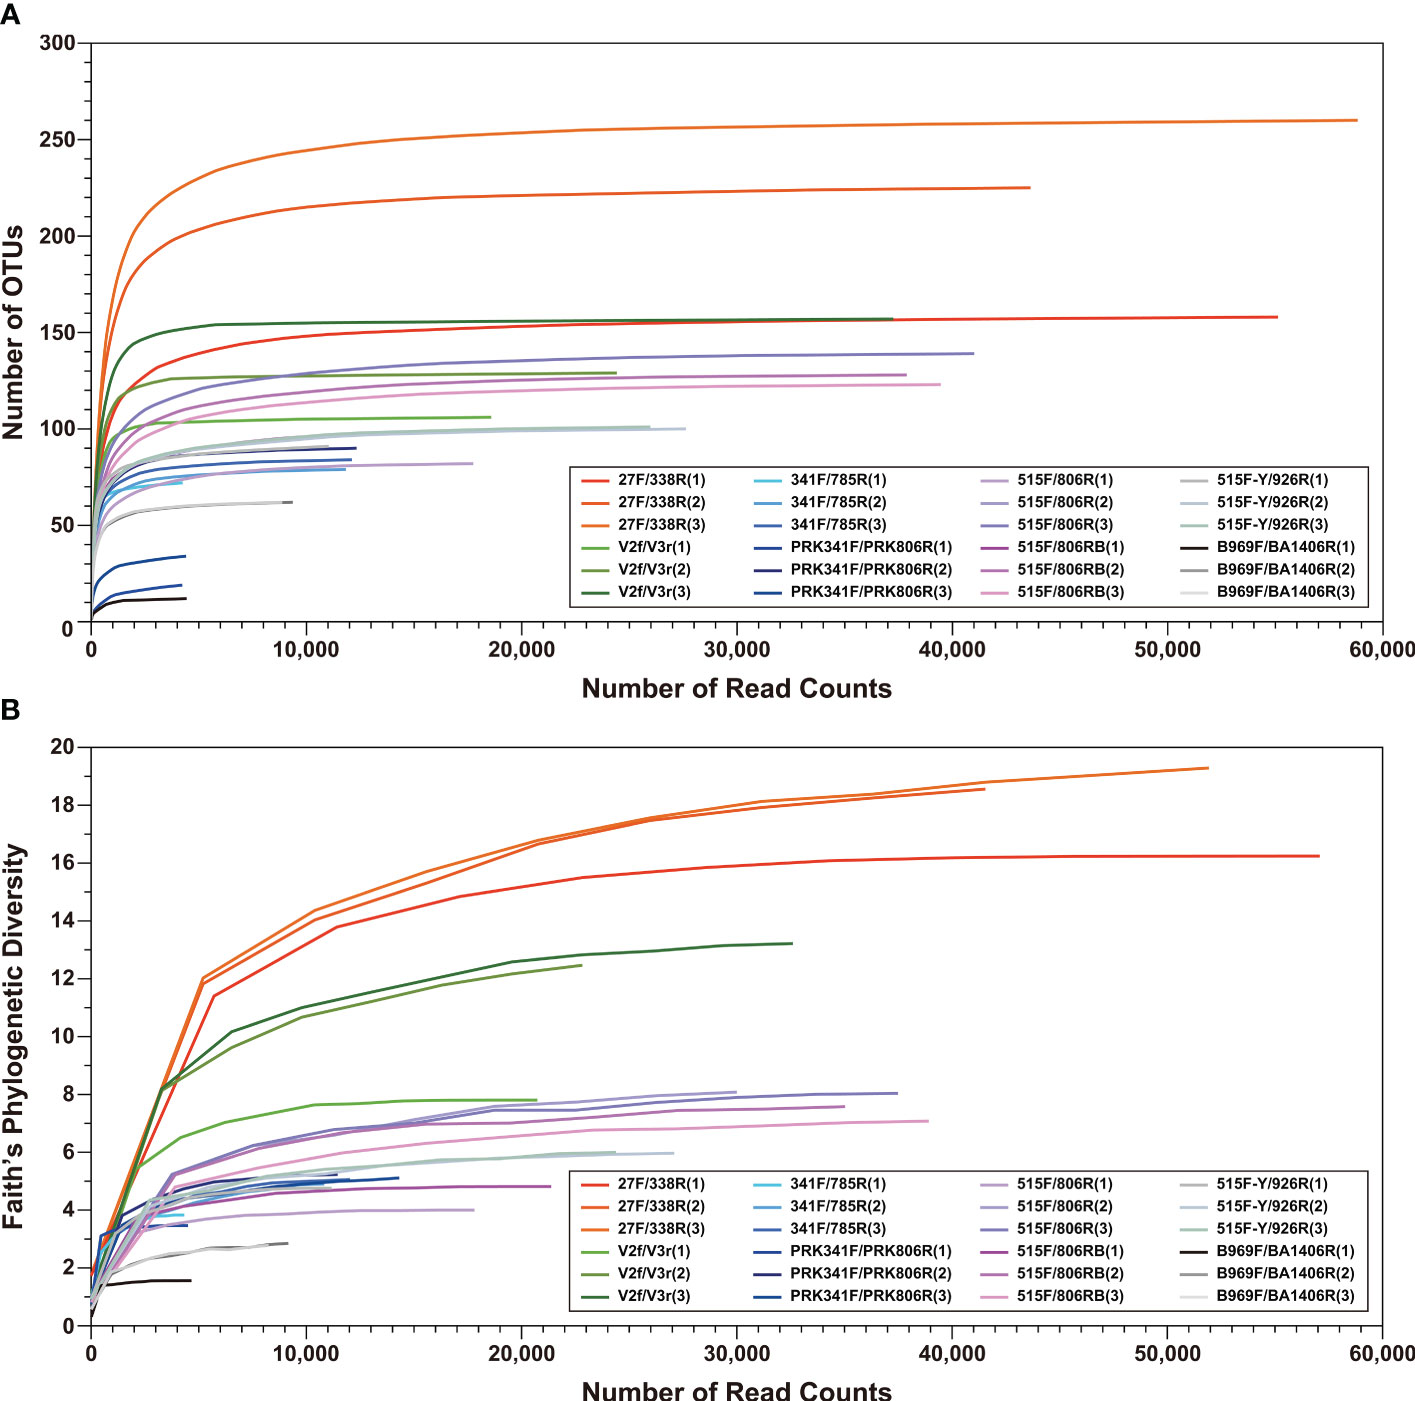
Figure 2 Rarefaction curves of (A) operational taxonomic units (OTUs; 97% sequence identity threshold) and (B) Faith’s Phylogenetic Diversity index from the eight primer datasets (See Table 1). Data for each primer set were obtained in triplicate.
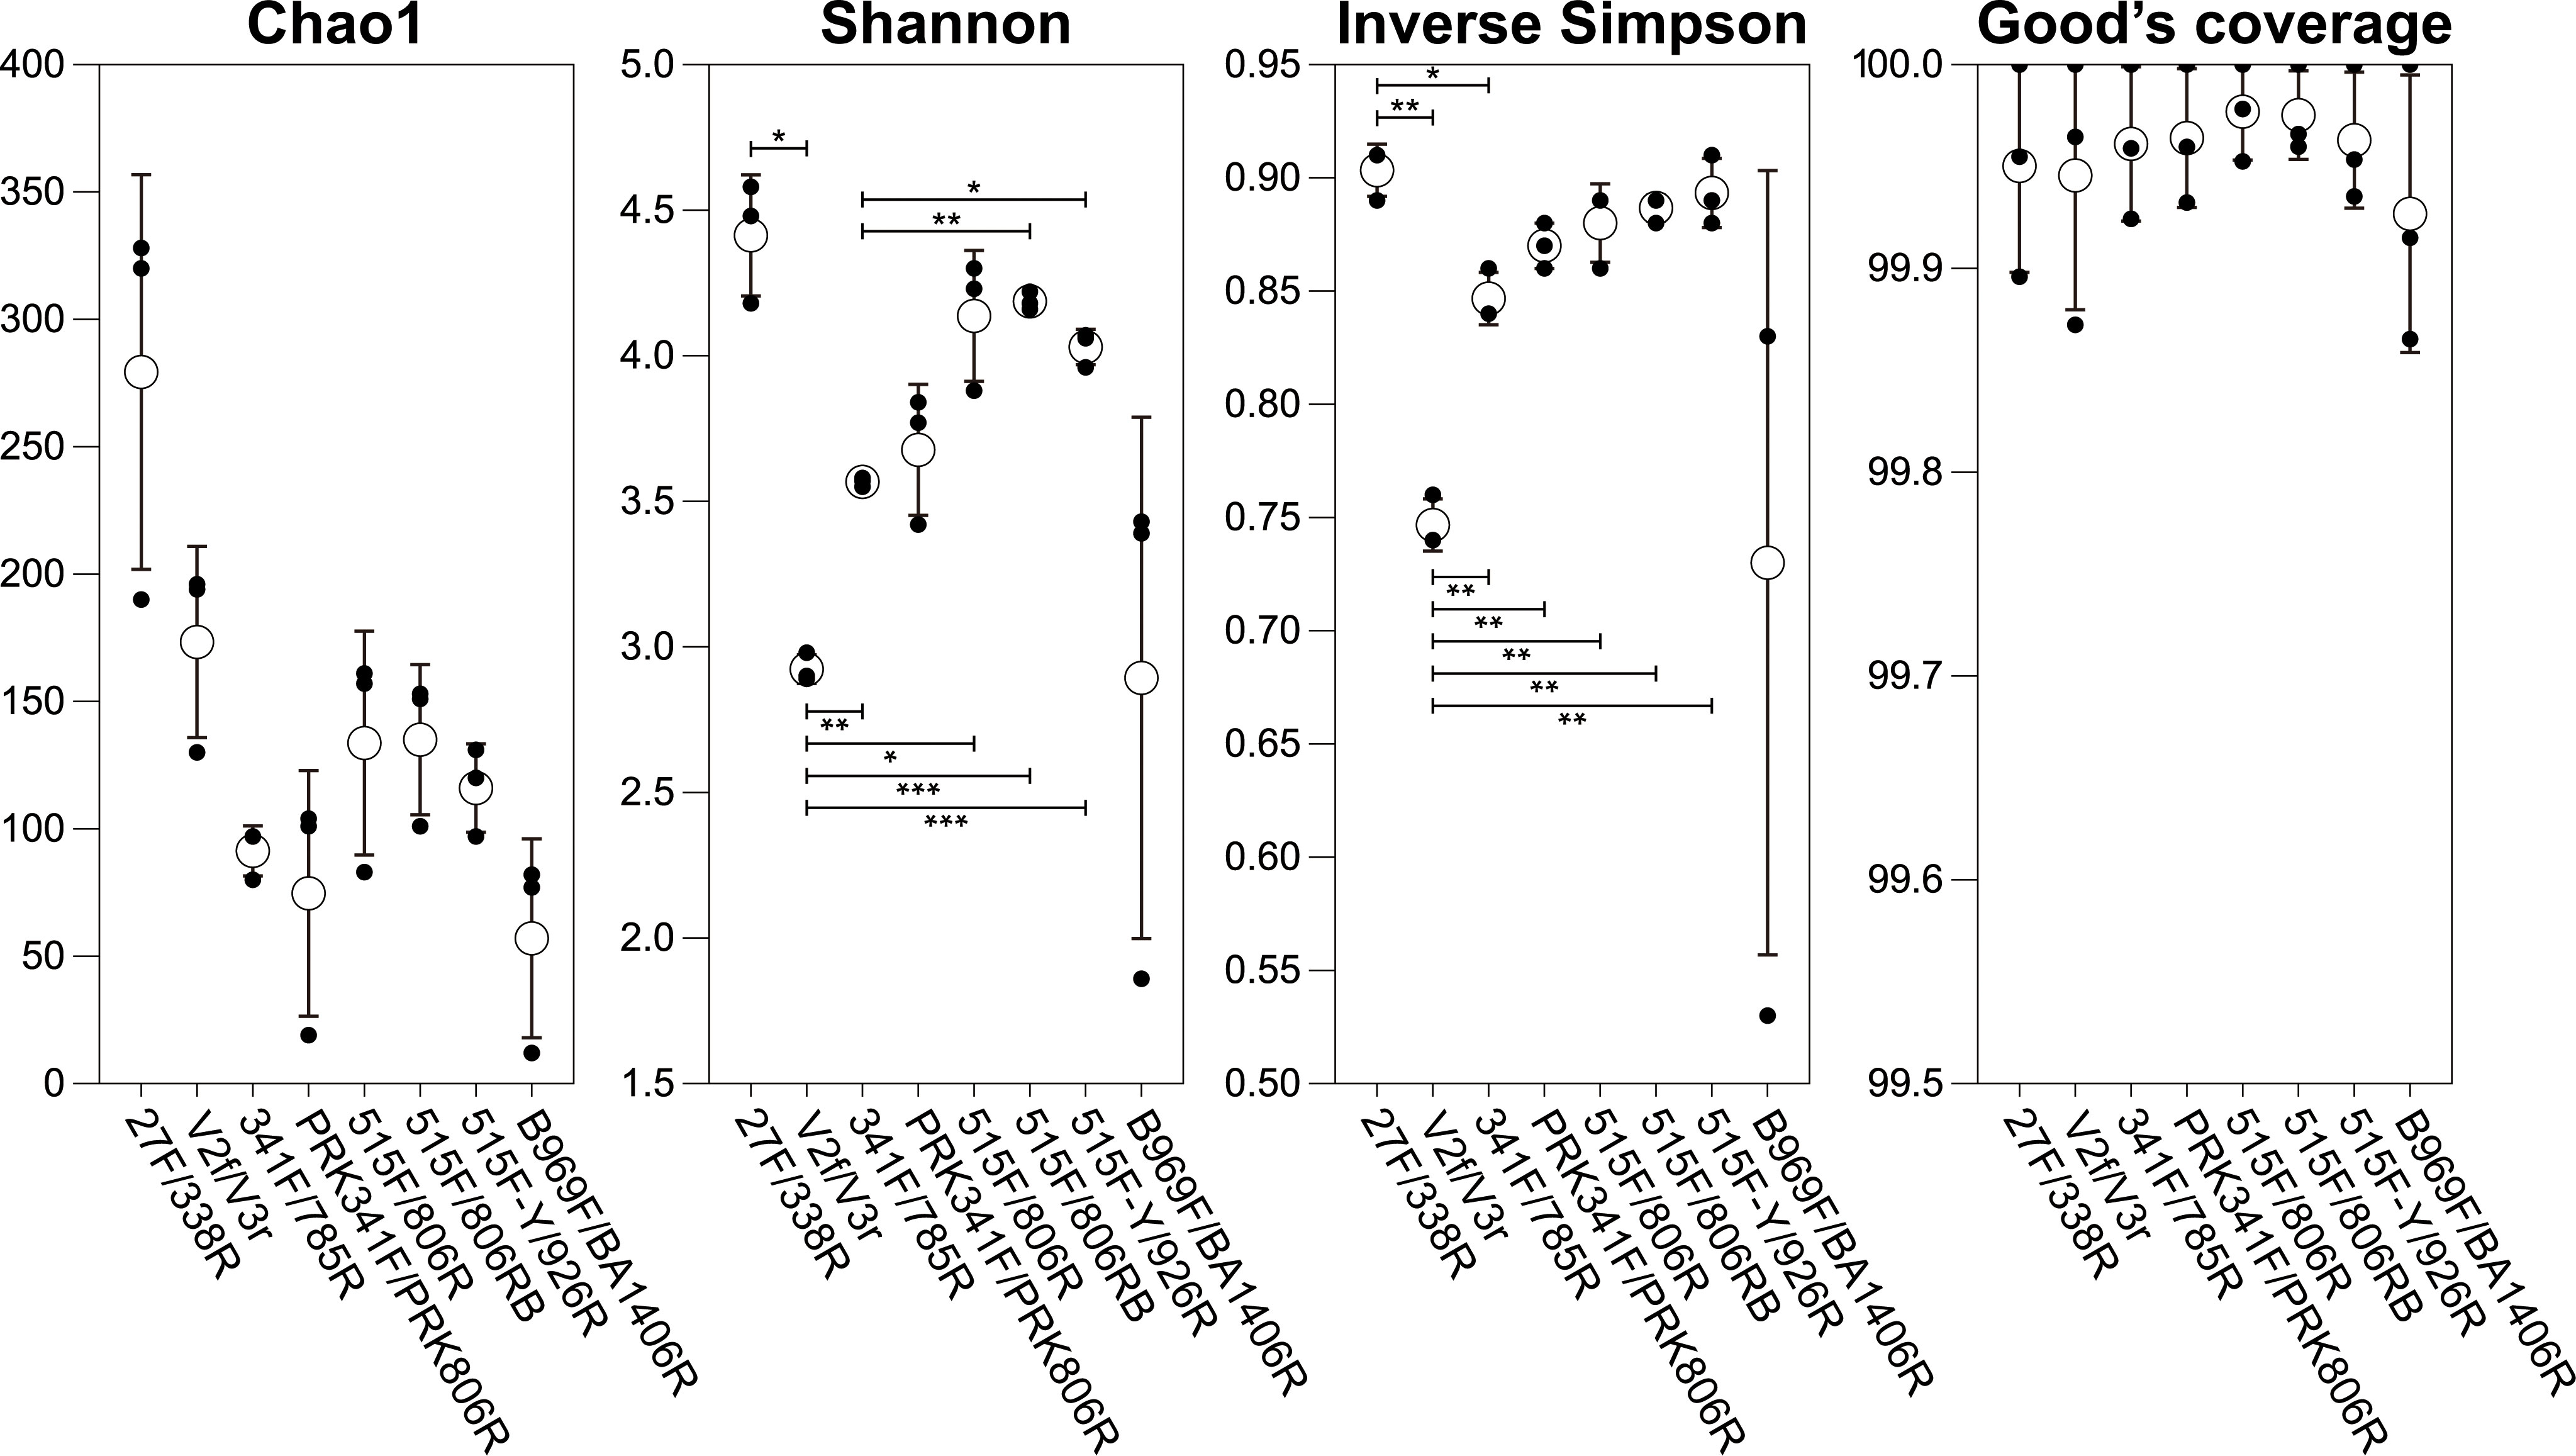
Figure 3 Alpha diversity indices (Chao1, Shannon diversity, inverse Simpson, and Good’s coverage) from eight primer datasets. Black and white circles indicate individual values of replicates and their average values, respectively. Data of alpha diversity indices were compared using ANOVA with Games-Howell analyses; horizontal bars indicate p-values (*p<0.05, **p<0.01, ***p<0.001).
The primer sets recovered great variation in OTU richness in each phylum, particularly the major phyla Proteobacteria and Bacteroidetes, which were detected by all primer sets (Figure 4). In the phyla Proteobacteria and Bacteroidetes, the OTU richness obtained with the 27F/338F primer set was ~4 times higher than that with B969F/BA1406R, which showed the lowest OTU richness in this study. Furthermore, some groups were not detected with some primer sets (e.g., at least one of the phyla Balneolaeota, Firmicutes, Fusobacteria, Kiritimatiellaeota, Planctomycetes, Spirochaetes, and Synergistetes were undetected by one or more of the 341F/785R, PRK341F/PRK806R, and B969F/BA1406R primer sets). The eight primer sets displayed similar taxonomic profiles for the dominant bacterial groups at the phylum, class, and order levels, although the read counts differed substantially across the primer sets (Figures 4, 5). Notably, Abellan-Schneyder et al. (2021) showed that the influence of methodological clustering (e.g., OTUs and amplicon sequence variants) is probably a minor factor affecting bacterial assignment. Overall, our results show unambiguously that the selection of a primer set greatly influences the diversity and read counts of the extant bacterial community and could lead to a substantial taxon bias, consistent with previous studies (Peiffer et al., 2013; Apprill et al., 2015; Thijs et al., 2017; Willis et al., 2019).
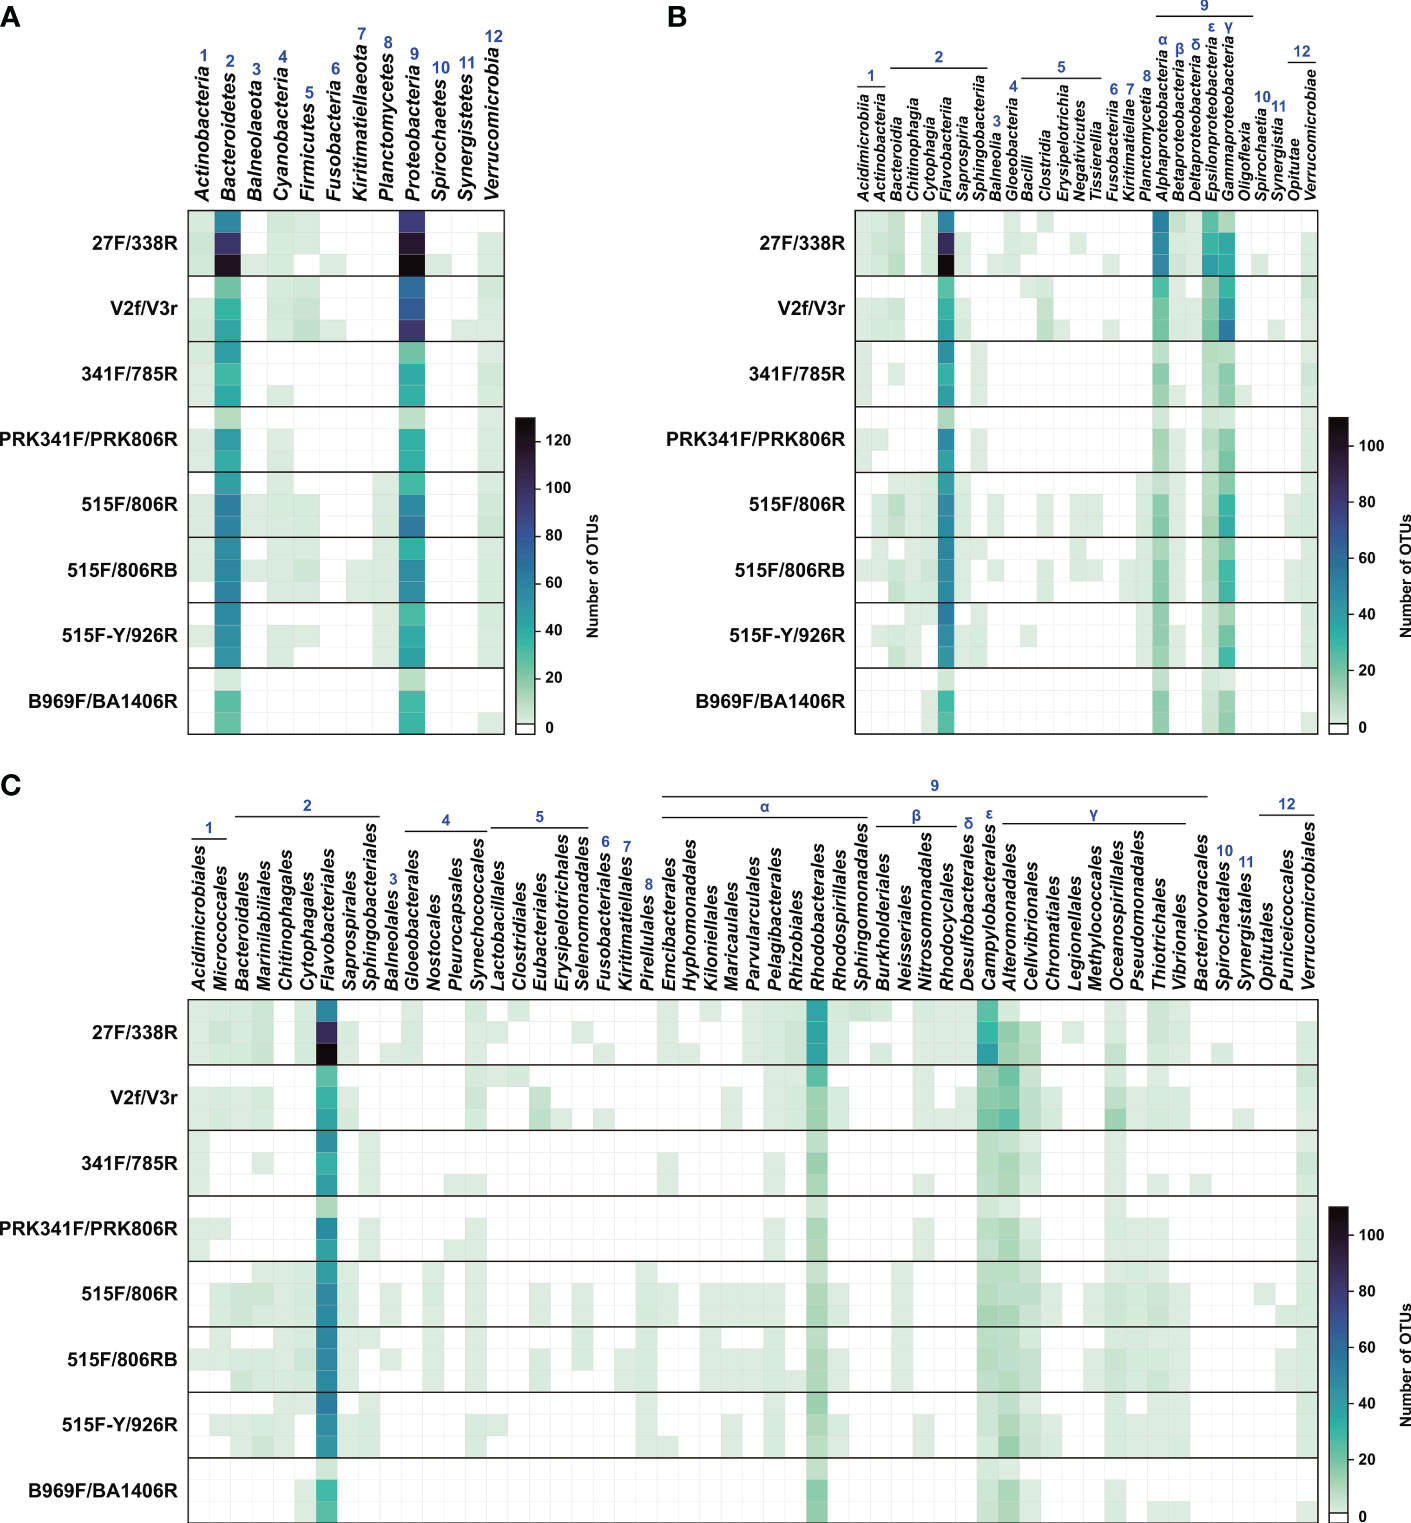
Figure 4 Heatmap of the number of operational taxonomic units (OTUs) from the eight primer sets. Each of the three parallel datasets from each primer set is presented on a separate row. (A) Phylum level. (B) Class level. (C) Order level. Numbers (1 to 12) represent bacterial phyla found. Greek letters (α to ϵ) indicate the classes of Proteobacteria.
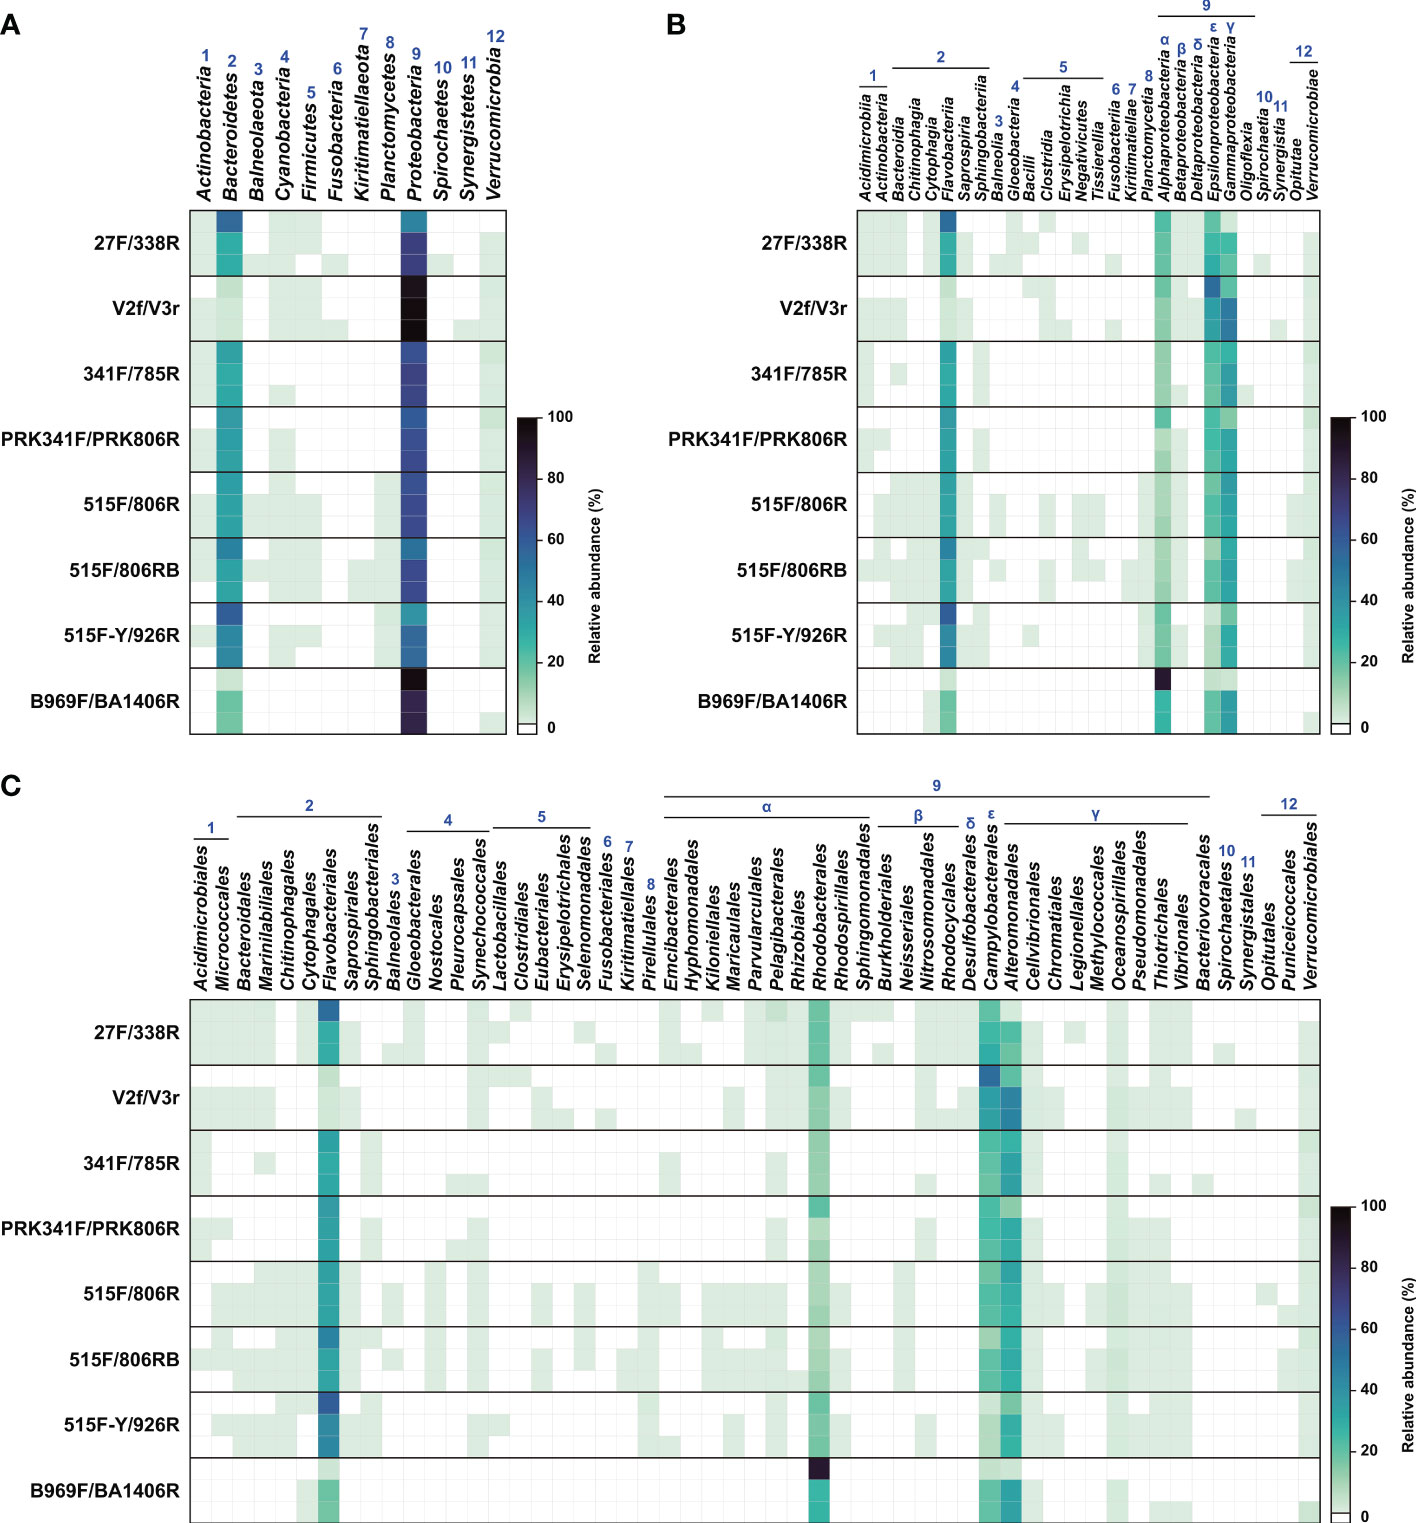
Figure 5 Heatmap of relative abundance of read counts from the eight primer sets. Each of the three parallel datasets from each primer set is presented on a separate row. (A) Phylum level. (B) Class level. (C) Order level. Numbers (1 to 12) represent bacterial phyla found. Greek letters (α to ϵ) indicate the classes of Proteobacteria.
3.2 Primer set 27F/338R
As noted above, the 27F/338R primer set, which targets the V1–V2 region, strongly outperformed the other primer sets based on read counts and OTUs. However, this primer set did not detect OTUs belonging to the three phyla Kiritimatiellaeota, Planctomycetes, and Synergistetes, which were however detected using different primer sets (Figures 4, 5, Table S1). Previous studies have reported that these three phyla might be present in low abundance, or as rare groups, in oceanic water columns. The phylum Kiritimatiellaeota is globally distributed; however, few data regarding its abundance in the ocean are available (Spring et al., 2016). Furthermore, the species belonging to the phylum Planctomycetes are regarded as a minor component of bacterial diversity in seawater; however, they sometimes compose as much as 22% of peat bacteria and 51–53% of the total bacteria on the surface of the kelp Laminaria hyperborea (Bengtsson and Øvreås, 2010; Dedysh and Ivanova, 2019). Meanwhile, organisms from the phylum Synergistetes are often found in anaerobic environments, such as the oral cavity and gut of animals, soils, and anaerobic sludge digesters, while they are rarely detected in the oceans (Chouari et al., 2005; Godon et al., 2005; Vartoukian et al., 2007; Hugenholtz et al., 2009).
On the other hand, the two classes Gloeobacteria (phylum Cyanobacteria) and Spirochaetia (phylum Spirochaetes) were detected only using the 27F/338R primer set (Figures 4, 5). In addition, 27F/338R detected the highest number of taxa at the order level (36 orders) among all of the primer sets, and accounted for 68% of all orders found in the present study (53 groups; Figures 4, 5). Several studies have found that the V1 and V2 regions amplified by these primers had a high phylogenetic resolution, and could be used for the identification of bacteria at lower taxonomic levels (i.e., genera and species), probably due to their rapid evolution (Kim et al., 2011; Jumpstart Consortium Human Microbiome Project Data Generation Working Group, 2012; Bukin et al., 2019).
In particular, phylogenetic resolution was associated with both the type of sample of interest and the proportion of degenerate bases in the primers used. Graspeuntner et al. (2018) reported that the 27F/338R primer set was less appropriate for detection of vaginal bacteria than the V3F/V4R primer set (= PRK341F/PRK806R in this study) in that it failed to detect several important species. However, in the present study, the two families Rhodobacteraceae and Roseobacteraceae (belonging to the order Rhodobacterales, which account for approximately 20% of the bacterial community in coastal seawaters; Buchan et al., 2005; Giebel et al., 2011), were detected using the 27F/338R primer set. At the family level, these two families, each ubiquitous in coastal environments, accounted for 3.8–8.9% and 10.4–12.0% of all OTUs using this primer set (Table S1). Meanwhile, the 27F/338R primer set, when modified with several degenerate bases (27F-RYM: 5′AGRGTTTGATYMTGGCTCAG3′, 338R-WWW: 5′TGCWGCCWCCCGTAGGWGT3′), performed poorly in detecting organisms belonging to the family Rhodobacteraceae in the Santa Barbara Channel, CA, USA (Wear et al., 2018). Recently, McNichol et al. (2021), in an in silico analysis, reported that the 27F-RYM/338R-WWW primer set, which covered 89% of all sequences in that study, was inferior to the 515F-Y/926R primer set, the latter of which showed the highest coverage (over 96% of all sequences) in a global marine metagenomic dataset.
Given these previous studies, the difference we observed between the 27F/338R primer set and the 27F-RYM/338R-WWW primer set, used in other studies, was unexpected. Thus, it is necessary to highlight that, although this degenerate primer set has been extensively used for bacteria in field studies for a long time, it may fail to find the major groups in coastal seawater (Hamady et al., 2008; Fortunato et al., 2012; Wear et al., 2018; McNichol et al., 2021). The different results obtained from the degenerate and nondegenerate primer sets may be due to differences in the binding and amplification efficiency of the PCR primers (Wagner et al., 1994; Polz and Cavanaugh, 1998; Lanzén et al., 2011).
3.3 Primer sets 515F/806RB and V2f/V3r
The primer set 515F/806RB had the second-best bacterial coverage, followed by the primer set V2f/V3r (Figures 4, 5, Table 3). Each of these primer sets has previously been regarded as sufficient for evaluating the diversity and relative abundance of the bacterial community in natural habitats (Liu et al., 2007). However, the V2f/V3r primer set, which targets the V2–V3 region of the 16S rRNA gene, did not amplify sequences in the phyla Balneolaeota, Kiritimatiellaeota, Planctomycetes and Spirochaetes, which were found by other primer datasets (Figures 4, 5). Balneolaeota is a newly described phylum, which was recently separated from the phylum Bacteroidetes, and which has been poorly studied to date (Hahnke et al., 2016). Furthermore, many members of the phylum Spirochaetes are important parasites that infect humans and other animals, and are also commonly found in marine benthic habitats (Bowman and McCuaig, 2003; Saad et al., 2017). Each of these phyla are therefore important to be able to detect. Petrosino et al. (2009) reported that the V2f/V3r primer set was previously regraded as an effective primer set for the identification of lower-ranked taxa (i.e., genus). Compared with the other primer sets that we evaluated, V2f/V3r detected a higher proportion of OTUs related to Gammaproteobacteria, accounting for 28.3–34.4% of all OTUs at the class level; in addition, this primer set had the highest overall coverage for Gammaproteobacteria (Figures 4, Table S1). However, our data showed that the V2f/V3r primer set failed to detect 23 orders of the 53 known to be within our sample, accounting for 57% of all order level taxa (Figures 4, 5). Thus, the V2f/V3r primer set may have less potential in detecting some abundant species than the 27F/338R primer set.
Interestingly, except for Fusobacteria, Spirochaetes, and Synergistetes, most of the phyla in the present study were detected using the 515F/806RB primer set, which targets the V4 region (Figures 4, 5). The phylum Fusobacteria, consisting of obligate anaerobes, is rarely found in ordinary seawater (Bennett and Eley, 1993). In contrast, the 515F/806RB primer set had difficulty detecting the phylum Proteobacteria, which is the dominant group in the oceans (Sunagawa et al., 2015). Remarkably, however, 515F/806RB detected the highest number of taxa at the class level (20 out of 28 classes; Figures 4, 5). Furthermore, 515F/806RB successfully detected 34 orders of the 53 known to be in our sample, accounting for 64% of all orders (Figures 4, 5). The bacterial compositions derived from the two primer sets V2f/V3r and 515F/806RB were distinct from each other at the ranks of order and lower. In addition, the 515F/806RB primer set was specifically designed to improve the detection of the SAR11 group (order Pelagibacterales), which accounts for 20–40% of the bacterial community in the oceans (Morris et al., 2002; Apprill et al., 2015). Although our sample was from the coastal area and thus contained a low abundance of SAR11, the results obtained in this study consistently showed that the primer set 515F/806RB displayed a relatively high number of OTUs related to the SAR11 group among the eight primer sets, accounting for 1.6–2.0% of all OTUs (Figures 4, Table S1).
3.4 Other primer sets: 515F/806R, 341F/785R, 515F-Y/926R, PRK341F/PRK806R, and B969F/BA1406R
The remaining five primer sets, 341F/785R, PRK341F/PRK806R, 515F/806R, 515F-Y/926R, and B969F/BA1406R, detected a phylum spectrum of 3–8 out of 12 known groups (Figures 4, 5). This result suggests that these primer sets had a lower resolution for the detection of natural bacteria than other primer sets. The four primer sets other than the 515F/806R primer set had a relatively low resolving power at both the class and order levels, detecting only 6–14 of all 28 classes and 10–26 of all 53 orders (Figures 4, 5).
The base composition of the 515F/806R primer set was very similar to that of the 515F/806RB primer set. Only a single degenerate ‘H’ (A, C, or T) in the reverse primer 806R was replaced with an ‘N’ (any base) to construct the reverse primer 806RB (Table 1; Apprill et al., 2015). The 515F/806R primer set is commonly used for diverse samples, including the human microbiome (Kozich et al., 2013; Alam et al., 2016). Moreover, despite adding only a single nucleotide ambiguity, the 515F/806RB primer set produced more read counts than the 515/806R primer set (Table 3). This result is consistent with previous studies, which found that one ambiguity in the 806R primer could produce read counts for 16S rRNA gene sequences considerably different from the original primer (Klindworth et al., 2013; Takahashi et al., 2014). Furthermore, unlike with the 515F/806RB primer set, SAR11 groups were rarely observed in this study using the 515F/806R primer set (Figures 4, 5, Table S1). The results obtained in this study were consistent with those of other studies on ocean field samples, which revealed an underestimation of SAR11 when using the 515F/806R primer set (Apprill et al., 2015; Parada et al., 2016).
The 341F/785R primer set detected only four of all 12 different phyla (Figures 4, 5). Remarkably, the phylum Bacteroidetes amplified by 341F/785R showed the highest numbers of OTUs among bacterial phyla, although the numbers of OTUs and read counts were relatively low, compared to the other primer sets (Figures 4, 5, Table S1). This result suggests that this primer set selectively amplifies Bacteroidetes more than other phyla. This trend of detecting Bacteroidetes was similar to results from the primer sets PRK341F/PRK806R, 515F/806R, 515F/806RB, and 515F-Y/926R. However, Klindworth et al. (2013) noted that the 341F/785R primer set failed to detect the SAR11 group in the phylum Proteobacteria. Consistent with this, the OTUs from the SAR11 group were rarely observed using the 341F/785R primer set (Figure 4, Table S1).
In this study, the 515F-Y/926R primer set detected bacterial phyla, classes, and orders at a lower level of resolution than the 515F/806R and 515F/806RB primer sets (Figures 4, 5). However, the 515F-Y/926R amplified high numbers of OTUs and overall reads from the phylum Flavobacteriia. In addition, SAR11 group OTUs were detected well by this primer set (Figures 4, 5, Table S1). Parada et al. (2016) reported that the 515F-Y/926R primer set increases the SAR11 (4 to 10-fold) and Flavobacteriia coverages compared with 515F-Y/806R, which was superior in detecting the phylum Gammaproteobacteria (1.32-fold) in field samples.
The primer sets PRK341F/PRK806R and B969F/BA1406R amplified relatively low numbers of OTUs and read counts (Table 3). This result suggests that these two primer sets may not be effective in detecting a diverse range of marine bacteria. Previous studies reported that the B969F/BA1406R primer set detected more bacterial taxa, including the SAR11 group, than the PRK341F/PRK806R primer set (Delmont et al., 2019; Willis et al., 2019). However, in our study, the B969F/BA1406R primer set detected the fewest bacterial taxonomic groups (10, or 19%, of all 53 orders; Figures 4, 5). In contrast, the PRK341F/PRK806R primer set detected 16 orders of all 53 orders (30%, Figures 4, 5). Furthermore, the primer sets PRK341F/PRK806R and B969F/BA1406R were less effective at finding the classes Verrucomicrobiae and Opitutae (Figures 4, 5, Table S1). Takahashi et al. (2014) showed that the PRK341F/PRK806R primer set had a lower taxonomic resolution for members of the classes Verrucomicrobiae and Opitutae, which were widely distributed but at low abundance in marine environments (Freitas et al., 2012). Thus, it seems that these two primer sets have difficulty in detecting many of the bacterial taxa frequently recognized in marine environments.
3.5 The usage of multiple primer sets for environmental DNA studies
Our findings demonstrate that the choice of primer set, even if differing only by the addition of a single ambiguity to a primer, may introduce a strong bias in identification, thereby greatly altering the understanding of the diversity and richness of marine bacteria from any given sample. Considering the drawback of amplicon bias, we find that it is difficult to fully understand bacterial diversity using only a single primer set. Given this differential coverage and efficiency, as well as concerns about cost, we decided to investigate the complementarity of multiple primer sets, with the intention to find a practical balance between number of primer sets and accuracy in detection.
Our data showed that 27F/338R and 515F/806RB complementarily covered almost all of the extant bacterial taxonomic groups (Figures 4, 5). Although the 515F/806RB datasets had significantly lower bacterial OTU abundances (r2 = 0.96, p < 0.001) and read counts (r2 = 1.0, p < 0.001) than the data obtained from the 27F/338R primer set (Figure 6), the combination of the two primer sets 27F/338R and 515F/806RB, which accounted for 68 and 64% of all orders detected using all primer sets in this study, respectively, accounted for 89% of all orders. This combination failed to detect only six orders, Pleurocapsales, Erysipelotrichales, Chromatiales, Bacteriovoracales, Synergistales, and Opitutales, which are not dominant groups in ordinary seawater (Godon et al., 2005; Choo et al., 2007; Tidgewell et al., 2010; Hahn et al., 2017). The addition of a third primer set, V2f/V3r, provided the potential of identifying more bacterial taxa, and an increase in coverage to 94% of all orders, by detecting three of the above six orders (Erysipelotrichales, Chromatiales, and Synergistales). However, none of these three orders were recovered in all three replicates. This result suggests that the detection of both the relatively well-conserved (V4) and fast-evolving (V1–V2) hypervariable regions may help to reduce diversity bias, at least in temperate coastal samples.
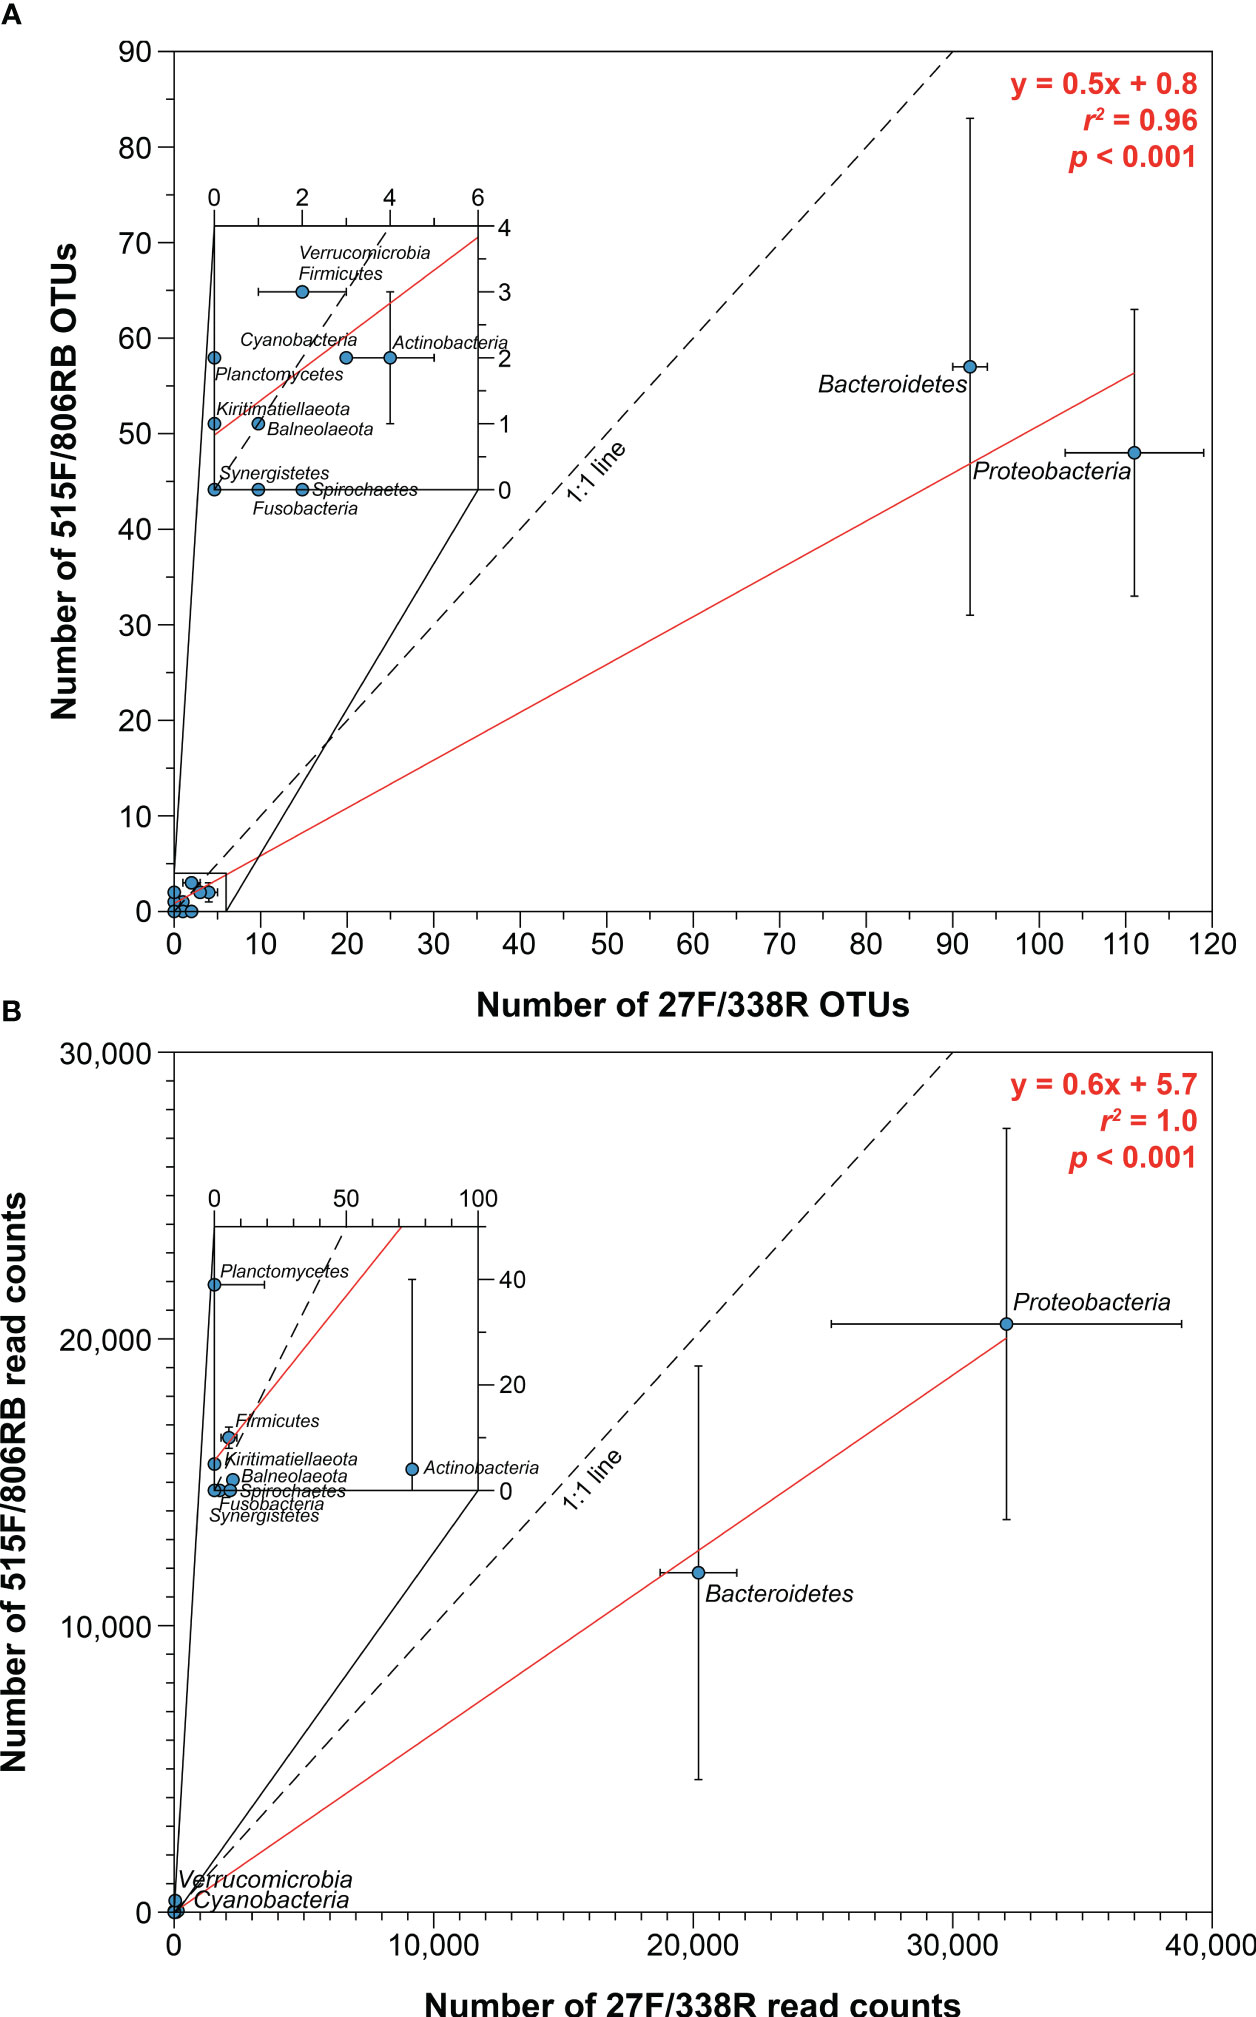
Figure 6 Relationships between best-performing primer sets, 27F/338R and 515F/806RB, based on (A) operational taxonomic units (OTUs) and (B) read counts, each at bacterial phylum level. Red line represents regression line.
4 Conclusion
The selection of 16S rRNA gene primer set(s) for NGS is one of the most critical steps in studying the microbial community present in natural samples. As with previous studies, across the eight primer sets that we investigated, the representation of bacterial community composition was biased when only a single primer set was used. We find that using at least two complementary primer sets in replicates for NGS-based studies should better assess the diversity, specificity, and richness of bacterial communities in a temperate coastal sample. In particular, we endorse the simultaneous use of two primer sets, 27F/338R (V1–V2) and 515F/806RB (V4), to significantly decrease the biases of primer sets targeting the marine bacterial community in this study. Performing individual sequencing and analysis for each primer set, followed by an analysis of the combined results, allows for the identification of any missing data specific to each primer. Future studies should incorporate various diversity analyses, including not only taxonomic diversity but also phylogenetic diversity, such as the UniFrac distance. By utilizing these analyses, a more comprehensive understanding of the structure and ecological characteristics of microbial communities can be achieved. Researchers can choose appropriate analysis methods based on their specific objectives, enabling a more accurate evaluation and interpretation of data obtained (Figure 7).
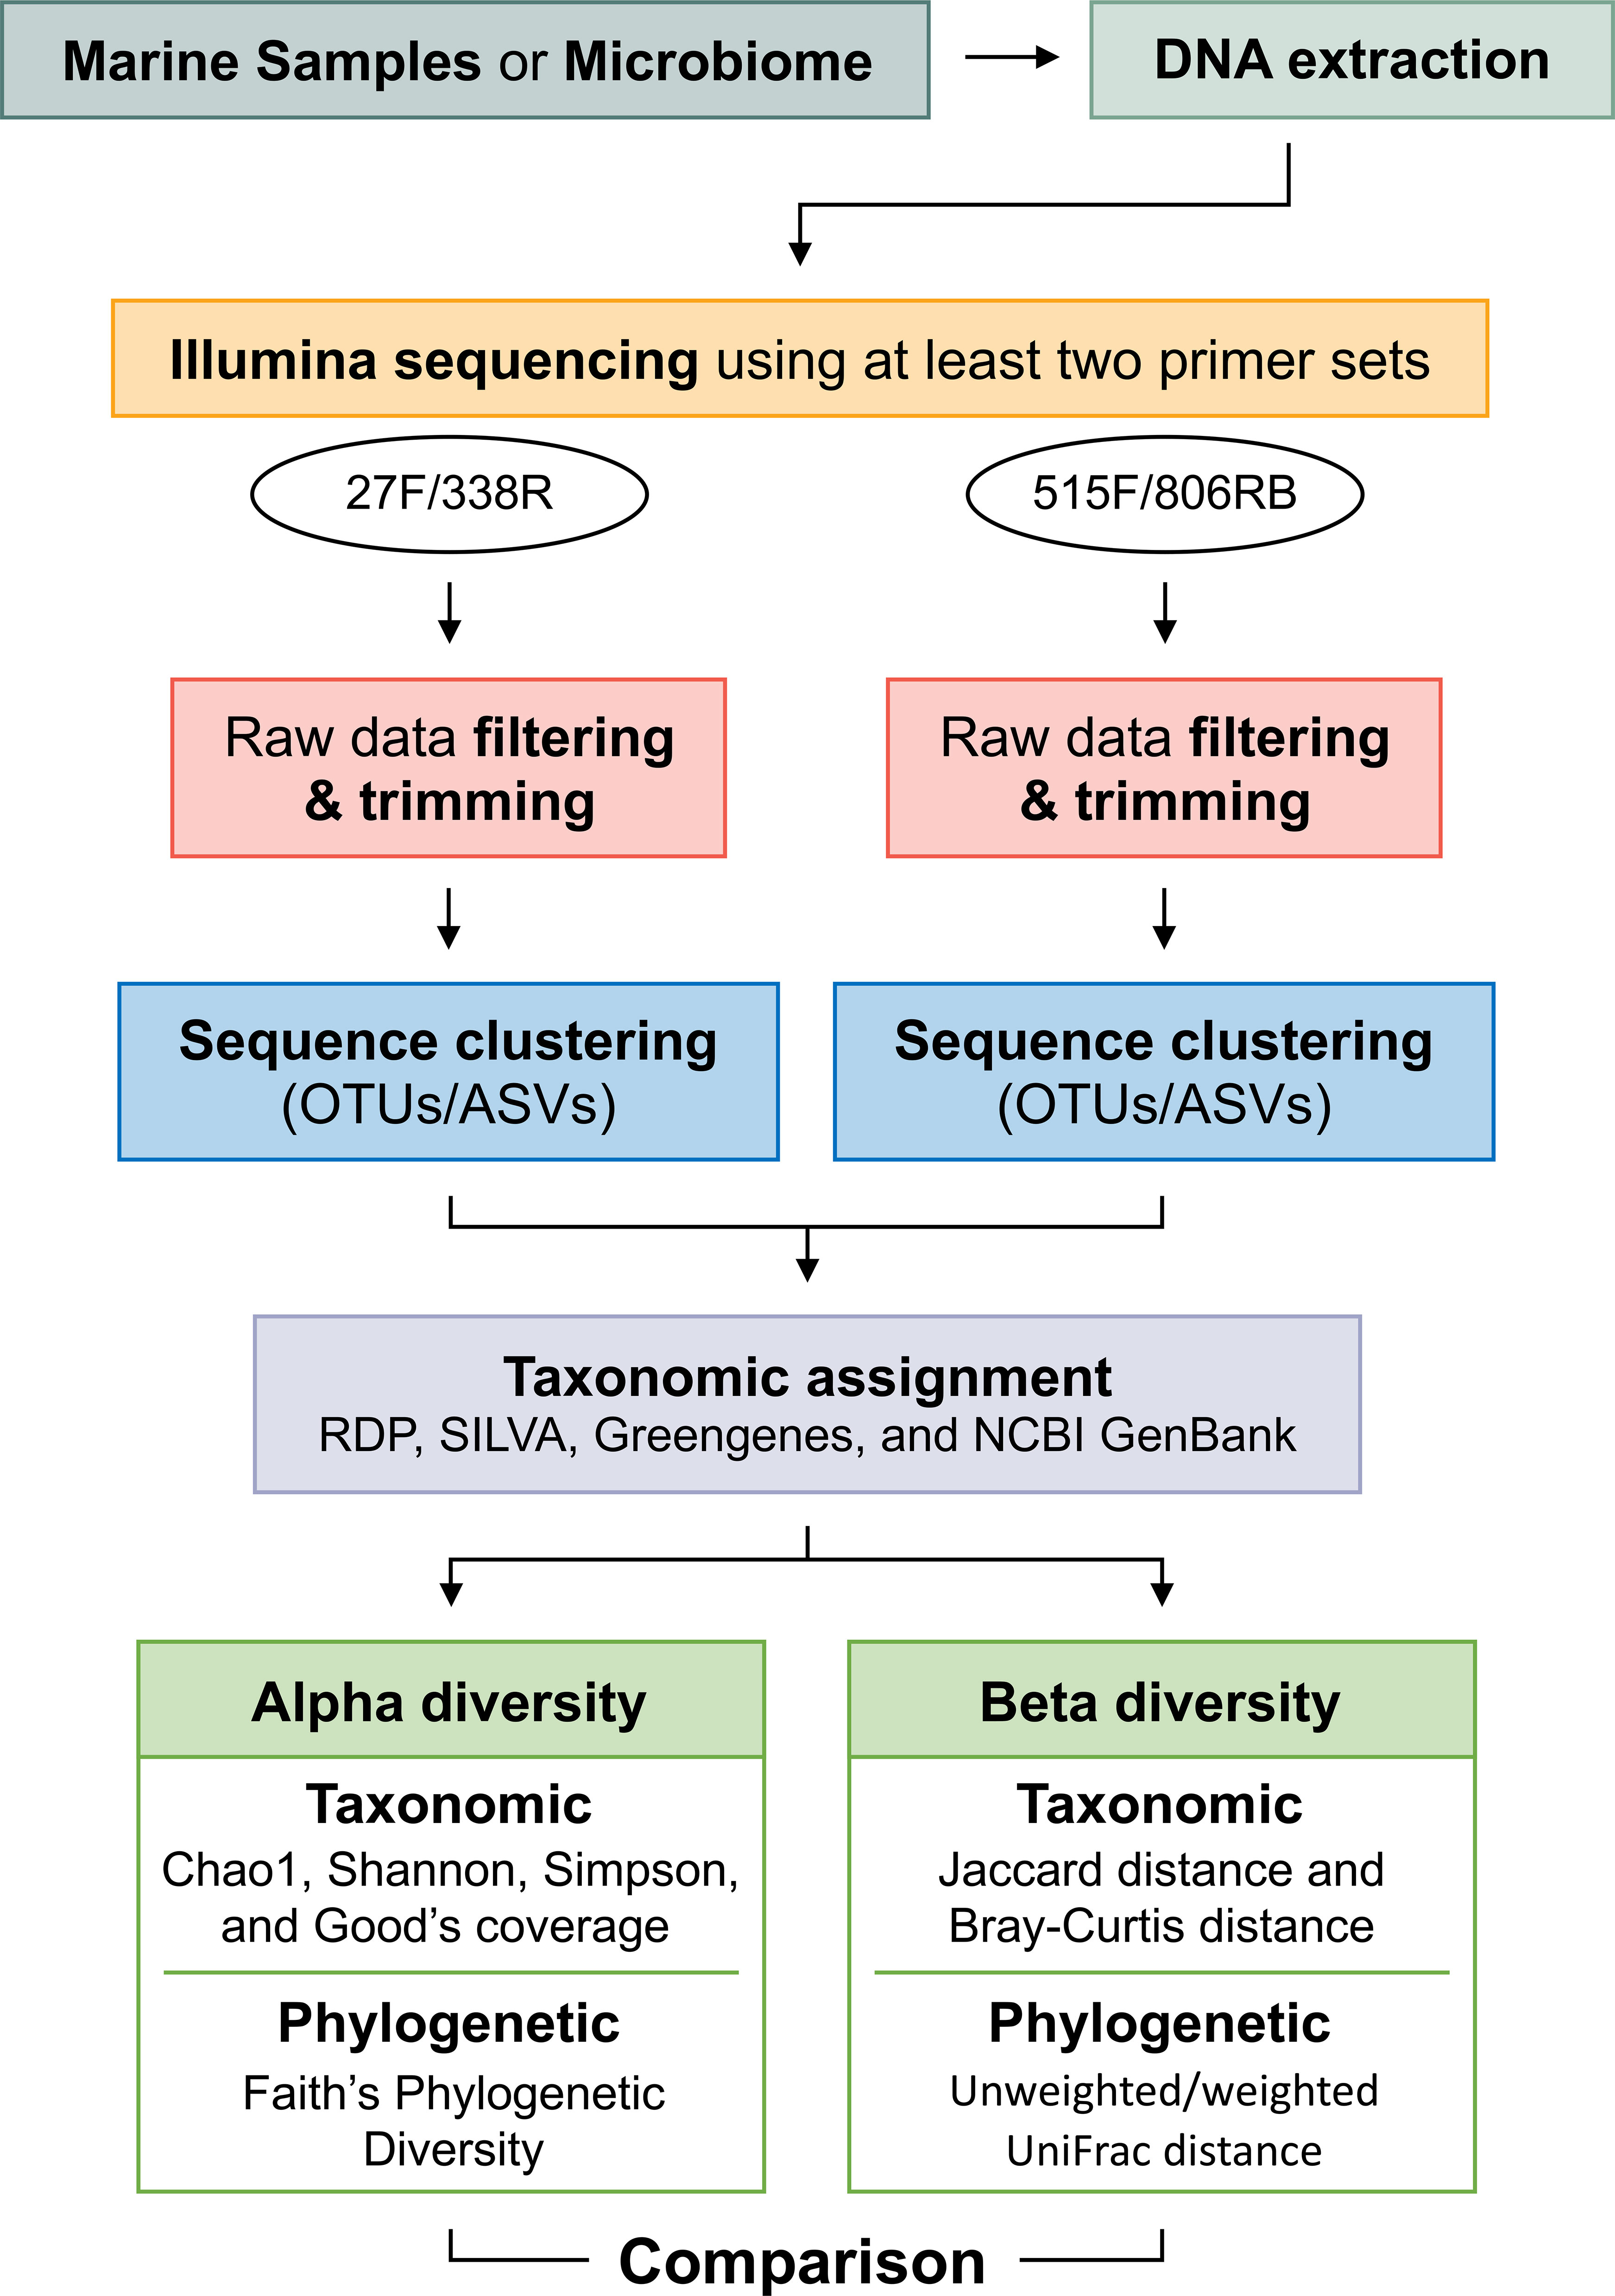
Figure 7 Recommended workflow for marine microbiome analysis in the present study.
Data availability statement
The datasets presented in this study can be found in online repositories. The names of the repository/repositories and accession number(s) can be found in the article/Supplementary Material.
Author contributions
JP designed and supervised the study. HL and DJ performed the majority of the experiments. HL, BC, and JP drafted the manuscript. All the authors approved the submitted version and contributed to this article.
Funding
This work was supported by the National Research Foundation of Korea (NRF) grant to JSP funded by the Korean government (NRF-2022R1I1A2064117).
Acknowledgments
We would like to thank Aaron A HEISS at Kyungpook Institute of Oceanography, Kyungpook National University, Republic of Korea for editing and reviewing this manuscript for English language.
Conflict of interest
The authors declare that the research was conducted in the absence of any commercial or financial relationships that could be construed as a potential conflict of interest.
Publisher’s note
All claims expressed in this article are solely those of the authors and do not necessarily represent those of their affiliated organizations, or those of the publisher, the editors and the reviewers. Any product that may be evaluated in this article, or claim that may be made by its manufacturer, is not guaranteed or endorsed by the publisher.
Supplementary material
The Supplementary Material for this article can be found online at: https://www.frontiersin.org/articles/10.3389/fmars.2023.1199116/full#supplementary-material
References
Abellan-Schneyder I., MatChado M. S., Reitmeier S., Sommer A., Sewald Z., Baumbach J., et al. (2021). Primer, pipelines, parameters: issues in 16S rRNA gene sequencing. mSphere 6, e01202–e01220. doi: 10.1128/mSphere.01202-20
Alam A., Leoni G., Quiros M., Wu H., Desai C., Nishio H., et al. (2016). The microenvironment of injured murine gut elicits a local pro-restitutive microbiota. Nat. Microbiol. 1, 1–8. doi: 10.1038/nmicrobiol.2015.21
Apprill A., McNally S., Parsons R., Weber L. (2015). Minor revision to V4 region SSU rRNA 806R gene primer greatly increases detection of SAR11 bacterioplankton. Aquat. Microb. Ecol. 75, 129–137. doi: 10.3354/ame01753
Azam F. (1998). Microbial control of oceanic carbon flux: the plot thickens. Science 280, 694–696. doi: 10.1126/science.280.5364.694
Bar-On Y. M., Phillips R., Milo R. (2018). The biomass distribution on Earth. Proc. Natl. Acad. Sci. U. S. A. 115, 6506–6511. doi: 10.1073/pnas.1711842115
Bengtsson M. M., Øvreås L. (2010). Planctomycetes dominate biofilms on surfaces of the kelp Laminaria hyperborea. BMC Microbiol. 10, 1–12. doi: 10.1186/1471-2180-10-261
Bennett K. W., Eley A. (1993). Fusobacteria: new taxonomy and related diseases. J. Med. Microbiol. 39, 246–254. doi: 10.1099/00222615-39-4-246
Bowman J. P., McCuaig R. D. (2003). Biodiversity, community structural shifts, and biogeography of prokaryotes within Antarctic continental shelf sediment. Appl. Environ. Microbiol. 69, 2463–2483. doi: 10.1128/AEM.69.5.2463-2483.2003
Buchan A., González J. M., Moran M. A. (2005). Overview of the marine Roseobacter lineage. Appl. Environ. Microbiol. 71, 5665–5677. doi: 10.1128/AEM.71.10.5665-5677.2005
Bukin Y. S., Galachyants Y. P., Morozov I. V., Bukin S. V., Zakharenko A. S., Zemskaya T. I. (2019). The effect of 16S rRNA region choice on bacterial community metabarcoding results. Sci. Data. 6, 1–14. doi: 10.1038/sdata.2019.7
Caporaso J. G., Kuczynski J., Stombaugh J., Bittinger K., Bushman F. D., Costello E. K., et al. (2010). QIIME allows analysis of high-throughput community sequencing data. Nat. Methods 7, 335–336. doi: 10.1038/nmeth.f.303
Caporaso J. G., Lauber C. L., Walters W. A., Berg-Lyons D., Huntley J., Fierer N., et al. (2012). Ultra-high-throughput microbial community analysis on the Illumina HiSeq and MiSeq platforms. ISME J. 6, 1621–1624. doi: 10.1038/ismej.2012.8
Caporaso J. G., Lauber C. L., Walters W. A., Berg-Lyons D., Lozupone C. A., Turnbaugh P. J., et al. (2011). Global patterns of 16S rRNA diversity at a depth of millions of sequences per sample. Proc. Natl. Acad. Sci. U. S. A. 108, 4516–4522. doi: 10.1073/pnas.1000080107
Chao A., Chiu C. H., Hsieh T. C., Davis T., Nipperess D. A., Faith D. P. (2015). Rarefaction and extrapolation of phylogenetic diversity. Methods Ecol. Evol. 6, 380–388. doi: 10.1111/2041-210X.12247
Cho B. C., Azam F. (1988). Major role of bacteria in biogeochemical fluxes in the ocean's interior. Nature 332, 441–443. doi: 10.1038/332441a0
Choi J., Park J. S. (2020). Comparative analyses of the V4 and V9 regions of 18S rDNA for the extant eukaryotic community using the Illumina platform. Sci. Rep. 10, 1–11. doi: 10.1038/s41598-020-63561-z
Choo Y. J., Lee K., Song J., Cho J. C. (2007). Puniceicoccus vermicola gen. nov., sp. nov., a novel marine bacterium, and description of Puniceicoccaceae fam. nov., Puniceicoccales ord. nov., Opitutaceae fam. nov., Opitutales ord. nov. and Opitutae classis nov. in the phylum ‘Verrucomicrobia’. Int. J. Syst. Evol. Microbiol. 57, 532–537. doi: 10.1099/ijs.0.64616-0
Chouari R., Le Paslier D., Daegelen P., Ginestet P., Weissenbach J., Sghir A. (2005). Novel predominant archaeal and bacterial groups revealed by molecular analysis of an anaerobic sludge digester. Environ. Microbiol. 7, 1104–1115. doi: 10.1111/j.1462-2920.2005.00795.x
Cole J. J., Findlay S., Pace M. L. (1988). Bacterial production in fresh and saltwater ecosystems: a cross-system overview. Mar. Ecol. Prog. Ser. 43, 1–10. doi: 10.3354/meps043001
Cole J. R., Wang Q., Cardenas E., Fish J., Chai B., Farris R. J., et al. (2009). The Ribosomal Database Project: improved alignments and new tools for rRNA analysis. Nucleic Acids Res. 37, D141–D145. doi: 10.1093/nar/gkn879
Comeau A. M., Douglas G. M., Langille M. G. (2017). Microbiome helper: a custom and streamlined workflow for microbiome research. mSystems 2, e00127–e00116. doi: 10.1128/mSystems.00127-16
Curtis T. P., Sloan W. T., Scannell J. W. (2002). Estimating prokaryotic diversity and its limits. Proc. Natl. Acad. Sci. U. S. A. 99, 10494–10499. doi: 10.1073/pnas.142680199
Dedysh S. N., Ivanova A. A. (2019). Planctomycetes in boreal and subarctic wetlands: diversity patterns and potential ecological functions. FEMS Microbiol. Ecol. 95, fiy227. doi: 10.1093/femsec/fiy227
Delmont T. O., Kiefl E., Kilinc O., Esen Ö.C., Uysal I., Rappé M. S., et al. (2019). Single-amino acid variants reveal evolutionary processes that shape the biogeography of a global SAR11 subclade. eLife 8, e46497. doi: 10.7554/eLife.46497
Edgar R. C. (2010). Search and clustering orders of magnitude faster than BLAST. Bioinformatics 26, 2460–2461. doi: 10.1093/bioinformatics/btq461
Edgar R. C., Flyvbjerg H. (2015). Error filtering, pair assembly and error correction for next-generation sequencing reads. Bioinformatics 31, 3476–3482. doi: 10.1093/bioinformatics/btv401
Fortunato C. S., Herfort L., Zuber P., Baptista A. M., Crump B. C. (2012). Spatial variability overwhelms seasonal patterns in bacterioplankton communities across a river to ocean gradient. ISME J. 6, 554–563. doi: 10.1038/ismej.2011.135
Freitas S., Hatosy S., Fuhrman J. A., Huse S. M., Mark Welch D. B., Sogin M. L., et al. (2012). Global distribution and diversity of marine Verrucomicrobia. ISME J. 6, 1499–1505. doi: 10.1038/ismej.2012.3
Giebel H. A., Kalhoefer D., Lemke A., Thole S., Gahl-Janssen R., Simon M., et al. (2011). Distribution of Roseobacter RCA and SAR11 lineages in the North Sea and characteristics of an abundant RCA isolate. ISME J. 5, 8–19. doi: 10.1038/ismej.2010.87
Godon J. J., Morinière J., Moletta M., Gaillac M., Bru V., Delgènes J. P. (2005). Rarity associated with specific ecological niches in the bacterial world: the ‘Synergistes’ example. Environ. Microbiol. 7, 213–224. doi: 10.1111/j.1462-2920.2004.00693.x
Gotelli N. J., Colwell R. K. (2001). Quantifying biodiversity: procedures and pitfalls in the measurement and comparison of species richness. Ecol. Lett. 4, 379–391. doi: 10.1046/j.1461-0248.2001.00230.x
Graspeuntner S., Loeper N., Künzel S., Baines J. F., Rupp J. (2018). Selection of validated hypervariable regions is crucial in 16S-based microbiota studies of the female genital tract. Sci. Rep. 8, 1–7. doi: 10.1038/s41598-018-27757-8
Hahn M. W., Schmidt J., Koll U., Rohde M., Verbarg S., Pitt A., et al. (2017). Silvanigrella aquatica gen. nov., sp. nov., isolated from a freshwater lake, description of Silvanigrellaceae fam. nov. and Silvanigrellales ord. nov., reclassification of the order Bdellovibrionales in the class Oligoflexia, reclassification of the families Bacteriovoracaceae and Halobacteriovoraceae in the new order Bacteriovoracales ord. nov., and reclassification of the family Pseudobacteriovoracaceae in the order Oligoflexales. Int. J. Syst. Evol. Microbiol. 67, 2555–2568. doi: 10.1099/ijsem.0.001965
Hahnke R. L., Meier-Kolthoff J. P., García-López M., Mukherjee S., Huntemann M., Ivanova N. N., et al. (2016). Genome-based taxonomic classification of Bacteroidetes. Front. Microbiol. 7. doi: 10.3389/fmicb.2016.02003
Hamady M., Walker J. J., Harris J. K., Gold N. J., Knight R. (2008). Error-correcting barcoded primers for pyrosequencing hundreds of samples in multiplex. Nat. Methods 5, 235–237. doi: 10.1038/nmeth.1184
Hongoh Y., Yuzawa H., Ohkuma M., Kudo T. (2003). Evaluation of primers and PCR conditions for the analysis of 16S rRNA genes from a natural environment. FEMS Microbiol. Lett. 221, 299–304. doi: 10.1016/S0378-1097(03)00218-0
Hugenholtz P., Hooper S. D., Kyrpides N. C. (2009). Focus: synergistetes. Environ. Microbiol. 11, 1327–1329. doi: 10.1111/j.1462-2920.2009.01949.x
Janssen S., McDonald D., Gonzalez A., Navas-Molina J. A., Jiang L., Xu Z. Z., et al. (2018). Phylogenetic placement of exact amplicon sequences improves associations with clinical information. mSystems 3, e00021–e00018. doi: 10.1128/mSystems.00021-18
Jiao N., Herndl G. J., Hansell D. A., Benner R., Kattner G., Wilhelm S. W., et al. (2010). Microbial production of recalcitrant dissolved organic matter: long-term carbon storage in the global ocean. Nat. Rev. Microbiol. 8, 593–599. doi: 10.1038/nrmicro2386
Johnson J. S., Spakowicz D. J., Hong B. Y., Petersen L. M., Demkowicz P., Chen L., et al. (2019). Evaluation of 16S rRNA gene sequencing for species and strain-level microbiome analysis. Nat. Commun. 10, 5029. doi: 10.1038/s41467-019-13036-1
Jumpstart Consortium Human Microbiome Project Data Generation Working Group. (2012). Evaluation of 16S rDNA-based community profiling for human microbiome research. PloS One 7, e39315. doi: 10.1371/journal.pone.0039315
Katoh K., Standley D. M. (2013). MAFFT multiple sequence alignment software version 7: improvements in performance and usability. Mol. Biol. Evol. 30, 772–780. doi: 10.1093/molbev/mst010
Kim M., Morrison M., Yu Z. (2011). Evaluation of different partial 16S rRNA gene sequence regions for phylogenetic analysis of microbiomes. J. Microbiol. Methods 84, 81–87. doi: 10.1016/j.mimet.2010.10.020
Kirchman D. L., Cottrell M. T., Lovejoy C. (2010). The structure of bacterial communities in the western Arctic Ocean as revealed by pyrosequencing of 16S rRNA genes. Environ. Microbiol. 12, 1132–1143. doi: 10.1111/j.1462-2920.2010.02154.x
Klindworth A., Pruesse E., Schweer T., Peplies J., Quast C., Horn M., et al. (2013). Evaluation of general 16S ribosomal RNA gene PCR primers for classical and next-generation sequencing-based diversity studies. Nucleic Acids Res. 41, e1. doi: 10.1093/nar/gks808
Kozich J. J., Westcott S. L., Baxter N. T., Highlander S. K., Schloss P. D. (2013). Development of a dual-index sequencing strategy and curation pipeline for analyzing amplicon sequence data on the MiSeq Illumina sequencing platform. Appl. Environ. Microbiol. 79, 5112–5120. doi: 10.1128/AEM.01043-13
Lanzén A., Jørgensen S. L., Bengtsson M. M., Jonassen I., Øvreås L., Urich T. (2011). Exploring the composition and diversity of microbial communities at the Jan Mayen hydrothermal vent field using RNA and DNA. FEMS Microbiol. Ecol. 77, 577–589. doi: 10.1111/j.1574-6941.2011.01138.x
Lee Z. M. P., Bussema C. III, Schmidt T. M. (2009). rrnDB: documenting the number of rRNA and tRNA genes in bacteria and archaea. Nucleic Acids Res. 37, D489–D493. doi: 10.1093/bib/bbs035
Li W., Fu L., Niu B., Wu S., Wooley J. (2012). Ultrafast clustering algorithms for metagenomic sequence analysis. Brief Bioinform. 13, 656–668. doi: 10.1093/bib/bbs035
Liu Z., Lozupone C., Hamady M., Bushman F. D., Knight R. (2007). Short pyrosequencing reads suffice for accurate microbial community analysis. Nucleic Acids Res. 35, e120. doi: 10.1093/nar/gkm541
Logares R., Sunagawa S., Salazar G., Cornejo-Castillo F. M., Ferrera I., Sarmento H., et al. (2014). Metagenomic 16S rDNA Illumina tags are a powerful alternative to amplicon sequencing to explore diversity and structure of microbial communities. Environ. Microbiol. 16, 2659–2671. doi: 10.1111/1462-2920.12250
Lozupone C., Knight R. (2005). UniFrac: a new phylogenetic method for comparing microbial communities. Appl. Environ. Microbiol. 71, 8228–8235. doi: 10.1128/AEM.71.12.8228-8235.2005
Magoč T., Salzberg S. L. (2011). FLASH: fast length adjustment of short reads to improve genome assemblies. Bioinformatics 27, 2957–2963. doi: 10.1093/bioinformatics/btr507
McNichol J., Berube P. M., Biller S. J., Fuhrman J. A. (2021). Evaluating and improving small subunit rRNA PCR primer coverage for bacteria, archaea, and eukaryotes using metagenomes from global ocean surveys. mSystems 6, e00565–e00521. doi: 10.1128/mSystems.00565-21
Mesa V., Gallego J. L., González-Gil R., Lauga B., Sánchez J., Méndez-García C., et al. (2017). Bacterial, archaeal, and eukaryotic diversity across distinct microhabitats in an acid mine drainage. Front. Microbiol. 8. doi: 10.3389/fmicb.2017.01756
Morris R. M., Rappé M. S., Connon S. A., Vergin K. L., Siebold W. A., Carlson C. A., et al. (2002). SAR11 clade dominates ocean surface bacterioplankton communities. Nature 420, 806–810. doi: 10.1038/nature01240
Nagata T. (2008). “Organic matter–bacteria interactions in seawater,” in Microbial ecology of the oceans, 2nd edn. Ed. Kirchman D. L. (Hoboken, NJ, USA: John Wiley & Sons), 207–241. doi: 10.1002/9780470281840.ch7
Pace N. R. (1997). A molecular view of microbial diversity and the biosphere. Science 276, 734–740. doi: 10.1126/science.276.5313.734
Parada A. E., Needham D. M., Fuhrman J. A. (2016). Every base matters: assessing small subunit rRNA primers for marine microbiomes with mock communities, time series and global field samples. Environ. Microbiol. 18, 1403–1414. doi: 10.1111/1462-2920.13023
Peiffer J. A., Spor A., Koren O., Jin Z., Tringe S. G., Dangl J. L., et al. (2013). Diversity and heritability of the maize rhizosphere microbiome under field conditions. Proc. Natl. Acad. Sci. U. S. A. 110, 6548–6553. doi: 10.1073/pnas.1302837110
Petrosino J. F., Highlander S., Luna R. A., Gibbs R. A., Versalovic J. (2009). Metagenomic pyrosequencing and microbial identification. Clin. Chem. 55, 856–866. doi: 10.1373/clinchem.2008.107565
Polz M. F., Cavanaugh C. M. (1998). Bias in template-to-product ratios in multitemplate PCR. Appl. Environ. Microbiol. 64, 3724–3730. doi: 10.1128/AEM.64.10.3724-3730.1998
Price M. N., Dehal P. S., Arkin A. P. (2010). FastTree 2 - approximately maximum-likelihood trees for large alignments. PloS One 5, e9490. doi: 10.1371/journal.pone.0009490
Quince C., Lanzen A., Davenport R. J., Turnbaugh P. J. (2011). Removing noise from pyrosequenced amplicons. BMC Bioinform. 12, 1–18. doi: 10.1186/1471-2105-12-38
Ruppert K. M., Kline R. J., Rahman M. S. (2019). Past, present, and future perspectives of environmental DNA (eDNA) metabarcoding: A systematic review in methods, monitoring, and applications of global eDNA. Glob. Ecol. Conserv. 17, e00547. doi: 10.1016/j.gecco.2019.e00547
Saad S., Bhatnagar S., Tegetmeyer H. E., Geelhoed J. S., Strous M., Ruff S. E. (2017). Transient exposure to oxygen or nitrate reveals ecophysiology of fermentative and sulfate-reducing benthic microbial populations. Environ. Microbiol. 19, 4866–4881. doi: 10.1111/1462-2920.13895
Sahm K., John P., Nacke H., Wemheuer B., Grote R., Daniel R., et al. (2013). High abundance of heterotrophic prokaryotes in hydrothermal springs of the Azores as revealed by a network of 16S rRNA gene-based methods. Extremophiles 17, 649–662. doi: 10.1007/s00792-013-0548-2
Sherr E. B., Sherr B. F. (1994). Bacterivory and herbivory: Key roles of phagotrophic protists in pelagic food webs. Microb. Ecol. 28, 223–235. doi: 10.1007/BF00166812
Spring S., Bunk B., Spröer C., Schumann P., Rohde M., Tindall B. J., et al. (2016). Characterization of the first cultured representative of Verrucomicrobia subdivision 5 indicates the proposal of a novel phylum. ISME J. 10, 2801–2816. doi: 10.1038/ismej.2016.84
Sunagawa S., Coelho L. P., Chaffron S., Kultima J. R., Labadie K., Salazar G., et al. (2015). Structure and function of the global ocean microbiome. Science 348, 1261359. doi: 10.1126/science.1261359
Takahashi S., Tomita J., Nishioka K., Hisada T., Nishijima M. (2014). Development of a prokaryotic universal primer for simultaneous analysis of Bacteria and Archaea using next-generation sequencing. PloS One 9, e105592. doi: 10.1371/journal.pone.0105592
Thijs S., Op De Beeck M., Beckers B., Truyens S., Stevens V., Van Hamme J. D., et al. (2017). Comparative evaluation of four bacteria-specific primer pairs for 16S rRNA gene surveys. Front. Microbiol. 8. doi: 10.3389/fmicb.2017.00494
Tidgewell K., Clark B. R., Gerwick W. H. (2010). “The natural products chemistry of cyanobacteria,” in Comprehensive natural products II. Eds. Liu H. W., Mander L. (Amsterdam: Elsevier), 141–188. doi: 10.1016/b978-008045382-8.00041-1
Vartoukian S. R., Palmer R. M., Wade W. G. (2007). The division “Synergistes”. Anaerobe 13, 99–106. doi: 10.1016/j.anaerobe.2007.05.004
Wagner A., Blackstone N., Cartwright P., Dick M., Misof B., Snow P., et al. (1994). Surveys of gene families using polymerase chain reaction: PCR selection and PCR drift. Syst. Biol. 43, 250–261. doi: 10.2307/2413465
Wear E. K., Wilbanks E. G., Nelson C. E., Carlson C. A. (2018). Primer selection impacts specific population abundances but not community dynamics in a monthly time-series 16S rRNA gene amplicon analysis of coastal marine bacterioplankton. Environ. Microbiol. 20, 2709–2726. doi: 10.1111/1462-2920.14091
Wessner D. R., Dupont C., Charles T. C. (2013). “Microbial ecosystem,” in Microbiology. Eds. Wessner D. R., Dupont C., Charles T. C. (New York: Wiley), 484–521.
Will C., Thürmer A., Wollherr A., Nacke H., Herold N., Schrumpf M., et al. (2010). Horizon-specific bacterial community composition of German grassland soils, as revealed by pyrosequencing-based analysis of 16S rRNA genes. Appl. Environ. Microbiol. 76, 6751–6759. doi: 10.1128/AEM.01063-10
Willis C., Desai D., LaRoche J. (2019). Influence of 16S rRNA variable region on perceived diversity of marine microbial communities of the Northern North Atlantic. FEMS Microbiol. Lett. 366, fnz152. doi: 10.1093/femsle/fnz152
Keywords: bias, diversity, marine bacteria, next-generation sequencing, primer selection
Citation: Lee HB, Jeong DH, Cho BC and Park JS (2023) Comparative analyses of eight primer sets commonly used to target the bacterial 16S rRNA gene for marine metabarcoding-based studies. Front. Mar. Sci. 10:1199116. doi: 10.3389/fmars.2023.1199116
Received: 03 April 2023; Accepted: 25 September 2023;
Published: 09 October 2023.
Edited by:
Antje Wichels, Alfred Wegener Institute Helmholtz Centre for Polar and Marine Research (AWI), GermanyReviewed by:
Rubens Tadeu Delgado Duarte, Federal University of Santa Catarina, BrazilRobyn Wright, Dalhousie University, Canada
Copyright © 2023 Lee, Jeong, Cho and Park. This is an open-access article distributed under the terms of the Creative Commons Attribution License (CC BY). The use, distribution or reproduction in other forums is permitted, provided the original author(s) and the copyright owner(s) are credited and that the original publication in this journal is cited, in accordance with accepted academic practice. No use, distribution or reproduction is permitted which does not comply with these terms.
*Correspondence: Jong Soo Park, jongsoopark@knu.ac.kr