Impact of freshwater diversions on vegetation in coastal wetlands based on remote sensing derived vegetation index
 Wei Wu
 Evan Grimes
 Glenn Suir
- 1School of Ocean Science and Engineering, The University of Southern Mississippi, Ocean Springs, MS, United States
- 2Environmental Laboratory, US Army Engineer Research and Development Center, Lafayette, LA, United States
- 3School of Geosciences, University of Louisiana at Lafayette, Lafayette, LA, United States
There exist contrasting results on the impact of large-scale freshwater and sediment diversions on land gain/loss. To improve understanding on the efficacy of diversion projects in restoring coastal wetlands, we aim to evaluate the long-term impacts of diversion-altered salinity and water level on vegetation productivity in coastal wetlands. Two freshwater diversion projects Caernarvon and Davis Pond in Louisiana, U.S. and associated reference sites were selected for inclusion in this study. We implemented multi-level Bayesian models to evaluate 1) how vegetation productivity approximated by Landsat-derived Normalized Difference Vegetation Index (NDVI) in peak biomass season changed over time (pre- and post-construction and operation of the freshwater diversions), and 2) how peak-season NDVI responded to mean and variability of water level and salinity among a suite of factors that could affect vegetation productivity. Analysis showed difference in temporal trends of NDVI between the reference and diversion site for the Caernarvon project with a significant increase at the diversion site although NDVI negatively responded to diversion at the beginning. Diversion did not seem to negatively affect NDVI for the Davis Pond project and NDVI only marginally increased at the diversion site. For both projects, NDVI negatively responded to water level, while salinity negatively affected NDVI or showed quadratic relation with NDVI. At the Caernarvon diversion project, the negative impact of water level on NDVI was greater at the diversion site than at the reference site. At the Davis Pond project, it was the salinity that showed different impact between the diversion and reference site. The temporal increase of NDVI at the Caernarvon diversion site can be explained by the lower salinity driven by diversion. The quadratic relation between salinity and NDVI at the Davis Pond diversion project led to only marginal increase at the diversion site. This study provided uncertainty estimates in temporal trend of NDVI and the impact of two key abiotic drivers on NDVI. The improved understanding on vegetation productivity will help predict landscape change in response to freshwater diversions.
Introduction
Coastal wetlands provide a wide variety of important ecosystem services, such as carbon sequestration, nursery habitats, protection from coastal storms, improved water quality, cultural values, and recreational opportunities (Costanza et al., 1997; Engle, 2011). However, coastal wetlands are disappearing rapidly in many parts of the world. Therefore, extensive efforts have been undertaken to restore coastal wetlands as an important aspect of wetland ecosystem management.
Wetland management decisions have historically been guided by target functions and/or restoration goals, such as the reduction of salinity or the amount of habitat or wetlands restored, but less considered has been the management or restoration of hydrologic cycles (Forbes et al., 2008). However, water level is a primary driver in wetland ecosystem structure and function. Water regime variation is increasingly recognized as important in maintaining wetland functionality and diversity, so better understanding of water regime effects and abiotic controls on plant communities can improve future modeling and management of wetlands resources (Brock and Britton, 1995; Zedler, 2001; Snedden et al., 2015). Previous emphasis of water level research has been on relative sea level rise and the gradual inundation of marshes, where plants have some capabilities to adapt and respond (Morris et al., 2002; Kirwan et al., 2010; Wu et al., 2020). However, some hydrologic alterations and water management actions induce intermittent, instantaneous changes in inundation that fall outside of typical ranges. The large variability of water level can impose entirely different vegetation and soil stresses and responses. Currently, there are data and knowledge gaps associated with the impact of atypical changes in water levels on wetland plants and soils (Baustian et al., 2018).
In addition to accelerating sea level rise, climate change will intensify variability of each component of hydrological cycle (i.e., precipitation, surface-water flow, and evapotranspiration), which will likely lead to more frequent droughts and floods (Lavers et al., 2015; Lane and Kay, 2021). As a result, hydrologic management is an increasingly vital component of wetland ecosystem restoration and management. Recently, long-term and large-scale coastal ecosystem restoration and management efforts have focused on hydrologic alterations as a way of enhancing and/or creating wetlands while promoting beneficial ecological processes (Allison and Meselhe, 2010; Kearney et al., 2011; Couvillion et al., 2013; Kenney et al., 2013). The 2017 Coastal Master Plan developed by the Coastal Protection and Restoration Authority (CPRA) (CPRA, 2017) proposes seven large-scale freshwater/sediment diversion projects over the next 50 years (Pahl et al., 2020). This approach to wetland creation is relatively slow, when compared to traditional measures (i.e., placement of dredged material or vegetation planting), but can provide nourishment and sediment benefits over longer timeframes.
In addition to changing water levels, diverting freshwater from a river channel can alter salinity, nutrient concentrations, and sediment loading in wetland outfall areas. All of these factors simultaneously affect vegetation composition, vegetation growth, and soil organic matter decomposition, which can directly and indirectly affect wetland accretion and elevation change (Day et al., 2007; Day et al., 2009; Elsey-Quirk et al., 2019). There is currently a lack of data and understanding of how these environmental factors additively and/or interactively affect wetland vegetation as well as short- and long-term impacts of freshwater diversions on wetland restoration, including effectiveness, potential damages, and economic impacts.
Previous studies exhibit large variability on the efficacy of freshwater diversions on wetland restoration. Some studies have noted significant wetland gain that is related to the volume of water and sediment diverted, particularly increased deposition of inorganic river sediment or enhanced vertical accretion (DeLaune et al., 2003; Lane et al., 2006; Day et al., 2009; CPRA, 2012; Day et al., 2014; DeLaune et al., 2013; Day et al., 2016a; Rutherford et al., 2018; White et al., 2023). Other studies observed deleterious effects of long-term freshwater diversion onto the marshes due to elevated nutrients (Kearney et al., 2011), lack of wetland gains (Metzger, 2007), land gains near the diversion outlets but loss further away (Brown et al., 2019), or failing to reduce wetland loss (Hardy and Wu, 2021).
Considering the high levels of uncertainty and cost, there is an immediate need to evaluate the influence of freshwater diversions and subsequent changes in environmental factors on wetland plant dynamics. Therefore, the goal of this study was to fill gaps of data and information that are required to adequately model and predict the impacts of freshwater diversions that are proposed for ecosystem restoration and management. The objectives of this study are: 1) to evaluate long-term remote sensing-based vegetation productivity across pre- and post-diversion condition, and 2) to predict the impact of key abiotic factors (i.e., water level and salinity) on vegetation productivity in diversion outfall areas and their corresponding reference areas. Ultimately, this study will evaluate the impact of atypical changes in water level (i.e., increased depths and durations of flooding) and salinity (i.e., introduction of freshwater inputs) on vegetation condition in wetlands with natural and altered hydrologic regimes. We have two hypotheses: 1) vegetation productivity decreased initially after the freshwater diversion began, but eventually increased after adapting to the novel hydrological regimes, and 2) water level and salinity significantly affected vegetation productivity and the effect varied between diversion and reference sites.
Methods
We applied a combination of tools, including remote sensing and Bayesian models to provide enhanced and efficient scientific measures for evaluating impacts of changing water regimes. These tools are especially useful in altered or complex ecosystems with varied interactions of biotic and abiotic factors (Lai et al., 2013). We took advantage of long-term remote sensing data and applied a remote sensing derived vegetation index to approximate peak vegetation biomass that represents vegetation productivity in coastal wetlands. The hydrology and salinity data came from the existing coast-wide reference monitoring system (CRMS). We applied Bayesian multi-level models that assimilated multi-source data to make predictions that account for uncertainties from parameters and model structures. The uncertainties were generally lacking in previous studies, however, they are important to inform future use of freshwater diversions for wetland restoration.
Study sites
We selected two representative freshwater diversion projects: Davis Pond and Caernarvon, and their respective reference sites in Louisiana, U.S. (Figure 1). The Caenarvon and Davis Pond diversion projects, which utilize pulsed operations (brief increases in flow through the diversion structure) with maximum flows of 255 cubic meters per second (cms) (Caernarvon) and 302 cms (Davis Pond), were primarily designed to mitigate saltwater intrusion from the Gulf of Mexico, reduce wetland loss, and enhance emergent vegetation growth (Jenkins et al., 2011; Plitsch, 2014; Peyronnin et al., 2017; White et al., 2023). The references sites used in this study were selected based on two primary factors: 1) geographic zone (i.e., same watershed basin as associated diversion site) and 2) environmental conditions (e.g., consist of similar vegetation to the pre-diversion study site). These environmental characteristics are supported in historic wetland surveys within each of the study and reference areas (Chabreck et al., 1968; Chabreck and Linscombe, 1997; Linscombe and Chabreck, 2001).
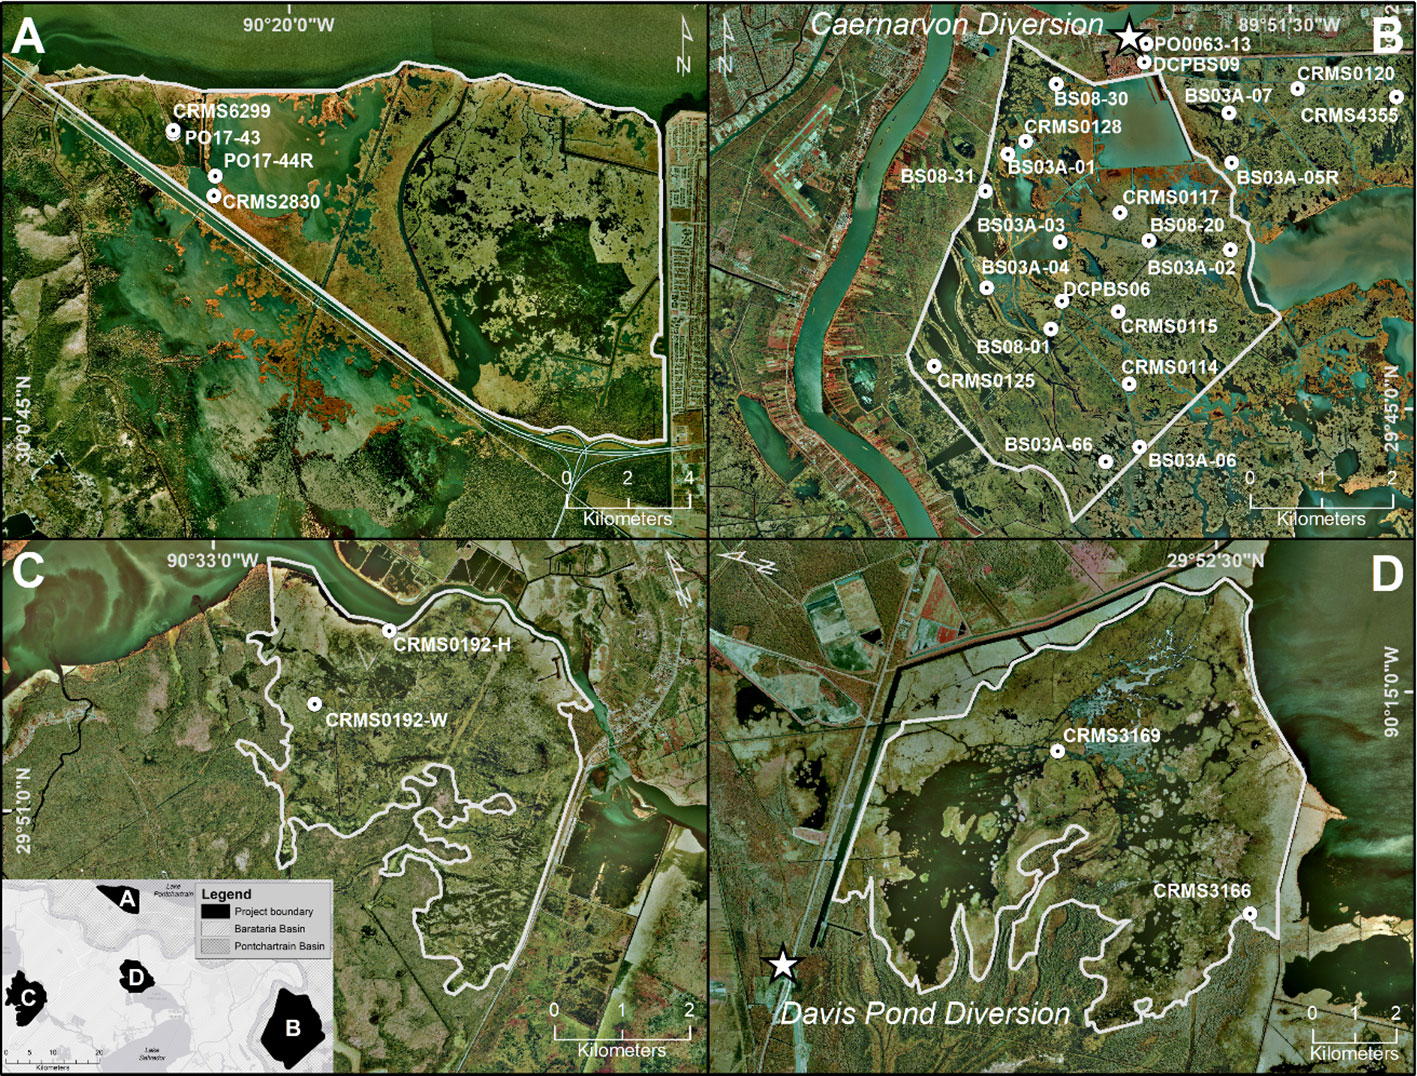
Figure 1 The study area (boundaries in white lines) demonstrating diversion [Caernarvon, (B) and Davis Pond, (D)] and reference sites [Caernarvon Reference, (A) and Davis Pond Reference, (C)], and Coastwide Reference Monitoring System (CRMS) stations where salinity and water level data were obtained, in southeastern Louisiana, U.S.
Davis Pond
The Davis Pond study site consists of 2,770 hectares (ha) of marsh and associated shallow water bodies and is located in Barataria Basin, Louisiana (29.88° N, 90.28° W, Figure 1) (Kral et al., 2012; Keogh et al., 2019). The Davis Pond study site has historically been a fresh Maidencane community dominated by Panicum hemitomon (maidencane), Sagittaria lancifolia (bulltongue arrowhead), Eleocharis macrostachy (pale spikerush), and Alternanthera philoxeroides (alligatorweed) (Chabreck et al., 1968; Chabreck and Linscombe, 1997; Linscombe and Chabreck, 2001). This study site comprises the direct outfall area of the Davis Pond freshwater diversion of the Mississippi River.
The Davis Pond freshwater diversion structure is a restoration project that began operations in July 2002 (USACE, 2002). Four 4.27-meter culverts were installed and designed to release more than 280 cms of water when necessary (Plitsch, 2018). Since construction and operation of the Davis Pond Diversion, the study site has transitioned to a Bulltongue community dominated by Sagittaria lancifolia and Zizaniopsis miliacea (giant cutgrass) (Sasser et al., 2008; Sasser et al., 2014; Coastal Protection and Restoration Authority (CPRA) of Louisiana, 2019). The project anticipates protecting 13,355 ha of wetlands and 314,440 ha of estuaries during its lifespan, and annual economic benefits are estimated to be over $15 million (USACE, 2002).
The Davis Pond reference site consists of 4,508 ha of wetlands in the Barataria Basin and is located south of Lac des Allemands, approximately 17 km west of the Davis Pond study site (29.84° N, 90.52° W, Figure 1). Since the 1960s, the Davis Pond reference site has maintained a fresh Maidencane vegetation community dominated by Panicum hemitomon and Sagittaria lancifolia (Chabreck et al., 1968; Chabreck and Linscombe, 1997; Linscombe and Chabreck, 2001; Sasser et al., 2008; Sasser et al., 2014; CPRA, 2019), similar to the Davis Pond freshwater diversion outfall area prior to the diversion operations. In addition to the prominent attached emergent vegetation, the Davis Pond and Davis Pond reference sites consist of some floating marsh mats (Sasser, 1994), which may be more resilient to changes in water regime.
Caernarvon
The Caernarvon diversion project outfall study site, which consists of 10,912 ha of marsh and associated shallow water bodies, is located in the Pontchartrain Basin, Louisiana (29.78°N, 89.93° W, Figure 1). From 1949 to 2001 the Caernarvon study site fluctuated between a brackish and intermediate system (O’Neil, 1951; Visser et al., 2002). Historically the area consisted of a Wiregrass vegetation community dominated by Spartina patens (saltmeadow cordgrass), Schoenoplectus americanus (chairmaker’s bulrush), Eleocharis spp. (spikerush), and Vigna luteola (hairypod cowpea) (Chabreck et al., 1968; Chabreck and Linscombe, 1997; Linscombe and Chabreck, 2001). Since 2001, the Caernarvon site has transitioned to a fresher system, with a Bulltongue community to the north (dominated by Polygunum punctatum and Alternanthera philoxeroides) and a Wiregrass community in the south (dominated by Spartina patens) (CPRA, 2019; Sasser et al., 2008; Sasser et al., 2014).
Caernarvon Diversion was completed in 1991 and is designed to release up to 255 cms of freshwater through five 4.57 m culverts, but has been operated at an average of 62.3 cms from 1993 to 2001 (USACE, 2013; Lopez et al., 2014). The diverted water flows directly into Big Mar Pond and disperses throughout Breton Sound, providing numerous habitat and ecosystem benefits (Villarrubia, 2002).
The Caernarvon Reference Site consists of 1,907 ha of wetlands and is located approximately 23 km west-northwest of New Orleans in the Pontchartrain Basin, Louisiana (30.03° N, 90.32° W, Figure 1). Since the 1960s, the Caernarvon Reference site has been a Wiregrass community dominated by Spartina patens, with considerable amounts of Eleocharis spp., Schoenoplectus americanus, Spartina alterniflora (smooth cordgrass), and Ipomoea sagittata (saltmarsh morning-glory) (Chabreck et al., 1968; Chabreck and Linscombe, 1997; Linscombe and Chabreck, 2001; Sasser et al., 2008; Sasser et al., 2014; CPRA, 2019), similar to the historical vegetation community in the Caernarvon diversion outfall area before the diversion started.
Remote sensing
Data acquisition and processing
Peak-season green biomass that represents vegetation productivity within the study areas was evaluated using space-borne imagery. Remote sensing assessments were performed using Landsat 5 Thematic Mapper [TM], Landsat 7 Enhanced Thematic Mapper Plus [ETM+], and Landsat 8 Operational Land Imager [OLI] for all diversion and reference sites. The Landsat constellation of sensors, which span the period of analysis from 1984 to 2018, provide moderate spatial (30 meter) and temporal (16 day return) resolution imagery (Suir et al., 2018). Landsat data are useful for evaluating long-term landscape trends, and estimating short-term variations linked to disturbance events and/or prevailing environmental conditions (Suir et al., 2011). Raw and processed Landsat data are available through the Google Earth Engine (GEE) image service. GEE provides Tier 1 surface reflectance imagery, which meets geometric, radiometric, and atmospheric quality requirements (Kalnay et al., 1996; Chander et al., 2009; Schmidt et al., 2013). Additionally, since cloud cover can be a significant limitation to Landsat imagery usage, the GEE uses aggregation functions (i.e., use of outlier values to remove cloud cover from neighboring scenes) to create monthly image composites. All cloud free scenes and composites of Landsat images used in this study, from 1984 to 2018, were acquired using the GEE.
Normalized Difference Vegetation Index
The Normalized Difference Vegetation Index (NDVI) utilizes a band ratio of image-derived reflectance between a near-infrared (NIR) and red band (, Rouse et al., 1974) to measure an ecosystem’s ability to capture solar energy and convert it to organic carbon or biomass (An et al., 2013). Since healthy green vegetation absorbs light in the red portion of the electromagnetic spectrum and reflects light in the NIR portion of the spectrum, the NDVI provides a useful relative measure for assessing vegetation biomass/vigor, and its changes over time (Carle, 2013; Suir and Sasser, 2019a; Suir and Sasser, 2019b). As such, this index was used with data collected within the vegetation peak biomass season to assess changes in green biomass and vegetation productivity in the diversion and reference areas.
Optical inspections were performed on all scenes and composites to identify and remove satellite images of poor quality. ESRI ArcGIS version 10.5 (Redlands, CA: Environmental Systems Research Institute) was used to process all Landsat-derived NDVI images for each site. All water and cloud features within the diversion and reference sites were initially excluded from each satellite image using the density slicing method (Frazier and Page, 2000; Wang et al., 2002). Since NDVI values less than zero (< 0) are typical of non-vegetation features (e.g., mud flats and bare earth) (Reif et al., 2011; Carle, 2013), those were also excluded from each image. Given the large number of Landsat image pixels per site, and the spatial variability within site not being the focus of this study, median NDVI values (from peak biomass season, August to October) across pixels of each site were used as model response variables to better evaluate temporal patterns of vegetation condition and change. In addition, the lack of well distributed water and salinity spatial data, described below, limited development of spatial model of NDVI. We applied paired t-test and Mann-Kendall non-parametric test to compare NDVI between diversion and reference site for each diversion project, and detect the temporal trend of NDVI at each site respectively.
Environmental variables
The distribution, abundance, growth potential, and productivity of wetland plants are influenced by a variety of environmental factors (Lacoul and Freedman, 2006a), related to geomorphology (geology and topography), sediment, climate, hydrology, water quality constituents, episodic events, and competition (Lacoul and Freedman, 2006b; Allen and Suir, 2014; Suir et al., 2018; He et al., 2023). Since water level and salinity are key abiotic factors to vegetation productivity, are directly impacted by freshwater diversions, and their data is abundant and available in coastal Louisiana, we focus on them as environmental variables in this study. The Louisiana Coastwide Reference Monitoring Station (CRMS) system and data were used to identify ranges of natural and managed hydrology and salinity in the project and reference areas (Figure 1). We calculated the average and standard deviation of daily water level and salinity within growing season (March to October) for each year and used them as the covariates in the Bayesian model. We applied paired t-test to compare water level and salinity between diversion and reference site for each diversion project.
Bayesian models
Limited data, limited understanding, and natural variability only lead to large uncertainties in prediction of vegetation response to environmental and wetland stressors. These responses are knowledge gaps that have recently limited the modeling and efficient implementation of wetland restoration through freshwater diversion measures. Bayesian inference has the advantage of quantifying uncertainties related to parameters and predictions through credible intervals (CI) of posteriors (Clark, 2004; Wu et al., 2012). Therefore, we implemented multi-level (or multi-scale) Bayesian models (Figure 2) to investigate temporal trends of peak-season NDVI and how salinity and water level affected it in the Caernarvon and Davis Pond diversion project areas. For this study, two distinct spatial scales were evaluated: 1) project scale (includes both diversion and reference sites), and 2) finer site scale (diversion or reference site).
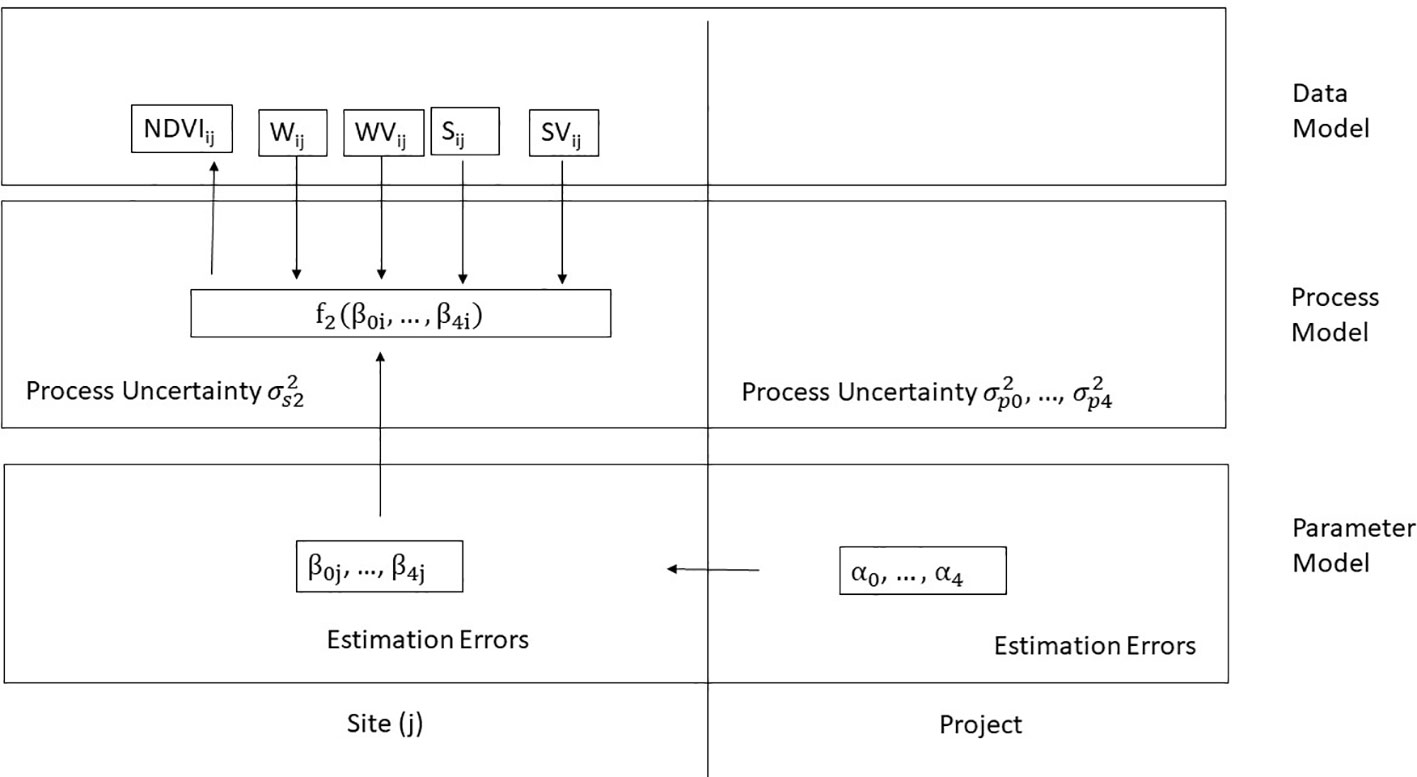
Figure 2 Structure of the full Bayesian multi-level model used to identify the effect of water level and salinity on NDVI. The complexity of the model was decomposed into stages of data, process and parameters (vertical direction) and the association of different spatial scales (horizontal direction). (Adapted from Wu et al., 2012). The symbols correspond to those in Eq. 5 – Eq. 8. W- mean daily water level, WV – standard deviation of daily water level, S – mean daily salinity, and SV – standard deviation of daily salinity, σ2 – variance, αs and βs denote model parameters, and subscript i denotes year. The project scale includes both diversion and reference site.
For each diversion project, we developed two types of models. The first type of models analyzed temporal trends of peak-season NDVI with year (in reference to initiation of freshwater diversion) and its quadratic term as the covariates to capture nonlinear trends, especially the potential minimum NDVI around or after the initiations of the freshwater diversions. The second type of models analyzed the impact of water level and salinity on peak-season NDVI. Limited availability of water level and salinity data temporally compared to NDVI data, especially at the reference sites, reduced temporal coverage in the second type of models. The data of the first type of models ranged from 1984 to 2018, while the data of the second type of models ranged from 1996 to 2018 for the Carnarvon project and from 1998 to 2018 for the Davis Pond project.
For each type of models, we developed a variety of model candidates to explore whether the effect of a particular covariate should be included or its effect differed between diversion and reference sites (see Supplementary Materials Tables S1–S3). We compared these models based on deviance information criterion (DIC) and predictive posterior loss (PPL) (Hooten and Hobbs, 2015). The lower the DIC or PPL, the better the model predicts. We ranked the models mainly based on DIC, but we compared PPL when the models had different hierarchies (for example, the models that accounted for site-specific parameters vs. the models that had parameters that did not vary by site).
The posteriors of the coefficients for the covariates, particularly, summarized in the medians and credible intervals (95% CIs, from 2.5% quantile to 97.5% quantile, and 50% CIs, from the first quartile to the third quartile), facilitated the inference on the long-term trends of NDVI and abiotic factors’ impact on NDVI. The 95% or 50% CIs of a coefficient represent that there is a 95% probability or 50% probability that this coefficient lies within the intervals. If a 95% CI does not overlap zero, then there is a significant effect of the corresponding covariate on NDVI. From the posteriors, we can also summarize the probability of a particular coefficient or prediction being positive or negative.
Temporal trend models
To represent the peak-season NDVI at Site j (diversion or reference) in Year i (), let represent the mean of , and represent the variance of D at the site scale. was modeled by assuming it followed (denoted by ~) a normal distribution (N) (Equation 1).
To account for nonlinear trends, we included the years passed (Y) in reference to the diversion initiation years (1991 for Caernarvon diversion and 2002 for Davis Pond diversion) and its quadratic term (Y2) as the covariates (Equation 2).
Where , , and represent intercept and coefficients for Y and Y2 respectively, and j=1 (diversion site) or 2 (reference site). For some models we compared (not shown here), there was no subscript j, therefore, , , or became lumped parameters , , or that did not vary between the diversion and reference sites.
Therefore, the D at two sites was modeled as in Equation 3.
Where ∝ denotes “is proportional to”. The parameters at the site scale were all modeled by assuming they were distributed as (~) normal distributions (N) with the mean ( and variance ( at the project scale (including both reference and diversion sites) (Equation 4). A lumped parameter that did not account for site-specific difference skipped this step.
Models to evaluate the impact of water level and salinity on NDVI
Mean of the NDVI at Site j (diversion or reference) in Year i ( was modeled as a linear function of water level and salinity. The covariates did not only include mean daily water level () and salinity ( from March to October, but also their standard deviations ( to represent variability (Equation 5, Figure 2). The variability is important in dynamic systems but has been rarely accounted for previously. We also explored the nonlinear response of NDVI to mean water level and mean salinity by including their quadratic terms in the models (not described in the equations). We did not detect multicollinearity based on inflation variance factor using “car” package in R for the Caernarvon diversion project (Fox and Weisberg, 2019). Equation 5 represents the full model for this project. However, there existed multicollinearity if we included both mean and standard deviation of salinity for the Davis Pond diversion project, therefore we removed standard deviation of salinity to eliminate multicollinearity in the models for the Davis Pond diversion project.
Where represent intercept, coefficients for mean water level, variability of water level, mean salinity, and variability of salinity respectively with j=1 (diversion site) or 2 (reference site).
Therefore, the D at two sites for a particular diversion project was modeled as in Equation 6.
The site-scale parameters ( were all modeled by assuming they were distributed as (~) a normal distribution (N) with the means ( and variances ( at the project scale (Equation 7).
Bayesian models require prior distributions for unknown parameters (). For computation efficiency, we used conjugated priors, i.e., the priors and posteriors have the same probability distribution forms (Calder et al., 2003). As such, the priors for were normally distributed and the priors for followed inverse gamma distributions. As we had limited knowledge on the parameters, we also defined the priors distributions flat to only weakly influence the posteriors (Lambert et al., 2005).
We derived the joint distribution of unknowns in Eq. 8 using the second type of models as an example by combining the parameter (priors), process, and data models.
We computed the posterior distributions using Markov Chain Monte Carlo Simulation (MCMC) (Robert and Casella, 2004) in the software JAGS 4.3.0 (Plummer, 2017). We summarized quantiles, 95% and 50% credible intervals, and the probability of a particular parameter being positive or negative based on the posteriors.
We normalized the covariates to increase the speed of convergence of MCMC for the second type of models (Hooten and Hobbs, 2015). In addition, we could directly compare the covariates’ effects based on the magnitudes of their parameters with these covariates being normalized to the similar ranges (Hardy and Wu, 2021).
Results
Temporal trends of water level and salinity
Water level at the diversion and reference sites was not significantly different from each other for both projects (p-value of paired t-test = 0.060 for Caernarvon project, and p-value = 0.86 for Davis Pond project) (Figures 3, 4). Meanwhile, salinity at the diversion sites was significantly higher than at the reference sites for both projects (p-value = 5.0×10⁻⁵ for Caernarvon project, and p-value = 2.5×10⁻⁴ for Davis Pond project) and it decreased over time. Variability of water level at the diversion sites was not significantly different from the reference sites for both diversion projects (p-value = 0.11 for Caernarvon project, and p-value = 0.12 for Davis Pond project), however the variability of salinity was significantly larger at the diversion sites than at the reference sites (p-value = 4.2×10⁻¹⁰ for Caernarvon project, and p-value = 0.0024 for Davis Pond project).
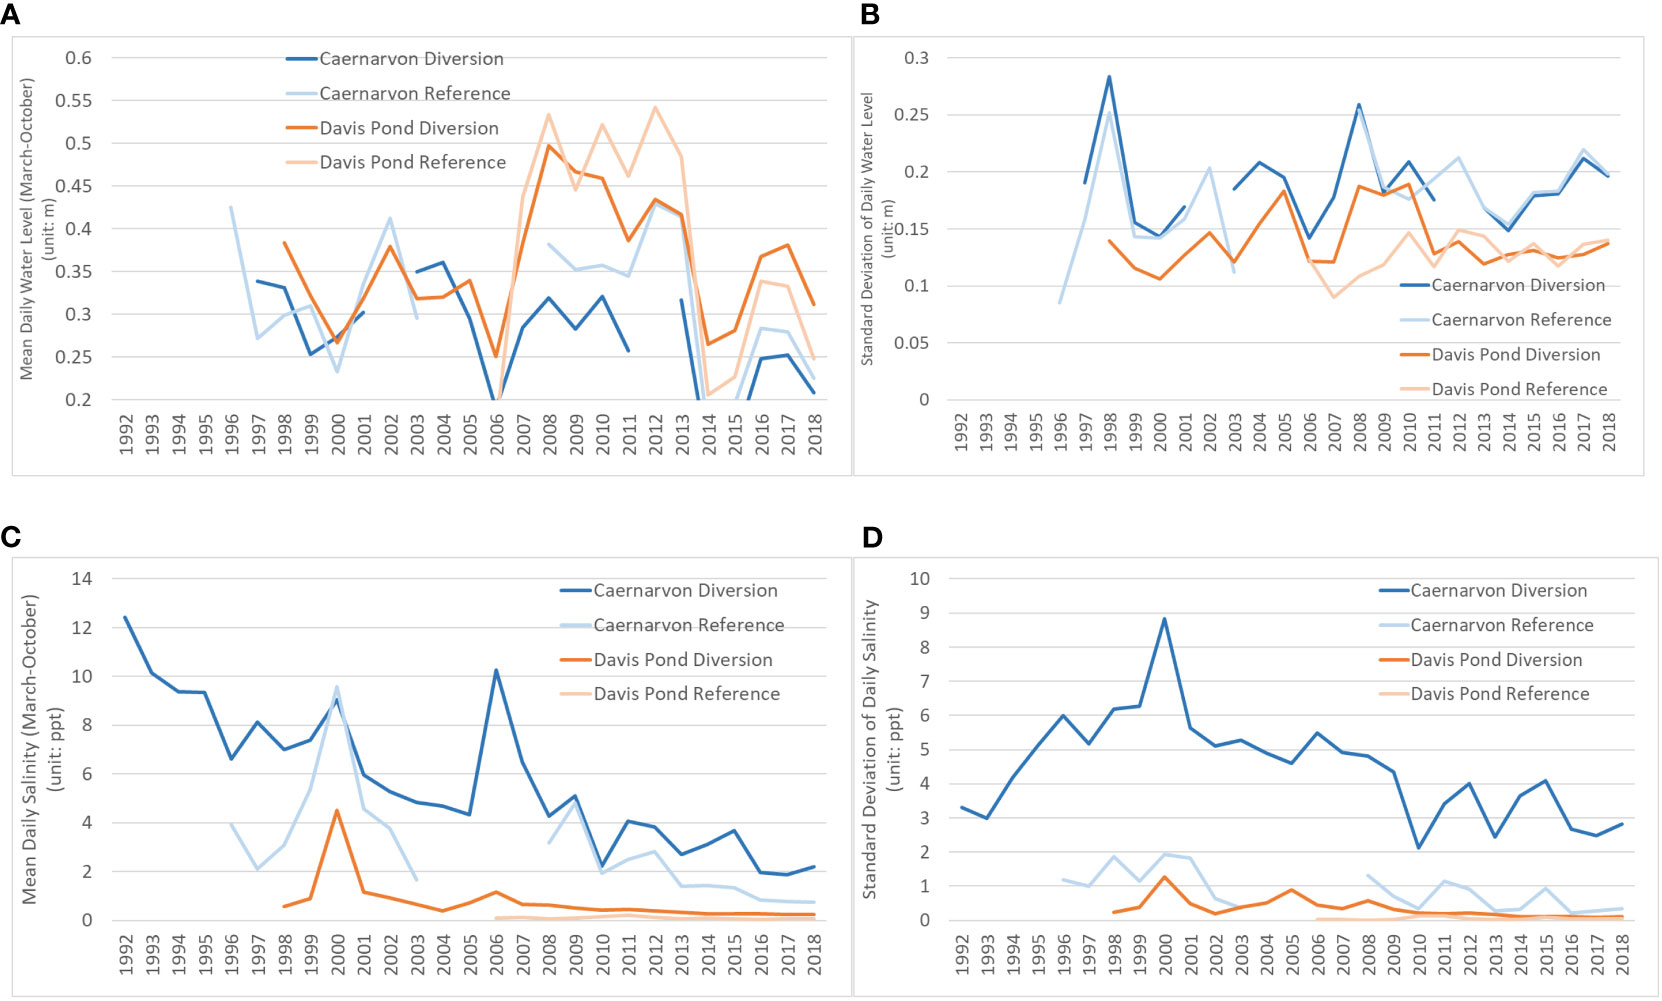
Figure 3 Time series of water level and salinity and their standard deviations. (A) Mean daily water level from March to October (unit: m), (B) Standard deviation of daily water level from March to October (unit: m), (C) Mean daily salinity from March to October (unit: ppt), and (D) Standard deviation of daily salinity from March to October (unit: ppt).
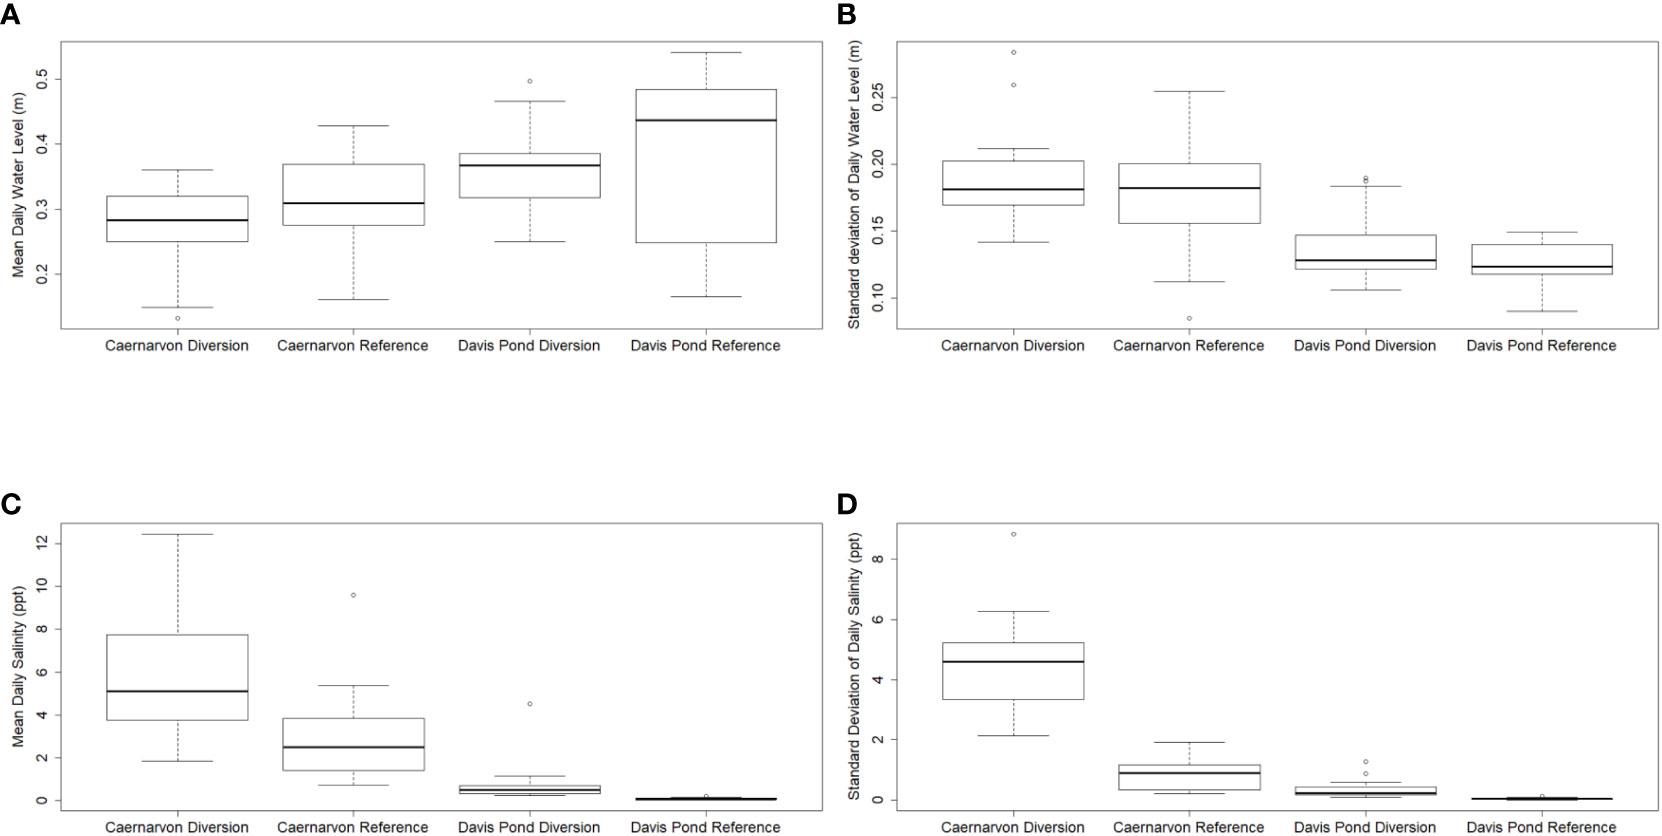
Figure 4 Box plots of water level and salinity and their standard deviations. (A) Mean daily water level from March to October (unit: m), (B) Standard deviation of daily water level from March to October (unit: m), (C) Mean daily salinity from March to October (unit: ppt), and (D) Standard deviation of daily salinity from March to October (unit: ppt).
Temporal trends of NDVI
NDVI values were greater at the Davis Pond diversion and reference sites with lower salinity than at the Caernarvon diversion and references sites with higher salinity (Figure 5). Comparing between the diversion and reference sites, NDVI values were significantly greater at the Davis Pond diversion site than at the reference site (p-value = 3.1×10⁻⁶), while there did not exist significant difference between the diversion and reference site for the Caernarvon diversion project (p-value = 0.34). From the Mann-Kendall trend test, NDVI increased significantly at the Caernarvon diversion site (p= 0.00073), but not at the reference site (p=0.73). NDVI increased marginally at the Davis Pond diversion site (p=0.085), and stayed similar at the reference site (p=0.54). The higher the NDVI, the higher the productivity and the more healthy the plants. Though increased NDVI does not indicate land gains, healthy plants will likely contribute to increased accretion and land gains in the long run.
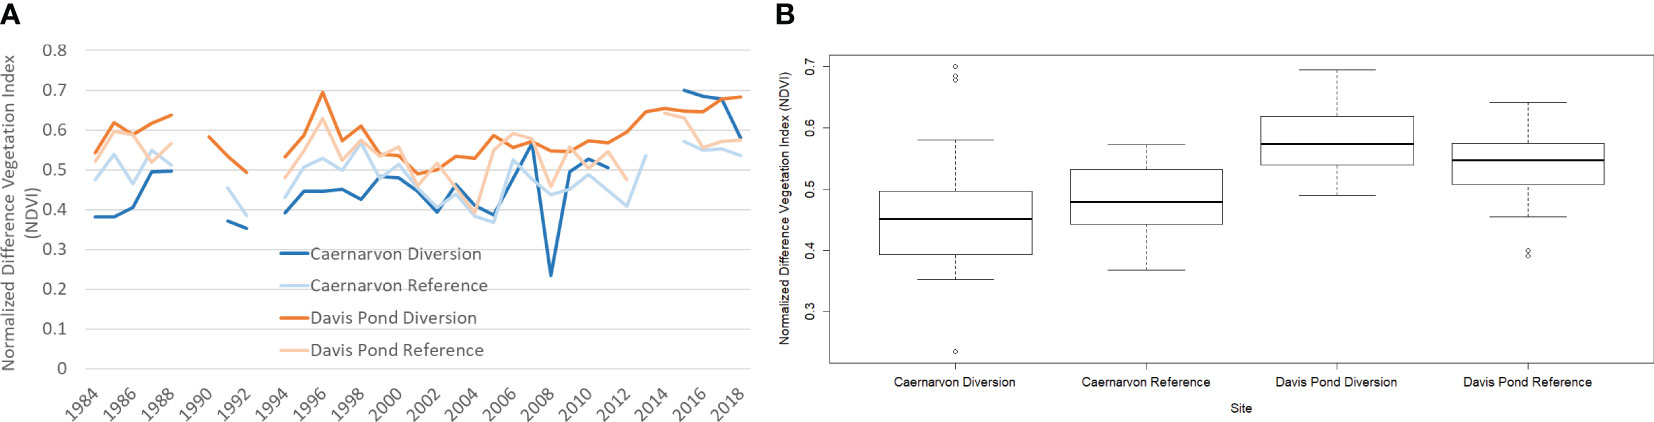
Figure 5 Landsat derived normalized difference vegetation index from 1984 to 2018 at Caernarvon diversion, reference sites and Davis Pond diversion and reference sites. (A) Time series of medians, and (B) Box plots of the time series of medians.
From the modeling results, we did not find a consistent response of NDVI to diversion between the Caernarvon diversion project and Davis Pond project. The best temporal model for Caernarvon diversion project included site variant intercept (γ0j) and site variant coefficient of years passed since diversion initiation(lapse of years) (γ1j) (Table S1; Figures 6A1, 6B1). The coefficient of squared lapse of year was a lumped parameter that did not differentiate between reference and diversion site (γ2) (Table S1; Figure 6C1). The best temporal model for Davis Pond project included site variant intercept (γ0j) (Table S1; Figure 6A2) while the coefficients for both lapse of years (γ1) and quadratic term (γ2) were lumped parameters (Table S1; Figures 6B2, 6C2). It is important to include the quadratic term to indicate nonlinear trend as the models that did not include it yielded higher DIC and PPL (Table S1). Since the parameters (γ2) for the quadratic term of lapse of years were positive (inferred by the positive 95% credible intervals of γ2 in Figure 6C) for both diversion projects, the general temporal trends of NDVI showed a nonlinear form with the existence of minimum NDVIs in time (Figure 6D).
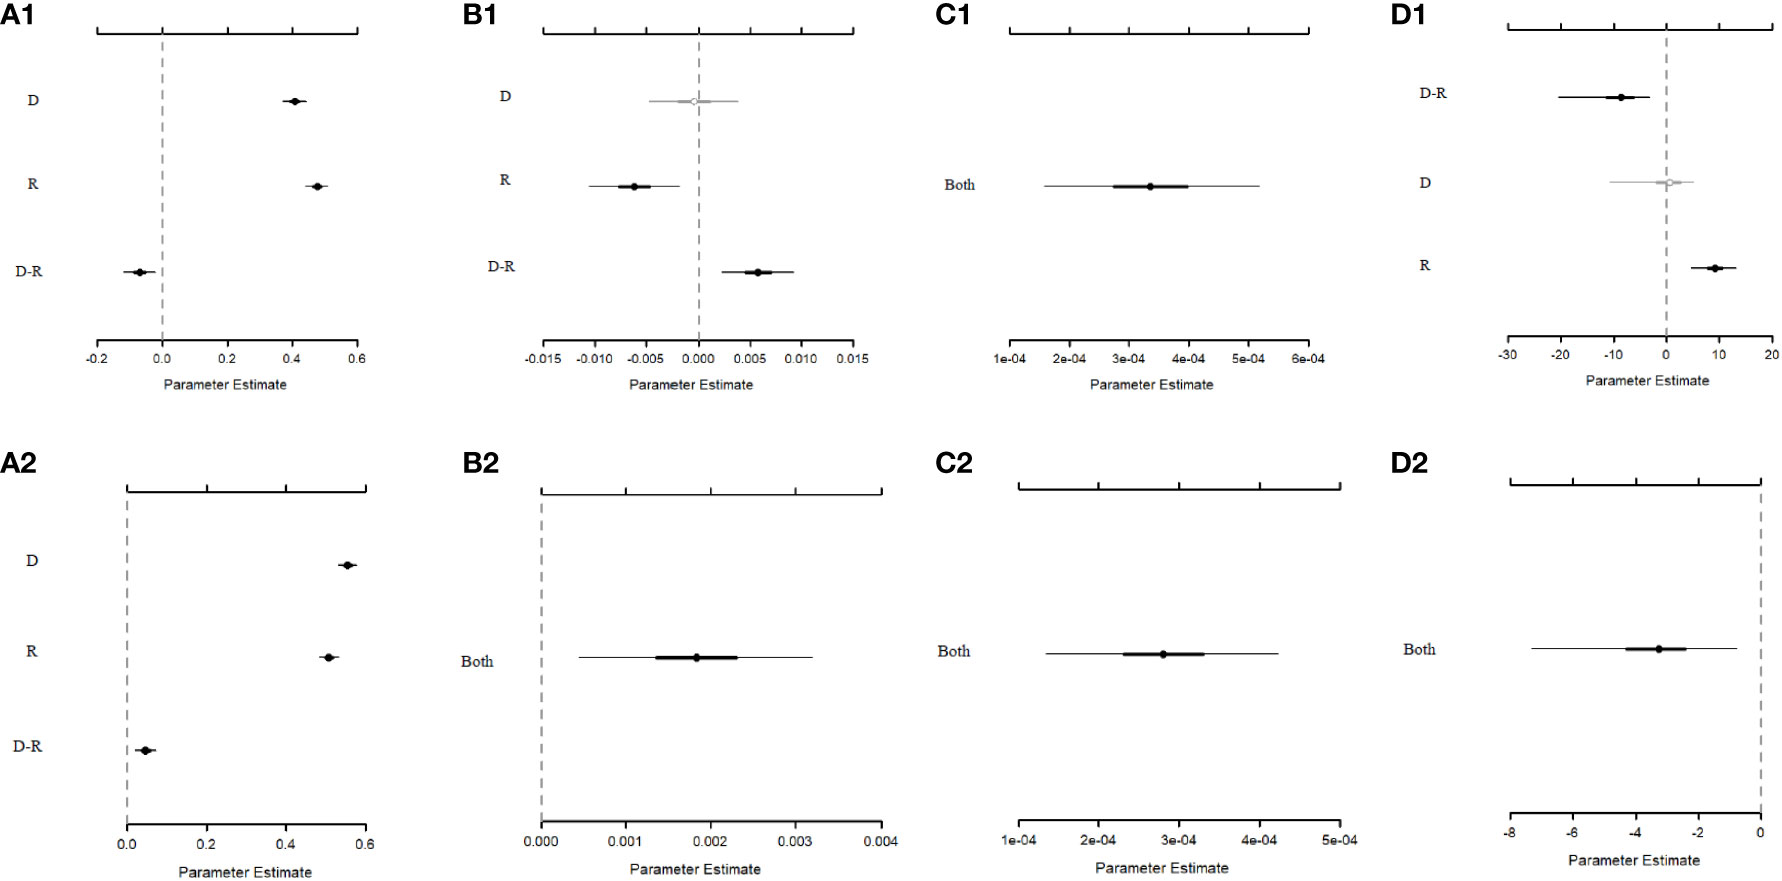
Figure 6 Credible intervals for the parameters (A) Intercept (γ0), (B) Coefficient for Y (γ1), (C) Coefficient for Y2 (γ2), and (D) Years passed since diversion initiated when minimum normalized difference vegetation index (NDVI) occurred (there existed minimum NDVI as the coefficient for Y2 was positive, calculated as ), in the best temporal trend models for Caernarvon diversion project (top), and Davis Pond diversion project (bottom). The labels for Y-axis: “D” denotes diversion site, “R” denotes reference site, “D-R” denotes difference of diversion and reference sites, and “Both” denotes the coefficient is a lumped variable that does not vary between reference site and diversion site. The thin line shows the 95% credible interval and the thick line shows the 50% credible interval. The dot represents median. The grey line with open dot indicates that both 50% and 95% credible intervals overlap zero, the grey line with grey dot indicates that 50% credible interval does not overlap zero while 95% credible interval does, and the black line with black dot indicates that both 50% and 95% credible intervals do not overlap zero and the parameter shows statistical significance. The dashed vertical line represents estimate of 0. Lines to its right represent positive estimates and lines to its left represent negative estimates. Plot generated using MCMCvis package in R (Youngflesh, 2018).
For the Caernarvon diversion project, the lapse of years for the minimum NDVI was not different from zero as both 95% and 50% credible intervals for it overlapped zero at the diversion site, while it was positive based on its positive 95% credible interval at the reference site (Figure 6D1). This indicated that the NDVI values dropped to the minimum when the diversion initiated at the diversion site but not at the reference site, therefore, diversion negatively affected vegetation at the very beginning of diversion. In more detail, the lapse of years with a minimum NDVI at the diversion site had a median of 0.7 year and 95% credible interval of -10.6 to 5.1 years, showing NDVI started the recovery trajectory up to 5 years since the diversion started. The lapse of years with a minimum NDVI at the reference site had a median of 9.2 years and 95% credible interval of 4.7 to 13.2 years. When we compared the lapse of years for the minimum NDVIs between diversion and reference site, there existed about 99.9% of probability that it was earlier at the diversion site than at the reference site.
For the Davis Pond diversion project, there was about 99.4% of probability that the minimum NDVI occurred before the diversion started at both diversion and reference sites (Figure 6D2). As such, freshwater diversion did not seem to negatively affect peak season vegetation biomass even at the beginning. As there was no difference of the coefficients for year and squared year in the best model, diversion did not seem to affect the temporal trends of NDVI for the Davis Pond project.
The impact of water level and salinity on NDVI
Both mean water level and mean salinity were included in the best models to predict NDVI for the two diversion projects (Tables S2, S3). For the Carnarvon diversion project, the impact of water level on NDVI differed between the diversion and reference site, while salinity’s impact did not show difference between the two sites. Both mean water level and mean salinity showed negative effect on NDVI. There was an about 95% probability that the effect of mean water level was more negative at the diversion site compared to the reference site (Figure 7). Focusing on the median impacts on NDVI at the diversion site, water level showed larger impact than salinity. At the reference site, water level and salinity showed similar impact.
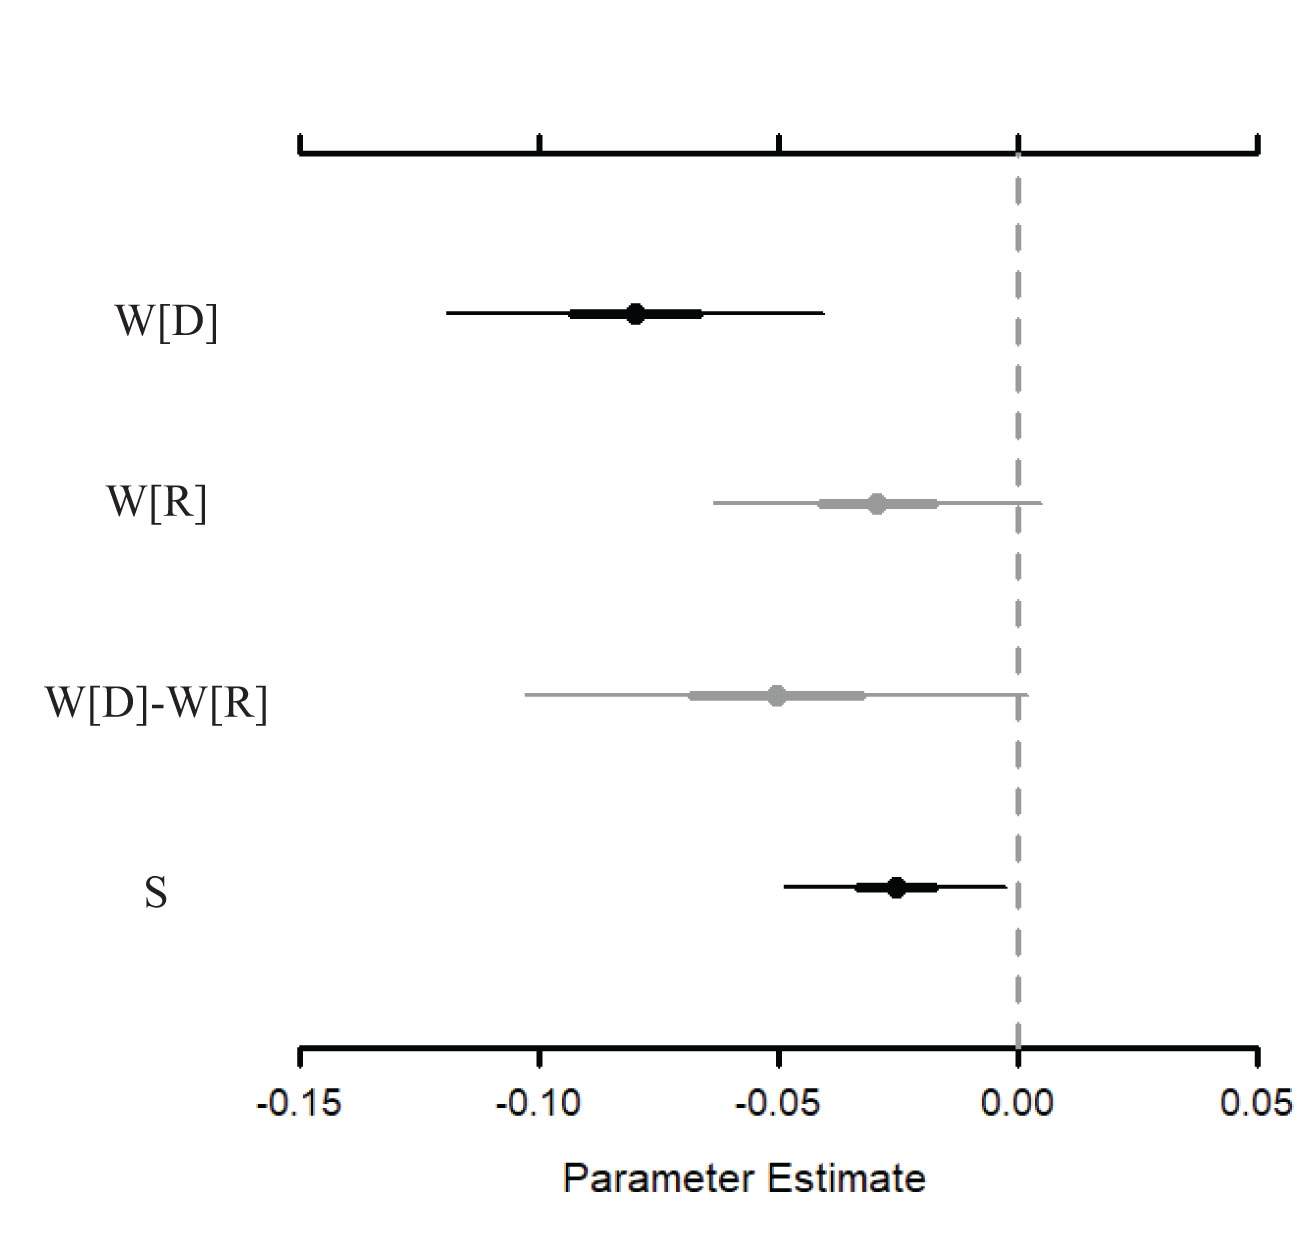
Figure 7 Credible intervals of the parameters for water level and salinity in the final model to evaluate the impact of environmental variables on NDVI for Caernarvon diversion project. [D] denotes diversion site, and [R] denotes reference site. S denotes mean of daily salinity, and W denotes mean of daily water level. If a particular parameter does not have brackets, this parameter does not differ between diversion and reference site. W[D]-W[R] denotes difference of the parameters for mean daily water level between diversion and reference site. The dot represents median. The thin line shows the 95% credible interval and the thick line shows the 50% credible interval. The grey line with open dot indicates that both 50% and 95% credible intervals overlap 0, the grey line with grey dot indicates that 50% credible interval does not overlap zero while 95% credible interval does, and the black line with black dot indicates that both 50% and 95% credible intervals do not overlap 0. Plot generated using MCMCvis package in R (Youngflesh, 2018).
Similarly, both mean daily water level and mean daily salinity were important to predict NDVI for the Davis Pond diversion project (Figure 8). Mean water level’s effect on NDVI did not differ between the diversion and reference site and it was negative. In contrast, mean salinity’s effect differed between the diversion and reference site. Different from the Caernarvon diversion project, salinity’s impact on NDVI showed parabolic relation, indicating a minimum NDVI at a certain salinity (median of 2.8 ppt and up to 4.7 ppt at the diversion site, and median of 0.15 ppt and up to 3.0 ppt at the reference site). The parabolic relation was not detected for water level as the inclusion of the quadratic term of water level did not improve model predictions (Table S3). Salinity’s impact was larger than the water level’s impact for the diversion site.
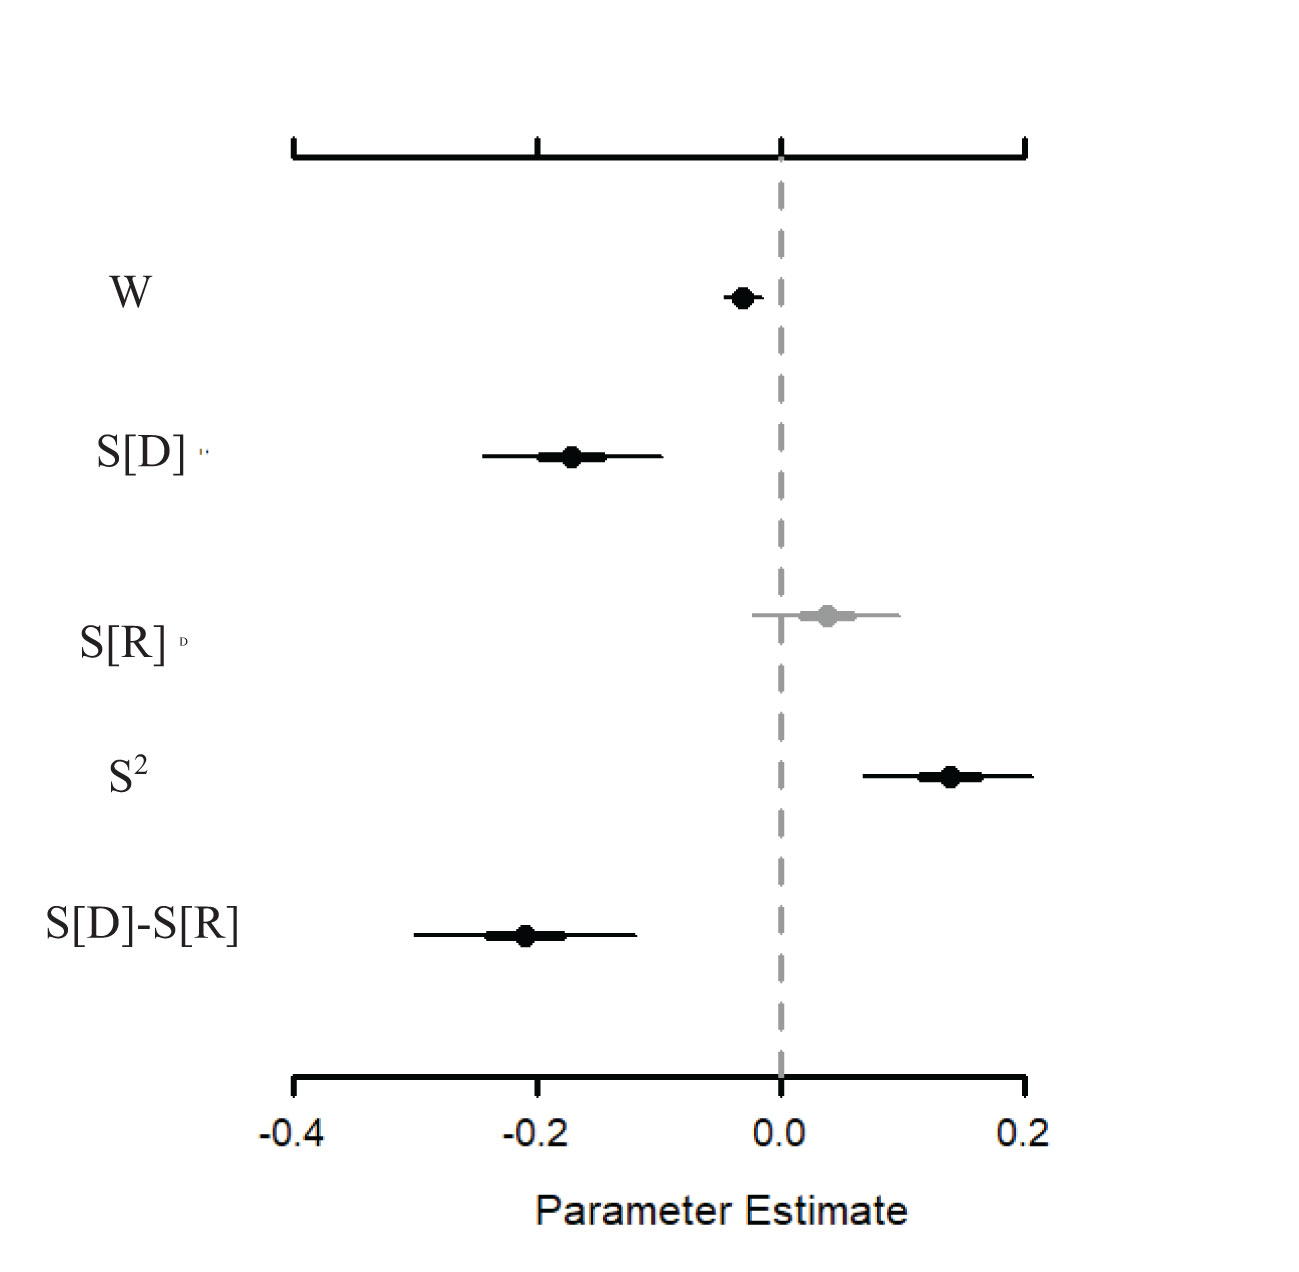
Figure 8 Credible intervals of the parameters for water level and salinity in the final model to evaluate the impact of environmental variables on NDVI for Davis Pond diversion project. S denotes mean daily salinity, and W denotes mean daily water level. [D] denotes diversion site, and [R] denotes reference site. If a particular parameter does not have brackets, this parameter does not differ between diversion and reference site. S[D]-S[R] denotes difference of the parameters for mean daily salinity between diversion and reference site. The dot represents median. The thin line shows the 95% credible interval and the thick line shows the 50% credible interval. The grey line with open dot indicates that both 50% and 95% credible intervals overlap 0, the grey line with grey dot indicates that 50% credible interval does not overlap 0 while 95% credible interval does, and the black line with black dot indicates that both 50% and 95% credible intervals do not overlap 0. Plot generated using MCMCvis package in R (Youngflesh, 2018).
Discussion
We developed a multi-level modeling framework to integrate existing data to evaluate the impact of freshwater diversion on vegetation productivity approximated by NDVI in peak biomass season (August to October) with a focus on NDVI’s temporal trend and NDVI’s response to salinity and water level. The study was not about wetland areal gains or losses, instead we focused on gaining some insights on the mechanisms of vegetation dynamics, which can help improve understanding on land dynamics. Wetland restoration involves many other aspects and functions that cannot easily be detected using remote sensing images, such as soil processes, belowground biomass, biogeochemical cycle, and microbial composition. However, in terms of wetland restoration, vegetation productivity can serve as indicators of other wetland functions, which generally occur at a more lagged time scale (Suir and Sasser, 2017).
The varying results for different diversion projects pinpoint both the need to evaluate these projects separately, and the difficulty in generalizing the efficacy of diversion projects. Both water level and salinity were important to predict NDVI, however, water level’s impact for the Caernarvon project differed between the diversion and reference site with the larger negative impact at the diversion site (based on the medians of the posteriors), while it did not vary between the two sites for the Davis Pond project. The opposite is the case for the salinity’s impact. Water level and salinity’s impacts differed in magnitude, driven by diversion attributes, biogeophysical conditions, and vegetation of the sites. Higher water level decreased NDVI, consistent with lower end-of-season biomass of Spartina alterniflora and Spartina patens with increased inundation (Snedden et al., 2015). The impact of salinity on vegetation was greater than that of water level at the lower salinity location (Davis pond sites), consistent with the previous research that shows salinity is the most important abiotic factor in determining coastal wetland habitat types (White and Kaplan, 2017; Lin et al., 2018). On the other hand, the impact of water level was greater at the higher salinity location (e.g. Caernarvon diversion site). Furthermore, salinity’s impact on NDVI showed different functional forms. NDVI monotonically declined with salinity for the Caernarvon diversion project, while the relation between NDVI and salinity was parabolic for the Davis Pond diversion project. The different functional forms either represent a declining (improving) vegetation condition with higher (lower) salinity (DeLaune et al., 2005; Snedden et al., 2015) or vegetation community shift driven by salinity (White and Kaplan, 2017). This was observed at the Caernarvon Site which experienced a shift from brackish and intermediate vegetation types between the 1940s and the early 2000s (O’Neil, 1951; Chabreck et al., 1968; Chabreck and Linscombe, 1997; Linscombe and Chabreck, 2001) to freshwater vegetation in 2007 and 2013 (Sasser et al., 2008; Sasser et al., 2014).
Lower salinity and higher water levels are generally accompanied by freshwater diversions. Though salinity was higher at the diversion sites than at the reference sites for both projects (Figures 2, 3), due to their proximity to the ocean, the reduced salinity due to diversion can benefit vegetation. The freshwater flow into these areas is expected to nourish and enhance the marsh vegetation that is going through salinity-induced stress (Metzger, 2007). Lower salinity could also lead to shifts in vegetation communities from salt tolerant communities to freshwater marshes. One study showed vegetation production increased as salinity decreased within coastal wetlands (Stagg et al., 2016). On the other hand, higher water levels had negative impacts on vegetation. In our study, the temporal increase of NDVI at the Caernarvon diversion site can be explained by the lower salinity driven by diversion. The quadratic relation between salinity and NDVI at the Davis Pond diversion project led to only marginal increase at the diversion site.
The combined effects of inundation and salinity involved large uncertainties, as evident in the posteriors (Figures 6–8), and noticed in the previous studies (e.g. Snedden et al., 2015; Brown et al., 2019; Elsey-Quirk et al., 2019). The large uncertainties summarized in our Bayesian analysis, lacking in many other studies that mainly focus on mean response, may partially explain the mixed results on the previous evaluation of freshwater diversion projects (Metzger, 2007; Kearney et al., 2011; CPRA, 2012; Day et al., 2014; Day et al., 2016a; Rutherford et al., 2018; Brown et al., 2019; Turner et al., 2019; Hardy and Wu, 2021; White et al., 2023). The different results are potentially due to differences in assessment methods, data, and data quality (remote sensing, field measurements, permanent change data), differences in receiving areas and conditions (e.g., proximity to river source, fetch, depth), and differences in diversion operation methods (i.e., diversion volume, timing, frequency) (Snedden et al., 2007; Day et al., 2009). Day et al. (2016b) showed that large and infrequent river diversions were more effective to restore Mississippi Delta and limit displacement of fisheries, water quality problems and wetland deterioration due to overloading of nutrients, compared to small and frequent river diversions. Our study is consistent with this finding. Caernarvon and Davis Pond diversion projects fall into the infrequent river diversions. Due to the infrequent diversions, water levels got controlled (not different from the reference sites), and therefore the potential negative impact due to higher water level was small. Other ecosystem models exist to predict vegetation productivity related to coastal wetland restoration. The primary productivity model in SEDLIB only accounts for local water depth (Brown et al., 2019), while Louisiana vegetation biomass model (LAVegMod) accounts for the effect of inundation, salinity, nutrients, and temperature (Visser et al., 2017; Baustian et al., 2018). However, none of the previous models predicted the uncertainties of the functions between vegetation productivity and abiotic factors, as done in this study. The uncertainty information derived from this study can be factored into these ecosystem models to improve the predictions of land gains/losses with uncertainties accounted for.
Nutrient and sediment change related to freshwater diversions are important to impact vegetation productivity and land gains/loss (Day et al., 2013; White et al., 2023), however, our study did not account for them due to lack of available data. Hollis and Turner (2019) and Turner (2011) showed significant decline in root strength or soil strength after small increases in nutrient availability. High nutrient did not necessarily lead to decreased belowground production though (Anisfeld and Hill, 2012; Fox et al., 2012; Day et al., 2013). Based on the review by Elsey-Quirk et al. (2019), larger sediment availability is necessary to offset the negative impact from the larger variability of environmental factors or excessive nutrients driven by freshwater diversions. On the other hand, greenhouse studies showed that biomass production of Spartina patens increased with nitrogen addition, with more increase in lower salinity than in higher salinity (DeLaune et al., 2005). A greenhouse study conducted at Breton Sound influenced by river water from the Caernarvon diversion showed that 36% of added nitrate was assimilated in the above- and belowground macrophytes, while the majority was removed from gaseous loss by denitrification (VanZomeren et al., 2012; White et al., 2019).
Adding sediment could raise marsh surface, increase aboveground biomass and number of regenerating shoots of Spartina alterniflora (DeLaune et al., 1990). The actual freshwater or sediment diverted for both Davis Pond and Carnarvon projects was less than the capacity designed. How and where the sediment will settle related to freshwater diversion will affect wetland gain or loss spatially. Our model does not only lack data, but also lacks the spatial scales needed to address that question. Other research has shown freshwater diversions are more effective if fine sediment transport in the system (many rivers have experienced long-term reductions) is restored (Kemp et al., 2016; Day et al., 2019). Thus, nutrients and sediment loading data should be collected and accounted for in future evaluations of the impacts of diversion projects on coastal wetlands. Other potential abiotic factors that need to be accounted for include redox potential and sulfide concentration that can affect vegetation growth (DeLaune et al., 1983; Twilley et al., 2019).
This study is not the first one to utilize remote sensing data to evaluate the impact of freshwater diversions on coastal wetlands in Louisiana. Metzger (2007) applied Landsat images to evaluate wetland gains and loss until 2005 for the Caernarvon project. Our study expanded temporal and spatial coverages by including two diversion projects and the analysis was conducted until 2018. As the impact of freshwater diversions tends to be long term, the inclusion of longer-term data is necessary. Another remote sensing-based study (White et al., 2023) showed land gains in the Davis Pond diversion outfall area but not at the Caernarvon diversion outfall area. Our study showed a significant increase of NDVI at the Caernarvon diversion site and a marginal increase at the Davis Pond diversion site. Meanwhile, NDVI at the reference sites of the diversion projects did not change significantly. The increase of NDVI, approximating increased primary productivity, will likely contribute to increased sediment accretion that can lead to land gains.
There are many vegetation indices in the remote sensing literature. Potentially we can compare them to select the one that best indicated vegetation productivity as in Wu et al. (2018). However, lack of spatial data of vegetation productivity presents a barrier for this comparison and analysis of multiple vegetation indices is beyond the scope of this study that focused on evaluating how Bayesian models can facilitate the evaluation of freshwater diversions on wetland vegetation temporally by accounting for the drivers of salinity and inundation.
Conclusion
There existed differences between the two diversion projects in NDVI’s temporal trends and how water levels and salinity impacted NDVI. Based on the NDVI alone, they increased or marginally increased over time at the diversion sites but not at the reference sites for both diversion projects. These indicated that freshwater diversions helped increase vegetation productivity. Both mean salinity and mean water level were consistently included in the NDVI models as important predictors.
This study provides a Bayesian modeling framework that can help evaluate freshwater diversion projects with uncertainty accounted for with a focus on the impact to vegetation. It also shows the importance of investigating the impact of both water level and salinity on vegetation in addition to the temporal trend analysis. The inclusion of these abiotic factors aids in gaining a better understanding of vegetative response to freshwater diversions, and therefore contributes to improved prediction on land change and more-informed coastal wetland restoration decisions in the future.
Data availability statement
The original contributions presented in the study are included in the article/Supplementary Material. Further inquiries can be directed to the corresponding author.
Author contributions
Material preparation, data collection and analysis were performed by WW (Bayesian models), EG (preliminary Bayesian models and abiotic data compilation), and GS (remote sensing image analysis). The first draft of the manuscript was written by WW, and all authors commented on previous versions of the manuscript. All authors contributed to the article and approved the submitted version.
Funding
This work was supported by the fund from the U.S. Army Engineer Research and Development Center through the agreement of Gulf Coast Cooperative Ecosystem Studies Unit with the award number of W912HZ-19-2-0012.
Acknowledgments
We are grateful for the valuable review comments provided by Molly Reif at the U.S. Army Engineer Research and Development Center and two reviewers. We would like to thank Coastwide Reference Monitoring System funded by Coastal Wetlands Planning, Protection, and Restoration Act, The National Aeronautics and Space Administration, and Google Earth Engine, which made environmental data and remote sensing images available for this study.
Conflict of interest
The authors declare that the research was conducted in the absence of any commercial or financial relationships that could be construed as a potential conflict of interest.
Publisher’s note
All claims expressed in this article are solely those of the authors and do not necessarily represent those of their affiliated organizations, or those of the publisher, the editors and the reviewers. Any product that may be evaluated in this article, or claim that may be made by its manufacturer, is not guaranteed or endorsed by the publisher.
Supplementary material
The Supplementary Material for this article can be found online at: https://www.frontiersin.org/articles/10.3389/fmars.2023.1202300/full#supplementary-material
References
Allen Y. C., Suir G. M. (2014). Using high-resolution, regional-scale data to characterize floating aquatic nuisance vegetation in coastal Louisiana navigation channels (Vicksburg, MS, US: Army Corps of Engineers Engineer Research and Development Center).
Allison M. A., Meselhe E. A. (2010). The use of large water and sediment diversions in the lower Mississippi River (Louisiana) for coastal restoration. J. Hydrol. 387 (3–4), 346–360. doi: 10.1016/j.jhydrol.2010.04.001
An N., Price K. P., Blair J. M. (2013). Estimating above-ground net primary productivity of the tallgrass prairie ecosystem of the Central Great Plains using AVHRR NDVI. Int. J. Remote Sens. 34 (11), 3717–3735. doi: 10.1080/01431161.2012.757376
Anisfeld S. C., Hill T. D. (2012). Fertilization effects on elevation change and belowground carbon balance in a long Island sound tidal marsh. Estuaries Coasts. 35, 201–211. doi: 10.1007/s12237-011-9440-4
Baustian M. M., Meselhe E., Jung H., Sadid K., Duke-Sylvester S. M., Visser J. M., et al. (2018). Development of an Integrated Biophysical Model to represent morphological and ecological processes in a changing deltaic and coastal ecosystem. Environ. Model. Softw. 109, 402–419. doi: 10.1016/j.envsoft.2018.05.019
Brock M. A., Britton D. L. (1995). The role of seed banks in the revegetation of Australian temporary wetlands. In Wheeler B., Shaw S., Fojt W., Robertson A. (eds), The Restoration of Temperate Wetlands. Wiley, Chichester, 183–188.
Brown G. L., McAlpin J. N., Pevey K. C., Luong P. V., Price C. R., Kleiss B. A. (2019). Mississippi River hydrodynamic and delta management study: Delta management modeling. AdH/SEDLIB multi-dimensional model validation and scenario analysis report (Vicksburg, MS, US: Engineer Research and Development Center).
Calder C., Lavine M., Müller P., Clark J. S. (2003). Incorporating multiple sources of stochasticity into dynamic population models. Ecology 84 (6), 1395–1402. doi: 10.1890/0012-9658(2003)084[1395:IMSOSI]2.0.CO;2
Carle M. (2013). Spatial structure and dynamics of the plant communities in a pro-grading river delta: Wax Lake Delta, Atchafalaya Bay, Louisiana. (Baton Rouge, LA, US: PhD dissertation, Louisiana State University).
Chabreck R. H., Linscombe G. (1997). Vegetative type map of the Louisiana coastal marshes (Baton Rouge: Louisiana Department of Wildlife and Fisheries).
Chabreck R. H., Palmisano A. W., Joan T. (1968). Vegetative type map of the Louisiana coastal marshes (Baton Rouge: Louisiana Department of Wildlife and Fisheries).
Chander G., Markham B. L., Helder D. L. (2009). Summary of current radiometric calibration coefficients for Landsat MSS, TM, ETM+, and EO-1 ALI sensors. Remote Sens. Environ. 113 (5), 893–903. doi: 10.1016/j.rse.2009.01.007
Clark J. S. (2004). Why environmental scientists are becoming Bayesians: Modelling with Bayes. Ecol. Lett. 8 (1), 2–14. doi: 10.1111/j.1461-0248.2004.00702.x
Costanza R., d’Arge R., de Groot R., Farber S., Grasso M., Hannon B., et al. (1997). The value of the world’s ecosystem services and natural capital. Nature 387 (6630), 253–260. doi: 10.1038/387253a0
Couvillion B. R., Steyer G. D., Wang H., Beck H. J., Rybczyk J. M. (2013). Forecasting the effects of coastal protection and restoration projects on wetland morphology in coastal Louisiana under multiple environmental uncertainty scenarios. J. Coast. Res. 67, 29–50. doi: 10.2112/SI_67_3
CPRA (2012). Louisiana’s comprehensive master plan for a sustainable coast. Available at: https://issuu.com/coastalmasterplan/docs/coastal_master_plan-v2?e=3722998/2447530.
CPRA (2017) Louisiana’s Comprehensive Master Plan for a Sustainable Coast. Available at: https://coastal.la.gov/wp-content/uploads/2017/04/2017-Coastal-Master-Plan_Web-Single-Page_CFinal-with-Effective-Date-06092017.pdf.
CPRA (Coastal Protection and Restoration Authority of Louisiana) (2019) Coastwide reference monitoring system-wetlands monitoring data. Retrieved from coastal information management system (CIMS) database. Available at: https://lacoast.gov/crms/.
Day J. W., Boesch D. F., Clairain E. J., Kemp G. P., Laska S. B., Mitsch W. J., et al. (2007). Restoration of the Mississippi Delta: lessons from hurricanes Katrina and Rita. Science 315, 1679–1684. doi: 10.1126/science.1137030
Day J. W., Cable J. E., Cowan J. H., Delaune R., De Mutsert K., Fry B., et al. (2009). The impacts of pulsed reintroduction of river water on a Mississippi delta coastal basin. J. Coast. Res. (54), 225–243. doi: 10.2112/SI54-015.1
Day J. W., Cable J. E., Lane R. R., Kemp G. P. (2016a). Sediment deposition at the Caernarvon Crevasse during the Great Mississippi Flood of 1927: Implications for coastal restoration. Water 8 (2), 38. doi: 10.3390/w8020038
Day J. W., Hunter R. G., Lane R. R., Shaffer G. P., Day J. N. (2019). Long-term assimilation wetlands in coastal Louisiana: Review of monitoring data and management. Ecol. Eng. 137, 7–20. doi: 10.1016/j.ecoleng.2018.09.019
Day J. W., Kemp G. P., Freeman A. M., Muth D. P. (2014). “Introduction: Perspectives on the Restoration of the Mississippi Delta,” in Perspectives on the Restoration of the Mississippi Delta: The Once and Future Delta. Eds. Day J. W., Kemp G. P., Freeman A. M., Muth D. P. (Springer Science+Business Media Dordrecht), 1–7. doi: 10.1007/978-94-017-8733-8_1
Day J. W., Lane R. R., D’Elia C. F., Wiegman A. R. H., Rutherford J. S., Shaffer G. P., et al. (2016b). Large infrequently operated river diversions for Mississippi delta restoration. Estuar. Coast. Shelf Sci. 183, 292–303. doi: 10.1016/j.ecss.2016.05.001
Day J. W., Lane R., Moerschbaecher M., DeLaune R., Mendelssohn I., Baustian J., et al. (2013). Vegetation and soil dynamics of a Louisiana estuary receiving pulsed Mississippi River water following Hurricane Katrina. Estuaries Coasts 36, 1–18. doi: 10.1007/s12237-012-9581-0
DeLaune R. D., Jugsujinda A., Peterson G. W., Patrick W. H. (2003). Impact of Mississippi River freshwater reintroduction on enhancing marsh accretionary processes in a Louisiana estuary. Estuar. Coast. Shelf Sci. 58, 653–662. doi: 10.1016/S0272-7714(03)00177-X
DeLaune R. D., Kongchum M., White J. R., Jugsujinda A. (2013). Freshwater diversions as an ecosystem management tool for maintaining soil organic matter accretion in coastal marshes. Catena 107, 139–144. doi: 10.1016/j.catena.2013.02.012
DeLaune R. D., Pezeshki S. R., Jugsujinda A. (2005). Impact of Mississippi River freshwater reintroduction on Spartina patens marshes: Responses to nutrient input and lowering of salinity. Wetlands 25, 155–161. doi: 10.1672/0277-5212(2005)025[0155:IOMRFR]2.0.CO;2
DeLaune R. D., Pezeshki S. R., Pardue J. H., Whitcomb J. H., Patrick W. H. (1990). Some influences of sediment addition to a deteriorating salt marsh in the Mississippi river deltaic plain: a pilot study. J. Coast. Res. 6, 181–188.
DeLaune R. D., Smith C. J., Patrick J. W.H. (1983). Relationship of marsh elevation, redox potential and sulfide to Spartina alterniflora productivity. Soil Sci. Soc Am. J. 47, 930–935. doi: 10.2136/sssaj1983.03615995004700050018x
Elsey-Quirk T., Graham S. A., Mendelssohn I. A., Snedden G., Day J. W., Twilley R. R., et al. (2019). Mississippi river sediment diversions and coastal wetland sustainability: Synthesis of responses to freshwater, sediment, and nutrient inputs. Estuarine Coast. Shelf Sci. 221, 170–183. doi: 10.1016/j.ecss.2019.03.002
Engle V. D. (2011). Estimating the provision of ecosystem services by Gulf of Mexico coastal wetlands. Wetlands 31 (1), 179–193. doi: 10.1007/s13157-010-0132-9
Forbes M. G., Alexander H. D., Dunton K. H. (2008). Effects of pulsed riverine versus non-pulsed wastewater inputs of freshwater on plant community structure in a semi-arid salt marsh. Wetlands 28 (4), 984–994. doi: 10.1672/07-127.1
Fox L., Valiela I., Kinney E. L. (2012). Vegetation cover and elevation in long-term experimental nutrient-enrichment plots in great sippewissett salt marsh, cape cod, massachusetts: implications for eutrophication and sea level rise. Estuaries Coasts 35, 445–458. doi: 10.1007/s12237-012-9479-x
Fox J., Weisberg S. (2019). An R Companion to Applied Regression. 3rd ed (Thousand Oaks, CA: SAGE). Available at: https://socialsciences.mcmaster.ca/jfox/Books/Companion/.
Frazier P. S., Page K. J. (2000). Water body detection and delineation with Landsat TM data. Photogram. Eng. Remote Sens. 66 (12), 1461–1468.
Hardy T., Wu W. (2021). Impact of different restoration methods on coastal wetland loss in Louisiana: Bayesian analysis. Environ. Monit. Assess. 193 (1), 1. doi: 10.1007/s10661-020-08746-9
He K., Li W., Zhang Y., Sun G., McNulty S. G., Flanagan N. E., et al. (2023). Identifying driving hydrogeomorphic factors of coastal wetland downgrading using random forest classification models. Sci. Total Environ. 894, 164995. doi: 10.1016/j.scitotenv.2023.164995
Hollis L. O., Turner R. E. (2019). The tensile root strength ofSpartina patens:response to atrazine exposure and nutrient addition. Wetlands. doi: 10.1007/s13157-019-01126-1
Hooten M. B., Hobbs N. T. (2015). A guide to Bayesian model selection for ecologists. Ecol. Monogr. 85 (1), 3–28. doi: 10.1890/14-0661.1
Jenkins J. A., Olivier H. M., Draugelis-Dale R. O., Kaller M. D. (2011). Davis Pond freshwater diversion biomonitoring—prediversion and postdiversion freshwater fish data: U.S. Geological Survey Data Series 604. Revised 2012. (Reston, Virginia).
Kalnay E., Kanamitsu M., Kistler R., Collins W., Deaven D., Gandin L., et al. (1996). The NCEP/NCAR 40-year reanalysis project. Bull. Am. Meteorol. Soc. 77 (3), 437–472. doi: 10.1175/1520-0477(1996)077<0437:TNYRP>2.0.CO;2
Kearney M. S., Riter J. C. A., Turner R. E. (2011). Freshwater river diversions for marsh restoration in Louisiana: Twenty-six years of changing vegetative cover and marsh area. Geophys. Res. Lett. 38 (16), L16405. doi: 10.1029/2011GL047847
Kemp G. P., Day J. W., Rogers J. D., Giosan L., Peyronnin N. (2016). Enhancing mud supply from the Lower Missouri River to the Mississippi River Delta USA: Dam bypassing and coastal restoration. Estuarine Coast. Shelf Sci. 183, 304–313. doi: 10.1016/j.ecss.2016.07.008
Kenney M. A., Hobbs B. F., Mohrig D., Huang H., Nittrouer J. A., Kim W., et al. (2013). Cost analysis of water and sediment diversions to optimize land building in the Mississippi River delta: Cost analysis to optimize Mississippi Delta land building. Water Resour. Res. 49 (6), 3388–3405. doi: 10.1002/wrcr.20139
Keogh M. E., Kolker A. S., Snedden G. A., Renfro A. A. (2019). Hydrodynamic controls on sediment retention in an emerging diversion-fed delta. Geomorphology 332, 100–111. doi: 10.1016/j.geomorph.2019.02.008
Kirwan M. L., Guntenspergen G. R., D’Alpaos A., Morris J. T., Mudd S. M., Temmerman S. (2010). Limits on the adaptability of coastal marshes to rising sea level. Geophys. Res. Lett. 37 (23), L23401. doi: 10.1029/2010GL045489
Kral F., Corstanje R., White J. R., Veronesi F. (2012). A geostatistical analysis of soil properties in the Davis Pond Mississippi freshwater diversion. Soil Sci. Soc. America J. 76 (3), 1107–1118. doi: 10.2136/sssaj2011.0206
Lacoul P., Freedman B. (2006a). Environmental influences on aquatic plants in freshwater ecosystems. Environ. Rev. 14 (2), 89–136. doi: 10.1139/a06-001
Lacoul P., Freedman B. (2006b). Relationships between aquatic plants and environmental factors along a steep Himalayan altitudinal gradient. Aquat. Bot. 84 (1), 3–16. doi: 10.1016/j.aquabot.2005.06.011
Lai X., Jiang J., Huang Q. (2013). Effects of the normal operation of the Three Gorges Reservoir on wetland inundation in Dongting Lake, China: A modelling study. Hydrol. Sci. J. 58 (7), 1467–1477. doi: 10.1080/02626667.2013.831418
Lambert P. C., Sutton A. J., Burton P. R., Abrams K. R., Jones D. R. (2005). How vague is vague? A simulation study of the impact of the use of vague prior distributions in MCMC using WinBUGS. Stat Med. 24 (15), 2401–2428. doi: 10.1002/sim.2112
Lane R. R., Day J. W., Day J. N. (2006). Wetland surface elevation, vertical accretion, and subsidence at three Louisiana estuaries receiving diverted Mississippi River water. Wetlands 26, 1130–1142. doi: 10.1672/0277-5212(2006)26[1130:WSEVAA]2.0.CO;2
Lane R. A., Kay A. L. (2021). Climate change impact on the magnitude and timing of hydrological extremes across great britain. Front. Water 3. doi: 10.3389/frwa.2021.684982
Lavers D. A., Ralph F. M., Waliser D. E., Gershunov A., Dettinger M. D. (2015). Climate change intensification of horizontal water vapor transport in CMIP5. Geophys. Res. Lett. 42, 5617–5625. doi: 10.1002/2015GL064672
Lin Y., Yu J., Cai J., Sneeuw N., Li F. (2018). Spatio-temporal analysis of wetland changes using a kernel extreme learning machine approach. Remote Sens. 10 (7), 1129. doi: 10.3390/rs10071129
Linscombe R., Chabreck R. (2001). Coastwide aerial survey, brown marsh 2001 assessment: Salt marsh dieback in Louisiana-Brown marsh data information management system, Vol. 8, Task III. Available at: https://lacoast.gov/new/ed/articles/brownmarsh.aspx.
Lopez J., Henkel T., Moshogianis A., Baker A., Boyd E., Hillmann E., et al. (2014). Examination of deltaic processes of Mississippi River outlets-Caernarvon Delta and Bohemia Spillway in Southeast Louisiana. GCAGS J. (3), p. 79–93.
Metzger M. G. (2007). Assessing the Effectiveness of Louisiana’ s Freshwater Diversion Projects Using Remote Sensing (New Orleans, LA, US: Thesis, University of New Orleans). Available at: https://scholarworks.uno.edu/td/633/.
Morris J. T., Sundareshwar P. V., Nietch C. T., Kjerfve B., Cahoon R. ,. D. (2002). Responses of coastal wetlands to rising sea level. Ecology 10, 2869–2877). doi: 10.1890/0012-9658(2002)083[2869:ROCWTR]2.0.CO;2
O’Neil T. (1951). The muskrat in the Louisiana coastal marshes: A study of the ecological, geological, biological, tidal and climatic factors governing the production and management of the muskrat industry in Louisiana (New Orleans, LA, US: Federal Aid Section, Fish and Game Division, Louisiana Department of Wild Life and Fisheries).
Pahl J. W., Freeman A. M., Raynie R. C., Day J. (2020). Response of the coastal systems to freshwater input with emphasis on Mississippi River deltaic plain river diversions: Synthesis of the state of the science. Estuar. Coast. Shelf Sci. 243, 106866. doi: 10.1016/j.ecss.2020.106866
Peyronnin N. S., Caffey R. H., Cowan J. H., Justic D., Kolker A. S., Laska S. B., et al. (2017). Optimizing sediment diversion operations: Working group recommendations for integrating complex ecological and social landscape interactions. Water (Switzerland) 9 (6), 368. doi: 10.3390/w9060368
Plitsch E. M. (2014). 2013 operations, maintenance and monitoring report (Coastal Protection and Restoration Authority of Louisiana).
Plitsch E. M. (2018). 2017 operations, maintenance, and monitoring report for Davis Pond freshwater diversion (BA-01) (Baton Rouge, LA, US: Coastal Protection and Restoration Authority of Louisiana).
Plummer M. (2017). JAGS version 4.3. 0 user manual, [Computer software manual]. Retrieved from Sourceforge. Net/Projects/Mcmc-Jags/Files/Manuals/4. x, 2.
Reif M. K., Macon C. L., Wozencraft J. M. (2011). Post-Katrina land-cover, elevation, and volume change assessment along the south shore of Lake Pontchartrain, Louisiana, USA. J. Coast. Res. 62, 30–39. doi: 10.2112/SI_62_4
Robert C. P., Casella G. (2004). Monte Carlo statistical methods. 2. ed (Springer Science+Business Media New York). doi: 10.1007/978-1-4757-4145-2
Rouse J. W., Haas R. H., Schell J. A., Deering D. W. (1974). “Monitoring vegetation systems in the Great Plains with ERTS,” in Proceedings of the Third Earth Resources Technology Satellite-1 Symposium, Greenbelt, MD: NASA SP-351. 309–317.
Rutherford J. S., Day J. W., D’Elia C. F., Wiegman A. R., Willson C. S., Caffey R. H., et al. (2018). Evaluating trade-offs of a large, infrequent sediment diversion for restoration of a forested wetland in the Mississippi delta. Estuarine Coast. Shelf Sci. 203, 80–89. doi: 10.1016/j.ecss.2018.01.016
Sasser C. E. (1994). Vegetation dynamics in relation to nutrients in floating marshes in Louisiana, USA. (Baton Rouge, LA, US: Coastal Ecology Institute, Louisiana State University).
Sasser C. E., Visser J. M., Mouton E., Linscombe G. ,. J., Hartley S. (2008). Vegetation types in coastal Louisiana in 2007: U.S. Geological Survey open file report 2008-1224, 1 sheet, scale 1:550,000 (Open-File Report) [Open-File Report].
Sasser C. E., Visser J. M., Mouton E., Linscombe J., Hartley S. B. (2014). Vegetation types in coastal Louisiana in 2013: U.S. Geological Survey Scientific Investigations Map 3290, 1 sheet, scale 1:550,000 (Scientific Investigations Map) [Scientific Investigations Map]. doi: 10.3133/sim3290
Schmidt G. L., Jenkerson C., Masek J. G., Vermote E., Gao F. (2013). Landsat ecosystem disturbance adaptive processing system (LEDAPS) algorithm description: U.S. Geological Survey Open-File Report 2013–1057, 17 p. (Reston, Virginia, US). doi: 10.3133/ofr20131057
Snedden G. A., Cable J. E., Swarzenski C., Swenson E. (2007). Sediment discharge into a subsiding Louisiana deltaic estuary through a Mississippi River diversion. Estuar. Coast. Shelf Sci. 71, 181–193. doi: 10.1016/j.ecss.2006.06.035
Snedden G. A., Cretini K., Patton B. (2015). Inundation and salinity impacts to above- and belowground productivity in Spartina patens and Spartina alterniflora in the Mississippi River deltaic plain: Implications for using river diversions as restoration tools. Ecol. Eng. 81, 133–139. doi: 10.1016/j.ecoleng.2015.04.035
Stagg C. L., Krauss K. W., Cahoon D. R., Cormier N., Conner W. H., Swarzenski C. M. (2016). Processes contributing to resilience of coastal wetlands to sea-level rise. Ecosystems 19 (8), 1445–1459. doi: 10.1007/s10021-016-0015-x
Suir G., Saltus C., Johnston J., Barras J. (2011). Development of methodology to classify historical panchromatic aerial photography. Analysis of landscape features on Point au Fer Island, Louisiana-from 1956 to 2009: A case study. (Baton Rouge, LA, US: Engineer Research and Development Center).
Suir G. M., Sasser C. E. (2017). Floristic quality index of restored wetlands in coastal Louisiana (Vicksburg, MS, US: Engineer Research and Development Center).
Suir G. M., Sasser C. E. (2019a). Use of NDVI and landscape metrics to assess effects of riverine inputs on wetland productivity and stability. Wetlands 39 (4), 815–830. doi: 10.1007/s13157-019-01132-3
Suir G., Sasser C. E. (2019b). Redistribution and impacts of nearshore berm sediments: Chandeleur Barrier Islands, Louisiana, United States. Ocean Coast. Manage. 168, 103–116. doi: 10.1016/j.ocecoaman.2018.10.029
Suir G., Suir K., Sapkota S. (2018). Use of remote sensing to detect and predict aquatic nuisance vegetation growth in coastal Louisiana: Summary of findings (Environmental Laboratory (U.S). doi: 10.21079/11681/26649
Turner R. E. (2011). Beneath the salt marsh canopy: Loss of soil strength with increasing nutrient loads. Estuaries Coasts 34 (5), 1084–1093. doi: 10.1007/s12237-010-9341-y
Turner R. E., Layne M., Mo Y., Swenson E. M. (2019). Net land gain or loss for two Mississippi River diversions: Caernarvon and Davis Pond. Restor. Ecol. 27 (6), 1231–1240. doi: 10.1111/rec.13024
Twilley R. R., Day J. W., Bevington A. E., Castañeda-Moya E., Christensen A., Holm G., et al. (2019). Ecogeomorphology of coastal deltaic floodplains and estuaries in an active delta: Insights from the Atchafalaya Coastal Basin. Estuar. Coast. Shelf Sci. 227, 106341. doi: 10.1016/j.ecss.2019.106341
USACE (2002) Davis Pond Freshwater Diversion. Available at: https://www.mvn.usace.army.mil/About/Projects/Davis-Pond-Freshwater-Diversion/.
USACE (2013) Modification of Caernarvon Diversion. Available at: https://www.mvn.usace.army.mil/Portals/56/docs/environmental/LCA/Near-Term%20Projects/ModofCaernarvonFactSheetJanuary2013PAO.pdf.
VanZomeren C. M., White J. R., DeLaune R. D. (2012). Fate of nitrate in vegetated brackish coastal marsh. Soil Sci. Soc Am. J. 76, 1919–1927. doi: 10.2136/sssaj2011.0385
Villarrubia C. (2002). Caernarvon Freshwater Diversion Project (Louisiana, US: Louisiana Department of Natural Resources), 30. Available at: https://lacoast.gov/reports/project/3890870~1.pdf.
Visser J., Duke-Sylvester S., Shaffer G., Hester M., Couvillion B., Broussard W. III, et al. (2017). Coastal Master Plan: Attachment C3-5: Vegetation (Baton Rouge, Louisiana: Coastal Protection and Restoration Authority), 1–128.
Visser J. M., Sasser C. E., Chabreck R. H., Linscombe R. G. (2002). The impact of a severe drought on the vegetation of a subtropical estuary. Estuaries 25 (6), 1184–1195. doi: 10.1007/BF02692215
Wang Y., Colby J. D., Mulcahy K. A. (2002). An efficient method for mapping flood extent in a coastal floodplain using Landsat TM and DEM data. Int. J. Remote Sens. 23 (18), 3681–3696. doi: 10.1080/01431160110114484
White J. R., Couvillion B., Day J. W. (2023). Coastal wetland area change for two freshwater diversions in the Mississippi River Delta. Ecol. Eng. 186, 106819. doi: 10.1016/j.ecoleng.2022.106819
White J. R., DeLaune R. D., Justic D., Day J. W., Pahl J., Lane R. R., et al. (2019). Consequences of Mississippi River diversions on nutrient dynamics of coastal wetland soils and estuarine sediments: A review. Estuar. Coast. Shelf Sci. 224, 209–216. doi: 10.1016/j.ecss.2019.04.027
White E., Kaplan D. (2017). Restore or retreat? Saltwater intrusion and water management in coastal wetlands. Ecosys. Health Sustain. 3 (1), e01258. doi: 10.1002/ehs2.1258
Wu W., Bethel M., Mishra D. R., Hardy T. (2018). Model selection in Bayesian framework to identify the best WorldView-2 based vegetation index in predicting green biomass of salt marshes in the northern Gulf of Mexico. GIScience Remote Sens. 55 (6), 880–904. doi: 10.1080/15481603.2018.1460934
Wu W., Biber P., Mishra D. R., Ghosh S. (2020). Sea-level rise thresholds for stability of salt marshes in a riverine versus a marine dominated estuary. Sci. Total Environ. 718, 137181. doi: 10.1016/j.scitotenv.2020.137181
Wu W., Biber P. D., Peterson M. S., Gong C. (2012). Modeling photosynthesis of Spartina alterniflora (smooth cordgrass) impacted by the Deepwater Horizon oil spill using Bayesian inference. Environ. Res. Lett. 7 (4), 45302. doi: 10.1088/1748-9326/7/4/045302
Youngflesh C. (2018). MCMCvis: Tools to visualize, manipulate, and summarize MCMC output. J. Open Source Software 3, 640. doi: 10.21105/joss.00640
Zedler J. B. (2001). Handbook for Restoring Tidal Wetlands (Boca Raton, Florida, US: CRC Press). Available at: http://www.crcnetbase.com/isbn/9780849390630.
Keywords: normalized difference vegetation index (NDVI), inundation, salinity, variability, Bayesian models, freshwater diversions
Citation: Wu W, Grimes E and Suir G (2023) Impact of freshwater diversions on vegetation in coastal wetlands based on remote sensing derived vegetation index. Front. Mar. Sci. 10:1202300. doi: 10.3389/fmars.2023.1202300
Received: 08 April 2023; Accepted: 25 September 2023;
Published: 18 October 2023.
Edited by:
Laibin Huang, University of California, Davis, United StatesReviewed by:
John W. Day, Louisiana State University, United StatesBinbin Wang, Saint Louis University, United States
Copyright © 2023 Wu, Grimes and Suir. This is an open-access article distributed under the terms of the Creative Commons Attribution License (CC BY). The use, distribution or reproduction in other forums is permitted, provided the original author(s) and the copyright owner(s) are credited and that the original publication in this journal is cited, in accordance with accepted academic practice. No use, distribution or reproduction is permitted which does not comply with these terms.
*Correspondence: Wei Wu, wei.wu@usm.edu