Sample contamination explains evidence of close kin proximity in yellowfin tuna (Thunnus albacares) in the Western and Central Pacific Ocean
 Giulia Anderson
 Jed I. Macdonald
 Monal Lal2,3
  John Hampton
 Neville Smith
 Ciro Rico
- 1Oceanic Fisheries Programme, Fisheries Aquaculture and Marine Ecosystems Division, Pacific Community (SPC), Noumea, New Caledonia
- 2Molecular Analytics Laboratory (MOANA-LAB), School of Marine Studies, Faculty of Science, Technology and Environment, The University of the South Pacific, Suva, Fiji
- 3Australian Centre for Pacific Islands Research, School of Science and Engineering, University of the Sunshine Coast, Maroochydore, QLD, Australia
- 4Instituto de Ciencias Marinas de Andalucía (ICMAN), Consejo Superior de Investigaciones Científicas, (CSIC), Puerto Real, Cádiz, Spain
Anderson et al.’s 2019 paper ‘Close Kin Proximity in Yellowfin Tuna (Thunnus albacares) as a Driver of Population Genetic Structure in the Tropical Western and Central Pacific’ provided observations of genetically related individuals among sampled yellowfin tuna. Resampling of some individuals from the original study produced very different sequencing results when compared with the original dataset, one possible explanation of which is cross-contamination among the original samples. Re-analyses produced no indication of strong population structure, including a very slightly and consistent heterozygosity deficit with only one statistically significant pairwise FST value of 0.002. We identified only one pair of genetically similar individuals that could still be an artefact of lingering contamination. These new results therefore support a highly connected population of yellowfin tuna in the study area, although we do not rule out the potential for local adaptation driven by non-observed loci or genetic sub-structure operating at more contemporary scales.
1 Introduction
Fisheries science and management has the potential to benefit significantly from incorporating genetic research in its toolbox. With the advent of next generation sequencing (NGS) in the 2000’s, which made it feasible to apply direct sequencing techniques on non-model species (including most commercially important fishes), the number and power of fisheries genetic and genomic applications has expanded rapidly. Today, it is possible to test an individual fish for species identification, provenance and age (Cusa et al., 2021; Hallerman, 2021; Mayne et al., 2021), to explore stock structure (Grewe et al., 2015; Brophy et al., 2020), estimate abundance (Bravington et al., 2016; Ruzzante et al., 2019), and to monitor ecosystems biodiversity through DNA metabarcoding (e.g. Oka et al., 2020). The variety of questions that can be addressed with confidence through the analysis of genome wide markers has contributed to an increasing recognition of the value of incorporating genetics into fisheries management in recent years (Bernatchez et al., 2017; Moore et al., 2020).
However, genetic assessments come with some challenges and limitations. Perhaps the most common challenge is ensuring DNA integrity during sampling and laboratory handling. The presence of cross-contamination in population genetic research can have a significant impact on the accuracy of results by artificially increasing the observed heterozygosity of individuals (Anderson et al., 2023). Should such data be incorporated into stock assessment without reservation, it could severely misguide management decisions. One example is Anderson et al.‘s now-retracted 2019 paper ‘Close Kin Proximity in Yellowfin Tuna (Thunnus albacares) as a Driver of Population Genetic Structure in the Tropical Western and Central Pacific’, which reported the observation of individuals within sample groups that were genetically so similar that they were possibly siblings. These results reopened discussion about the life history of the species in the Western and Central Pacific Ocean (WCPO). However, a re-analysis of the Anderson et al. (2019) dataset indicates that the original samples was cross-contaminated, and that the sequencing results were consequently compromised.
We present here a revised interpretation of the Anderson et al. (2019) study that incorporates new and higher-confidence sequencing data based on amended laboratory handling protocols and improved quality filtering protocols. In revisiting this study, we have two main goals: 1) to correct the record regarding the retracted study and to re-address the same question: is there fine- and/or meso-scale population structure among yellowfin tuna in the WCPO? And 2) to demonstrate the importance of vigilance against cross-contamination in NGS datasets.
2 Methods
Research was conducted in two stages. First, in 2016, a selection of yellowfin tuna samples was accessed from the Pacific Marine Specimen Bank (PMSB), which is managed by the Pacific Community (SPC) under the auspices of the Western and Central Pacific Fisheries Commissions (WCPFC). Samples were selected based on three criteria: 1) that individuals in each group of 30+ specimens were collected within six weeks and a 330 km radius from each other, 2) that groups from three locations had been collected in the same season, and 3) that three groups came from the same EEZ and season, but in different years. The 279 selected specimens, ranging in size between 28 and 140 cm fork length, were thus organized into seven sample groups across six years and four countries (Figure S1). These groups were from the Federated States of Micronesia in 2009 (FM09) and 2011 (FM11), the Gilbert Islands of Kiribati in 2009 (GL09), New Caledonia in 2014 (NC14), and Papua New Guinea in 2009, 2011, and 2013 (PG09, PG11 and PG13, respectively).
Frozen muscle tissue samples from the PMSB were subsampled for genetic analysis by extracting a 2mm3 volume from the interior of each tissue plug using a scalpel that was sterilized with ethanol and flame exposure after any cut that contacted the sample surface. The subsamples were then sent to Diversity Arrays Technology (DArT PL) in Canberra, Australia, for DNA extraction and de novo genetic sequencing using the DArTseq protocol. The sequencing process includes some proprietary steps but was described by DArT PL as follows (see also Sansaloni et al., 2011; Kilian et al., 2012; Ren et al., 2015).
Following automated DNA extraction, samples were digested using PstI and SphI restriction enzymes. Methylation-sensitive enzymes were chosen to avoid highly repetitive, methylated genomic regions that are minimally informative and which tend to carry an elevated risk of misinterpreting paralogs as a single locus during marker calling. Specialized adaptors were ligated to digested DNA. Both PstI and SphI adapters included a PCR primer sequence and Illumina flowcell attachment sequence, and the PstI adaptor also included a unique, varying length barcode sequence for sample recognition within pooled libraries. PCR selectively amplified fragments capped with both adaptors, using the following protocol: 1 min denaturation at 94°C, 30 cycles of 20 s at 94°C, 30 s and 58°C and 45 s at 72°C, and a final extension step of 7 min at 72°C. Libraries were then further amplified using bridge PCR on the Illumina HiSeq 2500 platform and sequenced. The resulting data was submitted to an in-house software, DArTsoft, which interprets sequences from images of fluorescence taken during Illumina sequencing and produces FASTQ files. Files were quality controlled for sequences with 90% confidence at 50% of bases, and split by barcode into individual specimens. Sequences were aligned de novo. A separate algorithm, DArTsoft14, called SNPs and further quality filtered for singletons and other suspected sequencing errors. The final output produced by DArT PL was a genotype report of all identified SNPs, their global call rate, polymorphic information content, and their co-dominant status in each sequenced specimen.
The resulting data was published in the now retracted paper by Anderson et al. (2019).
The second stage of research began in 2021. As part of a larger exploration of genetic cross-contamination in the context of fisheries science, 94 samples from the Anderson et al. (2019) dataset were re-sequenced. The selected samples included all individuals that were identified as part of half- or full-sib pairs in the Anderson et al. (2019) paper, plus a random selection of other individuals to capture the impact of resampling on specimens that were not involved in the kin-versus-contamination discussion. This time, subcutaneous subsampling was conducted by a staff member at SPC who sterilized cutting tools with 10% bleach followed by a Milli-Q water wash between incisions, rather than detergent wash followed by ethanol and flame exposure. This procedure has been validated as a method to recover contaminated samples using experimentally generated contaminated samples (Anderson et al., 2023). Samples were otherwise handled the same way as per Anderson et al. (2019) and processed using the same methods, except that DArT PL has since upgraded to an Illumina Novaseq platform. The new samples were co-analysed with the 2016 dataset during SNP calling. Data as returned by DArT PL is available at DOI 10.17605/OSF.IO/YRFM3 (https://osf.io/yrfm3/).
Returned data was further processed to replicate the Anderson et al. (2019) methods, but subjected to additional tests for cross-contamination. First, the re-sequenced data was compared against the original data from the same specimens and the version with lower observed heterozygosity selected for further use, since elevated observed heterozygosity is a common indicator of cross-contamination (e.g. in Petrou et al., 2019). Subsequently, the dataset was filtered for low quality loci using the same thresholds as Anderson et al., 2019. All but the locus with the highest call rate per contig was discarded, plus loci with call rate below 99%, heterozygosity above 50%, read depth less than 7x, or minor allele frequency less than 5%. Further, loci were tested for compliance with Hardy Weinberg Expectations (HWE) at p > 0.0001, linkage disequilibrium at < 60%, and departure from neutrality with respect to local selective pressures at a false discovery rate of 0.1. Tests for HWE and linkage disequilibrium (LD) were conducted with PLINK 1.9 (Chang et al., 2015) using the commands ‘—hardy’ and ‘–r2’, respectively. Loci under potential selection were identified using both OutFLANK v 0.2 (Whitlock and Lotterhos, 2015) and BayeScan v 2.1 (Foll and Gaggiotti, 2008) with a burn in of 50000 steps and prior odds of 10, followed by 20 pilot runs of 5000 iterations.
Alternative filtering regimes were also explored with heterozygosity cutoffs reduced to 90%, read depth increased to 10x, and a minor allele frequency reduced to 1.8% (equivalent to an allele being present 5 times in the dataset), but these datasets were less successful at flagging remaining contaminated individuals and did not significantly change downstream analyses. Basic results using these thresholds during final filtering are available in the Supplementary Materials.
It should be noted that methods exist to filter contaminated loci and individuals at this stage. The program ART-DeCo (Fiévet et al., 2019) interprets an unbalanced allelic ratio per heterozygote loci as contamination, and O’Leary et al. (2018) encourages use of the same filter to address a number of potential data quality issues. The present dataset does not include the allelic balance raw data necessary for such analysis. We therefore proceeded with filters more in line with those described in Guo et al. (2014), which include heterozygosity rate and genetic similarity between individuals. Namely, after the filtering described in the previous paragraph, all specimens were again assessed for missing data and individual heterozygosity, the latter calculated as the mean heterozygosity for that individual across all the loci surveyed. First, specimens with more than 20% missing data were removed from further analysis. This threshold was selected because of a clear break in data quality, with samples either demonstrating less than 20% missing data or more than 40%. Second, we elected to set a threshold for removal due to high heterozygosity as the median individual heterozygosity value (calculated across all specimens) plus the difference between median and minimum values. This calculation was preferred over z-score assessments (recommended by Anderson et al., 2023), after a Shapiro-Wilk test in the ‘stats’ package in R (R Core Team, 2023) indicated that the distribution of individual heterozygosity values was not normal and therefore parametric assessments were not appropriate. Our approach was not subject to parametric assumptions about distributional spread, and produced similar, though slightly more conservative thresholds for filtering (i.e. 0.2649) compared with approaches using z-scores (0.2884, stabilized after five iterations) or using the mean individual heterozygosity in the calculation instead of the median (0.2869). After extraction, the remaining 247 individuals were filtered again using the same quality metrics and thresholds as during preliminary filtering. These steps produced a ‘final’ genotype dataset for further analysis.
We again applied the Shapiro-Wilk test to test for normality of the heterozygosity distribution in this final dataset.
Downstream population genetic analyses replicated those conducted by Anderson et al. (2019). The inbreeding coefficient (FIS) and adjusted expected and observed heterozygosity (Hnb and Ho) values were obtained for each sample group using GENETIX v. 4.05 (Belkhir et al., 2004), while pairwise FST (Weir and Cockerham, 1984) was calculated using Arlequin v 3.5.2.2. ADMIXTURE v. 1.3.0 (Alexander et al., 2015) was used to recommend the number of independent genetic clusters (k) among all sampled individuals. Analyses were run with hypothetical k values ranging from 1 to 10, and the optimal k value was selected based on a low coefficient of variance. Discriminant Analyses of Principal Components (DAPC) in the ‘adegenet’ R package v 2.1.10 (Jombart and Ahmed, 2011) was first applied to infer cryptic structure within the dataset using k-means clustering to determine the number of underlying groups. DAPC was also applied using the sampling units as a priori groups to visualize the heterogeneity among geographic populations and sampling years. In both analyses, cross validation was used to determine the number of principal components retained.
Additionally, in keeping with the original study, we explored relatedness using three software programs, RelateAdmix (Moltke and Albrechtsen, 2014), KING v 2.3.1 (Manichaikul et al., 2010) and COANCESTRY v. 1.0.1.7 (Wang, 2011). The algorithm employed in RelateAdmix maximizes its accuracy when working with admixed populations, which is one plausible population model for tuna. Meanwhile KING employs an algorithm that is robust to unknown population structure. COANCESTRY allows for the consideration of inbreeding, which was a relevant feature for some sample groups in the original study. RelateAdmix requires a priori information about general genetic clustering, which was recycled from ADMIXTURE. The output.P and.Q files from the selected ADMIXTURE analysis (k=1) were submitted to RelateAdmix, and output values used to calculate θ = (k1/4) + (k2/2), where k1 and k2 are respectively the probabilities of sharing one or two alleles from a shared ancestor, and θ is the expected fraction of two genomes that is identical by descent. KING was run via command “related” and produces the kinship coefficient φ, plus a synthesis of dyads that are related in the first, second and third degree. COANCESTRY was run using the TrioML algorithm, which was empirically demonstrated to best describe the relatedness coefficient (r) among the seven algorithms available in that software package after conducting preliminary simulations as described in the COANCESTRY user manual.
RelateAdmix and COANCESTRY both produce relatedness coefficients, but no recommendation on how to differentiate full sibling pairs from half siblings and more distantly related individuals. To determine cut-off values for categorizing relatedness coefficients, we again used COANCESTRY to simulate 200 dyads each of full sibling, half siblings, first cousins, and unrelated individuals based on the same allele frequencies as the original population samples. The simulated genotypes were then submitted to both COANCESTRY and RelateAdmix, and results used to calculate the lower 95% confidence interval of the mean of each group, assuming a normal distribution. These values became the cut-offs for delineating full- and half-siblings in empirical datasets in the respective software programs.
3 Results
Of the 94 specimens that were resampled in 2021, 73 were selected to replace existing data in the original dataset. The updated dataset including all 279 non-duplicated individuals was filtered and retained 1,417 of 63,351 loci (Table 1). This dataset was used to assess individuals for missing data and high heterozygosity. The Shapiro-Wilk test conducted on the Ho distribution at this stage produced W = 0.519 and p < 2.2e-16, and the associated skewness coefficient was 4.77, indicating marked divergence from normality (Figure S2). Four individuals were then removed due to missing data, and another 29 due to high heterozygosity. Subsequently, filtering again with the same thresholds but only 247 high quality individuals, 3,781 loci passed all quality checks (Table 1).
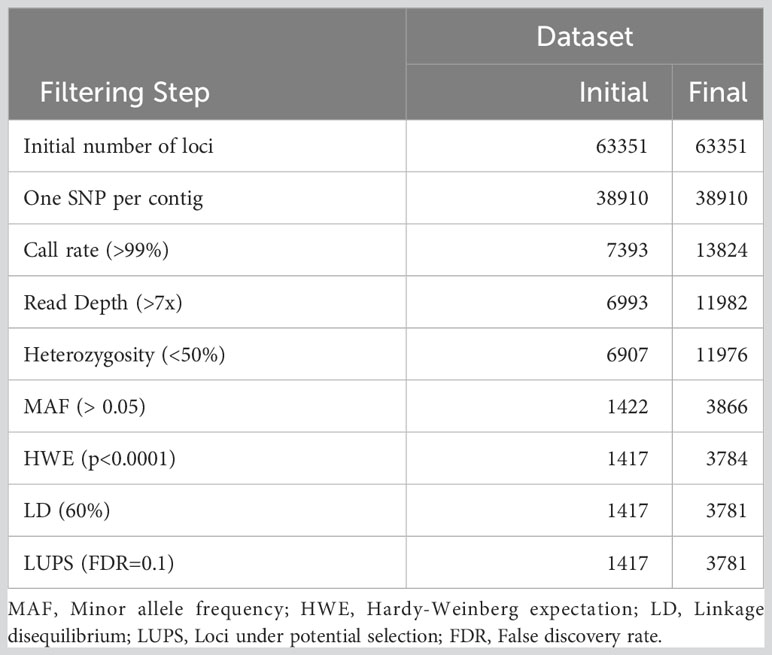
Table 1 Number of loci retained through quality filtering process for initial data exploration (‘Initial’) and the final dataset (‘Final’).
The Shapiro-Wilk test on the Ho distribution for these remaining 247 individuals produced W = 0.940 and p = 1.72e-8, with skewness coefficient 0.50, (Figure S2). Although the continued non-conformity to a normal distribution suggests that our final genotypic dataset is not entirely free of all contamination, based on the relationship between contamination and inflated heterozygosity demonstrated in Petrou et al. (2019) and Anderson et al. (2023), the substantial reduction in the amount of skewness suggests that cross-contamination is likewise much lessened. We therefore proceeded with a reassessment of the yellowfin tuna population structure results published in Anderson et al. (2019).
Observed and adjusted expected heterozygosity values (Ho and Hnb) and inbreeding coefficients (FIS) for each sample group are summarized in Table 2. All sample groups feature Hnb values of 0.26-0.27 and a slight heterozygosity deficit of 0.01-0.02 (on a scale of 0 to 1). Likewise, there was a small, yet consistent indication of inbreeding (0.05-0.07 on a scale of -1 to 1). The fixation index FST is presented in Table 3 and showed only values of 0.001-0.002 (on a scale of 0-1). Furthermore, only the comparison of FM11 and PG13 was statistically significant at p < 0.05 after Benjamini and Yekutieli (2001) FDR correction, and the corresponding FST estimate was only 0.002. K-means clustering recommended a k of 1, indicating strong evidence for the existence of only one underlying population. Similarly, the DAPC results with a priori groups showed minimal differentiation among sample groups (Figure 1).
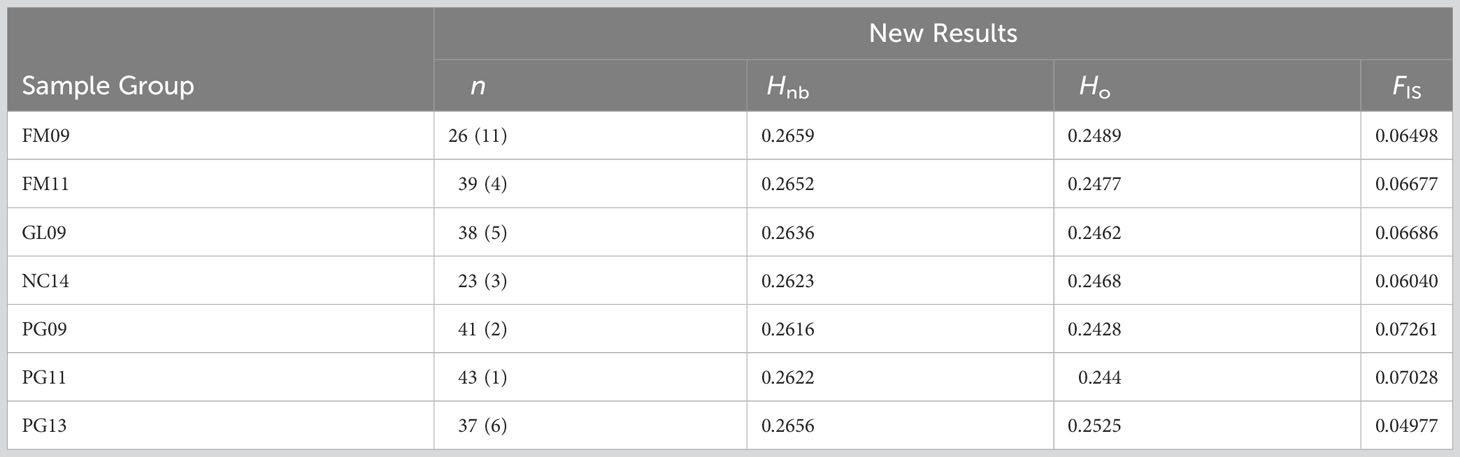
Table 2 Number of samples in the final dataset (n, followed by the number of samples extracted during filtering in parentheses), adjusted expected heterozygosity (Hnb), observed heterozygosity (Ho) and inbreeding coefficient (FIS) produced by the final dataset.
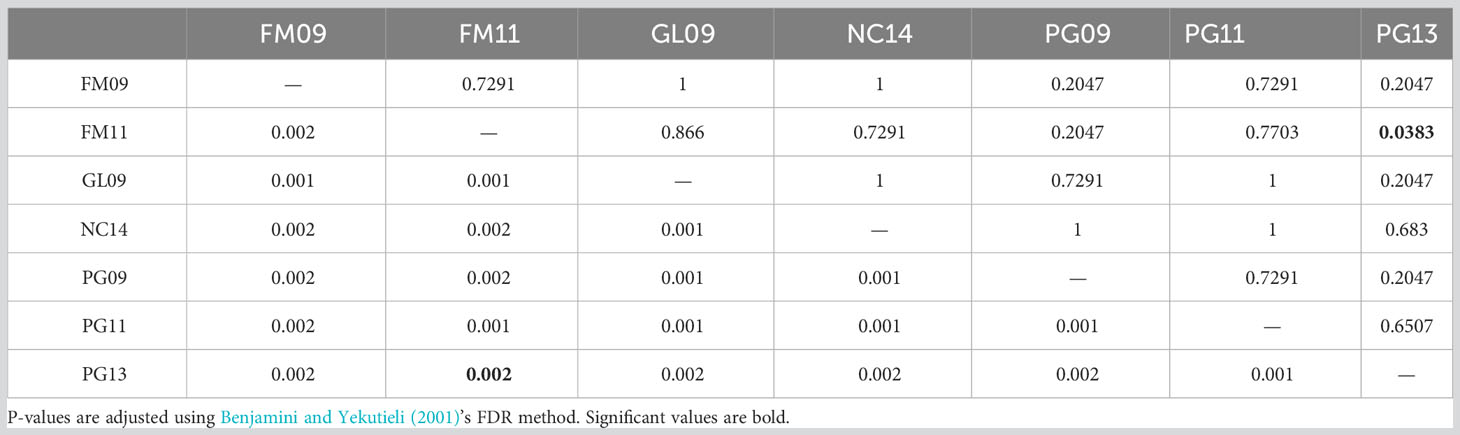
Table 3 Fixation index (FST) values below the diagonal and related p-values above the diagonal.
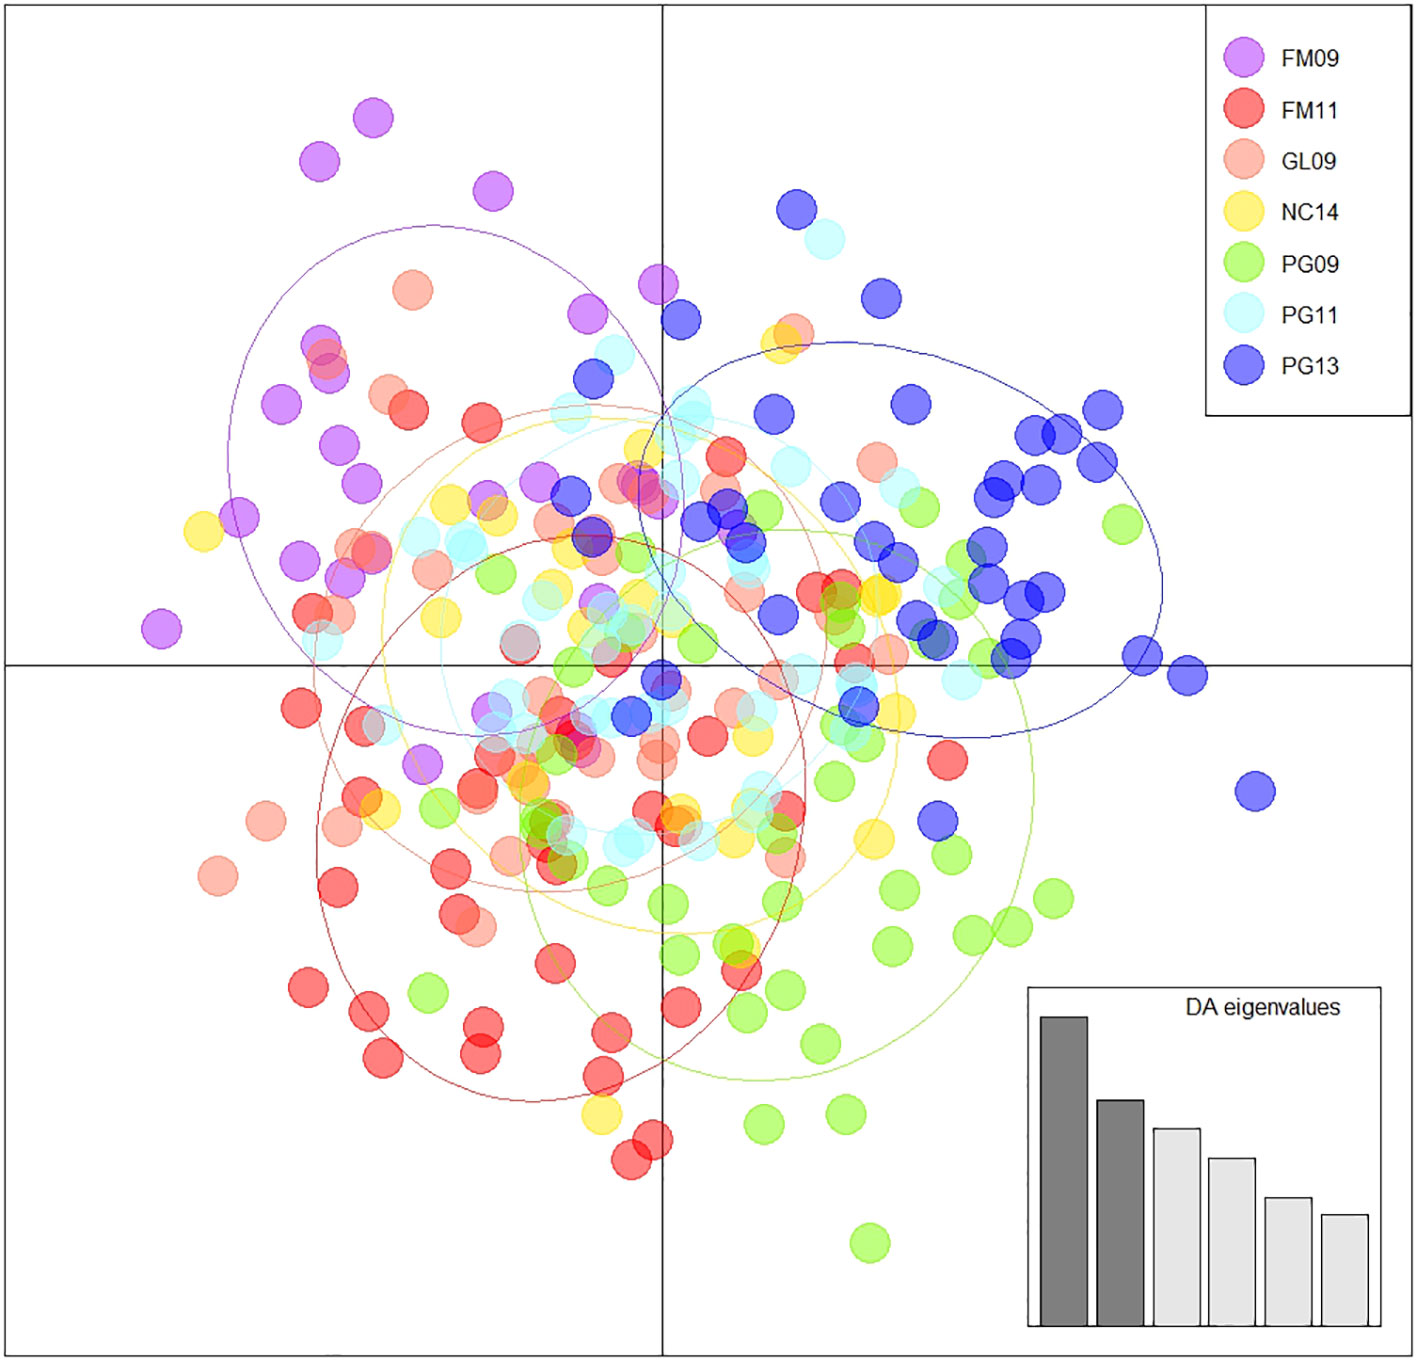
Figure 1 Discriminant analysis of principal components using 60 principal components, 6 discriminant functions, and a priori groupings. A synthesized distribution of specimens reflecting their genetic similarity and coloured according to group.
A full, side-by-side comparisons of these results to data from the original 2019 paper is available in the Supplementary Materials (Tables S1-S5, Figure S3) to demonstrate the changes brought about by resequencing and the updated tissue extraction procedures and data filtering steps. For example, heterozygosity excess of the FM09 and FM11 sample groups dropped from 0.07 to -0.015, and FIS increased from -0.255 to 0.065.
Finally, there was strong agreement between relatedness analyses on the (minimal) presence of kin among specimens. COANCESTRY, RelateAdmix and KING all identified the same, lone pair of individuals showing a relatedness coefficient within the range of simulated half sibs in the entire dataset, along with one or two cousin-level pairs. COANCESTRY and RelatedAdmix also reported several thousand dyads with relatedness coefficients lower than the threshold for cousin pairs, but more than would be expected from unrelated individuals (specifically, 8399 dyads using COANCESTRY and 5727 using RelatedAdmix), while KING identified 86 such dyads. Direct comparisons of these results with the results of Anderson et al. (2019) are available in Table S5 in the Supplementary Materials.
4 Discussion
The results presented here, in contrast to the conclusions of the retracted paper (Anderson et al., 2019), leave little evidence of strong genetic population structure for yellowfin tuna across our study region in the WCPO. Previous studies that generated levels of genetic divergence comparable to those inferred in this work have been hesitant to infer biologically significant structure patterns (e.g. Gonzalez et al., 2008). The observed heterogeneity and deficit in heterozygotes can most likely be attributed to transient ecological assemblages (Nikolic et al., 2020), which our sampling featuring spatially and temporally restricted collections was well designed to highlight. The findings of this study are consistent with expectations for a tropical tuna species like yellowfin tuna, which is highly mobile and widely distributed. Previous research has shown that adult yellowfin tuna populations exhibit genetic structuring at broad spatial scales (e.g. [Appleyard et al., 2001; Grewe et al., 2015; Pecoraro et al., 2018; Evans et al., 2019; Grewe et al., 2019; Proctor et al., 2019]; and reviewed in [Moore et al., 2020; Hamer et al., 2023]). The structure patterns described in these studies may be influenced by factors such as incomplete migration and the presence of semi-permeable oceanographic barriers (Pecoraro et al., 2018).
The lack of genetic variation we observed in adults and sub-adults from across the study region is also consistent with reproductive studies and historical larval collections that suggest that yellowfin tuna can spawn year-round across a large, continuous area in tropical waters of the WCPO, leading to high potential for mixing during early life stages (Nishikawa et al., 1985; Schaefer, 2001; Reglero et al., 2014; Muhling et al., 2017; Ijima and Jusup, 2023). Small juvenile yellowfin tuna (i.e. ~20-40 cm fork length) are regularly caught in purse seine, pole and line and ringnet fisheries throughout the equatorial and tropical WCPO, from Indonesia to Hawaii and from the Solomon Islands to south of Japan (Hamer et al., 2023; Macdonald et al., 2023). Taken together, these findings indicate that juvenile yellowfin tuna are widespread across our study region, consistent with the widespread larval distribution. No discrete (in space or time) spawning or nursery areas have been identified to date in this region. That said, genetic assessments of larval or early juvenile stages may reveal more structure due to limited mobility and/or mixing opportunities during those life phases. Indeed, an excess of sibship was found among 5-11 day old larvae of the related Atlantic bluefin tuna samples by McDowell et al. (2022). Further representative sampling of larvae and juveniles has long been identified as a research need to improve our understanding of tropical tuna population structure, and plans are afoot to obtain larval samples during upcoming collaborative research cruises.
While the steps taken in this work to address cross-contaminations have improved the reliability of the corrected dataset, caution should still be exerted during interpretation of the results. The present study implemented enhanced protocols for sample handling and post-sequencing checks, resulting in a significant reduction in sample cross-contamination compared with the Anderson et al. (2019) dataset. However, it is probable that some traces of contamination persist in the data. This hypothesis is supported by the non-normal distribution of Ho (depicted in Figure S2) and the correlation between high heterozygosity with elevated genetic similarity in relatedness assessments, in line with indicators of cross-contamination proposed by Guo et al. (2014). In all three evaluations of relatedness, twelve out of the thirteen dyads with the greatest relatedness coefficients consist of at least one individual whose heterozygosity is above the 90th percentile. The remaining dyad consists of two individuals with heterozygosity above the 75th percentile. The dyad exhibiting the strongest relatedness coefficient in which both individuals that fall below the 75th percentile is related at the 4th degree (e.g. half-first cousins), a degree of similarity more likely to arise naturally and not through contamination effects. The sole statistically significant pairwise FST value could potentially be compromised considering that the two groups involved in the comparison (FM11, PG13) contained a substantial proportion of individuals that were removed from the dataset during filtration based on our criteria to infer contamination.
Bioinformatic pipelines such as those developed by Simion et al. (2018) and Fiévet et al. (2019) are available to identify and filter out compromised loci and individuals from next generation sequencing datasets. These methods require sequencing read processing and SNP calling to be done in house. This was not possible in the present study, which sought to remain compatible with the Anderson et al. (2019) dataset by utilising DArT PL services to process raw data through SNP calling and to undertake preliminary quality filtering. Regardless, given the strength of evidence against the presence of strong population structure as shown by our new data, we believe that additional filtering steps are unlikely to alter this overall conclusion.
Some discussion is warranted on the likely source of contamination events in the original dataset presented by Anderson et al. (2019). Handling of samples always introduces the risk of contamination, even by experienced field and laboratory staff. Even professional sequencing labs can be a potential source of contamination (Ballenghien et al., 2017). The use of ethanol and flame treatment during the sample preparation phase was also possibly a weak point, since ethanol does not denature DNA and heat is likewise not recognized as a highly effective treatment (Wang et al., 2014). However, if this was the sole source of contamination, then samples would likely have been compromised at the same rate across groups. Instead, the concentration of contamination among Micronesian samples from FM09 and FM11 suggests that local deviations in onboard or onshore sampling protocols may have increased the rate and intensity of contamination in those groups. Situations like this directly highlight the need for the development of standard operating procedures for genetic sampling (Anderson et al., 2023) and effective communication of these SOPs among fisheries observers and other biological samplers. Notably, the success of resequencing in dramatically reducing contamination rates in the present study further validates the subsampling protocol proposed by Anderson et al. (2023) as an effective means of recovering compromised tissue samples. The approach is applicable to samples obtained either at sea or in port, in cases where standard operating procedures for genetic sampling were not adhered to, where the history of sample handling is unknown, or when tissue collection was primarily intended for non-genetic purposes (e.g. muscle stable isotope analysis – Lorrain et al., 2020).
Finally, it must be acknowledged that this study is still only assessing a subset of de novo SNP loci from the yellowfin tuna genome, and only assesses adults and sub-adults. There remains the potential for different conclusions using different loci, including alternative neutral loci and adaptive loci (especially given ongoing efforts to sequence full reference genomes for the various tuna species), different life stages, and different data types. Evidence of population genetic structure among yellowfin tuna at a Pacific-wide scale has been provided (e,g. Grewe et al., 2015; Pecoraro et al., 2018). However, we note no additional peer reviewed nuclear genome research has been published on yellowfin tuna since 2019. We encourage continued exploration of the population dynamics and genetic structure of yellowfin tuna both at the local and ocean-basin scale, particularly through collaborative assessments, ideally combining inference from multiple data sources (e.g. genetics, otolith chemistry and shape analysis, tagging, and modelling– e.g. Sakamoto et al., 2019; Taillebois et al., 2021). We also encourage ongoing efforts to publish reference genomes for yellowfin tuna and the pursuit of further larval and young juvenile samples.
5 Conclusion
We revisited data published in 2019 that indicated population genetic structure among yellowfin tuna in the WCPO. By resequencing a suspect part of the dataset, we found that the results were not reproducible. Instead, our new results indicate a lack of evidence for genetic population substructuring across the study area spanning Papua New Guinea to the Gilbert Islands, Kiribati, over six years of sample collection. The most likely explanation is that the original dataset was compromised by cross-contamination, which was reduced through the amended laboratory handling and data filtering protocols used in the present study.
It is possible that population structure exists but was not observed in this study, in particular local adaptation driven by loci under selection not captured by our genotyping assay. Structure may also be revealed when sampling alternative life stages as shown in other tunas. Finally, population structure can occur at time scales that are important to management processes but not measurable by genetic processes. We therefore encourage continued exploration of yellowfin tuna population structure using a diverse array of methods. We also highlight the need for the refinement and roll-out of sampling standard operating procedures for fisheries genetics and genomics applications that reduce the potential for sample cross-contamination from the point of collection to sequencing.
Data availability statement
The datasets presented in this study can be found in online repositories. The names of the repository/repositories and accession number(s) can be found below: https://osf.io/yrfm3/.
Ethics statement
Ethical approval was not required for the study involving animals in accordance with the local legislation and institutional requirements because samples are preexisting from a tissue bank and were not collected for this project.
Author contributions
Conceptualization: GA, JM, ML, CR. design and methodology: GA, JM, ML, CR. data collection: GA, CR. analysis of the findings: GA, JM, JH, NS. drafting of the manuscript: GA, JM. All authors contributed to the article and approved the submitted version.
Funding
Funding was provided by the Western and Central Pacific Fisheries Commission (Project 35b) and the European Union “Pacific-European-Union-Marine-Partnership” Programme (agreement FED/2018/397-941). This publication was produced with the financial support of the European Union and Sweden. Its contents are the sole responsibility of the authors and do not necessarily reflect the views of the European Union and Sweden.
Acknowledgments
We thank the Pacific Marine Specimen Bank for repeated access to samples; Ines Rico and staff from both the Pacific Community and the University of the South Pacific for supporting sample and data handling in both 2016 and 2023; and Diversity Arrays Technology for exceptionally providing a comparative dataset that incorporated DNA sequences from 2016 and 2023.
Conflict of interest
The authors declare that the research was conducted in the absence of any commercial or financial relationships that could be construed as a potential conflict of interest.
Publisher’s note
All claims expressed in this article are solely those of the authors and do not necessarily represent those of their affiliated organizations, or those of the publisher, the editors and the reviewers. Any product that may be evaluated in this article, or claim that may be made by its manufacturer, is not guaranteed or endorsed by the publisher.
Supplementary material
The Supplementary Material for this article can be found online at: https://www.frontiersin.org/articles/10.3389/fmars.2023.1204884/full#supplementary-material
References
Alexander D., et al. (2015) Admixture 1.3 Software Manual. Available at: http://www.genetics.ucla.edu/software/admixture/admixture-manual.pdf.
Anderson G., Lal M., Hampton J., Smith N., Rico C. (2019). Close kin proximity in yellowfin tuna ( Thunnus albacares ) as a driver of population genetic structure in the tropical Western and Central Pacific Ocean. Front. Mar. Sci. 6. doi: 10.3389/fmars.2019.00341
Anderson G., Macdonald J.I., Potts J., Feutry P., Grewe P.M., Boutigny M., et al (2023). ‘Evaluating DNA cross-contamination risk using different tissue sampling procedures on board fishing and research vessels’. ICES J. Mar. Sci. 80 (4), 728–738. doi: 10.1093/icesjms/fsad004
Appleyard S. A., Grewe P., Innes B., Ward R. (2001). Population structure of yellowfin tuna (Thunnus albacares) in the western Pacific Ocean, inferred from microsatellite loci. Mar. Biol. 139 (2), 383–393. doi: 10.1007/s002270100578
Ballenghien M., Faivre N., Galtier N. (2017). Patterns of cross-contamination in a multispecies population genomic project: Detection, quantification, impact, and solutions. BMC Biol. 15 (1), 1–16. doi: 10.1186/s12915-017-0366-6
Belkir L., Raufaste N., Bonhomme F. (2004). “1996-2004 GENETIX 4.05 Logiciel Sous Windows TM Four la Genetique des Populations,” in Laboratoire Genome, Populations, Interactions (Montpellier, France: Universite de Montpellier II).
Benjamini Y., Yekutieli D. (2001). ‘The control of the false discovery rate in multiple testing under dependency. Ann. Stat 29 (4), 1165–1188. doi: 10.1214/aos/1013699998
Bernatchez L., Wellenreuther M., Araneda C., Ashton D. T., Barth J. M. I., Beacham T. D., et al. (2017). Harnessing the power of genomics to secure the future of seafood. Trends Ecol. Evol. 32 (9), 665–680. doi: 10.1016/j.tree.2017.06.010
Bravington M., Grewe P., Davies C. (2016). Absolute abundance of southern bluefin tuna estimated by close-kin mark-recapture. Nat. Commun. 7, 1–8. doi: 10.1038/ncomms13162
Brophy D., Rodríguez-Ezpeleta N., Fraile I., Arrizabalaga H. (2020). Combining genetic markers with stable isotopes in otoliths reveals complexity in the stock structure of Atlantic bluefin tuna (Thunnus thynnus). Sci. Rep. 10 (1), 1–17. doi: 10.1038/s41598-020-71355-6
Chang C. C., Chow C.C., Tellier L.CAM, Vattikuti S., Purcell S.M., Lee J.J. (2015). Second-generation PLINK: rising to the challenge of larger and richer datasets.Gigascience 4 (7), , s13742–015–0047–8. doi: 10.1186/s13742-015-0047-8
Cusa M., St John Glew K., Trueman C., Mariani S., Buckley L., Neat F., et al. (2021). A future for seafood point-of-origin testing using DNA and stable isotope signatures. Rev. Fish Biol. Fisheries 32, 597–621. doi: 10.1007/s11160-021-09680-w
Evans K., Grewe P., Gunaskera R., Lansdell M. (2019). Connectivity of tuna and billfish species targeted by the Australian Eastern Tuna and Billfish Fishery with the broader Western Pacific Ocean. in Information Paper SC13-SA-IP-03 (Rarotonga, Cook Islands: Thirteenth Regular Session of the Scientific Committee of the Western and Central Pacific Fisheries Commission), 9–17 august 2017. Available at: https://meetings.wcpfc.int/node/10201.
Fiévet A., Bernard V., Tenreiro H., Dehainault C., Girard E., Deshaies V., et al. (2019). ART-DeCo: easy tool for detection and characterization of cross-contamination of DNA samples in diagnostic next-generation sequencing analysis. Eur. J. Hum. Genet. 27 (5), 792–800. doi: 10.1038/s41431-018-0317-x
Foll M., Gaggiotti O. (2008). A genome-scan method to identify selected loci appropriate for both dominant and codominant markers: A bayesian perspective. Genetics 180 (2), 977–993. doi: 10.1534/genetics.108.092221
Gonzalez E. G., Beerli P., Zardoya R. (2008). Genetic structuring and migration patterns of Atlantic bigeye tuna, Thunnus obesus (Low). BMC Evolutionary Biol. 8, 252. doi: 10.1186/1471-2148-8-252
Grewe P., Feutry P., Hill P.L., Gunasekera R.M., Schaefer K.M., Itano D.G., et al. (2015). Evidence of discrete yellowfin tuna (Thunnus albacares) populations demands rethink of management for this globally important resource. Sci. Rep. 5, 16916. doi: 10.1038/srep16916
Grewe P. M., Wudianto, Proctor C. H., Adams M. S., Jauhary A. R., Schafer K., et al. (2019). “Population Structure and Connectivity of Tropical Tuna Species across the Indo Pacific Ocean Region,” in Information Paper SC15/SA-IP-15 (Pohnpei, Federated States of Micronesia: Fifteenth Regular Session of the Scientific Committee of the Western and Central Pacific Fisheries Commission), 12-20 August 2019. Available at: https://meetings.wcpfc.int/node/11286.
Guo Y., Zhao S., Sheng Q., Ye F., Li J., Lehmann B., et al. (2014). Multi-perspective quality control of Illumina exome sequencing data using QC3. Genomics 103 (5–6), 323–328. doi: 10.1016/j.ygeno.2014.03.006
Hallerman E. M. (2021). Applications and limitations of DNA barcoding in Environmental Biology. J. Environ. Biol. 42 (1), 1–13. doi: 10.22438/JEB/42/1/MRN-1710
Hamer P., Macdonald J., Potts J., Vidal T., Teears T., Senina I. (2023). “Review and analyses to inform conceptual models of population structure and spatial stratification of bigeye and yellowfin tuna assessments in the Western and Central Pacific Ocean,” in Working Paper SC19/EB-WP-01 (Koror, Palau: Nineteenth Regular Session of the Scientific Committee of the Western and Central Pacific Fisheries Commission), 16-24 August 2023. Available at: https://meetings.wcpfc.int/node/19350.
Ijima H., Jusup M. (2023) Tuna and billfish larval distributions in a warming ocean. Available at: https://arxiv.org/abs/2304.09442.
Jombart T., Ahmed I. (2011). A’degenet 1.3-1: new tools for the analysis of genome-wide SNP data’. Bioinformatics 27 (21), 3070–3071. doi: 10.1093/bioinformatics/btr521
Kilian A., Wenzl P., Huttner E., Carling J., Xia L., Blois H., et al. (2012). “Diversity Arrays Technology: A Generic Genome Profiling Technology on Open Platforms,” in Data Production and Analysis in Population Genomics: Methods and Protocols (Totowa, NJ: Humana Press), 67–89. doi: 10.1007/978-1-61779-870-2_5
Lorrain A., Pethybridge H., Cassar N., Receveur A., Allain V., Bodin N., et al. (2020). Trends in tuna carbon isotopes suggest global changes in pelagic phytoplankton communities. Global Change Biol. 26 (2), 458–470. doi: 10.1111/gcb.14858
Macdonald J., Williams P., Roupsard F., Sanchez C., Bell L., Chang S-K., et al. (2023). “Project 90 update: Better data on fish weights and lengths for scientific analyses.,” in Information Paper SC19-ST-IP-04 (Koror, Palau: Nineteenth Regular Session of the Scientific Committee of the Western and Central Pacific Fisheries Commission), 16–24 August 2023. Available at: https://meetings.wcpfc.int/node/19346.
Manichaikul A., Mychaleckyj J.C., Rich S.S., Daly K., Sale M., Chen W-M. (2010). Robust relationship inference in genome-wide association studies. Bioinformatics 26 (22), 2867–2873. doi: 10.1093/bioinformatics/btq559
Mayne B., Espinoza T., Roberts D., Butler G.L., Brooks S., Korbie D., et al. (2021). Nonlethal age estimation of three threatened fish species using DNA methylation: Australian lungfish, Murray cod and Mary River cod. Mol. Ecol. Resour. 21 (7), 2324–2332. doi: 10.1111/1755-0998.13440
McDowell J. R., Bravington M., Grewe P.M., Lauretta M., Walter J.F. III, Baylis S.M., et al. (2022). Low levels of sibship encourage use of larvae in western Atlantic bluefin tuna abundance estimation by close-kin mark-recapture. Sci. Rep. 12 (1), 18606. doi: 10.1038/s41598-022-20862-9
Moltke I., Albrechtsen A. (2014). RelateAdmix: a software tool for estimating relatedness between admixed individuals. Bioinformatics 30 (7), 1027–1028. doi: 10.1093/bioinformatics/btt652
Moore B. R., Bell J.D., Evans K., Farley J., Grewe P.M., Hampton J., et al. (2020). ‘Defining the stock structures of key commercial tunas in the Pacific Ocean I: Current knowledge and main uncertainties’. Fisheries Res. 230, 105525. doi: 10.1016/j.fishres.2020.105525
Muhling B., Lamkin J.T., Alemany F., García A., Farley J., Walter Ingram G. Jr, et al. (2017). Reproduction and larval biology in tunas, and the importance of restricted area spawning grounds. Rev. Fish Biol. Fisheries 27, 697–732. doi: 10.1007/s11160-017-9471-4
Nikolic N., Montes I., Lalire M., Puech A., Bodin N., Arnaud-Haond S., et al. (2020). Connectivity and population structure of albacore tuna across southeast Atlantic and southwest Indian Oceans inferred from multidisciplinary methodology. Sci. Rep. 10 (1), 1–17. doi: 10.1038/s41598-020-72369-w
Nishikawa Y., Honma M., Ueyanagi S., Kikawa S. (1985). ‘Average distribution of larvae of oceanic species of scombroid fishe-1981’, S Ser. Far Seas Fish. Res. Lab. 12, 99.
Oka S.-I., Doi H., Miyamoto K., Hanahara N., Sado T., Miya M. (2020). Environmental DNA metabarcoding for biodiversity monitoring of a highly diverse tropical fish community in a coral reef lagoon: Estimation of species richness and detection of habitat segregation. Environ. DNA 3 (1), 55–69. doi: 10.1002/edn3.132
O’Leary S., Puritz J.B., Willis S.C., Hollenbeck C.M., Portnoy D.S., et al. (2018). These aren’t the loci you’re looking for: Principles of effective SNP filtering for molecular ecologists. Mol. Ecol. 27 (16), 3193–3206. doi: 10.1111/mec.14792
Pecoraro C., Babbucci M., Franch R., Rico C., Papetti C., Chassot E., et al. (2018). The population genomics of yellowfin tuna (Thunnus albacares) at global geographic scale challenges current stock delineation. Sci. Rep. 8, 1–4. doi: 10.1038/s41598-018-32331-3
Petrou E. L., Drinan D.P., Kopperl R., Lepofsky D., Yang D., Moss M.L., et al. (2019). Intraspecific DNA contamination distorts subtle population structure in a marine fish: Decontamination of herring samples before restriction-site associated sequencing and its effects on population genetic statistics. Mol. Ecol. Resour. 19 (5), 1131–1143. doi: 10.1111/1755-0998.12978
Proctor C., Lester R.J.G., Clear N.P., Grewe P.M., Moore B., Eveson J.P., et al. (2019). “Population structure of yellowfin tuna (Thunnus albacares) and bigeye tuna (T. obesus) in the Indonesian region,” in Final Report as output of ACIAR Project FIS/2009/059 (Canberra: CSIRO).
R Core Team (2023). R: A Language and Environment for Statistical Computing’ R Foundation for Statistical Computing (Vienna, Austria). Available at: https://www.R-project.org/.
Reglero P., Tittensor D.P., Álvarez-Berastegui D., Aparicio-González A., Worm B. (2014). Worldwide distributions of tuna larvae: revisiting hypotheses on environmental requirements for spawning habitats. Mar. Ecol. Prog. Ser. 501, 207–224. doi: 10.3354/meps10666
Ren R., Ray R., Li P., Xu J., Zhang M., Liu G., et al. (2015). Construction of a high-density DArTseq SNP-based genetic map and identification of genomic regions with segregation distortion in a genetic population derived from a cross between feral and cultivated-type watermelon. Mol. Genet. Genomics 290 (4), 1457–1470. doi: 10.1007/s00438-015-0997-7
Ruzzante D. E., McCracken G.R., Førland B., MacMillan J., Notte D., Buhariwalla C., et al. (2019). Validation of close-kin mark-recapture (CKMR) methods for estimating population abundance. Methods Ecol. Evol. 10 (9), 1445–1453. doi: 10.1111/2041-210X.13243
Sakamoto T., Komatsu K., Shirai K., Higuchi T., Ishimura T., Setou T., et al. (2019). Combining microvolume isotope analysis and numerical simulation to reproduce fish migration history. Methods Ecol. Evol. 10 (1), 59–69. doi: 10.1111/2041-210X.13098
Sansaloni C., Petroli C., Jaccoud D., Carling J., Detering F., Grattapaglia D., et al. (2011). Diversity Arrays Technology (DArT) and next-generation sequencing combined: genome-wide, high throughput, highly informative genotyping for molecular breeding of Eucalyptus’. BMC Proc. 5 (S7), P54. doi: 10.1186/1753-6561-5-s7-p54
Schaefer K. M. (2001). “Reproductive biology of tunas,” in Tuna: Physiology, Ecology, and Evolution. Eds. Block B., Stevens E. (San Diego, California: Academic Press), 225–270. doi: 10.1016/S1546-5098(01)19007-2
Simion P., Belkhir K., François C., Veyssier J., Rink J.C., Manuel M., et al. (2018). A software tool “CroCo” detects pervasive cross-species contamination in next generation sequencing data. BMC Biol. 16 (1), 1–9. doi: 10.1186/s12915-018-0486-7
Taillebois L., Davenport D., Barton D.P., Crook D.A., Saunders T., Hearnden M., et al. (2021). Integrated analyses of SNP-genotype and environmental data in a continuously distributed snapper species ( Lutjanus johnii , Bloch 1792) reveals a mosaic of populations and a challenge for sustainable management’. ICES J. Mar. Sci. 78 (9), 3212–3229. doi: 10.1093/icesjms/fsab187
Wang J. (2011). coancestry: a program for simulating, estimating and analysing relatedness and inbreeding coefficients. Mol. Ecol. Resour. 11 (1), 141–145. doi: 10.1111/j.1755-0998.2010.02885.x
Wang X., Lim H. J., Son A. (2014). Characterization of denaturation and renaturation of DNA for DNA hybridization. Environ. Health Toxicol. 29, e2014007. doi: 10.5620/eht.2014.29.e2014007
Weir B., Cockerham C. (1984). Estimating F-statistics for the analysis of population structure. Evolution 38 (6), 1358–1370. doi: 10.1111/j.1558-5646.1984.tb05657.x
Keywords: yellowfin tuna, population genetic structure, cross-contamination, Wahlund effect, Pacific Ocean
Citation: Anderson G, Macdonald JI, Lal M, Hampton J, Smith N and Rico C (2023) Sample contamination explains evidence of close kin proximity in yellowfin tuna (Thunnus albacares) in the Western and Central Pacific Ocean. Front. Mar. Sci. 10:1204884. doi: 10.3389/fmars.2023.1204884
Received: 12 April 2023; Accepted: 27 October 2023;
Published: 11 December 2023.
Edited by:
Pei-Yuan Qian, Hong Kong University of Science and Technology, Hong Kong SAR, ChinaReviewed by:
Eric Saillant, University of Southern Mississippi, United StatesJohn Walter, National Oceanic and Atmospheric Administration (NOAA), United States
Copyright © 2023 Anderson, Macdonald, Lal, Hampton, Smith and Rico. This is an open-access article distributed under the terms of the Creative Commons Attribution License (CC BY). The use, distribution or reproduction in other forums is permitted, provided the original author(s) and the copyright owner(s) are credited and that the original publication in this journal is cited, in accordance with accepted academic practice. No use, distribution or reproduction is permitted which does not comply with these terms.
*Correspondence: Giulia Anderson, giuliaa@spc.int