Exploring environmental and biological drivers of cetacean occurrence in the cross-border region of the Malin Shelf using data from a European fishery survey
 Morgane Pommier
 Ciaran O’Donnell
 Cynthia Barile
 Ross McGill
 Simon Berrow
 Joanne O’Brien
- 1Marine and Freshwater Research Centre, Atlantic Technological University, Galway, United Kingdom
- 2Fisheries Ecosystems Advisory Services, Marine Institute, Oranmore, United Kingdom
- 3Loughs Agency, Derry, United Kingdom
Irish and Scottish waters are important habitats for cetaceans in Europe. Yet, little data is available for the region of the Malin Shelf, north of Ireland. Despite a rich species diversity, relative cetacean abundance appears low compared to hotspots documented west of Scotland and Ireland. Whether this perceived low prevalence accurately portrays an ecological discontinuity or arises from a lack of published results and low survey effort in that transborder area remains unclear. Here, we used sighting records from a multi-disciplinary fisheries survey, the Western European Shelf Pelagic Acoustic Survey (WESPAS), to explore cetacean habitat preferences over the Malin and Hebridean shelves. Northern minke whale and common dolphin occurrence was modelled within a Bayesian Additive Regression Trees (BART) framework, against selected environmental and biological variables. No correlation was observed between cetacean presence and in-situ prey biomass. Minke whales distribution was better explained by oceanography, notably proxies for frontal activity, and primary productivity. Common dolphins similarly showed preferences for shelf waters within 5-25km of fronts, but also affinities for fine substrates. Favourable habitats identified by the models were consistent with literature around the Hebrides and shed light on potentially important areas along the Islay front and north of Donegal, so far unreported due to data deficiency. Results will contribute towards informing future monitoring, strategic management and conservation efforts in this cross-border region.
1 Introduction
Highly mobile species are oblivious to arbitrary human borders. Their distribution often fluctuates considerably in space and time, overlapping with different jurisdictions and adding to the many challenges faced by conservation ecologists (Runge et al., 2014). For instance, many cetacean species are accustomed to long-distance movements, travelling across large oceanic regions over relatively short time-frames. Nomadic species exhibit erratic, wandering, and relatively unpredictable movements across their habitat (Runge et al., 2015) (as opposed to migratory or resident populations’ more cyclic and regular movements). Although seasonality or stereotypical patterns can be observed, such dynamics are believed to be essentially resource-driven (Runge et al., 2014). In large predators with high metabolic requirements such as cetaceans, these diffuse displacements are likely dictated by prey movements, availability and quality, or by seasonal shifts in diet composition and/or foraging strategies (Macleod, 2004; Stern, 2009; Spitz et al., 2012).
Identifying key habitats and drivers of movement patterns of such wandering species is essential for adequate area-based conservation. Carefully placed and organised in coherent networks supported by international cooperation, marine protected areas (MPAs) can benefit even wide-ranging species (Notarbartolo-di Sciara, 2008; Runge et al., 2014; Conners et al., 2022). Yet currently, many MPAs, especially in coastal areas close to human populations, are too small or isolated to encompass the home range of highly mobile megafauna, and sometimes insufficiently aligned with animal movements and habitat use (Conners et al., 2022). Migratory and nomadic species protection might require adaptive and dynamic management tools such as transient or seasonal MPAs, centred on areas of high density - even if transitory -, or identified as critical for population functioning (O’Brien and Whitehead, 2013; Lindsay et al., 2016; Weir et al., 2019). Spatio-temporality of these sites can be decided upon species life history requirements, dynamics of ecosystem features likely to play a role in foraging-related movements, or temporary overlap of animals distribution with that of impactful human activities (Hooker et al., 2011; Scales et al., 2014b; Carlucci et al., 2021). In all cases, a solid understanding of animal distribution is essential.
Systematically surveying the entire habitat of wide-ranging species is practically impossible due to the financial and logistical constraints inherent to large-scale monitoring programmes. Modelled predictions of occurrence and habitat use, extrapolated from discrete observations are hence crucial to support conservation and management efforts (Redfern et al., 2006). Widely used in cetacean ecology, model outputs are key to pinpoint potentially important areas and threats, monitor and anticipate changes, inform decision-making processes and ensure adoption of optimal management approaches (Cañadas et al., 2005; Guisan et al., 2013; Paxton et al., 2014). The development of accurate and useful models, reliable enough to be applied in conservation ecology involves selecting the most appropriate predictors, which best explain the species pattern of occurrence (i.e. driving forces underlying animal distribution). This itself requires a baseline understanding of species ecology, ecosystem functioning and trophic interactions in order to identify such potential variables (Williams et al., 2012; Alessi and Fiori, 2014). Variables with direct physiological implications on a species, on which it would depend for its survival, would in theory appear among the best explanatory predictors. For cetaceans moving across their foraging grounds, direct prey field metrics (e.g. abundance, biomass, size, quality) would constitute ideal candidates (Embling et al., 2005; Lawrence et al., 2016; Receveur et al., 2021) but are in practice rarely readily available and need to be modelled themselves (Lambert et al., 2014; Virgili et al., 2021). For this reason, most cetacean distribution models use eco-geographical variables as proxies for productivity or prey habitats, sometimes offset by a few weeks or months to account for temporal lags between physical ocean processes and biological responses at higher trophic levels (Guisan and Zimmermann, 2000; Macleod et al., 2004; Redfern et al., 2006).
Environmental circumstances favouring biological production (e.g. combinations of temperature, salinity, light availability, hydrodynamics, nutrient supply) are not homogeneously or continually reunited in the ocean. Instead, optimal conditions occur sporadically in space and/or time, influenced by local topography and physical forcing, driving multi-scale productivity “hotspots” (Hyrenbach et al., 2000; Hazen et al., 2013). In response, many pelagic organisms exhibit patchy and highly fluctuating distributions. Apex predators with high-energetic needs often roam wide territories in search of prey (Hyrenbach et al., 2000; Block et al., 2011; Cox et al., 2018). Although opportunism rules in the pelagic zone, most species have adapted their foraging and habitat selection strategies to maximise their fitness, as proposed under the “Optimal Foraging Theory” (MacArthur and Pianka, 1966; Lambert et al., 2014; Mannocci et al., 2014). To limit the energy expenditure associated with foraging, many predators tend to favour regions of high and relatively predictable, if not stable, prey concentration (Cox et al., 2018). Important feeding areas associated with such aggregations can be located for instance near topographic features such as coastlines, channels, reefs, sea mounts, steep slopes, canyons, or offshore banks; dynamic but relatively persistent oceanographic systems such as an island’s wake, internal waves, ocean fronts and currents, or more ephemeral and variable phenomena such as seasonal thermal stratification, upwellings, spring blooms or eddies (Hyrenbach et al., 2000; Worm et al., 2003; Cox et al., 2018). As a result, the driving effects of physical forcing enhancing primary productivity has been shown to extend to movement patterns and phenology of nektonic species across many trophic levels (Cox et al., 2013; Scales et al., 2014a; Ostrowski and Bazika-Sangolay, 2015).
Continental shelves are among the most productive areas of our oceans (Sharples and Simpson, 2009; Simpson and Sharples, 2012). Irish and Scottish waters are important habitat for cetaceans in Europe, with historical records adding up to at least 30 different species sighted in either one or both Exclusive Economic Zones (EEZ) (Berrow, 2001; Reid et al., 2003; O’Brien et al., 2009). In Irish waters, Cetaceans on the Frontier (2009-2016) and ObSERVE-Aerial and Acoustic (2015-2016) programs represent to date the most abundant source of visual data for cetacean offshore occurrence (Counihan et al., 2012; Brown et al., 2014; Berrow et al., 2018). However, the former focused mostly on western and southern regions of the Irish EEZ, leaving the northern regions less explored. The ObSERVE-Aerial project addressed some of these gaps, allowing even coverage of the national shelf waters through repeated aerial surveys (Rogan et al., 2018). Yet, due to their design, line-transect surveys tend to inherently provide less coverage near the limit of the surveyed areas (Thomas et al., 2007). Therefore, when surveying national waters, border regions are often only marginally sampled. Based on publicly available literature and reports, it seems that few dedicated cetacean surveys have been specifically targeting the region of the Malin Shelf, northwest of Ireland and west of Scotland, which straddles the Irish and UK EEZs (Figure 1).
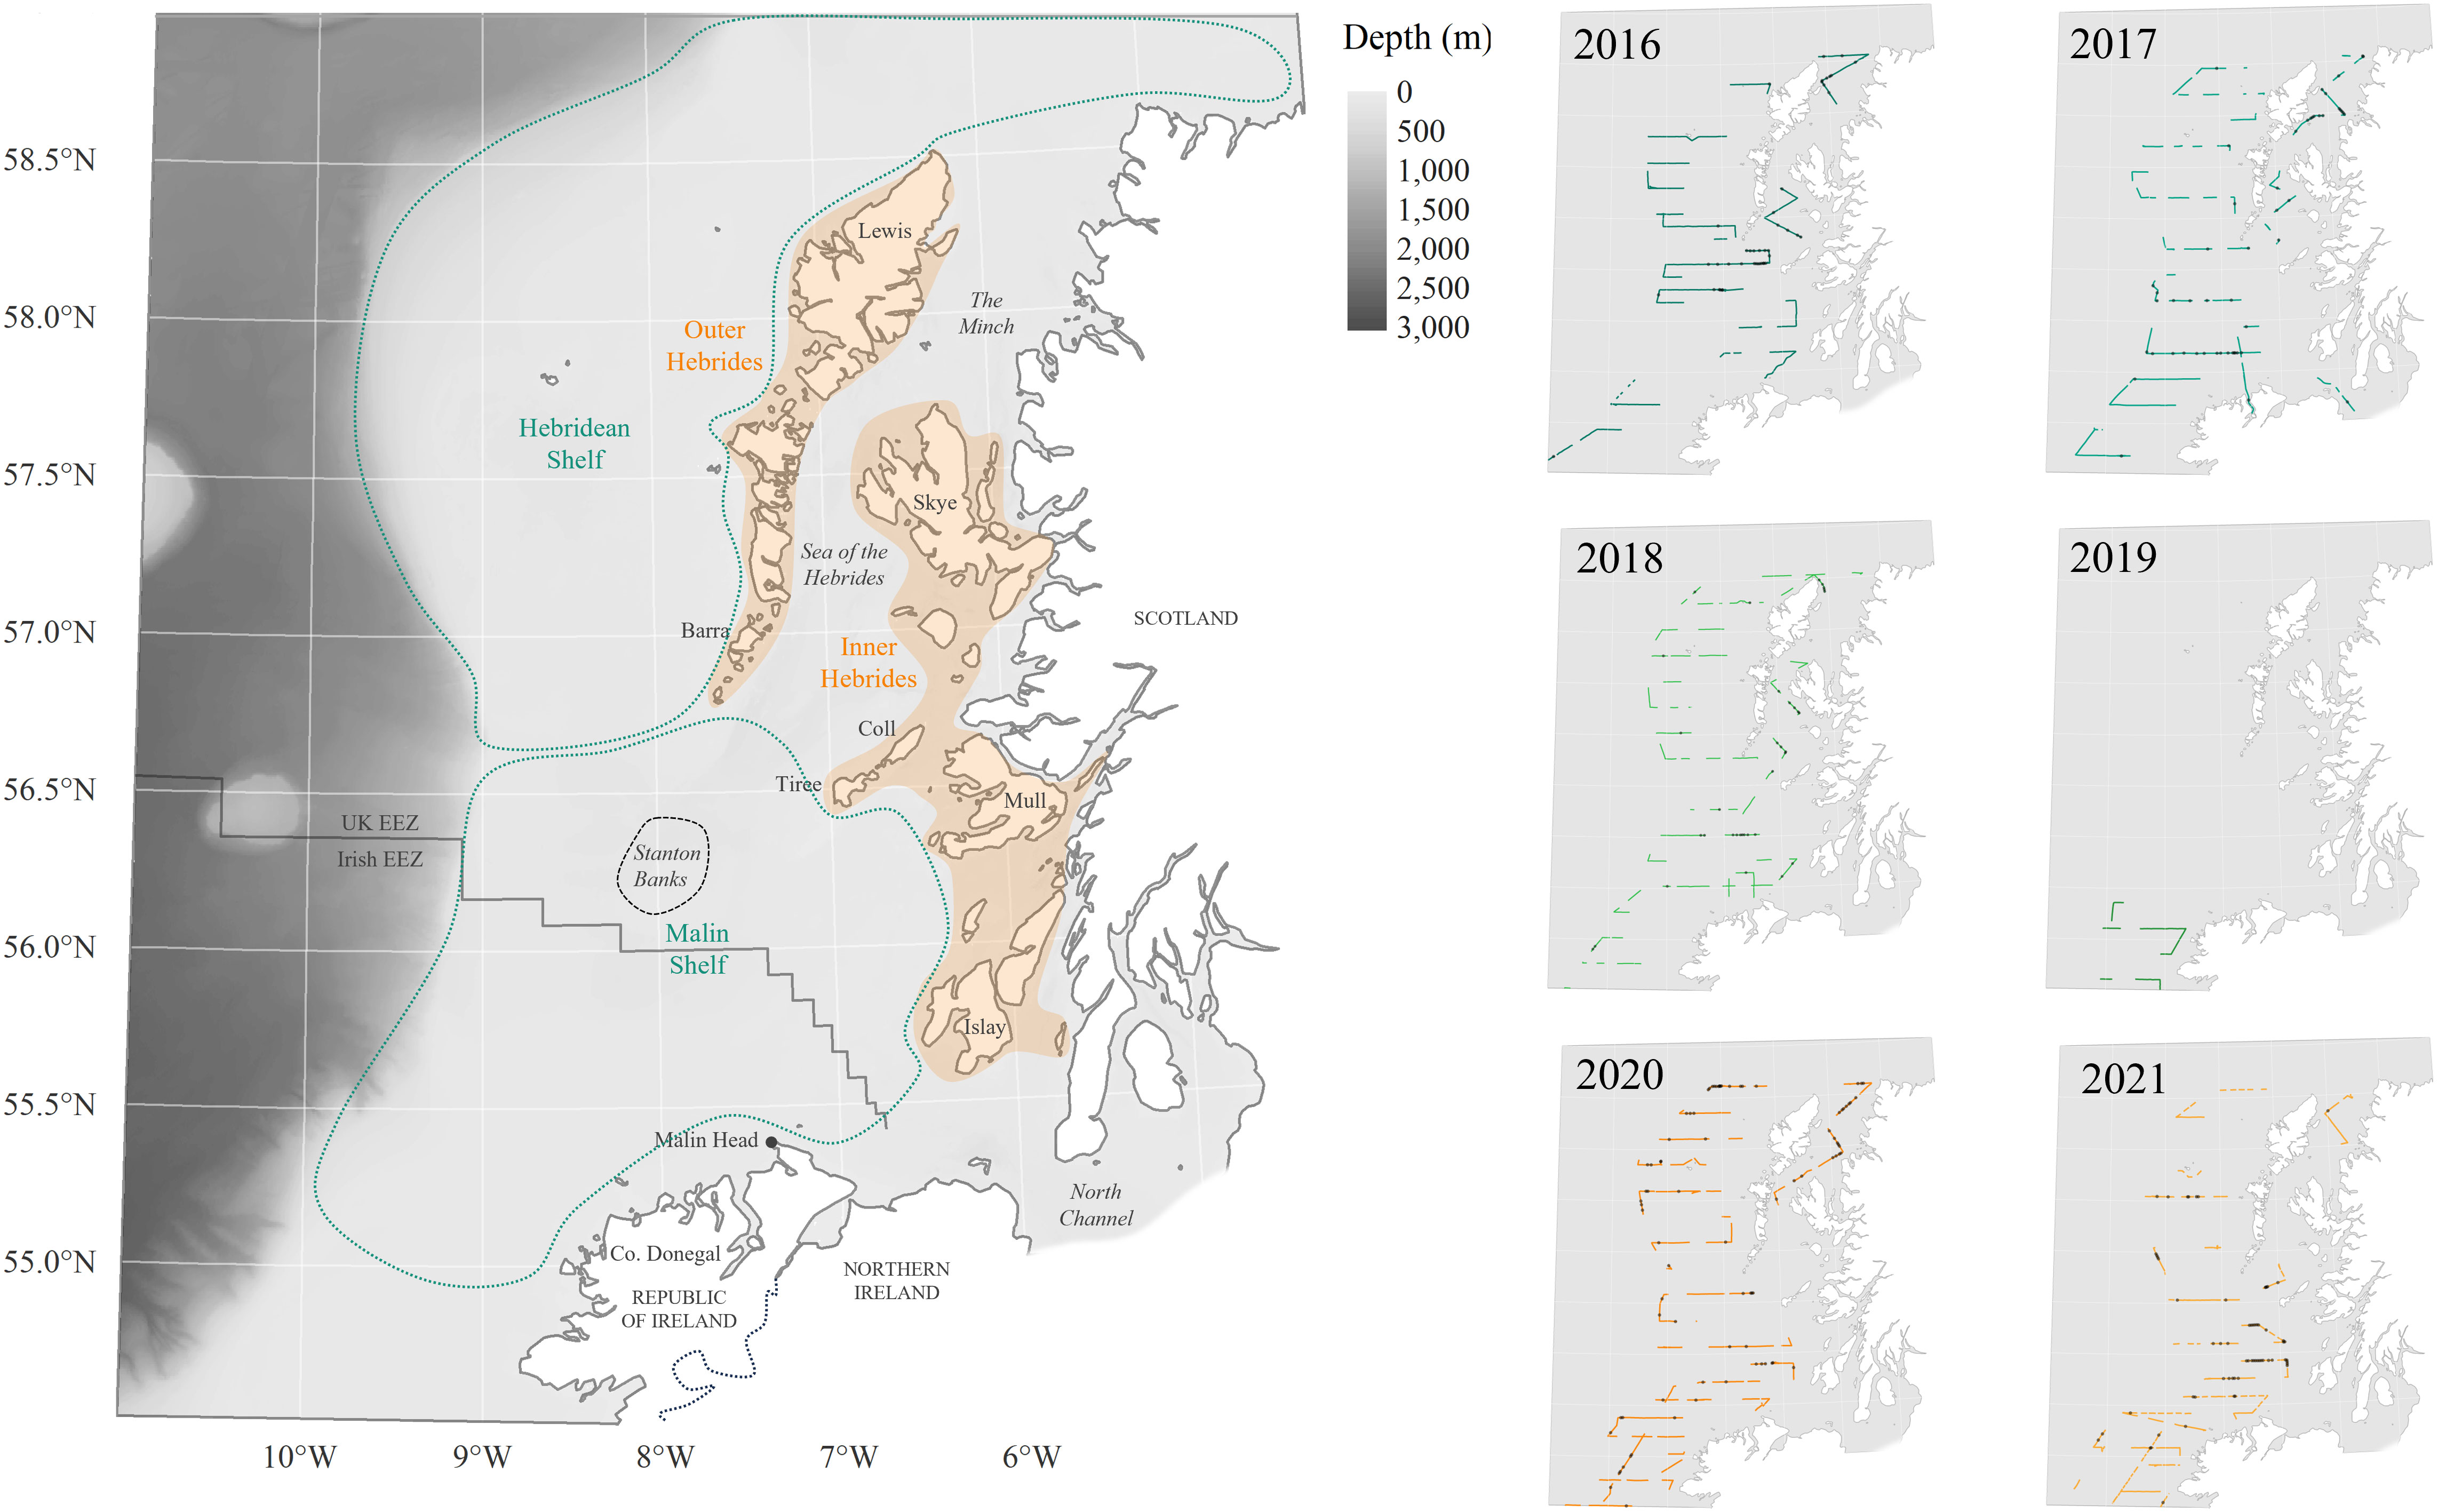
Figure 1 Study area, including geographical terms used throughout the manuscript, and MMO survey effort (tracklines) from 2016 to 2021. Black dots indicate cetaceans sightings.
As a result, little data is available on cetacean occurrence in that particular transborder area compared to the rest of Irish and Scottish waters (see (Pollock et al., 2000; Paxton et al., 2014; Hague et al., 2020) for examples of such gaps). Despite an apparent rich species diversity (Wall et al., 2006), relative cetacean abundance over the Malin shelf seems rather low compared to hotspots documented further north off the Hebrides, and west and south of Ireland (Northridge et al., 1995; Wall et al., 2006). As the environment is supposedly suitable for many species based on their current range and broad-scale habitat preferences (Waggitt et al., 2020), it remains unclear whether this uneven prevalence accurately portrays an ecological discontinuity or arises from a lack of published results and low survey effort in that transborder area.
Over the Malin Shelf, two water masses meet while converging northwards. Cold and low salinity waters from the shallow Irish and Clyde Seas exit the North Channel between Malin Head (Co. Donegal, Ireland) and Islay (Argyll, Scotland) while warmer, saltier waters from the Atlantic Ocean travel over the shelf in a north-east direction (Baxter, 2011), meeting in a frontal system first described by (Simpson et al., 1979) and commonly known as the Islay front. This dynamic tidal front is composed of two distinct features: a permanent thermohaline discontinuity, and a seasonal thermal front developing in spring and throughout the warmer months. Both coexist and overlap to some extent during summer (Hill and Simpson, 1989), before increasing autumn winds break down thermal stratification. Shelf fronts are known biological hotspots (Pingree et al., 1978; Holligan et al., 1981; Raine and McMahon, 1993) often exploited by predators (Scales et al., 2014a; Scales et al., 2014b; Cox et al., 2017). A range of planktivorous and piscivorous marine megafauna have been documented near the Islay front (Tasker et al., 1990; Doherty et al., 2017; Wakefield et al., 2017) but there has been no direct investigation of a potential influence on the seasonal habitat-use of the area by marine mammals, probably due to a lack of dedicated survey effort in the region.
The Western European Shelf Pelagic Acoustic Survey (WESPAS) program, initiated by the Marine Institute in 2016, is a consolidation of the former Malin Shelf herring and boarfish acoustic surveys, covering Irish and Scottish Atlantic shelf waters from 47°30’N to 58°30’N, from the 50m contour inshore to the onset of shelf-edge slopes (350m) (O’Donnell et al., 2021). Using active acoustics and complementary biological sampling to assess relative stock abundance of target species such as herring, horse mackerel and boarfish, this multidisciplinary survey also includes concurrent monitoring of marine megafauna, seabirds, zooplankton and in-situ oceanographic conditions. Every summer since its start, it has been extensively and systematically surveying the entire Malin Shelf. It provides one of the most comprehensive and longest on-going time series for visual observations of marine mammals in the region to date, along with simultaneous assessment of prey density, a link often missing in predator habitat models.
Here, we compiled sighting records from the last six WESPAS editions, aiming to fill the knowledge gap existing regarding cetacean occurrence over the Malin Shelf. We investigated drivers of most common species distribution, and particularly examined the influence of frontal systems by fitting habitat models with a range of selected biological and eco-geographical predictors. Combining marine mammal observations with concurrent active acoustic fish detection, we explored the potential relationship between predators distribution and prey biomass to complement and improve our understanding of the habitat models built using more traditional topography, oceanography and productivity proxies. Our ultimate objective was to identify any important areas and inform future monitoring and conservation effort accordingly.
2 Materials and methods
2.1 Data collection
Data were collected from the R.V. Celtic Explorer (ICES 209 acoustically-silent vessel) during the second leg of the WESPAS, covering the Malin shelf and Hebridean shelf from 54.5°N to 58.3°N every year from 2016 to 2021, usually between mid-June and mid-July. Survey coverage was initially informed by catch distribution from previous surveys, and designed following recommendations from the Manual for International Pelagic Surveys (ICES, 2015). The study area, stratified according to acoustic effort and geographical stock boundaries, was surveyed using parallel transect lines with randomised starting points within each stratum (Figure 1). Over the Malin Shelf, transects were typically spaced by 10 or 15 nautical miles (nmi) depending on the stratum (O’Donnell et al., 2021). Only sections of the transects actively surveyed by Marine Mammal Observers (MMO) during daylight hours and under suitable conditions were retained for analysis (Figures 1, 2). Although the present study aims are focused on the region of the Malin shelf in particular, survey data from the Hebridean shelf further north were also used to build the habitat models. Data in that area are more abundant and cetacean habitat has been more extensively described in the literature, and including the area in the model allowed 1) to increase the sample size available for analysis and 2) to provide “control” regions, where cetaceans habitats are already documented. This helped assessing plausibility and reliability of the models, and the degree of confidence when interpreting results obtained for the lesser known Malin Shelf. One to two trained MMOs were deployed on each survey leg (except in 2019), working shifts, a single observer at a time. Visual monitoring was conducted from the vessel crow’s nest at a height of 17.45m above water when conditions allowed, or from the monkey island located 14m above sea level. When travelling at constant speed and heading, MMOs followed a standard single-platform line transect survey protocol. At oceanographic sampling stations when the vessel was stationary (e.g. collection of CTD casts, fishing hauls or plankton samples), they adopted a single-platform point sampling approach. Effort was concentrated during daylight hours, when sea-state was ≤ 6 and in good or moderate visibility conditions (≥ 1km). Active surveying for animals was focused within a 120° arc ahead of the trackline, 60° abeam either side, but sightings up to 90° or further aft were also reported. Positional, environmental and sighting data were recorded using either Logger2000 (IFAW, 2000) or Cybertracker (Version 3.501)1 depending on the years. Geographical position was later corrected using the vessel positioning system records. Environmental conditions, including visibility, swell height and sea-state were logged during effort every 15 to 30 minutes, and concurrently to each sighting entry along with time, distance and bearing to the animals, group size, group composition and behaviour. Sightings were identified to species level when possible, and otherwise downgraded as unidentified dolphin, whale or cetacean. Only sightings made in sea-state up to 5 were considered for analysis, and any off-effort or incidental observations, made outside of periods of active searching, or by other crew members were discarded. Active acoustic surveying was carried out along predefined tracklines between 04:00 and 00:00 each day, times during which the target fish species adopt a typical single-species schooling behaviour. Data were collected using a Simrad EK60 scientific echosounder with split-beam transducers operating at 18, 38, 120 and 200kHz (O’Donnell et al., 2021). Echograms were scrutinised by experienced operators and echo-traces were assigned to species level using multi-frequency analysis based on (Jech and Michaels, 2006) and validated using relevant trawl catch data. Echo integration was performed along the transects using 1 nautical mile (nmi) as the elementary distance sampling unit (EDSU) to compute the Nautical Area Scattering Coefficient (NASC, m2.nmi-2). NASC values for the WESPAS surveys 2016-2021 were accessed through the ICES Acoustic data portal (ICES (2016; 2017; 2018; 2020a; 2021). ICES, Copenhagen.), log transformed and used as a proxy for prey biomass in the cetacean habitat models (Simmonds and MacLennan, 2008; Healy et al., 2013; Lawrence et al., 2016). In our study, we included as potential variable the NASC for herring and horse mackerel, known prey items for marine mammals in the area (Pierce et al., 2004; Brophy et al., 2009; Spitz et al., 2010). Other documented prey items such as sprat or blue whiting were not included because the NASC data were not available consistently throughout all survey years. Although information on boarfish biomass was collected from 2017 onward, it was not considered as a potential prey in the area. While it has been documented in the diet of predatory fishes and seabirds around the Azores, its spiny anatomy makes it unlikely to be targeted by predators in the presence of other abundant resources and it does not appear to be heavily preyed upon in the Northeast Atlantic (Egerton et al., 2017).
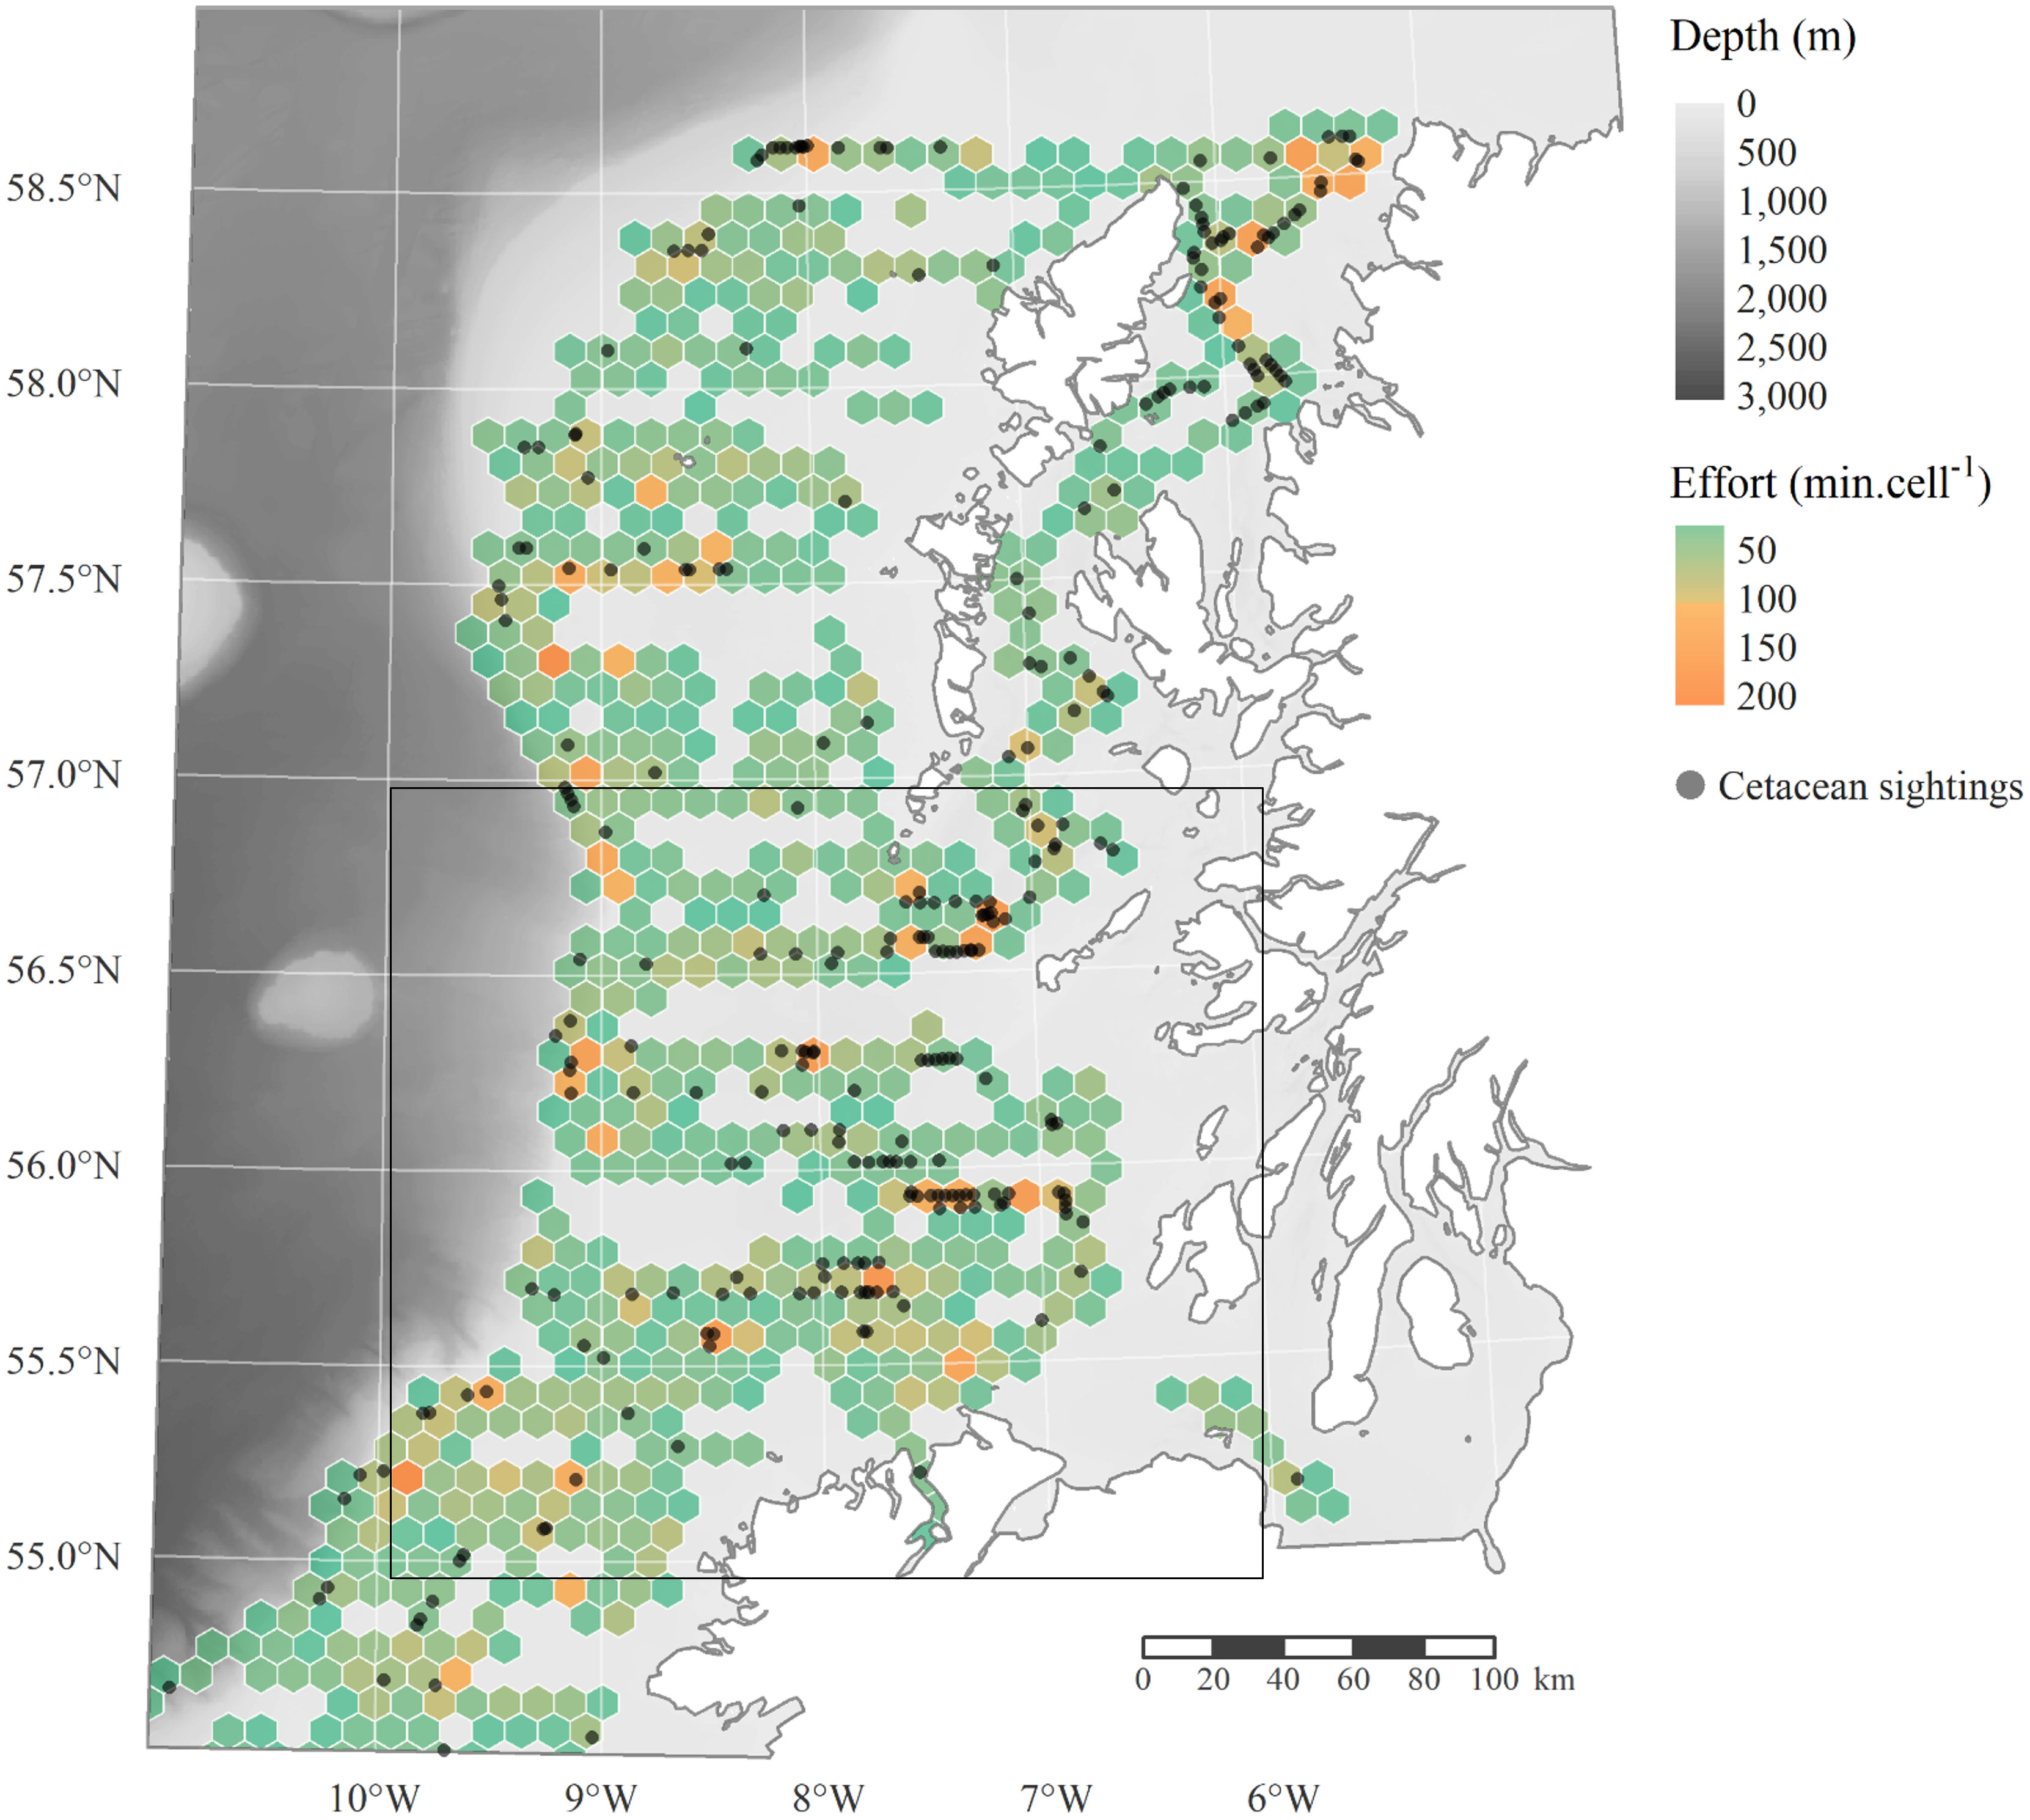
Figure 2 Search effort and cetacean sightings during the second leg of WESPAS, from 2016 to 2021. For better readability, cumulative effort (in minutes) has been summarised within 5nmi wide grid cells, but these are not used for analysis. The box outlines the main area of interest, referred to as the Malin Shelf throughout this manuscript.
2.2 Data preparation
Effort tracklines were split into 2km-long segments for analysis. To account for variability in platform activity and speed - inherent to the survey design and multidisciplinary nature (i.e. acoustic survey, hauls, trawls, CTD casts) - total effort duration (in minutes) was calculated for each segment and included as a covariate, along with seastate and swell height, known to affect animals detectability. Two distinct binary presence/absence datasets were generated for the two most common species, based on the occurrence of 1) minke whales (B. acutorostrata) and 2) common dolphins (D. delphis), by matching each sighting with the centroid of the closest on-effort segment surveyed that year. All spatial data manipulation was done in R on projected objects using the UTM-29 reference system (EPSG: 32929).
2.2.1 Environmental covariates
Due to the scarcity of previous work targeting the Malin Shelf area specifically, environmental variables potentially useful for habitat modelling were identified “a priori” based on previous work on cetaceans in North Atlantic waters (Anderwald et al., 2012; Breen et al., 2016; Giralt Paradell et al., 2019; Waggitt et al., 2020), using conceptual ecology frameworks describing features of interest (e.g. Hyrenbach et al., 2000; Cox et al., 2018), and geographic extent of the region (Williams et al., 2012). Four generic groups of environmental variables were examined, through a range of selected parameters: static habitat properties, oceanographic conditions, primary production and prey density.
Static, bathymetric and topographic covariates included depth, slope, aspect (decomposed into northness and eastness), roughness, distance to shore, habitat type and substrate nature. Bathymetric data were accessed through EMODnet online portal (EMODnet-Bathymetry, 2020) at a primary resolution of 0.002°x0.002°. Slope, aspect and roughness were calculated from the depth profile using the terrain() function from the ‘terra’ R package (Hijmans et al., 2023a). Northness and eastness were derived from the aspect taking its cosine and sine respectively (Sillero and Barbosa, 2021). Distance to shore was extracted from the MARSPEC dataset (Sbrocco and Barber, 2013) at a primary resolution of 0.008°x0.008. Habitat type (MSFD classification) and substrate data were extracted from the EUSeaMap 2021 European broad-scale seabed habitat map, accessed via EMODnet Seabed online portal (Vasquez et al., 2021). All static variables were down-sampled at a resolution of 0.01°x0.01° using the resample() function from the ‘raster’ R package (Hijmans et al., 2023b), to match the initial resolution of other environmental covariates and facilitate a scale selection process further described below.
Oceanography variables included basic physical properties of surface waters (e.g. temperature and salinity), mixed layer depth, and a range of frontal activity metrics. Daily instantaneous values (at 12:00 pm) for Sea Surface Temperature (SST, Potential Temperature, in °C), Sea Surface Salinity (SSS, Absolute Salinity in g.kg-1) and Mixed Layer Depth (MLD, depth at which a potential density difference of 0.03 kg.m-3 compared to a near-surface (-10m) reference value occurs) were extracted at a resolution of 0.01°x0.01° from the COMPASS-NEATL Hind-cast model developed by the Marine Institute. Data were accessed through the institute’s ERDDAP portal for the 2016-2020 period, and through the Scottish Association for Marine Science’s THREDDS data server for 2021 (Marine Institute, 2022; Marine Institute and Scottish Association for Marine Sciences, 2022). SST and SSS layers were used to compute daily frontal position, with ocean fronts defined where the surface gradient of water density exceeded a threshold of 0.075 kg.m-3.km-1. Following the TEOS-10 Thermodynamic Equations of Seawater (McDougall and Barker, 2011), Potential Temperature form the SST layer was first converted to Conservative Temperature using the gsw_CT_from pt() function from the ‘gsw’ R package (Kelley and Richards, 2021). Density (in kg.m-3) was then derived from Conservative Temperature and Absolute Salinity, using gsw_rho(), considering the Surface Sea Pressure equal to 0 dbar. Density gradient, as a measure of front strength, in kg.m-3.km-1, was computed for each grid cell. A binary metric (0 = absence of front, 1= presence of front) was further assigned to each cell based on whether or not the 0.075 kg.m-3.km-1 threshold was exceeded. The distance to the closest front was taken as the distance between each raster cell and the closest positive cell in the aforementioned front presence layer. Finally, a frontal probability index (i.e the probability for each cell to exceed the threshold over a defined period) was generated daily and weekly by taking moving averages of the binary frontal metric around each survey date.
Lower trophic level covariates included model-derived data for chlorophyll concentration, net primary production and phytoplankton concentration, all available through the Copernicus Marine Environment Monitoring Service online portal. Ocean colour in-situ observation products directly acquired from the satellite could not be used in this case due to cloud cover in the region, resulting in many missing data records at the temporal scales of interest (days and weeks). Daily values for chlorophyll-a concentration (CHL-a) were hence extracted from the cloud-free “North Atlantic Chlorophyll Daily Interpolated from satellite observations (Copernicus-GlobColour, L4, 1km x 1km)” dataset (CMEMS, 2022b). Daily layers of Primary Production (PP) and Phytoplankton Concentration (PC) at a 0.111°x0.067° resolution were retrieved from the “Atlantic- European North West Shelf- Ocean Biogeochemistry Reanalysis” (2016-2020) and “Atlantic - European North West Shelf - Ocean Biogeochemistry Analysis and Forecast” (2021) data products (CMEMS, 2022a). PP and PC values were integrated over the first 50 meters of the water column for each grid cell.
2.2.2 Scale-selection
Without a solid knowledge of a particular ecosystem or prior investigations, it is difficult to determine, and should not be assumed to which rate of environmental change animals will respond the most. Scales et al. (2017) confirmed through simulations that habitat models are sensitive to the spatio-temporal resolution of selected environmental predictors, and Pirotta et al. (2014) showed that dolphins and porpoises utilising the Moray Firth in Scotland responded to different scales of habitat variations. More and more, authors looking to model cetacean habitat-use implement a scale-selection workflow, aiming to assess which resolution is the most appropriate to use for any candidate explanatory parameter (Pirotta et al., 2014; Pirotta et al., 2020; Barile et al., 2021). Here, covariates were tested over multiple spatio-temporal scales, from the smallest corresponding to the finest unit of analysis, that is a segment size of 2km, to 5km and 10km; and from daily values to weekly and monthly means. Scales et al. (2017) showed that in wide-ranging animals exploiting dynamic ocean features, using too coarse resolution climatological layers can lower model accuracy. For this reason, and because the present study aimed at assessing the potential influence of a mesoscale tidal front which position and strength varies throughout summer, it was decided to limit the extent of spatial aggregating to 10km, and that of temporal averaging of oceanographic variables to weekly means. Monthly averages were therefore only considered for secondary ecosystem metrics such as chlorophyll concentrations, net primary production and phytoplankton concentrations. For productivity metrics, additional temporal scales integrating a 30-days offset before the sighting were also considered, to account for the time lag between processes occurring at lower trophic levels and their repercussion higher up the food chain, on potential prey of cetaceans (Correia et al., 2019; Pirotta et al., 2020; Lambert et al., 2022). The function aggregate() from the ‘raster’ R package (Hijmans et al., 2023b) was used to generate environmental layers at multiple spatial scales, and 7 and 30-days rolling averages were computed around each survey date to retrieve weekly and monthly means around each observation. For each study species, Generalised Linear Models (GLMs) were fitted individually to explain cetacean presence using only one predictor at one scale. For each variable, the model with the lowest Akaike’s Information Criterion (Akaike, 1974) was retained and the corresponding term included in the final SDM. When a delta in AIC lower than 2 units occurred between two candidate scales of a given variable (indicating little differences in model performance), decision was arbitrary with priority given to the finest spatial scale, followed by lowest temporal scale.
2.3 Data analysis
2.3.1 Model framework: Bayesian Additive Regression Trees
Decision tree-based algorithms are popular approaches in machine learning, capable of handling a diverse range of explanatory and response variables while accommodating missing values and outliers (De’ath and Fabricius, 2000; Malehi and Jahangiri, 2019). Classification and Regression Tree methods (CART) provide very flexible and robust, yet easily interpretable modelling frameworks able to accurately capture non-linear relationships and interactions between predictors. In ecology, they are particularly well suited for habitat modelling, to characterise and untangle complex ecological pattern and processes (De’ath and Fabricius, 2000; Moisen, 2008; Debeljak and Džeroski, 2011). However, without constraining (e.g. setting rules, for instance on maximum tree depth or information gain) or post hoc pruning (i.e. removing least informative sections of a tree), single decision tree models are prone to over-fitting, instability and high bias; leading to weak predictability when fed with new, independent datasets (Elith et al., 2008; Moisen, 2008). More recently, enhanced ensemble methods based on bagging, stacking, averaging or boosting of several trees have been developed and implemented to overcome limitations of standalone CART and improve generalisation. For instance, some of the most widely used sum-of-tree models in ecology are Random Forest (RF) and Boosted Regression Trees (BRTs) also known as Gradient Boosting (Breiman, 2001; Friedman, 2002; Elith et al., 2008). Bayesian Additive Regression Trees (BART) are a powerful and innovative Bayesian implementation of non-parametric function estimation, combining the strengths of both Bayesian statistical inference models and ensemble machine learning methods (Chipman et al., 2010; Carlson, 2020; Hill et al., 2020). Similar to BRTs, and opposed to RF which fits independent trees, BART combines sequential weak learners in a stagewise procedure: simple functions are fitted iteratively, with each new tree aiming to explain residual variance in data poorly classified by previous learners (Elith et al., 2008; Chipman et al., 2010). Unlike BRT however, where model parameters are kept constant, in the Bayesian approach, regularisation is introduced using a data-calibrated prior (Chipman et al., 2010; Tan and Roy, 2019; Hill et al., 2020), adjusted at each iteration. Posterior probability and predicted outcomes are inferred via an iterative backfitting Monte Carlo and Markov Chain algorithm (MCMC), sampling from a Generalised Additive Model’s (GAM) posterior distribution (Chipman et al., 2010; Hill et al., 2020). Overfitting in BART is minimised via ensembling and regularisation. Multiple weak learners are combined to get an average model, and the complexity of each contributing tree is further penalised by a regularisation prior forcing a simpler model and constraining each learner to only explain a portion of the relationship between explanatory variables and the response of interest.
Although only recently and seldom applied in SDMs so far, the BART framework has already shown promising results, equalling if not outperforming more traditional approaches such as GAMs, GLMs, MaxEnt, BRTs or Random Forest when compared on similar datasets (Carlson, 2020; Baquero et al., 2021; Konowalik and Nosol, 2021; Plant et al., 2021). Moreover, because BART integrates a full Bayesian inferential modelling framework instead of only a machine learning algorithm, it inherently captures uncertainty both in the function and model parameters. This allows for explicit quantification of uncertainty of predicted outcomes, and generation of credible intervals for model predictions (Chipman et al., 2010; Tan and Roy, 2019; Hill et al., 2020). Ubiquitous in SDMs, predictions errors are rarely reported on and yet essential to understand and consider in order to adequately and transparently interpret model outputs, especially if they are to be used in management plans (Barry and Elith, 2006).
2.3.2 Data exploration and transformation
While Bayesian regression tree approaches are generally considered robust to multicollinearity, missing data and outliers (Malehi and Jahangiri, 2019), it has yet to be investigated in the particular case of BART for SDMs (Carlson, 2020). Therefore, in the present study, for precaution and also because of potential implication on the scale-selection step utilising GLMs, we followed a traditional data exploration protocol recommended by Zuur et al. (2010) to identify and address where needs be some of these most common concerns (see Supplementary for details on data exploration steps).
2.3.3 Model fitting and retuning
BART models were fitted to each of the two datasets using the embarcadero R package (Carlson, 2020) and sample code from Baquero et al. (2021). Predictor selection was performed by an automated stepwise variable set reduction algorithm with a built-in complexity penalty, included in the variable.step() function. This selection algorithm has been previously tested on virtual datasets and found very robust to identify the minimal subset of relevant variables among the candidate covariates (Carlson, 2020). Starting with a full model, the function runs n iterations of a x-tree model (here set to n=100 and x=10), discards the least informative predictor, and repeats the process with the remaining variables, sequentially dropping them until only three are left. The best set of explanatory variables is returned based on the model presenting the lowest average root-mean-square error (RMSE). Although considered reliable, results from this automated process were further checked by the analyst to ensure plausibility and ecological relevance of retained variables, and identify any potential concerns. While BART performance consistently equals that of other machine learning methods using the default prior specification, it can be further improved by fine-tuning model hyper-parameters (Chipman et al., 2010; Baquero et al., 2021) within the embarcadero package (Carlson, 2020).
2.3.4 Model validation and evaluation
Validation is essential to assess a model’s predictive abilities. Ideally, it is conducted by testing the model on an independent dataset (Araújo et al., 2005; Araújo et al., 2019). When such data is unavailable in the area of interest, cross-validation, performed by training the model on a subset of the initial data and testing it on the remaining observations is a common and successful approach to estimate prediction errors (Roberts et al., 2017). Moreover, it can be used as a diagnostic tool to detect potential model overfitting. Poor performance on new data (i.e testing samples left out) would indeed indicate strong overfitting to the training dataset.
Ecological datasets are challenging and delicate to handle in that data points are rarely independent. Series of observations often present an underlying non-random structure, such as spatial or temporal autocorrelation, where samples close in space and/or time are more likely to yield similar observations. While such patterns are inherent to the biological processes they represent and should not be necessarily regarded as issues, they can affect data analyses and interpretation if overlooked. In a simple cross-validation approach where data is randomly split, this can lead to underestimation of model error and over-optimistic estimation of predictive performance (Araújo et al., 2005; Roberts et al., 2017). This can be addressed by controlling data partitioning, for instance by splitting records within spatial blocks, known as block cross-validation (Roberts et al., 2017). Following Baquero et al. (2021) and Valavi et al. (2019), the study area was partitioned into 50 x 50km spatial blocks using the Blockcv R package (Valavi et al., 2019), each assigned to one of 10 folds used in the cross-validation process.
Model performance and accuracy were appraised using the Area Under the ROC Curve (AUC) and the True Skill Statistic (TSS), two standard metrics commonly used to evaluate species distribution models, both independent from prevalence (Allouche et al., 2006; Baquero et al., 2021; Stephenson et al., 2021). Satisfactory performance thresholds were set to 0.7 for the AUC (ranging from 0 to 1) and 0.4 for TSS (ranging from -1 to 1), with values respectively higher than 0.8 and 0.6 indicating excellent performance (Allouche et al., 2006; Baquero et al., 2021; Stephenson et al., 2021). AUC and TSS were computed over each of the 10 spatial folds, both for the basic and retuned BART models.
2.3.5 Predictions
Final models were used to generate area-wide predictions of minke whale and common dolphin distribution. Given the highly fluctuating nature of some of the predictors investigated here such as dynamic frontal systems, using a set of environmental layers averaged over multiple years to generate prediction would risk masking fine scale features which location varies in time; and would not reflect any conditions occurring at sea. For these reasons, predictions were generated for each survey year separately, over the mean conditions for the survey duration only (approximately 15 days). To identify areas of consistent or recurrent favourability, the annual predictions, rather than the variables, were then averaged across years. Any covariate affecting detectability retained in the best models, such as sea conditions or effort duration, was set to an “ideal” value when generating predictions.
3 Results
3.1 Survey effort and cetacean sightings
Between 2016 and 2021, 7,075 km were surveyed by MMOs over the Malin and Hebridean continental shelves (Figure 2). A total of 303 cetacean sightings were reported, of at least 10 distinct species (Table 1): seven odontocetes, including common, Risso’s, white-beaked, Atlantic white-sided and bottlenose dolphins, long-finned pilot whales and harbour porpoises; and three mysticetes among which minke, fin and humpback whales. Minke whales (n=88) and common dolphins (n=80) were the most frequently encountered species in the region, followed by Risso’s dolphins (n=19) and fin whales (n=18). Time spent on effort was not perfectly homogeneous throughout the area, and some of the most surveyed regions were logically associated with higher sighting rates, but this pattern was not systematic (Figure 2). Solely based on the sighting’s distribution and clustering across the years, and while acknowledging a high degree of variability between surveys, three hotspots seemed to emerge 1) in the Minch; 2) south of the Outer Hebrides, off Tiree and Coll; and 3) north of Malin and west of Islay (Figure 2).
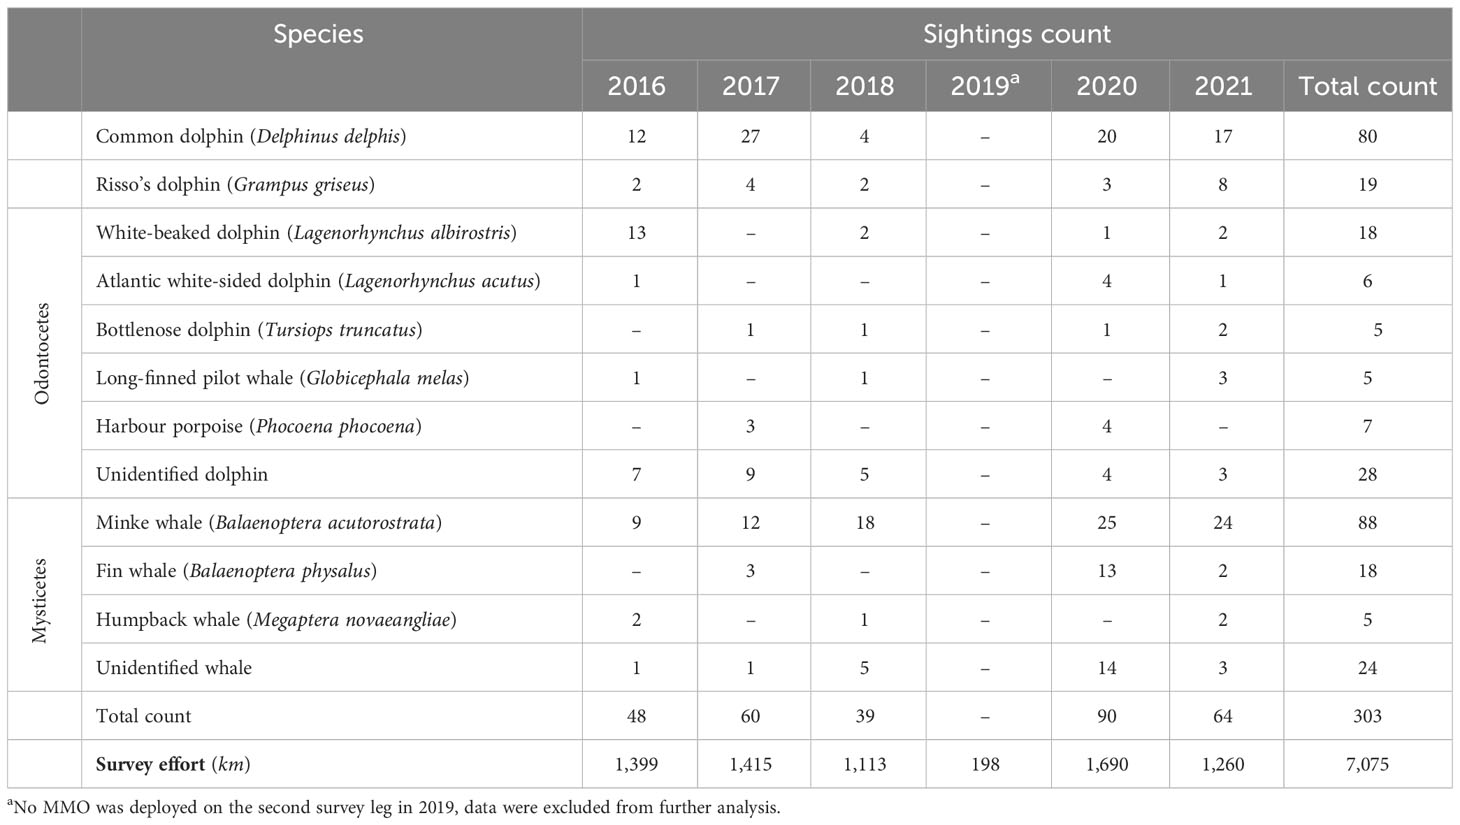
Table 1 Overview of survey effort and cetaceans sighting counts during the 2016-2021 WESPAS surveys.
3.2 Variable selection and model evaluation
Single species SDMs were fitted for the two most common species, minke whales (B. acustorostrata) and common dolphins (D. delphis). For the minke whale dataset, the scale selection workflow retained as candidate predictors distance to shore and topographic variables at a 0.02°x0.02° resolution, while substrate and habitat type were selected at a coarser scale of 0.1°x 0.1°. All oceanographic variables had the best - or equally good explanatory power (delta AIC ≤ 2) - as 0.02°x0.02° daily values, except for density gradient, which was selected as a weekly average, and frontal probability index, also considered as a weekly average but of the 0.1°x 0.01° layer. Chlorophyll-a was selected at a daily 2km x 2km resolution, phytoplankton concentration as a 0.333°x0.20001° weekly average, and net primary production as a 1-month-lagged 0.111°x0.0067° monthly average. Horse mackerel NASC was retained at the finest available scale of 1 nmi while herring NASC had a lower AIC as a 3 nmi moving average. Following the same process for common dolphin presence/absence records, all static variables were selected at a 0.02°x0.02° resolution, and all oceanographic variables as daily values at a 0.02°x0.02° scale, except for density gradient which was best suited as a weekly average. Chlorophyll-a was retained at a 5km x 5km daily resolution. Both net primary production and phytoplankton concentration were selected as 1-month lagged monthly averages, the former at 0.111°x0.0067° and latter at 0.333°x0.20001° resolution. Herring and Horse Mackerel NASC were both considered as 1 nmi values. Multicollinearity was assessed within each of these variable sets using VIFs and Pearson’s correlation coefficient. Bathymetry, slope and roughness were highly correlated (Pearson’s coefficient ≥ 0.7) (Figure S1). The predictor with the lowest AIC in each instance was retained, namely roughness for minke whales and bathymetry in the case of common dolphins. Habitat type was discarded for both species due to a very high VIF, probably because of co-dependence with substrate type. In the minke whale dataset, density gradient was preferred over frontal probability index (Pearson’s = 0.72). After discarding the aforementioned predictors, all VIFs and correlation coefficients were checked again to ensure they met the acceptable threshold. The variables that passed scale selection and collinearity checks were then subjected to the automated BART variable selection algorithm to identify the most useful (i.e. informative) set of predictors to explain species distribution. In minke whales, the function returned, in order of importance (relative contribution to variance explanation): seastate, phytoplankton concentration, density gradient, SST, distance to front, MLD, SSS and coarse substrate. While horse mackerel NASC was initially included in the output of the selection algorithm, it was manually discarded by the analyst. Reasons for this were that i) removing it still reduced RMSE (see Figure S2), and ii) the variable, extremely zero-inflated, was associated with very wide credible interval in terms of effect on the model outcomes, as visualised on partial dependence plots during data exploration. For common dolphins, the best set of model predictors included distance to front, SSS, phytoplankton concentration, effort duration, presence of muddy sand, seastate and presence of fine mud.
Evaluation metrics for the final models, retuned and fitted on the full datasets, were AUC = 0.91 TSS = 0.69 and AUC = 0.90 - TSS = 0.67 for minke whales and common dolphin models respectively, demonstrating excellent performance in both species (Figure S3). Results from the cross-validation also yielded excellent results, with a mean AUC of 0.91 (range: 0.87-0.93) and 0.87 (0.84-0.90) across all folds for minke whales and common dolphins respectively. TSS measures were satisfactory too, ranging from 0.61 to 0.71 in the minke whale model, with a mean of 0.66, and from 0.52 to 0.64 in the common dolphin model, for an average of 0.58 (Figure S3). Although lower than the values achieved with the full datasets, these results confirmed that the model did not overfit, and accurately performed on different data subsets. As the post-retuning performance of the full model was similar if not better in both cases, it was selected over the default parameter model for final predictions. However, it is worth noting that in the case of common dolphins, results from the cross-validation on the retuned model were more dispersed in terms of AUC and TSS, highlighting lower homogeneity in model performance across folds (Figure S3).
3.3 Environmental drivers of cetacean occurrence
Figure 3 presents partial dependence plots, showing the marginal influence of each individual predictors on the outcome of a the model, once removed the average effects of all other explanatory variables. For more clarity and coherence, plots are discussed thereafter grouped by variable type (oceanography, primary production, static variables, survey covariates) rather than in order of appearance. All results presented below focused on sections of the plots where most of data points were available. As a general rule, no conclusions should be drawn from portions of the curve derived from little data as they are generally associated with wide credible intervals. Caution should be used when interpreting such relationships.
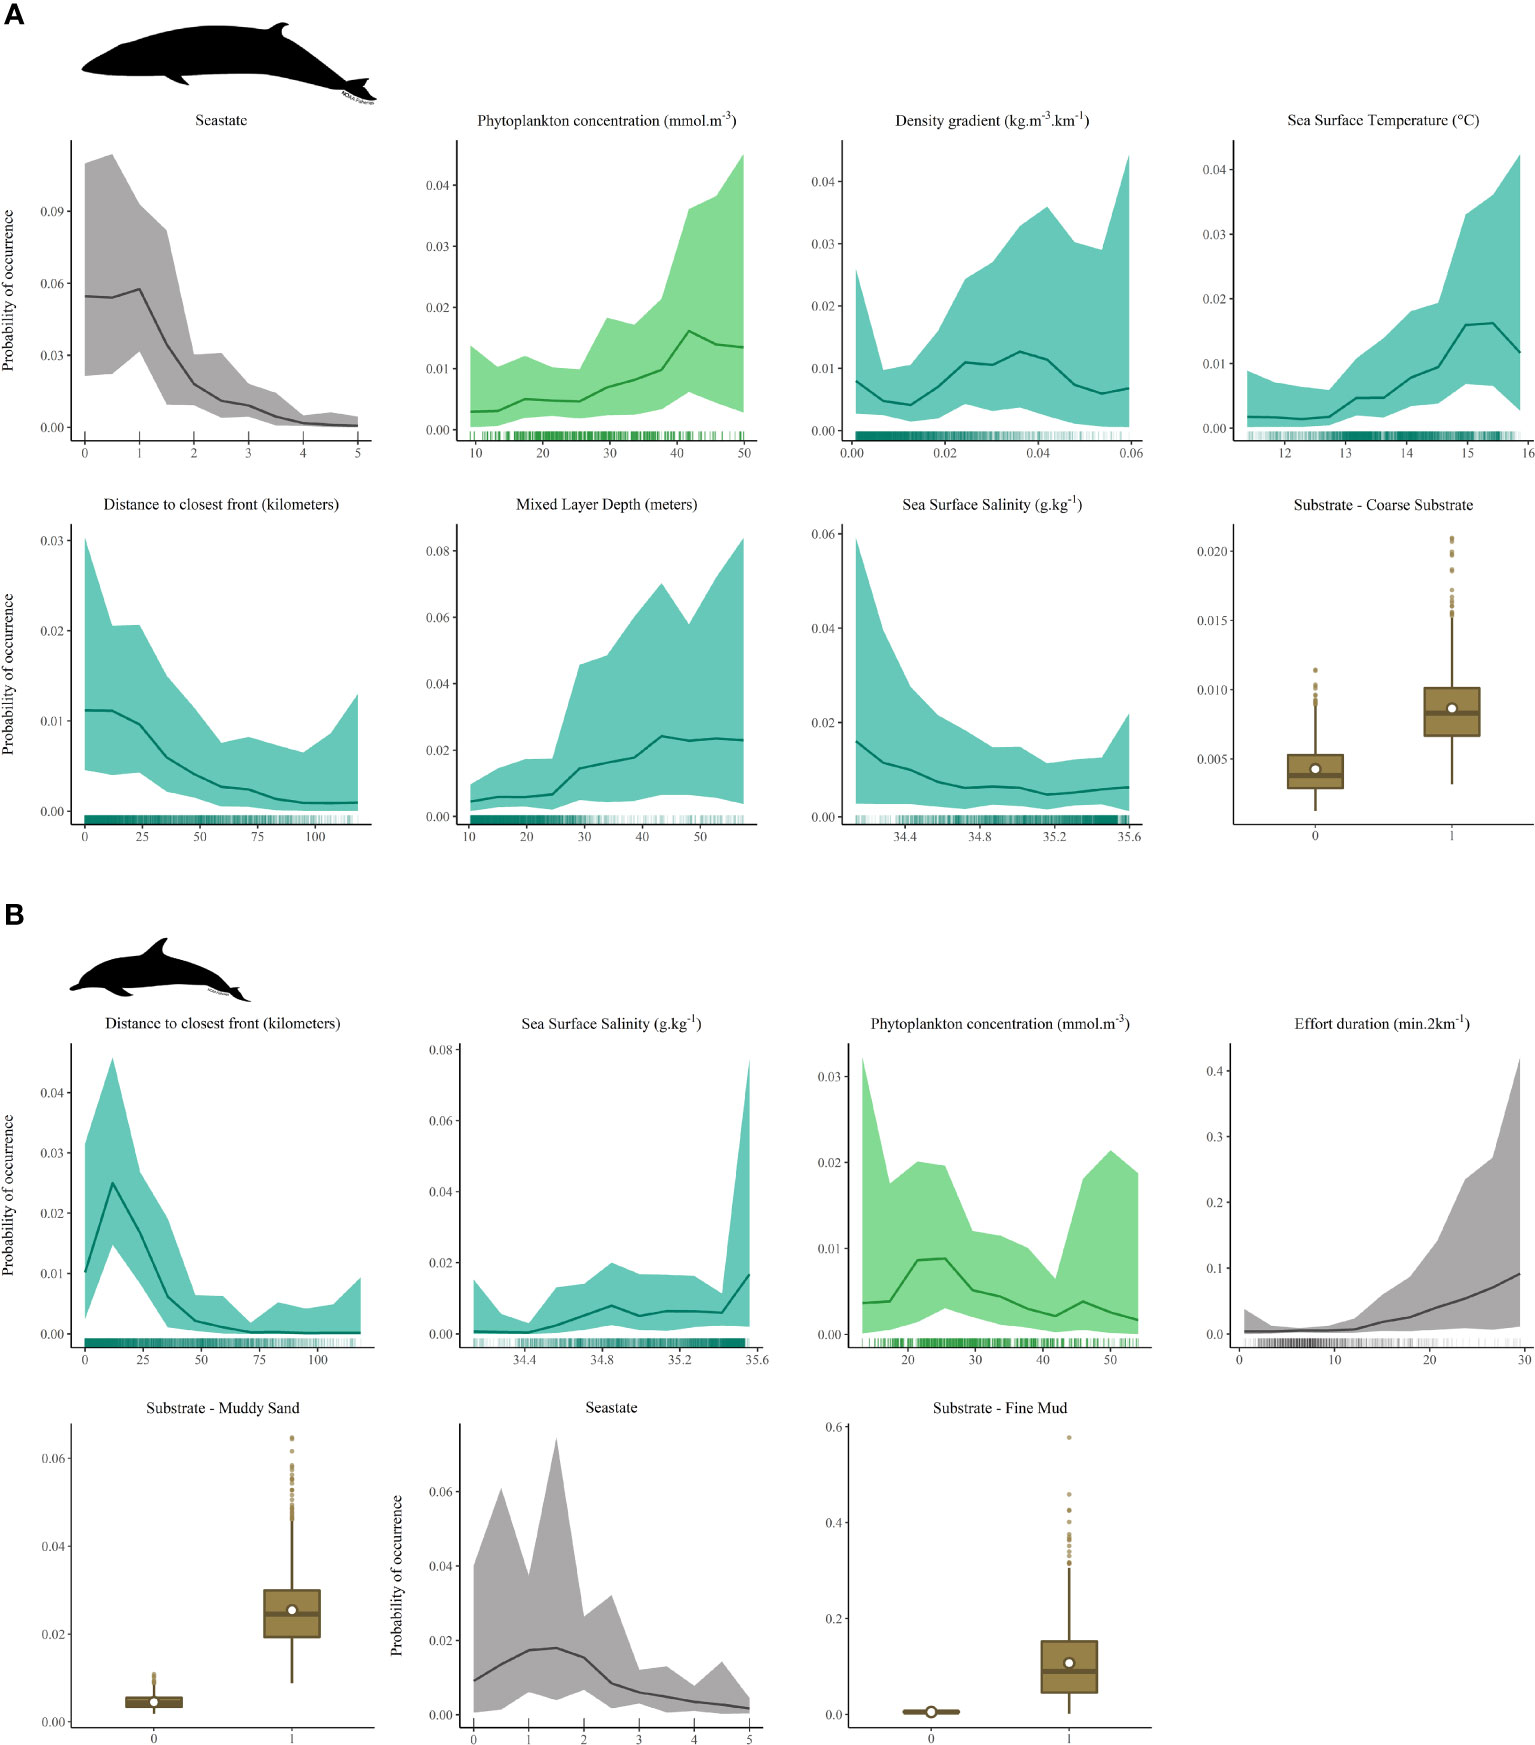
Figure 3 Partial dependence plots for each of the covariates retained in the final retuned models (A) minke whales (B.acutorostrata). (B) common dolphins (D.delphis). Rug plots on the x-axis show the distribution of raw data points. Plots are presented following the order of importance of predictors in the retuned model. Y-axis scales differ from one plot to another depending on the magnitude of the response to the explanatory variable.
Partial responses for B.acutorostrata (Figure 3A) highlighted a preference for waters of slightly lower salinity, typical of regions influenced by coastal currents and nearby freshwater runoff. Probability of occurrence was also higher for warmer temperatures, increasing steadily between 12.5 and 15.5°C. Minke whales seemed to favour frontal zones as they were more likely to be found within 15km of a front, near stronger density gradients and areas of high primary productivity (i.e. higher concentration of phytoplankton). Mixed layer depth appeared positively related with whale presence, although the credible interval for this response was very large. Overall, the species probability of occurrence was lower over coarse substrate than any other substrate type. Unsurprisingly, chances of encountering, or in this case rather detecting a whale decreased rapidly as seastate increased. This however resulted from limitations in the survey method and does not have any ecological relevance for the species.
Contrary to B.acutorostrata, D.delphis (Figure 3B) was preferentially associated with higher salinity, reflecting affinities for more oceanic habitats rather than most coastal waters. The probability of encountering common dolphins peaked at approximately 15km from a front, before decreasing the furthest away from it, similarly to what was observed for minke whales. Phytoplankton concentration was selected in the common dolphin model as 1 month-lagged monthly average. The survey usually taking place in early/mid-summer, this effectively represents the conditions in late spring. The partial response plot showed an initial increase in dolphins presence likelihood with increasing phytoplankton concentration, with a peak between 20 and 30 mmol.m-3, followed by a gradual decrease towards higher values, although a large credible interval was associated with the response curve. The species seemed to occur more frequently where the seabed was covered with fine mud or muddy sand. As for the minke whales, increasing seastate was associated with lower probability of detection. For common dolphins, effort duration further affected species detectability, with increasing effort duration per survey segment (i.e due to lower speed and/or different platform activity) correlated with higher chances of a sighting. This could arise from a typically more inquisitive behaviour of the species, and potential attraction to the vessel (e.g. bow riding).
3.4 Predicted distribution and habitat favourability
Probability of occurrence for minke whales and common dolphins, averaged over the entire study period, are presented in Figure 4 along with credible intervals associated with the model predictions. Chances of encountering minke whales were higher in the Hebridean Sea and along frontal zones over the Malin shelf. These patterns existed even at the lower end of predictions credible interval, and were more pronounced towards its upper bound, with regions south of Skye, west of the Outer Hebrides, west of Tiree and along the Islay front displaying highest presence probabilities. For dolphins, predictions were more broadly distributed from the coast up to mid-shelf waters, gradually decreasing towards the edge, with local hotspots associated with mud-dominated seabeds. Uncertainty was overall very high in both species but particularly in dolphins. Probabilities of presence were relatively low, probably due to the small number of cetacean sightings in comparison to survey effort. In order to better visualise their habitat preferences, presence likelihoods returned by the models were converted into a favourability index (Real et al., 2006), representing habitat suitability for a species independently from its prevalence in the region.
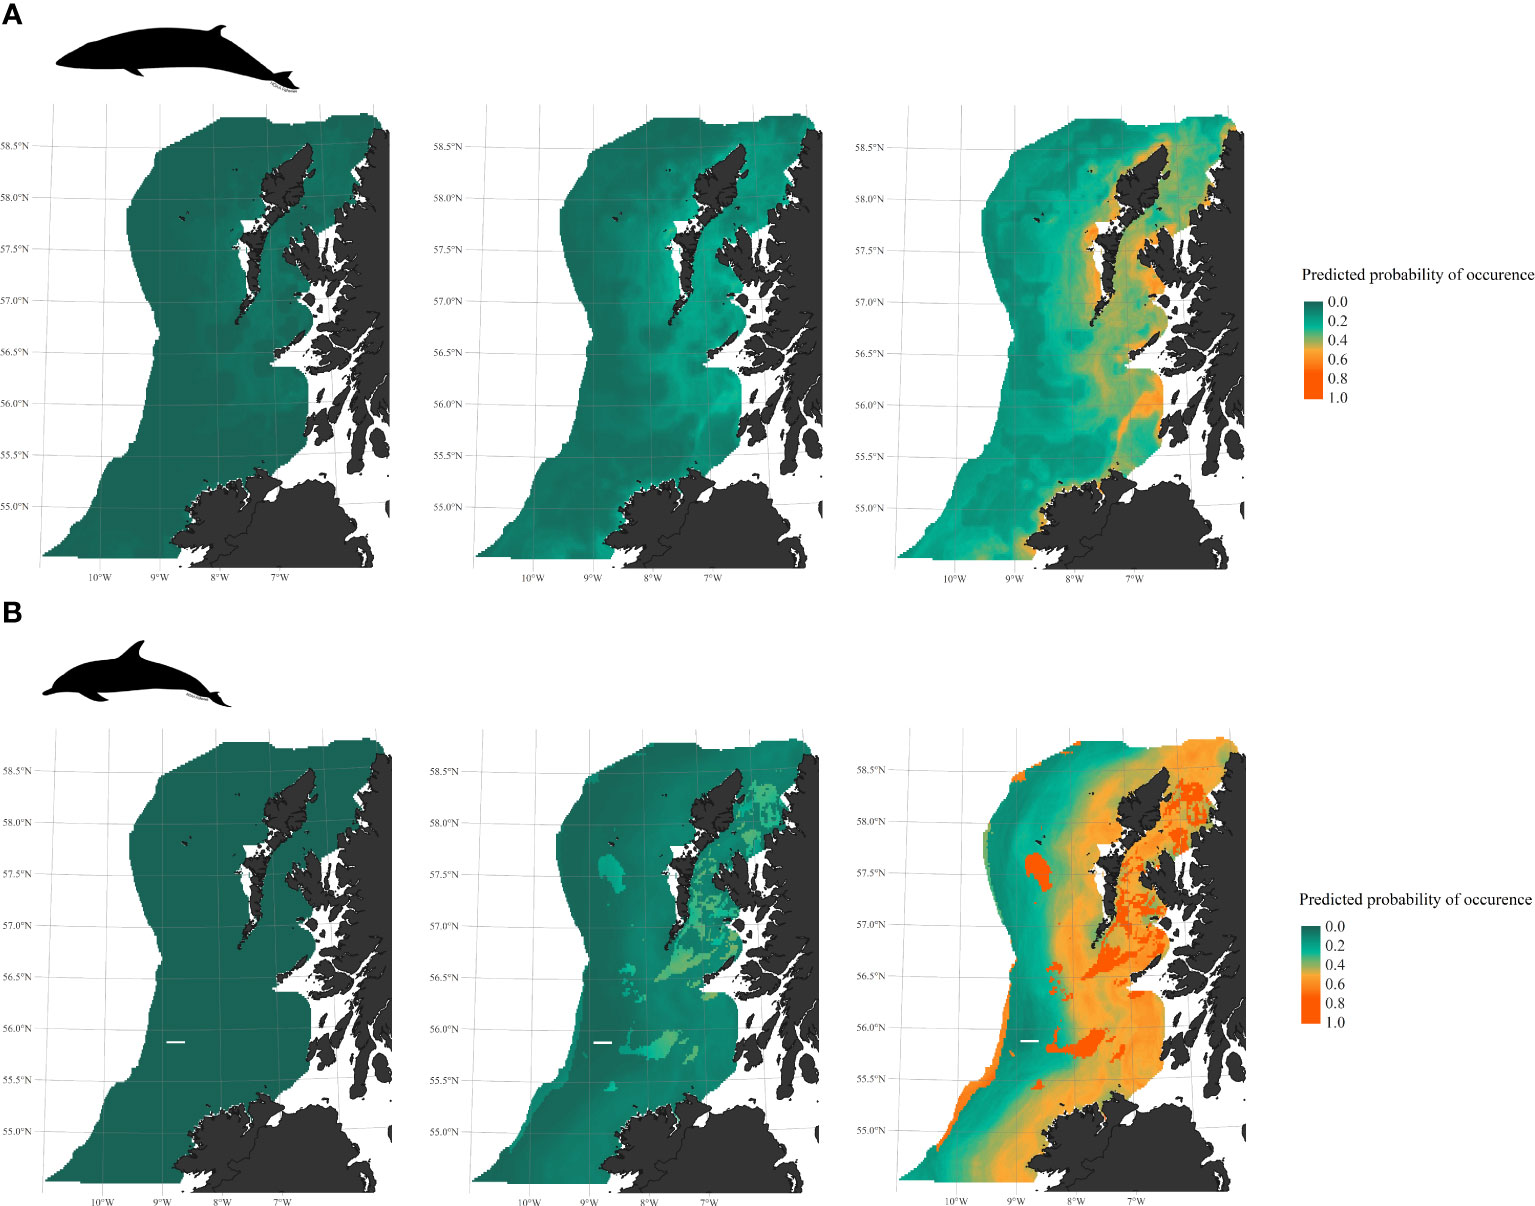
Figure 4 Predicted probability of occurrence, averaged over the study period, and associated 95% credible intervals. (A) minke whales (B.acutorostrata). (B) common dolphins (D.delphis) occurrence.
According to the averaged habitat favourability map for minke whales (Figure 5A), most recurrent hotspots are found around the Outer Hebrides, in the Minch, south of Skye, west of Tiree, along the Islay front, and along the coast of Donegal. In 2016, favourability was predicted to be highest in the Hebridean Sea, south of Lewis and along the Islay front (Figure 5B). Similar patterns were derived for 2017 and 2018, with suitability in the Malin Sea gradually increasing over time, extending further offshore over the shelf. Favourable conditions were spatially more restricted in 2020, confined to more northern regions and localised frontal zones off Tiree and Islay. In 2021, favourability was very high over most of the study area. Despite being trained on all data pooled together, the model was still efficient at capturing variability between years based on the fluctuations of environmental predictors alone. For instance, the more discrete hotspots pictured for 2020 closely matched actual sightings locations that year.

Figure 5 Habitat favourability for B.acutorostrata, (A) averaged over the study period and (B) per survey year.
For common dolphins, habitat was found consistently suitable within 100km of the Irish and Scottish coasts, with more specific hotspots associated with fine mud and muddy sand beds near the Hebrides and north of Malin Head (Figure 6A). Examining annual maps, we observe repetitive patterns in 2017, 2020 and 2021, with a wide band of suitable habitat stretching from south to north along the coastline. In 2016, the coast of Ireland appeared less optimal for dolphins compared to Scottish waters. In 2018, patches of most optimal habitat were wide-spread but more fragmented throughout the study region, (Figure 6B).

Figure 6 Habitat favourability for D. delphis, (A) averaged over the study period and (B) per survey year.
4 Discussion
In this study, we compiled and analysed one of the most comprehensive datasets of cetacean sightings over the Malin Shelf. Records adding up to at least ten different species of baleen whales and odontocetes confirmed the high taxonomic diversity in these waters in summer. We investigated habitat preferences of two of the most common species in the Malin Sea, minke whales and common dolphins, so far underdocumented in the area compared to regions further north around the Hebrides and south west of Ireland. Main findings and potential implications for conservation are discussed below.
4.1 Limitations and potential bias
To investigate patters and drivers of cetacean occurrence in our study area, we used BART, a decision tree-based modelling technique only recently applied to SDMs. Like other CART approaches, it is a flexible method able to fit interactions and capture the complex surface responses typically underlying ecological data (De’ath and Fabricius, 2000; Barry and Elith, 2006; Debeljak and Džeroski, 2011; Carlson, 2020). The BART framework further integrates a probabilistic estimation of posteriors through MCMC, allowing quantification of errors and credible intervals around model parameters and predictions. In both species, model performance was deemed excellent based on results from cross-validation. Yet, as in most modelling studies, some limitations remain and need to be acknowledged to ensure transparency when interpreting model outputs and drawing conclusions. Uncertainty was overall very high both in the minke whale and common dolphin models, particularly in areas identified as most suitable. As pointed out by Paxton et al. (2014), of all predictions, the lower bound of credible intervals is of most interest for spatial planning. Regions still standing out once potential overestimation of presence surfaces removed can be regarded as stable habitat, despite model uncertainty. Low sample size is a common source of model errors. Although survey effort and spatial coverage achieved through WESPAS were important, the number of sightings remained quite low (n = 87 and n = 78). Cetaceans are cryptic species, spending most of their time underwater out of MMOs sight, undetectable visually outside of daylight hours, and becoming rapidly difficult to spot in choppy seas and in poor weather conditions. Possible disturbance from the vessel presence could further hamper observations by affecting cetacean behaviour. Availability bias and unstable detectability further introduce some almost inevitable false-absences in datasets relying only on visual survey techniques, biases that are known to affect model performance (Lahoz-Monfort et al., 2014; Guillera-Arroita, 2017; Guélat and Kéry, 2018). While efforts were made to account for covariates affecting visibility, detectability was not directly quantified and integrated in the models. Collecting additional data to increase the sample size, and explicitly accounting for imperfect detection at the model definition stage would surely benefit accuracy and lower uncertainty (Rota et al., 2011; Guillera-Arroita, 2017). We also recommend models to be further validated using external datasets as they become available, for instance using the 2022 and 2023 WESPAS campaigns data.” Extending the time-frame available for analysis and including a temporal component in the model would also allow monitoring of potential shifts in distribution driven by current ocean changes. Barry and Elith (2006) stresses the importance of “global” versus “local” errors, which often interact and affect models reliability to various extents. While global error in a predictor is uniformly spread over the entire study area, local errors arise when the animal response to similar conditions of a given variable varies spatially. Such errors can occur for instance from proximate covariates unaccounted for at model design and specification stages, either because of lack of ecological knowledge, or because of data unavailability (explaining the use of indirect predictors and proxies). Functions fitted exclusively with environmental parameters, as reported here, are often insufficient to explain species spatial distribution (Barry and Elith, 2006). The survey region does not include the current limits of minke whales or common dolphins full range in the north east Atlantic (Perrin, 2018; Perrin et al., 2018), hence physiological limits are unlikely playing a significant role there. Any environmental conditions occurring in the study area, even if sub-optimal, would be suitable enough for their survival, meaning that both species, very mobile, could virtually be spotted anywhere. Patterns observed and characterised here are a reflection of habitat preferences and active selection rather than pure restriction or unsuitability. Trophic, mutualistic or antagonistic interactions with other species and individuals, most likely influencing animals response to their environment, were not captured here. Missing biological covariates, as well as a lack of information on disturbances probably explain some of the model errors and short-comings. Local differences in these interactions (i.e. change in prey availability, presence of competing species), added to spatial disparities in stress and threats exposure potentially drives fine-scale patterns masked within the full model. Additionally, most of the predictor layers used for analysis were outputs of remote sensing or model products, themselves coming with their own degree of uncertainty caused by random, biased or spatially clustered errors (Barry and Elith, 2006). Considering all these potential limitations, which are reminders for cautious interpretations of model outcomes, the following sections present and discuss the main results of our study.
4.2 Minke whales
B. acutorostrata was the most frequently sighted cetacean species along the northern leg of the WESPAS surveys. Minke whales are the most common baleen whales around the UK and Ireland. Although sightings have been reported year-round (Reid et al., 2003; Wall, 2013), abundance usually peaks from late spring to early autumn (Weir et al., 2001; Evans and James, 2016; Risch et al., 2019), concurrently to their northwards migration from southerly breeding grounds to higher latitude feeding grounds (Risch et al., 2014). Inshore density is typically at its highest around the time of the WESPAS. Favourability maps indeed pictured a clear preference for relatively shallow and coastal waters of the Hebridean and Malin continental shelves. Yet, neither topography, bathymetry nor distance to coast were retained in the most parsimonious set of predictors. Animals inshore distribution may have already been captured in the model by affinity for slightly lower salinity waters influenced by coastal currents (Correlation coefficient Salinity/Distance to shore = 0.59). This distribution aligns with many previous studies on minke whale occurrence in Irish and Scottish waters, where depth or distance to shore were often determinant factors, particularly in summer when the species undergoes an inshore movement (MacLeod et al., 2007; Robinson et al., 2009; Anderwald et al., 2012; Breen et al., 2016).
In the present study, B. acutorostrata habitat preferences were closely tied to oceanographic conditions and mesoscale features driving ocean productivity. Presence likelihood increased with SST, and frontal zones and other discontinuities in water masses seemed particularly important, with whales showing inclination for high density gradients, short distance to fronts, deep mixed layer and high phytoplankton concentration. Scott et al. (2010) similarly concluded that the extent of vertical mixing, stratification and primary productivity were important drivers of the occurrence of many predators in shallow shelf seas off the east coast of England, where minke whale were preferentially associated with moderately stratified waters and high chlorophyll concentration. Likewise, Boer (2010) reported high densities of minke whales near an offshore sand bank affected by a tidal mixing front and seasonal stratification triggering productivity patches of high phytoplankton, zooplankton and larval fish concentration (Pedersen and Hansen, 1993; Munk and Nielsen, 1994). In the Moray firth, northeast of Scotland, minke whales summer distribution appears correlated with the development of a warm water plume locally enhancing productivity (Wright et al., 2000; Macleod, 2004; Tetley et al., 2008). Further studies in Irish and Scottish waters corroborated the importance of high chlorophyll levels in explaining the species distribution, suggesting prey abundance as the driver behind such patterns (Anderwald et al., 2012; Breen et al., 2016). Around Scotland, B. acutorostrata feeds extensively on sand-eels and small pelagic shoaling species such as herring and sprat (Macleod et al., 2004; Pierce et al., 2004; Anderwald et al., 2012). High phytoplankton concentrations supposedly draw sand-eels out into the water column where they become readily available for the whales to prey on (Wright et al., 2000; Macleod, 2004; Tetley et al., 2008). Pre-spawning herring also tends to congregate in productive zones supporting high zooplankton biomass such as discontinuities between water masses, while showing preferences for the mixed side of frontal systems (Maravelias and Reid, 1997; Maravelias et al., 2000). Anderwald et al. (2012) proposed that chlorophyll blooms triggering local increase in copepod biomass could similarly constitute favourable feeding habitats for pre-wintering sprat and its predators. Few studies have directly correlated minke whale distribution with water temperature. Anderwald et al. (2012) observed a preference for the higher end of spring SST range, possibly related to an increased sand-eel activity around 10-12°. In our summer study, whales were clearly found in warmer waters with encounter probabilities peaking around 15°. This may reflect a selection for the stratified side of frontal discontinuities, where most biomass accumulates (Landeira et al., 2014; Flores-Melo et al., 2018), rather than a direct effect of thermal conditions.
While it remained the least important factor in our final model, the probability of encountering minke whales was lower wherever the seafloor was covered in coarse sediment. Conversely, along the shore of the Moray Firth and in inshore waters near Mull and the Small Isles, minke whales seem to favour coarse sand and fine gravel (Macleod et al., 2004; Robinson et al., 2009; Anderwald et al., 2012), which are optimal burrowing habitats for sand-eels (Macer, 1966; Wright et al., 2000; Green, 2017). Off the west-coast however, this pattern observed in spring does not hold as the season advances, and animals apparently re-distribute over more diverse habitats (Macleod et al., 2004; Anderwald et al., 2012). Adult minke whales have a relatively plastic diet and flexible feeding behaviour, targeting different preys based on resource availability (Robinson et al., 2009; Anderwald et al., 2012; Robinson et al., 2023). The observed shift in distribution throughout the season might be a response to gradual changes in prey availability as sprat, mackerel and herring become abundant in summer and early autumn, reflecting a transition from a foraging strategy heavily reliant on sand-eels towards a more diverse and opportunistic diet (Macleod et al., 2004; Anderwald et al., 2012). WESPAS data were collected from late June to mid-July, which could coincide with the beginning of this transition period. This also falls between the two main spawning periods of the North East Atlantic herring stock, in spring and autumn, when adults fish may not necessarily be distributed over their typical coarse substrate spawning ground (Maravelias et al., 2000; Frost and Diele, 2022). Moreover, the survey tracklines cover waters further away from the coast than the fine-scale studies conducted by Robinson et al. (2009); Anderwald et al. (2012); Macleod et al. (2004). Minke whales have been shown to exhibit a certain degree of site-fidelity (Gill and Fairbainrns, 1995; Albrecht et al., 2021) and individual specialisation in prey capture techniques (Robinson et al., 2023). Animals encountered during the survey might adopt different foraging strategies than those found more inshore. In the North East Altantic, Haug et al. (2002) observed a sexual dimorphism in whale habitat use during their northwards migration towards feeding ground, with juveniles and females travelling inshore whilst males stayed in more open waters. More recently, Robinson et al. (2023) further uncovered a spatial segregation between juvenile minke whales, targeting essentially sand-eels in inshore areas and adults, occupying more offshore sandy and muddy habitats while feeding extensively on juvenile herring and pre-wintering sprat.
Except for 2020, suitability seemed to increase over time. This could indicate a real improvement in ecological conditions with regards to minke whales’ preferences, or an analytical artefact due to the high number of sightings in the recent years, which would have enhanced the weight of recent observations in the model building stages, artificially depicting the conditions of those years as more favourable.
4.3 Common dolphins
Common dolphins were the second most sighted cetacean on the northern leg of the WESPAS surveys. The species ranges over most of European continental shelves, and although its core distribution is centred off Spain, Portugal and in the Bay of Biscay (Hammond et al., 2017; Laran et al., 2017), high densities have also been documented west and south of Ireland and in the western Channel (Reid et al., 2003; Wall et al., 2006; Wall, 2013). Seasonal occurrence farther north on the Malin and Hebridean shelves is not rare either (Wall et al., 2006; Robinson et al., 2010; Paxton et al., 2016), and ever more frequent. Over the past decades, a switch in relative abundance of white-beaked dolphin and common dolphin sightings and strandings has been observed in the area (MacLeod et al., 2005). Niche partitioning, as a way to reduce inter-specific competition, has been observed west of Scotland and appears globally driven by a latitudinal temperature gradient (MacLeod et al., 2007; MacLeod et al., 2008a), and locally facilitated by different foraging strategies and habitat selections (Weir et al., 2009). The northwards expansion of common dolphin range to the detriment of white-beaked dolphins has been imputed to ocean warming and is likely going to intensify in the current context of climate change, meaning common dolphins could become more abundant and dominant in the area (MacLeod et al., 2005; MacLeod et al., 2008a; Weir et al., 2009). In our study, we did not find any direct effect of temperature on the presence likelihood of common dolphin, but this is not necessarily contradictory, as the species is known to tolerate a wide range of temperatures, and typical summer temperatures west of Scotland are suitable for the species (MacLeod et al., 2008b; Weir et al., 2009).
Based on our models and derived favourability maps, D.delphis appeared mostly distributed over the continental shelf. Waggitt et al., 2020 and Weir et al., 2001 predicted on the contrary the species core habitat to be located further offshore, along the shelf-edge slopes and 1000m isobath. However, data is globally scarce beyond the shelf break (Reid et al., 2003), and because the WESPAS survey only marginally covers deeper waters, offshore occurrence could have been underestimated. Yet, our results remain consistent with that of other studies which characterised shelf domains as key habitats for common dolphins, at least in spring and summer (MacLeod et al., 2007; Weir et al., 2009). Using CART methods to investigate their occurrence around the Hebrides, MacLeod et al. (2007) and Weir et al., 2009 documented a predilection for waters within 42km and 28 km of the coast respectively, echoing the wide coastal band visible on our maps. Here, distance to shore or depth were not retained directly in the best models, but could have been confounded with other variables. For instance, most frontal activity was localised over the shelf (correlation distance to closest front/distance to shore = 0.62) and distance to front ended up being the most informative predictor for common dolphin distribution. Unlike whales however, dolphins were associated with higher salinity, suggesting a preference for more oceanic, open waters of the shelf rather than most coastal areas influenced by freshwater inputs (Giralt Paradell et al., 2019). According to the model, chances of encounter peaked around 15km from a front and rapidly decreased farther. Goold (1998) and Bush (2007) previously documented a spatial association beteween common dolphins and the seasonal development of the Celtic Sea Front, south of the Irish Sea. Authors hypothesised that the breakdown of the front in autumn coincided with an offshore migration of the species towards new foraging opportunities (Goold, 1998). Likewise, when modelling most probable location of at-sea mortality of dolphins by-caught in the Bay of Biscay, Gilbert et al. (2021) identified frontal regions as potential hotpots for interaction between common dolphins and fisheries, suggesting an important utilisation of such features for foraging. In a wider Atlantic context, many studies have correlated common dolphins distribution with regions of enhanced primary productivity attracting pelagic shoaling fishes such as herring, sardines and sprat feeding on zooplankton (Cañadas and Hammond, 2008; Jefferson et al., 2009; Moura et al., 2012). In our model, the relationship between common dolphins distribution and plankton concentration was not straight-forward. The best scale integrated a 1-month lag, reflecting spring conditions. Common dolphin occurrence appeared negatively correlated with phytoplankton concentration at that time. In the literature, relationships between D.delphis distribution and chlorophyll-a levels tend to be inconsistent. MacLeod et al. (2007) highlighted a preference for more productive waters near the Hebrides, like Cañadas and Hammond (2008) and Moura et al., 2012 in the southwest Mediterranean Sea and off Portugal, but Giralt Paradell et al. (2019); Castro et al. (2020) and Correia et al. (2019), reported opposite patterns off the Iberian Peninsula and north west Africa. Common dolphins are apex predators feeding relatively high up the food chain (Spitz et al., 2012). There could be, in addition to a temporal lag, a spatial mis-match between the location of the initial bloom and that of dolphins pelagic and demersal prey aggregation, as the biomass is exported away from fronts through complex food chains and consumption by nektonic organisms (Simpson, 1981; Frontier, 1986; Grémillet et al., 2008). This could also be coherent with the peak in dolphins occurrence observed 15km away from frontal zones.
Finally, the model predicted higher habitat suitability over muddy sand banks in the Hebridean Sea and in the Malin Sea. Like for minke whales, preference for certain substrate types could be linked to prey distribution. In the northeast Atlantic, D. delphis preys on small, gregarious pelagic fishes of high energetic value (Spitz et al., 2010). Mesopelagic lanternfishes and horse mackerel are essential components of offshore groups diet, while Gadidae and Gobiidae are important prey items for more coastal, neritic populations (Brophy et al., 2009; Spitz et al., 2010). Little data is available for Scotland and north of Ireland specifically, but a few individuals stranded on the west Scottish coast in summer had been feeding predominantly on whiting, other gadoids and mackerel (MacLeod et al., 2008b). Kessler (2021) confirmed the important contribution (75% total biomass) of mackerel, haddock, whiting and sand-eels to the species diet around Scotland. Southwest of the country, juveniles gadoids tend to favour areas covered in sand and mud like the ones highlighted in our study (Elliott et al., 2017a; Elliott et al., 2017b). The large patch of high favourability identified north of Malin is located near Stanton Banks (south), a prolific ground for demersal fisheries, targeting notably haddock and whiting (Gerritsen and Kelly, 2019).
4.4 Prey biomass
Interestingly, and contrary to our hypothesis, none of the final models retained prey density as an informative predictor for minke whales or common dolphins occurrence. Although habitat preferences of both species pointed towards typical prey aggregating features such as boundaries between water masses and specific substrate, no direct link was established between cetaceans occurrence and in-situ biomass measured on the echosounder. Or at least herring and horse mackerel NASCs were not useful metrics to accurately explain predators’ pattern of occurrence at the scale of the study area. Multiple factors could explain such results. Firstly, the active acoustic detection technique used to detect pelagic shoals is independent from weather conditions, contrary to the visual monitoring by MMOs. There is a possibility that environmental conditions affecting detectability were sub-optimal in some areas where fish were detected, especially offshore, where potential false-absences for cetaceans would have introduced bias in the model. Secondly, the analytical framework selected here, despite being particularly well-suited for habitat model - and hence for our primary aim of identifying important cetacean habitat - might not be the most appropriate to unravel interaction between two mobile species (prey/predator) which distributions are both patchy and highly variable. Question of species association and possible interactions could be further explored using a coarser resolution and alternative analytical frameworks such as the co-occurrence matrix and multinomial logit models selected by Embling et al. (2005); Beare et al. (2003), or more innovative joint species distribution modelling (JSDM) approaches (Pollock et al., 2014; Tikhonov et al., 2017; Tobler et al., 2019). Thirdly, and maybe most likely, herring and horse mackerel may not be the only nor main preys of minke whales and common dolphins in the region. As discussed above, B.acutorostrata does not only feed on herring but also extensively, if not predominantly on sand-eels and sprat (Macleod, 2004; Pierce et al., 2004; Anderwald et al., 2012). Sand-eels, buried or swimming close to the seafloor are not detected during the pelagic fisheries survey. Sprat was excluded from analysis as NASC values were not available for all survey years. In the Celtic Sea, south of Ireland, Volkenandt et al. (2015) described a spatial overlap between baleen whales and forage fish distribution (i.e. herring and sprat). There, minke whales were sighted near large herring shoals in years of high abundance, but were also found consistently associated with sprat, regardless of the biomass. In an earlier study in the area, Healy et al. (2013) similarly highlighted a positive relationship between combined herring and sprat NASC and baleen whales presence and abundance. Presence of common dolphins was also correlated with combined fish NASC (Healy et al., 2013). In Scotland, common dolphins may associate with herring shoals near the shelf edge, west and north of the Western Isles; but appear not to closer to shore and more south on the Malin Shelf (Embling et al., 2005). Horse mackerel also tend to occupy offshore habitats (Abaunza et al., 2008) while dolphins were found closer to the coast. The importance of substrate type identified in our study suggests a demersal foraging technique, which differs from previous observation by Weir et al. (2009) and Embling et al. (2005), but echoes findings from Brophy et al. (2009); MacLeod et al. (2008a); Kessler (2021) and De Pierrepont et al. (2005) which reported an important contribution of gadoid in D. dephis stomach contents. Geographical variability in common dolphins feeding habits and diversity of targeted preys (Santos et al., 1994; Brophy et al., 2009; Spitz et al., 2010; Kessler, 2021) is overall evidence of a highly plastic diet and demonstrates flexible foraging strategies, oriented towards pelagic and demersal species depending on resource abundance.
Minke whales and common dolphins in coastal areas appear to be opportunistic feeders, preying alternatively, or successively, on a diverse range of fish based on availability. From mapping of the raw data, distribution of minke whale appeared to overlap with that of sprat in the Minch when data were available, while common dolphins were found near herring shoals in 2020 and 2021 in the southern part of the study area. More focused studies might better capture local and temporally restricted relationships between predator and specific preys. In our larger scale study over the span of five years, single-species biomass alone was not sufficient to accurately predict cetacean occurrence. Instead, animals distribution was better explained using oceanography proxies.
4.5 Conclusion, implication for conservation and future research
Both species were found in coastal or mid-shelf waters where seasonal stratification and frontal activity increases productivity. As hypothesised, the influence of oceanographic physical forcing, driving phytoplankton blooms and locally boosting ecosystems trophodynamics was important in determining minke whale distribution in their feeding grounds, and to a lesser extent that of common dolphins. High primary productivity generally allows diverse zooplankton communities to thrive, the accumulating biomass at lower trophic levels in turn attracting planktivorous fish species and their predators (Ingram et al., 2007; Scales et al., 2014b; Cox et al., 2018). Stratified waters (Dickey-Collas et al., 1996; Embling et al., 2012; Cox et al., 2013), tidal front systems (Sinclair and Iles, 1985; Taggart et al., 1989; Lough and Manning, 2001; Alemany et al., 2009), internal waves (Embling et al., 2013) or upwellings (Hansen et al., 2001; Ostrowski and Bazika-Sangolay, 2015) have been linked with aggregation of different life stages of pelagic shoaling fish. Common dolphin in the study region might additionally exploit demersal preys at higher trophic levels and show more complex response to primary productivity and spatial location of fronts due to biomass displacement. Nevertheless, oceanography proxies were the most useful predictors for both predators occurrence across the Hebridean and Malin shelves. Substrate was also an important indicator in the case of common dolphins.
Fed with the eco-geographical predictors, our model was able to effectively explain minke whale distribution, and accurately pinpoint well-known hotpots northwest of Scotland around the Hebrides (Paxton et al., 2014; Evans and James, 2016; Paxton et al., 2016), off the Western Isles (MacLeod et al., 2007) and in the Minch (Evans et al., 1993; Weir et al., 2001). Coherence with previous results in the area strengthen the plausibility of predictions and inform their interpretation in data-deficient areas. The model singled-out potential “new” hotspots, less characterised to date, south of the Outer Hebrides, west of Tiree and along Islay front, where less data was available. This concurs with results obtained by Paxton et al. (2014), who statistically predicted persistent minke whale occurrence west and south of the Outer Hebrides, off Tiree and Islay, based on their habitat preferences in areas that focused more effort. Although in their study like in the present one, uncertainty around predictions remains high, these areas stood out even at the lower bound of the confidence intervals. For common dolphins, results differed to some extent from the published literature, but less studies had been conducted in the region so far, and none attempting to correlate dolphin distribution and substrate nature. The model identified suitable habitat in the Hebridean Sea, consistently with previous results (MacLeod et al., 2007; Weir et al., 2009). In our study, additional hotpots were also identified on the Malin Shelf over sand banks, particularly south of Lewis and off north Donegal, near Stanton Banks. If these modelled hotpots are indeed critical habitats for cetaceans in summer, integrating them marine spatial planning is essential to implement conservation and management plan, and identify any need for mitigation of human activities.
Presently, one of the most prominent threats to cetaceans in Irish and UK waters is by-catch (Parsons et al., 2010). Minke whale are most vulnerable to entanglement in static or ghost gear such as pot-fishing lines (Northridge et al., 2010; Breen et al., 2016; Leaper et al., 2022). Within the Irish EEZ, Breen et al. (2016) mapped the overlap between minke whale distribution and fishing pots effort, and flagged a significant exposure risk over the Malin Shelf, close to the hotspots identified in our models. Common dolphins are more subject to direct interaction with operating vessels, with accidental capture being a long-lasting and major issue in the North East Atlantic (ICES, 2020b). In our study area, if dolphins are indeed occupying shelf waters, interaction with pelagic trawlers might be limited since catch effort is mostly focused offshore and on the onset of the continental slopes (Pout et al., 2008; Gerritsen and Kelly, 2019). Overlap with demersal fisheries however might be substantial, especially near the south of Stanton Banks (Gerritsen and Kelly, 2019). In the Bay of Biscay, common dolphins incidental capture hotpots have been linked with demersal and mixed-demersal fisheries using trammel nets, bottom trawls and mid-water trawls (ICES, 2020b; Peltier et al., 2021). While this has mostly occurred at lower latitude, it could become an emerging threat. If the northwards expansion in common dolphin range was to intensify with ocean warming and the species becomes more abundant and persistent in the region, the risk of interaction might increase, especially near aggregation zones such as fronts, also targeted by fisheries (Gilbert et al., 2021). Ongoing climate change might further affect the timing and location of these features, which could impact cetaceans both through shifts in abundance and distribution of their preys, and in modification of exposure to other anthropogenic threats (Evans and Bjørge, 2013; Hazen et al., 2013).
Oceanic fronts have been established as important marine biodiversity hotpots (Wingfield et al., 2011; Hazen et al., 2013; Marchese, 2015) and most persistent systems have been brought forward as ideal candidate features to inform the designation of MPA networks (Miller and Christodoulou, 2014; Miller et al., 2014; Scales et al., 2014b). Inherently variable, such sites would require adaptive management frameworks to accommodate moving boundaries and quickly address species distribution shifts, especially on the long-term in light of climate change and its profound effect on ocean circulation. At present, oceanographic systems are not listed under any European or UK legislation. There is currently no capacity to designate frontal regions as MPAs under the criteria in place in Ireland (Marine Protected Area Advisory Group, 2020), but they have recently been included in the Scottish MPA Network as one of five large-scale features of interest (Miller et al., 2014; NatureScot and JNCC, n.d.). The possible MPA (pMPA) of the Hebridean Sea has been proposed with explicit listing of shelf fronts as critical features, along with the basking sharks and minke whales they attract. Previously, frontal regions have also been protected under the umbrella of megafauna species. For instance, the Irish Sea Front SPA was designated under the Birds Directive (2009/147/EC) based on at-sea aggregation of Manx Shearwater (Puffinus puffinus). A similar approach could potentially be adopted for the Islay front, highlighted in our study and earlier work as a potential hotpot for minke whales (Paxton et al., 2014). Common dolphins would also benefit from increased protection over the Malin Shelf, especially north of Donegal near the offshore sand banks. New sites in the region would further reinforce the existing network of MPAs, linking the Sea of Hebrides pMPA and the West Connacht Coast SAC designated west of Ireland. The recently launched Fair Seas coalition identified the north coast of Donegal as an area of interest for many protected species and habitats, including (among others) bottlenose dolphins, harbour porpoises, basking sharks and large herring spawning grounds. Findings from our study could complement this assessment and provide perspective from other species, reinforcing the call for designation.
Mapping most sensitive megafauna feeding grounds or transiting corridors is essential to include in marine spatial planning, all the more in an era of rapid growth in the development of offshore marine renewable energy. Ireland recently revised its energy targets upwards to produce 80% renewable electricity by 2030, including 5GW in offshore wind energy (Department of the Environment, Climate and Communications, 2023). In Scotland, the government set out to reach 8-11GW of offshore wind by 2030 (Energy and Climate Change Directorate, 2023). Four windfarms projects currently in concept or early planning phases overlap or are located near hotspots highlighted in the present study (4C Offshore, 20232). Without denying the critical need of transitioning towards more sustainable energy to mitigate the current climate crisis, we recommend potential implications for cetaceans using the area in summer be considered in future impact assessments and targeted monitoring plans.
Our results improved our understanding of cetacean habitat use over the Malin Shelf, so far mostly overlooked or inferred from preferences elsewhere. They provide baseline data to inform conservation, impact assessment and management plans in this trans-border area. Despite high uncertainty surrounding the absolute values of presence probabilities, which we recommend not to interpret literally in policy settings, this study still provides valuable insights into relative habitats favourability over the study area. For instance for minke whales, even at the lower end of the credible intervals, the model identified most probable hotspots, regardless of species prevalence and chances of encounter. To further confirm (or disprove) predictions from the statistical models, we recommend that future research focuses more specifically on potential hotpots identified here, for instance through smaller scale dedicated surveys, or complementary monitoring schemes. Collection of data in autumn, winter and spring would also benefit our understanding of cetacean phenology in the region.
Data availability statement
The cetacean dataset analysed for this study is available upon request. Requests to access these datasets should be directed to CO’D, chief scientist on the WESPAS survey, Marine Institute, https://www.marine.ie/marine-institute-request-digital-data.
Ethics statement
Ethical approval was not required for the study involving animals in accordance with the local legislation and institutional requirements because data were acquired using passive surveying methodologies.
Author contributions
CO’D is chief scientist on the WESPAS surveys, and provided access to the MMOs and echosounder datasets. MP, CO’D, and JO’B contributed to conception of the study. MP performed the statistical analysis and wrote the first draft of the manuscript. CB participated in the design and coding of statistical analysis with MP. JO’B, SB, and RM formed the supervising team of MP’s thesis and reviewed and commented on initial drafts. All authors contributed to the article and approved the submitted version.
Funding
Data used in this study were collected during the WESPAS programme. The survey is part of Ireland’s Data Collection Scheme which is carried out under Ireland’s Operational Programme (OP), co-funded by the European Maritime and Fisheries Fund (EMFF) and by the Irish Government. The present study was conducted as part of MP’s PhD thesis, funded under the SeaMonitor project. Funding for SeaMonitor (ID: IVA5060) was provided by the EU’s INTERREG VA Programme (Environment Theme), managed by the Special EU Programmes Body (SEUPB). Match-funding for this project has been provided by the Department for Agriculture, Environment and Rural Affairs in Northern Ireland and the Department of Housing, Planning and Local Government in Ireland. Funding towards open access publication fees was provided by the Marine Institute under the “Networking and marine research communication awards” (ref NET/23/009). The Networking Initiative is funded by the Marine Institute under the Marine Research Programme with the support of the Irish Government.
Acknowledgments
Authors would like to thank the technical and scientific crew from the RV. Celtic Explorer involved in the WESPAS survey, as well as all MMOs that participated in data collection. Authors are also grateful for the support provided by Dr. Andrew Dale and Dr. Diego Pereiro Rodriguez for accessing COMPASS oceanographic datasets and for their advice on computing frontal metrics.
Conflict of interest
The authors declare that the research was conducted in the absence of any commercial or financial relationships that could be construed as a potential conflict of interest.
Publisher’s note
All claims expressed in this article are solely those of the authors and do not necessarily represent those of their affiliated organizations, or those of the publisher, the editors and the reviewers. Any product that may be evaluated in this article, or claim that may be made by its manufacturer, is not guaranteed or endorsed by the publisher.
Supplementary material
The Supplementary Material for this article can be found online at: https://www.frontiersin.org/articles/10.3389/fmars.2023.1224267/full#supplementary-material
Footnotes
References
Abaunza P., Gordo L. S., Santamaría M. T. G., Iversen S. A., Murta A. G., Gallo E. (2008). Life history parameters as basis for the initial recognition of stock management units in horse mackerel (Trachurus trachurus). Fisheries Res. 89, 167–180. doi: 10.1016/j.fishres.2007.09.021
Akaike H. (1974). A new look at the statistical model identification. IEEE Trans. Automatic Control 19, 716–723. doi: 10.1109/TAC.1974.1100705
Albrecht S., Jung J.-L., Lazar L., Bathie M., Lémery-Peissik D., Rasmussen M. H. (2021). Local movements and site-tenacity of minke whale in Iceland in relation to feeding and a northward distribution shift. Mar. Biol. Res. 17, 744–761. doi: 10.1080/17451000.2021.2016839
Alemany D., Acha E. M., Iribarne O. (2009). The relationship between marine fronts and fish diversity in the Patagonian Shelf Large Marine Ecosystem. J. Biogeogr. 36, 2111–2124. doi: 10.1111/j.1365-2699.2009.02148.x
Alessi J., Fiori C. (2014). From science to policy—a geostatistical approach to identifying potential areas for cetacean conservation: a case study of bottlenose dolphins in the Pelagos sanctuary (Mediterranean Sea). J. Coast. Conserv. 18, 449–458. doi: 10.1007/s11852-014-0330-3
Allouche O., Tsoar A., Kadmon R. (2006). Assessing the accuracy of species distribution models: prevalence, kappa and the true skill statistic (TSS). J. Appl. Ecol. 43, 1223–1232. doi: 10.1111/j.1365-2664.2006.01214.x
Anderwald P., Evans P. G., Dyer R., Dale A., Wright P. J., Hoelzel A. R. (2012). Spatial scale and environmental determinants in minke whale habitat use and foraging. Mar. Ecol. Prog. Ser. 450, 259–274. doi: 10.3354/meps09573
Araújo M. B., Anderson R. P., Márcia Barbosa A., Beale C. M., Dormann C. F., Early R., et al. (2019). Standards for distribution models in biodiversity assessments. Sci. Adv. 5, eaat4858. doi: 10.1126/sciadv.aat4858
Araújo M. B., Pearson R. G., Thuiller W., Erhard M. (2005). Validation of species–climate impact models under climate change. Global Change Biol. 11, 1504–1513. doi: 10.1111/j.1365-2486.2005.01000.x
Baquero R. A., Barbosa A. M., Ayllón D., Guerra C., Sánchez E., Araújo M. B., et al. (2021). Potential distributions of invasive vertebrates in the Iberian Peninsula under projected changes in climate extreme events. Diversity Distributions 27, 2262–2276. doi: 10.1111/ddi.13401
Barile C., Berrow S., O’Brien J. (2021). Oceanographic Drivers of Cuvier’s (Ziphius cavirostris) and Sowerby’s (Mesoplodon bidens) Beaked Whales Acoustic Occurrence along the Irish Shelf Edge. J. Mar. Sci. Eng. 9, 1081. doi: 10.3390/jmse9101081
Barry S., Elith J. (2006). Error and uncertainty in habitat models. J. Appl. Ecol. 43, 413–423. doi: 10.1111/j.1365-2664.2006.01136.x
Baxter J. M. (2011). Scotland’s Marine Atlas: Information for the national marine plan (Scotland: scottish government).
Beare D. J., Reid D. G., McKenzie E. (2003). Fish schooling behaviour in the northwest north sea: interspecific associations measured by acoustic survey. Aquat. Living Resour. 16, 307–312. doi: 10.1016/S0990-7440(03)00041-X
Berrow S. (2001). Biological diversity of cetaceans (whales, dolphins and porpoises) in Irish waters. In Marine biodiversity in Ireland and adjacent waters. Proc. Conf. 26 (27), 115-119.
Berrow S. D., O’Brien J., Meade R., Delarue J., Kowarski K., Martin B., et al. (2018). Acoustic surveys for cetaceans in the Irish Atlantic margin: occurrence, distribution and abundance in 2015-2016, Irish Wildlife Manual (Ireland: Department of Communications, Climate Action & Environment and National).
Block B. A., Jonsen I. D., Jorgensen S. J., Winship A. J., Shaffer S. A., Bograd S. J., et al. (2011). Tracking apex marine predator movements in a dynamic ocean. Nature 475, 86–90. doi: 10.1038/nature10082
Boer M. N. (2010). Spring distribution and density of minke whale Balaenoptera acutorostrata along an offshore bank in the central North Sea. Mar. Ecol. Prog. Ser. 408, 265–274. doi: 10.3354/meps08598
Breen P., Brown S., Reid D., Rogan E. (2016). Modelling cetacean distribution and mapping overlap with fisheries in the northeast Atlantic. Ocean Coast. Manage. 134, 140–149. doi: 10.1016/j.ocecoaman.2016.09.004
Brophy J. T., Murphy S., Rogan E. (2009). The diet and feeding ecology of the short-beaked common dolphin (Delphinus delphis) in the northeast Atlantic. IWC Sci. Committee Document SC/61/SM 14.
Brown P. B., O’Driscoll D., Pinfield R., Meade R., Hunt W., McKeogh E., et al. (2014). Cetaceans on the Frontier 6. Tech. Rep.
Bush N. (2007). Spatio-temporal comparisons between acoustic and visual detections of the short-beaked common dolphin (Delphinus delphis) in the St George’s channel, in relation to environmental features 97.
Cañadas A., Hammond P. S. (2008). Abundance and habitat preferences of the short-beaked common dolphin Delphinus delphis in the southwestern Mediterranean: implications for conservation. Endangered Species Res. 4, 309–331. doi: 10.3354/esr00073
Cañadas A., Sagarminaga R., De Stephanis R., Urquiola E., Hammond P. S. (2005). Habitat preference modelling as a conservation tool: proposals for marine protected areas for cetaceans in southern Spanish waters. Aquat. Conserv.: Mar. Freshw. Ecosyst. 15, 495–521. doi: 10.1002/aqc.689
Carlson C. J. (2020). embarcadero: Species distribution modelling with Bayesian additive regression trees in r. Methods Ecol. Evol. 11, 850–858. doi: 10.1111/2041-210X.13389
Carlucci R., Manea E., Ricci P., Cipriano G., Fanizza C., Maglietta R., et al. (2021). Managing multiple pressures for cetaceans’ conservation with an Ecosystem-Based Marine Spatial Planning approach. J. Environ. Manage. 287, 112240. doi: 10.1016/j.jenvman.2021.112240
Castro J., Couto A., Borges F. O., Cid A., Laborde M. I., Pearson H. C., et al. (2020). Oceanographic determinants of the abundance of common dolphins (Delphinus delphis) in the south of Portugal. Oceans 1, 165–173. doi: 10.3390/oceans1030012
Chipman H. A., George E. I., McCulloch R. E. (2010). BART: Bayesian additive regression trees. Ann. Appl. Stat 4, 266–298. doi: 10.1214/09-AOAS285
CMEMS (2022b). North Atlantic Chlorophyll (Copernicus-GlobColour) from Satellite Observations: Daily Interpolated (Reprocessed from 1997) (Copernicus Marine Environment Monitoring Service).
Conners M. G., Sisson N. B., Agamboue P. D., Atkinson P. W., Baylis A. M. M., Benson S. R., et al. (2022). Mismatches in scale between highly mobile marine megafauna and marine protected areas. Front. Mar. Sci. 9. doi: 10.3389/fmars.2022.897104
Correia A. M., Gil Á., Valente R., Rosso M., Pierce G. J., Sousa-Pinto I. (2019). Distribution and habitat modelling of common dolphins (Delphinus delphis) in the eastern North Atlantic. J. Mar. Biol. Assoc. United Kingdom 99, 1443–1457. doi: 10.1017/S0025315419000249
Counihan R. P., Beck S., Martin T., Manning L., Dwyer P., Collins C., et al. (2012). Cetaceans on the frontier III. Tech. Rep.
Cox S. L., Embling C. B., Hosegood P. J., Votier S. C., Ingram S. N. (2018). Oceanographic drivers of marine mammal and seabird habitat-use across shelf-seas: A guide to key features and recommendations for future research and conservation management. Estuarine Coast. Shelf Sci. 212, 294–310. doi: 10.1016/j.ecss.2018.06.022
Cox S. L., Scott B. E., Camphuysen C. J. (2013). Combined spatial and tidal processes identify links between pelagic prey species and seabirds. Mar. Ecol. Prog. Ser. 479, 203–221. doi: 10.3354/meps10176
Cox S. L., Witt M. J., Embling C. B., Godley B. J., Hosegood P. J., Miller P. I., et al. (2017). Temporal patterns in habitat use by small cetaceans at an oceanographically dynamic marine renewable energy test site in the Celtic Sea. Deep Sea Res. Part II: Topical Stud. Oceanogr. 141, 178–190. doi: 10.1016/j.dsr2.2016.07.001
De’ath G., Fabricius K. E. (2000). Classification and regression trees: A powerful yet simple technique for ecological data analysis. Ecology 81, 3178–3192. doi: 10.1890/0012-9658(2000)081[3178:CARTAP]2.0.CO;2
Debeljak M., Džeroski S. (2011). “Decision trees in ecological modelling,” in Modelling complex ecological dynamics: An Introduction into Ecological Modelling for Students, Teachers & Scientists. (Berlin, Heidelberg: Springer Berlin Heidelberg), 197–209. doi: 10.1007/978-3-642-05029-914
Department of the Environment, Climate and Communications (2023). Climate action plan 2023 - CAP23 - Changing Ireland for the better (Ireland: Tech. rep., Government of Ireland).
De Pierrepont J. F., Dubois B., Desormonts S., Santos M., Robin J. (2005). Diet of English Channel cetaceans stranded on the coast of Normandy. Journal of the Marine Biological Association of the united Kingdom 85 (6), 1539–1546.
Dickey-Collas M., Gowen R. J., Fox C. J. (1996). Distribution of larval and juvenile fish in the western Irish sea: relationship to phytoplankton, zooplankton biomass and reccurrent physical features. Mar. Freshw. Res. 47, 169–181. doi: 10.1071/mf9960169
Doherty P. D., Baxter J. M., Godley B. J., Graham R. T., Hall G., Hall J., et al. (2017). Testing the boundaries: Seasonal residency and inter-annual site fidelity of basking sharks in a proposed Marine Protected Area. Biol. Conserv. 209, 68–75. doi: 10.1016/j.biocon.2017.01.018
Egerton S., Culloty S., Whooley J., Stanton C., Ross R. P. (2017). Boarfish (Capros aper): review of a new capture fishery and its valorization potential. ICES J. Mar. Sci. 74, 2059–2068. doi: 10.1093/icesjms/fsx048
Elith J., Leathwick J. R., Hastie T. (2008). A working guide to boosted regression trees. J. Anim. Ecol. 77, 802–813. doi: 10.1111/j.1365-2656.2008.01390.x
Elliott S. A. M., Sabatino A. D., Heath M. R., Turrell W. R., Bailey D. M. (2017a). Landscape effects on demersal fish revealed by field observations and predictive seabed modelling. PloS One 12, e0189011. doi: 10.1371/journal.pone.0189011
Elliott S. A. M., Turrell W. R., Heath M. R., Bailey D. M. (2017b). Juvenile gadoid habitat and ontogenetic shift observations using stereo-video baited cameras. Mar. Ecol. Prog. Ser. 568, 123–135. doi: 10.3354/meps12068
Embling C. B., Fernandes P. G., Hammond P. S., Armstrong E., Gordon J. (2005). Investigations into the relationship between pelagic fish and dolphin distributions off the west coast of Scotland. ICES ASC Theme Session R: Mar. Mammals Paper CM 8.
Embling C. B., Illian J., Armstrong E., van der Kooij J., Sharples J., Camphuysen K. C. J., et al. (2012). Investigating fine-scale spatio-temporal predator–prey patterns in dynamic marine ecosystems: a functional data analysis approach. J. Appl. Ecol. 49, 481–492. doi: 10.1111/j.1365-2664.2012.02114.x
Embling C. B., Sharples J., Armstrong E., Palmer M. R., Scott B. E. (2013). Fish behaviour in response to tidal variability and internal waves over a shelf sea bank. Prog. Oceanogr. 117, 106–117. doi: 10.1016/j.pocean.2013.06.013
EMODnet-Bathymetry (2020). EMODnet Bathymetry Consortium, (2020): EMODnet Digital Bathymetry (DTM. Europe European Commission. doi: 10.12770/bb6a87dd-e579-4036-abe1-e649cea9881a
Energy and Climate Change Directorate. (2023). Draft Energy Strategy and Just Transition Plan (p. 192) Scottish Government. Available at:https://www.gov.scot/publications/draft-energy-strategy-transition-plan/.
Evans P. G., Bjørge A. (2013). Impacts of climate change on marine mammals. Mar. Climate Change Impacts Partnership (MCCIP) Sci. Rev. 2013, 134–148.
Evans P. G., Lewis E. J., Parsons E. (1993). A survey of whales and dolphins in Hebridean waters (Scotland: Sea Watch Foundation).
Flores-Melo X., Schloss I. R., Chavanne C., Almandoz G. O., Latorre M., Ferreyra G. A. (2018). Phytoplankton ecology during a spring-neap tidal cycle in the southern tidal front of san jorge gulf, patagonia. Oceanography 31, 70–80. doi: 10.5670/oceanog.2018.412
Friedman J. H. (2002). Stochastic gradient boosting. Comput. Stat Data Anal. 38, 367–378. doi: 10.1016/S0167-9473(01)00065-2
Frontier S. (1986). “Studying Fronts as contact ecosystems,” in Elsevier Oceanography Series, vol. vol. 42 of Marine Interfaces Ecohydrodynamics . Ed. Nihoul J. C. J. (Elsevier), 55–66. doi: 10.1016/S0422-9894(08)71038-9
Frost M., Diele K. (2022). Essential spawning grounds of Scottish herring: current knowledge and future challenges. Rev. Fish Biol. Fisheries 32 (3), 721-744. doi: 10.1007/s11160-022-09703-0
Gerritsen H. D., Kelly E. (2019). Atlas of Commercial Fisheries around Ireland, third edition (Ireland: Marine Institute).
Gilbert L., Rouby E., Tew-Kaï E., Spitz J., Peltier H., Quilfen V., et al. (2021). Spatiotemporal models highlight influence of oceanographic conditions on common dolphin bycatch risk in the Bay of Biscay. Mar. Ecol. Prog. Ser. 679, 195–212. doi: 10.3354/meps13894
Gill A., Fairbainrns R. S. (1995). “Photo-identification of the minke whale Balaenoptera acutorostrata off the Isle of Mull, Scotland,” in Developments in Marine Biology, vol. vol. 4 of Whales, seals, fish and man . Eds. Blix A. S., Walløe L., Ulltang Ø. (Elsevier Science), 129–132. doi: 10.1016/S0163-6995(06)80016-8
Giralt Paradell O., Díaz López B., Methion S. (2019). Modelling common dolphin (Delphinus delphis) coastal distribution and habitat use: Insights for conservation. Ocean Coast. Manage. 179, 104836. doi: 10.1016/j.ocecoaman.2019.104836
Goold J. C. (1998). Acoustic assessment of populations of common dolphin off the West Wales Coast, with perspectives from satellite infrared imagery. J. Mar. Biol. Assoc. United Kingdom 78, 1353–1364. doi: 10.1017/S0025315400044544
Green E. (2017). A literature review of the lesser (Raitt’s) sandeel Ammodytes marinus in European waters. Tech. Rep. 37, doi: 10.13140/RG.2.2.13655.57761
Grémillet D., Lewis S., Drapeau L., van der Lingen C. D., Huggett J. A., Coetzee J. C., et al. (2008). Spatial match–mismatch in the Benguela upwelling zone: should we expect chlorophyll and seasurface temperature to predict marine predator distributions? J. Appl. Ecol. 45, 610–621. doi: 10.1111/j.1365-2664.2007.01447.x
Guélat J., Kéry M. (2018). Effects of spatial autocorrelation and imperfect detection on species distribution models. Methods Ecol. Evol. 9, 1614–1625. doi: 10.1111/2041-210X.12983
Guillera-Arroita G. (2017). Modelling of species distributions, range dynamics and communities under imperfect detection: advances, challenges and opportunities. Ecography 40, 281–295. doi: 10.1111/ecog.02445
Guisan A., Tingley R., Baumgartner J. B., Naujokaitis-Lewis I., Sutcliffe P. R., Tulloch A. I. T., et al. (2013). Predicting species distributions for conservation decisions. Ecol. Lett. 16, 1424–1435. doi: 10.1111/ele.12189
Guisan A., Zimmermann N. E. (2000). Predictive habitat distribution models in ecology. Ecol. Model. 135, 147–186. doi: 10.1016/S0304-3800(00)00354-9
Hague E. L., Sinclair R. R., Sparling C. E. (2020). Regional baselines for marine mammal knowledge across the North Sea and Atlantic areas of Scottish waters. Report. doi: 10.7489/12330-1
Hammond P. S., Lacey C., Gilles A., Viquerat S., Börjesson P., Herr H., et al. (2017). Estimates of cetacean abundance in European Atlantic waters in summer 2016 from the SCANS-III aerial and shipboard surveys. Tech. rep (Wageningen Marine Research).
Hansen J. E., Martos P., Madirolas A. (2001). Relationship between spatial distribution of the Patagonian stock of Argentine anchovy, Engraulis anchoita, and sea temperatures during late spring to early summer. Fisheries Oceanogr. 10, 193–206. doi: 10.1046/j.1365-2419.2001.00166.x
Haug T., Lindstrøm U., Nilssen K. T. (2002). Variations in minke whale (Balaenoptera acutorostrata) diet and body condition in response to ecosystem changes in the Barents Sea. Sarsia: North Atlantic Mar. Sci. 87, 409–422. doi: 10.1080/0036482021000155715
Hazen E. L., Suryan R. M., Santora J. A., Bograd S. J., Watanuki Y., Wilson R. P. (2013). Scales and mechanisms of marine hotspot formation. Mar. Ecol. Prog. Ser. 487, 177–183. doi: 10.3354/meps10477
Healy H., Minto C., Wall D., O’Donnell C., O’Connor I. (2013). Marine mammals and megafauna in Irish waters - behaviour, distribution and habitat use- WP4 research into Ecosystem Links and Habitat Use between Cetaceans and Fisheries in the Celtic Sea. Technical Report (Ireland: Marine Institute).
Hijmans R. J., Bivand R., Etten J. V., Forner K., Ooms J., Pebesma E. (2023a). terra: Spatial Data Analysis R package version 1.7-18. CRAN R-project. Available at: https://CRAN.R-project.org/package=terra.
Hijmans R. J., Etten J. V., Sumner M., Cheng J., Baston D., Bevan A., et al. (2023b). raster: Geographic Data Analysis and Modeling R package version 3.6-20. CRAN R-project. Available at: https://CRAN.R-project.org/package=raster.
Hill J., Linero A., Murray J. (2020). Bayesian additive regression trees: A review and look forward. Annu. Rev. Stat Its Appl. 7, 251-278. doi: 10.1146/annurev-statistics-031219-041110
Hill A. E., Simpson J. H. (1989). On the interaction of thermal and haline fronts: The Islay front revisited. Estuarine Coast. Shelf Sci. 28, 495–505. doi: 10.1016/0272-7714(89)90025-5
Holligan P. M., Swallow J. C., Currie R. I., Gill A. E., Simpson J. H. (1981). Biological implications of fronts on the northwest European continental shelf. Philosophical Transactions of the Royal Society of London. Ser. A Math. Phys. Sci. 302, 547–562. doi: 10.1098/rsta.1981.0182
Hooker S. K., Cañadas A., Hyrenbach K. D., Corrigan C., Polovina J. J., Reeves R. R. (2011). Making protected area networks effective for marine top predators. Endangered Species Res. 13, 203–218. doi: 10.3354/esr00322
Hyrenbach K. D., Forney K. A., Dayton P. K. (2000). Marine protected areas and ocean basin management. Aquat. Conserv.: Mar. Freshw. Ecosyst. 10, 437–458. doi: 10.1002/1099-0755(200011/12)10:6(437::AID-AQC425)3.0.CO;2-Q
ICES. (2015). IManual for International Pelagic Surveys (IPS). Series of ICES Survey Protocols SISP 9 – IPS, 92 pp.
ICES. (2016). ICES Acoustic data portal, Extraction 12 March 2022 of HERAS_ie_2016 data (Copenhagen: ICES). Available at: https://acoustic.ices.dk.
ICES. (2017). ICES Acoustic data portal, Extraction 11 February 2022 of WESPAS˜HERAS_ie_2017 data (Copenhagen: ICES). Available at: https://acoustic.ices.dk.
ICES. (2018). ICES Acoustic data portal, Extraction 11 February 2022 of WESPAS˜HERAS_ie_2018 data (Copenhagen: ICES). Available at: https://acoustic.ices.dk.
ICES. (2020a). ICES Acoustic data portal, Extraction 11 February 2022 of WESPAS˜HERAS_ie_2020 data (Copenhagen: ICES). Available at: https://acoustic.ices.dk.
ICES. (2020b). Workshop on fisheries emergency measures to minimize BYCatch of short-beaked common dolphins in the Bay of Biscay and harbour porpoise in the Baltic Sea (WKEMBYC) ICES Scientific Rep. 2(43):354doi: 10.17895/ices.pub.7472
ICES. (2021). ICES Acoustic data portal, Extraction 11 February 2022 of WESPAS˜HERAS_ie_2021 data (Copenhagen: ICES). Available at: https://acoustic.ices.dk.
Ingram S. N., Walshe L., Johnston D., Rogan E. (2007). Habitat partitioning and the influence of benthic topography and oceanography on the distribution of fin and minke whales in the Bay of Fundy, Canada. J. Mar. Biol. Assoc. United Kingdom 87, 149–156. doi: 10.1017/S0025315407054884
Jech J. M., Michaels W. L. (2006). A multifrequency method to classify and evaluate fisheries acoustics data. Can. J. Fisheries Aquat. Sci. 63, 2225–2235. doi: 10.1139/f06-126
Jefferson T. A., Fertl D., Bolaños-Jiménez J., Zerbini A. N. (2009). Distribution of common dolphins (Delphinus spp.) in the western Atlantic Ocean: a critical re-examination. Mar. Biol. 156, 1109–1124. doi: 10.1007/s00227-009-1152-y
Kelley D., Richards C. (2021). gsw: Gibbs Sea Water Functions (CRAN R-project). Available at: https://CRAN.R-project.org/package=gsw.
Kessler L. (2021). Stomach contents of common dolphins (Delphinus delphis) and striped dolphins (Stenella coeruleoalba) in Scottish waters between 1992 and 2011. Ph.D. thesis.
Konowalik K., Nosol A. (2021). Evaluation metrics and validation of presence-only species distribution models based on distributional maps with varying coverage. Sci. Rep. 11, 1482. doi: 10.1038/s41598-020-80062-1
Lahoz-Monfort J. J., Guillera-Arroita G., Wintle B. A. (2014). Imperfect detection impacts the performance of species distribution models. Global Ecol. Biogeogr. 23, 504–515. doi: 10.1111/geb.12138
Lambert C., Authier M., Blanchard A., Dorémus G., Laran S., Van Canneyt O., et al. (2022). Delayed response to environmental conditions and infra-seasonal dynamics of the short-beaked common dolphin distribution. R. Soc. Open Sci. 9, 220379. doi: 10.1098/rsos.220379
Lambert C., Mannocci L., Lehodey P., Ridoux V. (2014). Predicting cetacean habitats from their energetic needs and the distribution of their prey in two contrasted tropical regions. PloS One 9, e105958. doi: 10.1371/journal.pone.0105958
Landeira J. M., Ferron B., Lunven M., Morin P., Marié L., Sourisseau M. (2014). Biophysical interactions control the size and abundance of large phytoplankton chains at the ushant tidal front. PloS One 9, e90507. doi: 10.1371/journal.pone.0090507
Laran S., Authier M., Blanck A., Doremus G., Falchetto H., Monestiez P., et al. (2017). Seasonal distribution and abundance of cetaceans within French waters- Part II: The Bay of Biscay and the English Channel. Deep Sea Res. Part II: Topical Stud. Oceanogr. 141, 31–40. doi: 10.1016/j.dsr2.2016.12.012
Lawrence J. M., Armstrong E., Gordon J., Lusseau S. M., Fernandes P. G. (2016). Passive and active, predator and prey: using acoustics to study interactions between cetaceans and forage fish. ICES J. Mar. Sci. 73, 2075–2084. doi: 10.1093/icesjms/fsw013
Leaper R., MacLennan E., Brownlow A., Calderan S. V., Dyke K., Evans P. G., et al. (2022). Estimates of humpback and minke whale entanglements in the Scottish static pot (creel) fishery. Endangered Species Res. 49, 217–232. doi: 10.3354/esr01214
Lindsay R. E., Constantine R., Robbins J., Mattila D. K., Tagarino A., Dennis T. E. (2016). Characterising essential breeding habitat for whales informs the development of large-scale Marine Protected Areas in the South Pacific. Mar. Ecol. Prog. Ser. 548, 263–275. doi: 10.3354/meps11663
Lough R. G., Manning J. P. (2001). Tidal-front entrainment and retention of fish larvae on the southern flank of Georges Bank. Deep Sea Res. Part II: Topical Stud. Oceanogr. 48, 631–644. doi: 10.1016/S0967-0645(00)00130-2
MacArthur R. H., Pianka E. R. (1966). On optimal use of a patchy environment. Am. Nat. 100, 603–609. doi: 10.1086/282454
Macer C. T. (1966). Sandeels (Ammodytidae) in the south-western North Sea: their biology and fishery. Fishery Investigations, Ministry of Agriculture. Fisheries Food Ser. II 24, 55.
Macleod K. (2004). Abundance of Atlantic white-sided dolphin (Lagenorhynchus acutus) during summer off northwest Scotland. J. Cetacean Res. Manage. 6(1), 33–40. doi: 10.47536/jcrm.v6i1.788
MacLeod C. D., Bannon S. M., Pierce G. J., Schweder C., Learmonth J. A., Herman J. S., et al. (2005). Climate change and the cetacean community of north-west Scotland. Biol. Conserv. 124, 477–483. doi: 10.1016/j.biocon.2005.02.004
Macleod K., Fairbairns R., Gill A., Fairbairns B., Gordon J., Blair-Myers C., et al. (2004). Seasonal distribution of minke whales Balaenoptera acutorostrata in relation to physiography and prey off the Isle of Mull, Scotland. Mar. Ecol. Prog. Ser. 277, 263–274. doi: 10.3354/meps277263
MacLeod C. D., Mandleberg L., Schweder C., Bannon S. M., Pierce G. J. (2008a). A comparison of approaches for modelling the occurrence of marine animals. Hydrobiologia 612, 21–32. doi: 10.1007/s10750-008-9491-0
MacLeod C. D., Weir C. R., Pierpoint C., Harland E. J. (2007). The habitat preferences of marine mammals west of Scotland (UK). J. Mar. Biol. Assoc. United Kingdom 87, 157–164. doi: 10.1017/S0025315407055270
MacLeod C. D., Weir C. R., Santos M. B., Dunn T. E. (2008b). Temperature-based summer habitat partitioning between white-beaked and common dolphins around the United Kingdom and Republic of Ireland. J. Mar. Biol. Assoc. United Kingdom 88, 1193–1198. doi: 10.1017/S002531540800074X
Malehi A. S., Jahangiri M. (2019). Classic and bayesian tree-based methods. In Enhanced Expert Systems (IntechOpen).
Mannocci L., Catalogna M., Dorémus G., Laran S., Lehodey P., Massart W., et al. (2014). Predicting cetacean and seabird habitats across a productivity gradient in the South Pacific gyre. Prog. Oceanogr. 120, 383–398. doi: 10.1016/j.pocean.2013.11.005
Maravelias C. D., Reid D. G. (1997). Identifying the effects of oceanographic features and zooplankton on prespawning herring abundance using generalized additive models. Mar. Ecol. Prog. Ser. 147, 1–9. doi: 10.3354/meps147001
Maravelias C. D., Reid D. G., Swartzman G. (2000). Seabed substrate, water depth and zooplankton as determinants of the prespawning spatial aggregation of North Atlantic herring. Mar. Ecol. Prog. Ser. 195, 249–259. doi: 10.3354/meps195249
Marchese C. (2015). Biodiversity hotspots: A shortcut for a more complicated concept. Global Ecol. Conserv. 3, 297–309. doi: 10.1016/j.gecco.2014.12.008
Marine Institute and Scottish Association for Marine Sciences (2022). COMPASS-NEATL Hindcast 2021 (Scotland: SAMS).
Marine Protected Area Advisory Group (2020). Expanding Ireland’s Marine Protected Area Network: A report by the Marine Protected Area Advisory Group. Report for the Department of Housing, Local Government and Heritage, Ireland. Tech. rep (Ireland: government of Ireland).
McDougall T. J., Barker P. M. (2011). Getting started with TEOS-10 and the Gibbs Seawater (GSW) oceanographic toolbox. Scor/Iapso WG, 127(532), 1–28.
Miller P. I., Christodoulou S. (2014). Frequent locations of oceanic fronts as an indicator of pelagic diversity: Application to marine protected areas and renewables. Mar. Policy 45, 318–329. doi: 10.1016/j.marpol.2013.09.009
Miller P. I., Xu W., Londsale P. (2014). Seasonal shelf-sea front mapping using satellite ocean colour to support development of the Scottish MPA network. Scottish Natural Heritage, Policy and Advice Directorate. Tech. Rep. 538.
Moisen G. G. (2008). “Classification and regression trees,” in Encyclopedia of Ecology, vol. volume 1 . Eds. Jørgensen, Sven Erik, Fath, Brian D. (Oxford, UK: Elsevier), 582–588.
Moura A. E., Sillero N., Rodrigues A. (2012). Common dolphin (Delphinus delphis) habitat preferences using data from two platforms of opportunity. Acta Oecologica 38, 24–32. doi: 10.1016/j.actao.2011.08.006
Munk P., Nielsen T. G. (1994). Trophodynamics of the plankton community at Dogger Bank: predatory impact by larval fish. J. Plankton Res. 16, 1225–1245. doi: 10.1093/plankt/16.9.1225
NatureScot and JNCC. (n.d.). Marine Protected Areas and Large-Scale Features. Position Paper. Tech. 1195 rep., NatureScot and JNCC.
Northridge S., Cargill A., Coram A., Mandleberg L., Calderan S., Reid R. (2010). Entanglement of minke whales in Scottish waters: an investigation into occurrence, causes and mitigation. Contract Report. Final Report to Scottish Government CR/2007/49 (Scotland: Scottish government).
Northridge S. P., Tasker M. L., Webb A., Williams J. M. (1995). Distribution and relative abundance of harbour porpoises (Phocoena phocoena L.), white-beaked dolphins (Lagenorhynchus albirostris Gray), and minke whales (Balaenoptera acutorostrata Lacepède) around the British Isles. ICES J. Mar. Sci. 52, 55–66. doi: 10.1016/1054-3139(95)80015-8
Notarbartolo-di Sciara G. (2008). Marine protected areas for cetaceans: basic concepts on selection, creation and management. Selection Criteria Mar. Protect. Areas Cetaceans 7.
O’Brien J., Berrow S., McGrath D., Evans P. (2009). Cetaceans in Irish waters: a review of recent research. Biol. Environ.: Proc. R. Irish Acad. 109, 63–88. doi: 10.3318/BIOE.2009.109.2.63
O’Brien K., Whitehead H. (2013). Population analysis of Endangered northern bottlenose whales on the Scotian Shelf seven years after the establishment of a Marine Protected Area. Endangered Species Res. 21, 273–284. doi: 10.3354/esr00533
O’Donnell C., O’Malley M., Mullins E., Connaughton P., Keogh N., Judge J., et al. (2021). Western European Shelf Pelagic Acoustic Survey (WESPAS). Tech. rep (Ireland: Marine Institute).
Ostrowski M., Bazika-Sangolay B. (2015). “On physical mechanisms controlling inshore aggregations of small pelagic fish in a tropical upwelling system,” in 2015 IEEE/OES Acoustics in Underwater Geosciences Symposium (RIO Acoustics), 1–7. doi: 10.1109/RIOAcoustics.2015.7473621
Parsons E. C. M., Clark J., Simmonds M. P. (2010). The conservation of British cetaceans: a review of the threats and protection afforded to whales, dolphins, and porpoises in UK waters, Part 2. J. Int’l Wildlife L. Pol’y 13, 99. doi: 10.1080/13880291003705145
Paxton C. G. M., Scott-Hayward L., MacKenzie M., Rexstad E., Thomas L. (2016). Revised Phase III Data Analysis of Joint Cetacean Protocol Data Resource. Tech. Rep Vol. 517 (Peterborough: JNCC).
Paxton C. G., Scott-Hayward L. A. S., Rexstad E. A. (2014). Statistical approaches to aid the identification of Marine Protected Areas for minke whale, Risso’s dolphin, white-beaked dolphin and basking shark (Scotland: Scottish Natural Heritage, Policy and Advice Directorate).
Pedersen F. B., Hansen L. (1993). Structure of plankton communities in the Dogger Bank area (North Sea) during a stratified situation. Mar. Ecol. Prog. Ser. 95, 115–131. doi: 10.3354/meps095115
Peltier H., Authier M., Caurant F., Dabin W., Daniel P., Dars C., et al. (2021). In the wrong place at the wrong time: identifying spatiotemporal co-occurrence of bycaught common dolphins and fisheries in the bay of Biscay (NE Atlantic) from 2010 to 2019. Front. Mar. Sci. 8.
Perrin W. F. (2018). “Common dolphin: Delphinus delphis,” in Encyclopedia of marine mammals (Elsevier), 205–209.
Perrin W. F., Mallette S. D., Brownell R. L. Jr. (2018). “Minke whales: Balaenoptera acutorostrata and b. bonaerensis,” in Encyclopedia of marine mammals (Elsevier), 608–613.
Pierce G. J., Santos M. B., Reid R. J., Patterson I. A. P., Ross H. M. (2004). Diet of minke whales Balaenoptera acutorostrata in Scottish (UK) waters with notes on strandings of this species in Scotland 1992–2002. J. Mar. Biol. Assoc. United Kingdom 84, 1241–1244. doi: 10.1017/S0025315404010732h
Pingree R. D., Holligan P. M., Mardell G. T. (1978). The effects of vertical stability on phytoplankton distributions in the summer on the northwest European Shelf. Deep Sea Res. 25, 1011–1028. doi: 10.1016/0146-6291(78)90584-2
Pirotta E., Brotons J. M., Cerdà M., Bakkers S., Rendell L. E. (2020). Multi-scale analysis reveals changing distribution patterns and the influence of social structure on the habitat use of an endangered marine predator, the sperm whale Physeter macrocephalus in the Western Mediterranean Sea. Deep Sea Res. Part I: Oceanogr. Res. Papers 155, 103169. doi: 10.1016/j.dsr.2019.103169
Pirotta E., Thompson P. M., Miller P. I., Brookes K. L., Cheney B., Barton T. R., et al. (2014). Scaledependent foraging ecology of a marine top predator modelled using passive acoustic data. Funct. Ecol. 28, 206–217. doi: 10.1111/1365-2435.12146
Plant E., King R., Kath J. (2021). Statistical comparison of additive regression tree methods on ecological grassland data. Ecol. Inf. 61, 101198. doi: 10.1016/j.ecoinf.2020.101198
Pollock C. M., Mavor R., Weir C. R., Reid A., White R. W., Tasker M. L., et al. (2000). The distribution of seabirds and marine mammals in the Atlantic Frontier, north and west of Scotland. The distribution of seabirds and marine mammals in the Atlantic Frontier, north and west of Scotland (United Kingdom: Joint Nature Conservation Committee (JNCC)). 1–92.
Pollock L. J., Tingley R., Morris W. K., Golding N., O’Hara R. B., Parris K. M., et al. (2014). Understanding co-occurrence by modelling species simultaneously with a Joint Species Distribution Model (JSDM). Methods Ecol. Evol. 5, 397–406. doi: 10.1111/2041-210X.12180
Pout A., Campbell N., Beare D., Clarke E., Hillary R., Hölker F., et al. (2008). Modelling vessel activity in the Scottish pelagic fleet: the relationship between capacity and effort and the evaluation of a range of possible management plans. ICES Document CM 1, 08.
Raine R., McMahon T. (1993). A review of the summer phytoplankton distribution in Irish coastal waters: a biogeography related to physical oceanography. Occas. Pub. Irish Biogeogr. Soc 2, 99–111.
Real R., Barbosa A. M., Vargas J. M. (2006). Obtaining environmental favourability functions from logistic regression. Environ. Ecol. Stat 13, 237–245. doi: 10.1007/s10651-005-0003-3
Receveur A., Allain V., Menard F., Lebourges Dhaussy A., Laran S., Ravache A., et al. (2021). Modelling marine predator habitat using the abundance of its pelagic prey in the tropical SouthWestern Pacific. Ecosystems 25 (4), 757-779. doi: 10.1007/s10021-021-00685-x
Redfern J. V., Ferguson M. C., Becker E. A., Hyrenbach K. D., Good C., Barlow J., et al. (2006). Techniques for cetacean–habitat modeling. Mar. Ecol. Prog. Ser. 310, 271–295. doi: 10.3354/meps310271
Reid J. B., Evans P. G. H., Northridge S. P. (2003). Atlas of Cetacean distribution in north-west European waters. Tech. Rep.
Risch D., Castellote M., Clark C. W., Davis G. E., Dugan P. J., Hodge L. E., et al. (2014). Seasonal migrations of North Atlantic minke whales: novel insights from large-scale passive acoustic monitoring networks. Movement Ecol. 2, 24. doi: 10.1186/s40462-014-0024-3
Risch D., Wilson S. C., Hoogerwerf M., Geel N. C. F., Edwards E. W. J., Brookes K. L. (2019). Seasonal and diel acoustic presence of North Atlantic minke whales in the North Sea. Sci. Rep. 9, 1–11. doi: 10.1038/s41598-019-39752-8
Roberts D. R., Bahn V., Ciuti S., Boyce M. S., Elith J., Guillera-Arroita G., et al. (2017). Crossvalidation strategies for data with temporal, spatial, hierarchical, or phylogenetic structure. Ecography 40, 913–929. doi: 10.1111/ecog.02881
Robinson K. P., MacDougall D. A., Bamford C. C., Brown W. J., Dolan C. J., Hall R., et al. (2023). Ecological habitat partitioning and feeding specialisations of coastal minke whales (Balaenoptera acutorostrata) using a designated MPA in northeast Scotland. PloS one. 18(7), e0246617.
Robinson K. P., Eisfeld S. M., Costa M., Simmonds M. P. (2010). Short-beaked common dolphin (Delphinus delphis) occurrence in the Moray Firth, north-east Scotland. Mar. Biodivers. Records 3, e55. doi: 10.1017/S1755267210000448
Robinson K. P., Tetley M. J., Mitchelson-Jacob E. G. (2009). The distribution and habitat preference of coastally occurring minke whales (Balaenoptera acutorostrata) in the outer southern Moray Firth, northeast Scotland. J. Coast. Conserv. 13, 39–48. doi: 10.1007/s11852-009-0050-2
Rogan E., Breen P., Mackey M., Cañadas A., Scheidat M., Geelhoed S., et al. (2018). Aerial Surveys of Cetaceans and Seabirds in Irish waters: Occurrence, distribution and abundance in 2015-2017. Tech. Rep. Department of Communications, Climate Action & Environment.
Rota C. T., Fletcher R. J. Jr., Evans J. M., Hutto R. L. (2011). Does accounting for imperfect detection improve species distribution models? Ecography 34, 659–670. doi: 10.1111/j.1600-0587.2010.06433.x
Runge C. A., Martin T. G., Possingham H. P., Willis S. G., Fuller R. A. (2014). Conserving mobile species. Front. Ecol. Environ. 12, 395–402. doi: 10.1890/130237
Runge C. A., Tulloch A., Hammill E., Possingham H. P., Fuller R. A. (2015). Geographic range size and extinction risk assessment in nomadic species. Conserv. Biol. 29, 865–876. doi: 10.1111/cobi.12440
Santos M. B., Pierce G. J., Ross H. M., Reid R. J., Wilson B. (1994). Diets of small cetaceans from the Scottish coast Vol. 1994 (COPENHAGEN(DENMARK: ICES).
Sbrocco E. J., Barber P. H. (2013). MARSPEC: ocean climate layers for marine spatial ecology. Ecology 94, 979–979. doi: 10.1890/12-1358.1
Scales K. L., Hazen E. L., Jacox M. G., Edwards C. A., Boustany A. M., Oliver M. J., et al. (2017). Scale of inference: on the sensitivity of habitat models for wide-ranging marine predators to the resolution of environmental data. Ecography 40, 210–220. doi: 10.1111/ecog.02272
Scales K. L., Miller P. I., Embling C. B., Ingram S. N., Pirotta E., Votier S. C. (2014a). Mesoscale fronts as foraging habitats: composite front mapping reveals oceanographic drivers of habitat use for a pelagic seabird. J. R. Soc. Interface 11, 20140679. doi: 10.1098/rsif.2014.0679
Scales K. L., Miller P. I., Hawkes L. A., Ingram S. N., Sims D. W., Votier S. C. (2014b). On the Front Line: frontal zones as priority at-sea conservation areas for mobile marine vertebrates. J. Appl. Ecol. 51, 1575–1583. doi: 10.1111/1365-2664.12330
Scott B. E., Sharples J., Ross O. N., Wang J., Pierce G. J., Camphuysen C. J. (2010). Sub-surface hotspots in shallow seas: fine-scale limited locations of top predator foraging habitat indicated by tidal mixing and sub-surface chlorophyll. Mar. Ecol. Prog. Ser. 408, 207–226. doi: 10.3354/meps08552
Sharples J., Simpson J. (2009). Shelf sea and shelf slope fronts. Encyclopaedia of Ocean Sciences, 2nd Edn. edited by: Steele J. H. (Cambridge, Massachusetts, United States: Academic Press), 391-400.
Sillero N., Barbosa A. M. (2021). Common mistakes in ecological niche models. Int. J. Geogr. Inf. Sci. 35, 213–226. doi: 10.1080/13658816.2020.1798968
Simpson J. (1981). The shelf-sea fronts: Implications of their existence and behaviour. R. Soc. London Philos. Trans. Ser. A, Math. Phys. 302(1472):531–546. doi: 10.1098/rsta.1981.0181
Simpson J. H., Edelsten D. J., Edwards A., Morris N. C. G., Tett P. B. (1979). The Islay front: Physical structure and phytoplankton distribution. Estuar. Coast. Mar. Sci. 9, 713–IN1. doi: 10.1016/S0302-3524(79)80005-5
Simpson J. H., Sharples J. (2012). Introduction to the physical and biological oceanography of shelf seas (UK: Cambridge University Press).
Sinclair M., Iles T. D. (1985). Atlantic Herring (Clupea harengus) distributions in the gulf of Maine –Scotian shelf area in relation to oceanographic features. Can. J. Fisheries Aquat. Sci. 42, 880–887. doi: 10.1139/f85-112
Spitz J., Mourocq E., Leauté J.-P., Quéro J.-C., Ridoux V. (2010). Prey selection by the common dolphin: Fulfilling high energy requirements with high quality food. J. Exp. Mar. Biol. Ecol. 390, 73–77. doi: 10.1016/j.jembe.2010.05.010
Spitz J., Trites A. W., Becquet V., Brind’Amour A., Cherel Y., Galois R., et al. (2012). Cost of living dictates what whales, dolphins and porpoises eat: the importance of prey quality on predator foraging strategies. PloS One 7, e50096. doi: 10.1371/journal.pone.0050096
Stephenson F., Rowden A., Anderson O., Pitcher C., Pinkerton M., Petersen G., et al. (2021). Presenceonly habitat suitability models for vulnerable marine ecosystem indicator taxa in the South Pacific have reached their predictive limit. ICES J. Mar. Sci. 78 (8), 2830-2843. doi: 10.1093/icesjms/fsab162
Stern S. J. (2009). “Migration and movement patterns,” in Encyclopedia of Marine Mammals (Second Edition). Eds. Perrin W. F., Würsig B., Thewissen J. G. M. (London: Academic Press), 726–730. doi: 10.1016/B978-0-12-373553-9.00168-1
Taggart C. T., Drinkwater K. F., Frank K. T., McRuer J., LaRouche P. (1989). Larval fish, zooplankton community structure, and physical dynamics at a tidal front. Rapp. Reun. Conseil Explor. Mer 191, 184–194.
Tan Y. V., Roy J. (2019). Bayesian additive regression trees and the General BART model. Stat. Med. 38 (25), 5048-5069. doi: 10.48550/arXiv.1901.07504
Tasker M. L., Webb A., Harrison N. M., Pienkowski M. W. (1990). Vulnerable concentrations of marine birds west of Britain. Nat. Conservancy Council Peterborough, 1–45.
Tetley M. J., Mitchelson-Jacob E. G., Robinson K. P. (2008). The summer distribution of coastal minke whales (Balaenoptera acutorostrata) in the southern outer Moray Firth, NE Scotland, in relation to co-occurring mesoscale oceanographic features. Remote Sens. Environ. 112, 3449–3454. doi: 10.1016/j.rse.2007.10.015
Thomas L. E. N., Williams R. O. B., Sandilands D. (2007). Designing line transect surveys for complex survey regions. J. Cetacean Res. Manage. 9, 1. doi: 10.47536/jcrm.v9i1.687
Tikhonov G., Abrego N., Dunson D., Ovaskainen O. (2017). Using joint species distribution models for evaluating how species-to-species associations depend on the environmental context. Methods Ecol. Evol. 8, 443–452. doi: 10.1111/2041-210X.12723
Tobler M. W., Kéry M., Hui F. K., Guillera-Arroita G., Knaus P., Sattler T. (2019). Joint species distribution models with species correlations and imperfect detection. Ecology 100, e02754. doi: 10.1002/ecy.2754
Valavi R., Elith J., Lahoz-Monfort J. J., Guillera-Arroita G. (2019). blockCV: An r package for generating spatially or environmentally separated folds for k-fold cross-validation of species distribution models. Methods Ecol. Evol. 10, 225–232. doi: 10.1111/2041-210X.13107
Vasquez M., Allen H., Manca E., Castle L., Lillis H., Agnesi S., et al. (2021). EUSeaMap 2021. A European broad-scale seabed habitat map. (EMODnet).
Virgili A., Hedon L., Authier M., Calmettes B., Claridge D., Cole T., et al. (2021). Towards a better characterisation of deep-diving whales’ distributions by using prey distribution model outputs? PloS One 16, e0255667. doi: 10.1371/journal.pone.0255667
Volkenandt M., O’Connor I., Guarini J.-M., Berrow S., O’Donnell C. (2015). Fine-scale spatial association between baleen whales and forage fish in the Celtic Sea. Can. J. Fisheries Aquat. Sci. 73 (2), 197-204. doi: 10.1139/cjfas-2015-0073
Waggitt J. J., Evans P. G. H., Andrade J., Banks A. N., Boisseau O., Bolton M., et al. (2020). Distribution maps of cetacean and seabird populations in the North-East Atlantic. J. Appl. Ecol. 57 (2), 253-269. doi: 10.1111/1365-2664.13525
Wakefield E. D., Owen E., Baer J., Carroll M. J., Daunt F., Dodd S. G., et al. (2017). Breeding density, fine-scale tracking, and large-scale modeling reveal the regional distribution of four seabird species. Ecol. Appl. 27, 2074–2091. doi: 10.1002/eap.1591
Wall D. (2013). Marine Mammals and Megafauna in Irish Waters-Behaviour, Distribution and Habitat Use-WP1 Monitoring Spatial and Temporal Habitat Use and Abundance of Cetaceans. Tech. rep (Ireland: Irish Whale and Dolphin Group).
Wall D., O’Brien J., Meade J., Allen B. (2006). Summer distribution and relative abundance of cetaceans off the West coast of Ireland. Biol. Environ. Proc. R. Irish Acad. Biol. Environ. 106. doi: 10.3318/BIOE.2006.106.2.135
Weir C. R., Hodgins N. K., Dolman S. J., Walters A. E. M. (2019). Risso’s dolphins (Grampus griseus) in a proposed Marine Protected Area off east Lewis (Scotland, UK), 2010–2017. J. Mar. Biol. Assoc. United Kingdom 99, 703–714. doi: 10.1017/S0025315418000516
Weir C. R., Macleod C. D., Calderan S. V. (2009). Fine-scale habitat selection by white-beaked and common dolphins in the Minch (Scotland, UK): evidence for interspecific competition or coexistence? J. Mar. Biol. Assoc. United Kingdom 89, 951–960. doi: 10.1017/S0025315408003287
Weir C. R., Pollock C., Cronin C., Taylor S. (2001). Cetaceans of the Atlantic Frontier, north and west of Scotland. Continental Shelf Res. 21, 1047–1071. doi: 10.1016/S0278-4343(00)00124-2
Williams K., Belbin L., Austin M., Stein J., Ferrier S. (2012). Which environmental variables should I use in my biodiversity model? Int. J. Geogr. Inf. Sci. GIS 26, 1–39. doi: 10.1080/13658816.2012.698015
Wingfield D. K., Peckham S. H., Foley D. G., Palacios D. M., Lavaniegos B. E., Durazo R., et al. (2011). The making of a productivity hotspot in the coastal ocean. PloS One 6, e27874. doi: 10.1371/journal.pone.0027874
Worm B., Lotze H. K., Myers R. A. (2003). Predator diversity hotspots in the blue ocean. Proc. Natl. Acad. Sci. 100, 9884–9888. doi: 10.1073/pnas.1333941100
Wright P. J., Jensen H., Tuck I. (2000). The influence of sediment type on the distribution of the lesser sandeel, Ammodytes marinus. J. Sea Res. 44, 243–256. doi: 10.1016/S1385-1101(00)00050-2
Keywords: cetaceans, habitat modelling, Bayesian statistics, fisheries, conservation, remote sensing, ecology, marine ecosystems
Citation: Pommier M, O’Donnell C, Barile C, McGill R, Berrow S and O’Brien J (2023) Exploring environmental and biological drivers of cetacean occurrence in the cross-border region of the Malin Shelf using data from a European fishery survey. Front. Mar. Sci. 10:1224267. doi: 10.3389/fmars.2023.1224267
Received: 17 May 2023; Accepted: 17 October 2023;
Published: 15 November 2023.
Edited by:
Roberto Carlucci, University of Bari Aldo Moro, ItalyReviewed by:
Bingyao Chen, Nanjing Normal University, ChinaGiulia Cipriano, University of Bari Aldo Moro, Italy
Copyright © 2023 Pommier, O’Donnell, Barile, McGill, Berrow and O’Brien. This is an open-access article distributed under the terms of the Creative Commons Attribution License (CC BY). The use, distribution or reproduction in other forums is permitted, provided the original author(s) and the copyright owner(s) are credited and that the original publication in this journal is cited, in accordance with accepted academic practice. No use, distribution or reproduction is permitted which does not comply with these terms.
*Correspondence: Morgane Pommier, pommier.morgane50@gmail.com