Experimental ocean acidification and food limitation reveals altered energy budgets and synergistic effects on mortality of larvae of a coastal fish
 Emma Siegfried
 Darren W. Johnson
- Department of Biological Sciences, California State University, Long Beach, Long Beach, CA, United States
Ocean acidification (OA) presents a unique challenge to early life stages of marine species. Developing organisms must balance the need to grow rapidly with the energetic demands of maintaining homeostasis. The small sizes of early life stages can make them highly sensitive to changes in environmental CO2 levels, but studies have found wide variation in responses to OA. Thus far most OA studies have manipulated CO2 only, and modifying factors need to be considered in greater detail. We investigated the effects of high pCO2 and food ration on rates of growth and mortality of a coastal fish, the California Grunion (Leuresthes tenuis). We also examined how CO2 and food levels affected feeding success, metabolic rate, and swimming activity – processes reflective of energy acquisition and expenditure. In general, exposure to high CO2 decreased energy intake by reducing feeding success, and increased energy expenditure by increasing metabolic rate and routine swimming speed, though the magnitudes of these effects varied somewhat with age. Despite these changes in energetics, growth of biomass was not affected significantly by pCO2 level but was reduced by low ration level, and we did not detect an interactive effect of food ration and pCO2 on growth. However, under OA conditions, larvae were in poorer condition (as evaluated by the mass to length ratio) by the end of the experiment and our analysis of mortality revealed a significant interaction in which the effects of OA were more lethal when food energy was limited. These results are consistent with the idea that although energy can be reallocated to preserve biomass growth, increased energetic demand under ocean acidification may draw energy away from maintenance, including those processes that foster homeostasis during development. Overall, these results highlight both the need to consider the availability of food energy as a force governing species’ responses to ocean acidification and the need to explicitly consider the energy allocated to both growth and maintenance as climate changes.
1 Introduction
Ocean acidification (OA) is one of the major ongoing effects of climate change caused by anthropogenic carbon dioxide (CO2) emissions. The rate at which our climate is changing is unparalleled in geological history (Kump et al., 2009; Hönisch et al., 2012), and many studies have demonstrated harmful effects of ocean acidification on a variety of species (Fabry et al., 2008; Kroeker et al., 2010; Harvey et al., 2013; Kroeker et al., 2013; Wittmann and Pörtner, 2013; Ashur et al., 2017). Increases in pCO2 have been shown to negatively impact survival, growth, and calcification across a range of marine taxa (Kroeker et al., 2013). Larval stages have been demonstrated to be particularly vulnerable to ocean acidification conditions (Przeslawski et al., 2015; Cattano et al., 2018), in part because of their small size and in part because the larval period is typically long relative to other early stages of development that are also sensitive to acidification conditions (eggs, embryos). Growth throughout the larval period and survival during this time is important for the dynamics of populations because larval survival may be a population bottleneck and as a result is critical to population replenishment (Houde, 1987; Johnson et al., 2014). Understanding the effects of climate change on the larval stage is thus important as long-term changes in growth or mortality could have large effects on the future abundance of populations.
For larval fishes, increases in pCO2 have had varying impacts on several behavioral, physiological, and morphological traits. These effects include decreases in survival and growth in species such as the inland silverside (Menidia beryllina), summer flounder (Paralichthys dentatus), Atlantic herring (Clupea harengus), Atlantic Cod (Gadus morhua), and California Grunion (Leuresthes tenuis) (Baumann et al., 2012; Chambers et al., 2014; Tasoff and Johnson, 2019; Johnson, 2022), while others species such as cobia (Rachycentron canadum), walleye pollock (Theragra chalcogramma), and spiny damselfish (Acanthochromis polyacanthus) have exhibited no significant change in mortality or growth (Munday et al., 2011a; Bignami et al., 2013b; Hurst et al., 2014). Studies have even seen contradicting responses to elevated pCO2 in the same species, particularly in Atlantic Herring (Clupea harengus) and Atlantic Cod (Gadus morhua) (Franke and Clemmesen, 2011; Maneja et al., 2013; Frommel et al., 2014; Stiasny et al., 2016).
To highlight an example of the variation in responses of larvae to ocean acidification conditions, Frommel et al. (2014) and Sswat et al. (2018) both studied the growth and survival of Atlantic Herring. These were two separate studies both done with eggs sourced from populations of herring that live off the coast of Norway. Each experiment raised larvae in flow through systems that were fed natural plankton from nearby oceanic sources. Sswat et al. (2018) saw no difference in weight of larvae from OA and ambient conditions across the entire experiment, whereas Frommel et al. (2014) found that growth was significantly reduced by high pCO2 with the differences in growth increasing over time. With this being said, these two studies used different CO2 treatments – with Sswat et al. (2018) using values projected for the end of the century, and Frommel et al. (2014) using much higher values. Such differences in responses highlight the need to examine factors that may moderate species’ responses to ocean acidification conditions across CO2 dosages, particularly because OA is only one of a suite of stressors caused by climate change. Studies have begun to consider the effects of OA in combination with other variables, especially abiotic stressors (DePasquale et al., 2015; Pimentel et al., 2016; Laubenstein et al., 2018; Leo et al., 2018; Murray and Baumann, 2018; Watson et al., 2018; Cominassi et al., 2019; Di Santo, 2019; Hamilton et al., 2019; Dahlke et al., 2020; Villalobos et al., 2020; McMahon et al., 2020a; McMahon et al., 2020b; Frommel et al., 2022), but more research is needed to examine how the effects of OA depend on changes in the biotic environment (e.g., Bignami et al., 2017; Gobler et al., 2018; Stiasny et al., 2019; Cominassi et al., 2020).
As CO2 levels increase within the ocean, maintaining homeostasis will come at a greater energetic cost (Heuer and Grosell, 2014; Heuer and Grosell, 2016), and variation in food availability will likely play an important physiological role as organisms strive to meet their increased energetic demands. In addition, food availability is likely to change as climate changes. Since 1899, global median phytoplankton concentration has been decreasing by approximately 1% per year (Boyce et al., 2010). In general, the amount, size, and timing of food availability has been shown to affect recruitment of larval fishes (Hjort, 1914; Beaugrand et al., 2003), and the mismatch between food being available and the timing of fish spawning is predicted to increase as climate change continues (Asch et al., 2019). The timing of blooms has already changed in the Southern California region, with phytoplankton blooms shifting from spring to summer in the early 2000s (Venrick, 2012). A decrease in the amount of food available for larval fishes and invertebrates may be caused by either a mismatch in the timing of reproduction and food availability or just an overall decrease in food resources. Either way, changes in food availability could exacerbate the effects of climate change on the physiology of individuals, as the energy and nutrients available to individuals decrease.
The availability of food may moderate the responses of larval fishes to OA. Many previous studies of the effects of climate change have fed larval fishes ad libitum, and an abundance of food could dampen the responses. If the larvae have enough energy due to high amounts of food being available, they could overcome the negative energetic effects of ocean acidification or climate change more generally (Pan et al., 2015). As a result, the amount of food available being different across studies could explain some of the variation seen when comparing species’ tolerances to ocean acidification levels. In any case, the influence of food availability on responses to OA needs to be tested further.
In this study, we tested the effects of ocean acidification on growth and survival of larval California Grunion (Leuresthes tenuis) and how those effects might be moderated by different levels of food availability. To investigate how food availability may alter the response of larvae to OA, we examined several mechanistic processes that could affect energetics. Measurements of feeding rate, respiration rate, and routine swimming speed complemented the focus on the fitness-related endpoints of growth and mortality rates. Evaluating this set of metrics allowed us to gain a more general understanding of how OA can affect larval fish, and how those responses might be moderated by food availability.
2 Materials and methods
2.1 Study species
California Grunion (Leuresthes tenuis) are new world silversides (order: Atherinopsidae) that range from Baja California, Mexico to the San Francisco Bay area, and are common in Southern California (Walker, 1952; Gregory, 2001; Martin et al., 2013). Rather than spawning out in the ocean, grunion come up onto beaches during spring tides to spawn in events termed runs. Eggs and milt were collected at runs occurring from March to September on the days following new and full moons at Seal Beach, CA (33° 44’ 24.4530”, -118° 6’ 54.6516”) during the summers of 2021 and 2022.
Adult grunion were caught and strip spawned, after which eggs were fertilized for these experiments. Embryos were incubated in artificial nests of 450 mL containers of wet sand buried under approximately 40 mm of sand between 12 and 14 days under constant temperature (20˚C) and full darkness. After the incubation period, eggs were removed from the artificial nests and hatched in seawater through slight agitation to mimic the wave action that triggers hatching (Griem and Martin, 2000).
2.2 Overview of experimental design
To test the effects of OA on larval grunion and how those effects may be moderated by food availability, we conducted an experiment where larvae developed for 12 days under different experimental treatments: two levels of pCO2 (406.8 µatm representing ambient conditions and 1049.5 µatm representing near future conditions) crossed with two feeding treatments (80 nauplii x individual-1 x day-1 and 160 nauplii x individual-1 x day-1). The high feeding treatment was chosen because previous experiments designed to measure consumption rates found that grunion larvae of similar age and raised the same temperatures as our study (12 days post hatch and 16˚C) have been shown to consume approximately 160 nauplii individual-1 day-1 when a surplus of nauplii was available (Shelley and Johnson, 2022). During each experimental replicate, larvae from each of 6 full sibling groups were reared across all 4 experimental treatments. Twenty-four tanks of larvae were reared at a time and the full experiment was repeated 12 times. Our primary focus was on the independent and combined effects of OA and food availability on growth and survival. In addition, most replicates also included measurements of feeding rate, respiration rate, and behavior. Any changes in these energetic processes may shed light on how OA affects energy expenditure and acquisition. Because growth and survival will depend on energy budgets, the examination of several energetic responses simultaneously allowed us to further assess the pathways by which OA affects the performance and ultimately survival of larvae.
2.3 Seawater chemistry manipulations
During each run of the experiment, larvae were reared within four seawater systems, with two systems simulating OA conditions and two simulating ambient conditions. Each system consisted of six 6.6L rearing tanks circulated through a 140L sump which contained a mechanical filter (200 µm), protein skimmer, and chiller. OA conditions were simulated by bubbling gas into the sumps of these systems. Ambient conditions received a constant flow of air bubbled in by a continuously running pump connected to tubing capped with an air stone. OA conditions received a constant flow of air and an intermittent flow of CO2. A pH controller system was used to control pH as a proxy for the partial pressure of CO2 (pCO2) in water. In the OA treatment, controllers were set to a target pH of 7.65 (which corresponds to a pCO2 of ~1180 µatm for source seawater) and the flow of CO2 was turned on when the pH rose above 7.78 and shut off when it fell below 7.52 (Pinpoint-pH, American Marine Inc., Ridgefield, CT). Experiments were replicated in 12-day cycles over time, and between replicate blocks all the systems were drained completely and replenished with fresh seawater.
Throughout the experiment, seawater chemistry parameters were monitored. Temperature, pH, and salinity were monitored daily. Temperature was monitored using digital thermometers reporting to the nearest 0.1˚C, and salinity with a handheld refractometer. pH was measured using an Orion Star A211 probe (Thermo Scientific, Waltham, MA). Probes were calibrated every 72 hours with National Institute of Standards and Technology (NIST) certified 3-point pH buffers, and all measurements were recorded to the nearest 0.01 units. Even though pH total scale is often recommended for OA systems, measuring on the NBS scale is also accurate and can provide estimates of pCO2 that are within a few µatm of other approaches (Munday et al., 2014). Total alkalinity was measured at minimum every 6 days using a total alkalinity titration system (model AS-ALK2, Apollo SciTech, Newark, DE, USA). The coefficient of variation for the measurement variability of the alkalinity measurements ( ± 1.24%) was verified using standards for alkalinity in seawater that were obtained from the Certified Reference Materials Laboratory at Scripps Institution of Oceanography. The package seacarb in R version 4.2.1 was used to calculate pCO2 from total alkalinity, pH, and salinity using the K1 and K2 constants from Millero (2010).
2.4 Larval rearing and ration treatment
For each of the larval families (n = 6 per experimental run), samples of up to 100 larvae were distributed to each of the four experimental treatments (2 OA levels X 2 food levels), and each family was represented in all four seawater systems. Larvae remained in the rearing tanks for 12 days under a seawater flow of 10 mL/s and a 13:11-hr light-dark cycle. Larvae were provided food for the first time 3 days after hatch, a time in development when most grunion larvae transition to external feeding (May, 1971). In addition to either elevated or ambient pCO2, each tank was assigned to either a high ration or low ration treatment. Larvae were fed Artemia spp. nauplii from cultures that were either 2 or 3 days old. This timeframe allowed us to cycle multiple Artemia cultures and ensure that we had a consistent supply of food of similar caloric content (the energy density of Artemia nauplii declines over time, but 2- and 3- day nauplii have similar values; Vanhaecke et al., 1983). The high ration treatment tanks received 160 Artemia spp. nauplii per individual per day, while low ration tanks received 80 Artemia spp. nauplii per individual per day. The concentration of nauplii was estimated volumetrically using 4, 200 µL samples. The volume of nauplii fed to each tank was then calculated based on the concentration of nauplii in the stock solution, the number of fish larvae remaining in the tank, and the desired ration level.
2.5 Response variables
During the 12d experimental cycles, we measured mortality and growth, as well as feeding success, respiration, and behavior. We wanted to evaluate any links between physiological mechanisms and energetics to endpoint responses like mortality. Each of the metrics, apart from mortality, was measured at 3 points during the 12d experimental cycle – at the beginning, middle, and end. Beginning measurements were made on day of hatch and thus represent a baseline average for each family before being placed into an experimental treatment. The one exception was feeding rate. Because grunion larvae do not feed until a few days after hatch, early feeding rate was measured at day 3, a time when most larvae have transitioned to feeding externally (May, 1971). This measurement was thus influenced by experimental treatments and not a true baseline measure for each family.
Mortality was evaluated by totaling the number of dead fish larvae at the bottom of each tank daily. This number was then used to calculate the proportion of fish that remained alive on each day of the experiment. This proportion was then Ln-transformed and regressed on days post hatch. The negative of the slope of this regression was used as the estimate of daily mortality rate.
Size was measured through two different metrics – length and mass. Length measurements were obtained by euthanizing larvae in tricaine methanesulfonate (MS-222) and then taking photos of larvae. Notochord length was measured on images of 10 larvae from each family on hatch day and then each tank on both 6 dph and 12 dph using ImageJ (Schneider et al., 2012). Wet mass was measured for groups of 20 individuals placed on pre-weighed pieces of aluminium foil. Water was removed by blotting the fish, and they were then placed in a drying oven at 40˚C for 24 hours before dry mass was measured. All masses were measured using an ML54T Precision Balance that reported weights to the nearest 1e-4 g (Mettler Toledo, Greifensee, Switzerland). Masses were measured for groups, rather than individuals because the dry weights of individual larvae (~4.70e-4 g on average) were near the reporting precision of the balance and lower than the minimum sample weight recommended by the manufacturer. The estimated average dry mass and notochord length per individual were used to calculate growth rates. Growth rates were calculated for two different time periods in this study (0 dph to 6 dph and 6 dph to 12 dph). These rates were calculated as the difference in either mass or notochord length between the two days divided by the amount of time between the two points. Condition factor was also calculated from these two measurements using the formula below:
DW is dry weight, and NL is notochord length. Condition factor gives a general measure of larval quality and generally as larvae grow, their condition factor increases (Westernhagen and Rosenthal, 1981). Lower condition has also been linked to lower tissue quality under ocean acidification conditions (Frommel et al., 2012). We note that condition factor is usually calculated using wet weight so values of condition in this study may not be directly comparable to other studies. However, condition factor based on dry weight is still a suitable measure for comparing development across experimental treatments within a single study. Moreover, dry weight may provide a more accurate measure of tissue biomass than wet weight.
Feeding rate for individual larvae was measured by placing a single larva in a 450 mL container of its corresponding seawater treatment dosed with 100 Artemia nauplii. Measurements of individual feeding rate took place between 09:00 and 13:00 and were completed before groups of fish received their regular, daily feedings. The order in which individuals were tested was randomized for both the treatments and families. The temperature was held at 16 (SD: ± 1.1 ˚C) using a water bath and the larvae remained in the containers for 2 hours. After 2 hours, the larvae were removed and the concentration of remaining Artemia nauplii was measured. To estimate the number of nauplii introduced to each container, 4 samples, each of 200 µL in volume were taken from a well-mixed stock solution to determine concentration. The volume of stock solution that corresponded to 100 nauplii was then pipetted into each container. At the end of the experiment, larvae were removed, the containers were mixed, and 6 samples, each of 4 mL volume were taken to estimate the remaining concentration of nauplii. Once the final nauplii concentration was calculated, it was multiplied by the total volume of the seawater (average = 361 mL) to estimate the total number of remaining nauplii. The difference in the estimated nauplii added (100) and remaining nauplii was then divided by the duration of the feeding experiments to calculate the hourly feeding rate.
To evaluate metabolic rate, we measured respiration rates of individual larvae. Oxygen consumption (VO2) was measured in a microplate reader system which uses optical fluorescence to measure dissolved oxygen (DO) concentrations in water (Loligo, Denmark and PreSens, Germany). Larvae were starved for at least 18 hours before measuring metabolic rate, which allows for the individuals to reach a post-absorptive state even under acidified conditions (Siegfried and Johnson, 2023). Individual larvae were placed in wells of a 24 well plate which were filled with the appropriate seawater treatment (ambient or high pCO2). Larvae were allowed to acclimate for 5 minutes before the system was closed and DO concentration was measured every 30 seconds for 20 minutes. Because this is a closed system, the change in DO over time can be used to measure VO2. In each run, 5 larvae from each treatment as well as 4 blanks were included. The blanks were seawater-only treatments that were used to correct for background respiration. In our study, oxygen saturation at the end of each trial was on average 85% (SD: 5.78%). Metabolic measurements were made between the hours of 10:00 and 15:30, and because only 24 chambers could be measured at a time, the order in which fish from the different experimental treatments and families were measured was always randomized. VO2 was calculated using the function VO2=V(S-B), where S is the slope describing the change in O2 concentration over time for individual chambers and calculated by a linear model (average R2: 0.9248, SD: 0.1020), B is the average change in O2 concentration over time for chambers with no fish, and V is the total volume of water contained in each chamber (1.500 mL). Grunion larvae tested in this study were between 6.44 and 11.72 mm long, but they are also thin. The volume of grunion larvae was on average less than 0.0015 mL, and thus the displacement volume is negligible and was not included in these calculations. Larvae of this length could not swim freely but larvae were able to move around somewhat in these chambers. Thus, measures of metabolic rates in this study are representative of routine metabolic rate rather than standard, resting metabolic rate (Peck and Moyano, 2016). Fish were assigned randomly to different chambers and were discarded after to avoid resampling the same individual. VO2 (mgO2 hr-1) was converted to mass specific metabolic rate (MO2, in mgO2 g-1 hr-1) using the masses obtained from the groups of individuals at the same age and from the same treatment and family which matched those used in the trial. In this experiment, it was expected that mass would change, especially with age and feeding treatments. MO2 is used to allow for comparison across animal sizes, as metabolic rate generally increases with body mass (Kleiber, 1947), and a focus on MO2 allowed us to measure the direct effects of OA on respiration rates. For example, if OA decreased growth rate, one would expect an indirect decrease in VO2 by virtue of a smaller size at the time of measurement. Any comparison of VO2 values across treatments would not be able to separate direct and indirect effects on respiration. In this case the comparison of mass-specific oxygen consumption rate allowed for a direct comparison of the effects of OA on metabolism.
Swimming behavior was measured as average speed (mm/s). Individual larvae were transferred into single cells of a 6 well plate with 7.5 mL of source water in each well. After acclimating for 20 minutes, the larvae were placed on a backlit panel inside a small box with opaque sides to remove any external visual stimuli. A camera mounted at the top of the box recorded videos for 20 minutes. Each video was then analyzed in EthoVision (Version 11.5.1026, Noldus Information Technology, February 16, 2016), video analysis software that was used to track individual larvae and calculate average speed. We recognize that routine swimming speed is generally sensitive to chamber size (e.g., Fuiman et al., 1999) and that movements were certainly restricted within our chambers. However, the smaller sizes allowed us to measure up to 24 fish at a time and the assay was useful for comparing relative activity levels of fish held under different experimental conditions.
2.6 Data analysis
All analyses were done in R Version 4.2.1. To test whether seawater chemistry parameters in the ambient and high pCO2 treatments were significantly different from each other, linear mixed effects models were run using pH, temperature and pCO2 as the responses and the intended CO2 treatment (high vs. low) as the fixed effects. In addition, the sump source as well as the temporal block were included as random effects.
For the main experiment, each of the larval response variables was analyzed across treatments using mixed effects models. Because mortality rate cannot be below 0 and was not normally distributed, a generalized linear mixed effects model with a quasi-Poisson error distribution was used. For mortality rate, fixed effects included the CO2 treatment, ration level, their interaction, and size at hatch. Size of larvae at hatch has been shown in previous experiments to have a significant effect on mortality rates (Johnson, 2022), and for this reason is included as a fixed effect for this analysis. In the mortality analysis, the size of the larvae was represented by dry mass of larvae at 0 dph. For the rest of the larval response variables, linear mixed effects models were used to estimate the size of the fixed effects of CO2 treatment and ration level and their interaction on the responses of larval fishes. Growth rates were calculated for two different periods (day 0 to day 6 and day 6 to day 12) within our experimental timeframe because of a non-linear pattern of size at age. Other responses were compared across treatments at the midpoint and endpoint measurements, including mass, notochord length, MO2, feeding rate, and average swimming speed. Our measures of average swimming speed were log transformed because of a heavy right skew in the original data. All analyses included the random effects of family identity. Experimental block was also included as a random effect for all of the analyses except for mass. Because previous studies suggested a strong, linear decline in larval size throughout the season (Johnson, 2022), hatching month was included as a fixed effect in the analyses of size to account for any seasonal variation. The generalized linear mixed effects model for mortality rate was run using the package MASS (Venables and Ripley, 2002), and the linear mixed effects models using the package lme4 (Bates et al., 2015). In all analyses, we first considered a full model that contained coefficients for the intercept (reference group was the ambient, high food treatment), CO2 treatment, ration level, and their interaction. This version of the model thus allowed for any differences in the effects of CO2 among feeding treatments (and vice versa). If the interaction term was non-significant (i.e., p > 0.05) the interaction term was dropped, and the analyses were re-run as an additive model. Additive models summarized the overall effects by averaging the CO2 effects across feeding treatments and averaging the food ration effects across CO2 treatments.
3 Results
3.1 Seawater chemistry
Ocean acidification treatments maintained significantly different pCO2 levels throughout our experiments, with the ambient treatment averaging 411.8 ± 13.6 µatm pCO2 and ocean acidification treatment averaging 1047.4 ± 44.2 µatm pCO2 (all results reported as mean ± standard error) pH also remained significantly different across treatments with the ambient treatment having on average a pH of 8.07 ± 0.003 and OA 7.72 ± 0.008. Average salinity and temperature were similar across treatments at 34.2 ± 0.03 ppt and 16.7 ± 0.04 ˚C, respectively. For additional details on seawater chemistry, see Table 1.
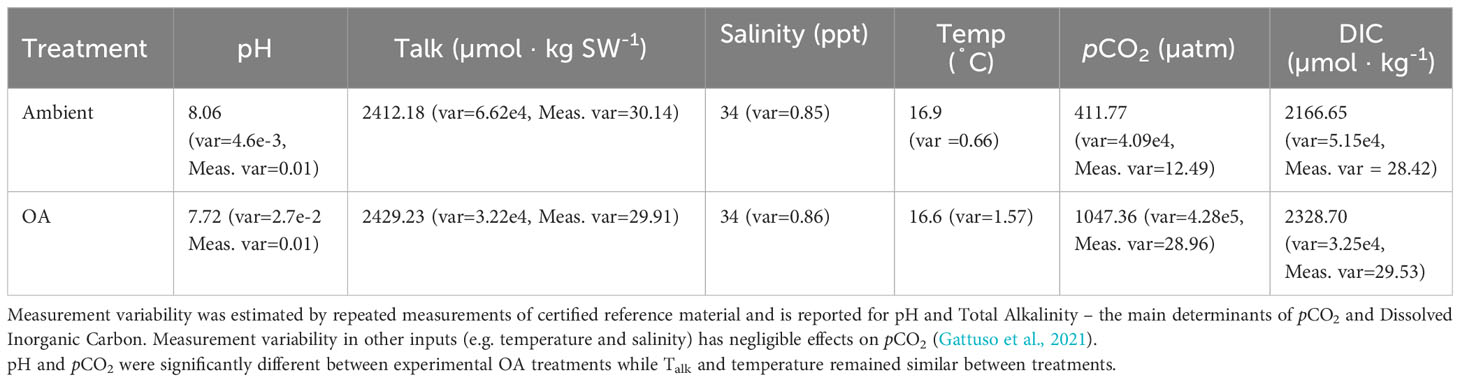
Table 1 Summary of seawater chemistry parameters across replicate experiments (means ± variance).
3.2 Responses of larvae
Larvae developing under ocean acidification conditions exhibited significant differences in processes related to energy intake and expenditure. Ocean acidification conditions reduced the feeding rates of larval grunion, and the effects were fairly consistent across ages. When considering the overall effects, high CO2 significantly decreased the feeding rate of fish larvae at 7 dph and 11 dph (7 dph: p=0.0249, n=175 individuals from 44 families; 11 dph: p<0.0001, n=173 individuals from 44 families; Figure 1; Supplementary Table 1). An average decrease with high CO2 was also observed at 3 dph, but not significantly so. A near significant interaction term on day 7 suggests that the reduction in feeding with CO2 may have been less intense under low ration conditions on day 7, but because the responses were similar for the same types of feeding trials on days 3 and 11 and because there was marginal statistical support for an interaction on only one of the three days tested (3 dph: p=0.4182; 7 dph: p=0.0775; 11 dph: p=0.2921), we dropped the interaction from all of the models and concentrated on the main effects (i.e., the effects of CO2 averaged across feeding treatments). Fish that were raised on a low ration treatment did not have significant differences in feeding rate in these single feeding trials (Supplementary Table 1). Larvae raised under ocean acidification ate on average at a much slower rate at both 7 dph and 11 dph (7 dph: 1.448 ± 2.531 nauplii/hr; 11 dph: 3.163 ± 1.979 nauplii/hr) than those raised under ambient conditions (7 dph: 8.179 ± 2.382 nauplii/hr; 11 dph: 16.352 ± 2.464 nauplii/hr).
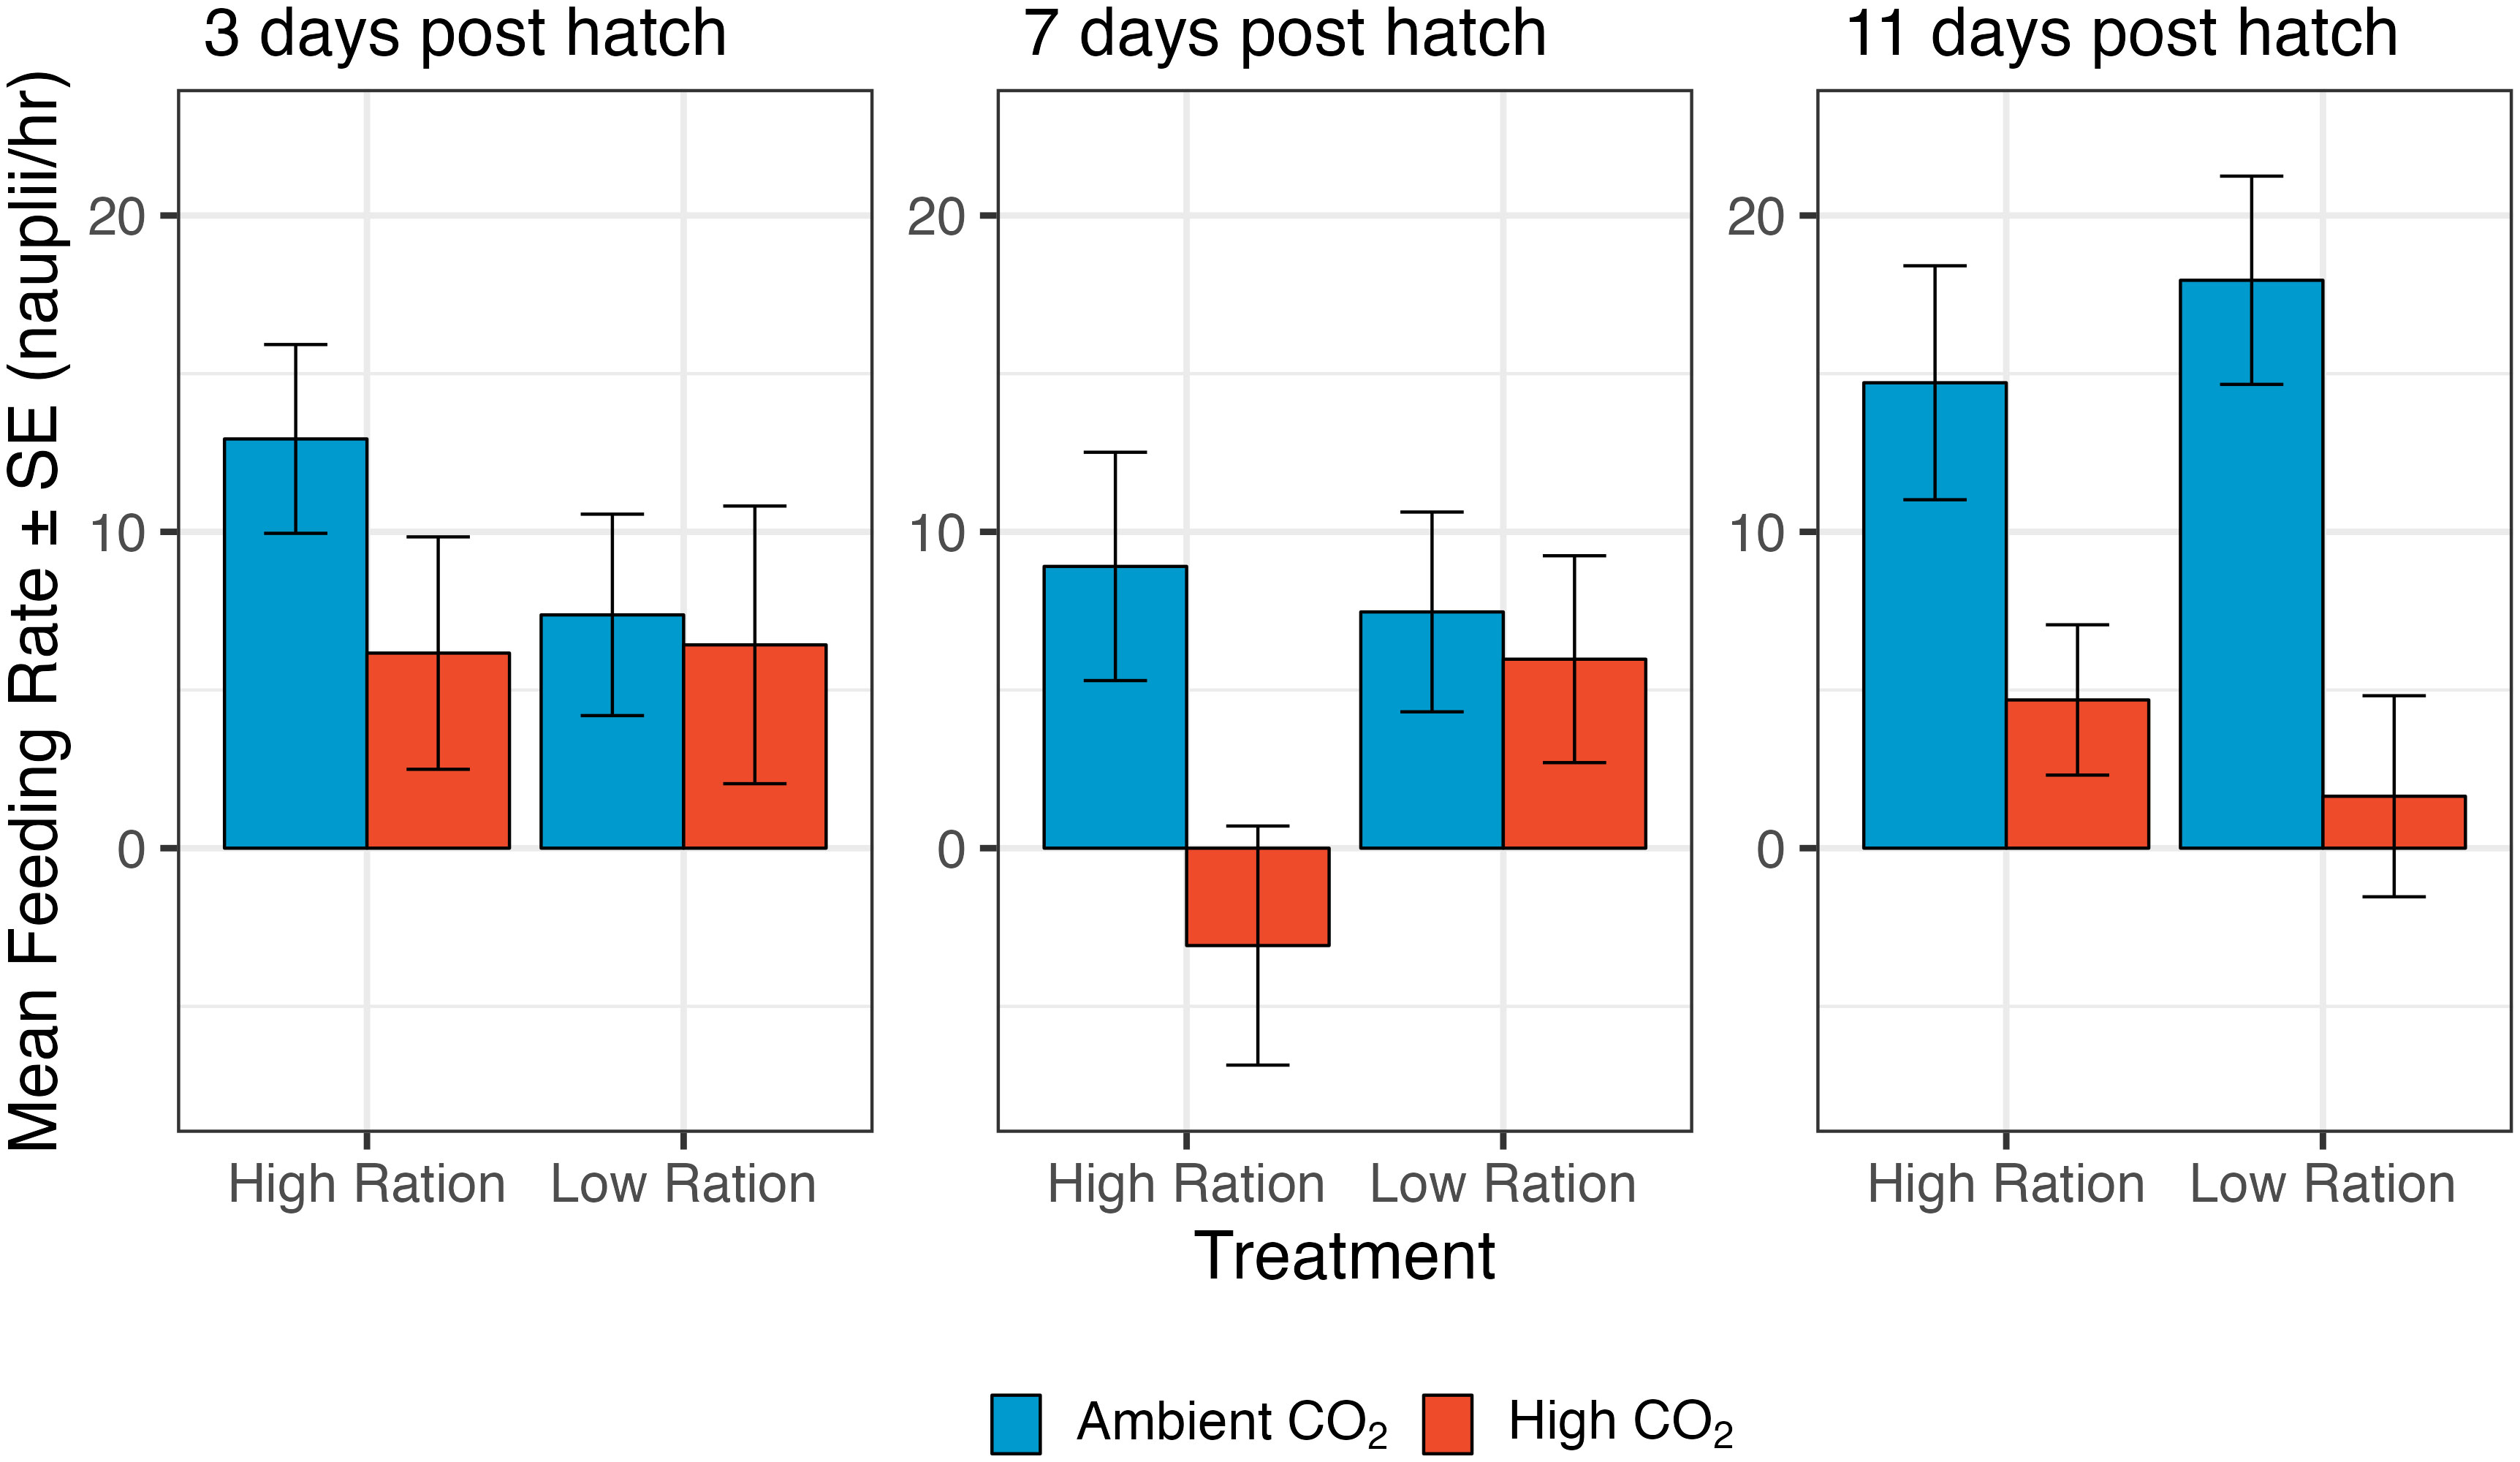
Figure 1 The effect of pCO2 and ration level on the feeding rate of larval California Grunion at 3, 7 and 11 days post hatch. The low ration treatment was fed 80 Artemia spp. nauplii individual-1 day-1 and 160 nauplii individual-1 day-1 for the high ration treatment. Red bars represent the high pCO2 treatment (~1040 µatm) while the blue bars represent the ambient treatment (~410 µatm). On day 3, sample size was 152 individuals from 38 families, on day 7, 175 individuals from 44 families and on day 12, 173 individuals from 44 families. Feeding rate was estimated by counting nauplii in subsamples of seawater at the beginning and end of the experiments. Our estimates thus include some sampling variability and negative estimates are possible when true feeding values are near zero.
Mass-specific metabolic rate (MO2) was increased slightly, but somewhat inconsistently by CO2 (Figure 2). On day 6, MO2 increased with high CO2 but the effect was not significant (p=0.4594). The interactive effects of pCO2 and food ration were non-significant (p=0.3956; n=948 individuals from 50 families), so the interaction term was dropped from the models. By day 12, the effects of CO2 were stronger, and the overall effect of CO2 was significant (Supplementary Table 2; p=0.0107; n=992 individuals from 50 families), even though this appeared to be driven largely by a strong response in the high ration treatment (interaction p=0.0556). At both time points in this experiment, MO2 was highest in the acidified, high ration treatment (6 dph: 126.002 ± 4.534 mgO2 g-1 hr-1; 12 dph: 135.262 ± 3.812 mgO2 g-1 hr-1) and the treatment with the lowest values differed between the time points. At 6 dph, MO2 was lowest in the ambient, low ration treatment (122.254 ± 4.604 mgO2 g-1 hr-1) while at 12 dph, MO2 was lowest in the ambient, high ration treatment (121.908 ± 4.945 mgO2 g-1 hr-1).
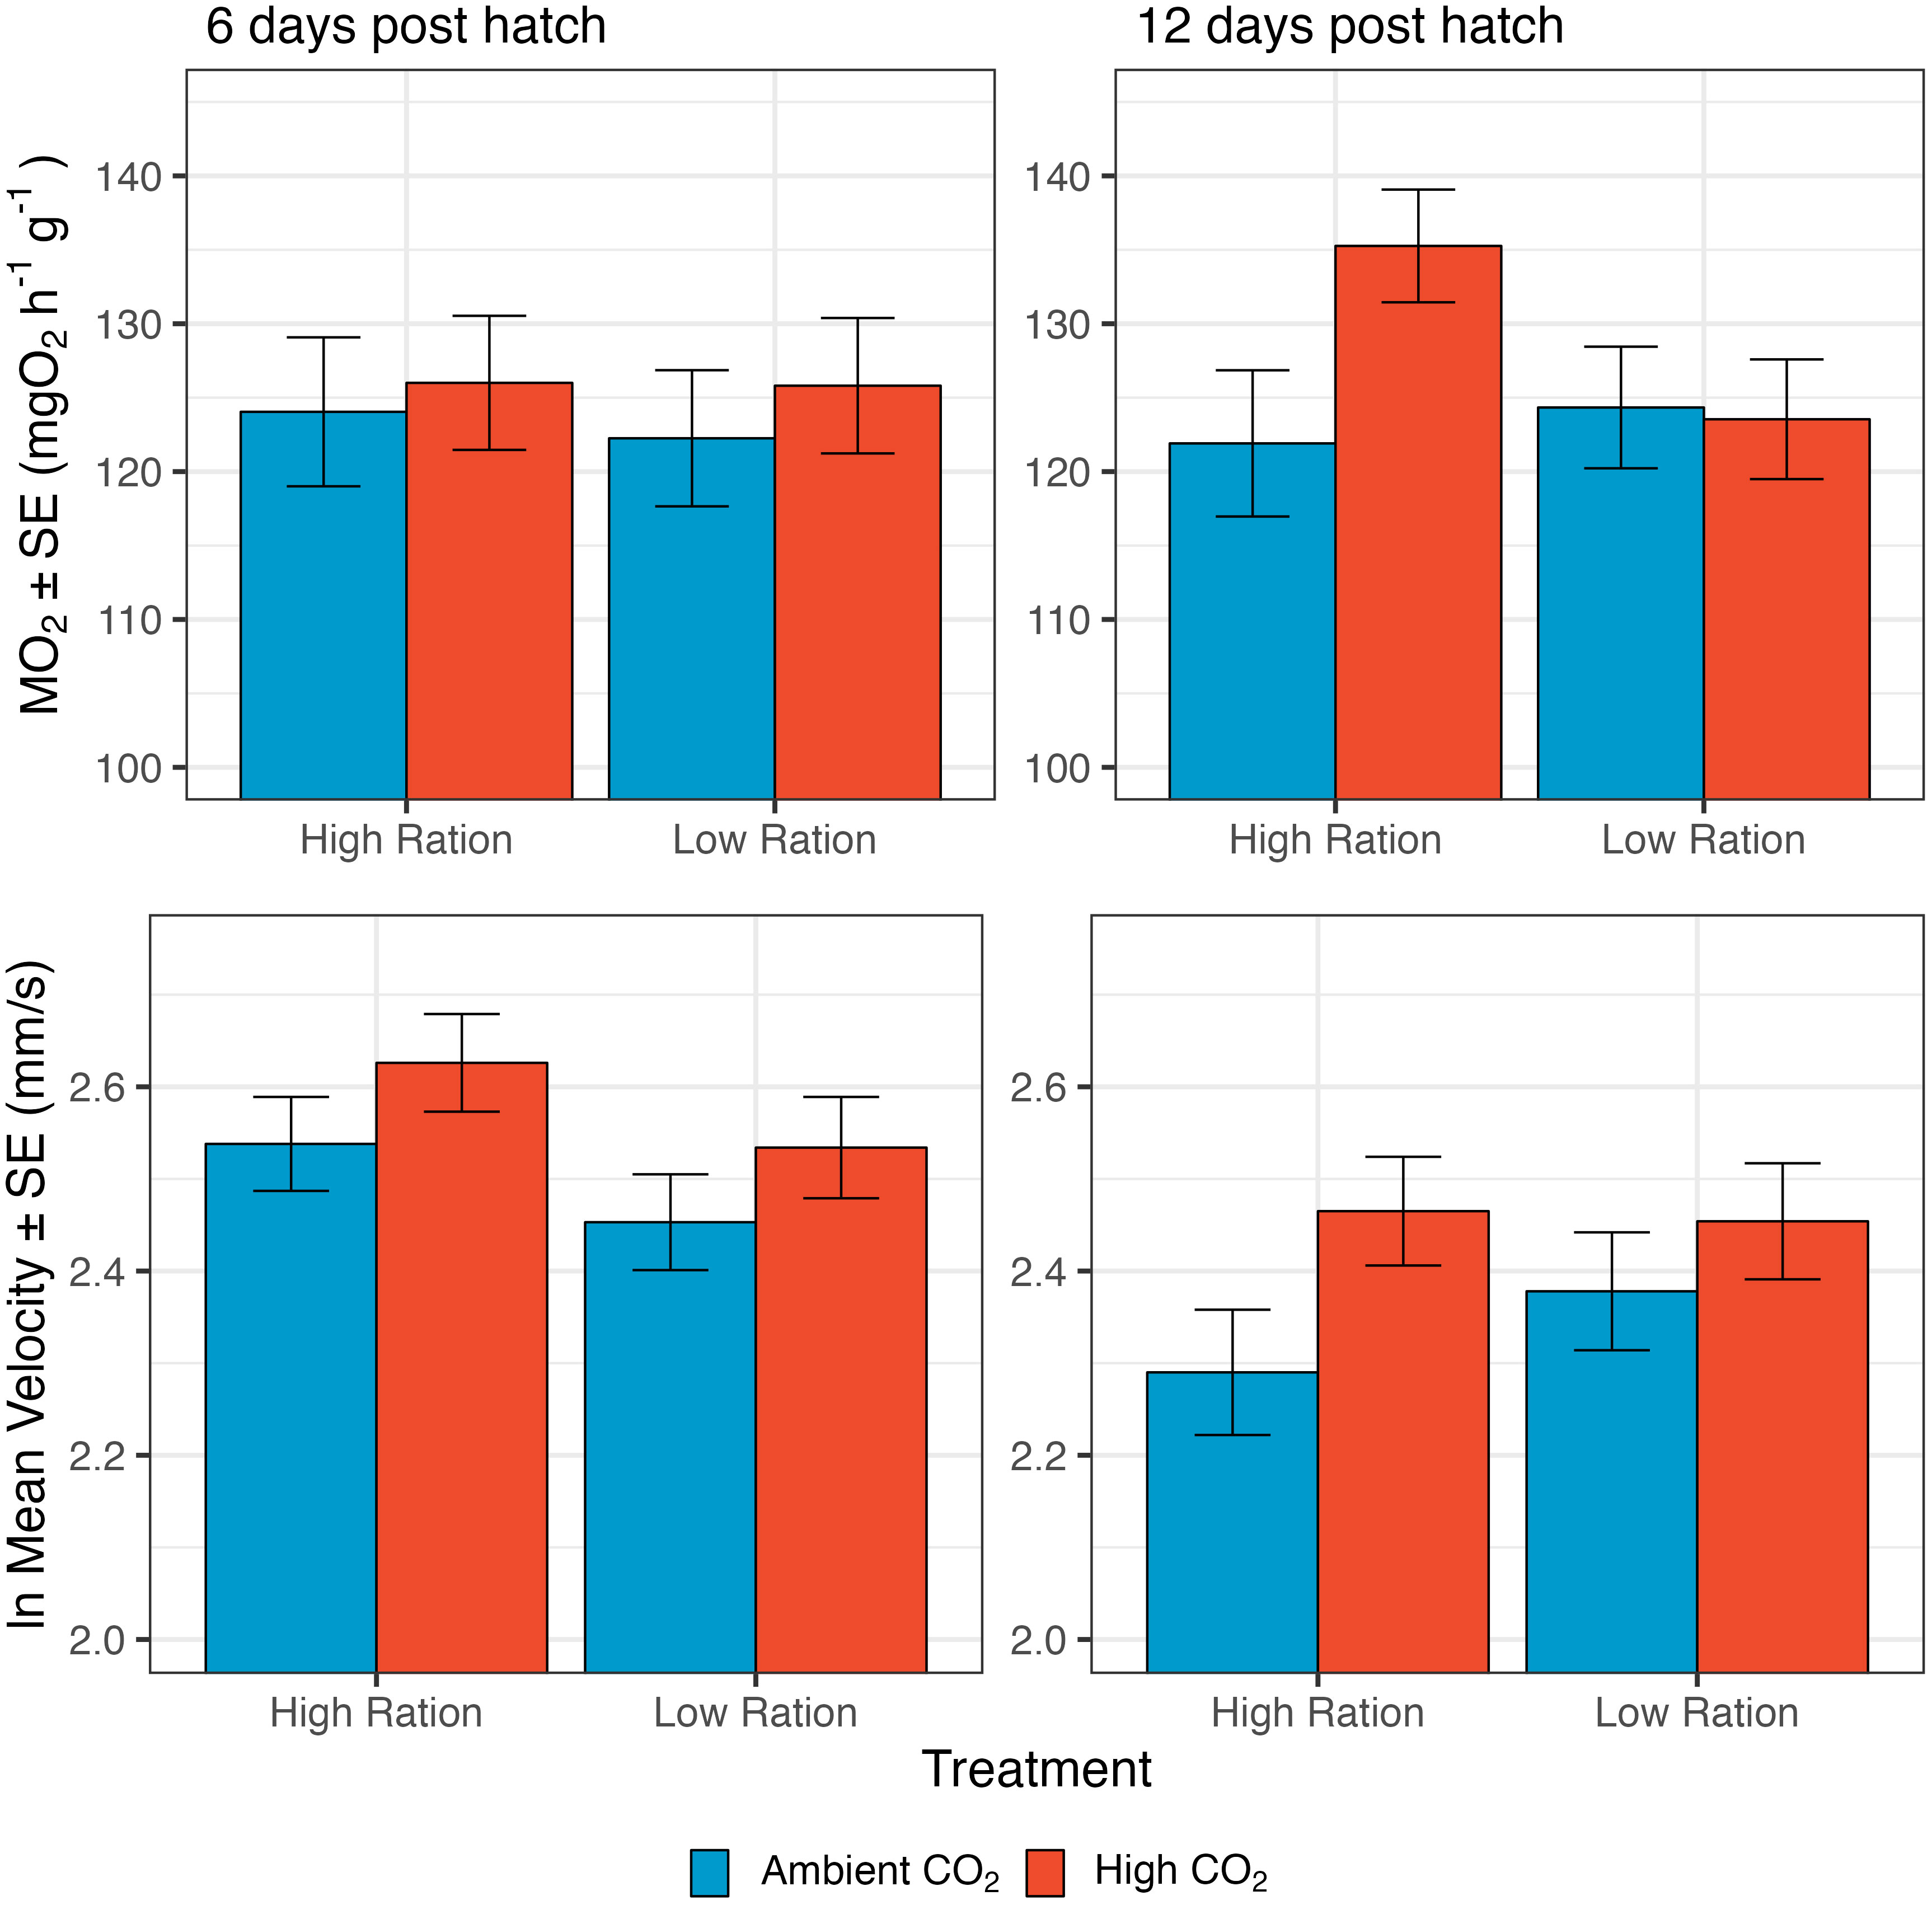
Figure 2 The effect of pCO2 and ration level on both the mass-specific metabolic rate (MO2) and average swimming speed of larval California Grunion. These data are presented together because both processes relate to energy expenditure. For MO2, the day 6 sample size was 948 individuals from 50 families and the day 12 sample was 992 individuals from 50 families. For swimming speed, the day 6 sample size was 906 individuals from 38 families and the day 12 sample was 870 individuals from 39 families.
Elevated CO2 also had an effect on routine swimming speed of larvae (Figure 2, bottom row). The interaction term was not significant at both 6 dph (p=0.6740) and 12 dph (p=0.7290) and was removed from the models. At 6 dph, average swimming speed was moderately reduced by low ration (p=0.0572, n=906 individuals from 38 families; Figure 2; Supplementary Table 3) and average swimming speed was significantly increased by high pCO2 at both 6 and 12 dph (6dph: p=0.0500; 12 dph: p=0.0260, n=870 individuals from 39 families; Figure 2; Supplementary Table 3). At 6 dph, the lowest swimming speed was in the ambient, low ration treatment (17.119 ± 1.354 mm/s), while at; 12 dph, the lowest swimming speed was in the ambient, high ration treatment (14.847 ± 1.230 mm/s). The highest swimming speed was in the acidified, high ration treatment at 6 dph (19.742 ± 1.456 mm/s) and the acidified, low ration treatment at 12 dph (17.500 ± 1.336 mm/s; note that Figure 2 summaries the ln transformed data). Figure 2 expresses swimming speed in mm per second, but when speed was expressed in terms of body lengths per second, an overall increase in swimming speed with CO2 was still apparent (Supplementary Figure 1; Supplementary Table 4).
Dry mass of the larvae was compared across treatments at the midpoint and the endpoint of the experiments. Mass was smaller for fish given low rations, but mass was largely unaffected by CO2 (Figure 3, top row). There was no significant effect of the interaction between high pCO2 and low ration on the dry mass of larvae on either 6 dph (p=0.7945) or 12 dph (p=0.4160), so the interaction term was dropped from the from the models to focus on the overall effects of pCO2 and feeding ration. Dry mass on both days 6 and 12 decreased with hatch month, though these effects were more pronounced for 12d old larvae (p<0.0001, n=247 groups from 60 families; Supplementary Table 5). In addition to seasonal effects, average dry mass was smaller for larvae in the low-ration treatment (6 dph: p=0.0005, n=246 groups from 60 families; 12 dph: p<0.0001; Figure 4; Supplementary Table 5). Average values of dry mass were lower for the high CO2 treatments at day 12, but the effects were not significant (12 dph: p=0.1836, high pCO2: 0.566 ± 0.013 mg, ambient: 0.581 ± 0.016 mg). On day 6, dry mass was lowest in the acidified, low ration treatment (0.393 ± 0.015 mg) and highest in the ambient, high ration treatment (0.424 ± 0.020 mg). This pattern was mirrored on day 12 (Acidified, Low Ration: 0.548 ± 0.019 mg; Ambient, High Ration: 0.608 ± 0.024 mg). Results were similar when the focus was on growth rate, rather than size at age. The rate of biomass growth decreased significantly with low ration during both time periods, but the effects were more pronounced from day 0 to day 6 (0 – 6 dph: p=0.0015; Supplementary Table 6; Supplementary Figure 2). Growth was not significantly affected by high CO2. Across both time periods, the interaction term was not significant (0 – 6 dph: p=0.7212; 6 – 12 dph: p=0.5424), so it was removed from the models.
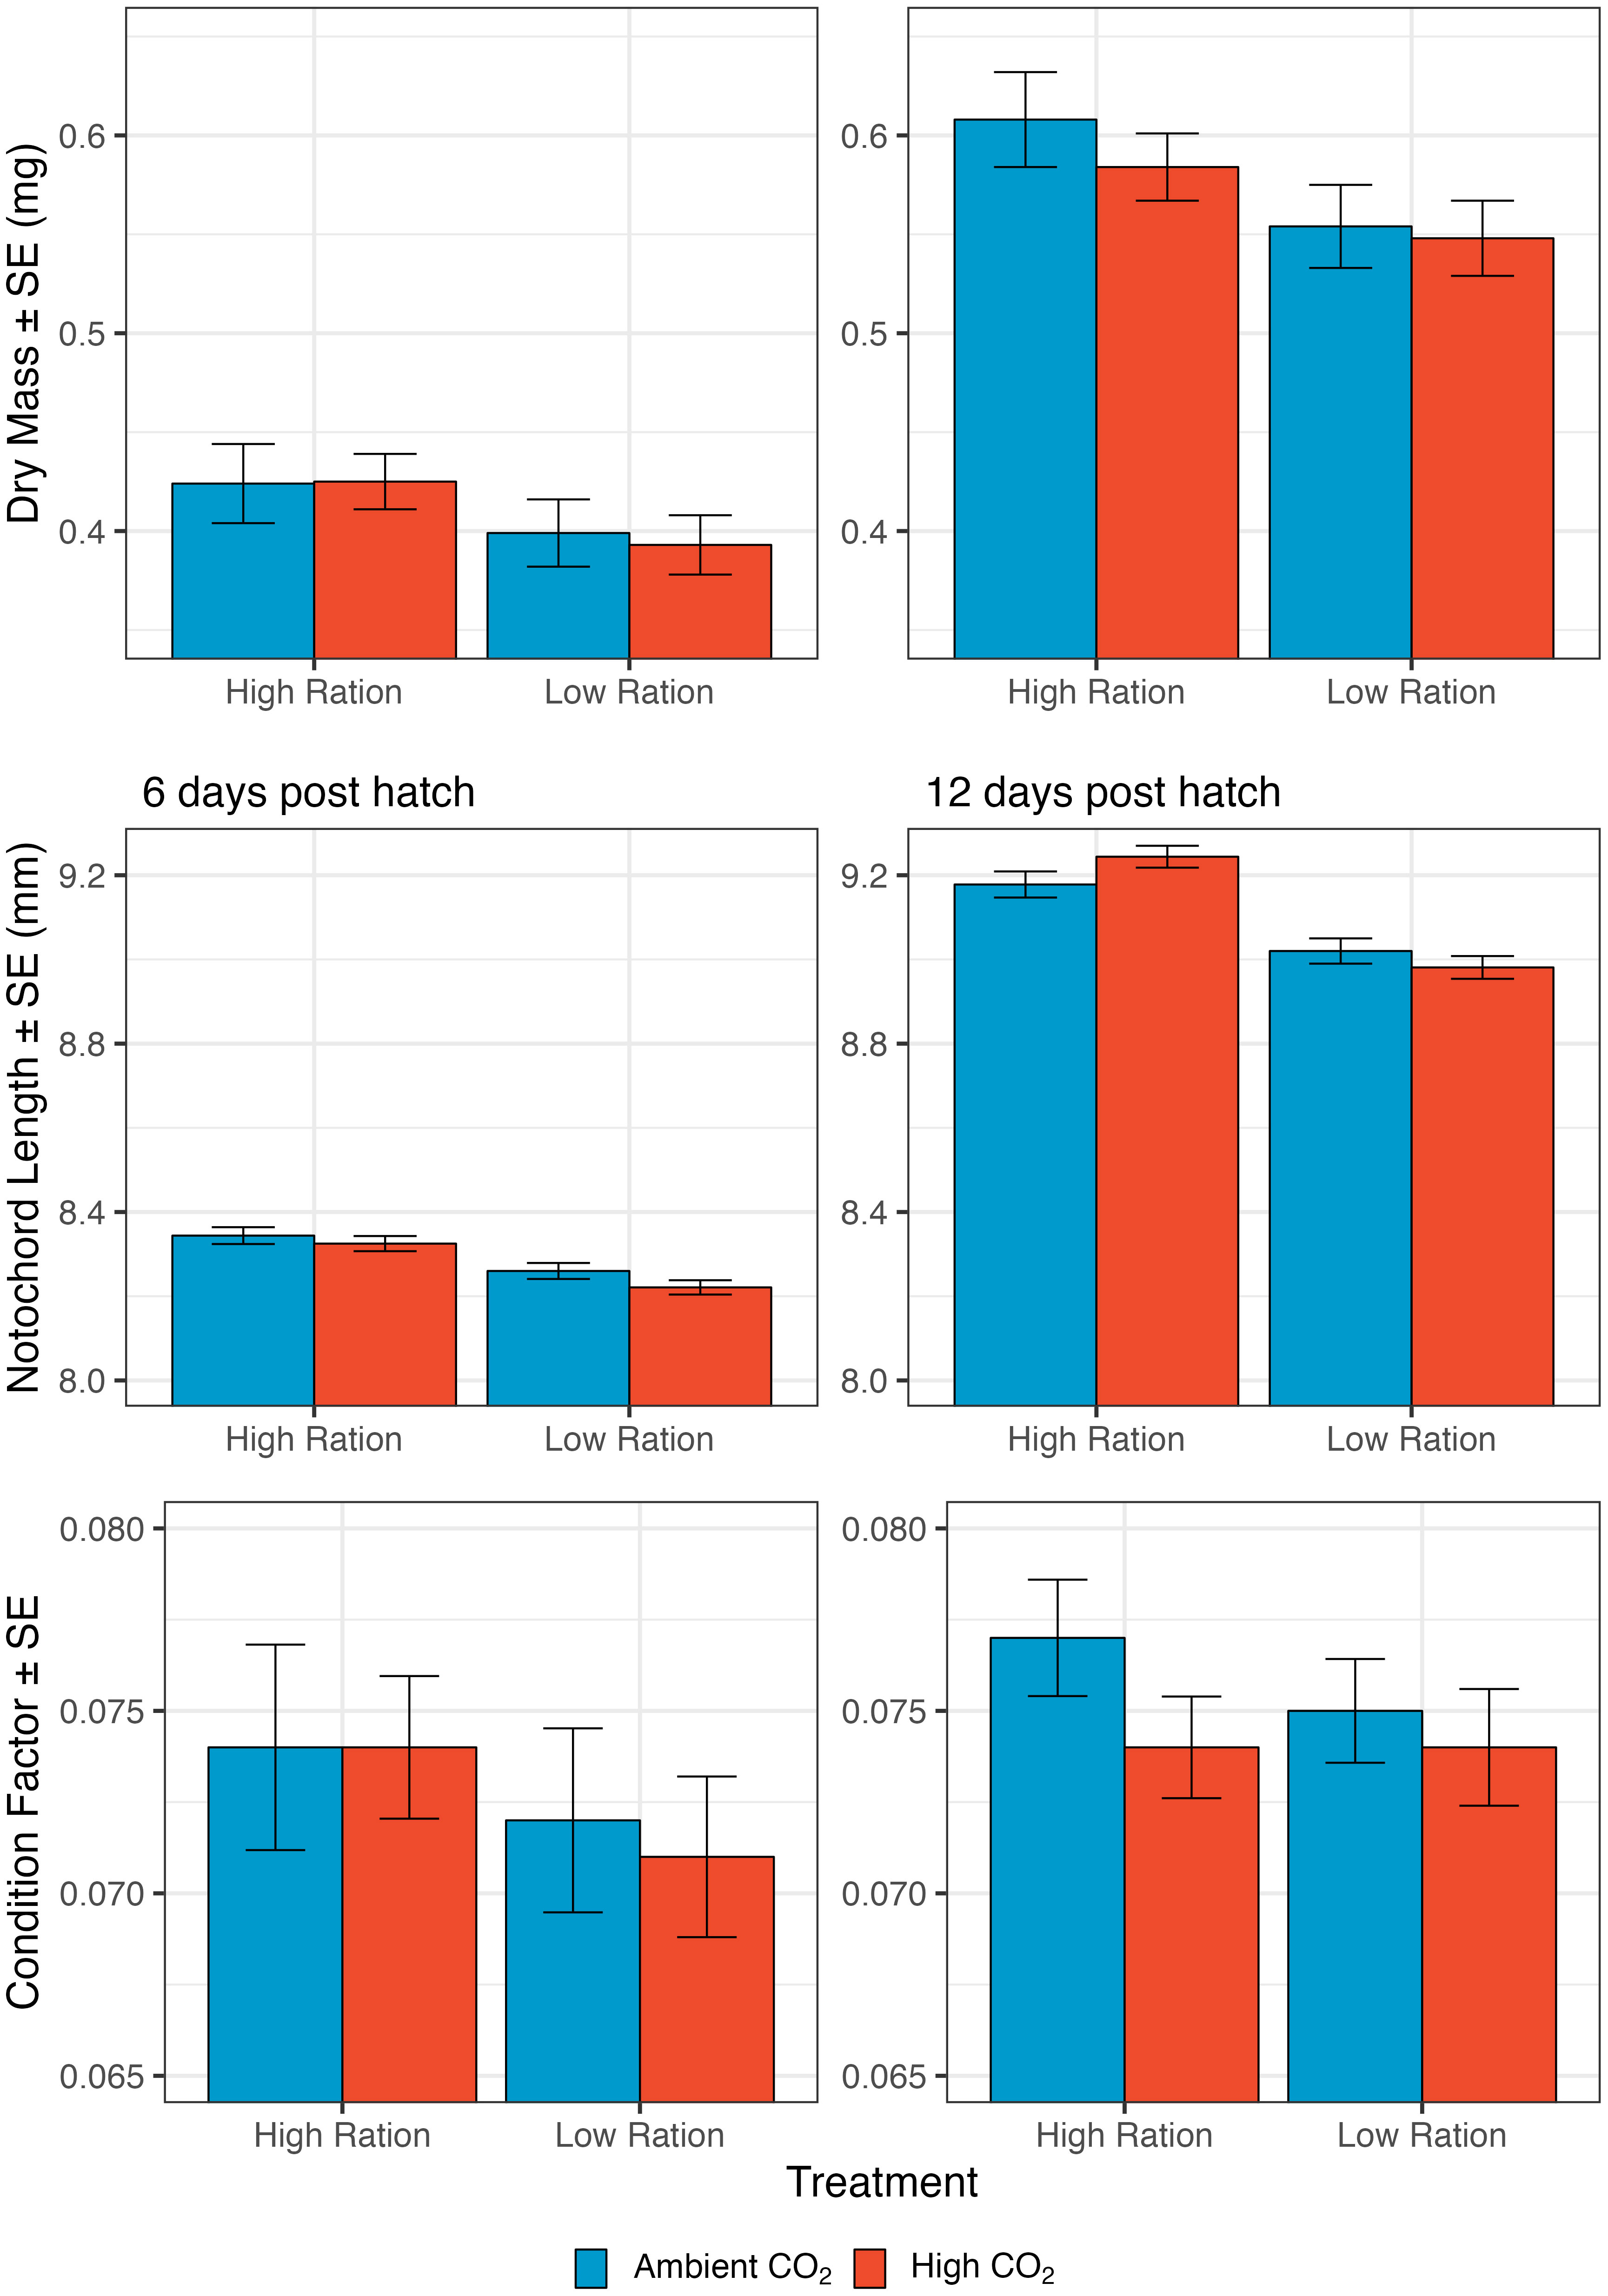
Figure 3 The effect of pCO2 and ration level on size-related metrics for larval California Grunion. Top row illustrates variation in dry mass. On day 6, sample size was 216 groups from 66 families and on day 12, 268 groups from 66 families. Dry mass was measured for groups of 10 larvae but is expressed per individual. Middle row illustrates variation in notochord length. On day 6, sample size was 2225 individuals from 56 families and on day 12, 2177 individuals from 56 families. Bottom row illustrates variation in condition factor (the ratio of mass to length3). Sample sizes are same as those for mass.
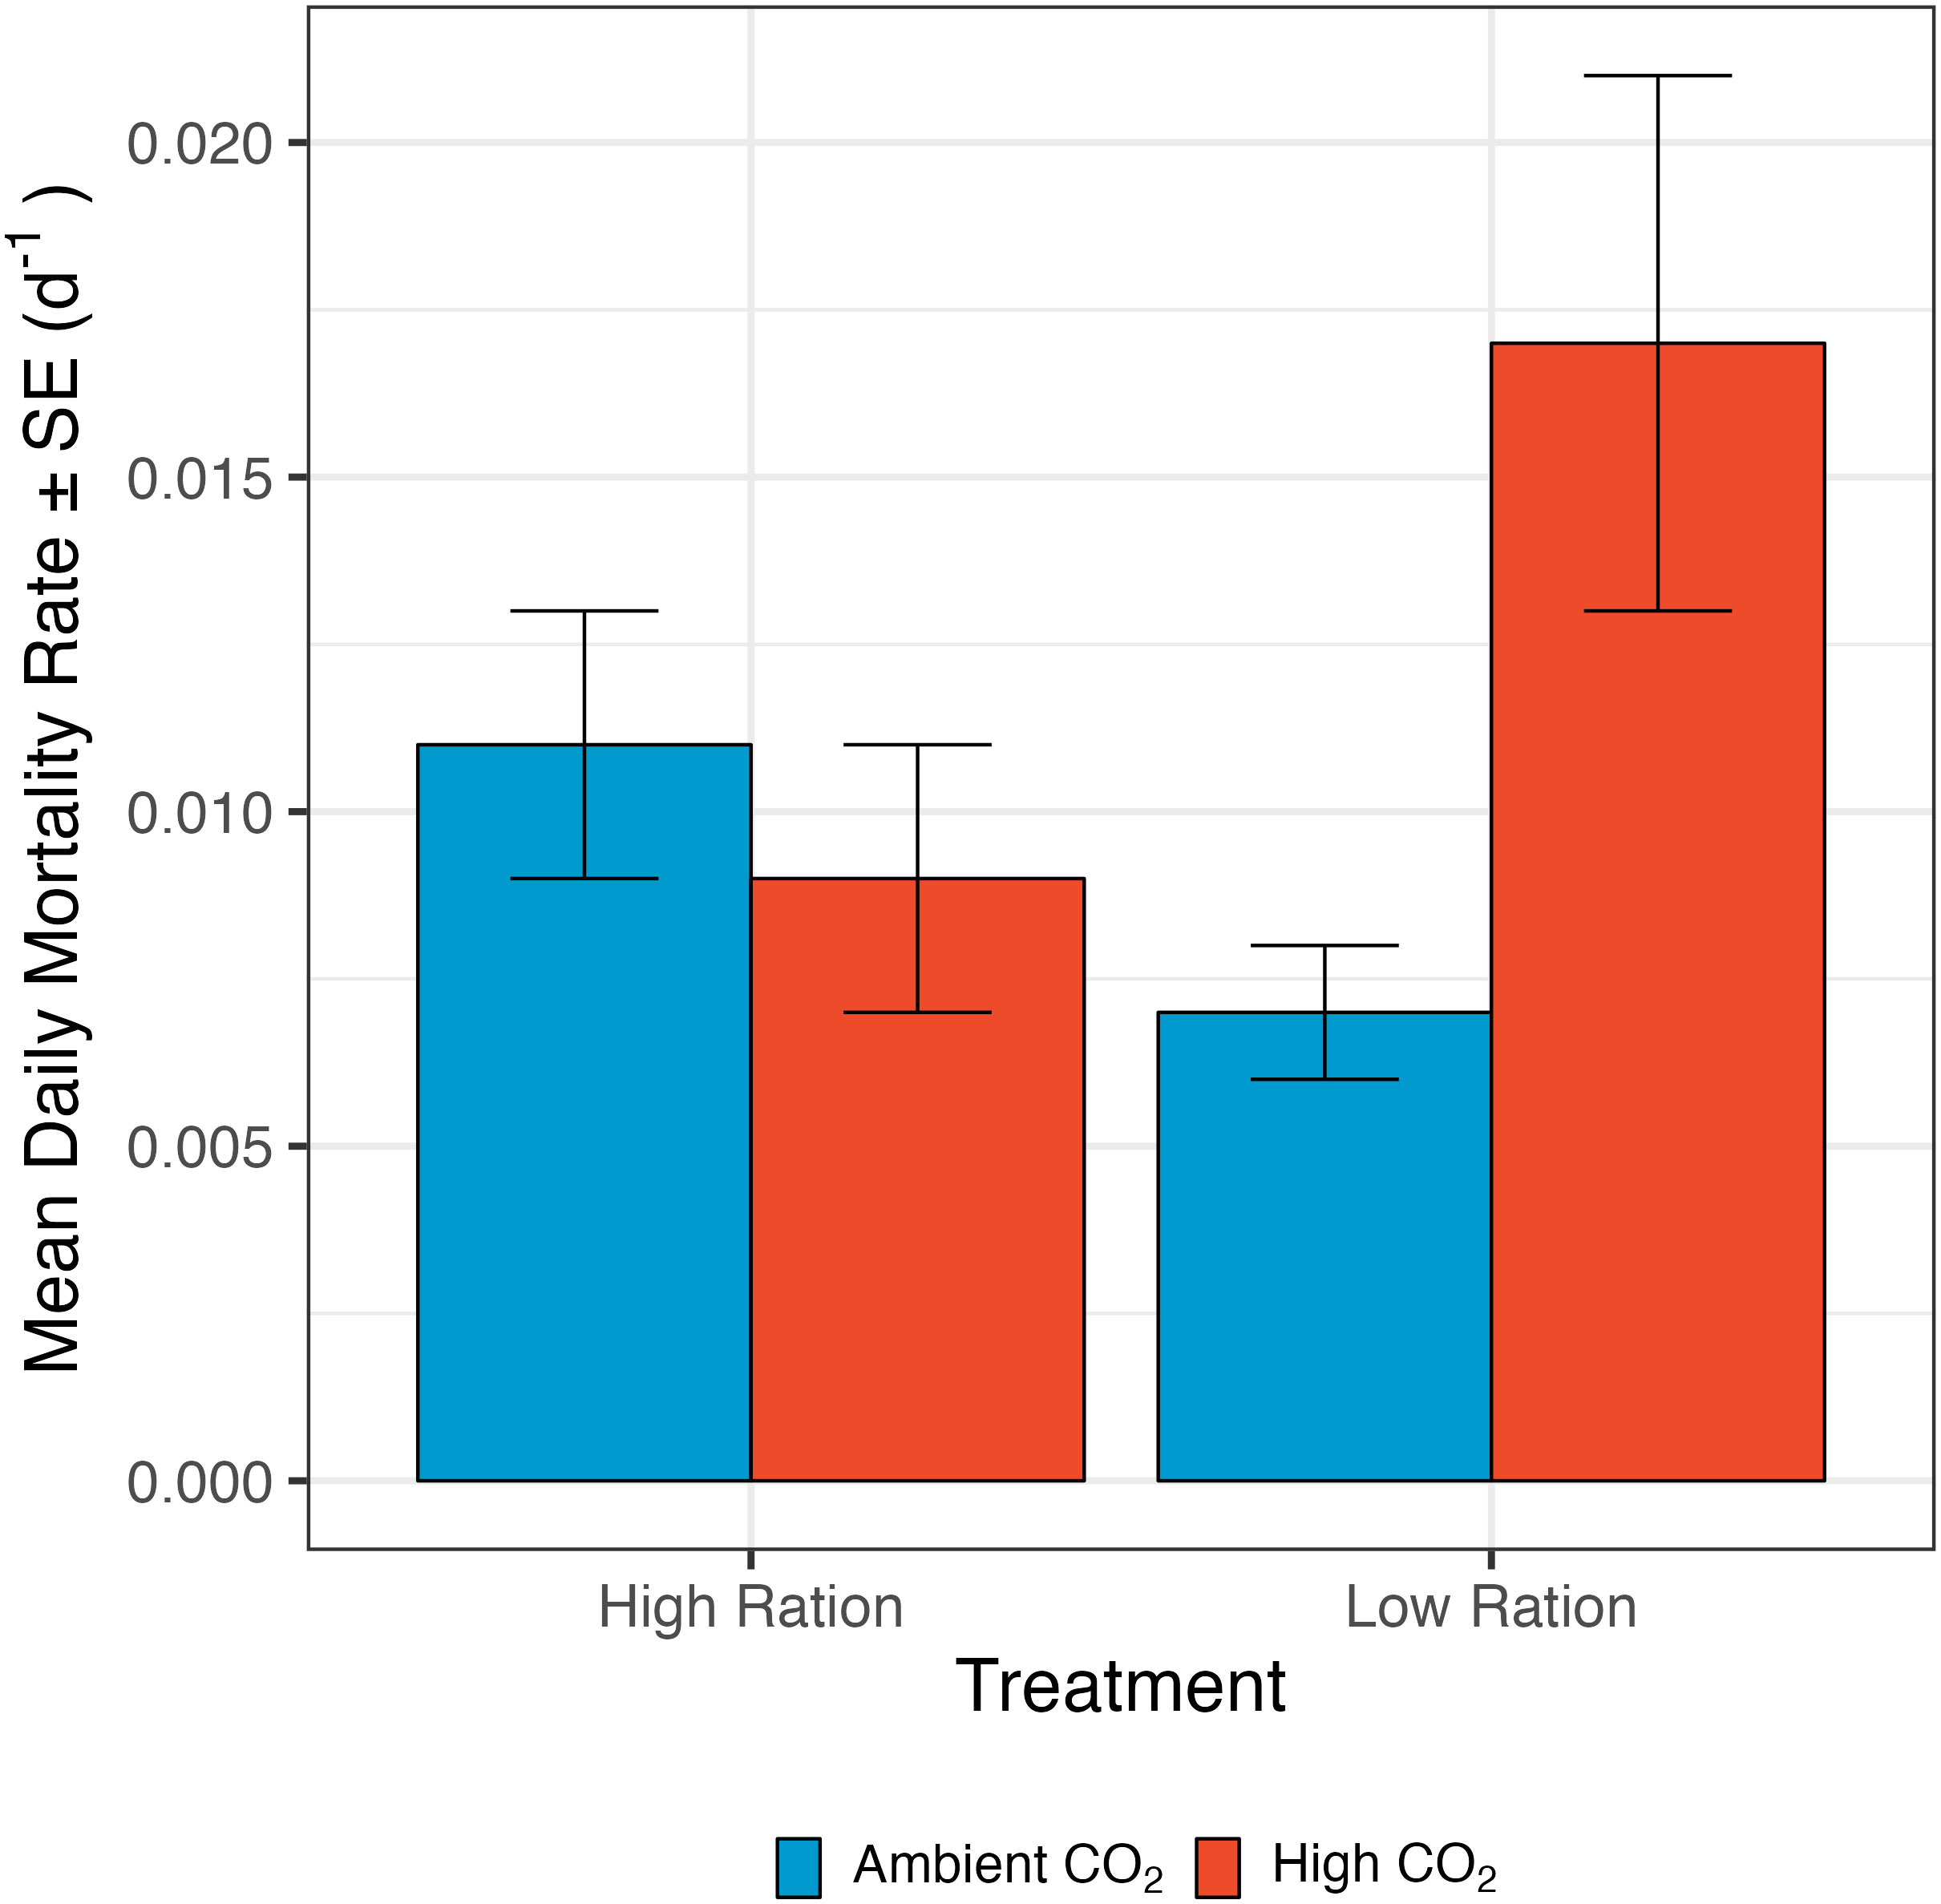
Figure 4 The effect of pCO2 and ration level on the mortality rate of California Grunion larvae from ages 0 to 12 days post hatching. The low ration treatment was fed 80 Artemia spp. nauplii individual-1 day-1 and the high ration treatment was fed 160 nauplii individual-1 day-1. Red bars represent the high pCO2 treatment (~1040 µatm) while the blue bars represent the ambient treatment (~410 µatm). n = 58 family groups per treatment combination (232 total).
Additionally, notochord length was compared across treatments at the midpoint and end point of the experiments (Figure 3, middle row). At both points, there was not a significant interaction between elevated pCO2 and ration level (6 dph: p=0.2348; 12 dph: p=0.0840), so the interaction was dropped from the model. Considering the main effects, low ration significantly decreased notochord length on both 6 dph and 12 dph (6 dph: p<0.0001; 12 dph: p<0.0001 (Figure 3, middle row); Supplementary Table 7 and elevated pCO2 significantly decreased notochord length at 6 dph (p=0.0102), but increased notochord length by 12 dph (p=0.0058). The marginal p-value for the interaction term for notochord length on day 12 suggests that CO2 may have increased notochord length mainly when fish were given a high ration. Notochord length decreased significantly with hatch month for both 6d and 12d old larvae (6dph: p<0.0001, n=2225 individuals from 56 families; 12 dph: p<0.0001, n=2177 individuals from 56 families; Supplementary Table 7). The average notochord length on day 12 was smallest in the high pCO2, low ration treatment (8.981 ± 0.027 mm), a pattern which was mirrored in the day 6 data (8.221 ± 0.017 mm). On day 12, the notochord length was highest in the high CO2, high ration treatment (9.244 ± 0.026 mm), but on day 6, notochord length was highest in the ambient, high ration treatment (8.344 ± 0.020 mm). The rate of growth in length was not significantly affected by the interaction between high pCO2 and low ration either from 0 – 6 dph (p=0.2185) or from 6 – 12 dph (p=0.4070), and so the interaction terms were removed from the models (Supplementary Table 8). The rate of growth in length was significantly decreased from 0 dph to 6 dph and 6 dph to 12 dph by low ration (0 – 6 dph: p= 0.0002; 6 – 12 dph: p=0.0382; Supplementary Table 8; Supplementary Figure 2), but significantly increased from 6 dph to 12 dph by high pCO2 (p=0.0308).
The condition of larvae also exhibited significant differences among the experimental treatments (Figure 3, bottom row). Condition factor increased significantly with hatch month for 6d old larvae (6 dph: p=0.0240; Supplementary Table 9), but not for 12d old larvae. Day 6 mass and notochord length both decreased with hatch date and because condition factor is a ratio of mass to length cubed, these results suggest that day 6 mass was less sensitive to seasonal effects than length was. At 6 dph condition was significantly lower in the low ration treatments (p=0.0082), but unaffected by high pCO2 (p=0.315; Supplementary Table 9), and there was no significant interaction between ration and CO2 treatments (p=0.8779). By day 12, condition factor decreased significantly with both high pCO2 and low ration (p-values<0.0001), and the interaction term indicated that the decrease with high pCO2 conditions was significantly greater in magnitude when larvae were fed higher rations (Supplementary Table 9). Condition factor at 12 dph was highest in the ambient, high ration treatment (0.077 ± 0.002 mg mm-3) and lowest in both the high pCO2 low and high ration treatments (high ration: 0.074 ± 0.001 mg mm-3, low ration: 0.074 ± 0.002 mg mm-3).
Our results revealed a synergistic effect of ocean acidification and food availability on mortality of grunion larvae. Mortality rate was significantly increased by pCO2 only when the larvae were raised under the low ration condition (interaction term: p=0.0048, n=231 groups from 58 families; Figure 4; Supplementary Table 10). In addition to this effect, mortality rate was decreased slightly by higher initial larval size, but not significantly so in this analysis (Supplementary Table 10). The larvae that were fed the low ration and raised under high pCO2 conditions had a higher mortality rate (0.01 ± 0.002 d-1) than those raised under ambient conditions (high ration: 0.008 ± 0.002 d-1, low ration: 0.006 ± 0.001 d-1) or with a high ration under high pCO2 conditions (0.006 ± 0.001 d-1).
4 Discussion
An important result of this study is that the effects of ocean acidification conditions on larval mortality may depend on food availability. Mortality rates were significantly elevated with pCO2 when fish were fed a low ration treatment, but fish given a high ration could withstand high levels of CO2 (~1040 µatm). This context dependence may help explain some of the variance in responses to pCO2 observed among species and studies, as feeding rates have not always been tightly regulated in studies of ocean acidification, and it is rare to standardize feeding rates across studies (e.g., see Kroeker et al., 2010; Kroeker et al., 2013; Cattano et al., 2018 for summaries of variation in species’ responses). In addition, the interactive effects of food availability and CO2 suggest that responses to ocean acidification conditions may be moderated by energy levels or critical nutrients.
A major focus of this study was to examine some physiological and behavioral processes as intermediate mechanisms that may mediate the relationship between elevated pCO2 as the stimulus and larval mortality as the fitness-related response. Our results suggest that increased CO2 can alter feeding success, routine activity, and respiration rates in ways that are both consistent with previous ocean acidification research, and indicative of energy limitation as a force that can govern a species’ response to ocean acidification conditions. We discuss each of these processes below, beginning with those that affect energy acquisition and ending with those that affect energy expenditure.
This study found strong evidence that high pCO2 can interfere with feeding rates of larval fish. Although responses were somewhat variable on day 7, there was an overall decrease in feeding with CO2 at all three ages tested, and by day 12 fish from the high CO2 treatment had much lower feeding success. To date, few studies have investigated this response, but our results are consistent with a decrease in feeding rate seen in juvenile sea bass (Dicentrarchus labrax) under OA conditions (Cominassi et al., 2020), and with previous experiments examining effects of OA on feeding rates of groups of grunion larvae in larger arenas (Siegfried and Johnson, 2023). Although the current study focused on short-term feeding rates, it is worth noting that the effects of CO2 were large, and feeding rates under elevated pCO2 levels were only 25-40% of feeding rates under ambient pCO2 conditions, on average. We do not know the proximate mechanism that led to reduced feeding success in our study. In general, feeding success involves several steps including the encounter, capture, and handling and digestion of prey. Given the increased swimming activity observed under high CO2, we do not expect that encounter rates were somehow lower in the high CO2 treatments. Instead, we suspect that OA conditions interfere with either prey capture, or the handling and digestion of prey, and encourage more research in this area. The decrease in feeding rate under OA conditions may affect feeding opportunities in natural systems and may have corresponding effects on energy budgets. Generally speaking, plankton in natural systems are patchy (Mackas et al., 1985; Owen, 1989), and encounters between larval fish and groups of their planktonic prey may be brief. If larvae are unable to take full advantage of feeding opportunities they do encounter, then they will obtain less energy. With less food intake, there will be less energy available for processes like growth and the maintenance of acid-base balance, which may be energetically demanding and is an imperative process for larvae raised under OA conditions (Esbaugh, 2018).
In addition to having lower energy intake, larvae under high pCO2 consumed more energy. High pCO2 increased mass-specific respiration rates (i.e., MO2 rates) during the experiment. This response mirrors effects seen in other species (e.g. juvenile Pomacentrus amboinensis, Couturier et al., 2013), and indicates an increase in metabolic cost associated with the stress of high pCO2. Some statistical support for an interaction between CO2 and feeding suggests that responses of metabolic rate to these variables may be more complex, and worthy of further study. Although the overall increase in MO2 with CO2 was modest (a 4-5% increase, on average), it is important to note that these costs are incurred continuously, and respiration accounts for the vast majority of daily energy expenditure (Shelley and Johnson, 2022). Interestingly, the increase in MO2 under ocean acidification conditions was mirrored by an increase in routine swimming speed. The increase in swimming speed seen in these experiments was similar to higher swimming activity levels observed in studies of juvenile spiny chromis damselfish (Acanthochromis polyacanthus) exposed to OA conditions, even though the activity changes in that study were short term (~1hr; Sundin et al., 2019). Generally, most ocean acidification studies thus far have not observed significant effects of high CO2 on a variety of swimming metrics including routine swimming activity, mean swimming speed, and critical swimming speed (Bignami et al., 2013b; Bignami et al., 2014; Maneja et al., 2015; Silva et al., 2016; Bignami et al., 2017; Sswat et al., 2018; Cominassi et al., 2019; Downie et al., 2020). It could be that the effects of ocean acidification on swimming are in general small relative to the variability among individuals, and thus difficult to detect statistically. In our study, routine swimming speeds were elevated by ~11.5% when larvae developed under high CO2 (+9% on day 6; +14% on day 12), and although there was substantial variation among individuals, we were able to measure ~900 fish from ~40 families at each age and thus had reasonably high power to detect small effects. Because grunion and other larval fish are active throughout the day (Fisher and Bellwood, 2003), even a minor increase in routine swimming speed under high CO2 conditions could amount to a substantial increase in energy consumption. Furthermore, in this study the increases in swimming activity and MO2 with CO2 may be related. MO2 and swimming speed were not measured on the same fish, but they were measured on the same families (full-sibling groups). Even though the metabolic chambers were small (1.5 ml volume), the grunion larvae could still move within these spaces. The experiments thus measured routine metabolic rate rather than standard metabolic rate. The family-wide increase in swimming activity with elevated pCO2 might be at least partially responsible for the increase in MO2 observed under high CO2 conditions. Regardless of the relative contribution of increased cellular metabolism versus increased activity, increases in energy use with increased CO2 should decrease the amount of surplus energy available, all else being equal.
The combination of reduced energy intake (via decreased feeding success) and increased energy expenditure (via higher MO2 and/or routine activity) under high CO2 conditions suggests that there should be less energy available for growth and maintenance. Moreover, any energy limitation should be exacerbated when fish are given a low ration treatment. It is perhaps surprising then that there was no significant effect of the high CO2 treatment on biomass growth. Although the mass of larvae was consistently smaller in the OA treatments, the effect sizes were small, and there are multiple phenomena that may explain the lack of a significant effect of high CO2 conditions on biomass. The first is that the low food ration may have not resulted in severe limitation of energy. Growth rate slowed with low food ration, but while food ration per larva was halved in the low ration treatment, growth from 0 to 12dph decreased by only ~16%. There is some evidence to suggest that assimilation efficiency is higher at low feeding rates for larvae of grunion and other species (Houde and Schekter, 1983; Checkley, 1984; Rendleman et al., 2018; Shelley and Johnson, 2022). As a result, even in the low ration treatment, the increased energetic demands of living in a high CO2 environment may not have exhausted the supply of surplus energy or the capacity of larvae to compensate with increased efficiency or reallocation of energy (Pan et al., 2015).
A second explanation for our results is that the energy allocated toward biomass growth was mostly preserved under OA conditions, but the energy allocated for maintenance was depleted. It is thought that energetic allocation in larval fish prioritizes growth over maintenance (see Rombough, 1994; Pedersen, 1997), in part because of the evolutionary advantage of growing quickly during early life when larvae are small and vulnerable to many predators (Houde, 1987; Sogard, 1997; Johnson et al., 2014). If the lowered energy intake and added costs of developing under high CO2 restrict energy for maintenance more than they do for growth, then the symptoms of an energy deficit may go beyond a simple reduction in biomass. Such a result seems plausible as several studies of larval fish have found no appreciable difference in biomass between ambient and OA treatments, but when examined closely, fish in the OA treatments have shown signs of abnormal development including reduced swim bladder inflation (Hurst et al., 2021), changes in otolith size (Faria et al., 2017), and tissue damage (e.g. Frommel et al., 2012; Frommel et al., 2016). The results of our study are consistent with an effect of high CO2 on maintenance energy. There was clear evidence of exposure to high CO2 resulting in both lower energy intake and greater energetic demands. In addition, fish developing under high CO2 grew more elongated relative to their body mass. These results suggest a degree of developmental abnormality, or at least a decline in body condition for fish in high CO2 seawater. Finally, mortality rates were elevated most when energy availability was limited by low food ration. Taken together, these results are consistent with the hypothesis that exposure to high CO2 may result in developmental deficiencies that can become lethal when the availability of food energy is low but can be overcome when food is relatively abundant.
This study provides more insight into the importance of investigating how multiple stressors associated with climate change can combine to affect larval fishes. Additionally, our results highlight the importance of using multiple ration levels in experiments investigating energy budgets and physiology rather than feeding larvae solely ad libitum. While this is the case, there are a few limitations to this study. California Grunion are a coastal species and thus already experience a higher average pCO2 and greater fluctuations than offshore regions (Davidson, 2015). As a result, the pCO2 levels used in our experiments are relatively conservative and lower than what might be projected for the coastal ecosystems this species inhabits (Takeshita et al., 2015). In general, responses to experimental ocean acidification will depend on the magnitude of change in pCO2. The response levels seen in this experiment may be muted and could be more extreme if tested under higher pCO2 levels (for example, see Tasoff and Johnson, 2019). In addition to this, food provided to the larvae was Artemia spp. nauplii rather than a more complex mixture of plankton the fish might encounter in situ. Artemia spp. are a common food source for larval fishes in lab experiments and were thus chosen to ensure a steady food source.
A more holistic understanding of the lethal and sub-lethal effects of climate change on larval fishes is going to be important as we continue to attempt to understand the effects of climate change on fish populations. This study found multiple effects of ocean acidification and low ration, either primarily or via an interaction, on a suite of physiological characteristics of larval California Grunion. In addition to shedding new light on how ocean acidification is likely to affect feeding, behavior, growth, and mortality, the results of this study guide our understanding of the energy budgets of marine organisms and how they respond to climate change stressors. For larval fishes, the changes in physiology and behavior that affect energy budgets under ocean acidification may have more severe consequences for homeostatic maintenance than previously thought. Our results are generally consistent with recent studies highlighting how ocean acidification conditions may disrupt development in subtle ways (Munday et al., 2011b; Frommel et al., 2012; Bignami et al., 2013a; Frommel et al., 2016; Shen et al., 2016; Faria et al., 2017; Cominassi et al., 2020; Hurst et al., 2021), and highlight the need for more studies of the physiological links that connect changes in environmental CO2 to organismal endpoints of growth and survival. In addition, having a more detailed understanding of how marine species will respond to climate change, including both ocean acidification and biotic changes such as changes in ocean productivity and food availability will continue to be an important part of understanding and predicting the effects of climate change on our future oceans.
Data availability statement
The raw data supporting the conclusions of this article will be made available by the authors, without undue reservation.
Ethics statement
The animal study was approved by CSULB Institutional Animal Care and Use Committee. The study was conducted in accordance with the local legislation and institutional requirements.
Author contributions
ES and DJ contributed to the conception and design of the study. ES collected the data. ES and DJ performed the statistical analysis. ES wrote the first draft of the manuscript. ES and DJ wrote sections of the manuscript. All authors contributed to manuscript revision, read, and approved the submitted version.
Funding
Financial support for ES was provided by the American Society of Ichthyologists and Herpetologists, the Southern California Tuna Club, the Los Angeles Rod and Reel Club, the Richard Green Foundation, the Fly Fishers’ Club of Orange County and CSULB CSNM. This study was funded by NSF award OCE-1948975 to DJ.
Acknowledgments
We would like to thank Cameron Powell, Sarah Parrott, Terah Morales, and Kara Stella for their assistance in data collection and processing for this project.
Conflict of interest
The authors declare that the research was conducted in the absence of any commercial or financial relationships that could be construed as a potential conflict of interest.
Publisher’s note
All claims expressed in this article are solely those of the authors and do not necessarily represent those of their affiliated organizations, or those of the publisher, the editors and the reviewers. Any product that may be evaluated in this article, or claim that may be made by its manufacturer, is not guaranteed or endorsed by the publisher.
Supplementary material
The Supplementary Material for this article can be found online at: https://www.frontiersin.org/articles/10.3389/fmars.2023.1240404/full#supplementary-material
References
Asch R. G., Stock C. A., Sarmiento J. L. (2019). Climate change impacts on mismatches between phytoplankton blooms and fish spawning phenology. Global Change Biol. 25, 2544–2559. doi: 10.1111/gcb.14650
Ashur M. M., Johnston N. K., Dixson D. L. (2017). Impacts of ocean acidification on sensory function in marine organisms. Integr. Comp. Biol. 57, 63–80. doi: 10.1093/icb/icx010
Bates D., Mächler M., Bolker B., Walker S. (2015). Fitting linear mixed-effects models using lme4. J. Stat. Software. 67, 1–48. doi: 10.18637/jss.v067.i01
Baumann H., Talmage S. C., Gobler C. J. (2012). Reduced early life growth and survival in a fish in direct response to increased carbon dioxide. Nat. Climate Change 2, 38–41. doi: 10.1038/nclimate1291
Beaugrand G., Brander K. M., Lindley J. A., Souissi S., Reid P. C. (2003). Plankton effect on cod recruitment in the North Sea. Nature 426, 661–664. doi: 10.1038/nature02164
Bignami S., Enochs I. C., Manzello D. P., Sponaugle S., Cowen R. K. (2013a). Ocean acidification alters the otoliths of a pantropical fish species with implications for sensory function. Proc. Natl. Acad. Sci. United. States America 110, 7366–7370. doi: 10.1073/pnas.1301365110
Bignami S., Sponaugle S., Cowen R. K. (2013b). Response to ocean acidification in larvae of a large tropical marine fish, Rachycentron canadum. Global Change Biol. 19, 996–1006. doi: 10.1111/gcb.12133
Bignami S., Sponaugle S., Cowen R. K. (2014). Effects of ocean acidification on the larvae of a high-value pelagic fisheries species, mahi-mahi Coryphaena hippurus. Aquat. Biol. 21, 249–260. doi: 10.3354/ab00598
Bignami S., Sponaugle S., Hauff M., Cowen R. K. (2017). Combined effects of elevated pCO2, temperature, and starvation stress on larvae of a large tropical marine fish. ICES. J. Mar. Sci. 74, 1220–1229. doi: 10.1093/icesjms/fsw216
Boyce D. G., Lewis M. R., Worm B. (2010). Global phytoplankton decline over the past century. Nature 466, 591–596. doi: 10.1038/nature09268
Cattano C., Claudet J., Domenici P., Milazzo M. (2018). Living in a high CO2 world: a global meta-analysis shows multiple trait-mediated fish responses to ocean acidification. Ecol. Monogr. 88, 320–335. doi: 10.1002/ecm.1297
Chambers R. C., Candelmo A. C., Habeck E. A., Poach M. E., Wieczorek D., Cooper K. R., et al. (2014). Effects of elevated CO2 in the early life stages of summer flounder, Paralichthys dentatus, and potential consequences of ocean acidification. Biogeosciences 11, 1613–1626. doi: 10.5194/bg-11-1613-2014
Checkley D. M. Jr. (1984). Relation of growth to ingestion for larvae of Atlantic herring Clupea harengus and other fish. Mar. Ecol. Prog. series. Oldendorf. 18, 215–224. doi: 10.3354/meps018215
Cominassi L., Moyano M., Claireaux G., Howald S., Mark F. C., Zambonino-Infante J. L., et al. (2019). Combined effects of ocean acidification and temperature on larval and juvenile growth, development and swimming performance of European sea bass (Dicentrarchus labrax). PloS One 14, 1–22. doi: 10.1371/journal.pone.0221283
Cominassi L., Moyano M., Claireaux G., Howald S., Mark F. C., Zambonino-Infante J. L., et al. (2020). Food availability modulates the combined effects of ocean acidification and warming on fish growth. Sci. Rep. 10, 1–12. doi: 10.1038/s41598-020-58846-2
Couturier C. S., Stecyk J. A. W., Rummer J. L., Munday P. L., Nilsson G. E. (2013). Species-specific effects of near-future CO2 on the respiratory performance of two tropical prey fish and their predator. Comp. Biochem. Physiol. - A. Mol. Integr. Physiol. 166, 482–489. doi: 10.1016/j.cbpa.2013.07.025
Dahlke F., Lucassen M., Bickmeyer U., Wohlrab S., Puvanendran V., Mortensen A., et al. (2020). Fish embryo vulnerability to combined acidification and warming coincides with a low capacity for homeostatic regulation. J. Exp. Biol. 223, jeb212589. doi: 10.1242/jeb.212589
Davidson C. W. (2015). Spatial and temporal variability of coastal carbonate chemistry in the Southern California region (San Diego: University of California).
DePasquale E., Baumann H., Gobler C. J. (2015). Vulnerability of early life stage Northwest Atlantic forage fish to ocean acidification and low oxygen. Mar. Ecol. Prog. Ser. 523, 145–156. doi: 10.3354/meps11142
Di Santo V. (2019). Ocean acidification and warming affect skeletal mineralization in a marine fish. Proc. R. Soc. B.: Biol. Sci. 286. doi: 10.1098/rspb.2018.2187
Downie A. T., Illing B., Faria A. M., Rummer J. L. (2020). Swimming performance of marine fish larvae: review of a universal trait under ecological and environmental pressure. Rev. Fish. Biol. Fisheries. 30, 93–108. doi: 10.1007/s11160-019-09592-w
Esbaugh A. J. (2018). Physiological implications of ocean acidification for marine fish: emerging patterns and new insights. J. Comp. Physiol. B.: Biochem. Systemic. Environ. Physiol. 188, 1–13. doi: 10.1007/s00360-017-1105-6
Fabry V. J., Seibel B. A., Feely R. A., Orr J. (2008). Impacts of ocean acidification on marine fauna and ecosystem processes. ICES. J. Mar. Sci. 65 (3), 414–432. doi: 10.1093/icesjms/fsn048
Faria A. M., Filipe S., Lopes A. F., Oliveira A. P., Gonçalves E. J., Ribeiro L. (2017). Effects of high pCO2 on early life development of pelagic spawning marine fish. Mar. Freshw. Res. 68, 2106–2114. doi: 10.1071/MF16385
Fisher R., Bellwood D. (2003). Undisturbed swimming behaviour and nocturnal activity of coral reef fish larvae. Mar. Ecol. Prog. Ser. 263, 177–188. doi: 10.3354/meps263177
Franke A., Clemmesen C. (2011). Effect of ocean acidification on early life stages of Atlantic herring (Clupea harengus L.). Biogeosciences 8, 3697–3707. doi: 10.5194/bg-8-3697-2011
Frommel A. Y., Lye S. L. R., Brauner C. J., Hunt B. P. V. (2022). Air exposure moderates ocean acidification effects during embryonic development of intertidally spawning fish. Sci. Rep. 12, 12270. doi: 10.1038/s41598-022-16399-6
Frommel A. Y., Maneja R., Lowe D., Malzahn A. M., Geffen A. J., Folkvord A., et al. (2012). Severe tissue damage in Atlantic cod larvae under increasing ocean acidification. Nat. Climate Change 2, 42–46. doi: 10.1038/nclimate1324
Frommel A. Y., Maneja R., Lowe D., Pascoe C. K., Geffen A. J., Folkvord A., et al. (2014). Organ damage in Atlantic herring larvae as a result of ocean acidification. Ecol. Appl. 24, 1131–1143. doi: 10.1890/13-0297.1
Frommel A. Y., Margulies D., Wexler J. B., Stein M. S., Scholey V. P., Williamson J. E., et al. (2016). Ocean acidification has lethal and sub-lethal effects on larval development of yellowfin tuna, Thunnus albacares. J. Exp. Mar. Biol. Ecol. 482, 18–24. doi: 10.1016/j.jembe.2016.04.008
Fuiman L. A., Smith M. E., Malley V. N. (1999). Ontogeny of routine swimming speed and startle responses in red drum, with a comparison of responses to acoustic and visual stimuli. J. Fish. Biol. 55, 215–226. doi: 10.1111/j.1095-8649.1999.tb01057.x
Gattuso J.-P., Epitalon J.-M., Lavigne H., Orr J. (2018). seacarb: seawater carbonate chemistry. R package version 3.3.0. http://CRAN.R-project.org/package=seacarb
Gobler C. J., Merlo L. R., Morrell B. K., Griffith A. W. (2018). Temperature, Acidification, and Food Supply Interact to Negatively Affect the Growth and Survival of the Forage Fish, Menidia beryllina (Inland Silverwide), and Cyprinodon variegatus (Sheepshead Minnow). Front. Mar. Sci. 5, 1–12. doi: 10.3389/fmars.2018.00086
Gregory P. (2001). Grunion. California’s living marine resources: A status report Vol. 592p (Sacramento: California Department of Fish and Game), 246–247.
Griem J. N., Martin K. L. M. (2000). Wave action: the environmental trigger for hatching in the California grunion Leuresthes tenuis (Teleostei: Atherinopsidae). Mar. Biol. 137, 177–181. doi: 10.1007/s002270000329
Hamilton S. L., Kashef N. S., Stafford D. M., Mattiasen E. G., Kapphahn L. A., Logan C. A., et al. (2019). Ocean acidification and hypoxia can have opposite effects on rockfish otolith growth. J. Exp. Mar. Biol. Ecol. 521, 151245. doi: 10.1016/j.jembe.2019.151245
Harvey B. P., Gwynn-Jones D., Moore P. J. (2013). Meta-analysis reveals complex marine biological responses to the interactive effects of ocean acidification and warming. Ecol. Evol. 3, 1016–1030. doi: 10.1002/ece3.516
Heuer R. M., Grosell M. (2014). Physiological impacts of elevated carbon dioxide and ocean acidification on fish. Am. J. Physiology-Regulatory. Integr. Comp. Physiol. 307, R1061–R1084. doi: 10.1152/ajpregu.00064.2014
Heuer R. M., Grosell M. (2016). Elevated CO2 increases energetic cost and ion movement in the marine fish intestine. Sci. Rep. 6, 1–8. doi: 10.1038/srep34480
Hjort J. (1914). Fluctuations in the great fisheries of Northern Europe viewed in the light of biological research. International Council for the Exploration of the Sea.
Hönisch B., Ridgwell A., Schmidt D. N., Thomas E., Gibbs S. J., Sluijs A., et al. (2012). The geological record of ocean acidification. Science 335, 1058–1063. doi: 10.1126/science.1208277
Houde E. D. (1987). Fish early life dynamics and recruitment variability. Am. Fish. Soc Symp. 2, 17–29.
Houde E. D., Schekter R. C. (1983). Oxygen uptake and comparative energetics among eggs and larvae of three subtropical marine fishes. Mar. Biol. 72, 283–293. doi: 10.1007/BF00396834
Hurst T. P., Copeman L. A., Andrade J. F., Stowell M. A., Al-Samarrie C. E., Sanders J. L., et al. (2021). Expanding evaluation of ocean acidification responses in a marine gadid: elevated CO2 impacts development, but not size of larval walleye pollock. Mar. Biol. 168, 119. doi: 10.1007/s00227-021-03924-w
Hurst T. P., Fernandez E. R., Mathis J. T. (2014). Effects of ocean acidification on hatch size and larval growth of walleye pollock (Theragra chalogramma). ICES. J. Mar. Sci. 70, 812–822. doi: 10.1093/icesjms/fst053
Johnson D. W. (2022). Selection on offspring size and contemporary evolution under ocean acidification. Nat. Climate Change 12, 757–760. doi: 10.1038/s41558-022-01425-2
Johnson D. W., Grorud-Colvert K., Sponaugle S., Semmens B. X. (2014). Phenotypic variation and selective mortality as major drivers of recruitment variability in fishes. Ecol. Lett. 17, 743–755. doi: 10.1111/ele.12273
Kleiber M. (1947). Body size and metabolic rate. Physiol. Rev. 27, 511–541. doi: 10.1152/physrev.1947.27.4.511
Kroeker K. J., Kordas R. L., Crim R., Hendriks I. E., Ramajo L., Singh G. S., et al. (2013). Impacts of ocean acidification on marine organisms: Quantifying sensitivities and interaction with warming. Global Change Biol. 19, 1884–1896. doi: 10.1111/gcb.12179
Kroeker K. J., Kordas R. L., Crim R. N., Singh G. G. (2010). Meta-analysis reveals negative yet variable effects of ocean acidification on marine organisms. Ecol. Lett. 13, 1419–1434. doi: 10.1111/j.1461-0248.2010.01518.x
Kump L. R., Bralower T. J., Ridgwell A. (2009). Ocean acidification in deep time. Oceanography 22, 94–107. doi: 10.5670/oceanog.2009.100
Laubenstein T., Rummer J., Nicol S., Parsons D., Pether S., Pope S., et al. (2018). Correlated effects of ocean acidification and warming on behavioral and metabolic traits of a large pelagic fish. Diversity 10, 35. doi: 10.3390/d10020035
Leo E., Dahlke F. T., Storch D., Pörtner H. O., Mark F. C. (2018). Impact of Ocean Acidification and Warming on the bioenergetics of developing eggs of Atlantic herring Clupea harengus. Conserv. Physiol. 6, 1–10. doi: 10.1093/conphys/coy050
Mackas D. L., Denman K. L., Abbott M. R. (1985). Plankton patchiness: biology in the physical vernacular. Bull. Mar. Sci. 37, 653–674.
Maneja R. H., Frommel A. Y., Browman H. I., Geffen A. J., Folkvord A., Piatkowski U., et al. (2015). The swimming kinematics and foraging behavior of larval Atlantic herring (Clupea harengus L.) are unaffected by elevated pCO2. J. Exp. Mar. Biol. Ecol. 466, 42–48. doi: 10.1016/j.jembe.2015.02.008
Maneja R. H., Frommel A. Y., Geffen A. J., Folkvord A., Piatkowski U., Chang M. Y., et al. (2013). Effects of ocean acidification on the calcification of otoliths of larval Atlantic cod Gadus morhua. Mar. Ecol. Prog. Ser. 477, 251–258. doi: 10.3354/meps10146
Martin K. L. M., Hieb K. A., Roberts D. A. (2013). A southern California icon surfs north: Local ecotype of California grunion, Leuresthes tenuis (Atherinopsidae), revealed by multiple approaches during temporary habitat expansion into San Francisco Bay. Copeia 2013, 729–739. doi: 10.1643/CI-13-036
May R. C. (1971). Effects of delayed initial feeding on larvae of the grunion, Leuresthes tenuis (Ayres). Fishery. Bull. 69, 411–425.
McMahon S. J., Parsons D. M., Donelson J. M., Pether S. M. J., Munday P. L. (2020a). Elevated CO2 and heatwave conditions affect the aerobic and swimming performance of juvenile Australasian snapper. Mar. Biol. 167, 1–12. doi: 10.1007/s00227-019-3614-1
McMahon S. J., Parsons D. M., Donelson J. M., Pether S. M. J., Munday P. L. (2020b). Elevated temperature and CO2 have positive effects on the growth and survival of larval Australasian snapper. Mar. Environ. Res. 161, 105054–105054. doi: 10.1016/j.marenvres.2020.105054
Millero F. J. (2010). Carbonate constants for estuarine waters. Mar. Freshw. Res. 61, 139–142. doi: 10.1071/MF09254
Munday P. L., Gagliano M., Donelson J. M., Dixson D. L., Thorrold S. R. (2011a). Ocean acidification does not affect the early life history development of a tropical marine fish. Mar. Ecol. Prog. Ser. 423, 211–221. doi: 10.3354/meps08990
Munday P. L., Hernaman V., Dixson D. L., Thorrold S. R. (2011b). Effect of ocean acidification on otolith development in larvae of a tropical marine fish. Biogeosciences 8, 1631–1641. doi: 10.5194/bg-8-1631-2011
Munday P. L., Watson S.-A., Chung W.-S., Marshall N. J., Nilsson G. E. (2014). Response to ‘The importance of accurate CO2 dosing and measurement in ocean acidification studies’. J. Exp. Biol. 217 (10), 1828–1829. doi: 10.1242/jeb.105890
Murray C. S., Baumann H. (2018). You better repeat it: Complex CO2 × temperature effects in Atlantic silverside offspring revealed by serial experimentation. Diversity 10. doi: 10.3390/d10030069
Owen R. W. (1989). Microscale and finescale variations of small plankton in coastal and pelagic environments. J. Mar. Res. 47, 197–240. doi: 10.1357/002224089785076415
Pan T.-C. F., Applebaum S. L., Manahan D. T. (2015). Experimental ocean acidification alters the allocation of metabolic energy. Proc. Natl. Acad. Sci. 112, 4696–4701. doi: 10.1073/pnas.1416967112
Peck M. A., Moyano M. (2016). Measuring respiration rates in marine fish larvae: challenges and advances. J. Fish. Biol. 88 (1), 173–205. doi: 10.1111/jfb.12810
Pedersen B. H. (1997). The cost of growth in young fish larvae, a review of new hypotheses. Aquaculture 155, 259–269. doi: 10.1016/S0044-8486(97)00127-0
Pimentel M. S., Faleiro F., Marques T., Bispo R., Dionisio G., Faria A. M., et al. (2016). Foraging behaviour, swimming performance and malformations of early stages of commercially important fishes under ocean acidification and warming. Clim Change 137, 495-509. doi: 10.3390/fishes5010001
Przeslawski R., Byrne M., Mellin C. (2015). A review and meta-analysis of the effects of multiple abiotic stressors on marine embryos and larvae. Global Change Biol. 21, 2122–2140. doi: 10.1111/gcb.12833
Rendleman A. J., Rodriguez J. A., Ohanian A., Pace D. A. (2018). More than morphology: Differences in food ration drive physiological plasticity in echinoid larvae. J. Exp. Mar. Biol. Ecol. 501, 1–15. doi: 10.1016/j.jembe.2017.12.018
Rombough P. J. (1994). Energy partitioning during fish development: Additive or compensatory allocation of energy to support growth? Funct. Ecol. 8, 178–186. doi: 10.2307/2389901
Schneider C. A., Rasband W. S., Eliceiri K. W. (2012). NIH Image to ImageJ: 25 years of image analysis. Nat. Methods 9, 671–675. doi: 10.1038/nmeth.2089
Shelley C. E., Johnson D. W. (2022). Larval fish in a warming ocean: a bioenergetic study of temperature-dependent growth and assimilation efficiency. Mar. Ecol. Prog. Ser. 691, 97–114. doi: 10.3354/meps14057
Shen S. G., Chen F., Schoppik D. E., Checkley D. M. (2016). Otolith size and the vestibulo-ocular reflex of larvae of white seabass Atractoscion nobilis at high pCO2. Mar. Ecol. Prog. Ser. 553, 173–182. doi: 10.3354/meps11791
Siegfried E., Johnson D. W. (2023). Effects of ocean acidification and warming on the specific dynamic action of California Grunion (Leuresthes tenuis) larvae. J. Exp. Mar. Biol. Ecol. 563, 151893. doi: 10.1016/j.jembe.2023.151893
Silva C. S. E., Novais S. C., Lemos M. F. L., Mendes S., Oliveira A. P., Gonçalves E. J., et al. (2016). Effects of ocean acidification on the swimming ability, development and biochemical responses of sand smelt larvae. Sci. Total. Environ. 563-564, 89–98. doi: 10.1016/j.scitotenv.2016.04.091
Sogard S. M. (1997). Size-selective mortality in the juvenile stage of teleost fishes: a review. Bull. Mar. Sci. 60, 1129–1157.
Sswat M., Stiasny M. H., Jutfelt F., Riebesell U., Clemmesen C. (2018). Growth performance and survival of larval Atlantic herring, under the combined effects of elevated temperatures and CO2. PloS One 13, 1–19. doi: 10.1371/journal.pone.0191947
Stiasny M. H., Mittermayer F. H., Sswat M., Voss R., Jutfelt F., Chierici M., et al. (2016). Ocean acidification effects on Atlantic cod larval survival and recruitment to the fished population. PloS One 11, 1–11. doi: 10.1371/journal.pone.0155448
Stiasny M. H., Sswat M., Mittermayer F. H., Falk-Petersen I. B., Schnell N. K., Puvanendran V., et al. (2019). Divergent responses of Atlantic cod to ocean acidification and food limitation. Global Change Biol. 25, 839–849. doi: 10.1111/gcb.14554
Takeshita Y., Frieder C. A., Martz T. R., Ballard J. R., Feely R. A., Kram S., et al. (2015). Including high-frequency variability in coastal ocean acidification projections. Biogeosciences 12, 5853–5870. doi: 10.5194/bg-12-5853-2015
Tasoff A. J., Johnson D. W. (2019). Can larvae of a marine fish adapt to ocean acidification? Evaluating the evolutionary potential of California grunion (Leuresthes tenuis). Evol. Appl. 12, 560–571. doi: 10.1111/eva.12739
Vanhaecke P., Lavens P., Sorgeloos P. (1983). International study on Artemia (1). XVII. Energy consumption in cysts and early larval stages of various geographical strains of Artemia. Annales. la Société. Royale. Zool. Belgique. 113, 155–164.
Venrick E. L. (2012). Phytoplankton in the California Current system off southern California: Changes in a changing environment. Prog. Oceanogr. 104, 46–58. doi: 10.1016/j.pocean.2012.05.005
Villalobos C., Love B. A., Olson M. B. (2020). Ocean acidification and ocean warming effects on pacific herring (Clupea pallasi) early life stages. Front. Mar. Sci. 7, 1–13. doi: 10.3389/fmars.2020.597899
Watson S. A., Allan B. J. M., McQueen D. E., Nicol S., Parsons D. M., Pether S. M. J., et al. (2018). Ocean warming has a greater effect than acidification on the early life history development and swimming performance of a large circumglobal pelagic fish. Global Change Biol. 24, 4368–4385. doi: 10.1111/gcb.14290
Westernhagen H., Rosenthal H. (1981). On condition factor measurements in Pacific herring larvae. Helgoländer. Meeresuntersuchungen. 34, 257–262. doi: 10.1007/BF02074122
Keywords: California grunion, pCO2, climate change, early life history, energetics, swimming activity, respiration, feeding rate
Citation: Siegfried E and Johnson DW (2023) Experimental ocean acidification and food limitation reveals altered energy budgets and synergistic effects on mortality of larvae of a coastal fish. Front. Mar. Sci. 10:1240404. doi: 10.3389/fmars.2023.1240404
Received: 15 June 2023; Accepted: 09 August 2023;
Published: 31 August 2023.
Edited by:
Gretchen E. Hofmann, University of California, Santa Barbara, United StatesReviewed by:
Ana M. Faria, MARE-ISPA, PortugalScott Hamilton, Moss Landing Marine Laboratories, United States
Copyright © 2023 Siegfried and Johnson. This is an open-access article distributed under the terms of the Creative Commons Attribution License (CC BY). The use, distribution or reproduction in other forums is permitted, provided the original author(s) and the copyright owner(s) are credited and that the original publication in this journal is cited, in accordance with accepted academic practice. No use, distribution or reproduction is permitted which does not comply with these terms.
*Correspondence: Emma Siegfried, siegfried.emma@gmail.com