Matching visual and acoustic events to estimate detection probability for small cetaceans in the ACCOBAMS Survey Initiative
 Camille Ollier
 Ilona Sinn
 Oliver Boisseau
 Vincent Ridoux
 Auriane Virgili
- 1Centre d’Etude Biologiques de Chizé, UMR 7372 CNRS, La Rochelle Université, Chizé, France
- 2Observatoire PELAGIS, UAR 3462 CNRS, La Rochelle Université, La Rochelle, France
- 3Marine Conservation Research, Kelvedon, United Kingdom
Estimating the detection probability of small cetaceans using either visual or acoustic surveys is difficult because they do not surface or vocalise continuously and can be imperceptible to an observer or hydrophone. Animals seen at the surface may have lower vocalisation rates, while submerged individuals may be more vocally active. This study aims to estimate visual, acoustic and combined detection probability by using Mark-Recapture Distance Sampling (MRDS) methodology. We used vessel-based visual sightings and acoustic data (based on click identification) collected simultaneously during the ACCOBAMS Survey Initiative in summer 2018 onboard the R/V Song of the Whale. This study focused on small cetaceans in the Mediterranean Sea, including the most commonly-encountered species, the striped dolphin (Stenella coeruleoalba). We identified duplicate events between visual and acoustic platforms using a decision tree based on time and distance thresholds to estimate g(0) (the detection probability on the trackline) for small cetaceans. A total of 30 duplicate events were identified from 107 and 109 events identified by the visual and acoustic platforms respectively. We tested the models with two key functions. With a hazard-rate key function, the g(0) was estimated at 0.52 (CV=21.0%) for both platforms combined, 0.29 (CV=25.6%) for the visual platform and 0.32 (CV=25.1%) for the acoustic platform. With a half-normal key function, g(0) was estimated at 0.51 (CV = 21.7%) for both platforms combined, 0.29 (CV = 25.6%) for the visual platform and 0.33 (CV = 23.2%) for the acoustic platform. Our results illustrate that passive acoustic monitoring can be used as an independent platform in MRDS to estimate the detection probability. Our estimate of g(0) was well below 1, far from the perfect detection commonly assumed for abundance estimation. Without correction for detection biases, total abundance would be underestimated by a factor of two when using both acoustic and visual data. This highlights the importance of using dual-platform surveys to estimate detection probability in order to improve abundance estimates and conservation efforts.
1 Introduction
Marine megafauna species, which have long life spans, low fecundity rates and high longevity (McCauley et al., 2015; Sequeira et al., 2019), are particularly sensitive to anthropogenic pressures and consequently face conservation risks (Bossart, 2011). Although positive actions have been taken for the conservation of populations (Alves et al., 2022), they are still exposed to a wide range of anthropogenic threats such as over-exploitation, underwater noise or bycatch, which affect their vital rates and population viability (Bossart, 2011; New et al., 2014; Pirotta et al., 2018). As a result, many populations of marine megafauna currently have a critical conservation status (Lascelles et al., 2014).
Conservation status assessment is based on information on the abundance, population status and natural history of the species, as well as anthropogenic pressures, all of which may vary over time. Estimating cetacean abundance is a difficult task, as they are mobile and elusive species that spend most of their time below the sea surface, over extended home ranges. Due to these difficulties, opportunities to detect cetaceans in a study area (hereafter called events once detected) may be missed, leading to a biased estimate of population abundance. While most cetacean conservation programs use minimum abundance estimates to take conservation measures (Evans and Hammond, 2004), unbiased absolute abundance is essential to identify acceptable levels of human-caused mortality for cetaceans (Punt et al., 2021). For example, bycatch is the most common source of cetacean mortality (Reeves et al., 2013) and assessing the sustainability of cetacean bycatch can allow the development of effective conservation and management measures (Parra et al., 2021).
Line-transect and mark-recapture methods are two well-known techniques for estimating cetacean population abundance (Buckland et al., 2001; Hammond, 2018). Mark-recapture methods can be applied using different techniques such as acoustic devices (Marques et al., 2012), DNA sampling (Mills et al., 2000) or photo-identification (Genov et al., 2008). The latter is the most commonly used technique, using natural markings on animals to identify cetaceans, and patterns of recaptures in the form of capture histories to estimate the number of undetected animals and hence population size (Hammond, 2018). Photo-identification based mark-recapture technique is effective for studying small coastal populations of cetaceans in a limited study area. In contrast, the line transect method, which is based on distance sampling techniques, does not require the identification of individuals and is generally applied over large study areas, while allowing for the simultaneous monitoring of several species (Buckland et al., 2004; Daura-Jorge and Simões-Lopes, 2017). This method relies on the visual and/or acoustic detection of events collected by observers/recorders on a platform moving along a predetermined linear route in a study area. Observers record visual and/or acoustic detection events, i.e. each event in which an individual or group of individuals is encountered, the radial distance of the event from the observer/recorder and the angle between the vessel’s bow and the animals. For each event, the radial distance and angle are used to calculate the perpendicular distance from the transect line. A detection function g(x), which is the probability of detecting an animal given its distance x from the line, is estimated from the distribution of the perpendicular distances. Knowing this probability of detection, the number of events and the size of the covered region, density and abundance of the population and the effective strip width (ESW; the number of objects detected beyond this distance is equal to the number of objects missed before this limit) can be estimated (Buckland et al., 2015). Conventional Distance Sampling (CDS) usually requires three assumptions to be met: (1) all animals on the transect line are detected, usually referred to as g(0) = 1, (2) animals are detected at their initial location and (3) distance measurements are accurate. The assumption g(0)=1 has been commonly used to estimate cetacean abundance (Barlow, 2006; Øien, 2009; Dick and Hines, 2011; Hildebrand et al., 2015) despite the fact that many animals spend a significant proportion of the time submerged and might hence be missed, potentially inducing a negative bias in abundance estimates.
Abundance estimation is indeed closely linked to the detectability of individuals during surveys (McCarthy et al., 2013). Detectability can be affected by both an availability bias and a perception bias (Laake and Borchers, 2004), constituting together the detection biases. Availability bias corresponds to the unavailability of animals for detection, either because they are below the sea surface, which depends on the time spent at depth by the species and the platform speed, or because they are not acoustically active, which depends on the vocalisation rate of the species. Perception bias accounts for the non-detection of available animals by observers or recorders due to imperfect observer vigilance or unfavourable conditions for detection (e.g. high sea states). Multi-Covariate Distance Sampling (MCDS) partially addresses detection biases using covariates in the detection function (Marques and Buckland, 2003). However, estimating the detection probability of small cetaceans remains difficult and the assumption that all animals are detected on the transect line can be violated due to both availability and perception biases. If they are not accounted for, the estimated abundance will be negatively biased (Saavedra et al., 2018).
To provide more accurate abundance estimates, the Mark-Recapture Distance Sampling (MRDS) method deals with missed detections at distance zero by estimating g(0). This method requires two independent platforms scanning the same area simultaneously, which are used to ‘mark’ animals (Laake and Borchers, 2004). The g(0) and overall detection probability are estimated by using the number of animals seen by each platform and by both platforms (duplicate events). Most dual platform line-transect surveys use two visual platforms, either with a single survey platform or with two separate survey platforms (Cañadas et al., 2004; Hammond et al., 2013; Laran et al., 2017; Lambert et al., 2019). The number of surveys using an acoustic platform with a towed hydrophone array as a second platform has increased in recent years (Barlow and Taylor, 2005; Boisseau et al., 2010; Richman et al., 2014; Martin et al., 2020; Rankin et al., 2020; Dalpaz et al., 2021). The acoustic platform has the advantage of detecting cetaceans even when they are not visible at the surface, and thus not available to the visual platform. These two methods are complementary and can improve the overall detection efficiency (Verfuss et al., 2018). This kind of analysis can however be challenging due to the complexity of identifying events; acoustic events are typically validated during post-field analysis, while visual events are recorded directly during the survey.
The ACCOBAMS Survey Initiative (ASI) vessel component, conducted in the summer of 2018 with the R/V Song of the Whale in the western and central Mediterranean Sea, was a unique survey using a visual-acoustic dual platform (ACCOBAMS, 2021). The ASI was carried out under the auspices of the Agreement on the Conservation of Cetaceans of the Black Sea Mediterranean Sea and Contiguous Atlantic Area (ACCOBAMS) to estimate cetacean abundance in the entire Mediterranean Sea. This region is exposed to increasing levels of anthropogenic impacts (Coll et al., 2012) and is home to cetacean populations that are often distinct from their nearby Atlantic counterparts. Numerous studies have been conducted in the Mediterranean Sea to estimate the abundance of cetaceans (Laran et al., 2017; Panigada et al., 2017; Lewis et al., 2018 but survey efforts have been recognised as heterogeneous across the basin (Mannocci et al., 2018). Some species, like the Risso’s dolphin (Grampus griseus) or the rough-toothed dolphin (Steno bredanensis), have received less attention than others (Boisseau et al., 2010; Kerem et al., 2012; Luna et al., 2022) and some areas have been studied more extensively, especially within the western basin (Mannocci et al., 2018). Therefore, the ASI project aimed at filling these data gaps.
In this study, we aimed to use this visual-acoustic dual platform to estimate the detection probability of small cetaceans in the Mediterranean Sea. Small cetaceans studied here include the bottlenose dolphin (Tursiops truncatus), the long-finned pilot whale (Globicephala melas), the Risso’s dolphin, the rough-toothed dolphin, the common dolphin (Delphinus delphis), the striped dolphin (Stenella coeruleoalba) and unidentified dolphins. This diverse community is largely dominated by the striped dolphin (ACCOBAMS, 2021). We only included transects from the ASI survey where visual and acoustic data (based on echolocation clicks) of small cetaceans were collected simultaneously. In this study, we did not go as far as estimating cetacean abundance because the transects where visual and acoustic data were collected simultaneously did not cover the study area uniformly, and therefore these transects were not a representative sample of the species distribution (Buckland et al., 2004). In addition, we did not estimate group size in our study, which is necessary for absolute abundance estimation. Although group size is a key aspect of abundance estimation, we did not fully address it in this study as it was primarily focused on estimating detection probabilities. To estimate detection probability, we first developed a new methodology to identify duplicate events based on a decision tree (rule-based classification). Then, we implemented an MRDS approach with covariates affecting detectability on the prior identification of visual/acoustic event duplicates. The MRDS analysis allowed the detection probability and ESW of the visual, acoustic and combined platforms to be estimated, taking detection biases into account. We expected to obtain a g(0) lower than 1, since detection cannot be considered as perfect for either platform, with a number of the animals on the transect line inevitably being missed. This paper aims to provide estimates of detection probabilities to be used to estimate the abundance of small cetacean populations, and to demonstrate the benefits of systematically using a dual platform in multi-species line-transect surveys.
2 Materials and methods
2.1 Studied species
This study focused on small cetaceans in the Mediterranean Sea which included: the bottlenose dolphin, the long-finned pilot whale, the Risso’s dolphin, the rough-toothed dolphin, the common dolphin and the striped dolphin. The echolocation clicks of these species share similar frequency ranges (Table 1), making species identification difficult (Soldevilla et al., 2008), hence all studied species were pooled for the MRDS analysis. In addition, there were likely too few encounters with species other than striped dolphin to generate robust detection functions for individual species. Striped dolphins, with 52% of the sightings during the vessel survey (ACCOBAMS, 2021) and 85% during the aerial survey (Panigada et al., in review), were the most prevalent small odontocetes in the Mediterranean Basin. These species do not share the same behaviours (i.e. group size, habitat preference, dive duration, responses to the boat) and by grouping all small odontocetes in the same analysis, we assumed that all species behave in the same way in terms of visual and acoustic events; this simplification will be discussed later on.

Table 1 Frequencies of peaks energy characteristics (kHz) for each studied species.
2.2 Survey design
The study area covered the Alborán Sea/Strait of Gibraltar, the Algero-Provençal Basin, the Tyrrhenian Sea/eastern Ligurian Sea, the Strait of Sicily/Tunisian Plateau/Gulf of Sirte, and the Ionian Sea/Central Mediterranean (from 6°W to 36°E and from 30°N to 46°N; Figure 1). The survey area was divided into 21 blocks. It was conducted using R/V Song of the Whale, a 21 m acoustically quiet vessel. The vessel operated with minimal disturbance to marine life by using noise-reduction devices, including vibration-damping mounts for the main engine and a five-bladed propeller. Some transects were surveyed using either a visual or an acoustic platform, while others were surveyed using with both platforms. In this study, we focused on data collected with both platforms between May and September 2018 at an average speed of 3.2 m/s (6.2 knots; Figure 1). Transects were designed with the Distance software (Thomas et al., 2010) as equal-spaced zig-zag transects to provide uniform coverage probability. The ASI survey used a line-transect sampling protocol and visual observers recorded the location, environmental conditions, group size and perpendicular distance to the animal(s) from the transect line (Buckland et al., 2001). Transects were divided into legs with constant environmental conditions, and each leg was finally divided into 5 km segments for analysis.
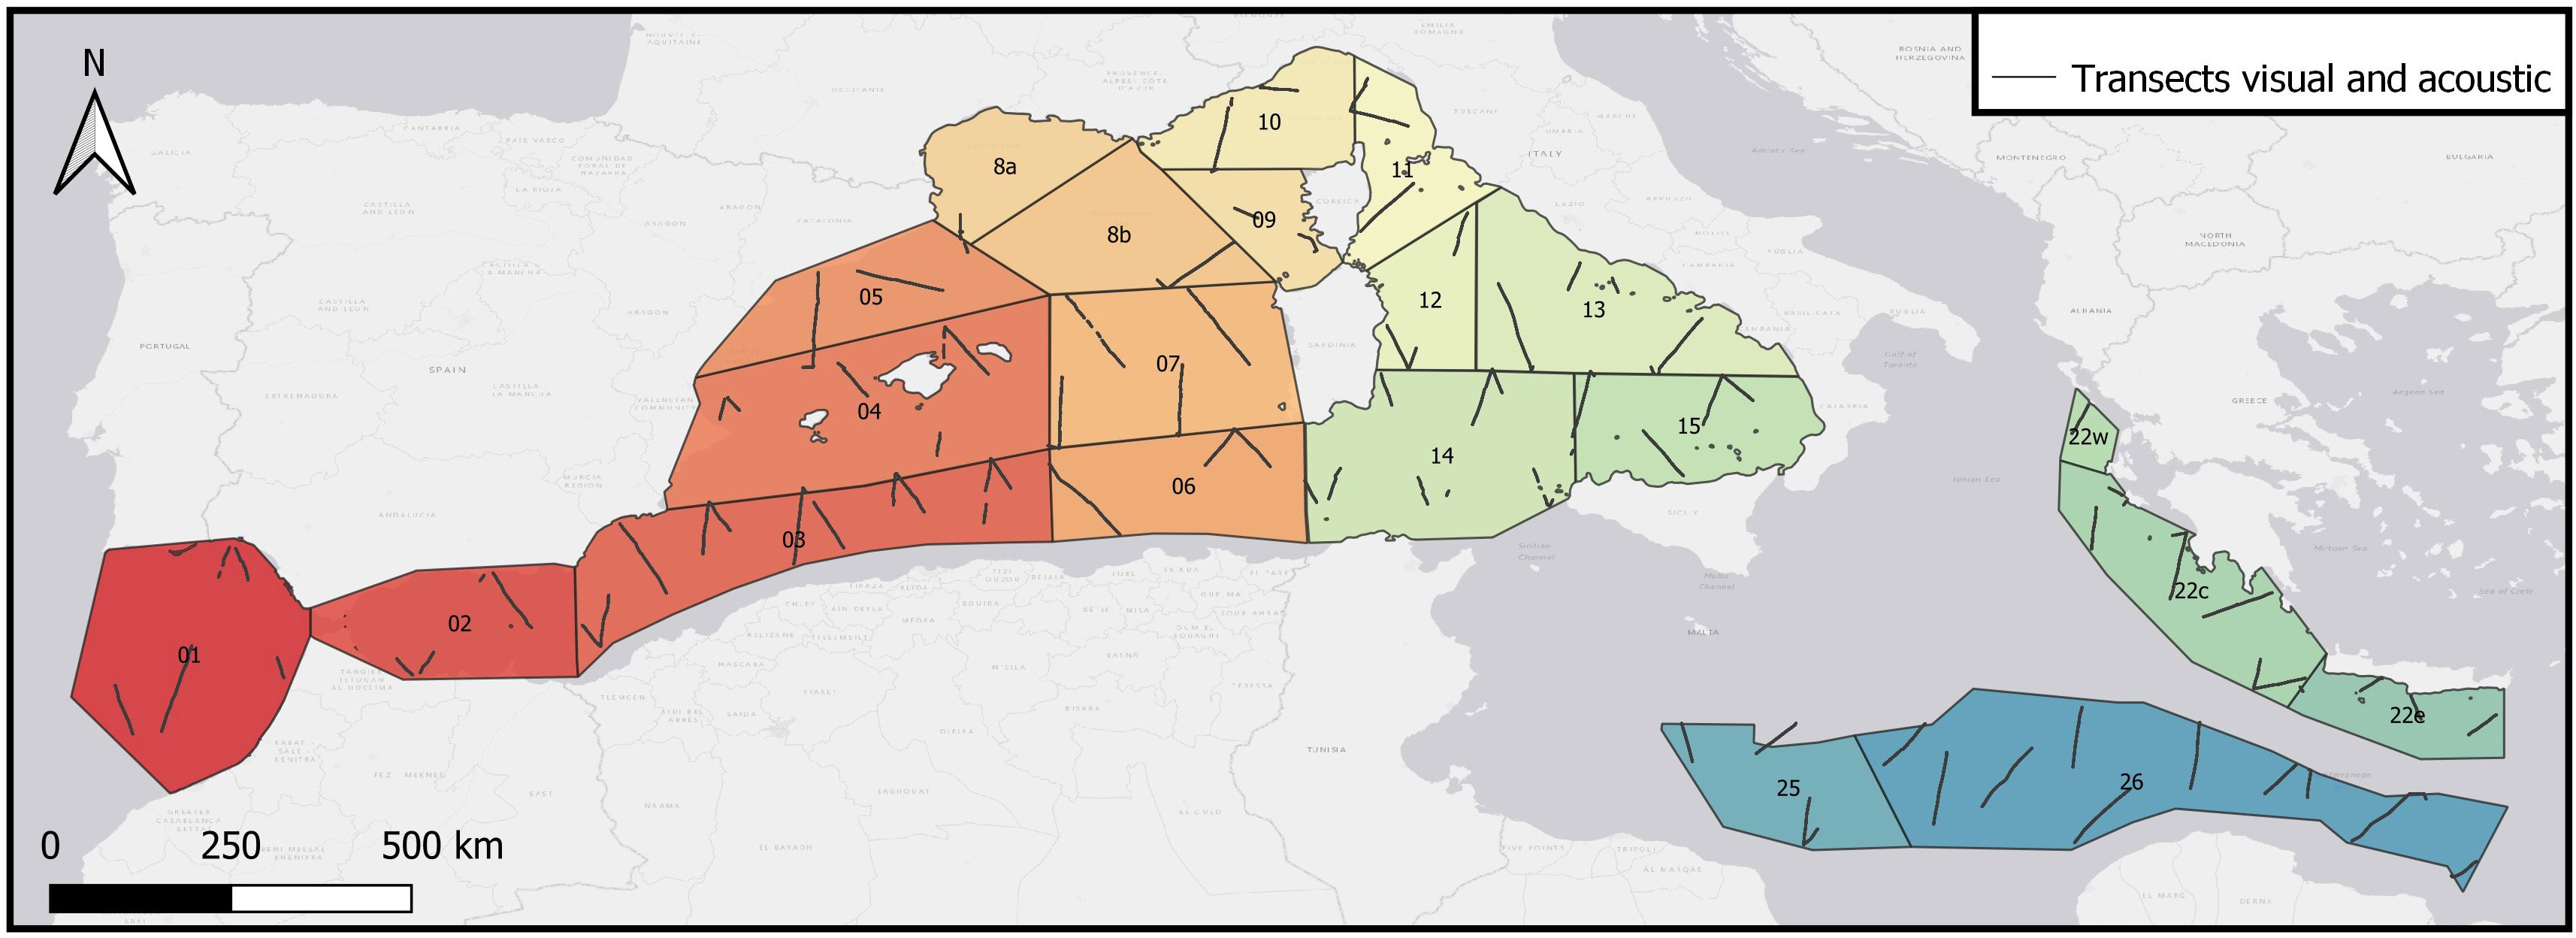
Figure 1 Study area covered by the ASI survey in 2018. The area was divided into 21 blocks: 1) Gulf of Cadiz, 2) Alborán, 3) Algeria West, 4) Baleares, 5) North East Spain, 6) Algeria East, 7) West Sardinia, 8a) Gulf of Lion shelf, 8b) Gulf of Lion deep, 9) Pelagos South West, 10) Pelagos North West, 11) Pelagis East, 12) Tyrrhenian Central West, 13) Tyrrhenian Central East, 14) Tunisia North, 15) Tyrrhenian South East, 22w) Hellenic Trench West, 22c) Hellenic Trench Central, 22e) Hellenic Trench East, 25) Libya East and 26) Libya East. The black lines represent the transects sampled in dual-platform mode (simultaneous visual and acoustic effort).
2.3 Visual data collection
Visual data were collected during daylight hours, whenever the observation conditions were appropriate (i.e. Beaufort sea state 4). During the visual effort, two observers were positioned on a 5 m elevated platform to search for cetaceans. Each observer was on either side of the platform: the first observer scanned the starboard side from 340° to 90° and the second observer scanned the port side from 270° to 20° with 0° representing the bow. They observed the respective areas with naked eye and used binoculars to confirm species identity if required. For each visual event, observers provided information to a dedicated data logger using the Logger software package (www.marineconservationresearch.org). Information about species, group size, bearing angle and distance from the boat (between the observer and the centre of the group) were recorded for each visual event. Bearings and distances were estimated by eye and group sizes were reported as best, high and low estimates of the number of animals for each visual event. In order to improve effectiveness of and consistency between the observers, distance trials and training on the survey protocol were carried out prior to the survey. Additional information was recorded on cue type and animal behaviour. When necessary, the vessel interrupted the transect line to approach animals for species identification or photo-identification before returning to the transect line at the point where it was left. Information on environmental conditions i.e. Beaufort sea state (out of 9), wave and swell heights (m), cloud cover (percentage scale; out of 10), glare, visibility (from 1 low visibility to 3 good visibility), wind direction and speed (m/s) and boat speed (m/s) were logged every hour or whenever conditions changed by the data logger member. The Logger software automatically registered the GPS position, heading and boat speed every 10 seconds. The visual survey team, consisting of at least 5 members, rotated between different roles that lasted no more than one hour: port observer, starboard observer and data logger for three hours, followed at least by two hours of rest to avoid fatigue. Any duplicate sightings made by both observers in the overlap area have been removed.
2.4 Acoustic data collection
The acoustic survey was conducted 24 hours a day with a towed hydrophone array capable of detecting all cetacean species. A 400 m tow cable was used to avoid any boat self-noise; at this distance, any vessel noise, such as propeller cavitation, was imperceptible to both human ear and the detection algorithms described below. Acoustic effort took place when Beaufort sea state was below 5 and local water depths were above 50 m. The hydrophone array was housed in an oil-filled tube and was composed of a pair of hydrophones in a linear configuration. The two hydrophone elements (Magrec HP03), spaced 0.25 m apart, had a sensitivity of -204 dB re 1V/µPa with a flat frequency response ( ± 3 dB) from 1 to 100 kHz in the frequency band of most odontocete vocalizations. Pre-amplifiers with 29 dB gain were used to prevent voltage drop between the array and the research vessel. The outputs of the pair of hydrophones were digitised at a sample rate of 192 kHz and were monitored in real-time using a click detector in PAMGuard, a passive acoustic monitoring software package (Gillespie et al., 2008). Audio recordings were stored as 16-bit wav files. Outputs from the click detector were compressed into binary storage files in PAMGuard and these files were manually analysed post-hoc with a focus on small odontocetes.
2.5 Acoustic data analysis
2.5.1 Echolocation click identification
The small cetaceans considered here have a rich vocal repertoire, producing clicks, whistles, burst pulses and many other vocalisations (Janik, 2009). Here we focused only on echolocation clicks for multiple reasons. Echolocation clicks are produced by all odontocetes and are the predominant vocalizations of toothed whales (Klinck and Mellinger, 2011). Echolocation click trains can be used to derive an estimation of the perpendicular distance which is key when applying a distance sampling framework (see below). In contrast, whistles are omnidirectional vocalizations (Jensen et al., 2012) without clear onset/offset, and as such are less suitable for estimating perpendicular distances (Amorim et al., 2022).
We defined an acoustic event as a sequence of clicks that was produced by the same animal or group of animals and showed a consistent change in bearing (e.g. when a vocalising cetacean passed from in front to behind the hydrophone array; Figure 2). Sequences of clicks that did not show a consistent trajectory of bearings (e.g. clouds of clicks) or did not cross the 90° line (e.g. detections that did not move past the array) were not considered as acoustic events.
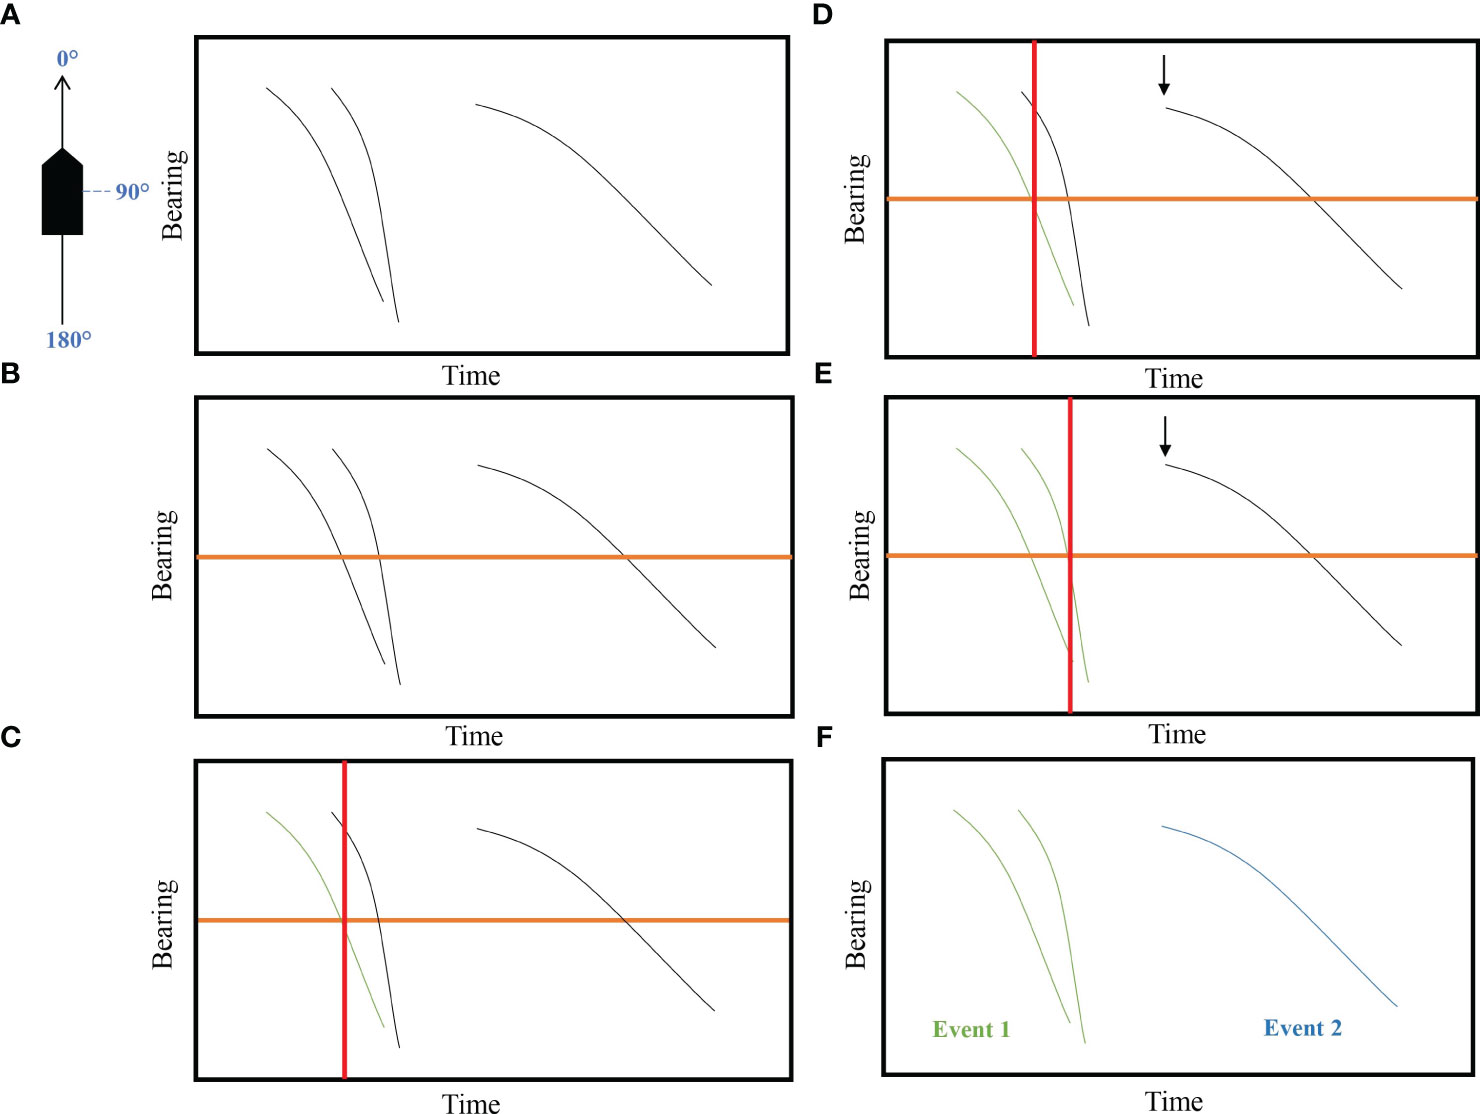
Figure 2 Protocol for determining acoustic events using PAMGuard Click detector module. (A) Determination of the number of events. (B) Set a 90° reference line representing the bearing of 90° of the boat. (C) Set a perpendicular line where the first track is crossing the 90° reference line. (D) If the followed track starts before the perpendicular line of the 1st track, it will be considered as the same event. (E) If we set a perpendicular line on the 2nd track, the 3rs track starts after the perpendicular line, this would be considered as a distinct event. (F) In conclusion, the first two tracks are the same event but probably from two different animals and the 3rd one is another acoustic event.
To confirm that an acoustic event was likely produced by a small cetacean, clicks were identified by eye based on peak frequency, the width of the peak frequency, and the number of zero crossings. We hypothesized that impulsive signals between 10 and 80 kHz were most likely produced by a cetacean. Echolocation clicks are short, broadband pulses varying from 10 to 150 kHz for many species (Au, 1993). Odontocetes emit echolocations clicks in a narrow beam projected forward from the melon and the signal energy is more focused in the forward direction (“on-axis”) than to the sides (“off-axis”; Au et al., 1978). Most studies focus on understanding clicks produced “on-axis” (Table 1), i.e. when the animals are facing the hydrophone where the transmission loss of the signal is minimal, which is not typically applicable to the field conditions when recording free-ranging cetaceans (Soldevilla et al., 2008; Baumann-Pickering et al., 2010). Signal waveforms can vary strongly between “off-axis” and “on-axis” clicks. As the higher frequencies attenuate faster than lower frequencies, the higher frequency peaks in clicks recorded “off-axis” (or clicks recorded from distant animals) may not be evident. Although acoustic events, in this study, can be either recorded “off-axis” or “on-axis” depending on the swimming direction of the animals relative to the hydrophones, most free-ranging animals are not likely to produce clicks “on-axis” of the hydrophone (Miller, 2002). Therefore, we expected to record echolocation clicks with lower bandwidths than those reported in Table 1 (marked by *), which included only “on-axis” clicks. The frequency range expected from small cetaceans corresponded to those of the ASI hydrophones which recorded sounds up to 92 kHz.
2.5.2 Localisation
A sequence of clicks can be used to derive an estimation of the perpendicular distance using the Target Motion Analysis (TMA) module’s 2D simplex method implemented in PAMGuard. The bearing angle of each detected click was determined using the time delay of arrival of a signal detected by the pair of hydrophones. Convergence of successive bearing lines was used to locate the sound source and allows the estimation of the distance perpendicular from the crossing point. The TMA module attempted to resolve left/right ambiguity using variation in the vessel’s course.
The number of acoustically active individuals per acoustic event was determined as the number of tracks that occurred at the same time. This method allowed the number of vocalising animals to be counted instead of the number of vocalisations (Akamatsu et al., 2018; Richman et al., 2014). As for visual events, acoustic group sizes were reported as best, high and low estimates of the number of animals for each event.
2.6 Identification of duplicate events
For this study, transects where visual and acoustic data were simultaneously collected were retained to identify duplicate events collected by the visual and acoustic platforms. The MRDS analysis is based on the reliable identification of duplicate events between the two platforms. Two events are considered duplicates when the same group of individuals is detected both visually and acoustically. For this purpose, a two-step decision tree (i.e. a rule-based classification system) was elaborated based on a set of temporal and spatial criteria determining how close in time and space a visual and an acoustic event were recorded. A putative duplicate was a pair of events consisting of a visual and an acoustic event to be tested with the decision tree. A putative duplicate became a potential duplicate then a confirmed duplicate when the first and the second step of the decision tree were respectively passed successfully.
2.6.1 1st step of the decision tree: time threshold
The time window in which a pair of visual and acoustic events can originate from the same group of individuals was defined by considering that the two platforms, visual and acoustic, were 400 m apart, had a specific detection radius and were moving at the vessel speed (Figure 3). The visual buffer was defined as the 270°-90° sector scanned by the observers in front of the vessel with a radius calculated as 95% of the distribution of the visual perpendicular distances recorded during the survey (here 2,107 m). The acoustic buffer was a disk centred on the hydrophone array with a radius calculated as 95% of the distribution of the acoustic perpendicular distances recorded during the survey (here 1,266 m).
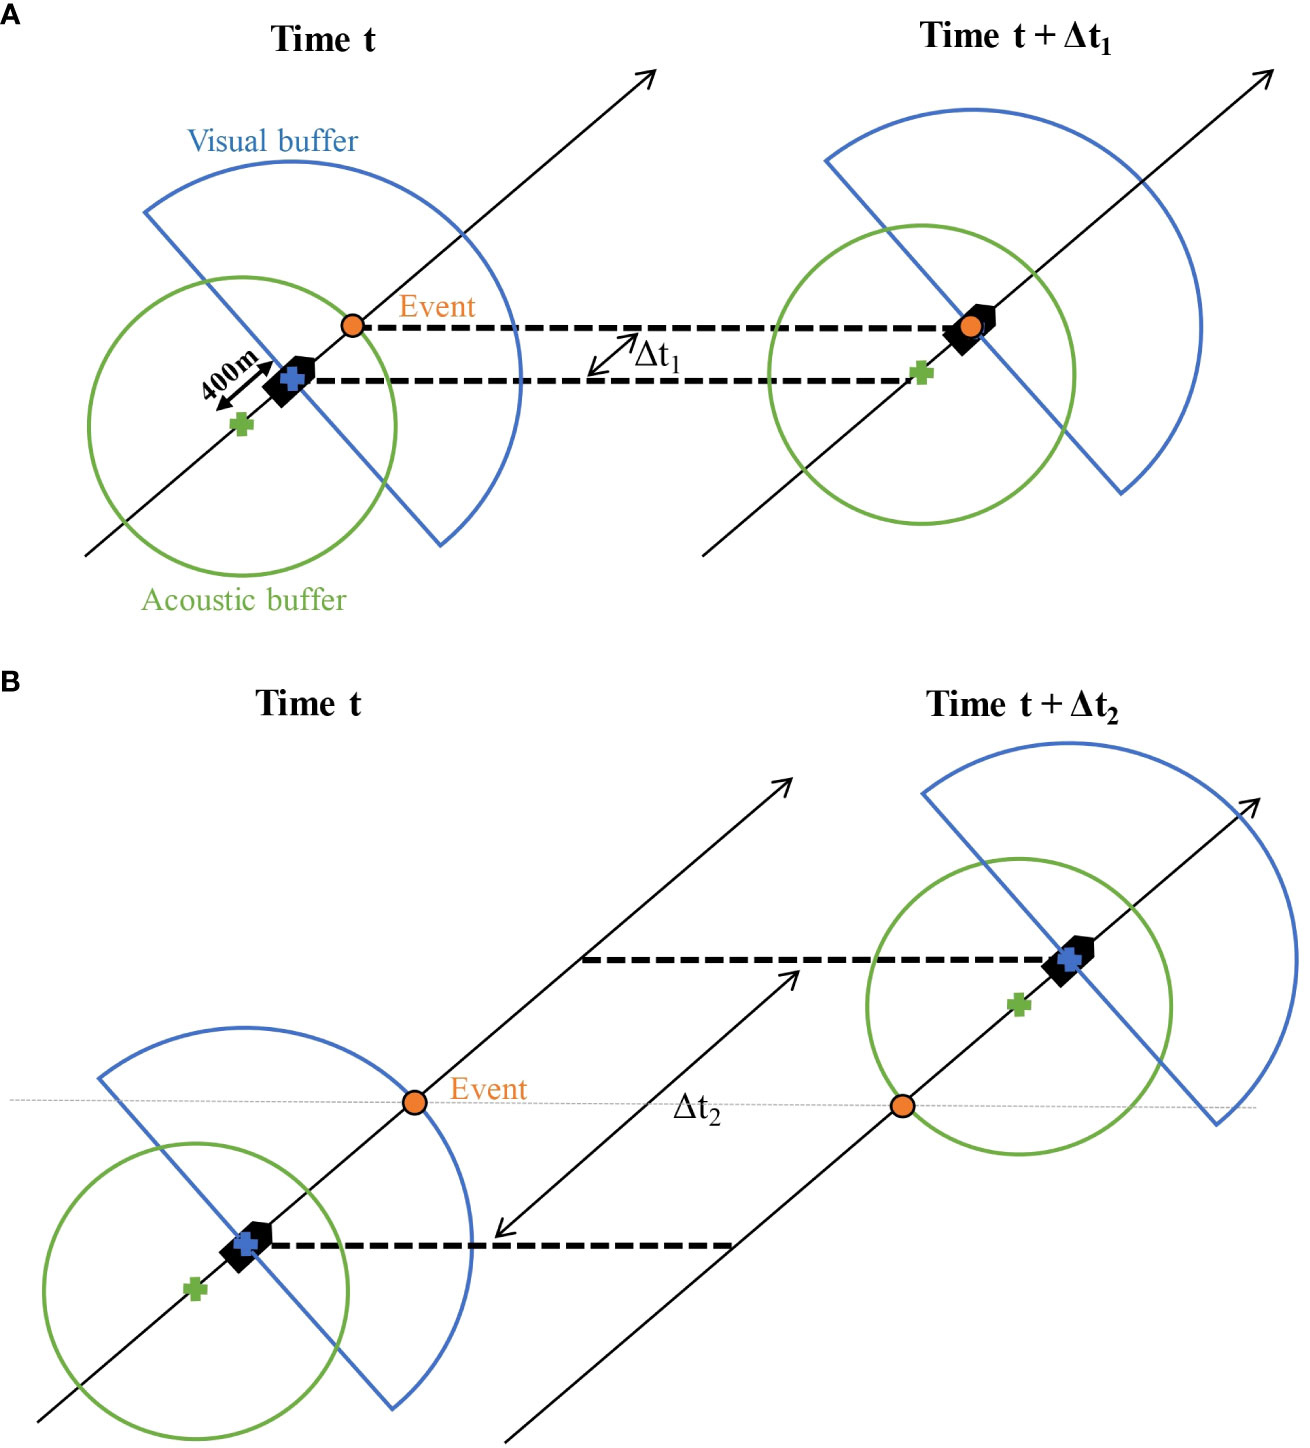
Figure 3 First step of the decision tree: the platform-related time lag or dual. The visual semi-buffer (blue) was centred on the vessel (blue cross) and the acoustic buffer (green) was centred on the hydrophone (green cross). A potential duplicate event was considered if a visual and an acoustic event were close in time (between and ). (A) The minimum time lag would correspond to the same group of small cetaceans being acoustically detected as early as possible by the hydrophone array and visually sighted as late as possible by the onboard observers. (B) The maximum time lag would correspond to the same group of small cetaceans being visually sighted as early as possible by the onboard observers and acoustically detected as late as possible by the hydrophone array. All intermediate situations between A and B would be accepted as potential duplicates.
When a first event was identified by either platform, we calculated the minimum and maximum time lags (Δt1 and Δt2) for an event from the second platform to be identified in the corresponding buffer, assuming that the detected animal was stationary.
The time lag (in s) was determined by:
where is the maximum distance (in m) travelled by the vessel between an acoustic event (vs visual event) and a subsequent visual event (vs acoustic event) forming a putative duplicate. It was estimated as 866 m (1,266 m – 400 m) when the acoustic event came first and 3,773 m (1,266 m + 400 m + 2,107 m) when the visual event came first. Based on an average speed boat of 3.2 m/s (6.2 knots), s and s. Hence any pair of records in which the acoustic event occurs within 271 s before and 1,179 s after the visual event was considered as a potential duplicate.
2.6.2 2nd step of the decision tree: distance threshold
Once potential duplicates have been identified with the temporal criteria related to the platform structure and movement, another threshold was applied to account for the potential movement of the target animal(s) between the two events of the potential duplicate. A mobility buffer was thus estimated based on published values of the routine swimming speeds of small cetaceans. This mobility buffer represented the area centred on the first record of the potential duplicate in which the target animal(s) could be at the time of the second record if they were moving at a routine swimming speed, assuming no responsive movement relative to the vessel. If the location of the second record of a potential duplicate felt within the mobility buffer, the potential duplicate became a confirmed duplicate (Figure 4). The radius of the mobility buffer (in m) was calculated as:
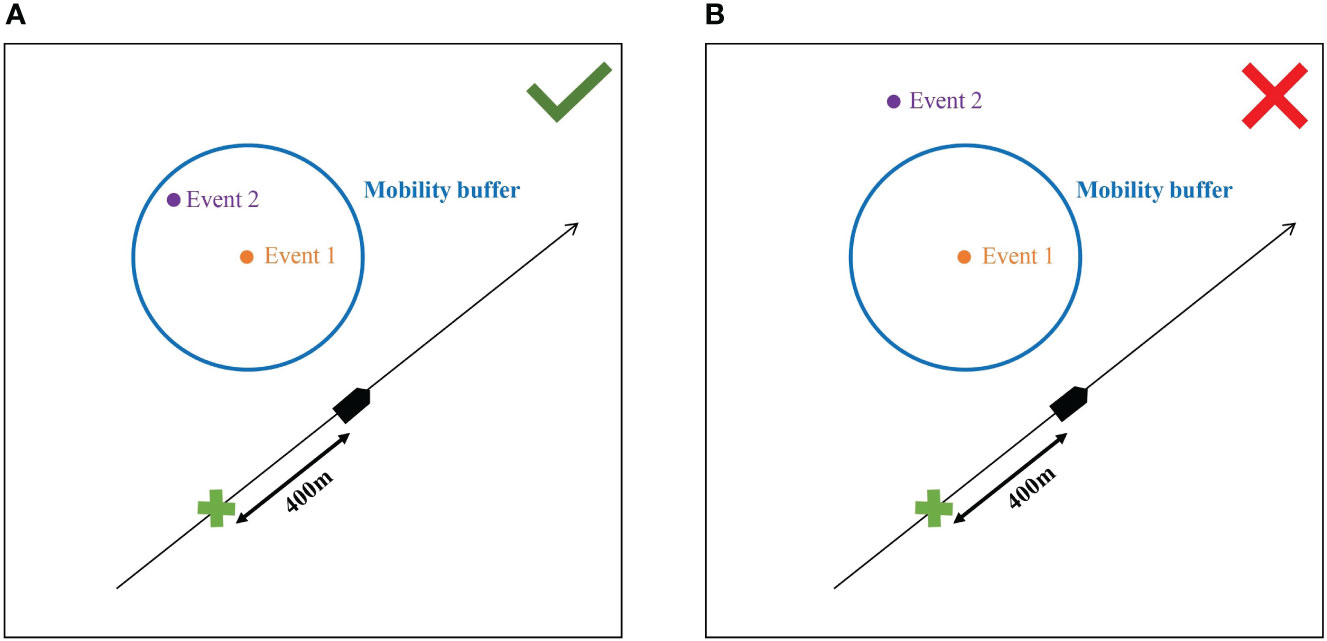
Figure 4 Second step of the decision tree: the animal-movement-related spatial lag or mobility buffer. The black line is the surveyed transect. The hydrophone array (green cross) was located 400 m behind the vessel (black pentagon). The mobility buffer is centred on the first event by either platform (blue circle). The status of confirmed duplicate was accepted when the 2nd event was within the mobility buffer (A). The status of confirmed duplicate was rejected when the 2nd event was outside of the mobility buffer (B).
where was the time lag (in seconds) between a visual and an acoustic event and the routine swimming speed of the animal (in m/s). The routine speed was determined from the literature and the value corresponding to the 95% quantile of the distribution was chosen, i.e. 3.6 m/s (7 knots; Supplementary Table 1; Pilleri and Knuckey, 1969; Saayman et al., 1972; Würsig and Würsig, 1979; Hui, 1987; Tanaka, 1987; Williams et al., 1992; Ridoux et al., 1997; Wood, 1998; Fish and Rohr, 1999; Yazdi et al., 1999). Given the potential left/right ambiguity of the localised acoustic event, we assumed that the acoustic event of a potential duplicate was on the same side as the corresponding visual event.
After passing the two steps of the decision tree, multiple replicate events could be confirmed (e.g. one visual event could correspond to up to three different acoustic events). Among these replicate events, we selected the one with the shortest distance difference to limit the responsive movement of the animal(s) (e.g. if the visual event’s distance was 200 m, and the distances for the three acoustic events were 10 m, 100 m and 1000 m, the acoustic event with a distance of 100 m is chosen). The rest of the replicate events were deleted. In the end, a confirmed duplicate event was finally composed of one visual and one acoustic event. For each duplicate event, we selected the highest “best” group size estimate and the larger distance value between the visual and acoustic event.
2.7 Detection function and effective strip width
The detection function and g(0) were calculated using data from both visual and acoustic platforms using the MRDS method (Laake and Borchers, 2004). Events from each platform were set as trials for the other. If events of the same group of animals were made by both platforms (confirmed duplicate, see above), they were considered successful, if not, they were considered failed. There are two possible assumptions in MRDS (Burt et al., 2014): full independence (FI) or point independence (PI). The FI assumption considers the two platforms to be independent at any distance and thus a mark-recapture (MR) model is applied at all distances (including distance zero) to estimate the overall detection probability p. It appears this assumption generates negative biases in abundance estimates in case of failure of the independence assumption (Laake et al., 2011; Burt et al., 2014). The failure can be identified if the abundance estimate is lower than the abundance estimates from the CDS, resulting in the presence of heterogeneity in detection probabilities which generates biases in abundance estimates (Buckland et al., 2010). Attempts have been made to minimise the unmodelled heterogeneity for example by including the effect of covariates in the detection function (Borchers et al., 1998; Laake and Borchers, 2004). To provide a solution to the problem of unmodelled heterogeneity, the concept of PI assumption was introduced by Laake (1999). The PI assumption considers the two platforms to be independent only at distance zero and reduces the impact of unmodeled heterogeneity on detection probability estimates (Buckland et al., 2010). The PI assumption uses a combination of MR and DS submodels. The MR submodel is used to estimate g(0), while the DS submodel is used to estimate the decrease in detectability with distance, and these two are combined to get the overall detection probability p (Burt et al., 2014). In our study, the visual and acoustic platforms were beforehand considered independent but we did not know if this independency was valid for all distances or only at distance zero, so we tested MRDS models with both FI and PI assumptions. Factors affecting the detectability for both platforms were investigated and included in the model to improve precision (Marques and Buckland, 2003; Buckland et al., 2004). We wanted to assess the effect of the platform on the detectability, so the platform was included as a covariate in all tested models. We also tested the effect of the sea state (0, 1, 2, 3, 4 Beaufort scale) as well as wave and swell height (values in metres grouped into classes: 0 to 0.5 m, 0.6 to 1 m, 1.1 to 1.5 m and 1.6 to 2 m). Single covariates and combinations of two covariates were tested. For the DS model, we tested models with a hazard-rate (HR) and a half-normal (HN) key functions and with or without covariates. The right truncation distance was set at 1,500 m, based on the inspection of the histogram of detection frequencies plotted against distances from the transect line (Buckland et al., 2001). Only segments conducted with good conditions (i.e. Beaufort sea state 4) were considered in the analysis. The decision was made to exclusively focus on Beaufort sea state due to the fact that visibility, swell and wave height are highly subjective metrics. We tested all models with FI and PI assumptions, with HR and HN key functions for the DS submodel, and combinations of covariates. The Akaike Information Criterion (AIC, Akaike, 1998) and the goodness of fit were used to select the best model fit for each key function. The MRDS analyses were performed in R 4.0.3 using the mrds package (Laake et al., 2013). Finally, to estimate the ESW, the overall detection probability was multiplied by the truncation distance (Buckland et al., 2004).
2.8 Sensitivity analysis of the decision tree
Correctly classifying events as unique or duplicate is a critical step in MRDS analysis (Hamilton et al., 2018). We investigated the effect of the thresholds considered in the two-step decision tree on the number of duplicates and on the detection probability. We tested different values of the distance distribution used to set the visual and acoustic buffers in the first step of the decision tree: 70%, 80%, 90%, and 100% based on a fixed value of the routine swimming speed, which was 3.6 m/s (7 knots). For the second step of the decision tree, different routine speeds were found in the literature, ranging from 1.6 to 4.2 m/s (3.1 and 8.2 knots). We analysed the effect of the routine speed by testing different values: 1.60, 2.25, 2.90, 3.55 and 4.20 m/s (3.11, 4.37, 5.64, 6.90, 7.00, 8.16 knots) with a fixed value of the distance distribution of 95%. For each value of the distance distribution and the routine speed, the number of duplicate events and g(0) were estimated, as well as the overall detection probability using half-normal and hazard-rate key functions. This sensitivity analysis allowed comparison of the number of duplicate events and detection probability estimates obtained to assess the effect of using of the values in the decision tree.
3 Results
3.1 Summary of survey data
Transects where acoustic and visual data were simultaneously collected in good conditions (when Beaufort sea state ≤ 4) totalled 6,679 km of effort (Figure 1). The lengths and average speed of surveyed transects for each survey block are given in Supplementary Table 2. A total of 108 visual and 122 acoustic events of small cetaceans were identified. Species identification based on the visual survey component is shown in Table 2. The striped dolphin was the most frequently observed species and represented 52.8% of the total visual events. The second most observed species was the short-beaked common dolphin (11.1%) followed by the bottlenose dolphin (4.6%). The Risso’s dolphin (2.8%), the long-finned pilot whale (0.9%), and the rough-toothed dolphin (0.9%) were occasionally observed during the survey. About a quarter of the visual events could not be identified to the level of species (26.9%). The estimated “best” group size was higher in visual events 9.9 14.0 individuals than in acoustic events 3.8 1.5 individuals.
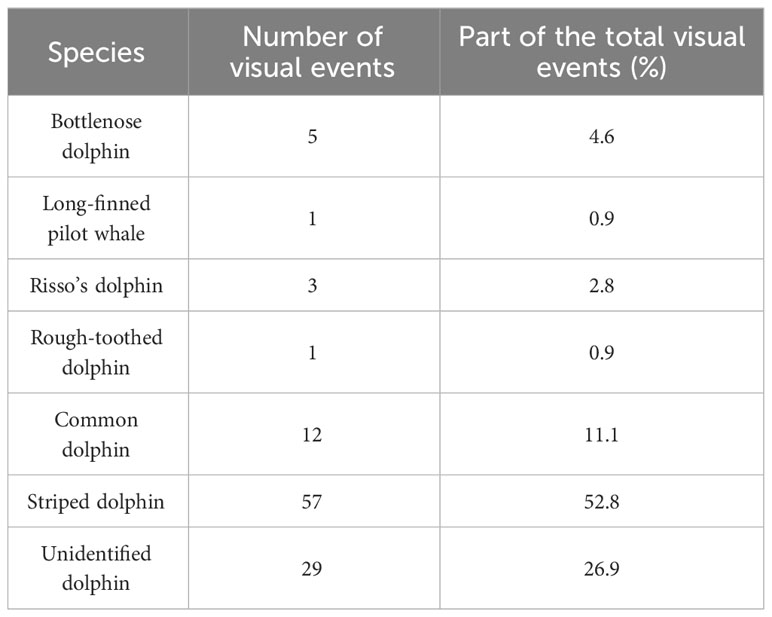
Table 2 Number of visual events for each studied species.
3.2 Matching visual and acoustic events
A total of 87 potential duplicates were identified after the first temporal threshold was applied, reducing to 44 confirmed duplicates after applying the second spatial threshold. By selecting a single visual and acoustic event for each match, we finally obtained 30 unique duplicate events, which represent 16% of the total events. The visual platform recorded 77 events that the acoustic platform did not. Conversely, 79 events were identified by the acoustic platform only. Among the duplicate events, the species most observed by the visual platform was the striped dolphin (56.7%) followed by the common dolphin (16.7%) and unidentified dolphins (13.3%). Not surprisingly, bottlenose (6.7%), Risso’s (3.3%) and rough-toothed (3.3%) dolphins were rarely seen in the duplicate events. Under the assumption that unidentified dolphins have the same species composition as the identified dolphins, about 63% of the duplicate events would be striped dolphins.
3.3 Estimation of the detection probability
A truncation distance was set at 1,500 m, which removed 10 unique visual, 2 unique acoustic and 2 duplicate events, representing 7.5% of the total events (Figure 5). Thus, in total, 67 unique visual, 77 unique acoustic and 28 duplicate events were used to fit the detection function in the MRDS method.
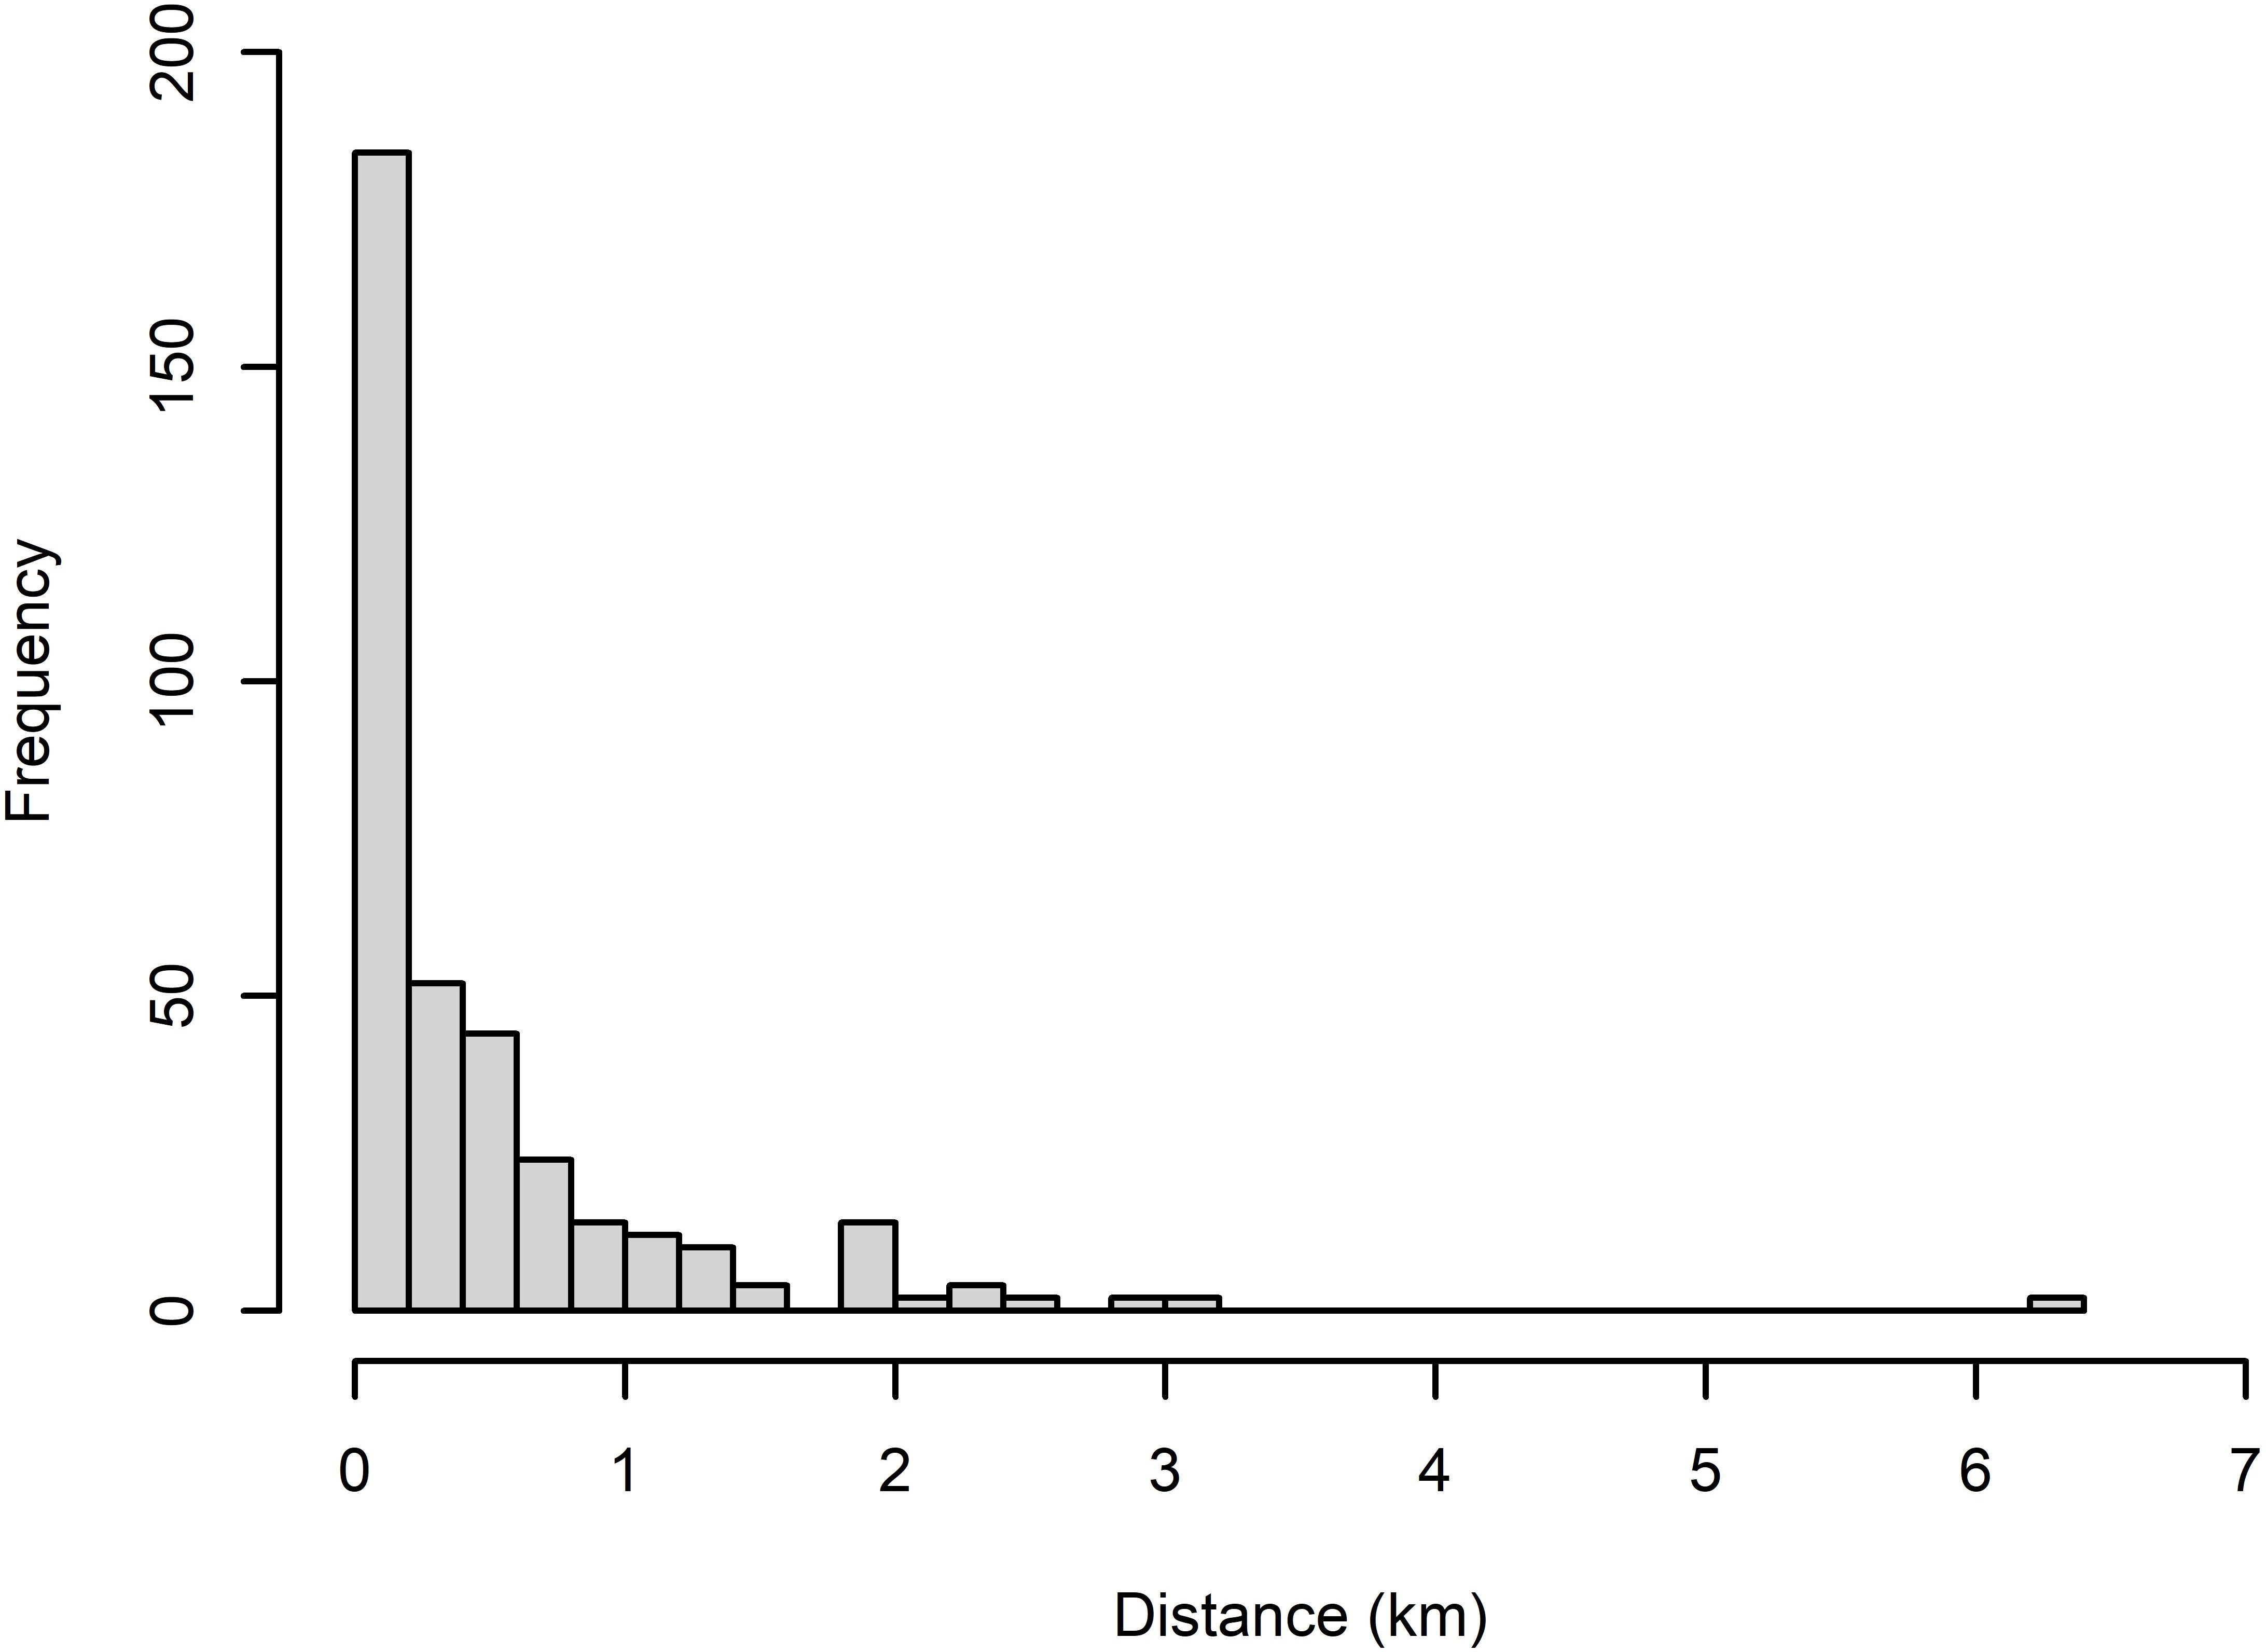
Figure 5 Perpendicular distance (km) frequency distributions for small cetaceans identified by the R/V Song of the Whale either with the visual or acoustic platforms.
Based on the AIC and the goodness of fit, the PI model with a HR key function was the best model (Supplementary Figure 1 and Supplementary Table 3). The MR submodel included perpendicular distance, swell height and platform as covariates. The DS submodel with the HR key function included sea state only. However, the model did not appear to fit the data well and overestimated detectability close to the transect line (Figure 6). Although the fit of the PI model with a HN key function was not optimal, it had a better fit to the data (Figure 6) and could therefore be considered as a more conservative model for estimating detection probabilities.
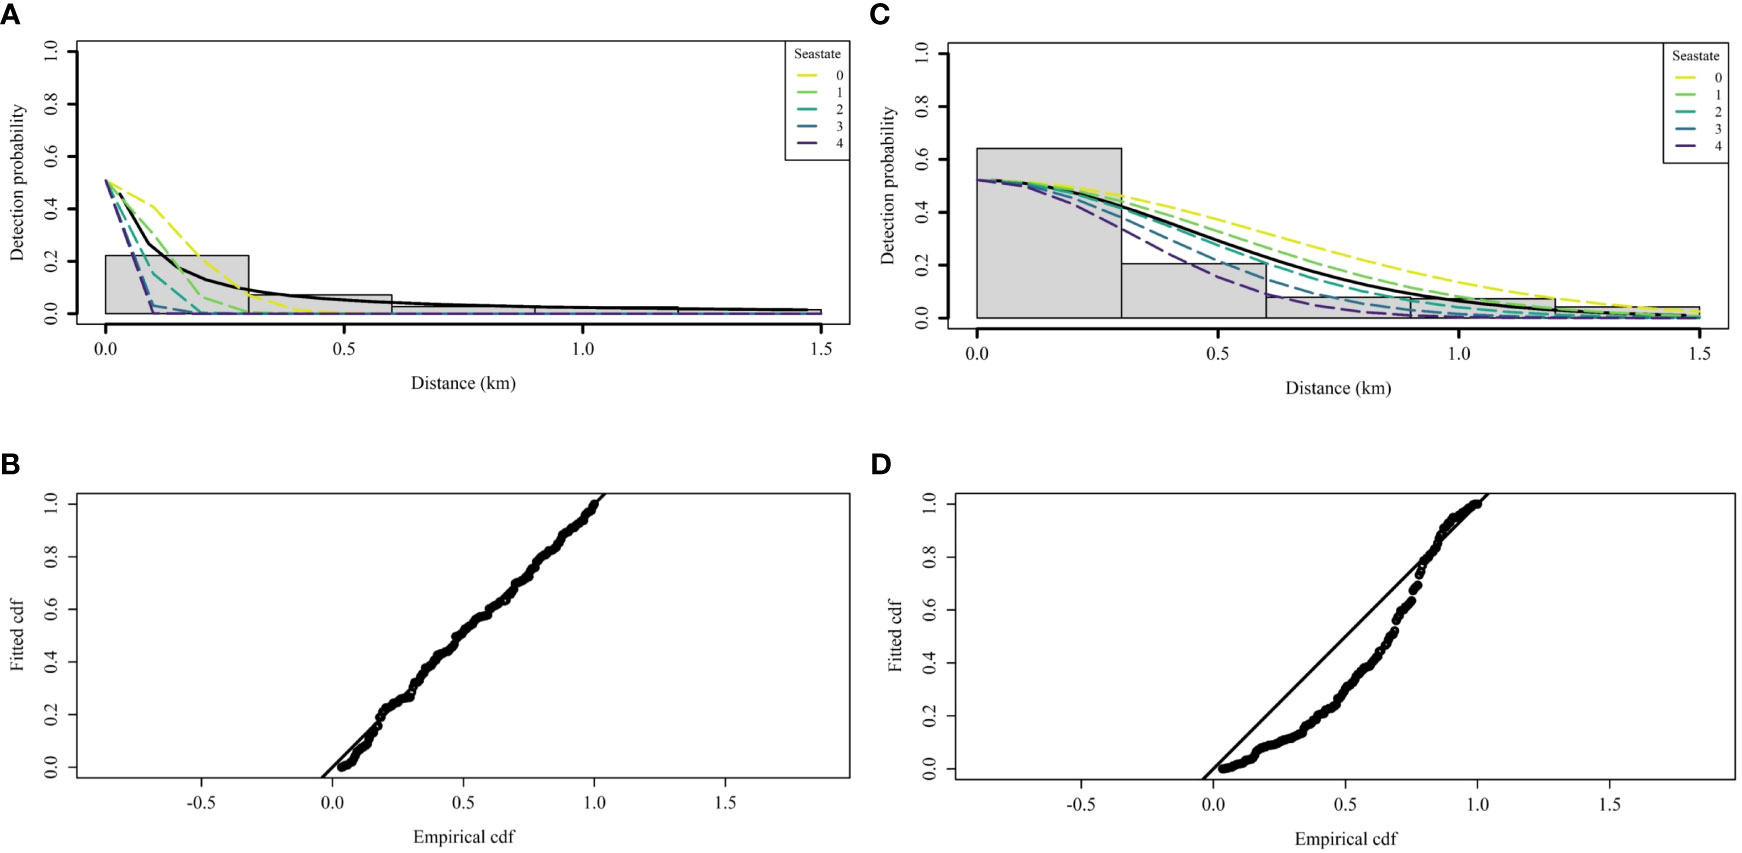
Figure 6 Fitted detection function of the best model with a hazard-rate key function (A) with the associated goodness of fit (B) and with a half-normal key function (C) with the associated goodness of fit (D). The selected model is a point-independence model with an MR submodel including the covariate platform and a DS submodel including the covariate sea state. Each line represents the fitted detection function for each class of the sea state covariate.
For both key functions, all parameters of the detection function were negative (Table 3), such that the detection probability decreased with increasing perpendicular distance from the transect, swell height and sea state (the further away from the vessel and the worse the conditions, the more difficult it is to detect the animals). However, g(0) was fixed in all conditions. The detection probability in the MR submodel was slightly higher with the acoustic platform than with the visual platform (parameter estimate for the visual platform equal to -0.14), but the standard error (SE) was high relative to the parameter estimate, so the effect of the platform was marginal (Table 3) which means their effect on the detectability of small cetaceans was negligible. In contrast, the SE was low for the distance and swell height covariate in the MR submodel and for the sea state in the DS submodel (Table 3). These results highlighted the strong effect these covariates have on the detectability of small cetaceans on the transect line.
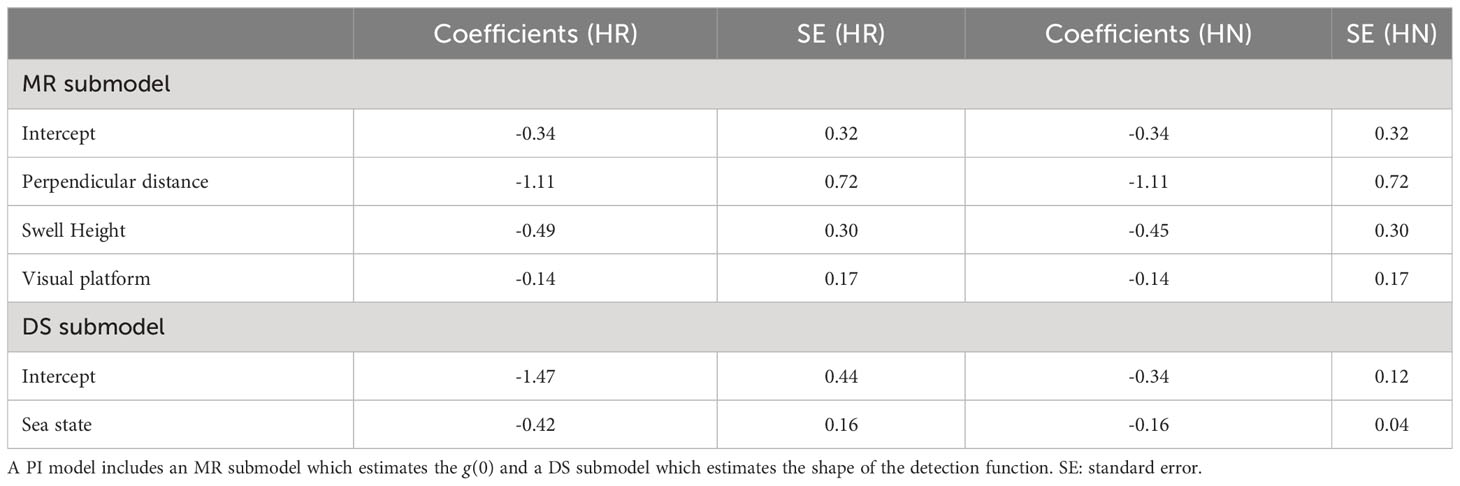
Table 3 Coefficients and standard errors estimated in the PI model with a hazard-rate key function (HR) and a half-normal key function (HN).
The number of events identified by the visual and acoustic platforms did not differ greatly and duplicate events occurred mainly within 500 m of the transect line. However, the acoustic platform detected more events on the transect line and at a greater distance (Figure 7). Indeed, the g(0) was slightly higher for the acoustic platform from 0.32 (CV = 25.1%) to 0.33 (CV = 23.2%) depending of the key function (Table 4). The g(0) of the visual platform was estimated between 0.29 (CV= 25.6%) and 0.30 (CV = 23.8%). Finally, by using combined platforms, we obtained a g(0) of 0.52 (CV = 19.8%) with the HR key function and 0.51 (CV = 21.7%) with a HN key function. The use of the key function had a large effect on the overall detection probability estimations and therefore on the ESW. It was estimated to 0.07 (CV = 28.9%) and 105 m for the HR key function and 0.21 (CV = 20.3%) and 315 m for the HN key function respectively.
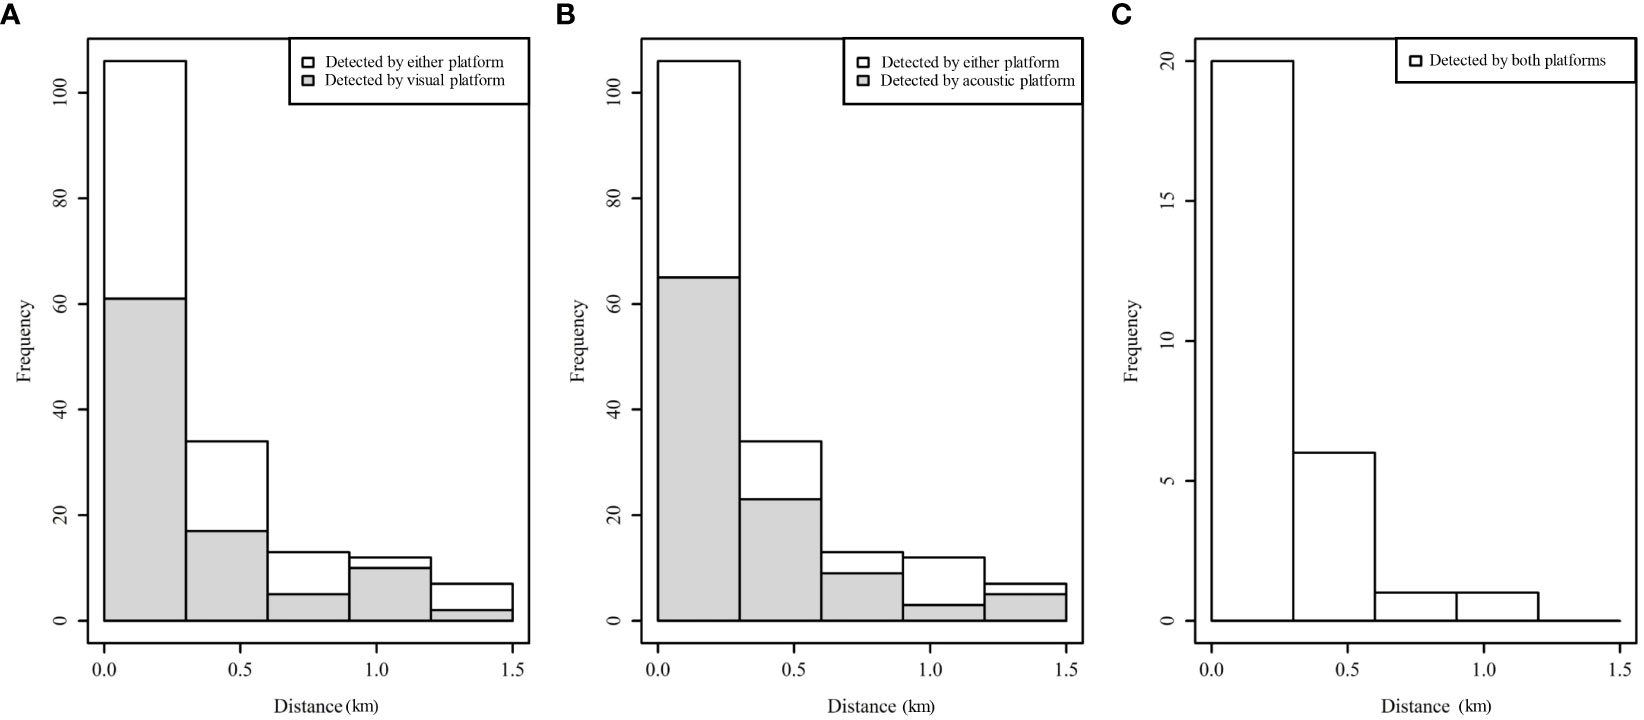
Figure 7 Histograms of distances for detections by either platform with the shaded regions show the number for visual platform (A) and for acoustic platform (B). Detections recorded by both platforms are shown in (C).
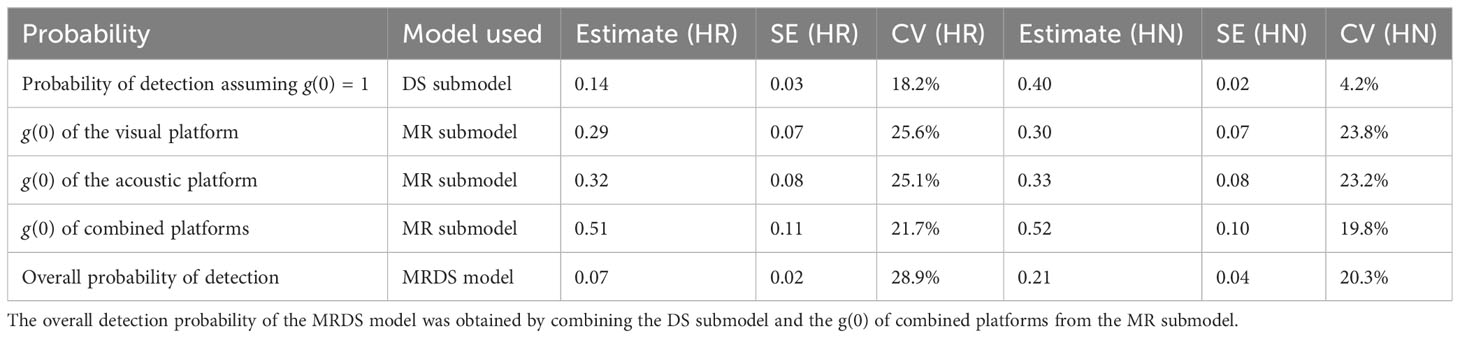
Table 4 Detection probabilities obtained from the MRDS model with a hazard-rate key function (HR) and a half-normal key function (HN).
If detection biases were not accounted for, i.e. assuming g(0) = 1, the estimated overall detection probability and ESW would be 0.14 and 210 m respectively for the HR key function and 0.40 and 600 m for the HN key function.
The sensitivity analysis explored the effect of using different values of the distance distribution and routine swimming speed on the number of duplicate events and the detection probability estimates (Figure 8 and Supplementary Tables 4, 5). With a distance distribution ranging from 70 to 100% and a routine speed ranging from 1.6 to 4.2 m/s (3.1 to 8.2 knots), the number of duplicate events increases from 14 to 35 and 3 to 37 respectively. Both g(0) and the overall detection probability became stable for both models from 70% of the distance distribution. On the contrary, g(0) continuously increased as the routine speed increased, and overall probability detection increased more slowly for both models.
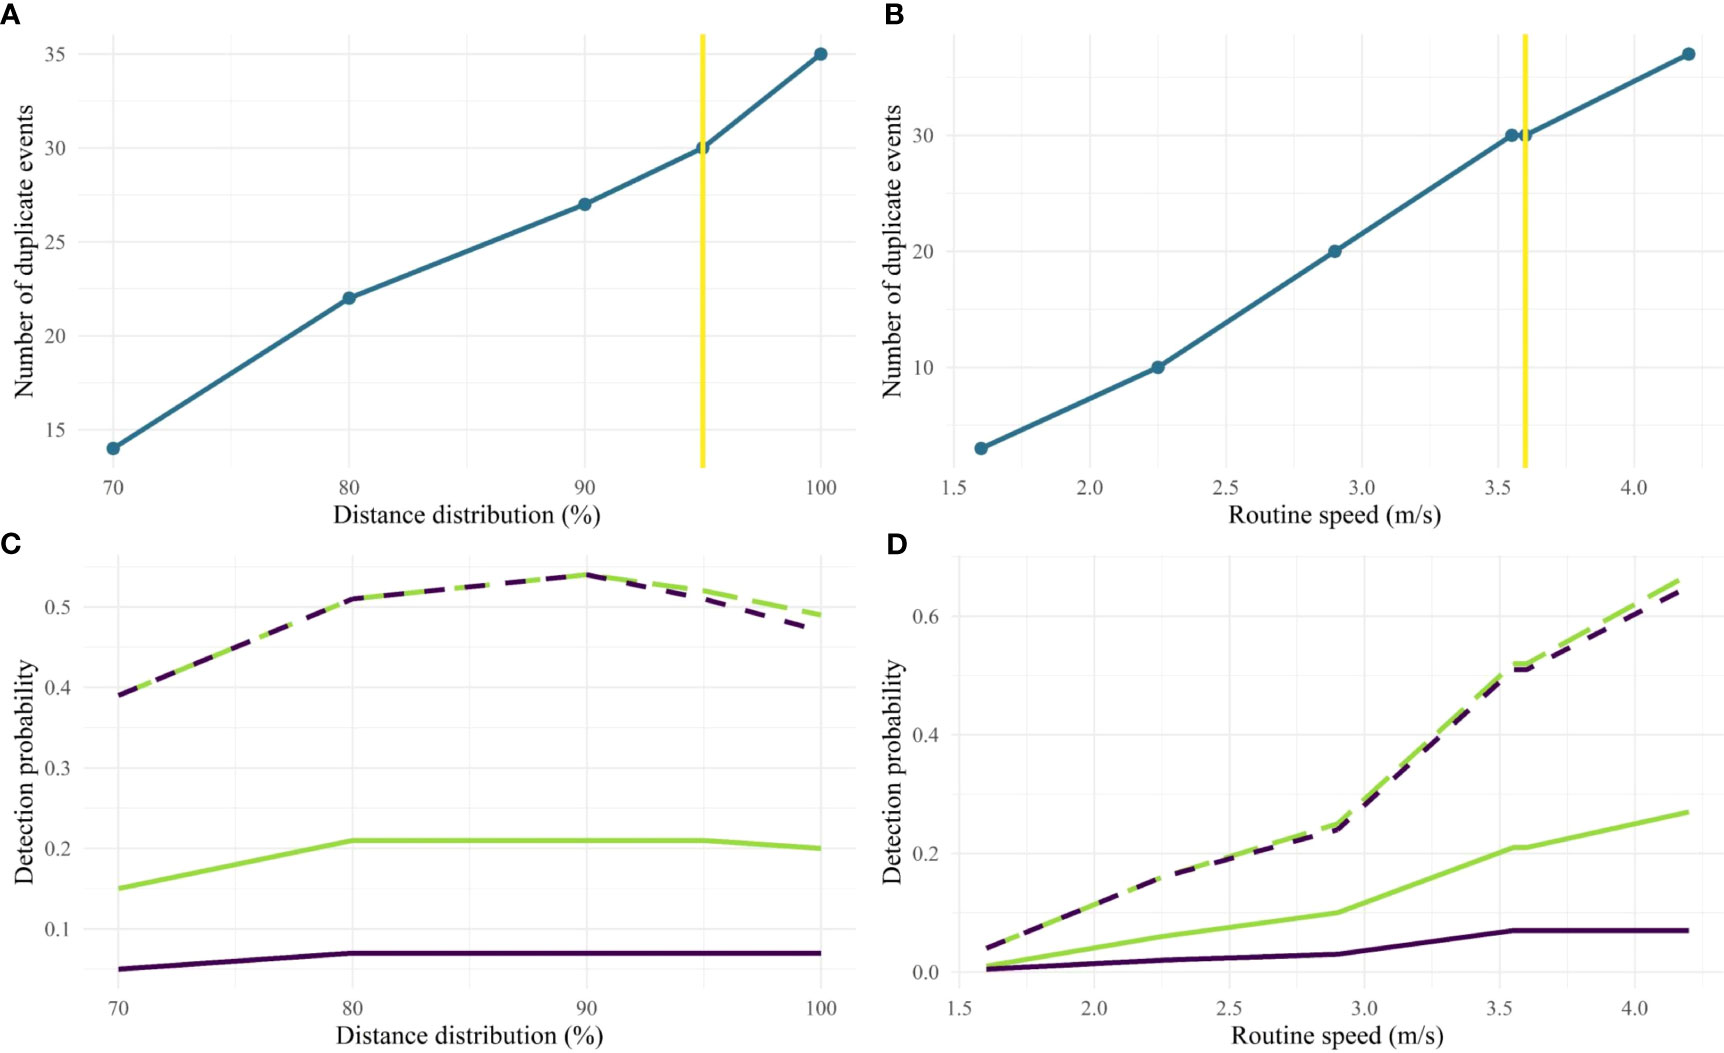
Figure 8 Sensitivity analysis of the two-step decision tree. The variation of the number of duplicates was explored with different values of the distance distribution (A) and the routine speed (B). The vertical yellow line indicates the chosen value for this study. The overall detection probability (solid line) and g(0) (dashed line) were estimated for each value of the distance distribution (C) and the routine speed (D). The green and purple lines represent the models used with a half-normal and a hazard-rate key function respectively.
4 Discussion
The objectives of our study were to develop a method to match visual and acoustic events and to estimate the detection probability of small cetaceans accounting for detection biases. Visual and acoustic data were collected simultaneously using a visual-acoustic dual platform in a distance sampling framework. Most studies estimate the detection probability by assuming g(0) is equal to 1 with a single platform (Barlow, 2006; Øien, 2009; Dick and Hines, 2011; Hildebrand et al., 2015). To account for detection biases in abundance estimates, g(0) needs to be estimated. The benefit of using a dual visual-acoustic platform is to quantify the proportion of missed events to estimate g(0) and thus to correctly calculate the detection probability. To do so, we first developed a method to identify duplicate events by taking the movements of the vessel and of the animal(s) into account. Then, we estimated the detection probability through an MRDS analysis by including covariates that can affect the detection.
4.1 Methodological considerations
4.1.1 Responsive movement
Performing distance sampling analysis assumes that animals are moving slower than the speed of the survey platform and are detected before any responsive movement related to the presence of the vessel, which requires detecting animals ahead of the vessel (Buckland et al., 2001). The effect of responsive movement on the detection function can be corrected by using two independent visual teams on the same vessel where one searches further ahead to detect animals before they respond (Borchers et al., 1998). When the second platform is an acoustic platform, it is more complex to account for responsive movement since small cetaceans are less easy to track with acoustic methods. For example, when they move away, they no longer face the hydrophone and may be less available for detection. Among the species studied, the three most commonly seen species were striped, common and bottlenose dolphin. These species are known to be attracted to the bow of vessels (Würsig, 2018). To reduce the bias due to responsive movement, we first assumed a minimal attraction or avoidance effect from the boat because the R/V Song of the Whale is a quiet research vessel designed for this purpose. Second, the responsive movement was partially taken into account in the identification of the duplicate events by setting a mobility buffer based on an average cetacean routine swimming speed. Field observations during the ASI surveys suggested the use of routine speed was appropriate for assessing responsive movement as animals were rarely observed ‘racing’ towards the research vessel. Additionally, a single distance was required for each duplicate event. The distance selected between the matching visual and acoustic events was chosen according to the first event that was detected. In general, animals were first detected visually in front of the boat and then later by the hydrophone towed 400 m behind the boat. By choosing the distance of the first detected event, we minimised the influence of any reactive motion and this partially addressed the responsive movement problem. Martin et al. (2020) assessed responsive movement based on animal orientation and behaviour information based on visual data. They also set the trial configuration (one platform is informed about detections of the other platform) and chose the FI assumption in their model to partially address the responsive movement issue (Laake and Borchers, 2004; Burt et al., 2014). They recommended that responsive movement be properly considered in future vessel-based surveys for abundance assessments. Although responsive movement is difficult to assess and avoid, we believe that taking a mobility buffer into account partially addressed the issue of responsive movement in the MRDS analysis with two independent platforms.
4.1.2 Duplicate events
The number of duplicate events plays an important role in the MRDS analysis when estimating detection probability (Evans and Hammond, 2004; Hamilton et al., 2018). Classifying unique events as duplicates will lead to an underestimation of the detection probability. In the opposite way, classifying duplicate events as unique events would result in an overestimation of the detection probability (Evans and Hammond, 2004). In the present study, only 16% of the total events were confirmed duplicates, while in other studies, they represent more than 30% of total events (35%, Dalpaz et al., 2021; 30%, Rankin et al., 2020; 48%, Richman et al., 2014). We tested the decision tree with different values of the distance distribution in the first step and the routine speed in the second step. The distance distribution was based on the data and was not an arbitrary threshold. Changing the value of the distribution did not have a great impact on detection probabilities, particularly from 80% to 100%, and this can be explained by the truncation distance value set at 1,500 m. As for the routine speed chosen from values between 1.6 and 4.2 m/s (3.1 and 8.2 knots) found in the literature, it was an arbitrary threshold. The effect of varying this speed on detection probabilities was not negligible: the higher the routine speed, the higher the number of duplicate events and detection probabilities. By choosing the 95% quantile of the swimming speed distribution, i.e. 3.6 m/s (7 knots), we lost 7 duplicate events, which was not insignificant. The choice of a higher speed would probably correspond to an attraction or repulsion movement relative to the vessel, but we were unable to determine whether the animals detected were being attracted or repelled or not. It seemed more appropriate to consider a routine swimming speed, with the aim of including all motivational states, including travelling, socialising, resting and foraging. Our number of duplicate events seemed low compared to other studies, but the approach used to identify duplicates was different from that of other studies. Dalpaz et al. (2021) used a decision tree based on three criteria: (1) less than 30 min between events, (2) less than 6 km between events and (3) taxonomic compatibility between detections of Delphinidae and Ziphiidae. Rankin et al. (2020) identified visual and acoustic detections of rough-toothed dolphins as duplicates when both detections occurred in a close range. However, the authors did not explain in detail how they matched the detections and how “close” was defined. Richman et al. (2014) studied detectability of Ganges River dolphins and used a distance threshold between a visual and an acoustic detection to identify duplicates. They found the value of the distance threshold based on visual inspection of the frequency distribution of number of matched detections over distance; which was 249 m for a single animal and 349 m for a group of more than one animal. In open ocean habitats, such as in our study, hydrophones are towed as far back as possible to avoid self-boat noise. The delay between a visual sighting from in front of the vessel and the subsequent detection of the animal by the hydrophone to the rear of the vessel can be relatively long. As small cetaceans are highly mobile species, it is necessary to take their movement into account during this time. Although routine speed remains a sensitive parameter for the decision tree, the application of the mobility buffer still reduced the number of duplicate events identified by the time buffer by half, which can be considered very restrictive. However, it allowed to identify with more certainty the potentially true duplicate events, reducing the risk of false duplicates.
4.2 Detectability of small cetaceans
4.2.1 Detection process
During the survey and the analytical stage, a consistent protocol was implemented to define distinct events. However, the performance of the models tested was not perfect, as either the goodness of fit was good but the model did not seem to fit the data, or the opposite was observed. The detection function using the HR key function was unable to accurately describe the data observed close to the transect line due to a poor fit at low perpendicular distances. This indicates a possible problem associated with the detection process. Accurate distance estimation can be an issue in visual surveys (Marques et al., 2006). In this study, radial distances were estimated by naked eyes without tools, which may bias perpendicular distance estimates. For a small vessel with a low platform like the R/V Song of the Whale, the use of reticule binoculars or photogrammetry is complex (Leaper et al., 2023). Observers during the ASI survey had varying levels of field experience and identification skills. Thus, using the photogrammetry or reticules might have been counter-productive if being used by novice observers. Laser rangefinders can be a useful tool but only under optimal sea state conditions to avoid waves interfering with the laser and/or the motion of the vessel making reliable range-finding challenging. All of these methods would also result in a biased distance estimate. With distance estimation training conducted prior to the survey, naked eye measurements appeared to be the best approach in these conditions.
4.2.2 Group size estimation
During a survey, detectability between individuals may vary for multiple reasons; some animals may surface/vocalize more than others, or some may be more detectable in specific habitats such as shallow or deep waters. Due to this variability, each individual, species or population should have its own detection probability. However, some variables that influence the detection probability cannot be observed, which corresponds to unmodelled heterogeneity and therefore does not allow a reliable estimation of detection probability and abundance (Buckland et al., 2004; Buckland et al., 2015). The first source of unmodelled heterogeneity could be related to group size estimation. Estimating group size is complex in visual and even more so in acoustic studies because animals are moving and an unknown fraction of the group might be underwater or silent at any given time (Gerrodette et al., 2019). In visual surveys, estimating the group size of a large school of active dolphins is a difficult task and the estimates can vary considerably between observers (Gerrodette et al., 2002). The average group size was estimated to be 10 individuals in this study, which was consistent with other studies averaging between 4 and 30 individuals (Notarbartolo di Sciara et al., 1993; Bearzi et al., 2003; Cañadas and Hammond, 2008; Boisseau et al., 2010; Notarbartolo di Sciara and Tonay, 2021) in the Mediterranean, although larger aggregations are known (Watkins et al., 1987; Boisseau et al., 2010; Notarbartolo di Sciara and Tonay, 2021). In acoustic surveys, group size cannot be estimated directly during surveys and most studies use visual events to determine group size of the acoustic events (Barlow & Taylor, 2005; Pirotta et al., 2015). Another approach is to use cue counting to estimate the density of cues that animals produce, such as calls, that can be converted into animal density using the cue production rate of the species (Marques et al., 2009). In our study, we used overlapping clicks trains as an indicator of the number of acoustically active individuals in the group and to estimate the acoustic group size for each event, following Thomas and Marques (2012). With our methodology, the estimated visual group size was approximately three times higher than the acoustic group size. Such a discrepancy between the visual and acoustic group size suggests that the latter was underestimated. The first assumption suggests that our recordings may have captured only a subset of the group, namely those animals that were echolocating. The second assumption is that we counted individuals moving from the front of the boat to the back, and that all the animals in a group were probably not moving in the same way toward the hydrophone, so that only part of the group was detected and counted, the others having moved away or not in the direction of the hydrophone. The third assumption is a mixture of the two, implying that disentangling availability bias and perception bias from the acoustic method is difficult. Due to probably incorrect estimates of the acoustic group size, we did not include this covariate in the model and the remaining unmodelled heterogeneity can lead to a potential overestimation of the detection probability (Borchers et al., 2006; Burt et al., 2014). With further studies of vocalization rates, it may be possible to scale up the underestimation of acoustic group size, but currently we do not have enough meaningful data on vocal rates for small odontocetes in the Mediterranean Sea.
4.2.3 Pooling species
Pooling species with different behaviours may be another source of unmodelled heterogeneity in detection probability. Indeed, small cetaceans show different group sizes, dive durations, vocalization rates or preferred habitats. For example, the three most observed species in the Mediterranean Sea are distributed differently. The bottlenose dolphin mostly lives on the continental shelf (Bearzi et al., 2009; Cañadas et al., in review), while the striped dolphin is an oceanic species that is usually found in open waters (Cañadas et al., in review; Notarbartolo di Sciara and Tonay, 2021). The common dolphin can be observed in both inshore and offshore waters (Bearzi et al., 2003). By grouping species together, the variation in species occurrence and distribution within a study area would not be significant if the detectability across species were equal. In acoustic studies, the common spectral features of the studied species and the characteristics of clicks (i.e. directionality, high-frequency) contribute to click variability and complexity in classification. Although ongoing research opens avenues for improved classification (Oswald et al., 2003; Soldevilla et al., 2008; Bittle and Duncan, 2013; Pedersen et al., 2021), species identification from echolocation clicks remains limited and we had to pool the different species. By grouping all species together, a single detection function was fitted for species. However, the striped dolphin is a dominant species in the Mediterranean, where our study detected over 63% and Panigada et al., (in review) detected over 85% in an aerial line-transect survey. Pooling species is a common practice in aerial line-transect survey where some species were merged (striped dolphin/common dolphin; ACCOBAMS, 2021). As striped dolphins were highly dominant in the study area, the problem of pooling species would be reduced.
4.3 Comparison of g(0) estimation with other studies
Despite the main limitations of this study, our results were statistically accurate, as shown by reasonably low CVs (20-27%), and were consistent with other studies, especially for the visual platform. Rankin et al. (2020) estimated g(0) at 0.37 and 0.77 for the visual and acoustic platforms respectively and 0.84 with the combined platforms for rough-toothed dolphins. The g(0) for the visual platform was similar to our results (0.29, CV = 25.7% and 0.30, CV = 23.8%). For acoustics, our results were lower (0.32, CV = 25.1% and 0.33, CV = 23.2%) but Rankin et al. (2020) also included other vocalizations such as whistles and burst-pulses (Rankin et al., 2020), which resulted in a higher number of acoustic events and thus a higher estimate of g(0). Additionally, echolocation clicks are highly directional and therefore if the animals are too far away or off-axis of the hydrophone, the detection probability decreases sharply (Au et al., 2012; Finneran et al., 2014), which could partly explain the low estimate of g(0) from the acoustic platform in our study. Although the appropriate data are lacking for the Mediterranean, it is possible that small odontocetes are more vocal when submerged, as is typically the case for larger odontocete species including sperm whale and Cuvier’s beaked whale (Akamatsu et al., 2001). This situation would preclude exact duplicates to occur. However, since dolphins can switch between the two conditions in a matter of a few seconds, and the time window for potential duplicates was within 271 s before and 1,179 s after the visual event, this left ample time for duplicates to be recorded if the individual was acoustically active during this time interval. Therefore, these methods appeared to be complementary and, as expected, we obtained a higher detection probability by combining both platforms (Laake et al., 2011; Rankin et al., 2020).
4.4 Implication for cetacean conservation
In this study, we highlight the importance of using a visual-acoustic dual platform in multispecies line transect surveys to estimate the detection probabilities of small cetaceans with consideration of detection biases, which have a major effect on the detection probability estimates. While recognising that most cetacean conservation programs use minimal abundance estimates (Evans and Hammond, 2004), we emphasise an unbiased abundance estimate to provide a better approach to assessing the sustainability of cetaceans in the face of anthropogenic mortalities. Based on our estimates of g(0) and p, if we were to estimate cetacean abundance in the Mediterranean Sea without correcting for detection biases, this would be underestimated by a factor of two when using both acoustic and visual data for either model (HR and HN key functions). In order to estimate the abundance of small cetaceans from the ASI vessel survey, it would be necessary to consider all transects, i.e. acoustic, visual and combined transects to ensure uniform coverage. A homogeneous distribution of dual platform effort over the study area would be recommended to avoid spatial bias (over-representation of a habitat or species) which could then affect the g(0) estimate. Further research is needed to estimate small cetacean abundance from a visual-acoustic dual platform in the Mediterranean Basin.
Data availability statement
The original contributions presented in the study are included in the article/Supplementary Material. Further inquiries can be directed to the corresponding author.
Author contributions
The present work was designed by CO, AV and VR. OB provided the data. CO and IS developed the decision tree and conducted the analyses. CO wrote the manuscript. All revisions were done by OB, VR and AV. All authors contributed to the article and approved the submitted version.
Funding
This research was funded by the National Center for Scientific Research, we would like to thank them for financing the thesis project of which this present work is a part.
Acknowledgments
We would like to thank ACCOBAMS and their technical and financial partners for making this survey possible. We thank the following scientists for their help with our project: Charlotte Lambert, Mathieu Genu and Sophie Laran, A deep thanks to the University of St Andrews for hosting the Distance sampling workshop and for kindly answering our questions.
Conflict of interest
The authors declare that the research was conducted in the absence of any commercial or financial relationships that could be construed as a potential conflict of interest.
Publisher’s note
All claims expressed in this article are solely those of the authors and do not necessarily represent those of their affiliated organizations, or those of the publisher, the editors and the reviewers. Any product that may be evaluated in this article, or claim that may be made by its manufacturer, is not guaranteed or endorsed by the publisher.
Supplementary material
The Supplementary Material for this article can be found online at: https://www.frontiersin.org/articles/10.3389/fmars.2023.1244474/full#supplementary-material
References
ACCOBAMS (2021). Estimates of abundance and distribution of cetaceans, marine mega-fauna and marine litter in the Mediterranean Sea from 2018-2019 surveys. Eds. Panigada S., Boisseau O., Cañadas A., Lambert C., Laran S., McLanaghan R., Moscrop A. (Monaco: ACCOBAMS - ACCOBAMS Survey Initiative Project), 177.
Akaike H. (1998). “Information theory and an extension of the maximum likelihood principle,” in Selected Papers of Hirotugu Akaike. Springer Series in Statistics. Eds. Parzen E., Tanabe K., Kitagawa G. (New York, NY: Springer), 199–213. doi: 10.1007/978-1-4612-1694-0_15
Akamatsu T., Wang D., Wang K., Wei Z. (2001). Comparison between visual and passive acoustic detection of finless porpoises in the Yangtze River, China. J. Acoust. Soc Am. 109, 1723–1727. doi: 10.1121/1.1356705
Akamatsu T., Wang D., Nakamura K., Wang K. (1998). Echolocation range of captive and free-ranging baiji (Lipotes vexillifer), finless porpoise (Neophocaena phocaenoides), and bottlenose dolphin (Tursiops truncatus). J. Acoust. Soc Am. 104 (4), 2511–2516. doi: 10.1121/1.423757
Akamatsu T., Wang D., Wang K., Li S., Dong S., Zhao X., et al. (2008). Estimation of the detection probability for Yangtze finless porpoises (Neophocaena phocaenoides asiaeorientalis) with a passive acoustic method. J. Acoust. Soc Am. 123 (6), 4403–4411. doi: 10.1121/1.2912449
Alves F., Rosso M., Li S., Nowacek D. P. (2022). A sea of possibilities for marine megafauna. Science 375, 6579. doi: 10.1126/science.abn6022
Amorim T. O. S., de Castro F. R., Ferreira G. A., Neri F. M., Duque B. R., Mura J. P., et al. (2022). Acoustic identification and classification of four dolphin species in the Brazilian marine area affected by the largest tailings dam failure disaster. J. Acoust. Soc Am. 152, 3204–3215. doi: 10.1121/10.0016358
Au W. W. L. (1993). The Sonar of Dolphins (Springer Science & Business Media. New York, NY: Springer).
Au W. W. L., Branstetter B., Moore P. W., Finneran J. J. (2012). Dolphin biosonar signals measured at extreme off-axis angles: Insights to sound propagation in the head. J. Acoust. Soc Am. 132, 2. doi: 10.1121/1.4730901
Au W. W. L., Floyd R. W., Haun J. E. (1978). Propagation of Atlantic bottlenose dolphin echolocation signals. J. Acoust. Soc Am. 64, 2. doi: 10.1121/1.382015
Au W. W., Floyd R. W., Penner R. H., Murchison A. E. (1974). Measurement of echolocation signals of the Atlantic bottlenose dolphin, Tursiops truncatus Montagu, in open waters. J. Acoust. Soc Am. 56 (4), 1280–1290. doi: 10.1121/1.1903419
Barlow J. (2006). Cetacean abundance in Hawaiian waters estimated from a summer/fall survey in 2002. Mar. Mamm. Sci 22, 446–464. doi: 10.1111/j.1748-7692.2006.00032.x
Barlow J., Taylor L. (2005). Estimates of sperm whale abundance in the Northeastern in temperate pacific from a combined acoustic and visual survey. Mar. Mamm. Sci. 21, 3. doi: 10.1111/j.1748-7692.2005.tb01242.x
Baumann-Pickering S., Wiggins S. M., Hildebrand J. A., Roch M. A., Schnitzler H.-U. (2010). Discriminating features of echolocation clicks of melon-headed whales (Peponocephala electra), bottlenose dolphins (Tursiops truncatus), and Gray’s spinner dolphins (Stenella longirostris longirostris). J. Acoust. Soc Am 128 (4), 2212–2224. doi: 10.1121/1.3479549
Bearzi G., Fortuna C. M., Reeves R. R. (2009). Ecology and conservation of common bottlenose dolphins Tursiops truncatus in the Mediterranean Sea. Mamm. Rev 39 (2), 92–123. doi: 10.1111/j.1365-2907.2008.00133.x
Bearzi G., Reeves R. R., Notarbartolo-Di-Sciara G., Politi E., Cañadas A., Frantzis A., et al. (2003). Ecology, status and conservation of short-beaked common dolphins Delphinus delphis in the Mediterranean Sea. Mamm. Rev. 33, 224–252. doi: 10.1046/J.1365-2907.2003.00032.X
Bittle M., Duncan A. (2013). “A review of current marine mammal detection and classification algorithms for use in automated passive acoustic monitoring,” in Proceedings of Acoustics, vol. 8. Ed. McMinn T. (Victor Harbor, SA: Australian Acoustical Society).
Boisseau O., Lacey C., Lewis T., Moscrop A., Danbolt M., McLanaghan R. (2010). Encounter rates of cetaceans in the Mediterranean Sea and contiguous Atlantic area. J. Mar. Biolog. Assoc. U.K. 90, 1589–1599. doi: 10.1017/S0025315410000342
Borchers D. L., Buckland S. T., Goedhart P. W., Clarke E. D., Hedley S. L. (1998). Horvitz-Thompson Estimators for double-Platform line transect surveys. Biometrics 54, 4. doi: 10.2307/2533652
Borchers D. L., Laake J. L., Southwell C., Paxton C. G. M. (2006). Accommodating unmodeled heterogeneity in double-observer distance sampling surveys. Biometrics 62, 2. doi: 10.1111/j.1541-0420.2005.00493.x
Bossart G. D. (2011). Marine mammals as sentinel species for oceans and human health. Vet. Pathol. 48, 3. doi: 10.1177/0300985810388525
Buckland S. T., Anderson D. R., Burnham K. P., Laake J. L., Borchers D. L., Thomas L. (2001). Introduction to distance sampling – Estimating abundance of Biological Populations (Oxford: Oxford University Press).
Buckland S. T., Anderson D. R., Burnham K. P., Laake J. L., Borchers D. L., Thomas L. (2004). Advanced Distance Sampling: Estimating abundance of biological populations (Oxford: Oxford University Press).
Buckland S. T., Laake J. L., Borchers D. L. (2010). Double-observer line transect methods: Levels of independence. Biometrics 66, 1. doi: 10.1111/j.1541-0420.2009.01239.x
Buckland S. T., Rexstad E. A., Marques T. A., Oedekoven C. S. (2015). Distance Sampling: methods and applications (New York: Springer).
Burt M. L., Borchers D. L., Jenkins K. J., Marques T. A. (2014). Using mark-recapture distance sampling methods on line transect surveys. Methods Ecol. Evol. 5, 11. doi: 10.1111/2041-210X.12294
Cañadas A., Desportes G., Borchers D. (2004). The estimation of the detection function and g(0) for short-beaked common dolphins (Delphinus delphis), using double-platform data collected during the NASS-95 Faroese survey. J. Cetacean. Res. Manage. 6, 2. doi: 10.47536/jcrm.v6i2.782
Cañadas A., Hammond P. S. (2008). Abundance and habitat preferences of the short-beaked common dolphin Delphinus delphis in the southwestern Mediterranean: implications for conservation. Endanger. Species. Res. 4, 3. doi: 10.3354/esr00073
Coll M., Piroddi C., Albouy C., ben Rais Lasram F., Cheung W. W. L., Christensen V., et al. (2012). The Mediterranean Sea under siege: spatial overlap between marine biodiversity, cumulative threats and marine reserves. Glob. Ecol. Biogeogr. 21, 4. doi: 10.1111/J.1466-8238.2011.00697.X
Dalpaz L., Paro A. D., Daura-Jorge F. G., Rossi-Santos M., Norris T. F., Ingram S. N., et al. (2021). Better together: analysis of integrated acoustic and visual methods when surveying a cetacean community. Mar. Ecol. Prog. Ser. 678, 197–209. doi: 10.3354/meps13898
Daura-Jorge F. G., Simões-Lopes P. C. (2017). Mark-recapture vs. line-transect abundance estimates of a coastal dolphin population: a case study of Tursiops truncatus from Laguna, southern Brazil. Lat. Am. J. Aquat. Mamm. 11, 1–2. doi: 10.5597/lajam00222
Dick D. M., Hines E. M. (2011). Using distance sampling techniques to estimate bottlenose dolphin (Tursiops truncatus) abundance at Turneffe Atoll, Belize. Mar. Mamm. Sci. 27, 3. doi: 10.1111/j.1748-7692.2010.00435.x
Diercks K. J., Trochta R. T., Greenlaw C. F., Evans W. E. (1971). Recording and analysis of dolphin echolocation signals. J. Acoust. Soc Am. 49 (1A_Supplement), 135–135. doi: 10.1121/1.1975868
Eskesen I. G., Wahlberg M., Simon M., Larsen ,. O. N. (2011). Comparison of echolocation clicks from geographically sympatric killer whales and long-finned pilot whales (L). J. Acoust. Soc Am. 130 (1), 9–12. doi: 10.1121/1.3583499
Evans P. G., Hammond P. S. (2004). Monitoring cetaceans in European waters. Mamm. Rev. 34, 1–2. doi: 10.1046/J.0305-1838.2003.00027.X
Evans W. E. (1973). Echolocation by marine delphinids and one species of fresh-water dolphin. J. Acoust. Soc Am. 54 (1), 191–199. doi: 10.1121/1.1913562
Finneran J. J., Branstetter B. K., Houser D. S., Moore P. W., Mulsow J., Martin C., et al. (2014). High-resolution measurement of a bottlenose dolphin’s (Tursiops truncatus) biosonar transmission beam pattern in the horizontal plane. J. Acoust. Soc Am. 136, 4. doi: 10.1121/1.4895682
Fish F., Rohr J. (1999). Review of dolphin hydrodynamics and swimming performance. SPAWARS System Center Technical Report (San Diego, CA: SPAWAR System Center San Diego), 1801.
Genov T., Kotnjek P., Lesjak J., Hace A., Fortuna C. M. (2008). Bottlenose dolphins (Tursiops truncatus) in Slovenian and adjacent waters (northern Adriatic Sea). Ann. Ser. Hist. Nat. 18, 2. 227–2. 244.
Gerrodette T., Perryman W. L., Barlow J. (2002). Calibrating group size estimates of dolphins in the eastern tropical Pacific Ocean. Southwest Science Center Administrative Report LJ-02-08 (La Jolla, CA: NOAA Fisheries).
Gerrodette T., Perryman W. L., Oedekoven C. S. (2019). Accuracy and precision of dolphin group size estimates. Mar. Mamm. Sci. 35, 1. doi: 10.1111/mms.12506
Gillespie D., Mellinger D. K., Gordon J., Mclaren D., Redmond P., McHugh R., et al. (2008). PAMGuard: semiautomated, open source software for real-time acoustic detection and localisation of cetaceans. J. Acoust. Soc Am. 30, 5. doi: 10.1121/1.4808713
Hamilton O. N. P., Kincaid S. E., Constantine R., Kozmian-Ledward L., Walker C. G., Fewster R. M. (2018). Accounting for uncertainty in duplicate identification and group size judgements in mark–recapture distance sampling. Methods Ecol. Evol. 9, 2. doi: 10.1111/2041-210X.12895
Hammond P. S. (2018). ““Mark–recapture”,” in Encyclopedia of Marine Mammals, 3rd ed. Eds. Wursig B., Thewissen J. G. M., Kovacs K. M. (London: Academic Press), 580–584. doi: 10.1016/C2015-0-00820-6
Hammond P. S., Macleod K., Berggren P., Borchers D. L., Burt L., Cañadas A., et al. (2013). Cetacean abundance and distribution in European Atlantic shelf waters to inform conservation and management. Biol. Conserv. 164, 107–122. doi: 10.1016/j.biocon.2013.04.010
Hildebrand J. A., Baumann-Pickering S., Frasier K. E., Trickey J. S., Merkens K. P., Wiggins S. M., et al. (2015). Passive acoustic monitoring of beaked whale densities in the Gulf of Mexico. Sci. Rep. 5, 1. doi: 10.1038/srep16343
Hui C. A. (1987). Power and speed of swimming dolphins. J. Mammal. 68, 1, 126–1, 132. doi: 10.2307/1381055
Janik V. M. (2009). “Chapter 4 acoustic communication in delphinids” in Advances in the Study of Behavior. Eds. Naguib M., Zuberbuumlhler K., Clayton N. S., Janik V. M. (Academic Press), 123–157. doi: 10.1016/S0065-3454(09)40004-4
Jensen F. H., Beedholm K., Wahlberg M., Bejder L., Madsen P. T. (2012). Estimated communication range and energetic cost of bottlenose dolphin whistles in a tropical habitat. J. Acoust. Soc Am. 131, 1. doi: 10.1121/1.3662067
Kerem D., Hadar N., Goffman O., Lojen S., Kent R., Boisseau O., et al. (2012). Update on the cetacean fauna of the mediterranean levantine basin. J. Open Mar. Biol. 6, 1. doi: 10.2174/1874450801206010006
Klinck H., Mellinger D. K. (2011). The energy ratio mapping algorithm: A tool to improve the energy-based detection of odontocete echolocation clicks. J. Acoust. Soc Am. 129, 4. doi: 10.1121/1.3531924
Laake J. (1999). “Distance sampling with independent observers: Reducing bias from heterogeneity by weakening the conditional independence assumption” in Marine Mammal Survey and Assessment Methods. Eds. Laake J. L., Robertson D. G., Amstrup S. C., Manly B. F. J. (London: CRC Press), 137–148. doi: 10.1201/9781003211167-14
Laake J. L., Borchers D. L. (2004). ““Methods for incomplete detection at distance zero”,” in Advanced Distance Sampling – Estimating abundance of biological populations. Eds. Buckland S. T., Anderson D. R., Burnham K. P., Laake J. L., Borchers D. L., Thomas L. (Oxford: Oxford University Press), 108–189.
Laake J., Borchers D., Thomas L., Bishop J. (2013) mrds: Mark–Recapture Distance Sampling (mrds). R package version 2.1.4. Available at: http://CRAN.R-project.org/package=mrds (Accessed August, 18, 2022).
Laake J. L., Collier B. A., Morrison M. L., Wilkins R. N. (2011). Point-based mark-recapture distance sampling. J. Agric. Biol. Environ. Stat. 16, 389–408. doi: 10.1007/S13253-011-0059-5
Lambert C., Authier M., Dorémus G., Gilles A., Hammond P., Laran S., et al. (2019). The effect of a multi-target protocol on cetacean detection and abundance estimation in aerial surveys. R. Soc Open Sci. 6, 9. doi: 10.1098/RSOS.190296
Laran S., Pettex E., Authier M., Blanck A., David L., Dorémus G., et al. (2017). Seasonal distribution and abundance of cetaceans within French waters- Part I: The North-Western Mediterranean, including the Pelagos sanctuary. Deep Sea Res. Part II Top. Stud. Oceanogr. 141, 31–40. doi: 10.1016/J.DSR2.2016.12.011
Lascelles B., Notarbartolo G., Sciara D., Agardy T., Cuttelod A., Eckert S., et al. (2014). Migratory marine species: their status, threats and conservation management needs. Aquat. Conserv. 24, 111–127. doi: 10.1002/aqc.2512
Leaper R., Burt L., Gillespie D., Macleod K. (2023). Comparisons of measured and estimated distances and angles from sightings surveys. J. Cetacean Res. Manage. 11, 3. doi: 10.47536/jcrm.v11i3.602
Lewis T., Boisseau O., Danbolt M., Gillespie D., Lacey C., Leaper L., et al. (2018). Abundance estimates for sperm whales in the Mediterranean Sea from acoustic line-transect surveys. J. Cetacean Res. Manage. 18, 103–117. doi: 10.47536/jcrm.v18i1.437
Luna A., Sánchez P., Chicote C., Gazo M. (2022). Cephalopods in the diet of Risso’s dolphin (Grampus griseus) from the Mediterranean Sea: A review. Mar. Mamm Sci. 38, 2. doi: 10.1111/mms.12869
Madsen P. T., Kerr I., Payne R. (2004). Echolocation clicks of two free-ranging, oceanic delphinids with different food preferences: false killer whales Pseudorca crassidens and Risso's dolphins Grampus griseus. J. Exp. Biol. 207 (11), 1811–1823. doi: 10.1242/jeb.00966
Mannocci L., Roberts J. J., Halpin P. N., Authier M., Boisseau O., Bradai M. N., et al. (2018). Assessing cetacean surveys throughout the Mediterranean Sea: a gap analysis in environmental space. Sci. Rep. 8, 1. doi: 10.1038/s41598-018-19842-9
Marques T. A., Andersen M., Chrsitensen-Dalsgaard S., Belikov S., Boltunov A., Wiig Ø., et al. (2006). The use of global Positioning Systems to record distances in a Helicopter line-transect survey. Wildl. Soc Bull. 34 (3), 759–763. doi: 10.2193/0091-7648(2006)34[759:TUOGPS]2.0.CO;2
Marques F. F. C., Buckland S. T. (2003). Incorporating covariates into standard line transect analyses. Biometrics 59, 4. doi: 10.1111/j.0006-341X.2003.00107.x
Marques T. A., Thomas L., Martin S. W., Mellinger D. K., Jarvis S., Morrissey R. P., et al. (2012). Spatially explicit capture–recapture methods to estimate minke whale density from data collected at bottom-mounted hydrophones. J. Ornithol. 152, 445–455. doi: 10.1007/s10336-010-0535-7
Marques T. A., Thomas L., Ward J., DiMarzio N., Tyack P. L. (2009). Estimating cetacean population density using fixed passive acoustic sensors: An example with Blainville’s beaked whales. J. Acoust. Soc Am. 125, 4. doi: 10.1121/1.3089590
Martin M. J., Gridley T., Roux J. P., Elwen S. H. (2020). First Abundance Estimates of Heaviside’s (Cephalorhynchus heavisidii) and Dusky (Lagenorhynchus obscurus) Dolphins Off Namibia Using a Novel Visual and Acoustic Line Transect Survey. Front. Mar. Sci. 7. doi: 10.3389/fmars.2020.555659
McCarthy M. A., Moore J. L., Morris W. K., Parris K. M., Garrard G. E., Vesk P. A., et al. (2013). The influence of abundance on detectability. Oikos 122, 5. doi: 10.1111/J.1600-0706.2012.20781.X
McCauley D. J., Pinsky M. L., Palumbi S. R., Estes J. A., Joyce F. H., Warner R. R. (2015). Marine defaunation: Animal loss in the global ocean. Science 374, 1255641. doi: 10.1126/science.1255641
Miller P. J. O. (2002). Mixed-directionality of killer whale stereotyped calls: a direction of movement cue? Behav. Ecol. Sociobiol. 52, 262–270. doi: 10.1007/S00265-002-0508-9
Mills L. S., Citta J. J., Lair K. P., Schwartz M. K., Tallmon D. A. (2000). Estimating animal abundance using noninvasive DNA sampling: promise and pitfalls. Ecol. Appl. 10, 283–294. doi: 10.1890/1051-0761(2000)010[0283:EAAUND]2.0.CO;2
New L. F., Clark J. S., Costa D. P., Fleishman E., Hindell M. A., Klanjšček T. (2014). Using short-term measures of behaviour to estimate long-term fitness of southern elephant seals. Mar. Ecol. Prog. Ser. 496, 99–108. doi: 10.3354/meps10547
Notarbartolo di Sciara G., Tonay A. (2021). Conserving whales, dolphins and porpoises in the Mediterranean and Black Seas. ACCOBAMS Status report-ACCOBAMS (Monaco), 160.
Notarbartolo di Sciara G., Venturino M. C., Zanardelli M., Bearzi G., Borsani F. J., Cavalloni B. (1993). Cetaceans in the central Mediterranean Sea: Distribution and sighting frequencies. Ital. J. Zool. 60, 1. doi: 10.1080/112500009309355800
Øien N. (2009). Distribution and abundance of large whales in Norwegian and adjacent waters based on ship surveys 1995-2001. NAMMCO Sci. Publ. 7, 31–47. doi: 10.7557/3.2704
Oswald J. N., Barlow J., Norris T. F. (2003). Acoustic identification of nine delphinid species in the eastern tropical Pacific Ocean. Mar. Mar. Sci. 19, 1. doi: 10.1111/j.1748-7692.2003.tb01090.x
Panigada S., Lauriano G., Donovan G., Pierantonio N., Cañadas A., Vázquez J. A, et al. (2017). Estimating cetacean density and abundance in the Central and Western Mediterranean Sea through aerial surveys: Implications for management. Dee Sea Res. Part II Top. Stud. Oceanogr 141, 41–58. doi: 10.1016/J.DSR2.2017.04.018
Parra G. J., Bilgmann K., Peters K. J., Möller L. M. (2021). Abundance and potential biological removal of common dolphins subject to fishery impacts in south Australian waters. Front. Mar. Sci. 8, 1237. doi: 10.3380/fmars.2021/617075
Pedersen M. B., Tønnesen P., Malinka C. E., Ladegaard M., Johnson M., Aguilar de Soto N., et al. (2021). Echolocation click parameters of short-finned pilot whales (Globicephala macrorhynchus) in the wild. J. Acoust. Soc Am. 149, 3. doi: 10.1121/10.0003762
Pilleri G., Knuckey J. (1969). Behaviour Patterns of some Delphinidae observed in the Western Mediterranean. Z. Tierpsychol. 26, 1. doi: 10.1111/J.1439-0310.1969.TB01937.X
Pirotta E., Booth C. G., Costa D. P., Fleishman E., Kraus S. D., Lusseau D. (2018). Understanding the population consequences of disturbance. Ecol. Evol. 8, 9934–9946. doi: 10.1002/ece3.4458
Pirotta E., Merchant N. D., Thompson P. M., Barton T. R., Lusseau D. (2015). Quantifying the effect of boat disturbance on bottlenose dolphin foraging activity. Biol. Conserv. 181, 82–89. doi: 10.1016/J.BIOCON.2014.11.003
Punt A. E., Siple M. C., Francis T. B., Hammond P. S., Heinemann D., Long K. J. (2021). Can we manage marine mammal bycatch effectively in low-data environments? J. Appl. Ecol. 58 (3), 596–607. doi: 10.1111/1365-2664.13816
Rankin S., Oswald J. N., Simonis A. E., Barlow J. (2015). Vocalizations of the rough-toothed dolphin, Steno bredanensis, in the Pacific Ocean. Mar. Mamm. Sci. 319 (4), 1538–1548. doi: 10.1111/mms.12226
Rankin S., Oedekoven C., Archer F. (2020). Mark recapture distance sampling: using acoustics to estimate the fraction of dolphins missed by observers during shipboard line-transect surveys. Environ. Ecol. Stat. 27, 2. doi: 10.1007/s10651-020-00443-7
Reeves R. R., McClellan K., Werner T. B. (2013). Marine mammal bycatch in gillnet and other entangling net fisheries 1990 to 2011. Endang. Species Res. 20, 71–97. doi: 10.3354/esr00481
Richman N. I., Gibbons J. M., Turvey S. T., Akamatsu T., Ahmed B., Mahabub E., et al. (2014). To see or not to see: Investigating detectability of ganges river dolphins using a combined visual-acoustic survey. PloS One 9, 5. doi: 10.1371/journal.pone.0096811
Ridoux V., Guinet C., Creton C. L. P., Steenstrup R., Beauplet G. (1997). A video sonar as a new tool to study marine mammals in the wild: measurements of dolphin swimming speed. Mar. Mamm. Sci. 13, 2. doi: 10.1111/J.1748-7692.1997.TB00627.X
Saavedra C., Gerrodette T., Louzao M., Valeiras J., García S., Cerviño S., et al. (2018). Assessing the environmental status of the short-beaked common dolphin (Delphinus delphis) in North-western Spanish waters using abundance trends and safe removal limits. Prog. Oceanogr. 166, 66–75. doi: 10.1016/j.pocean.2017.08.006
Saayman G. S., Bower D., Tayler C. K. (1972). Observations on inshore and pelagic Dolphins on the South-Eastern Cape coast of South Africa. Koedoe 15, 1. doi: 10.4102/KOEDOE.V15I1.664
Sequeira A. M. M., Hays G. C., Sims D. W., Eguiluz V. M., Rodriguez J. P., Heupel M. R., et al. (2019). Overhauling ocean spatial planning to improve marine megafauna conservation. Front. Mar. Sci. 6. doi: 10.3389/fmars.2019.00639
Soldevilla M. S., Henderson E. E., Campbell G. S., Wiggins S. M., Hildebrand J. A., Roch M. A. (2008). Classification of Risso’s and Pacific white-sided dolphins using spectral properties of echolocation clicks. J. Acoust. Soc Am. 124, 1. doi: 10.1121/1.2932059
Tanaka S. (1987). Satellite radio tracking of bottlenose dolphins. Nippon suisan gakkaishi 53, 8. doi: 10.2331/SUISAN.53.1327
Thomas L., Buckland S. T., Rexstad E. A., Laake J. L., Strindberg S., Hedley S. L., et al. (2010). Distance software: design and analysis of distance sampling surveys for estimating population size. J. Appl. Ecol. 47, 5–14. doi: 10.1111/j.1365-2664.2009.01737.x
Thomas L., Marques T. A. (2012). Passive acoustic monitoring for estimating animal density. Acoust. Today 8, 3. doi: 10.1121/1.4753915
Verfuss U. K., Gillespie D., Gordon J., Marques T. A., Miller B., Plunkett R., et al. (2018). Comparing methods suitable for monitoring marine mammals in low visibility conditions during seismic surveys. Mar. Pollut. Bull. 126, 1–18. doi: 10.1016/J.MARPOLBUL.2017.10.034
Wahlberg M., Jensen F. H., Aguilar Soto N., Beedholm K., Bejder L., Oliveira C., et al. (2011). Source parameters of echolocation clicks from wild bottlenose dolphins (Tursiops aduncus and Tursiops truncatus). J. Acoust. Soc Am. 130 (4), 2263–2274. doi: 10.1121/1.3624822
Watkins W. A., Tyack P., Moore K. E., Notarbartolo di Sciara G. (1987). Steno bredanensis in the mediterranean sea. Mar. Mamm. Sci. 3, 1. 78–1. 82. doi: 10.1111/J.1748-7692.1987.TB00152.X
Williams T., Friedl W., Fong M., Yamada R., Sedivy P., Haun J. (1992). Travel at low energetic cost by swimming and wave-riding bottlenose dolphins. Nature 355, 6363. doi: 10.1038/355821a0
Wood C. J. (1998). Movement of bottlenose dolphins around the south-west coast of Britain. J. Zool. 246, 2. doi: 10.1111/J.1469-7998.1998.TB00144.X
Würsig B. (2018). “Bow-riding,” in Encyclopedia of Marine Mammals, 3rd ed. Eds. Wursig B., Thewissen J. G. M., Kovacs K. M. (London: Academic Press), 135–136. doi: 10.1016/C2015-0-00820-6
Würsig B., Würsig M. (1979). Behavior and ecology of the bottlenose dolphin, Tursiops truncatus, in the South Atlantic. Fish. Bull. 77, 2.
Keywords: detection probability, duplicate events, mark-recapture distance sampling, dual platform, passive acoustic monitoring, line-transect surveys
Citation: Ollier C, Sinn I, Boisseau O, Ridoux V and Virgili A (2023) Matching visual and acoustic events to estimate detection probability for small cetaceans in the ACCOBAMS Survey Initiative. Front. Mar. Sci. 10:1244474. doi: 10.3389/fmars.2023.1244474
Received: 22 June 2023; Accepted: 02 October 2023;
Published: 16 October 2023.
Edited by:
Jeffrey C. Mangel, Prodelphinus, PeruReviewed by:
Thomas A. Jefferson, Clymene Enterprises, United StatesSacha Viquerat, Alfred Wegener Institute Helmholtz Centre for Polar and Marine Research (AWI), Germany
Tiago Andre Marques, University of St Andrews, United Kingdom
Copyright © 2023 Ollier, Sinn, Boisseau, Ridoux and Virgili. This is an open-access article distributed under the terms of the Creative Commons Attribution License (CC BY). The use, distribution or reproduction in other forums is permitted, provided the original author(s) and the copyright owner(s) are credited and that the original publication in this journal is cited, in accordance with accepted academic practice. No use, distribution or reproduction is permitted which does not comply with these terms.
*Correspondence: Camille Ollier, ollier.cam@gmail.com