Diversity of filter feeding and variations in cross-flow filtration of five ram-feeding fish species
 Leandra Hamann1,2*†
  Kristina Schreiber1† Jan Hagenmeyer1,3† Santiago Eduardo1,4† Tobias Spanke5†
  Alexander Blanke1†
- 1Bonn Institute for Organismic Biology, Section Animal Biodiversity, University of Bonn, Bonn, Germany
- 2The Whitney Laboratory for Marine Bioscience, University of Florida, Saint Augustine, FL, United States
- 3Ruhr-University Bochum, Bochum, Germany
- 4Otto-von-Guericke-Universität Magdeburg, Magdeburg, Germany
- 5Centre for Taxonomy and Morphology (ztm), Leibniz Institute for the Analysis of Biodiversity Change, Bonn, Germany
Introduction: Filter-feeding fish separate food particles from the surrounding water by cross-flow filtration in which a suspension flows parallel to a porous filter medium, thereby transporting particles along the surface.
Methods: Here, we investigate cross-flow filtration in five ram-feeding fish species from two groups, Scombridae (Scomber scombrus and Rastrelliger kanagurta) and Clupeidae (Clupea harengus, Sardina pilchardus, and Engraulis encrasicolus). Using a combination of morphometrics, micro-CT scanning, video analysis, and water tunnel experiments, we give a detailed description of the gill arch system, calculate filtration parameters, observe particle movement, and identify morphological traits that induce cross-flow filtration.
Results: Our findings suggest that these ram-feeding fish species use a combination of cross-flow and dead-end filtration as the underlying filtration principle. Specifically, the particles are transported along the surface of gill rakers and denticles towards the esophagus where they accumulate before being periodically swallowed. We infer three distinct morphotypes characterized by variations in geometry, mesh size, and surface structures, which indicate variations of the general mechanism.
Discussion: The description presented in this study contributes to the development of models for investigating the influence of morphological variation on fluid flow and particle retention in filter-feeding fish and on their ecology and biomimetic application.
1 Introduction
Suspension feeding is an aquatic feeding strategy that separates food particles from water (Jørgensen, 1966) and has evolved multiple times in animals such as sponges, mussels, crustaceans, flamingos, or baleen whales. Through their feeding activity, suspension feeders influence nutrient fluxes, local flow fields, and bio-chemical processes on a local and global level (Hentschel and Shimeta, 2008; Sebens et al., 2017). Filter-feeding fishes are of particular interest to humans. Pilchards, anchovies, and herrings belong to the most commonly fished species for human consumption (Alder et al., 2008). Silver carps and bighead carps were considered for waste water treatment to remove and recycle nutrients and algae and improve water quality (Hernderson, 1983). In addition, bio-inspired filter modules were developed that mimic the filter-feeding mechanism (Hung and Piedrahita, 2014; Schroeder et al., 2019). Filter-feeding fishes also ingest microplastics (Phillips and Bonner, 2015; Ory et al., 2018; Ribeiro et al., 2020). Therefore, their particle separation mechanisms are relevant for ecology, fishery, filtration technologies, and environmental protection.
The particle separation mechanism in filter-feeding fishes was described as cross-flow filtration (CFF), in which water streams parallel to the gill arches (GA) that bear elongated gill rakers (GR) with denticles forming a mesh-like arrangement (Figure 1) (Sanderson et al., 2001). The parallel flow transports the particles along the separation medium towards the esophagus while at the same time cleared water exits through the gill arch system (GAS) and under the opercula (Sanderson et al., 2001). Filter-feeding fishes from 21 families are known, which divide into over 70 ram- and pump-feeding species. Ram feeders use their forward motion to stream water into the mouth, while pump feeders suck water into their mouth through rhythmic contractions of pharyngeal structures (Sanderson and Wassersug, 1993; Storm et al., 2020).

Figure 1 Stacked photographs of the frontal view into the buccal cavity (left column) and micro-CT volume renders through the sagittal mid-plane with view of the left side (middle column) and through the frontal plane with view of the ventral GAS of the studied ram-feeding fish: (A) Atlantic mackerel (Scomber scombrus, Linnaeus 1758, Fishing ground: North east Atlantic—Food and Agricultural Organisation (FAO) 27), (B) Indian mackerel (Rastrelliger kanagurta, Cuvier 1816, West Indian Ocean—FAO 51), (C) Atlantic herring (Clupea harengus, Linnaeus 1758, North East Atlantic—FAO 27), (D) Atlantic pilchard (Sardina pilchardus, Walbaum 1792, Mediterranean and Black Sea—FAO 37), and (E) Atlantic anchovy (Engraulis encrasicolus, Linnaeus 1758, Mediterranean and Black Sea—FAO 37), with GA, gill arch; GR, gill raker; PB, pharyngobranchial. Mouth opening angles approximately in physiological configuration. Images and scans not to scale.
Although the general mechanism of CFF in filter-feeding fishes was identified, the considerably high variability in the filter-feeding morphology may indicate variations of fluid flow and particle retention. For example, GR are long and blade shaped (Gibson, 1988), bushy (Friedland et al., 2006), short with an oval cross-section (Langeland and Nost, 1995), or even fused as in the silver carp (Cohen and Hernandez, 2018b). Pump-feeding cichlids have microbranchiospines that are dermal ossifications on the external faces of the GA whose function is yet unclear (Goodrich et al., 2000). The palatal organ shows morphological modifications in the pump-feeding silver carp compared to other non-filter-feeding Cypriniformes (Cohen and Hernandez, 2018a). Intraspecific variability of CFF morphology was observed in Sardina pilchardus with variations in GR number and GR gap size (Garrido and van der Lingen, 2014), which may indicate adaption to local prey characteristics and different feeding environments (Costalago et al., 2015). In the so-called cross-step filtration in the paddlefish, GA and GR form d-type ribs that induce characteristic vortices within the tangential inflow (Sanderson et al., 2016). Specific functions of these different traits within CFF were not assessed so far, and the parameter space is not known.
Therefore, we analyze the morphology of the GAS and identify functional details in five ram-feeding fishes from the groups Scombridae (Scomber scombrus and Rastrelliger kanagurta) and Clupeidae (Clupea harengus, S. pilchardus, and Engraulis encrasicolus). Endoscopic in vivo data from inside the oral cavity of ram-feeding fishes is difficult to obtain (Cheer et al., 2001). Therefore, we used digital microscopy and micro-CT to describe the three-dimensional arrangement of the GAS. Additionally, we conducted a video analysis of the selected filter-feeding species in aquaria and the wild to observe feeding behavior. In order to observe fluid flow and particle movement in the GAS, we examined fish heads with an open-mouth position in a water tunnel. Using a combination of imaging methods and functional analyses allowed us to describe the GAS in detail, calculate filtration parameters, such as mesh size, open area ratio, and fluid exit ratio, and thus identify the parameter space of CFF for these species. The results will help in understanding their particle separation mechanism, the ecological relevance in pelagic nutrient fluxes, and potential biomimetic applications.
2 Materials and methods
2.1 Study organisms
We analyzed seven Atlantic mackerels (Scomber scombrus, Linnaeus 1758), seven Indian mackerels (R. kanagurta, Cuvier 1816), seven Atlantic herrings (C. harengus, Linnaeus 1758), 11 Atlantic pilchards (S. pilchardus, Walbaum 1792), and 11 Atlantic anchovies (E. encrasicolus, Linnaeus 1758) to account for potential variation in the GAS (Figure 1). All species are ram-feeding filter feeders (Sanderson and Wassersug, 1993; Storm et al., 2020). The fishes were ordered from “FrischeParadies” (Cologne, Germany) and caught fresh from fishing grounds in the North East Atlantic, West Indian Ocean, Mediterranean, and Black Sea 1 day before they were picked up at the shop. The fishes were round, not decapitated or gutted, and cooled on ice during transport. After being visually inspected for damages, they were immediately frozen at −18°C.
2.2 Morphometrics based on digital microscopy
Before dissection, the fishes were thawed in cold water for 1 h. Each specimen was weighed and photographed with their mouth closed and open. The head was cut off and dissection was begun on the left side of the GAS and proceeded from larger to smaller structures, i.e., head, gill arches, gill rakers, and denticles. Larger structures were photographed with a Nikon D850 equipped with an AF-S Micro NIKKOR 60 mm 1:2.8G ED lens. Smaller structures were photographed with a Keyence VHX-700F (Ver 2.3.8.2 with lens VH-Z20R RZx20-x200, System Ver 1.93) at the University of Cologne. Photos were taken by one operator (LH) and analyzed by two operators (LH and JH) using ImageJ. In total, 20 parameters were measured (Figure 2A). To measure parameters 3–10, the mouth was held in an open position with pins and needles so that the jaw was opened with the GAS fully expanded and the GR closing the gap between the GA as previously established (Sanderson and Wassersug, 1993; Storm et al., 2020). Needles were inserted through the cranium to hold the head in position, and the mouth was opened by pulling on the hyoid retractor muscle and fixed with needles through the hyoid from outside the head. No needles were inserted inside the buccal cavity to not damage relevant structures. We are aware that measurements on soft and moveable structures are difficult to analyze. However, the open mouth position is an essential feature in ram-feeding fishes. We therefore compared the open mouth position, represented by the jaw angle, to measurements extracted from our video analysis to ensure that the angle represented a natural feeding position. The GAS is described with anatomical terminology along the anterior–posterior axis, the dorso-ventral axis, and the medial–lateral axis (Figure 2, Storm et al., 2020). The GA are described in ascending order from the most anterior GA1 to the most posterior GA5 close to the esophagus. On each GA, the GR protrude either anteriorly or posteriorly (Figure 2A). Posterior GR only occurred in some species and arches. To measure parameters 11–20 on each GA, the GAS was removed from the head. In the smaller species (S. pilchardus and E. encrasicolus), the GAS remained intact because the structures were too fragile to be separated, whereas in the larger species, each GA was separated for taking the measurements.
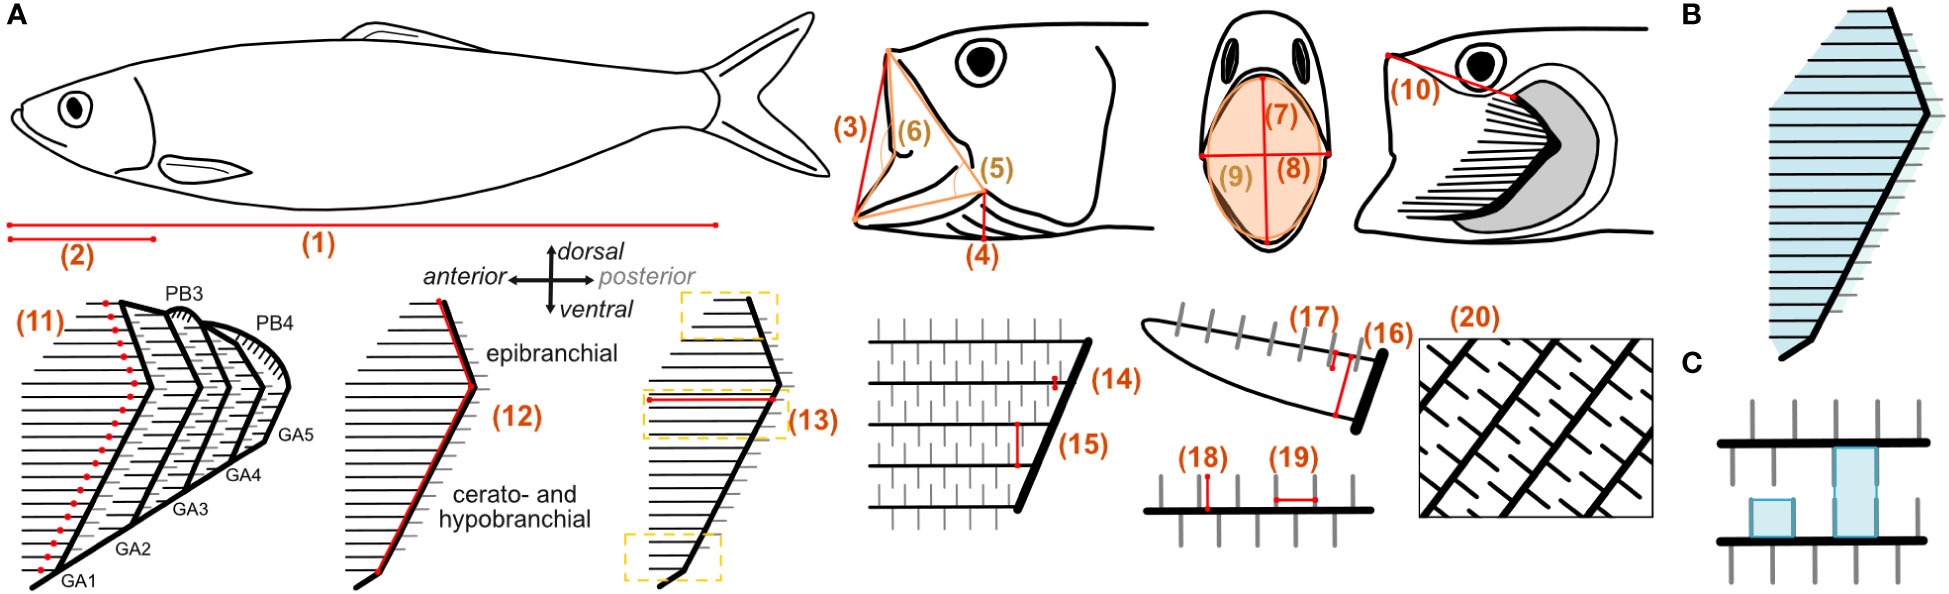
Figure 2 (A) Measured parameters in the fishes: 1) standard length (SL) with open and closed mouth; 2) head length; 3) open mouth height (lateral); 4) branchiostegal height; 5) jaw angle (in orange); 6) lip angle (in orange); 7) open mouth height frontal; 8) open mouth width frontal; 9) open mouth area (in orange); 10) upper lip to epibranchial; 11) number of GR; 12) length of GA (sum of epi-, cerato-, and hypobranchial length) and pharyngobranchials (PB, only in Scombridae); 13) length of GR measured for five GR on each branchial: at the ceratobranchial close to epi-cerato joint, at dorsal end of epibranchial, and at the ventral end of the hypobranchial (indicated by yellow lines); 14) width of GR; 15) distance between GR; 16) height of GR; 17) vertical position of denticles on the GR; 18) length of denticles; 19) distance between denticles; 20) open area ratio. Examples of calculated filtration parameters such as (B) filtration area for each GA and (C) minimum and maximum mesh size.
GA length (parameter 12) was determined as the sum of the measured length of epi-, cerato- and hypobranchial, respectively (Figure 2). The length of the epibranchial was measured from the epibranchial–ceratobranchial joint to the last dorsal GR along the anterior facing side of the GA. The length of the ceratobranchial was measured from the epibranchial–ceratobranchial joint to the last ventral GR before the cerato-hypobrachial joint, and the length of the hypobranchial was measured from the cerato-hypobrachial joint to the last ventral GR of the hypobranchial along the anterior facing side of the GA. If the cerato-hypobrachial joint was not visible, the cerato- and hypobranchial were measured together. The length of the pharyngobranchials, if present, was measured separately and not accounted into the GA length. GR length (parameter 13) was measured for five anterior and, if present, posterior facing GR on each epi-, cerato-, and hypobranchial, i.e., at the dorsal and ventral ends of the epibranchial and hypobranchial, respectively, where they are shortest, and close to the epibranchial–ceratobranchial joint at the ceratobranchial where they are longest (Magnuson and Heitz, 1971). GR width, distance, and height were measured at their base close to the GA (parameters 14–16). Vertical position of the denticles was measured laterally from the GR edge facing the buccal cavity to the base of the denticles (parameter 17). Length and distance between denticles (parameter 18 and 19) were measured on GR close to the base. Measurements on structures were taken five times for different GR and 10 times for different denticles. The open area ratio (parameter 20) was determined in a black–white image by measuring the area occupied by GR and denticles compared to the open area where water can flow through (Figure 2A). The fish heads and GAS were rinsed in the direction of the natural flow with tap water to remove blood, food particles, and mucus. If agglomerations of mucus were present, it was removed with tweezers and noted in Table 1 as “yes” for mucus presence.

Table 1 Selection of measured and calculated parameters for the analyzed species divided into: habitus and head, gill arches, gill raker and denticles, filtration parameters, and feeding behavior and fluid dynamics.
A maximum of 765 measurements were taken per individual, when all measurements were applicable (see Supplementary Information for raw data). Dissections and measurements on the fresh samples were carried out within 8 h, and all analyzed structures were kept in water at all times to prevent artifacts from drying. After dissection, each GAS was fixed in 5% formaldehyde and dehydrated in increasing ethanol concentration up to 70% ethanol for long-term fixation.
2.3 Micro-CT scanning
One additional individual of each species, was selected for micro-CT scanning to visualize the three-dimensional arrangement of the GAS in an open-mouth position (Figure 1). The head was cut off from the body and pinned upwards in an open-mouth position onto Styrofoam with needles inserted through the cranium and hyoid retractor muscle to pull down the lower jaw. The samples were then fixed in 5% formaldehyde, dehydrated in increasing ethanol concentrations up to 70%, and stained with PTA. Afterwards, the large needles were removed and replaced by small needles to hold the head in place for scanning. The fixation process was sufficient to harden the tissues and keep the head in an open mouth position. Each head was scanned with a Bruker SkyScan 1173 (for scanning parameters, see Supplementary Information S1) at the Leibniz-Institute for the Analysis of Biodiversity Change (LIB). The scans were reconstructed with NRecon (Version 1.7.5.9), and volume renders were created with Drishti (Version 2.6.4) (Limaye, 2012). Virtual cross-sections of the fish heads were made in the sagittal plane along the hyoid bone and in the frontal plane close to the epi-ceratobranchial joint on GA1 with dorsal view on the ventral side of the GAS (Figure 1).
2.4 Feeding behavior
Public aquaria across Europe were contacted to film the feeding behavior and determine swimming speed before and during feeding. Fishes were filmed for several minutes with the camera (Sony RX 10 Mark IV, 25 fps) and LED light positioned on tripods outside the tanks. The fishes were given their usual food, but it was crushed and decreased in size to increase the chances of filter feeding (Crowder, 1985; Garrido et al., 2007). Scomber scombrus were fed with a mixture of small crustaceans, shrimps, and blue mussels, which were crushed by hand to decrease the size. Clupea harengus were fed with small crustaceans and pellets, and S. pilchardus were fed with pellets crushed in a blender. Due to travel restrictions during the coronavirus disease 2019 (COVID-19) pandemic, a video footage for E. encrasicolus was taken by the aquarium curator with a GoPro (30 fps) in a quarantine tank and sent to the authors. From these recordings, only swimming speed was measured because of quality issues. Rastrelliger kanagurta is not held in captivity, so field footage was organized from dives in the Red Sea by amateur divers.
The footage was analyzed in ImageJ (Version 2.3.0). Measurements were taken only in frames where the individuals were parallel to the camera with their total length visible. Head length and jaw angle were measured relative to standard length of each individual (parameters 1, 2, 4, and 5 in Figure 2A). Assuming isometric allometry in adult fish of these species, the measurements were multiplied by the mean standard length of each species obtained from the dissected individuals to allow comparison. The swimming speed was determined by using the Manual Particle Tracing Module in ImageJ. Sequences of at least 10 frames were measured by following the eye of the fish and dividing the travelled distance by the standard length. Feeding behavior was determined based on whether the mouth was open or closed. Filter feeding in S. scombrus and R. kanagurta was followed by quick closing and opening of the mouth, which is likely to be swallowing of the prey items and was described for ram-feeding basking sharks (Hallacher, 1977; Sims, 2000). In accordance with technical filters, we describe this behavior as “cleaning” because particles are removed from the buccal cavity and GAS. Due to the aquaria holding conditions, it is possible that the same individuals of the shoal were measured several times.
2.5 Fluid flow and particle movement in GAS
The same fish heads that were prepared for micro-CT scanning were also used to analyze the particle movement in the buccal cavity under laminar flow conditions in a water tunnel. Therefore, the fish heads were pinned on a streamlined holder in the test section facing the incoming flow (for water tunnel setup and description, see Supplementary Information S2). The flow velocity was set to 6.5 cm/s because this shows the best laminar conditions in this water tunnel. Four dissection steps were proceeded: 1) intact head, 2) removal of the right operculum and replacement with a transparent foil, 3) removal of the left operculum and replacement with a transparent foil, and 4) removal of the right GA1 to be able to look inside the buccal cavity (Supplementary Information Figure S2A). In step 2, the transparent foil was cut from clear sheet protectors for papers and held in position with needles in the anterior part of the mouth to close up with the fish skin. The posterior part was left open and positioned in such a way that it mirrored the remaining left operculum regarding length, dorsal–ventral curvature, and opening distance. Brine shrimp eggs (Artemia salina, 1.09 g/cm³, (Haines and Sanderson, 2017)) were added to the water in the last dissection step to analyze particle velocity and particle movement inside the buccal cavity. A zoom body tube (Navitar 1-60135) combined with a coupler (Navitar 1-6010) and a c-mount (LMScope) to fit the Nikon D850 camera were used to take close-up videos (100 fps) of the brine shrimp eggs without the fish heads in the test section and when the fish heads were added at the entrance of the mouth opening and at the inside of the GR of the left GA1. The videos of brine shrimp eggs were analyzed using ImageJ (Version 2.3.0) and the Manual Tracking plugin. The average egg size was determined under a microscope (Keyence VHX-700F, Ver 2.3.8.2 with lens VH-Z20R RZx20-x200, System Ver 1.93) as 0.242 ± 0.019 mm (N = 30) and was used to set the scale in the videos and approximate the velocity of the moving eggs. The velocity was only measured for particles within the focal plane to ensure that the interaction with the focused structures was tracked. Four different particle movements were distinguished: free (no contact with surfaces), out (particles leaves the GAS through the mesh), roll (contact with a surface and particle keeps moving), or stop (contact with a surface that leads to no further movement). The number of particles for each behavior was divided by the total number of particles for each species to describe the share of particle movement.
In order to observe the influence of the dissection on the flow through the head, black ink was injected at the middle axis of the mouth opening for each dissection step. A camera (Nikon D850, Nikkor AF-S 24-120 mm 1:4 G ED) was mounted outside the tank to film the right side of the fish. Three videos were taken for each dissection step. The ink streamline was checked for laminarity between each video without the fish head. Close-up videos were taken of the GAS at the entrance of the mouth opening, the outside of the GR of the right GA1, and the inside of the GR of the left GA1 during dissection step 3 and 4. The videos were visually analyzed, and the ink streamlines were described by direction, distribution, and diffusion for each dissection step of each species. Single frames were extracted that are exemplary for the recorded videos and show all aspects of observed ink motion (Supplementary Information S3).
2.6 Calculation of filtration parameters
The calculation of the total filtration area (A) of each GA of the left side is based on the sum of the area calculated for the upper (u) and lower (l) GA individually, similar to Magnuson and Heitz, 1971. As we only measured five GR on each epi-, cerato- and hypobranchial, we multiplied the mean GR length and the mean distance between GR with GR number (NGR) for each upper and lower GA, as shown here for the anterior side of GA1:
We assume that GR length decreases linearly from the longest GR at the ceratobranchial towards the distal ends of the epibranchial and hypobranchial, respectively (Figure 2B). The same calculation was used to calculate the posterior area if present. The total filtration area is the sum of all calculated areas between the GA and the area between GA and the operculum. The area between GA4 and GA5 was not included because epibranchial and hypobranchial GR on GA5 were partly missing in the clupeid species and absent on GA5 in the scombrid species. The filtration area formed by posterior GR in the clupeid species was also not included because there were only a few GR on the ceratobranchial and the formula was not applicable. The total filtration area was only calculated for individuals for which all measurements were possible. Finally, the area was doubled to include the filtration area of the right side of the fish. The symmetry of the GAS is determined by the ratio of upper area (UA), formed by the GR of the epibranchial, to lower area (LA), formed by the GR of the cerato- and hypobranchial of each GA.
The closed area (area that is covered by the GR and denticles) and open area (open space through which the water can flow) were measured in pictures taken at the anterior ceratobranchial of each GA. The open area ratio is calculated as the ratio of open area to the sum of open and closed area:
Because the open area ratio remained similar from GA1 to GA5 in the clupeiform species, the mean open area ratio at the ceratobranchial of GA1 was used to calculate the open area of each GA based on the calculated total filtration area. It was not possible to measure the open and closed area on GA2 to GA4 in the scombriform species because of the high density of denticles, and we thus calculated the open area ratio in the same way as for the Clupeiformes.
The relative open area of each GA is calculated by the open area of that GA divided by the total area of all GA.
The fluid exit ratio (Brooks et al., 2018) is calculated as the ratio of the total open area to the open mouth area:
Depending on the position of opposing GR and denticles, the mesh size can be calculated as minimum or maximum mesh size (Figure 2C) and also be understood as the minimum size of particles that are retained (Collard et al., 2017). The minimum mesh size (MSmin) is formed if denticles between two GR are alternating, so it is calculated as the product of denticle distance and denticle length:
The maximum mesh size (MSmax) is formed if denticles between two GR are directly opposite of each other, so it is calculated as the product of the denticle distance and the gap between the two GR:
A decrease or increase in mesh size from anterior to posterior GA can be determined by the ratio of the mesh size from GA1 to GA4. The mesh size ratio was based on the mean of the minimum and maximum mesh size.
The Reynolds number describes the local flow regime based on the ratio of inertial to viscous forces. It is an important indicator to identify the type of particle encounter with the filter medium, e.g., hydrosol filtration theory (Rubenstein and Koehl, 1977). It was calculated as:
The density ρ is 1.027×10³ kg m–3, and the dynamic viscosity μ is 0.00141 kg/(m–1 s-1) for seawater at 10°C. The flow velocity v was measured as the swimming velocity in the videos during feeding as standard length per second multiplied by the standard length of the dissected species (Table 1). The Reynolds number was calculated around the fish (L = standard length, Table 1), at the mouth opening (L = equivalent spherical diameter of open mouth height and width), and around the denticles (L = denticle width on anterior GR of GA1, Table 1). To account for the reduced flow velocity inside the buccal cavity due to hydrodynamic drag, we calculated a reduction factor based on our measurements in the water tunnel experiments. The reduction factor at the mouth opening was calculated as 83.2% ± 10.7%, which is the mean velocity of brine shrimp eggs at the mouth opening across all species divided by the brine shrimp egg velocity when no fish head was in the water tunnel. The reduction factor at the denticles was calculated as 42.3% ± 11.8%, which is the mean velocity of brine shrimp eggs at GA1 across all species divided by the brine shrimp egg velocity when no fish head was in the water tunnel. For comparison, the Reynolds number was calculated at the mouth opening for the fish heads in the water tunnel with v = 0.065 m/s and the reduction factor of 83.2 ± 10.7%. The volume flowrate through the mouth was calculated as the open mouth area multiplied by the mean swimming velocity and the reduction factor at the mouth opening.
2.7 Statistics
The results were analyzed and visualized using the R programming environment (R Core Team, R Studio Version 3.6.3.) and Scribus (Version 1.5.6.1). Descriptive statistics of untransformed data were calculated for all measured and calculated parameters. Measurements are reported as mean with standard deviations. Ratios were calculated based on means and reported without standard deviation. All boxplots show the median and upper and lower quartiles as whiskers and outliers, respectively. In order to investigate the relationship of morphological traits, we used principal component analysis (PCA) based on 19 parameters, including 10 absolute values and nine relative values (Table 1). Variables were not included if they were binary or partly binary (i.e., number of posterior GR, position of denticles, mucus, teeth, additional structures), angles (i.e., lip angle, jaw angle), or if they were used to calculate filtration parameters and therefore not independent. To limit the number of variables, only data concerning GA1 were included, e.g., for GR number, open area ratio, or mesh sizes. Of the included 817 data points, 98 were missing, which were imputed for the PCA by the mean of each variable for each species, respectively (Dray and Josse, 2015). Afterwards, we performed a regression of each log-transformed variable with the log-transformed standard length to extract the residuals and correct for size. The PCA with the residuals was based on a correlation matrix (scale = TRUE, center = TRUE). A threshold of 75% was chosen to select the principal components (PCs) that explain most of the variance. The loadings of these PCs were extracted and ranked, respectively, based on their absolute values (or modulus) to identify essential contributors. The same dataset was used to calculate a correlation matrix and identify potential functional relation for each parameter combination. Because some of the data were not normal distributed, we used the Spearman rank test to calculate the correlation coefficient. The comparison of the jaw angle in the dissected individuals and the videos and the comparison of the swimming speed before and during feeding were done with a Kruskal–Wallis rank sum test (chi-squared) with a post-hoc Dunn test (method “Holm”).
3 Results
3.1 Morphometrics and filtration parameters
Scomber scombrus is the largest species analyzed with 269.4 ± 4 mm as standard length, followed by C. harengus (248.2 ± 7.3 mm), R. kanagurta (210.1 ± 1 2.4 mm), S. pilchardus (118.7 ± 6.4 mm), and E. encrasicolus (97.9 ± 2.4 mm; Table 1). Standard length ranges an extra ± 2% when the mouth is open. The mouth height-to-width ratio ranges from 1.2 to 1.8, which indicates an oval opening along the ventral–dorsal axis. The jaw angle of the open mouth ranges from 45° in S. scombrus to 74° in E. encrasicolus (Table 1). The branchiostegal height is largest in R. kanagurta and smallest in E. encrasicolus ranging between 3.5 mm ± 1.3 mm to 13.0 mm ± 1.6 mm. The angle of the protruded lips is 94.8° ± 11.3° up to 168° ± 36°, closing the mouth opening at the sides. The head makes up approximately 19.8% in C. harengus and maximum 27% in R. kanagurta of the standard length. The epibranchial of GA1 begins at around two-thirds into the buccal cavity, except in E. encrasicolus in which the epibranchial starts already in the first third (Table 1).
GA length decreases from anterior to posterior (Figure 3A). An exception is S. pilchardus, in which GA2 is longer than GA1. The GA ratio describing the decrease in length from GA1 to GA5 is largest in R. kanagurta with 0.38 and smallest in C. harengus and E. encrasicolus with 0.21, meaning that GA5 is only 38% and 21% of the length of GA1, respectively (Table 1). The same trend can also be seen in the GR number on each GA (Figure 3B). Here, S. pilchardus has more GR on GA2 and GA3 than on the first, while GR distance remains similar. The two mackerel species S. scombrus and R. kanagurta have anterior and posterior GR, of which the number of posterior GR is only marginally reduced. For example, R. kanagurta has, on average, 53 anterior GR and 43 posterior GR with similar GR distance. There are no GR on GA5 in the two mackerel species. Clupea harengus and E. encrasicolus have posterior GR only on GA4 and GA5. Sardina pilchardus has posterior GR only on GA4. One individual has posterior GR on GA2 and GA3, counting 7 and 3 in number (Figure 3B).
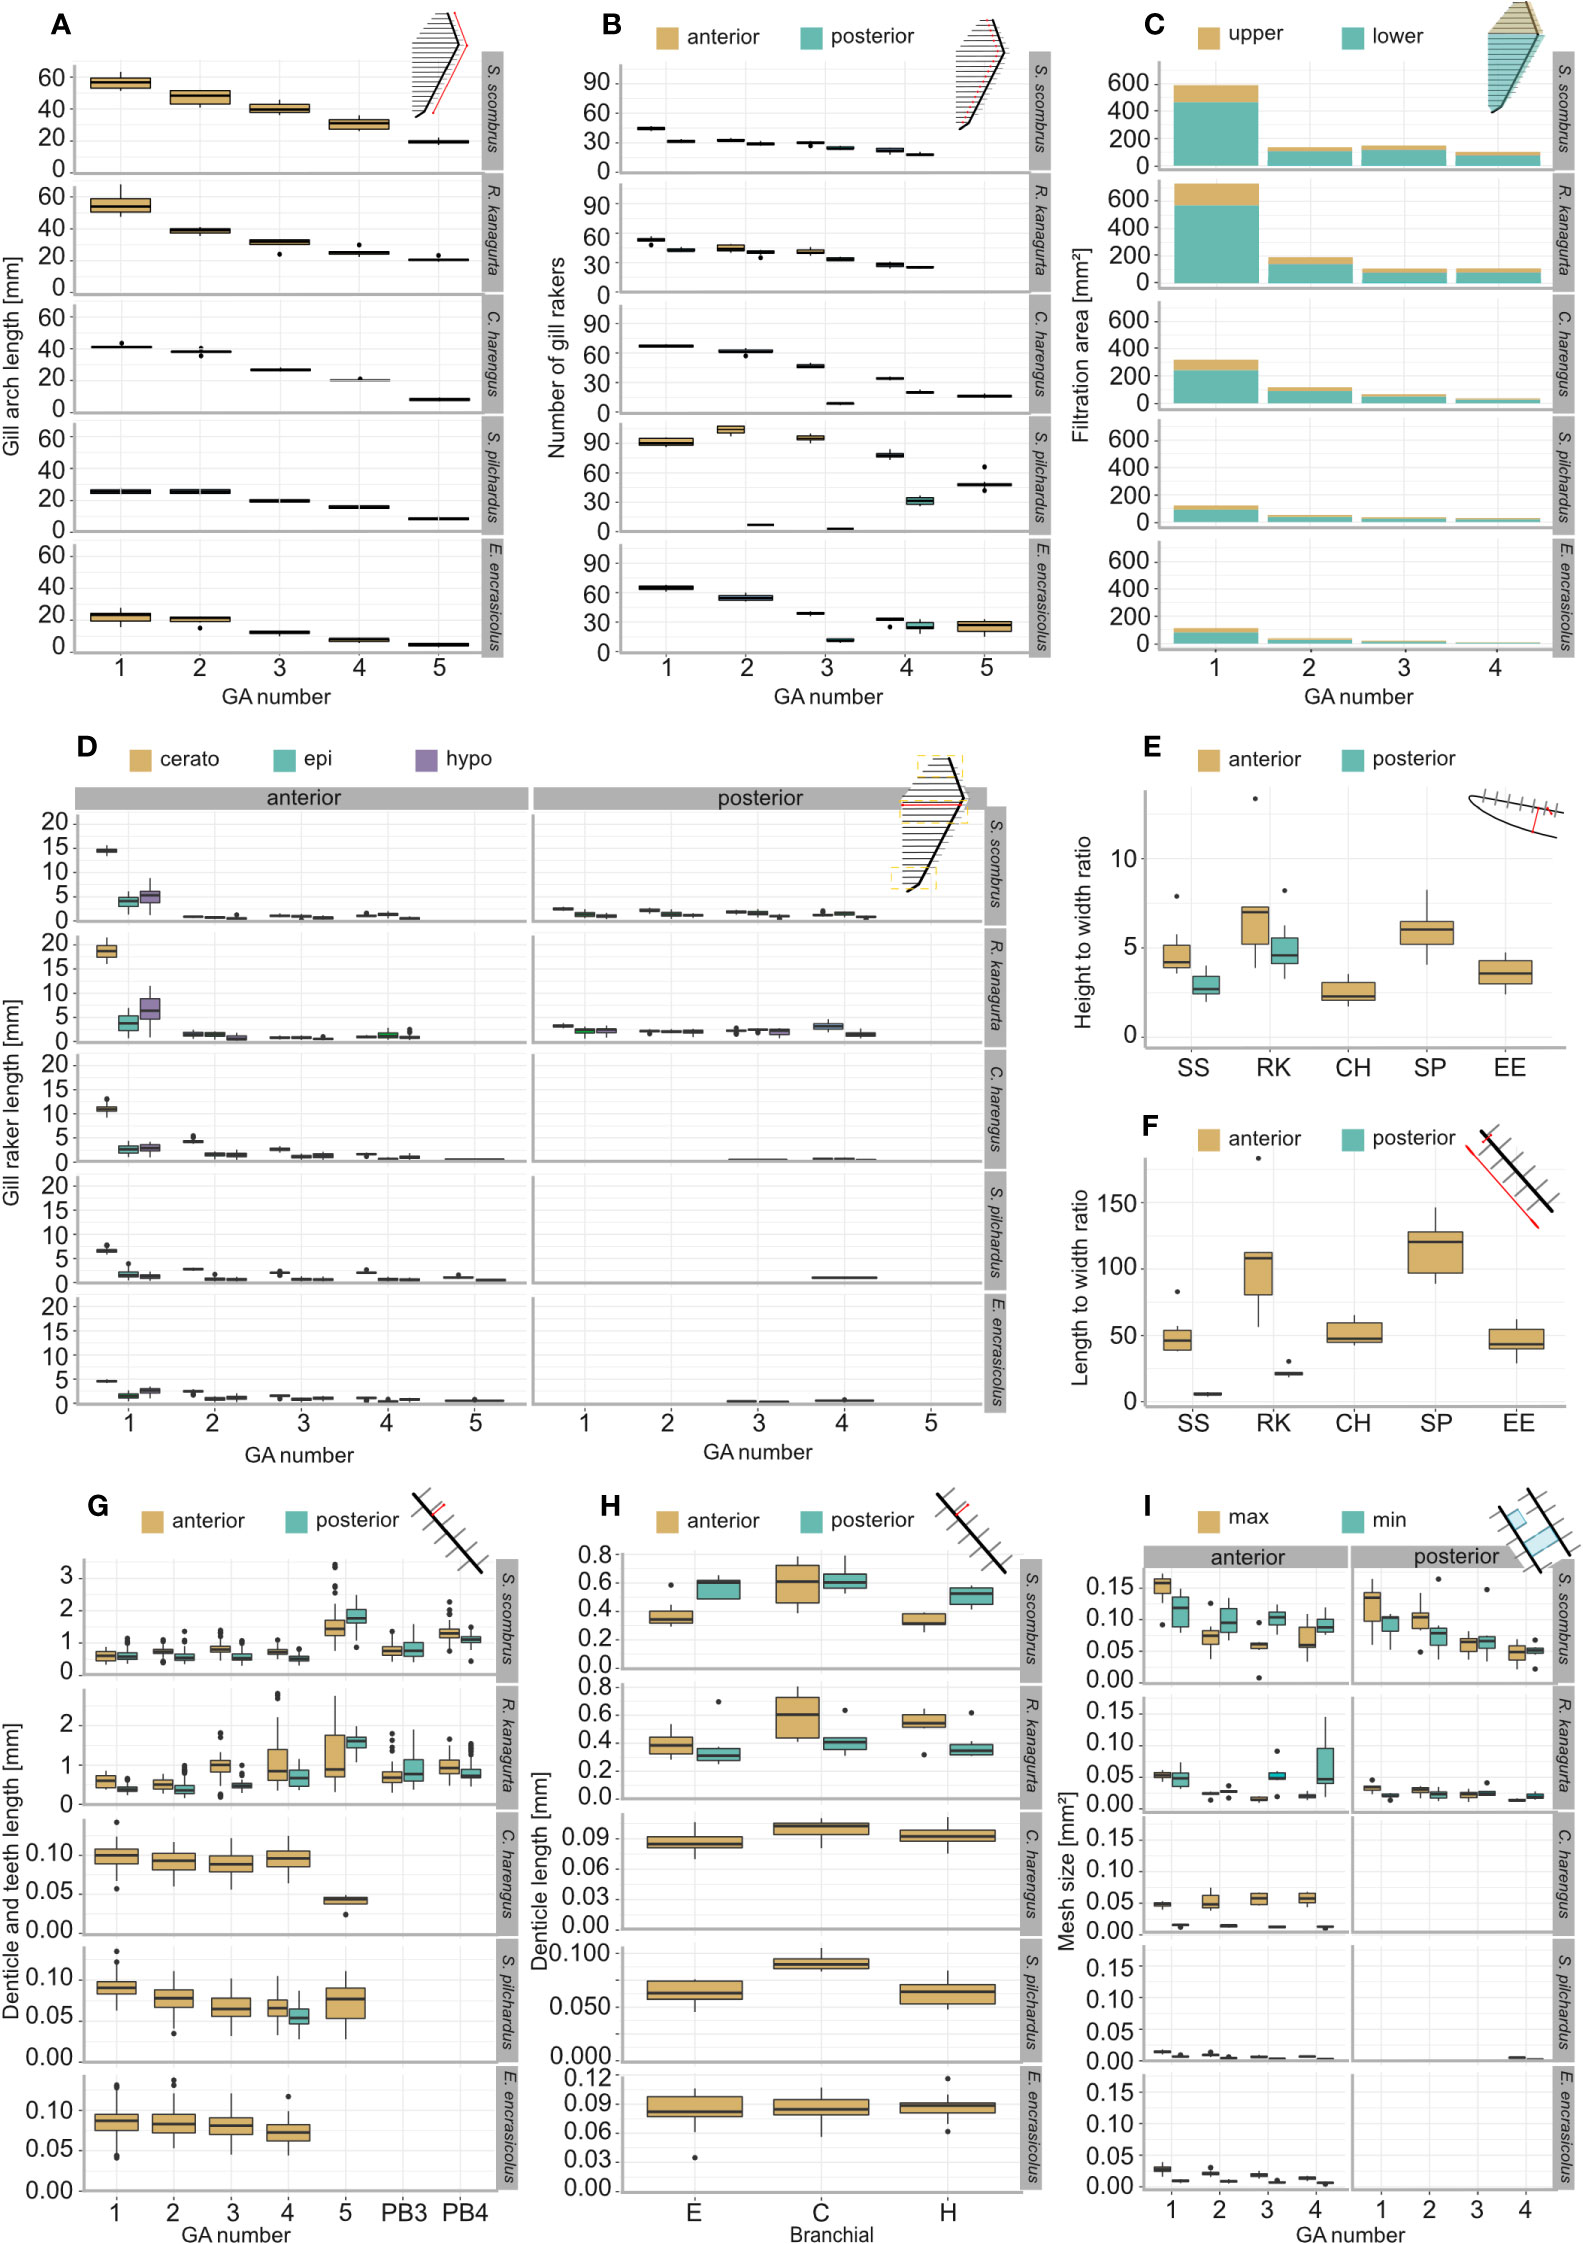
Figure 3 Morphometric measurements and filtration parameters of the studied ram-feeding fishes S. scombrus (SS), R. kanagurta (RK), C. harengus (CH), S. pilchardus (SP), and E. encrasicolus (EE): (A) Gill arch (GA) length, (B) gill raker (GR) number on the anterior and posterior side of each GA, (C) filtration area of upper (epibranchial) and lower (cerato- and hypobranchial) GA, (D) GR length on epi-, cerato- and hypobranchial on the anterior and posterior side of each GA, (E) height-to-width ratio of GR on GA1, (F) length-to-width ratio of the GR on GA1, (G) denticle length of the anterior and posterior GR of each GA and on pharyngobranchial 3 and pharyngobranchial 4 in the two scombrid species, (H) denticle length of the anterior and posterior GR on each branchial of GA1, and (I) minimum and maximum mesh size of the anterior and posterior sides of the first four GA.
The total filtration area is largest in R. kanagurta with 2,280.8 ± 156.2 mm2 and smallest in E. encrasicolus with 367.2 ± 29.0 mm2 (Table 1, Figure 3C). The symmetry of upper to lower GA darea is in all species between 0.28 and 0.4, meaning that the filtration area created by the GR on the epibranchial is smaller than the filtration area on cerato and hypobranchial of each GA (Table 1, Figure 3H). The open area ratio of GA1 ranges between 0.51 and 0.57 in S. scombrus, R. kanagurta, C. harengus, and S. pilchardus. In E. encrasicolus, the open area ratio is 0.71 (Table 1). In S. scombrus and R. kanagurta, the relative open area is highest at the first gap with 60.4% and 63.8% and lowest at the fourth gap formed by the posterior GR of GA3 and anterior GR of GA4 with 10.5% and 9.7%, respectively. In the three clupeid species, the relative open area at the first gap ranges between 50.8% and 61.0%, at the second gap between 21.2% and 21.7%, at the third gap between 12.0% and 14.8%, and at the fourth gap between 5.8% and 12.5% (Table 1). The fluid exit ratio ranges between 1.4 in R. kanagurta and 4.5 in S. pilchardus, which means that the open area of the filtration area is larger than the open mouth area (Table 1).
GR are longest on GA1 in all five species (Figure 3D). In Scombriformes, the length of the GR is abruptly shorter in GA2 to GA4, and GA5 has no GR. In Clupeiformes, the length decreases more evenly from GA1 to GA5. Within one GA, GR length is largest on the ceratobranchial and smallest on the distal ends of epi and hypobranchial. The GAS length, determined by the sum of the mean GR length at the ceratobranchial of all GA, is longest in R. kanagurta with 32.5 mm ± 2.5 mm and smallest in E. encrasicolus with 10.6 mm ± 0.8 mm (Table 1). The mean of the length-to-width ratio of the anterior GR on GA1 varies between 46.3 and 114.1 (Table 1, Figure 3F). The mean length-to-width ratio of the posterior GR in S. scombrus and R. kanagurta ranges from 10 to 25. The height-to-width ratio of the GR on GA1 ranges between 3.5 and 8 (Figure 3F).
The denticles in S. scombrus and R. kanagurta sit on top of the anterior, blade-shaped GR on GA1. They are spaced at regular intervals, thin (Figure 4), and measure approximately 0.59 mm ± 0.16 mm in length on GA1 in both species (Table 1). The denticles on the ceratobranchial of the GR on GA1 are longer than on the epi- and hypobranchial (Figure 3H). On the shorter, posterior GR of GA1 and anterior and posterior GR on GR2, GR3, and GR4, the denticles vary strongly in size (Figure 3G) but are irregularly arranged and closer together (Figure 4). Other scombrids were described to bear patches of tiny teeth on most GA (Collette and Gillis, 1992). Based on the outer appearance, it is difficult to tell denticles and teeth originating from GR apart (Figure 4), which might explain the high variance in length. We assume that structures originating from the GA are mainly teeth and less denticles. Because GA5 has no GR, we assume that the measured structures are only teeth. These teeth are generally longer, ranging in length approximately 1.5 mm (Figure 3G), and appear thicker and sturdier. Additionally, part of the five GA in the two species of Scombriformes are four pharyngobranchials, of which the third and fourth are visible within the oral cavity and bear teeth (Figures 1, 5), as described for R. kanagurta (Gnanamuttu, 1966). On each side, the pharyngobranchials are located dorsally between the epibranchials of GA3 and GA4 and opposite of GA5 (Figure 5). The more anterior third pharyngobranchial is small and slender with small teeth, and the posterior fourth pharyngobranchial is rectangular and has more pronounced teeth. For other species within the Scombridae, e.g., Grammatorcynus bicainatus, the pharyngobranchials were also described as pharyngeal tooth patches (Collette and Gillis, 1992).
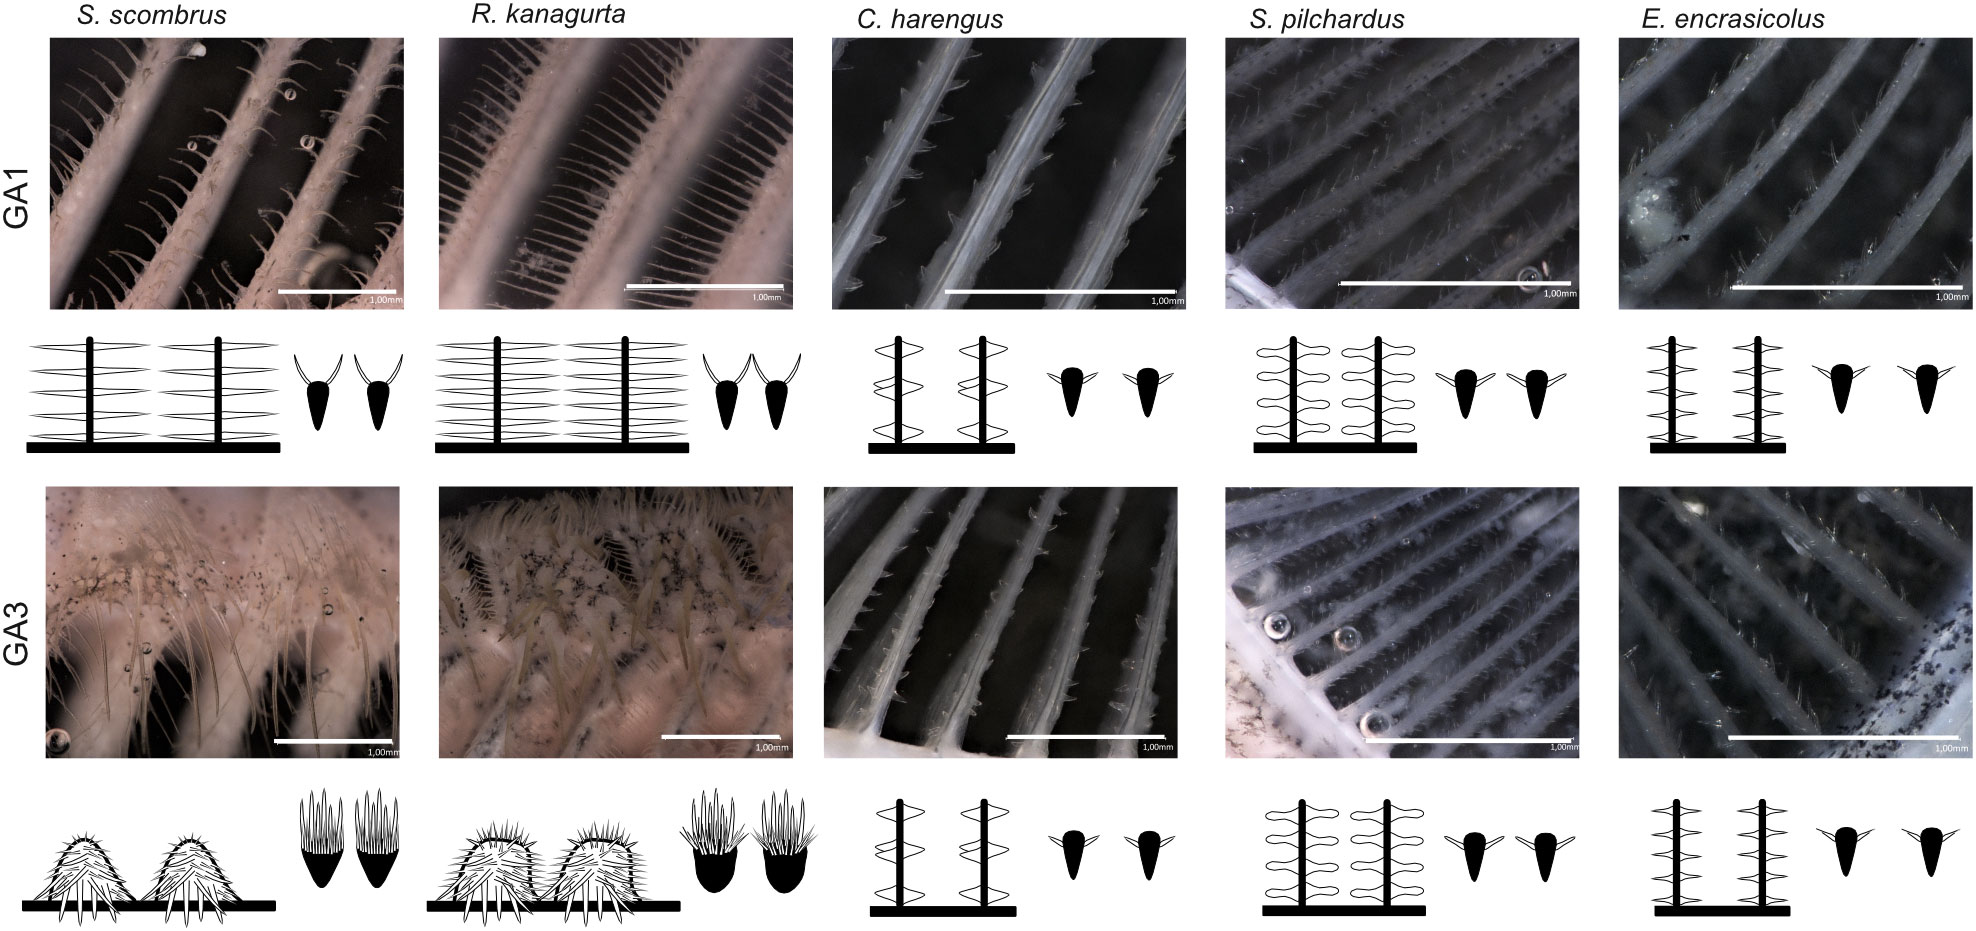
Figure 4 Denticle shape of the anterior GR on GA1 and GA3 for each species with view from inside the buccal cavity onto the flow facing side of GR and denticles (left) and cross-section through the GR and denticles (right), respectively. Scale bar 1 mm, drawings not to scale to each other.
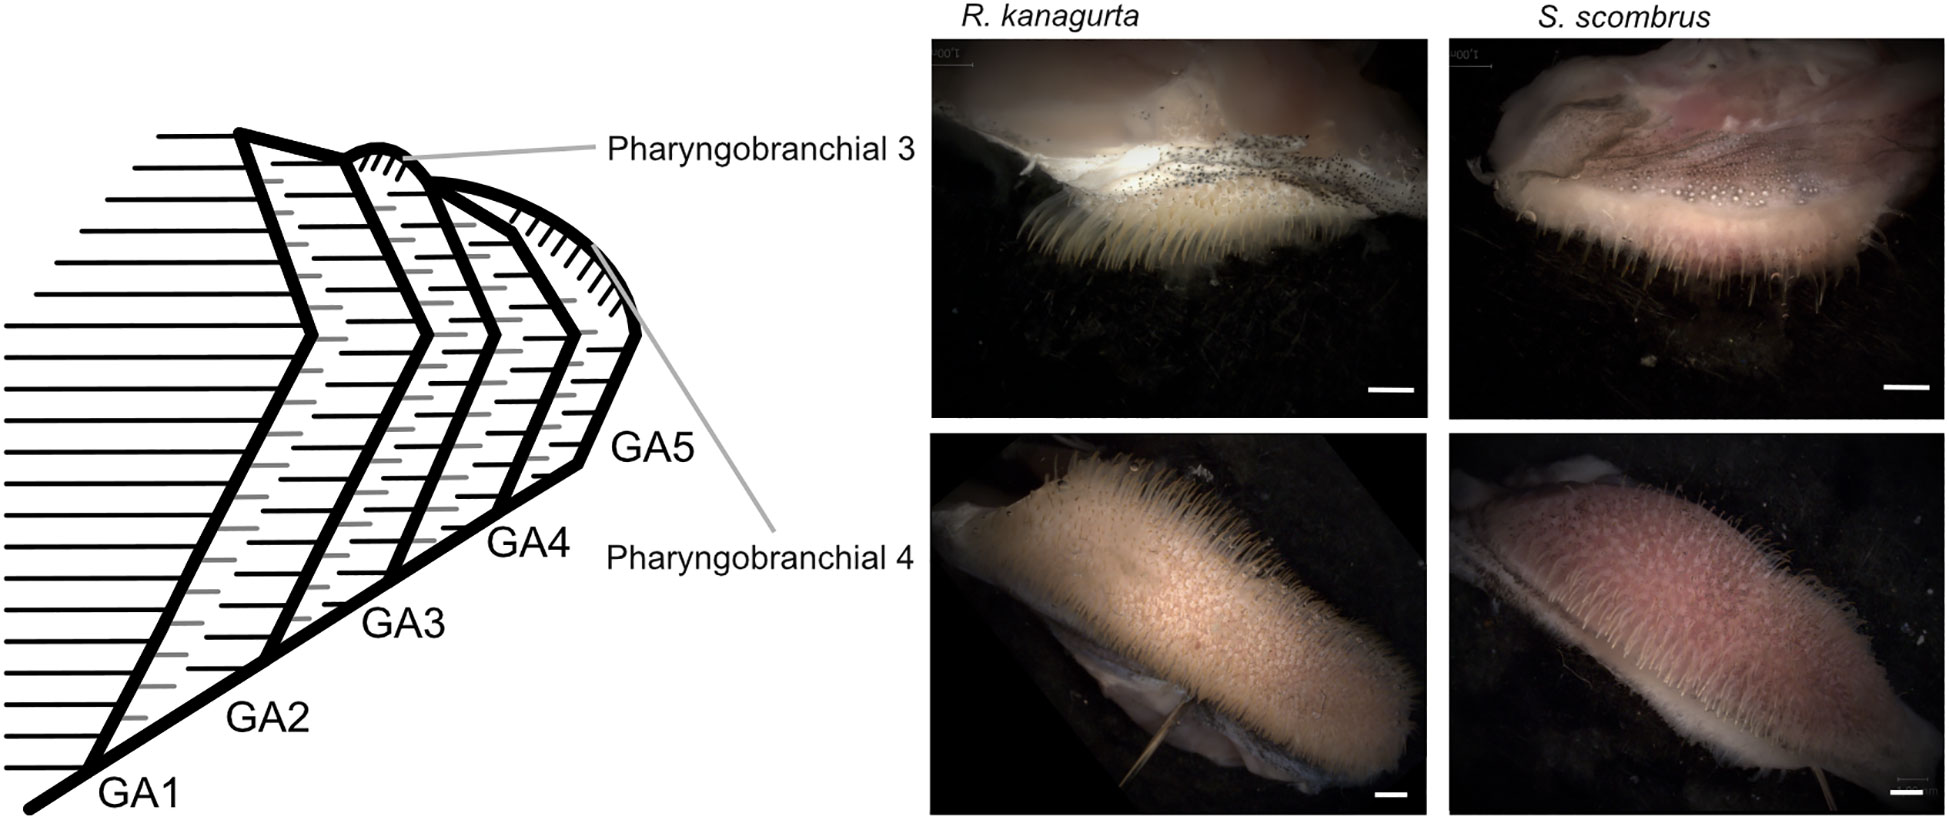
Figure 5 Position of pharyngobranchial 3 and pharyngobranchial 4 within the gill arch system and gill arches in R. kanagurta and S. scombrus. Scale bar, 1 mm.
The denticles of C. harengus, S. pilchardus, and E. encrasicolus are at regular distances at the sides of the GR blades of GA1 at approximately a relative distance of 0.17, 0.27, and 0.23 of the height measured from the interior face of the GR (Table 1). They are short, vary in shape between the three species (Figure 4), and were described as conical, diabolo shaped, and sickle shaped (Collard et al., 2017). The denticle length remains similar across all GA and is 0.098 mm ± 0.015 mm in C. harengus, 0.091 mm ± 0.013 mm in S. pilchardus, and 0.085 mm ± 0.018 mm in E. encrasicolus (Table 1, Figure 3F). The denticle length is similar across all branchials on GA1 (Figure 3H).
The calculated minimum and maximum mesh sizes are smallest in S. pilchardus with 0.007 mm2 and 0.014 mm2 and largest in S. scombrus with 0.113 mm2 and 0.148 mm2. In the clupeid species, the minimum mesh size is smaller than the maximum mesh size on all GA. In the scombrid species, this is only true for the anterior and posterior GR on GA1 and the posterior GR on GR2 (Figure 3I). Otherwise, the minimum mesh size is larger than the maximum mesh size. This is because of the different orientations of the denticles on GA2 to GA4 in the scombrid species. The denticles are directed inwards into the buccal cavity allowing much smaller distances between the denticles (see denticles on GA3 in Figure 3), which is one of the two factors in mesh size calculation (Equations 6, 7). The mesh size ratio based on the mean mesh size of GA1 to GA4 shows that the mesh size becomes smaller from anterior to posterior in S. scombrus, R. kanagurta, S. pilchardus, and E. encrasicolus. Only in C. harengus, the mesh size is smaller on GA1 compared to GA4 (Table 1).
During the dissection of the fish, mucus formation was noticed close to the esophagus in S. scombrus and R. kanagurta. GA5 and the fourth pharyngobranchial show a high amount of dark pigmented areas between the denticles and in the groove between the pharyngobranchials (Figure 6). These pigments are arranged on structures that we termed “mucus villi” because they remind of intestinal villi.
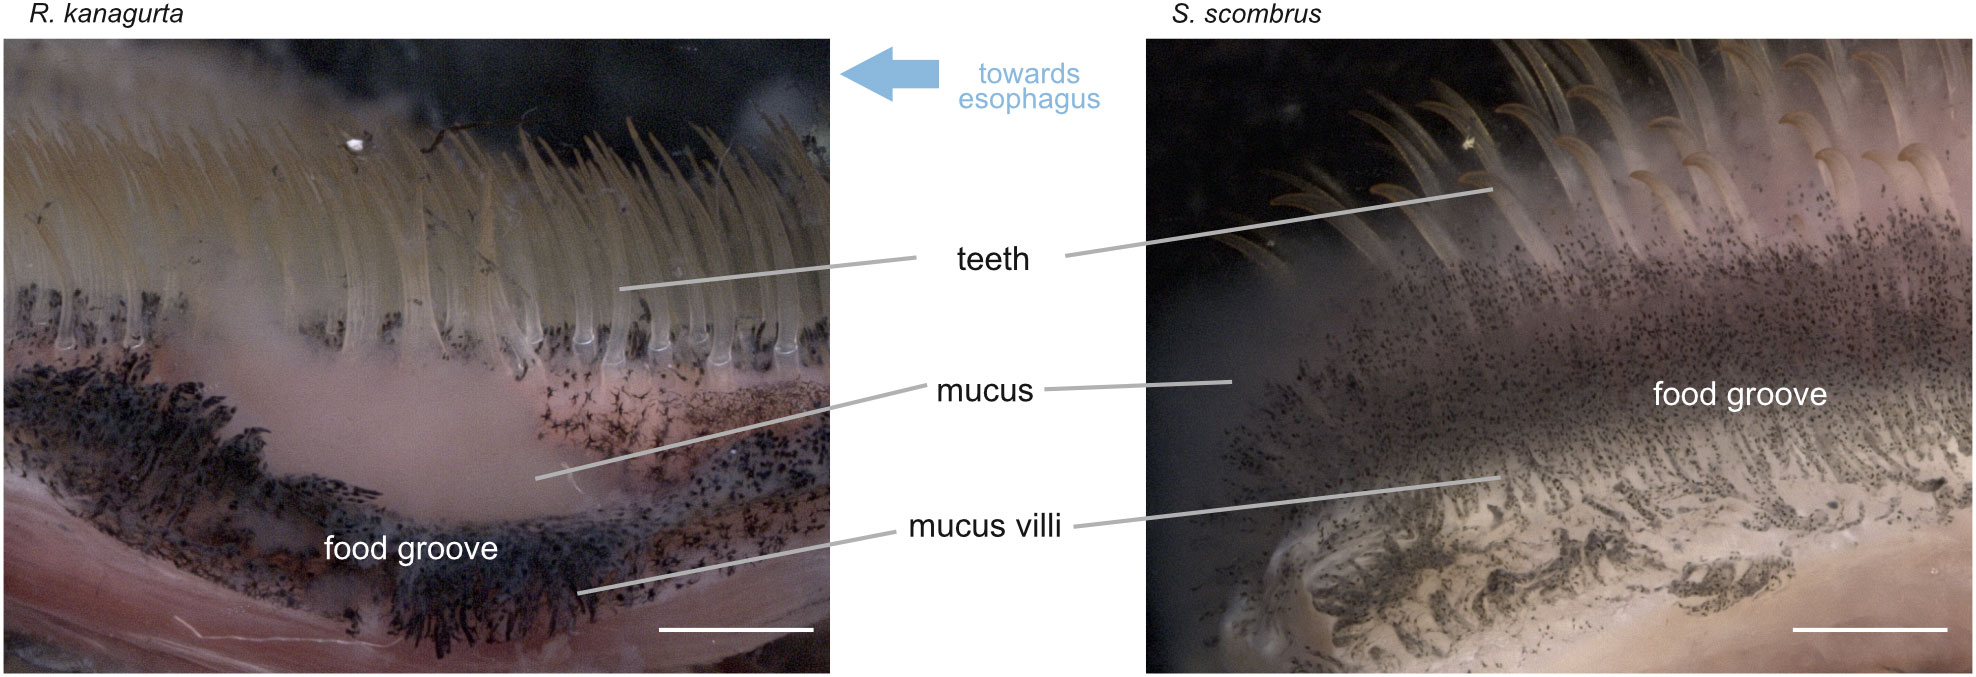
Figure 6 View of the food groove and medial side of GA5 in R. kanagurta and S. scombrus. Water flows from right to left towards the esophagus. Mucus was observed to originate from the mucus villi, which are located between the denticles and in the food groove. Scale bar, 1 mm.
3.2 Principal component analysis and correlation matrix
The first three PCs explain 80.7% of the variance in the data (Figure 7). Based on the ranking of the loadings (Supplementary Information S4), PC1 (36.8%) relates to overall geometry and size (highest loadings in descending order: GAS length, GR length on GA1, length ratio of GA1 to GA5 (GA1–5 ratio), GR height-to-width ratio, and the filtration area), whereas PC2 (31.3%) relates to the filter medium and the fluid flow (highest loadings: GR number, mesh size max, mesh size min, relative open area of GA1, and MO ratio), and PC3 (12.6%) represents the symmetry (highest loadings: symmetry, mesh size ratio, weight, fluid exit ratio, and mesh size min). In all of the combinations of the PCs, the individuals of one species cluster into distinct groups with little overlap between each other. While groups are evenly distributed in PC1, PC2 results in two groups that consist of R. kanagurta, S. scombrus, and E. encrasicolus, on the one hand, and C. harengus and S. pilchardus, on the other hand, thus not representing the two taxonomic groups Scombridae and Clupeiformes. PC3 shows a higher spread of the individuals within each group and separates the two scombrids, R. kanagurta, and S. scombrus, with the clupeid species in between them.
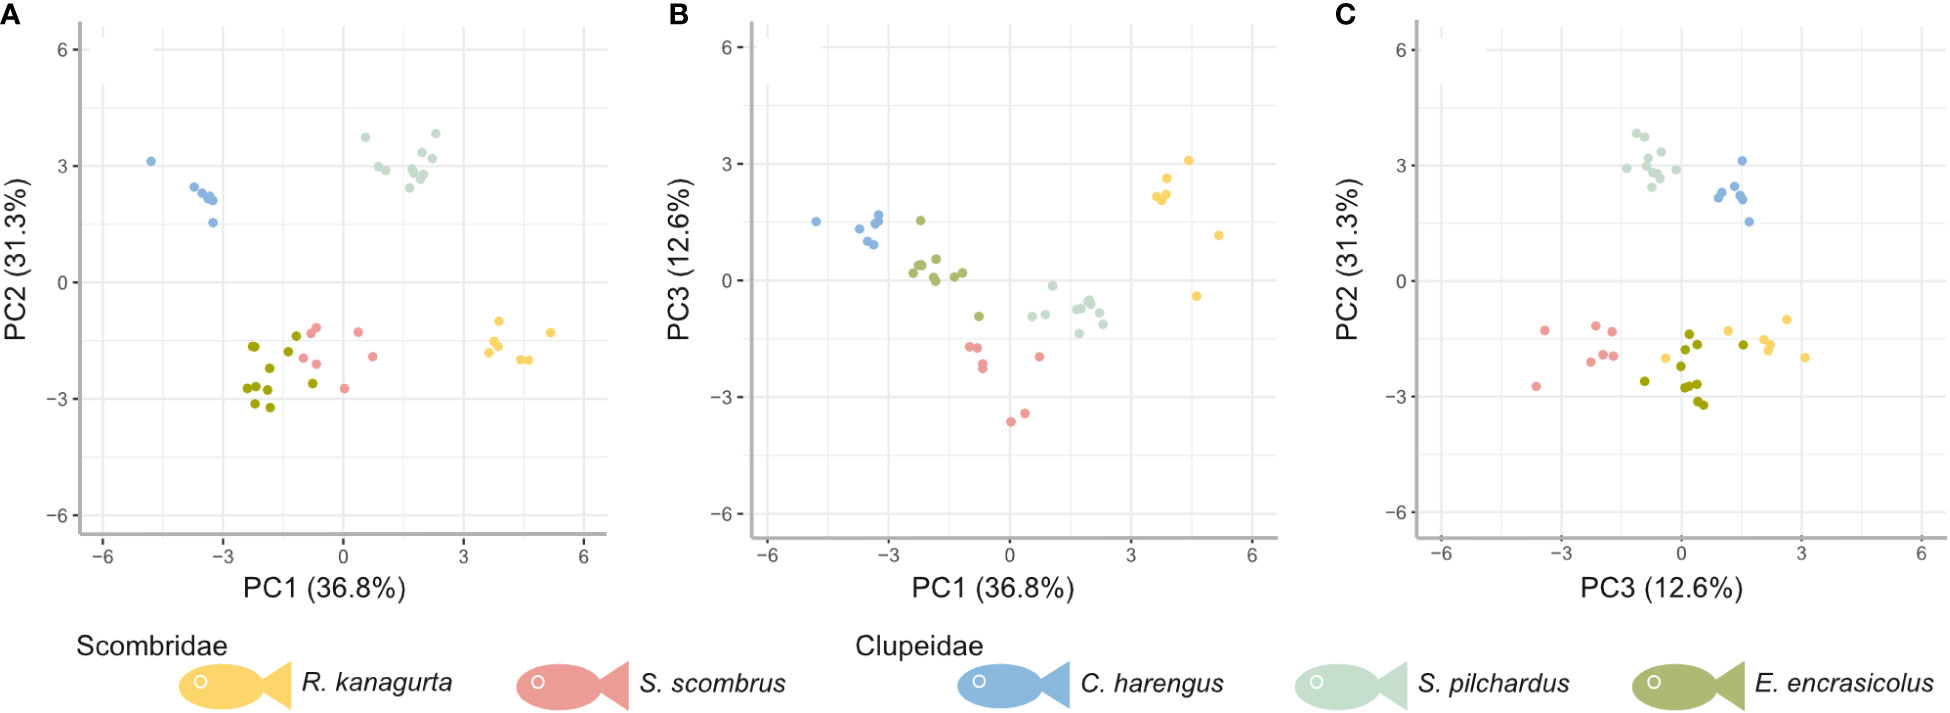
Figure 7 PCA based on the residuals to correct for allometry for five ram-feeding species (colors) in the combination of (A) principal component (PC) 1 and PC2, (B) PC1 and PC3, and (C) PC3 and PC2. PC1, PC2, and PC3 account for approximately 78.5% of the variation.
Most variables in the correlation matrix correlate positively with each other (Figure 8). Due to the high number of combinations, only the significant correlations with a correlation coefficient of ρ >0.7 are described (for detailed description and graphs, see Supplementary Information S5). For example, weight correlates positively with GAS length (ρ = 0.7), GAS length positively correlates with GR length of GA1 (ρ = 0.92), and head length correlates positively with denticle length (ρ = 0.83). Given the correction for size, this might indicate an allometric component in the above parameters and, consequently, on the filter-feeding mechanism. The longer the denticles on GA1, the larger the filtration area (ρ = 0.79), and the longer the GAS, the more cone-shaped (higher GA 1–5 ratio) and not cylindrical the GAS (ρ = 0.81). The shape of the mouth opening is more oval shaped in C. harengus and S. pilchardus and more round in the other three species. The more oval the mouth shape, the higher the number of GR on GA1 (ρ = 0.73). GR number on GA1 negatively correlates with minimum (ρ = −0.74) and maximum mesh size (ρ = −0.80).
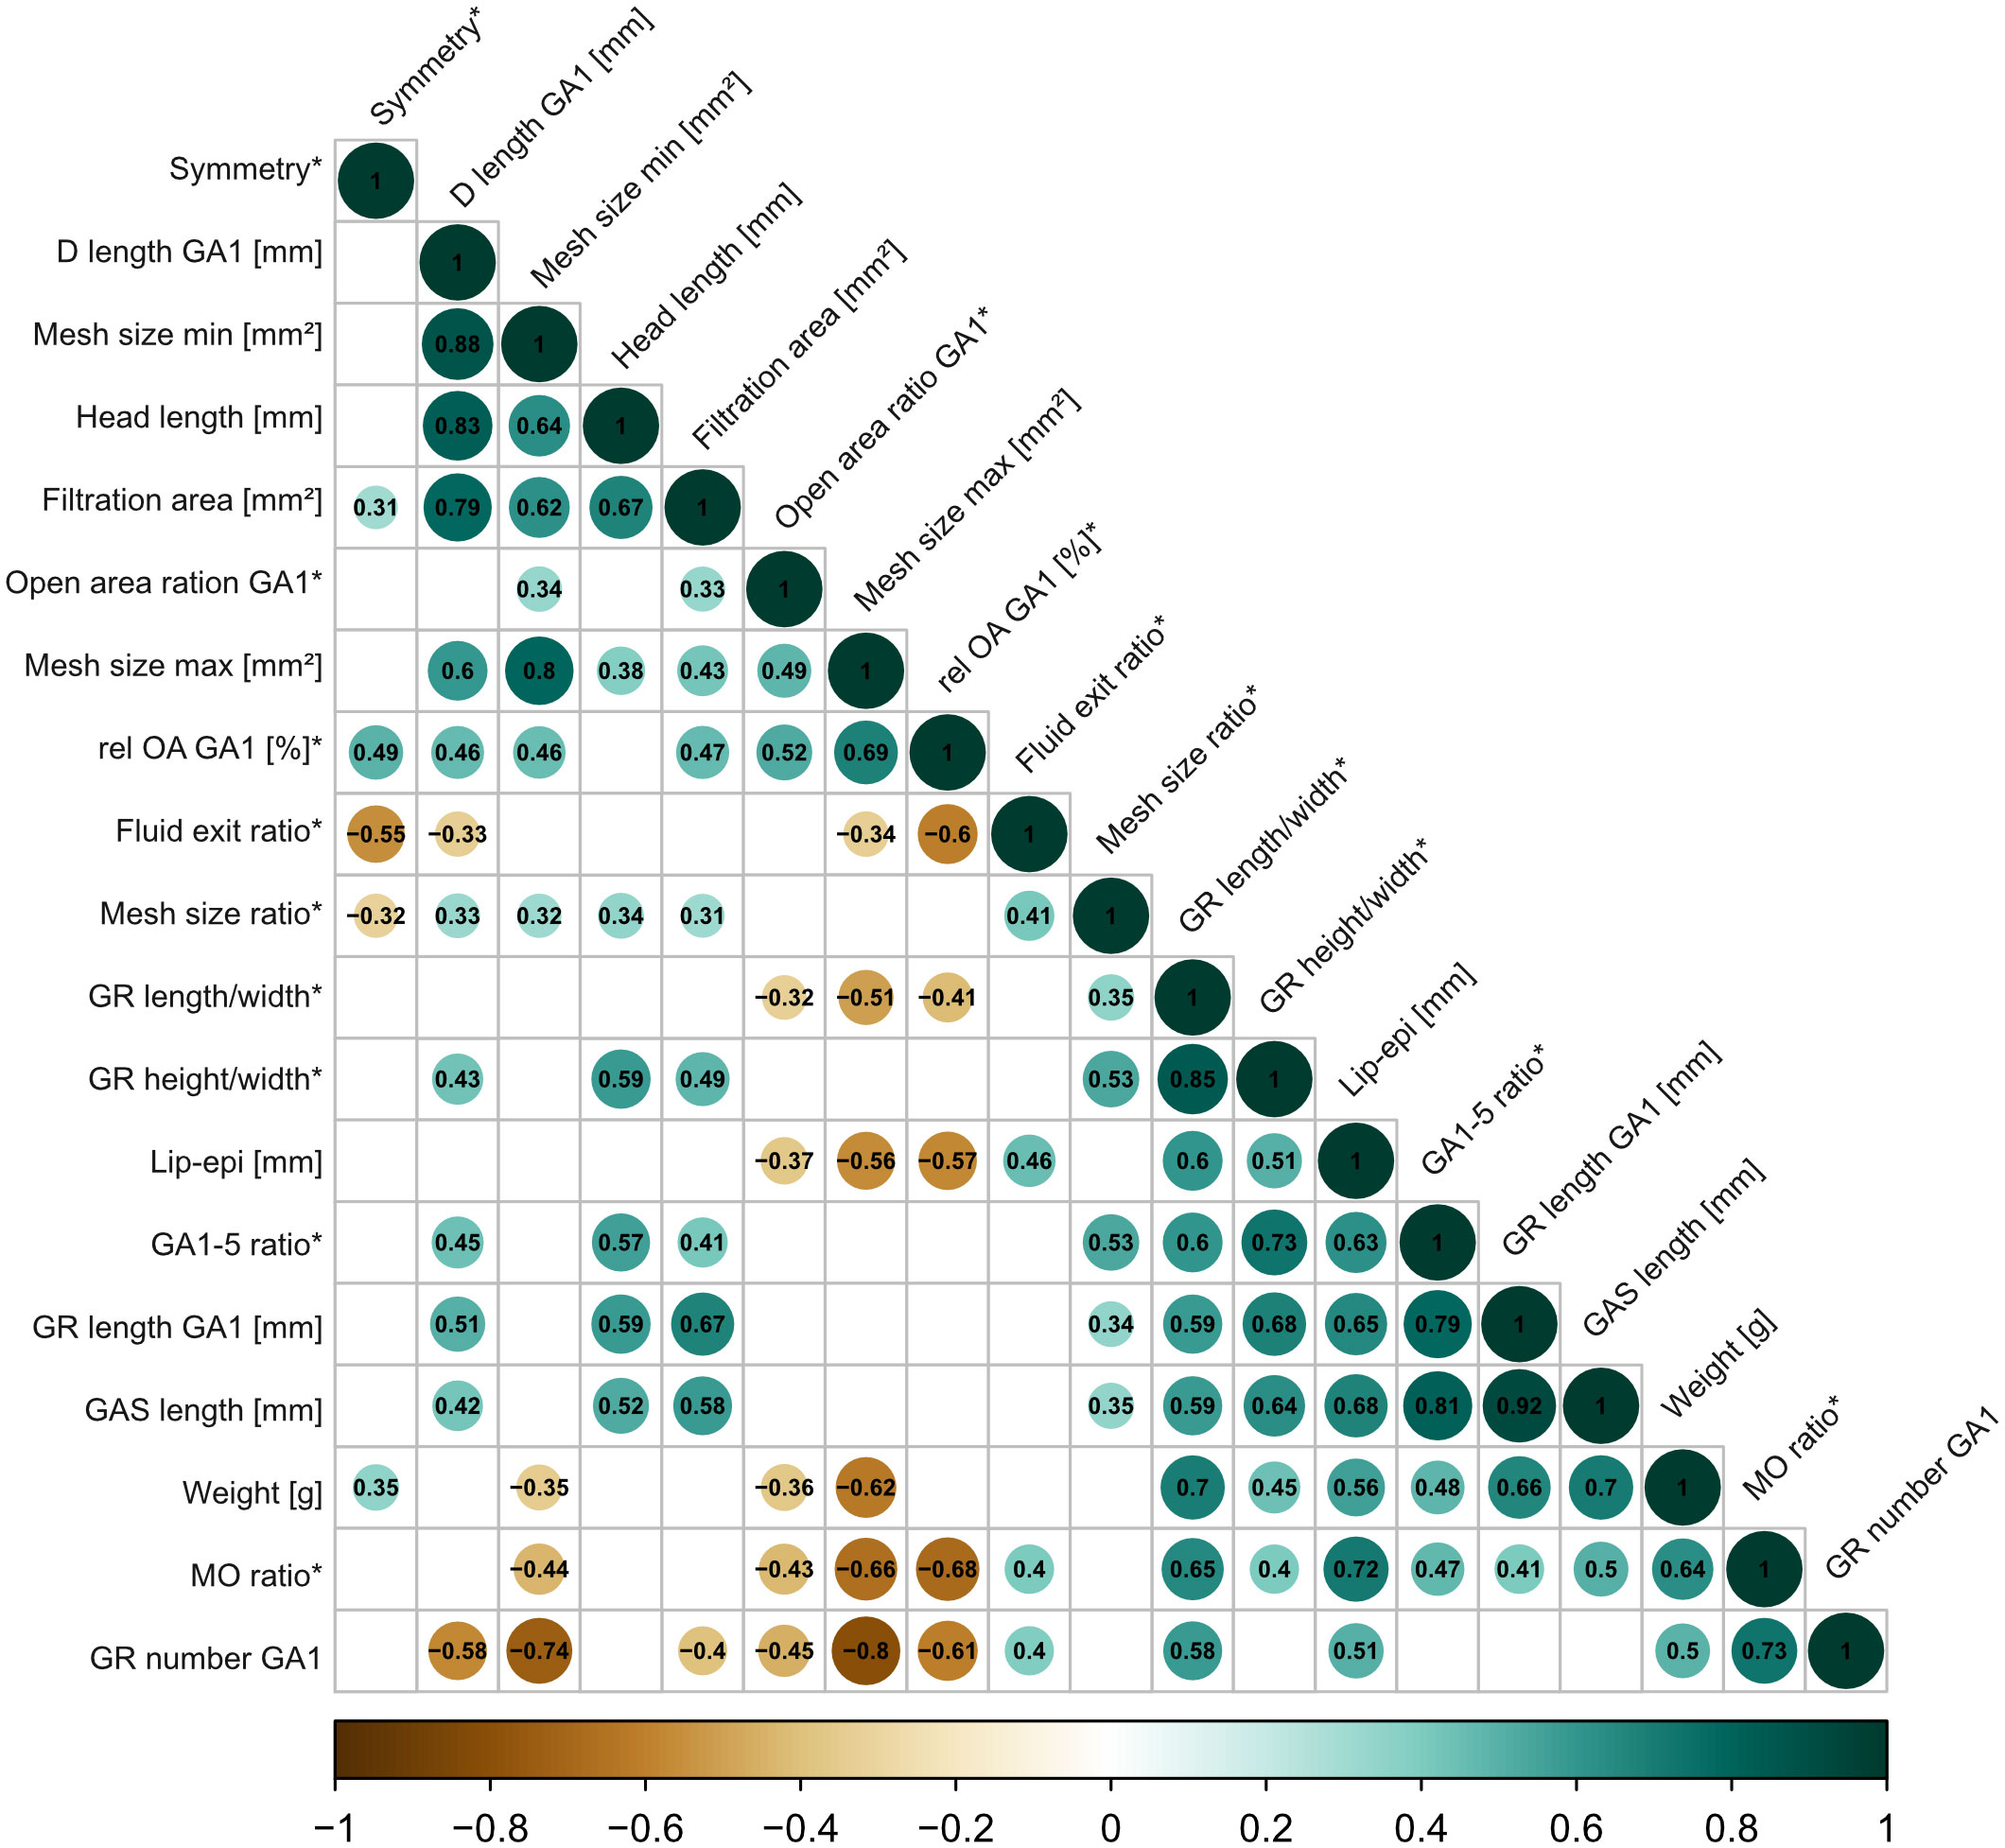
Figure 8 Correlation matrix based on Spearman rank tests with 19 size-corrected parameters across the five ram-feeding species to describe the GAS system. Only significant correlations (p<0.05) are indicated by color (positive correlations in green, negative correlations in brown) and the respective correlation coefficient. Relative parameters are indicated with an asterisk (*). See Table 1 for description of parameters.
3.3 Micro-CT scans
The micro-CT scans of the fish heads show the three-dimensional arrangement of the GAS within the buccal cavity in an open mouth position (Figure 1). In S. scombrus (Figure 1A) and R. kanagurta (Figure 1B), GA1 is very prominent in the anterior part of the buccal cavity. GA5 and the fourth pharyngobranchial narrow down the buccal cavity towards the esophagus forming a cylindrical geometry of the GAS. However, GR in R. kanagurta only touch the operculum with their distal tip, whereas the GR in S. scombrus are directed inwards. Even though the jaw angle of the head in this S. scombrus specimen is 56.3° and lies within the range of jaw angles during feeding (Figure 9), we assume that the mouth was not fully opened sideways, so the opercula did not open and the GAS could not expand to a natural feeding position. In the lateral view of C. harengus (Figure 1C) and S. pilchardus (Figure 1D), the buccal cavity has a narrow, cylindrical shape that bends upwards towards the esophagus. In the frontal cross-section with the view on the dorsal side, the buccal cavity is narrow and opens up at the GAS. In S. pilchardus, GA1 is in contact with the inner sides of the opercula, which again might indicate that the GAS is not fully expanded. The buccal cavity, the opercula, and the GAS in E. encrasicolus (Figure 1E) are shorter in an anterior–posterior direction compared to the other species. From both views, the GAS has a conical, almost rotational symmetric shape.
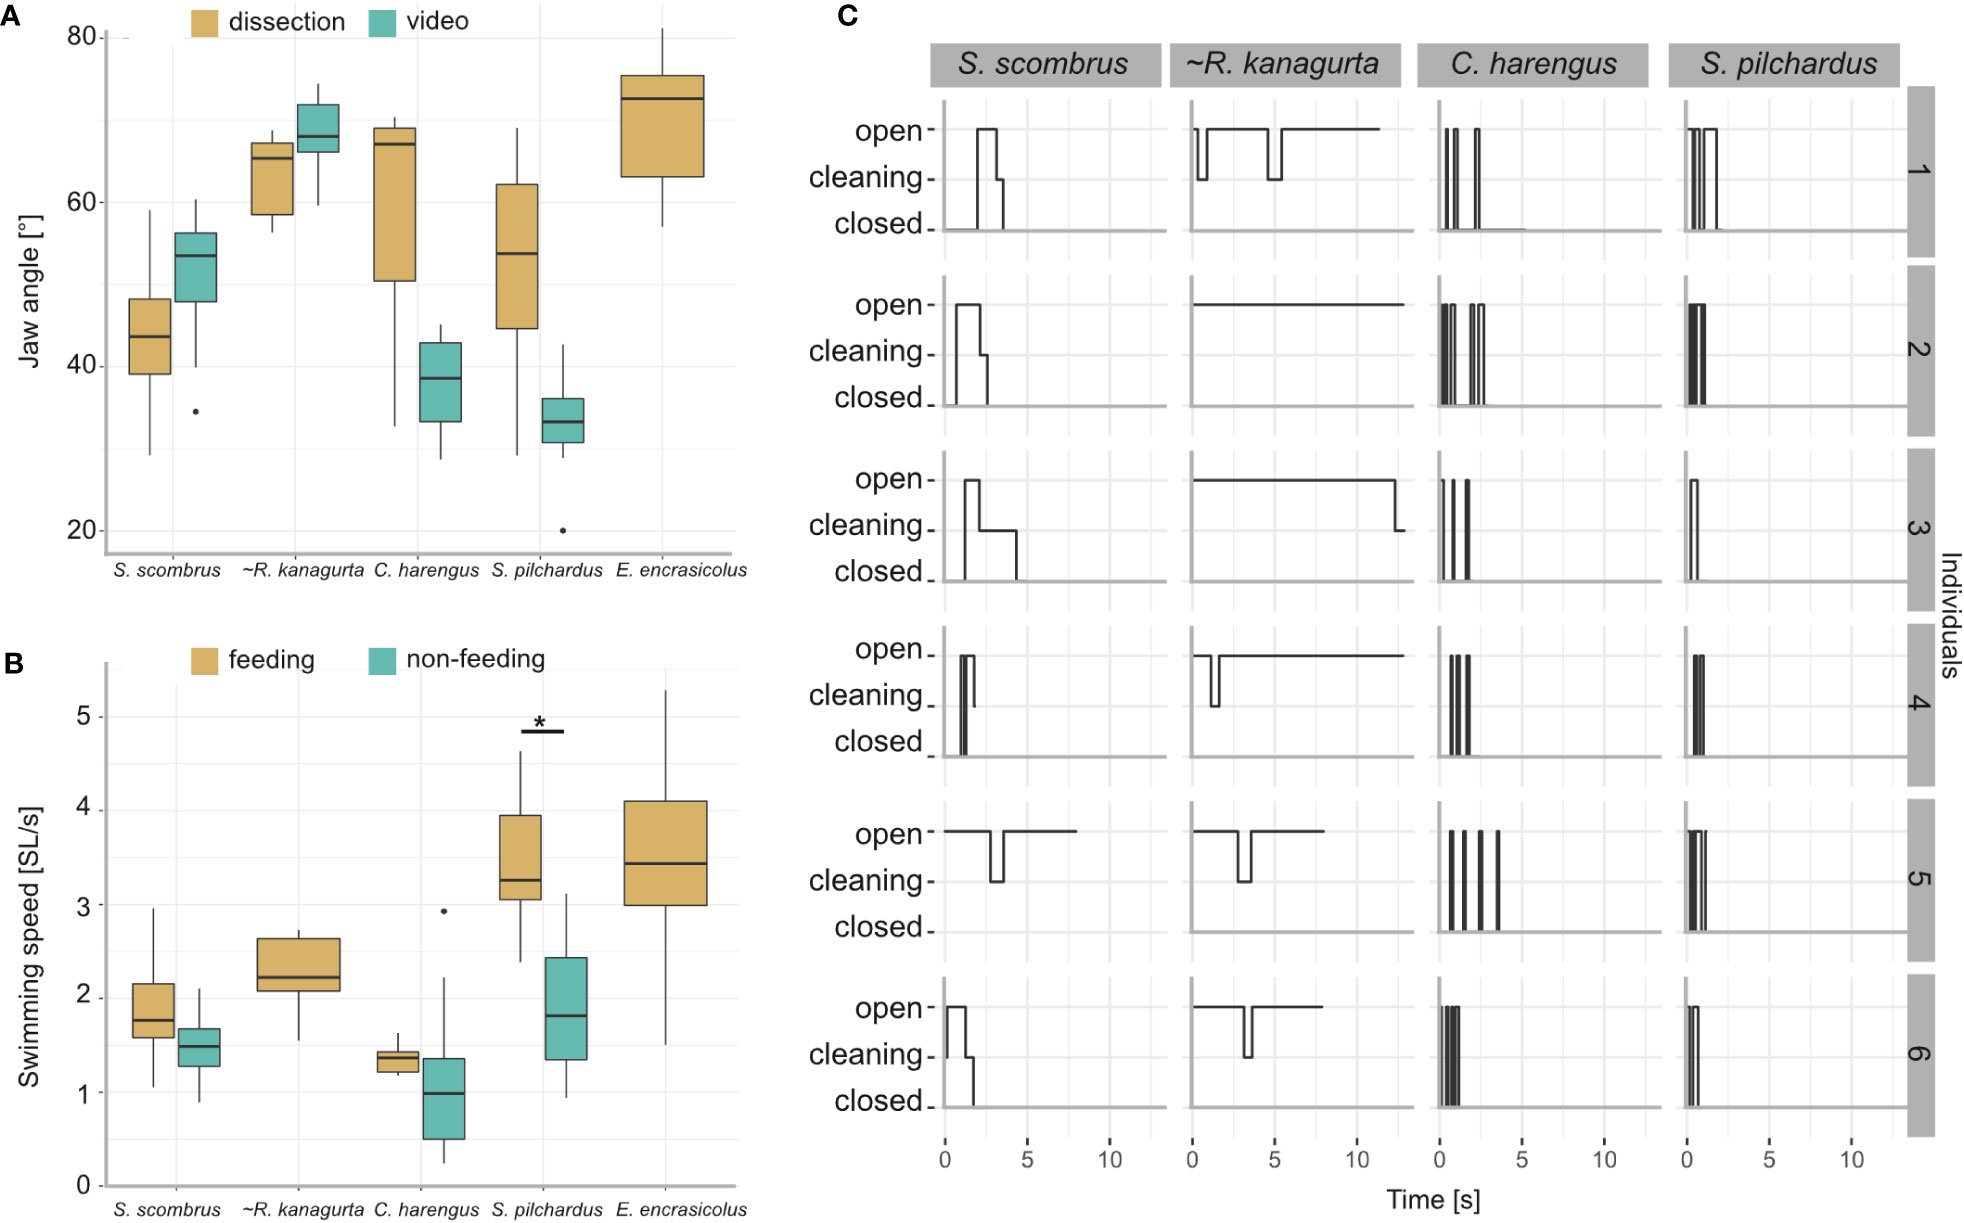
Figure 9 Results from the videography of five ram-feeding fishes during feeding. S. scombrus, C. harengus, S. pilchardus, and E. encrasicolus were filmed in public aquaria. R. kanagurta was filmed in the field, indicated by (~). (A) Comparison of the jaw angle in feeding individuals and the manually opened jaws during dissection. Due to video quality, the jaw angle in E. encrasicolus was not measured. Kruskal–Wallis rank sum test (chi-squared) with post-hoc Dunn test (method “Holm”) showed no significant differences of jaw angle measurement type within each species. (B) Comparison of the swimming speed before feeding (non-feeding) and during feeding. Data were not available for R. kanagurta and E. encrasicolus. Kruskal–Wallis rank sum test (chi-squared) with post-hoc Dunn test (method “Holm”) showed a significant difference in the swimming speed for S. pilchardus before and while feeding (p = 0.0009, indicated by asterisk). (C) Feeding behavior of six individuals described by the mouth position, i.e., closed, cleaning, opened over time.
3.4 Behavior during ram feeding
Jaw angle and swimming velocity were measured in 20 S. scombrus, five R. kanagurta, nine C. harengus, 15 S. pilchardus, and 24 E. encrasicolus during feeding with an open mouth position (Table 1). The jaw angles of the manually opened mouth in the dissected individuals compared to the filter-feeding individuals in the videos show no significant differences (Figure 9A). The mean swimming velocity ranges between 0.34 m/s in C. harengus up to 0.5 m/s in S. scombrus (Table 1). In S. scombrus, C. harengus, and E. encrasicolus, the swimming velocity is higher during feeding than during non-feeding (Figure 9B). There is only a significant difference in the swimming speed for S. pilchardus before and while feeding (Kruskal–Wallis rank sum test (chi-squared), post-hoc Dunn test (method “Holm”), p = 0.0009).
Based on the SL, the Reynolds number ranges between 35,000 in E. encrasicolus and 137,000 in S. scombrus. At the mouth opening, the Reynolds number ranges between 3,480 in S. pilchardus and 13,037 in R. kanagurta and around the denticles, the Reynolds number ranges between 13 in E. encrasicolus and 128 in S. scombrus (Table 1). With an open mouth position, the volume flowrate ranges between 1.59 L/min in S. pilchardus and up to 19.57 L/min in R. kanagurta (Table 1).
The feeding behavior was observed in six individuals each of S. scombrus, R. kanagurta, C. harengus, and S. pilchardus (Figure 9C). Clupea harengus and S. pilchardus show frequent mouth opening and closing with an average opening time of 0.17 s and 0.27 s, respectively. The average opening time in S. scombrus and R. kanagurta is 0.53 s and 3.7 s, respectively. In both species, cleaning was observed after the mouth was held open. Cleaning lasted, on average, 0.25 s in S. scombrus and 0.71 s in R. kanagurta.
3.5 Particle movement in GAS
With no fish head in the water tunnel, the brine shrimp eggs move at an average velocity of 66.5 ± 0.7 mm/s (N = 49). With a fish head in the water tunnel, the velocity of free-moving brine shrimp eggs decreases the further they move posteriorly within the buccal cavity (Figure 10A). At the open mouth, the velocity ranges between 43.9 mm/s ± 3 mm/s in R. kanagurta and 62.7 mm/s ± 4.3 mm/s in C. harengus, which equals a velocity decrease of 66% and 94.3%, respectively. At GA1, the velocity decreases to 19.2 mm/s ± 7.2 mm/s (28.9%) in E. encrasicolus and 40.4 mm/s ± 12.7 mm/s (60.7%) in C. harengus. The particle trajectories at the mouth entrance show a relatively straight line into the mouth in R. kanagurta and C. harengus, which changes at GA1 to an upwards motion in R. kanagurta and a downwards motion in C. harengus (Figure 10B). At GA1, between 50% of the particles in E. encrasicolus and 83.3% in C. harengus move freely in a posterior direction and have no contact with GR or denticles (Figure 10C). Particle rolling along the surface of GR and denticles is observed in 3.3% of the particles in C. harengus and 16.7% in S. pilchardus. The share of particles that stop on the surface of the mesh at GA1 ranges between 5% in C. harengus and 20% in E. encrasicolus. Between 8.3% of the particles in C. harengus and 32.7% in R. kanagurta move through the meshes of GA1 and out of the GAS. No particles are lost in S. pilchardus. In the intact fish heads, the ink shows a stable rotational vortex at the mouth entrance in R. kanagurta and E. encrasicolus that diffuses the ink (Supplementary Information S3, Supplementary Figure S2). The vortex is not present when GA1 is removed, and both opercula are replaced with transparent foil. This indicates that drag posed by the GAS and the head is reduced with opercula and right GA1 removal, and hence, particle velocity might be even slower in intact fish heads. At the set flow velocity of 6.5 cm/s, the Reynolds number at the open mouth ranges between 468 in S. pilchardus and 975 in S. scombrus, which is 13%–19% of the Reynolds number calculated for the feeding behavior experiments (Table 1). The flow visualized with black ink remains laminar when passing GR and denticles (Supplementary Information 3, Supplementary Figure 2).
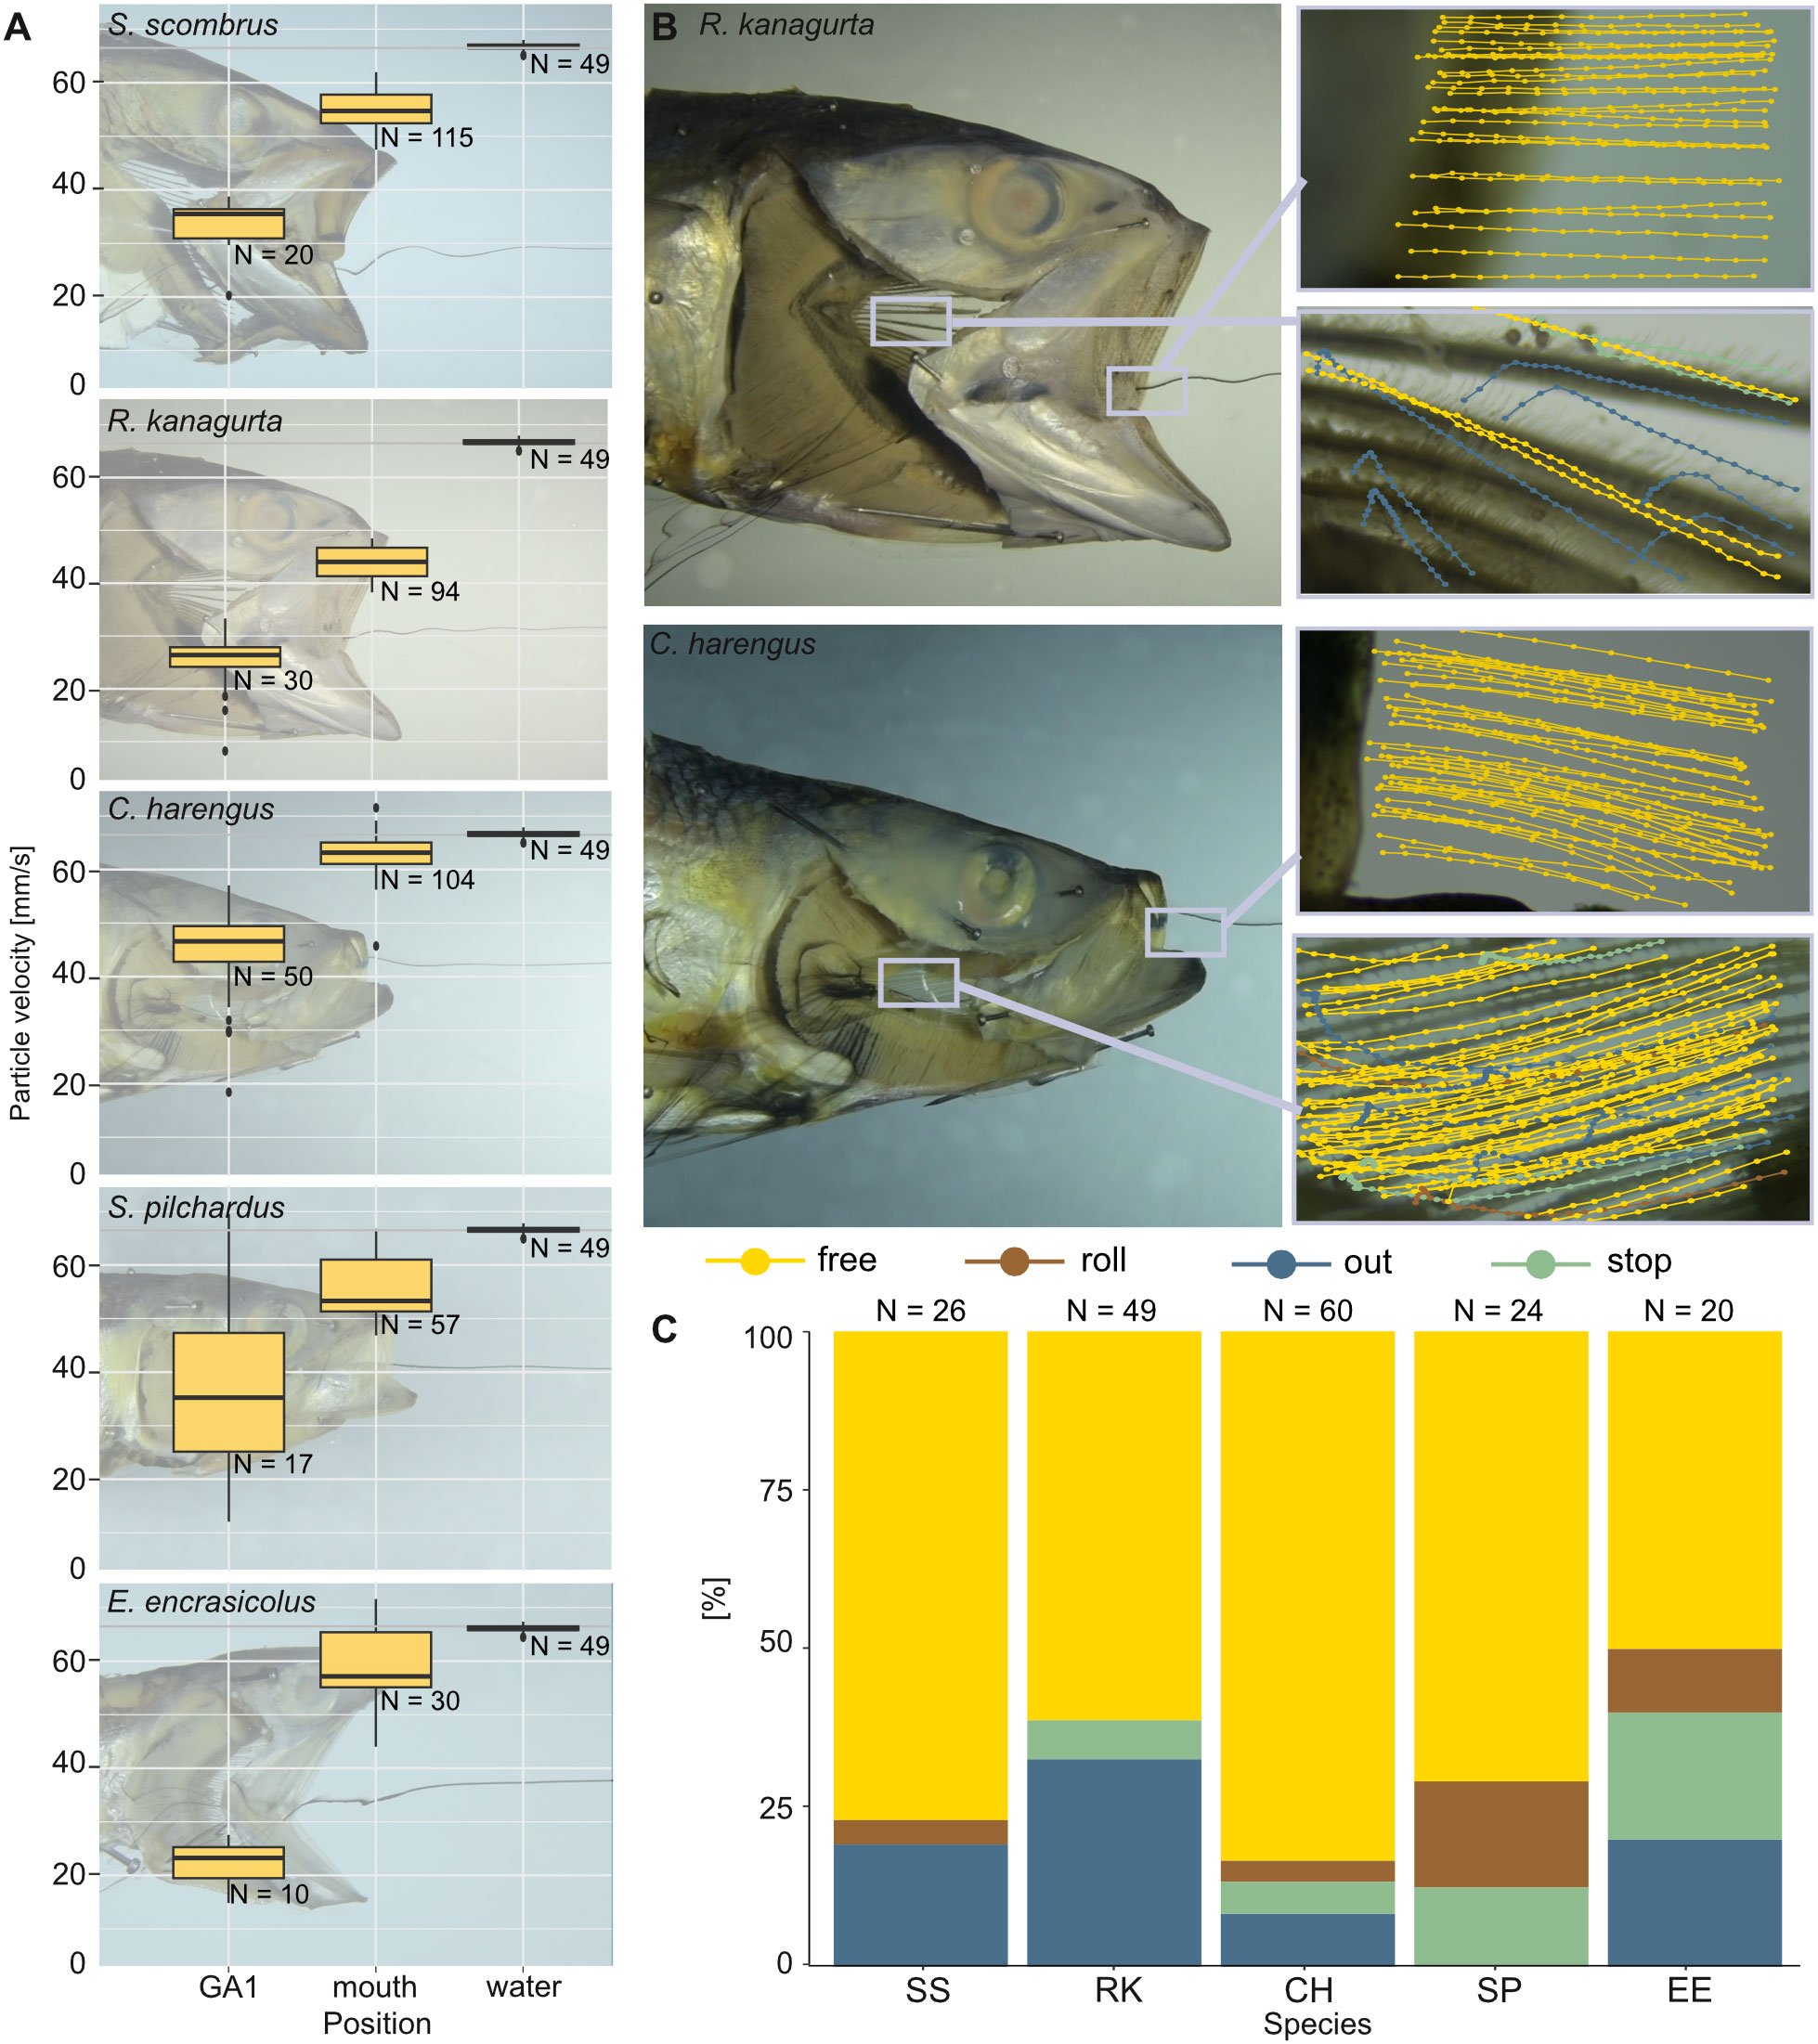
Figure 10 Velocity of brine shrimp eggs in ram-feeding fish in an open-mouth position in the water tunnel. The opercula are replaced by transparent foil, and GA1 is removed (dissection step 4). Particle behavior is divided into free (yellow), out (blue), roll (brown), and stop (green). (A) Velocity of the free moving brine shrimp eggs (mm/s) in the water without the fish, at the mouth entrance and at the left ceratobranchial of GA1. (B) Examples for the sections filmed in R. kanagurta and C. harengus with tracked particle movement plotted in the image. (C) Share [%] of particle movement at GA1 and PB for the five ram-feeding species: S. scombrus (SS), R. kanagurta (RK), C. harengus (CH), S. pilchardus (SP), and E. encrasicolus (EE).
4 Discussion
Based on GAS morphology, feeding behavior, and particle movement, we suggest that the filtration mechanism in these ram-feeding fishes in fact combines cross-flow and dead-end filtration (Figure 11). The parallel orientation of the anterior GA and GR towards the incoming flow is a morphological characteristic for cross-flow filtration (CFF) in ram feeders (Cheer et al., 2001; Paig-Tran et al., 2011). Our functional analysis further supports the morphological evidence, as 75% of the brine shrimp eggs move freely or roll along the surface of GA1. Free-moving particles in a posterior direction were also identified as typical for CFF in the filter-feeding tilapia Oreochromis aureus (Smith and Sanderson, 2007). However, the conically tapered GAS geometry from GA1 to the more posterior GA together with the observed reduction of particle velocity also suggest a transition from cross-flow to dead-end filtration. In technical filtration processes, the angle of the filter medium towards the flow, which we define as the angle of attack α (Figure 11D), is typically 0° in CFF and 90° in dead-end filtration (Sutherland, 2008). Based on our results, we suggest the term “semi-CFF,” for which 90° > α > 0°, in order to differentiate this suspension feeding system from dead-end and CFF (Figure 11D). We further hypothesize that the share of free and rolling particles will decrease with increasing α, an aspect that deserves further study in other species. In general, our results provide evidence for the hypotheses of previous studies in which a combination of CFF and dead-end filtration was suggested for the ram-feeding American shad (Storm et al., 2020). The combination of CFF and dead-end filtration enables ram-feeding fishes to direct the incoming food particles towards the esophagus where they are accumulated before being periodically swallowed.
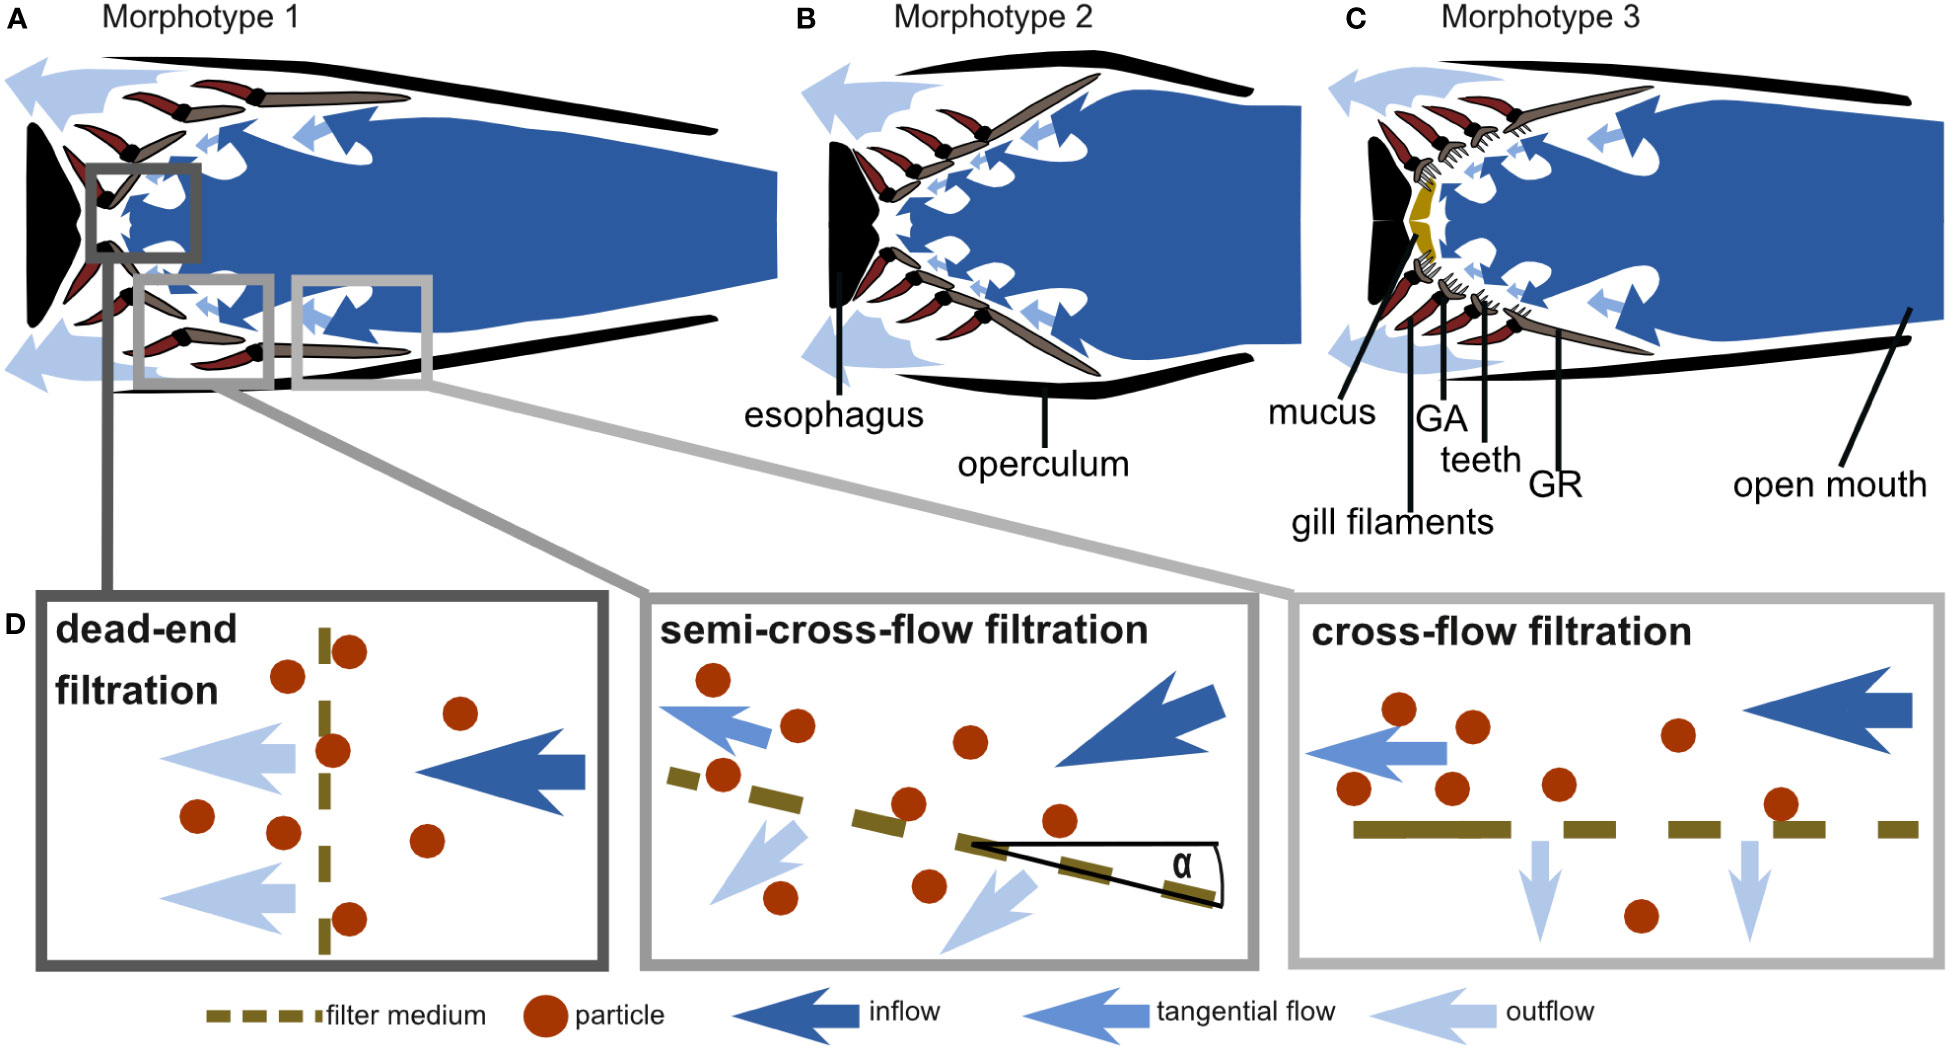
Figure 11 Schematic drawings of cross-sections through the frontal plane of the GAS at the height of the epi-ceratobranchial joints (compare right-hand images in Figure 1) and hypothesized water flow through the three morphotypes based on morphometric measurements, micro-CT scans, and flow tank experiments: (A) C. harengus and S. pilchardus represent morphotype 1, (B) E. encrasicolus represents morphotype 2, and (C) S. scombrus and R. kanagurta represent morphotype 3 (drawings not to scale). (D) Schematic drawing of cross-flow, semi-cross-flow, and dead-end filtration and their position in the fish mouth as exemplarily shown for morphotype 1.
In addition, based on our morphometric measurements, we can describe three GAS morphotypes that further indicate variation of the general particle separation mechanism (Figure 11). The three clupeid species represent two morphotypes in which the GA, GR, and denticles form a smooth filtration surface with regular meshes. However, S. pilchardus and C. harengus differ from E. encrasicolus regarding the geometry of the open mouth, the pipe length, and the GAS symmetry. Therefore, S. pilchardus and C. harengus is represented by morphotype 1 that has an oval-shaped mouth opening and a narrow buccal cavity leading towards the GAS (Figure 11A), whereas E. encrasicolus represents morphotype 2 with a wide, round mouth opening, and a short distance to the short, symmetrical, cone-shaped GAS (Figure 11B). The two scombrid species represent morphotype 3 that can be clearly distinguished to the other two morphotypes by the round mouth opening, the presence of two GR types (only GR on GA1 are blade shaped), the densely packed denticles on GA2 to GA4 on the inner facing edge of the GR, long teeth on GA that are oriented into the buccal cavity, two visible pharyngobranchials, and the presence of mucus (Figure 11C). In the following, we describe the morphotypes in detail to identify their function related to filter feeding.
In all five species, the lips protrude forward, and the opercula and branchiostegal rays stretch outwards when the jaw opens for filter feeding. The protruded lips and the open operculum form a pipe-like structure to guide the water towards and through the cone-shaped GAS (Figures 1, 11). This “pipe length” correlates positively with a long, cone-shaped GAS, but negatively with mesh size and open area ratio. We assume that a longer pipe breaks down large turbulences from the ambient flow and allows for smaller mesh sizes with slow flow. Additionally, a large filtration area, a high open area ratio, and a high fluid exit ratio reduce the resistance to flow (Sutherland, 2008; Brooks et al., 2018) and slow down the flow velocity at the mesh, as observed in our experiments and described for filter-feeding manta rays (continuity equation, see Divi et al., 2018). Around the denticles, the ratio between inertial and viscous forces ranges between Re 13 in the smaller species and Re 128 in the larger species, which indicates laminar flow and is in line with results of other studies (Rykaczewski, 2009; Brooks et al., 2018). Because of the cone shape with the closed esophagus at the end and given the distribution of the calculated relative open area, most of the water exists at the anterior opening of the cone (largest circumference). Besides the anterior–posterior geometry, the GAS is asymmetric in its dorso-ventral orientation. The area formed by the upper GA is in all species smaller than the lower area; hence, more water is exiting laterally from the operculum and ventrally from the branchiostegal rays.
All GR in the clupeid species and the GR on GA1 in the scombrid species are blade shaped with length-to-width and height-to-width ratios (Figures 3E, F) that are similar to other filter-feeding species (Gibson, 1988; Storm et al., 2020). The height-to-width ratio of the GR cross-section is also defined as the fineness ratio in hydrodynamics and describes the geometry of streamlined bodies to minimize drag, which optimally ranges between 2 and 8 (Vogel, 1996; Ahlborn et al., 2009). The fineness ratio of the GR on GA1 in the selected species is between 2.6 and 7.2 and lies within the optimal range for streamlined bodies.
In both, cross-flow and dead-end filtration, the particles are retained on the surface of the filter medium. The tangential flow in CFF transports particles along the filter medium, which is facilitated by a smooth surface. This can be seen in morphotypes 1 and 2 in which the denticles extend laterally from the GR to form small meshes (Rykaczewski, 2009; Collard et al., 2017). Surface structures, such as teeth in the scombrid species, will probably pose an obstacle that induces the particles to stop. As observed with the brine shrimp eggs, the clupeid species with a smooth surface show a higher share of rolling particles with 9.8 ± 6.4% than S. scombrus with 3.8% and R. kanagurta 0%, which both have teeth. Therefore, the mackerel species might capture food particles between the inwards directed teeth and denticles. This mechanism resembles the technical depth filtration in which particles are retained inside the pores of a filter medium (Sutherland, 2008). It is unclear if the observed differences in denticle shape influence mesh size or have other functions. Mesh size is calculated based on the assumption of evenly distributed, rectangular, stiff meshes (Sutherland, 2008; Collard et al., 2017). However, denticles from neighboring GR do not touch and form closed meshes and might bend in the oncoming flow. Additionally, denticles and teeth are oriented not laterally but medially into the buccal cavity in the scombrid species, which challenges the applied calculation for rectangular meshes. Therefore, GR might be more relevant in mesh formation than denticles, as demonstrated by the positive correlation of GR number and minimum mesh size (Figure 8). Still, it is unclear how mesh size influences particle retention because removing GR and microbranchiospines in Galilee Saint Peter’s fish (Tilapia galilaea) did not affect particle ingestion rate and selectivity (Drenner et al., 1987). However, this species is a pump-feeding fish, and its GR are not as long as the ones of the ram-feeding fishes in our study. GR length, GR shape, and GR gap might thus be indicators for different filter-feeding mechanisms and morphotypes. All five analyzed species are large shoal, pelagic fishes at an intermediate trophic level with a wide distribution (Bullen, 1912; Garrido and van der Lingen, 2014). As shown for filter- and particulate-feeding anchovies, pilchards (Garrido and van der Lingen, 2014), or Tilapia (Dempster et al., 1995), plasticity in feeding behavior allows dietary opportunism on plankton, as it is a heterogeneous food source. Adaption to different food sizes allows the co-occurring of several species within one habitat, as observed for anchovy and sardine species (Garrido and van der Lingen, 2014). As expected, the dimensions of the GAS are a significant factor in selecting particle size. For example, C. harengus and S. pilchardus have similar mesh sizes in the size-corrected data. They cluster together in the PCA and correlation matrix (Figures 3, 8; Supplementary Information 3), probably using very similar mechanisms, even though the standard length of C. harengus is around twice as long as of S. pilchardus.
Cross-flow filtration in technical applications is characterized by a time-dependent, steady-state particle distribution and the prolonged occurrence of clogging (Ripperger and Altmann, 2002; Makabe et al., 2021). Clogging reduces filtration performance. Therefore, cleaning is an important step in any filtration process. In the case of filter-feeding organisms, cross-flow filtration was assumed to reduce clogging (Brooks et al., 2018), avoid clogging (Storm et al., 2020), or that it is prevented by periodic swallowing (Paig-Tran et al., 2011). Therefore, it is crucial to consider the time-dependent behavior in our study to identify cross-flow filtration. During the behavioral studies, we observed frequent cleaning in ram-feeding R. kanagurta in the field (Figure 9). This further supports the hypothesis that cross-flow filtration is not the only filtration mechanism present in the observed species. However, our ability to interpret the results obtained in the environment of the aquaria is limited. While we measured 0.5 m/s for S. scombrus in the aquarium, it was reported that the swimming speed of S. scombrus in the Norwegian Sea ranged between 1.1 and 1.8 m/s measured with sonar (Nøttestad et al., 2016). Most ram-filter-feeding fish species also show opportunistic particulate feeding, which differs regarding swimming speed, mouth opening time, and cleaning frequency (Batty et al., 1986; Pepin et al., 1988; James and Findlay, 1989). Within the current literature, there are no established criteria to identify these feeding types. Filter feeding was either identified when the mouth was opened longer than 0.5 s in S. scombrus (Pepin et al., 1988), 1–3 s in Scomber japonicus (O’Connell and Zweifel, 1972), or >0.4–3 s in Engraulis capensis (James and Findlay, 1989). Additionally, the occurrence of filter feeding depends on particle concentration (O’Connell and Zweifel, 1972; Gibson and Ezzi, 1985) and particle size (Garrido et al., 2007), especially in relation to fish size (Crowder, 1985). For the Gizzard shad, particle selectivity was also based on nutrient content (Heidman et al., 2012). Therefore, we cannot clearly identify filter feeding in the aquaria experiments.
Each of the applied methods to investigate aspects of filter feeding has strengths and limitations. The morphometric analysis of fresh dissected specimens prevented artifacts due to fixation methods. Yet, micro-CT scans were necessary to reveal the three-dimensional arrangement of the GAS. Even though micro-CT scans are non-invasive, they are prone to fixation artifacts, e.g., regarding the opercula position. The usage of preserved fish in the water tunnel experiments shows the same problem. Nevertheless, using preserved fish is advantageous, as they do not lack morphological detail that is difficult to manufacture in artificial models, such as denticles. In this context, the step-wise removal of the opercula and the right GA1 might have influenced the flow through the buccal cavity even though the opercula were replaced by transparent foil. Additionally, the water tunnel experiments were performed only in laminar flow conditions with a constant flow velocity and one individual per species.
At this point, with the limitations of the experimental procedures and the complexity of filter feeding, i.e., the interaction of environmental conditions, feeding behavior, the variety in filter-feeding morphology, and food particle characteristics (Cheer et al., 2012), it is challenging to predict filtration efficiency. Looking at gut content, S. scombrus and R. kanagurta feed mainly on copepods, cladocerans, diatoms, peridinians, and larvae of adult decapoda, but also appendicularians, polychaeta larvae, post-larvae bivalves, pteropods, cirripede nauplii, small hydromedusae, and fish eggs and larvae (Bullen, 1912; Bhimachar and George, 1952; Runge et al., 1987), which indicates a retention ability for a diversity of particle types and sizes. One study showed that the gut content of R. kanagurta was the same as the ambient plankton, indicating non-selectivity (Rao and Rao, 1957). This is also supported by the fact that ram-feeding fish ingest microplastics: 40%–50% of C. harengus, S. pilchardus, and E. encrasicolus had microplastics in their stomachs in sizes between 0.13 mm to 22.4 mm (Collard et al., 2017).
5 Conclusions
Based on the GAS morphology, we were able to identify three morphotypes in the studied ram-feeding fishes that all use a combination of cross-flow and dead-end filtration as the general particle separation mechanism. Within the conical GAS, the particles are directed through cross-flow filtration in the anterior GAS towards the posterior esophagus where they accumulate through dead-end filtration. The transition of the two, termed semi-CFF and characterized with an angle of attack of the filter medium between 0° and 90°, might also be relevant for other ram-feeding suspension feeders, such as manta rays, whale sharks, or baleen whales. We identified differences in geometry, filter media, symmetry, and surface structures, and described these in three morphotypes. Each morphotype is most likely to influence fluid flow and particles retention. Even though we analyzed only five species, we identified many distinct morphological traits, which leads us to expect a large morphological diversity in filter-feeding fishes.
Data availability statement
The raw data supporting the conclusions of this article will be made available by the authors, without undue reservation.
Ethics statement
Ethical approval was not required for the study involving animals in accordance with the local legislation and institutional requirements because the fishes were obtained dead and frozen from a commercial delicatessen shop.
Author contributions
LH: conceptualization and methodology, experimental investigation of gill arch system morphology and filter-feeding behavior, conduction of experiments in water tunnel, data analysis and visualization, formal analysis, writing: original draft, writing: review and editing; KS: water tunnel assembly, conduction of experiments in water tunnel, writing: review and editing; JH: experimental investigation of GAS morphology, writing: review and editing; SE: experimental investigation of GAS morphology, writing: review and editing; TS: PTA staining and micro-CT scans, writing: review and editing; AB: writing, review and editing, supervision, project administration, funding acquisition and conceptualization. All authors contributed to the article and approved the submitted version.
Funding
LH, KS, JH, SE, and AB were supported by the European Research Council (ERC) under the European Union’s Horizon 2020 research and innovation program (grant agreement no. 754290) and the Federal Ministry of Education and Research (BMBF) under the programme “Ideenwettbewerb Biologisierung der Technik” (grant agreement no. 13XP5164A). TS was supported by Leibniz Association grant P91/2016 (SAW-Ricefish).
Acknowledgments
We thank the following aquaria for enabling us to film the fishes in their tanks: SeaLife Center Oberhausen (Germany), Ozeaneum (Stralsund, Germany), Aquarium La Rochelle (France), and Aquarium San Sebastian (Spain). We also thank Swantje Neumeyer and Bodo Kallwitz for sharing their videos of R. kanagurta in the Red Sea. We are grateful for the support by Jens Hamann in taking photos and videos, the workgroup around Prof. Dr. Reinhard Predel (University of Cologne) for letting us use his Keyence, and Dr. Hendrik Herzog and Christian Grünewald for designing and assembling the water tunnel.
Conflict of interest
The authors declare that the research was conducted in the absence of any commercial or financial relationships that could be construed as a potential conflict of interest.
Publisher’s note
All claims expressed in this article are solely those of the authors and do not necessarily represent those of their affiliated organizations, or those of the publisher, the editors and the reviewers. Any product that may be evaluated in this article, or claim that may be made by its manufacturer, is not guaranteed or endorsed by the publisher.
Supplementary material
The Supplementary Material for this article can be found online at: https://www.frontiersin.org/articles/10.3389/fmars.2023.1253083/full#supplementary-material
References
Ahlborn B. K., Blake R. W., Chan K. H. S. (2009). Optimal fineness ratio for minimum drag in large whales. Can. J. Zoology 87, 124–131. doi: 10.1139/Z08-144
Alder J., Campbell B., Karpouzi V., Kaschner K., Pauly D. (2008). Forage fish: from ecosystems to markets. Annu. Rev. Environ. Resour. 33, 153–166. doi: 10.1146/annurev.environ.33.020807.143204
Batty R. S. S., Blaxter J.H.S.H.S., Libby D. A. A. (1986). “Herring (Clupea harengus) filter-feeding in the dark,” in Marine Biology. (Springer). doi: 10.1007/BF00428631
Bhimachar B. S., George P. C. (1952). Observations on the food and feeding of the Indian mackerel,Rastrelliger canagurta (Cuvier). Proc. Indian Acad. Sci. 36, 105–118. doi: 10.1007/BF03050438
Brooks H., Haines G. E., Lin M. C., Sanderson S. L. (2018). Physical modeling of vortical cross-step flow in the American paddlefish, Polyodon spathula. PloS One 13, e0193874. doi: 10.1371/journal.pone.0193874
Bullen G. E. (1912). Some notes upon the feeding habits of mackerel and certain clupeoids in the english channel. J. Mar. Biol. Assoc. United Kingdom 9, 394–403. doi: 10.1017/S0025315400048335
Cheer A., Cheung S., Hung T.-C., Piedrahita R. H., Sanderson S. L. (2012). Computational fluid dynamics of fish gill rakers during crossflow filtration. Bull. Math. Biol. 74, 981–1000. doi: 10.1007/s11538-011-9709-6
Cheer A. Y., Ogami Y., Sanderson S. L. (2001). Computational fluid dynamics in the oral cavity of ram suspension-feeding fishes. J. Theor. Biol. 210, 463–474. doi: 10.1006/jtbi.2001.2325
Cohen K. E., Hernandez L. P. (2018a). The complex trophic anatomy of silver carp, Hypophthalmichthys molitrix, highlighting a novel type of epibranchial organ. J. Morphology 279, 1615–1628. doi: 10.1002/jmor.20891
Cohen K. E., Hernandez L. P. (2018b). Making a master filterer: Ontogeny of specialized filtering plates in silver carp (Hypophthalmichthys molitrix). J. Morphology 279, 925–935. doi: 10.1002/jmor.20821
Collard F., Gilbert B., Eppe G., Roos L., Compère P., Das K., et al. (2017). Morphology of the filtration apparatus of three planktivorous fishes and relation with ingested anthropogenic particles. Mar. pollut. Bull. 116, 182–191. doi: 10.1016/j.marpolbul.2016.12.067
Collette B. B., Gillis G. B. (1992). Morphology, systematics, and biology of the double-lined mackerels (Grammatorcynus, Scombridae). Fishery Bull. 90, 13–53. doi: 10.1016/j.marpolbul.2016.12.067
Costalago D., Garrido S., Palomera I. (2015). Comparison of the feeding apparatus and diet of European sardines Sardina pilchardus of Atlantic and Mediterranean waters: Ecological implications. J. Fish Biol. 86, 1348–1362. doi: 10.1111/jfb.12645
Crowder L. B. (1985). Optimal foraging and feeding mode shifts in fishes. Environ. Biol. Fishes 12, 57–62. doi: 10.1007/BF00007710
Dempster P., Baird D. J., Beveridge M. C. M. (1995). Can fish survive by filter-feeding on microparticles? Energy balance in tilapia grazing on algal suspensions. J. Fish Biol. 47, 7–17. doi: 10.1111/j.1095-8649.1995.tb01868.x
Divi R. V., Strother J. A., Paig-Tran E. W. M. (2018). Manta rays feed using ricochet separation, a novel nonclogging filtration mechanism. Sci. Adv. 4, eaat9533. doi: 10.1126/sciadv.aat9533
Dray S., Josse J. (2015). Principal component analysis with missing values: a comparative survey of methods. Plant Ecol. 216, 657–667. doi: 10.1007/s11258-014-0406-z
Drenner R. W., Hambright K. D., Vinyard G. L., Gophen M. (1987). Particle ingestion by tilapia galilaea is not affected by removal of gill rakers and microbranchiospines. Trans. Am. Fisheries Soc. 116, 272–276. doi: 10.1577/1548-8659(1987)116<272:PIBTGI>2.0.CO;2
Friedland K. D., Ahrenholz D. W., Smith J. W., Manning M., Ryan J. (2006). Sieving functional morphology of the gill raker feeding apparatus of atlantic menhaden. J. Exp. Zoology Part A: Comp. Exp. Biol. 305, 974–985. doi: 10.1002/jez.a.348
Garrido S., Marçalo A., Zwolinski J., van der Lingen C. (2007). Laboratory investigations on the effect of prey size and concentration on the feeding behaviour of Sardina pilchardus. Mar. Ecol. Prog. Ser. Boca Raton, FL: CRC Press) 330, 189–199. doi: 10.3354/meps330189
Garrido S., van der Lingen C. D. (2014). “Feeding biology and ecology,” in Biology and Ecology of Sardines and Anchovies. Ed. Ganias K. (CRC Press), 122–189.
Gibson R. N. N. (1988). Development, morphometry and particle retention capability of the gill rakers in the herring, Clupea harengus L. J. Fish Biol. 32, 949–962. doi: 10.1111/j.1095-8649.1988.tb05438.x
Gibson R. N., Ezzi I. A. (1985). Effect of particle concentration on filter- and particulate-feeding in the herring Clupea harengus. Mar. Biol. 88, 109–116. doi: 10.1007/BF00397157
Gnanamuttu B. Y. J. C. (1966). Osteology of the Indian mackerel, rastrelliger kanagurta (Cuvier). Indian J. Fisheries 13, 1–26.
Goodrich J. S. S., Sanderson S. L. L., Batjakas I. E. E., Kaufman L. S. S. (2000). Branchial arches of suspension-feeding Oreochromis esculentus: Sieve or sticky filter? J. Fish Biol. 56, 858–875. doi: 10.1111/j.1095-8649.2000.tb00877.x
Haines G. E., Sanderson S. L. (2017). Integration of swimming kinematics and ram suspension feeding in a model American paddlefish, Polyodon spathula. J. Exp. Biol. 220, 4535–4547. doi: 10.1242/jeb.166835
Hallacher L. E. (1977). On the feeding behavior of the Basking shark, Cetorhinus maximus. Environ. Biol. Fishes 2, 297–298. doi: 10.1007/BF00005996
Heidman M., Holley L., Chambers R., Sanderson S. (2012). Selective feeding on nutrient-rich particles by gizzard shad Dorosoma cepedianum does not involve mechanical sorting. Aquat. Biol. 17, 129–139. doi: 10.3354/ab00470
Hentschel B. T., Shimeta J. (2008). “Suspension feeders,” in Encyclopedia of Ecology (Amsterdam: Elsevier Science Ltd), 3437–3442.
Hernderson S. (1983). An Evaluation of Filter Feeding Fishes for Removing Excessive Nutrients and Algae from Wastewater (Washington D.C., USA: United States Environmental Protection Agency).
Hung T., Piedrahita R. H. (2014). Experimental validation of a novel bio-inspired particle separator. Aquacultural Eng. 58, 11–19. doi: 10.1016/j.aquaeng.2013.09.005
James A., Findlay K. (1989). Effect of particle size and concentration on feeding behaviour, selectivity and rates of food ingestion by the Cape anchovy Engraulis capensis. Mar. Ecol. Prog. Ser. 50, 275–294. doi: 10.3354/meps050275
Langeland A., Nost T. (1995). Gill raker structure and selective predation on zooplankton by particulate feeding fish. J. Fish Biol. 47, 719–732. doi: 10.1111/j.1095-8649.1995.tb01937.x
Limaye A. (2012). Drishti: a volume exploration and presentation tool. Ed. Stock S. R., 85060X. doi: 10.1117/12.935640
Magnuson J. J., Heitz J. G. (1971). Gill raker apparatus and food selectivity among mackerels, tunas, and dolphins. Fishery Bull. 69, 361–370.
Makabe R., Akamatsu K., Tatsumi R., Koike O., Nakao S.i. (2021). Numerical simulations of lift force and drag force on a particle in cross-flow microfiltration of colloidal suspensions to understand limiting flux. J. Membrane Sci. 621, 118998. doi: 10.1016/j.memsci.2020.118998
Nøttestad L., Diaz J., Penã H., Søiland H., Huse G., Fernö A. (2016). Feeding strategy of mackerel in the Norwegian Sea relative to currents, temperature, and prey. ICES J. Mar. Sci. 73, 1127–1137. doi: 10.1093/icesjms/fsv239
O’Connell C. P., Zweifel J. R. (1972). A laboratory study of particulate and filter feeding of the pacific mackerel, Scomber japonicus. Fishery Bull. 70, 973–981.
Ory N., Chagnon C., Felix F., Fernández C., Ferreira J. L., Gallardo C., et al. (2018). Low prevalence of microplastic contamination in planktivorous fish species from the southeast Pacific Ocean. Mar. pollut. Bull. 127, 211–216. doi: 10.1016/j.marpolbul.2017.12.016
Paig-Tran E. W. M., Bizzarro J. J., Strother J. A., Summers A. P. (2011). Bottles as models: Predicting the effects of varying swimming speed and morphology on size selectivity and filtering efficiency in fishes. J. Exp. Biol. 214, 1643–1654. doi: 10.1242/jeb.048702
Pepin P., Koslow J. A., Pearre S. (1988). Laboratory study of foraging by Atlantic mackerel, Scomber scombrus, on natural zooplankton assemblages. Can. J. Fisheries Aquat. Sci. 45, 879–887. doi: 10.1139/f88-106
Phillips M. B., Bonner T. H. (2015). Occurrence and amount of microplastic ingested by fishes in watersheds of the Gulf of Mexico. Mar. pollut. Bull. 100, 264–269. doi: 10.1016/j.marpolbul.2015.08.041
Rao K. V. N., Rao K. P. (1957). Differences in the food of the young and the adult Indian mackerel, rastrelliger kanagurta (Cuv.). Nature 180, 711–712. doi: 10.1038/180711b0
Ribeiro F., Okoffo E. D., O’Brien J. W., Fraissinet-Tachet S., O’Brien S., Gallen M., et al. (2020). Quantitative analysis of selected plastics in high-commercial-value Australian seafood by pyrolysis gas chromatography mass spectrometry. Environ. Sci. Technol. 54, 9408–9417. doi: 10.1021/acs.est.0c02337
Ripperger S., Altmann J. (2002). Crossflow microfiltration - State of the art. Separation Purification Technol. 26, 19–31. doi: 10.1016/S1383-5866(01)00113-7
Rubenstein D. I., Koehl M. A. R. (1977). The mechanisms of filter feeding: some theoretical considerations. Am. Nat. 111, 981–994. doi: 10.1086/283227
Runge J. A., Pepin P., Silvert W. (1987). Feeding behavior of the Atlantic mackerel Scomber scombrus on the hydromedusa Aglantha digitale. Mar. Biol. 94, 329–333. doi: 10.1007/BF00428238
Rykaczewski R. R. (2009). Influence of Oceanographic Variability on the Planktonic Prey and Growth of Sardine and Anchovy in the California Current Ecosystem (San Diego, USA: University of California).
Sanderson S. L., Cheer A. Y., Goodrich J. S., Graziano J. D., Callan W. T. T. (2001). Crossflow filtration in suspension-feeding fishes. Nature 412, 439–441. doi: 10.1038/35086574
Sanderson S. L., Roberts E., Lineburg J., Brooks H. (2016). Fish mouths as engineering structures for vortical cross-step filtration. Nat. Commun. 7, 11092. doi: 10.1038/ncomms11092
Sanderson S. L. L., Wassersug R. J. (1993). “Convergent and alternative designs for vertebrate suspension feeding,” in The skull. Eds. Hanken J., Hall B. K. (Chicago and London: University of Chicago Press), 37–112.
Schroeder A., Marshall L., Trease B., Becker A., Sanderson S. L. L. (2019). Development of helical, fish-inspired cross-step filter for collecting harmful algae. Bioinspiration Biomimetics 14, 056008. doi: 10.1088/1748-3190/ab2d13
Sebens K., Sarà G., Nishizaki M. (2017). “Energetics, particle capture, and growth dynamics of benthic suspension feeders,” in Marine Animal Forests: The Ecology of Benthic Biodiversity Hotspots (New York: Springer), 813–854.
Sims D. W. (2000). Filter-feeding and cruising swimming speeds of basking sharks compared with optimal models: They filter-feed slower than predicted for their size. J. Exp. Mar. Biol. Ecol. 249, 65–76. doi: 10.1016/S0022-0981(00)00183-0
Smith J. C., Sanderson S. L. (2007). Mucus function and crossflow filtration in a fish with gill rakers removed versus intact. J. Exp. Biol. 210, 2706–2713. doi: 10.1242/jeb.000703
Storm T. J., Nolan K. E., Roberts E. M., Sanderson S. L. (2020). Oropharyngeal morphology related to filtration mechanisms in suspension-feeding American shad (Clupeidae). J. Exp. Zoology Part A: Ecol. Integr. Physiol. 333, 493–510. doi: 10.1002/jez.2363
Keywords: filter-feeding, cross-flow filtration, morphometrics, gill arch, gill raker, morphotypes, particle separation, water tunnel
Citation: Hamann L, Schreiber K, Hagenmeyer J, Eduardo S, Spanke T and Blanke A (2023) Diversity of filter feeding and variations in cross-flow filtration of five ram-feeding fish species. Front. Mar. Sci. 10:1253083. doi: 10.3389/fmars.2023.1253083
Received: 04 July 2023; Accepted: 18 September 2023;
Published: 16 October 2023.
Edited by:
Jeff Shimeta, RMIT University, AustraliaReviewed by:
S. Laurie Sanderson, College of William & Mary, United StatesJean Potvin, Saint Louis University, United States
Copyright © 2023 Hamann, Schreiber, Hagenmeyer, Eduardo, Spanke and Blanke. This is an open-access article distributed under the terms of the Creative Commons Attribution License (CC BY). The use, distribution or reproduction in other forums is permitted, provided the original author(s) and the copyright owner(s) are credited and that the original publication in this journal is cited, in accordance with accepted academic practice. No use, distribution or reproduction is permitted which does not comply with these terms.
*Correspondence: Leandra Hamann, hamannleandra@gmail.com
†ORCID: Leandra Hamman, orcid.org/0000-0002-5564-7755
Kristina Schreiber, orcid.org/0000-0002-6361-0434
Jan Hagenmeyer, orcid.org/0009-0000-3951-4357
Santiago Eduardo, orcid.org/0009-0005-9159-1962
Tobias Spanke, orcid.org/0000-0002-3640-0546
Alexander Blanke, orcid.org/0000-0003-4385-6039