De novo genome and transcriptome assembly of Kelletia kelletii, a coastal gastropod and fisheries species exhibiting a northern range expansion
 Benjamin N. Daniels1*
  Cassidy L. Andrasz1 Nicholas Zarate1 Andy Lee2
  Cataixa López3 Paul Anderson4 Robert J. Toonen3
  Mark R. Christie2,5 Crow White1
  Jean M. Davidson1
- 1Biological Sciences Department, California Polytechnic State University, San Luis Obispo, CA, United States
- 2Department of Biological Sciences, Purdue University, West Lafayette, IN, United States
- 3Hawai‘i Institute of Marine Biology, University of Hawai‘i at Manoa, Kane‘ohe, HI, United States
- 4Department of Computer Science and Software Engineering, California Polytechnic State University, San Luis Obispo, CA, United States
- 5Department of Forestry and Natural Resources, Purdue University, West Lafayette, IN, United States
Understanding the genomic characteristics of non-model organisms can bridge research gaps between ecology and evolution. However, the lack of a reference genome and transcriptome for these species makes their study challenging. Here, we complete the first full genome and transcriptome sequence assembly of the non-model organism Kellet’s whelk, Kelletia kelletii, a marine gastropod exhibiting a poleward range expansion coincident with climate change. We used a combination of Oxford Nanopore Technologies, PacBio, and Illumina sequencing platforms and integrated a set of bioinformatic pipelines to create the most complete and contiguous genome documented among the Buccinoidea superfamily to date. Genome validation revealed relatively high completeness with low missing metazoan Benchmarking Universal Single-Copy Orthologs (BUSCO) and an average coverage of ∼70x for all contigs. Genome annotation identified a large number of protein-coding genes similar to some other closely related species, suggesting the presence of a complex genome structure. Transcriptome assembly and analysis of individuals during their period of peak embryonic development revealed highly expressed genes associated with specific Gene Ontology (GO) terms and metabolic pathways, most notably lipid, carbohydrate, glycan, and phospholipid metabolism. We also identified numerous heat shock proteins (HSPs) in the transcriptome and genome that may be related to coping with thermal stress during the sessile life history stage. A robust reference genome and transcriptome for the non-model organism K. kelletii provide resources to enhance our understanding of its ecology and evolution and potential mechanisms of range expansion for marine species facing environmental changes.
1 Introduction
The investigation of population ecology, adaptive evolution, and molecular responses of species to climate change is important to ecosystem science, conservation, and management (Parmesan, 2006). For instance, the Anthropocene is marked by escalating cases of species expanding and/or shifting their biogeographic range distributions in response to climate change (Chen et al., 2011; Pinsky et al., 2013), and new ranges often present new environmental and human-induced stressors that challenge and direct the physiological function, population viability, and evolutionary trajectory of the range-expanding species (Fields et al., 1993; Hazen et al., 2013; Matthew et al., 2022). Thus, in the face of climate change, it is essential to understand the ability of species to adapt to new environmental conditions to sustainably manage their populations and to support ecosystem function and resilience (Byrne et al., 2020).
Generating genomes and transcriptomes from a diverse range of species is valuable for supporting analyses of their response to climate change (Lemay et al., 2013; Stillman and Armstrong, 2015). Population genomic analyses can reveal patterns of migration and gene flow between a species’ historical and expanded range, source–sink dynamics, response to environmental drivers, and, ultimately, projected population persistence (Kapheim et al., 2019; Ma et al., 2021). Genome and transcriptome assemblies also facilitate comparative analyses of individuals and species for detecting patterns of genetic variation potentially associated with climatic stressors and adaptive evolution (Barshis et al., 2013; Stillman and Armstrong, 2015). For example, a reference genome assembly coupled with genome-wide sequencing can be used to identify selection on polygenic traits. Using this method, Barghi et al. (2019) identified multiple alternative genetic pathways converging on an optimal phenotype that allow for rapid evolution. Utilizing the power of genome assemblies and genome-wide data can thus help answer fundamental questions on the nature of adaptive evolution.
Kellet’s whelk, Kelletia kelletii, is a subtidal gastropod and significant predator and scavenger in kelp forest ecosystems (Halpern et al., 2006) and commercial fisheries species in California, USA (Aseltine-Neilson et al., 2006). Kellet’s whelk has recently exhibited an approximately 400 km northward range expansion (first identified in 1980) along the North American west coast (Herrlinger, 1981), potentially driven by intensifying El Niño oceanographic conditions arising from climate change (Zacherl et al., 2003; Harley et al., 2006). The species’ range expansion is likely associated with physiological, ecological, and evolutionary changes that affect population dynamics and persistence. For example, protein analysis indicates that K. kelletii can exhibit physiological changes that might aid in cold compensation, including an increased abundance of proteins involved in energy metabolism, oxidative stress, and cell signaling (Vasquez et al., 2019). This change in protein composition could support adaptation to the typically colder ocean water temperatures K. kelletii experiences in its expanded range. Revealing the genetic processes behind these changes may provide valuable insights into the mechanisms of species evolution and adaptation as well as appropriate management of the species.
Despite its ecological and economic importance, K. kelletii is a non-model species with scarce genetic data available (White and Toonen, 2008; Selkoe et al., 2010). This creates a lost opportunity to understand the ecological and evolutionary dynamics of K. kelletii as well as other coastal marine species. Genetic analyses of non-model organisms such as K. kelletii are often logistically challenging. For example, de novo assembly of the genome and transcriptome of K. kelletii—and most marine gastropods—is challenged by the ability to extract pure and high-molecular-weight (HMW) genomic DNA, often rendering co-precipitates that can inhibit the performance of different sequencing platforms (Adema, 2021; Daniels et al., 2023). Moreover, genomic assembly tools are typically designed for high-quality genomic datasets (da Fonseca et al., 2016; Wang et al., 2021) and have been found to perform poorly when presented with highly repetitive and heterozygous sequences, which are common in marine invertebrates (Yuan et al., 2017). Consequently, invertebrate species are disproportionately under-represented in genomic research: they account for ∼97% of all animals, yet as of 2020, they possess less than a third of available whole-genome assemblies in comparison to vertebrates (Zhang et al., 2021). To overcome these shortcomings and successfully generate genome and transcriptome assemblies of non-model organisms, such as K. kelletii, an innovative combination of testing and troubleshooting using multiple methods and assembly tools is required.
In this study, we combined sequence data from multiple state-of-the-art sequencing methods to generate a draft genome for K. kelletii as well as to assess the efficacy of different methods for genomic analysis of this non-model organism. We compared genome assembly tools and developed a workflow that yielded a high-quality genome for K. kelletii. Additionally, we generated a complete and annotated transcriptome from total mRNA-seq data. The data generated provide insights into novel molecular processes of K. kelletii, such as the presence of highly expressed genes associated with specific Gene Ontology (GO) terms and metabolic pathways, and genes in the heat shock protein (HSP) family that provide a potential mechanism for K. kelletii to adapt to environmental stressors in its expanded geographic range.
2 Materials and methods
2.1 Sample collection
Adult K. kelletii were collected in the wild and maintained in flow-through filtered seawater aquaria at the California Polytechnic State University research pier, located in Avila Beach, California, USA. The adult whelks were collected from sub-tidal reefs located near Monterey (MON) (36.6181670 N, 121.897 W), Naples (NAP) (34.4219670 N, 119.952283 W), and Point Loma (POL) (32.665333 N, 117.261517 W), California, in 2019, transported live to the aquaria, and maintained under ambient conditions with food in the form of frozen seafood provided ad libitum (CDFW Scientific Collection Permit 8018 to C.W.). For genome sequencing, two specimens (B257 and H164) collected from NAP were kept at the Cal Poly Pier in a holding tank before dissections. For transcriptome sequencing, adult individuals from NAP, POL, and MON were kept in common garden seawater tanks (one for each location) at the Cal Poly pier (Table S3). Adults breed via internal fertilization, and females lay benthic egg capsules that develop for approximately 1 month before hatching and releasing pelagic veligers (Vendetti, 2020). We collected veligers produced by individuals in each tank by collecting egg capsules at peak development just prior to hatching and then flash-freezing the capsules in liquid nitrogen. In the lab, 58 veliger samples were prepared for cDNA sequencing by dissecting veligers from the parental egg capsule while still frozen.
2.2 Genome assembly and analysis
2.2.1 HMW DNA extractions, cleanup, and quantification
Genomic DNA extractions were conducted on gill tissue that we dissected and then flash-frozen from NAP specimens B257 and H164. Sequencing was conducted using PacBio Sequel II, Nanopore MinION, and Illumina NovaSeq sequencing platforms. For PacBio Sequel II sequencing, HMW DNA was extracted by the Genomics and Cell Characterization Core Facility (GC3F) at the University of Oregon (Eugene, OR, USA) using a modified HMW Circulomics Standard TissueRuptor Protocol with slight modifications (Supplementary Material 1). DNA was further cleaned and concentrated using the DNeasy PowerClean Pro Cleanup Kit (Qiagen, Hilden, Germany) following the manufacturer’s instructions. For Nanopore MinION and Illumina NovaSeq sequencing, HMW DNA was extracted using a modified Salting-Out Protocol (Daniels et al., 2023). The DNA was further purified and concentrated using the Genomic DNA Clean and Concentrator kit (Zymo Research, Irvine, CA, USA) and was then selected for high-molecular-weight DNA using the PacBio Short Read Eliminator kit (PacBio, Menlo Park, CA, USA) following the manufacturer’s instructions. Concentration was assessed using the dsDNA BR assay on a Qubit fluorometer (Thermo Fisher Scientific, Singapore). DNA quality was assessed by running ∼250 ng of DNA on a 2% agarose gel against a 25-kb XL ladder.
2.2.2 PacBio Sequel 2 library preparation and sequencing
Both PacBio Sequel II libraries were prepared by the GC3F at the University of Oregon (Eugene, OR, USA) using the PacBio HiFi SMARTbell Libraries from the Ultra-Low DNA Input procedure (PacBio, Menlo Park, CA, USA). Libraries were prepared for sequencing using the Binding Kit 2.2 and loaded at 143 pM. Samples were sequenced on Sequel II using the Sequel sequencing kit 2.0 and 8M SMRTcells with 2 hours of pre-extension, followed by a 30-hour movie time.
2.2.3 Oxford Nanopore Technologies MinION library preparation and sequencing
Both Nanopore MinION libraries were prepared using the Ligation Sequencing Kit (SQK-LSK108, Oxford Nanopore Technologies (ONT), Oxford, UK) and NEBnext DNA Repair Kit reagents (NEB, Ipswich, MA, USA) according to the manufacturers’ instructions. Each library aliquot at a volume of 1 µL was quantified using Qubit. The libraries of adapted and tethered DNA were used for loading the MinION Flow Cells with a total of 133 ng and 504 ng of DNA, respectively. Each library was loaded into an R9 flow cell (FLO-MIN106, ONT) for MinION sequencing. Priming and loading of the SpotON Flow Cells were performed using the standard protocol (ligation sequencing gDNA Protocol SQK-LSK109). MinION sequencing was operated with MinKNOW v5.2.13 without basecalling. Each flow cell was sequenced until <2 pores were sequenced.
2.2.4 Illumina NovaSeq library preparation and sequencing
The Illumina NovaSeq library was prepared by the GC3F at the University of Oregon (Eugene, OR, USA) for sequencing using the NEB Ultra II kit (NEB, Ipswich, MA, USA) according to the manufacturer’s instructions with a few modifications. DNA was mixed with the fragmentation reagents as described in the kit instructions, fragmented at 37°C for 8 minutes, and end-repaired as described in the manual. The end-repaired sample was mixed with the ligation buffer and enhancer from the NEB kit, and 2.5 µL of 15 µm pre-annealed Tru-Seq style Y-adapter was ligated for 15 minutes at 20°C. The sample was cleaned with 2, 0.75x bead cleans to remove adapter dimer. Samples were quantified using qPCR and loaded on the NovaSeq. All extraction, DNA cleanup, and sequencing protocols can be found in the Supplementary Material (Supplementary Material 1).
2.2.5 CCS, basecalling, and trimming
PacBio Sequel 2 raw read sequences were selected for Circular Consensus Sequences (CCS) by the GC3F at the University of Oregon. A total of 1.3 Gb, 43.7 Gb, and 26.2 Gb of data were used for downstream genome assemblies. Basecalling was conducted on the raw Nanopore MinION reads using Guppy v6.2.1 and high-accuracy mode (<5% error rate) (Supplementary Material 2). A total of 2.6 Gb and 1.4 Gb of data passed high-quality filtering and were then filtered using Fastp v0.23.2 with default parameters. Illumina NovaSeq raw sequences were trimmed and filtered using Fastp v0.23.2 with default parameters (Supplementary Material 2). A total of 119.4 Gb of forward and reverse Illumina data were used for genome assemblies.
2.2.6 Assembly and validation
A range of bioinformatic pipelines were used to assemble the genome using ONT MinION reads, PacBio HiFi reads, and Illumina NovaSeq reads. Initial genome assemblies were conducted using a range of bioinformatic tools in order to identify the best assembly. The short-read Illumina NovaSeq data were assembled using ABySS v2.3.5 (Jackman et al., 2017) using a kmer length of 80 and default parameters. The long-read data (MinION ONT reads + PacBio HiFi reads) were assembled using Flye v2.9.2 (Kolmogorov et al., 2019) using default parameters. Both the long-read and short-read data were assembled using the hybrid assembler MaSuRCA v4.1.0 (Zimin et al., 2017). These assemblies (ABySS, Flye, and MaSuRCA) were compared, and the best assembly was selected for downstream work. The long-read Flye assembly was used for RNA scaffolding and corrections using RNA_BESST (https://github.com/ksahlin/BESST_RNA). Briefly, all RNA-seq data were aligned to the long-read Flye assembly using Hisat2 v2.2.1 (Kim et al., 2019) with default parameters, and bam files were merged, sorted, and indexed using Samtools v1.3.1 (Danecek et al., 2021). This file and the long-read Flye assembly were used as the input files for RNA_BESST scaffolding using default parameters. DNA scaffolding and corrections were conducted on the RNA_BESST assembly using BESST v2.2.4 (https://github.com/ksahlin/BESST). Briefly, all Illumina NovaSeq reads were aligned to the RNA_BESST assembly using Hisat2 v2.2.1, and the bam file was sorted and indexed using Samtools v1.3.1. This file and the RNA_BESST assembly were used as the input files for BESST. All genome assemblies were assessed using QUAST v5.2.0 (Gurevich et al., 2013) and BUSCO v5.3.2 (Simão et al., 2015) against the metazoa database. The genome with the best overall quality was used for all downstream methods and referred to as the K. kelletii complete genome. Complete genomes of 22 closely related species (i.e., taxonomy: species; Buccinidae: Babylonia areolata, Neogastropoda: Conus ventricosus, Phymorhynchus buccinoides, Anentome helena, Conus betulinus, Conus tribblei, Conus consors, Caenogastropoda: Alviniconcha marisindica, Batillaria attramentaria, Lanistes nyassanus, Pomacea maculata, Marisa cornuarietis, Pomacea canaliculata, Melanoides tuberculata, Gastropoda: Dirona pellucida, Tritonia festiva, Elysia marginata, Haliotis laevigata, Physella acuta, Chrysomallon squamiferum, and Achatina immaculata) were downloaded from NCBI (https://www.ncbi.nlm.nih.gov), and QUAST metrics and Benchmarking Universal Single-Copy Orthologs (BUSCO) scores were compared. Prokaryotic decontamination was conducted using FCS-GX (Astashyn et al., 2023). All scripts and accession numbers used can be found in the Supplementary Material (Supplementary Material 2).
2.2.7 Structure and read alignment
Genome size was estimated using all sequencing reads in KMC v3.2.1 (Kokot et al., 2017), and the histogram of the reads was visualized in GenomeScope 2.0 (Ranallo-Benavidez et al., 2020). All sequencing reads of each type (Illumina NovaSeq, Nanopore MinION, PacBio sequel II) were merged and aligned to the K. kelletii genome using Hisat2 v2.2.1 with default parameters. Each bam file was sorted using Samtools v1.3.1 and assessed using Qualimap v2.2.2 (Okonechnikov et al., 2016). Read coverage of each type was compared across each contig, and the total coverage of each contig was calculated. Total coverage values for each contig were rounded to the nearest integer, and the percent of contigs at each depth was calculated. Contig guanine–cytosine (GC) content and length were extracted using Infoseq in EMBOSS v6.6.0.0 (https://www.bioinformatics.nl/cgi-bin/emboss/help/infoseq).
2.2.8 Genome annotations
RNA-seq reads were mapped to the genome using Hisat2 v2.2.1. BAM files were sorted and combined using Samtools v1.3.1. A transcripts.gtf file based on RNA-seq read alignment was constructed using Stringtie v2.2.1 (Kovaka et al., 2019), and transcript predictions were made using TransDecoder v5.5.0 (Haas, BJ. https://github.com/TransDecoder/TransDecoder). The Eukaryota Swiss-Prot database was downloaded from the UniProtKB/Swiss-Prot database (Apweiler et al., 2004), and a database was created using BLAST v2.12 (Altschul et al., 1990). This database was used for homology-based predictions using TransDecoder. A genome-based coding region annotation file was created using TransDecoder. The resulting protein sequence file based on final candidate open reading frames (ORFs), with shorter candidate ORFs within longer ORFs removed, was used for phylogenetic analysis and HSP family analysis. The protein sequence file was further clustered based on 95% identity using CD-HIT v4.8.1 (Fu et al., 2012).
2.2.9 Phylogenetic analysis
The TransDecoder consensus protein sequences for K. kelletii were used for OrthoFinder v2.5.5 (Emms and Kelly, 2019) along with downloaded genome protein sequences of 10 high-quality related genome assemblies from NCBI (i.e., taxonomy: species; Caenogastropoda: B. attramentaria, P. canaliculata, Gastropoda: Aplysia californica, Plakobranchus ocellatus, E. marginata, Gigantopelta aegis, Haliotis rubra, Bivalva: Pecten maximus, Mya arenaria, and Annelida: Owenia fusiformis). OrthoFinder was used to assign genes to orthogroups and produce a species tree. Briefly, orthogroups were inferred and gene trees were produced using the STAG (Emms and Kelly, 2018) algorithm. The rooted species tree was inferred based on all gene trees and rooted using STRIDE. The species tree was visualized using Dendroscope3 (Huson and Scornavacca, 2012) with STAG support values at internal nodes (https://github.com/davidemms/STAG). The flowchart of genomic methods can be found in Figure 1A.
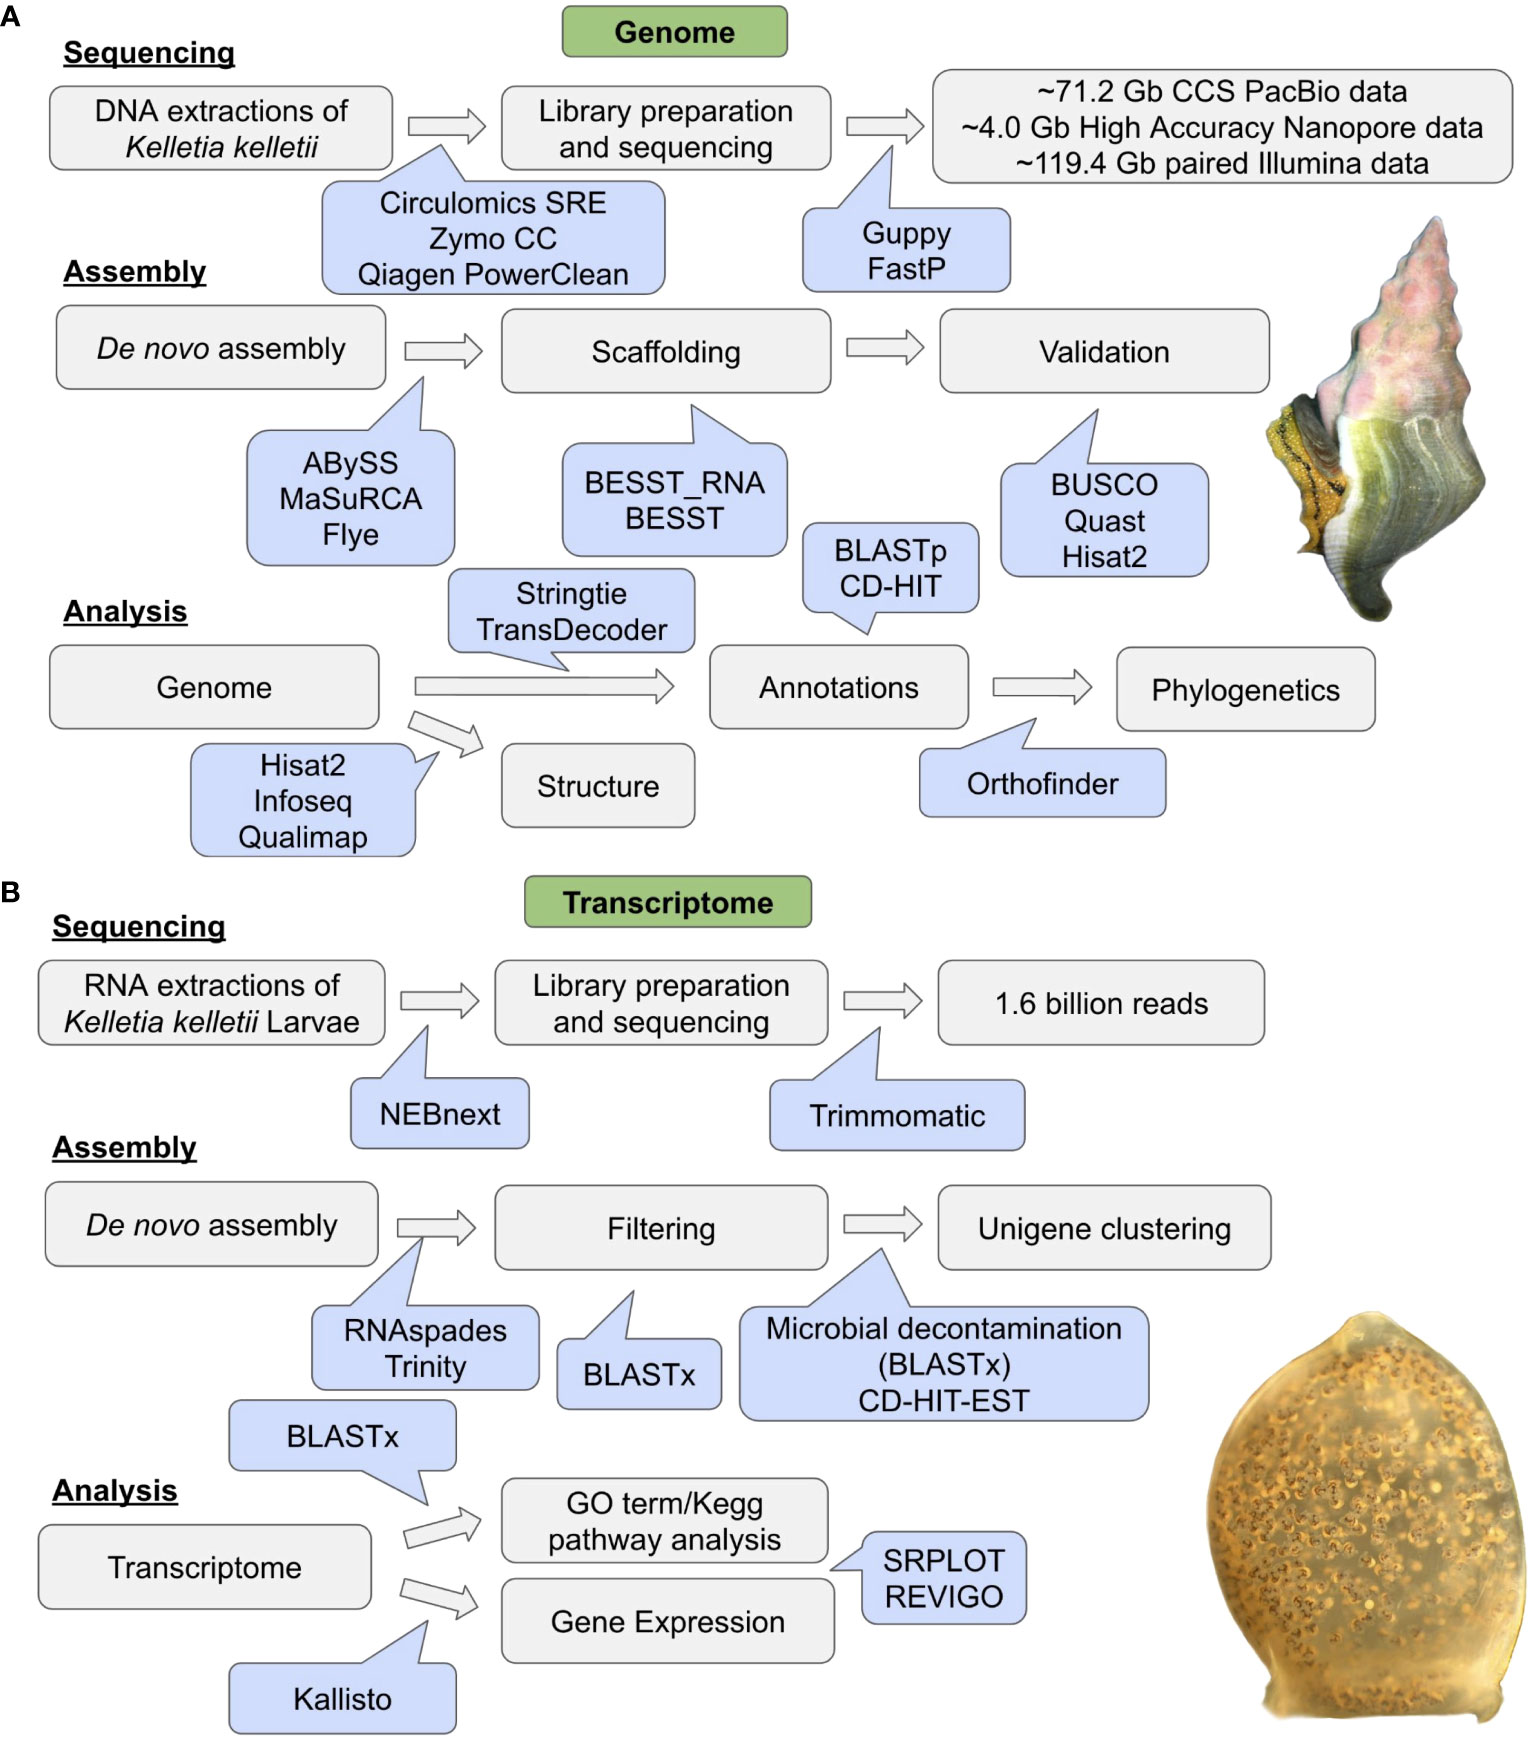
Figure 1 Workflow diagram of (A) genome sequencing, genome assembly, and analysis. Image of Kellet’s whelk, Kelletia kelletii, adult (photo credit: CW). (B) RNA sequencing, transcriptome assembly, and transcriptome analysis. Image of K. kelletii larva at peak development (photo credit: JV).
2.3 Transcriptome assembly and analysis
2.3.1 Sequencing
RNA extractions on all 58 veliger samples (24 from adults originating from MON, 18 from adults originating from NAP, 10 from adults originating from both MON and NAP, and 6 from adults originating from POL), sequencing, and data quality control were conducted by Novogene (Davis, CA, USA). Briefly, RNA was extracted using TRIzol and RNA phase separation. After fragmentation, the first-strand cDNA was synthesized using random hexamer primers, followed by the second-strand cDNA synthesis using dTTP for non-directional library preparation. Messenger RNA was purified from total RNA using poly-T oligo-attached magnetic beads. Libraries were prepared using end repair, A-tailing, adapter ligation, size selection, amplification, and purification. Libraries were checked using Qubit, real-time PCR for quantification, and bioanalyzer for size distribution detection (Agilent, Santa Clara, CA, USA). Libraries were pooled and sequenced on the NovaSeq (Illumina, San Diego, CA, USA). Raw data fastq files were processed through in-house Perl scripts (Supplementary Material 2). Clean reads were obtained by removing reads containing adapters, reads containing poly-N, and low-quality reads. Q20, Q30, and GC content were calculated for the clean reads. RNA-seq reads were further cleaned using Trimmomatic v0.39 (Bolger et al., 2014) IlluminaClip with leading: 3, trailing: 3, slidingwindow: 4:15, minlen: 36 parameters (see Supplementary Material 2). All downstream analyses were conducted using the clean data.
2.3.2 Assembly
The trimmed and paired RNA reads from the 58 samples were assembled using Trinity v2.14.0 (Grabherr et al., 2011) and rnaSPAdes v3.15.4 (Bushmanova et al., 2019). Both assemblies were run using default parameters. The quality of transcriptomes was assessed and compared using BUSCO v5.3.2 using the metazoa (954 genes) and mollusca (5295 genes) BUSCO databases. RnaSPAdes transcriptome was further filtered by removal of contigs without BLASTx hits to either the UniProtKB/Swiss-Prot (Boutet et al., 2016) database or the NCBI NR database (Benson et al., 2006). To distinguish whether contig sequences were originating from host (K. kelletii) or microbial members (bacteria, viruses, and archaea), each contig was aligned to the UniPort databases of Eukaryota (representing the K. kelletii gene expression) or bacteria, viruses, and archaea (representing the microbial gene expression). Protein databases for eukaryotes, bacteria, viruses, and archaea were created using the Swiss-Prot annotated genes for each group using BLASTx v2.12.0. The transcriptome was blasted to each database and given their group identifier: BLASTx results for Eukaryota were given “host” in the identifier column, and BLASTx results for microbes were given “microorganism” in the identifier column. All contig BLASTx results were ordered by bitscore, and duplicate contig IDs were removed. This resulted in each contig being assigned to its highest BLASTx bitscore and a group identifier. The contig IDs from the “microorganism” group were removed from the transcriptome assembly for microbial decontamination. Unigene clustering was conducted on this assembly using CD-HIT with a minimum contigs size of 150 bp and sequence identity threshold of 0.95.
2.3.3 Analysis
The transcriptome was blasted to the Eukaryota UniProtKB/Swiss-Prot database using BLASTx. Gene expression of each gene within the transcriptome was calculated using Kallisto v0.48.0 (Bray et al., 2016) for all 58 samples, and the total transcripts per million (TPM) were calculated for each gene. GO terms and pathway data were extracted from BLASTx results using UniProt ID Mapping to each gene (Apweiler et al., 2004). GO term count within the transcriptome was identified by counting the occurrence of each GO term annotation across all genes. GO term expression was calculated using the sum of all gene expression associated with each GO term. GO term data were visualized using SRPLOT (https://www.bioinformatics.com.cn/en) and REVIGO (Supek et al., 2011). A flowchart of transcriptomic methods can be found in Figure 1B.
3 Results
3.1 Genome assembly
The genome of K. kelletii was assembled using a combination of sequences generated by Oxford Nanopore Technologies MinION, PacBio Sequel II, and Illumina NovaSeq platforms. Three initial de novo genome assemblies were produced using only the NovaSeq short-read data, only the Sequel II and MinION long-read data, or a combination of the short-read and long-read data. The NovaSeq data assembled using ABySS produced a genome with an accumulated length of 0.15 Gb in 35,020 contigs and a complete BUSCO score of 9.9%. The MinION and Sequel II data assembled using Flye produced a genome with an accumulated length of 2.11 Gb in 55,556 contigs and a complete BUSCO score of 81.1%. Both data types (long-read and short-read) assembled using MaSuRCA produced a genome with an accumulated length of 1.42 Gb in 37,318 contigs and a complete BUSCO score of 65.3% (Table 1). The additional RNA scaffolding on the Flye assembly resulted in improved assembly metrics for BUSCO score, contig number, and contig N50 (Table 1; Figure 2). Further scaffolding of this assembly using the NovaSeq short-read data resulted in improved contig number and contig N50 but a slight reduction in the complete BUSCO score from 84.2% to 84.1%; however, the overall missing BUSCO score was improved to 7% from 6.9% (1 gene) (Table 1; Figure 2). This final assembly (Flye + RNA + DNA scaffolding) with an accumulated length of 2,107,417,620 base pairs (2.1 Gb) and 46,654 contigs was the most complete and contiguous assembly; therefore, it was selected for all downstream analyses and referred to as the K. kelletii genome (Table 1). A genome size of 2,594,611,041 bp, 2% heterozygosity, and 56.48% sequence repeats was estimated based on a kmer-based method in KMC and GenomeScope 2.0. This estimated genome size being larger than our assembled genome (2.1 Gb versus 2.6 Gb, respectively) suggests a haploid genome assembly. Prokaryotic decontamination using FCS-GX resulted in one contaminated contig that was removed from the K. kelletii genome.
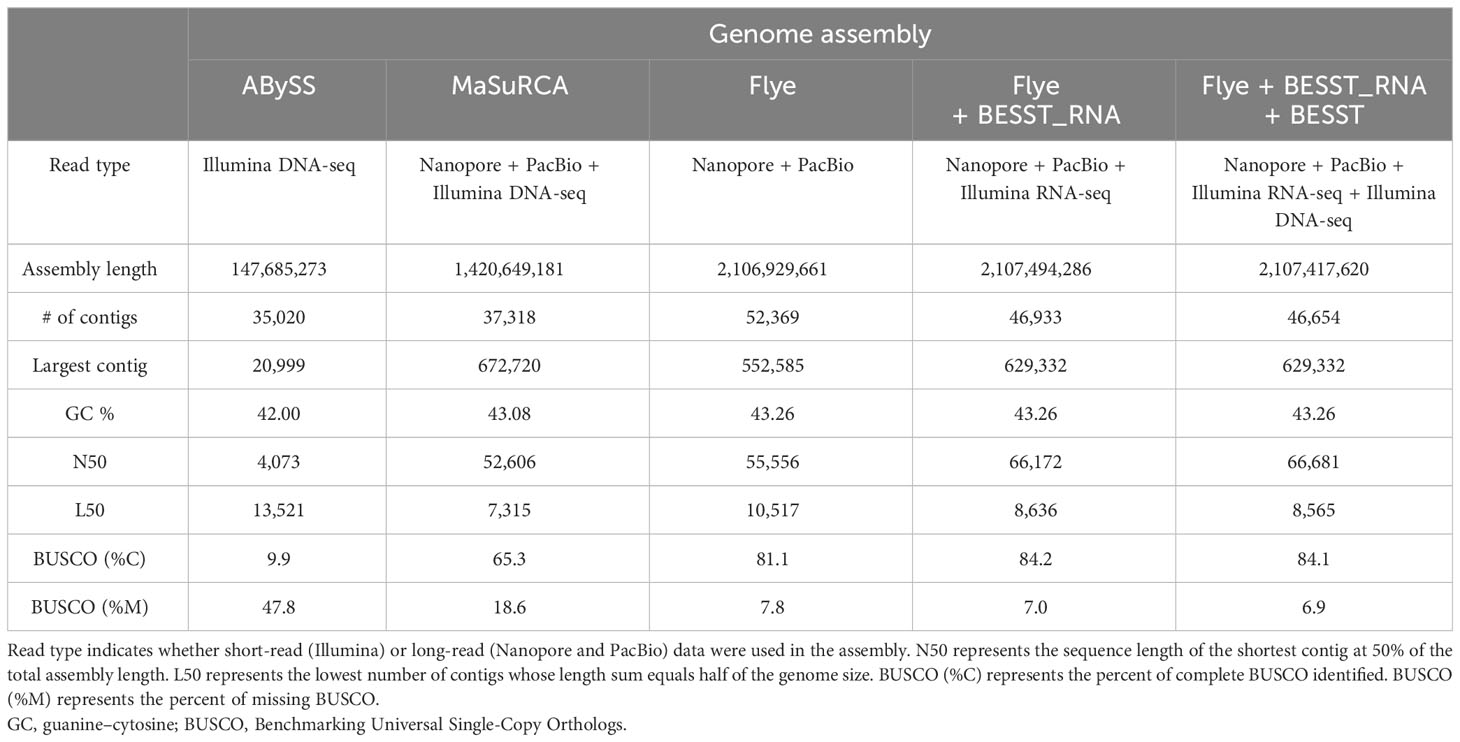
Table 1 Genome assembly metrics comparing different assembly tools in order from least complete (center) to most complete (right).

Figure 2 BUSCO completeness comparison between different assemblies of Kelletia kelletii based on Metazoa odb10. Colors represent the categories of identified BUSCO. S, complete and single copy; D, complete and duplicated; F, fragmented; M, missing. ABySS: NovaSeq data assembly; Flye: MinION and Sequel II assembly; Flye + RS: Flye + RNA-scaffolding assembly; Flye + RS + DS: Flye + RNA-scaffolding + DNA-scaffolding assembly. Total percent S + D + F listed with each assembly type.
3.2 Genome validation
The K. kelletii genome has a slightly lower BUSCO and N50 than most other high-quality gastropod genomes but remains clustered with the highest-quality genome assemblies in relation to BUSCO and N50 metrics (Figure 3). The K. kelletii genome only had 6.9% missing metazoan BUSCO (Table 2) and 84% of the RNA-seq reads from the 58 samples used in the transcriptome assembly mapped back to the genome (Table S1), suggesting a relatively complete genome.
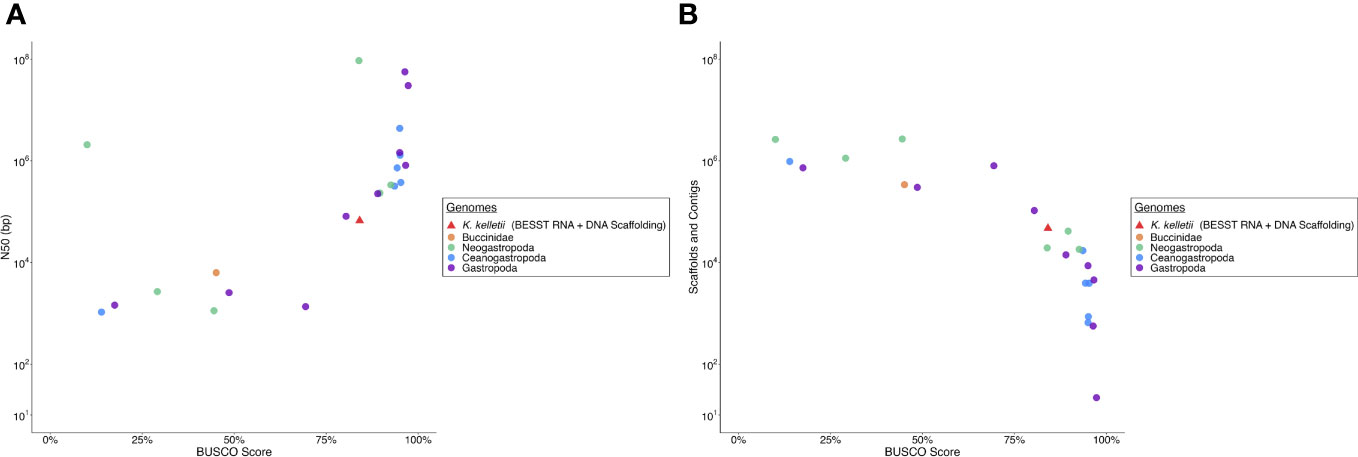
Figure 3 Comparison of Kelletia kelletii genome quality to other Gastropod genomes. (A) Contig logN50 vs. BUSCO (Benchmarking Universal Single-Copy Orthologs) score. (B) Number of scaffolds and contigs vs. BUSCO score.
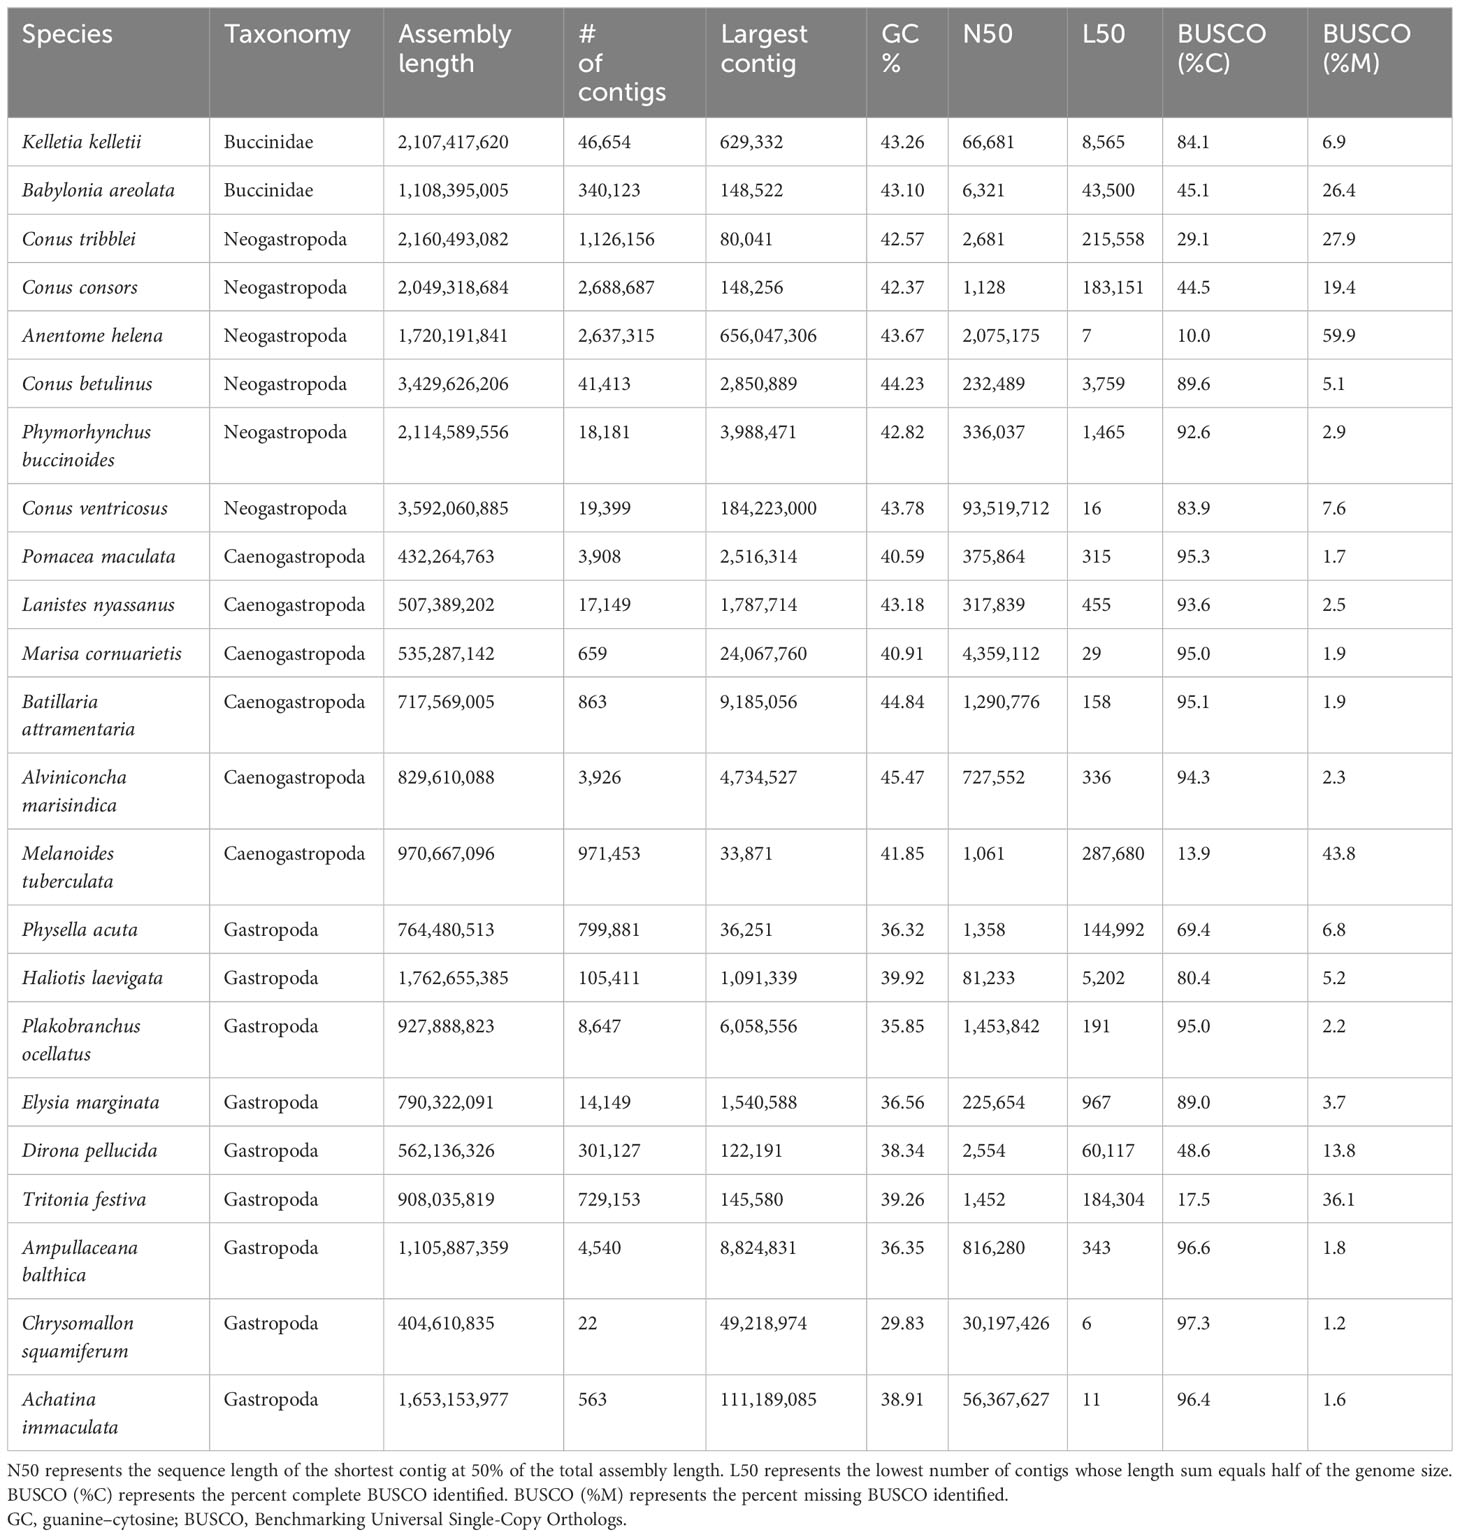
Table 2 Genome assembly metrics comparing different Gastropod genomes.
3.3 Genome characteristics
Reads mapped back to the K. kelletii genome provide evidence on each sequencing dataset’s coverage and contribution to genome completeness (Table S2). The MinION data produced an average coverage of 0.016x and mapped to 34.68% of contigs, the Sequel II data produced an average coverage of 4.44x and mapped to 91.61% of contigs, and the NovaSeq data produced an average coverage of 66.14x and mapped to 100% of contigs (Table S2). Distribution of total sequence coverage across all contigs shows only 18 contigs having lower than 2x coverage (∼0.04%) and 1,477 contigs with greater than 200x coverage (∼3.2%) (Figure 4; Table S2). Percent of contigs at each sequencing depth shows that the majority of contigs had greater than 20x coverage (∼96.6%) (Figure 4). GC content compared to the contig sequencing coverage (for contigs ≥ 1.5 kb and coverage ≥ 20) shows a uniform cluster suggesting non-heterozygous sequences found in the assembly (Figure 4C; Li et al., 2017; Yuan et al., 2017).
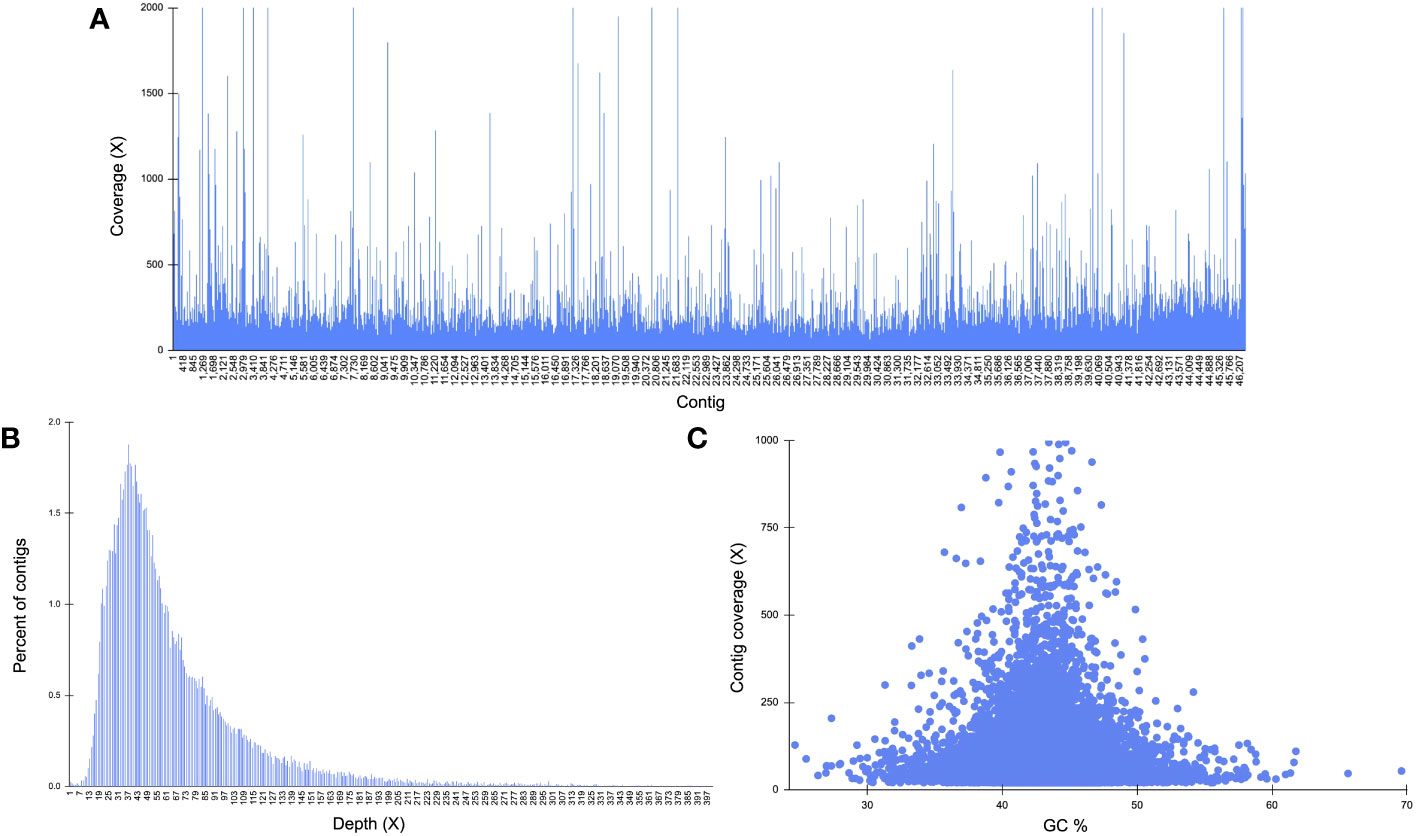
Figure 4 Genome structure characteristics of Kelletia kelletii. (A) Distribution of total sequence coverage across all contigs; average coverage for each read type: MinION = 0.02 ± 0.52, Sequel II = 4.44 ± 3.63, NovaSeq = 66.14 ± 155.46. Percent of contigs with each read type: MinION = 34.68%, Sequel II = 91.61%, NovaSeq = 100%. (B) Sequencing depth distribution throughout the genome. (C) Guanine–cytosine (GC) content of contigs against contig coverage for contigs ≥ 1,500 kb and coverage ≥ 20.
3.4 Genome annotation
A total of 168,252 protein sequences were identified by Transdecoder from ORFs within the genome. Further clustering of these protein sequences based on 95% identity revealed 76,242 consensus proteins representing the K. kelletii protein-coding genes. A total of 33,024 (∼43.3%) of these proteins aligned to the Eukaryota UniProtKB/Swiss-Prot database, leaving 43,218 unidentified protein-coding genes from the K. kelletii genome.
3.5 Phylogenetics
OrthoFinder assigned 526,695 protein sequences (84.6% of the total) from 11 species to 49,127 orthogroups. Fifty percent of all genes were in orthogroups with 17 or more genes and were contained in the largest 8,517 orthogroups. There were 5,803 orthogroups with all 11 species present, and 132 of these consisted entirely of single-copy genes. STRIDE (Emms and Kelly, 2017) tree analysis contained 314 well-supported, non-terminal duplications, meaning each was shared by more than one species; a total of 313 duplications provided support for optimal root placement, while 1 was contradictory. The phylogeny produced confirms the phylogenetic lineage across the given high-quality lophotrochozoan genomes and K. kelletii’s taxonomic position, initially established with fossil records and mitochondrial DNA sequence data (Figure 5; Vaux et al., 2017; Vaux et al., 2018).

Figure 5 Phylogenetic tree of closely related species to Kelletia kelletii using orthologs between closely related species identified by OrthoFinder using STAG and STRIDE inferences. NCBI taxonomic groups are represented by color, as shown in the legend. Higher-order taxonomic groupings are indicated on the right. Branch length represents the average number of substitutions per site between all protein comparisons, and bootstrap values at internal nodes represent STAG support values calculated based on the fraction of trees that support each bipartition (https://github.com/davidemms/STAG).
3.6 Transcriptome analysis
The 58 sequenced K. kelletii veliger samples from three different locations (Table S3) produced a total of 1,639,361,325 reads. The resulting rnaSPAdes (Complete Metazoa BUSCO score, 99%) and Trinity (Complete Metazoa BUSCO score, 98.4%) assemblies of the raw trimmed reads indicated a more complete assembly by rnaSPAdes and were therefore used for downstream analysis and referred to as the K. kelletii transcriptome (Table S5). The assembled transcriptome was ∼1.1 Gb total length with 1,186,735 contigs (Table 3). Further filtering, decontamination, and unigene clustering of the assembly resulted in a clustered assembly with ∼0.47 Gb total length and 261,643 unigenes (Table 3). Of these 261,643 unigenes, 91,761 (∼35.1%) were blasted to the UniProtKB/Swiss-Prot database (Table S4). Of these annotated unigenes, 21,988 mapped to Kyoto Encyclopedia of Genes and Genomes (KEGG) terms, 7,528 mapped to UniProt annotations involving pathways, and 8,639 mapped to UniProt annotations specifically involving developmental stages (Table S4). Unigene length distribution showed that 46.7% of the unigenes fell into the 150–1,000-bp length, while the remaining 53.3% were above 1,000 bp (Figure S1). A significant proportion of unigenes within the 150–1,000-bp length range (46.7%) indicates the presence of many smaller RNA molecules in the transcriptome.
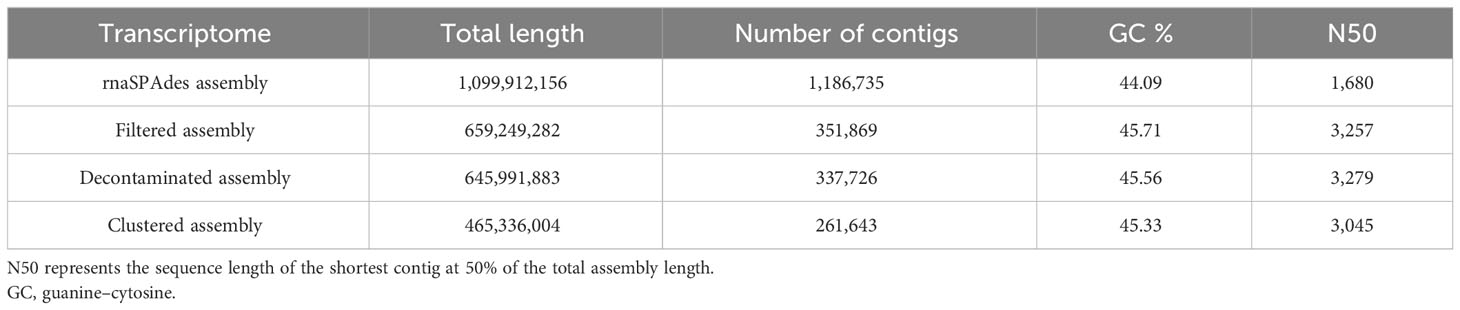
Table 3 Transcriptome assembly metrics at each step of assembly.
3.7 GO term and pathway analyses
The top 12 occurring and expressed GO terms within each category [biological process (BP), molecular function (MF), and cellular component (CC)] of the 91,761 transcriptome unigenes showed the most represented GO terms in the transcriptome associated with the development period within the K. kelletii egg capsules (Table S4; Figure 6). The top 40 expressed GO terms within each category were mapped and connected based on their similarity, which revealed the most abundant GO term subcategories during peak embryonic development, such as “chordate embryonic development”, “lipid binding”, and “response to oxidative stress” and their association with other highly expressed GO terms (Figure 6). Pathway identification in the transcriptome revealed the top 20 expressed pathways and their associated gene count such as “lipid metabolism”, “purine metabolism”, and “energy metabolism” (Figure 7).
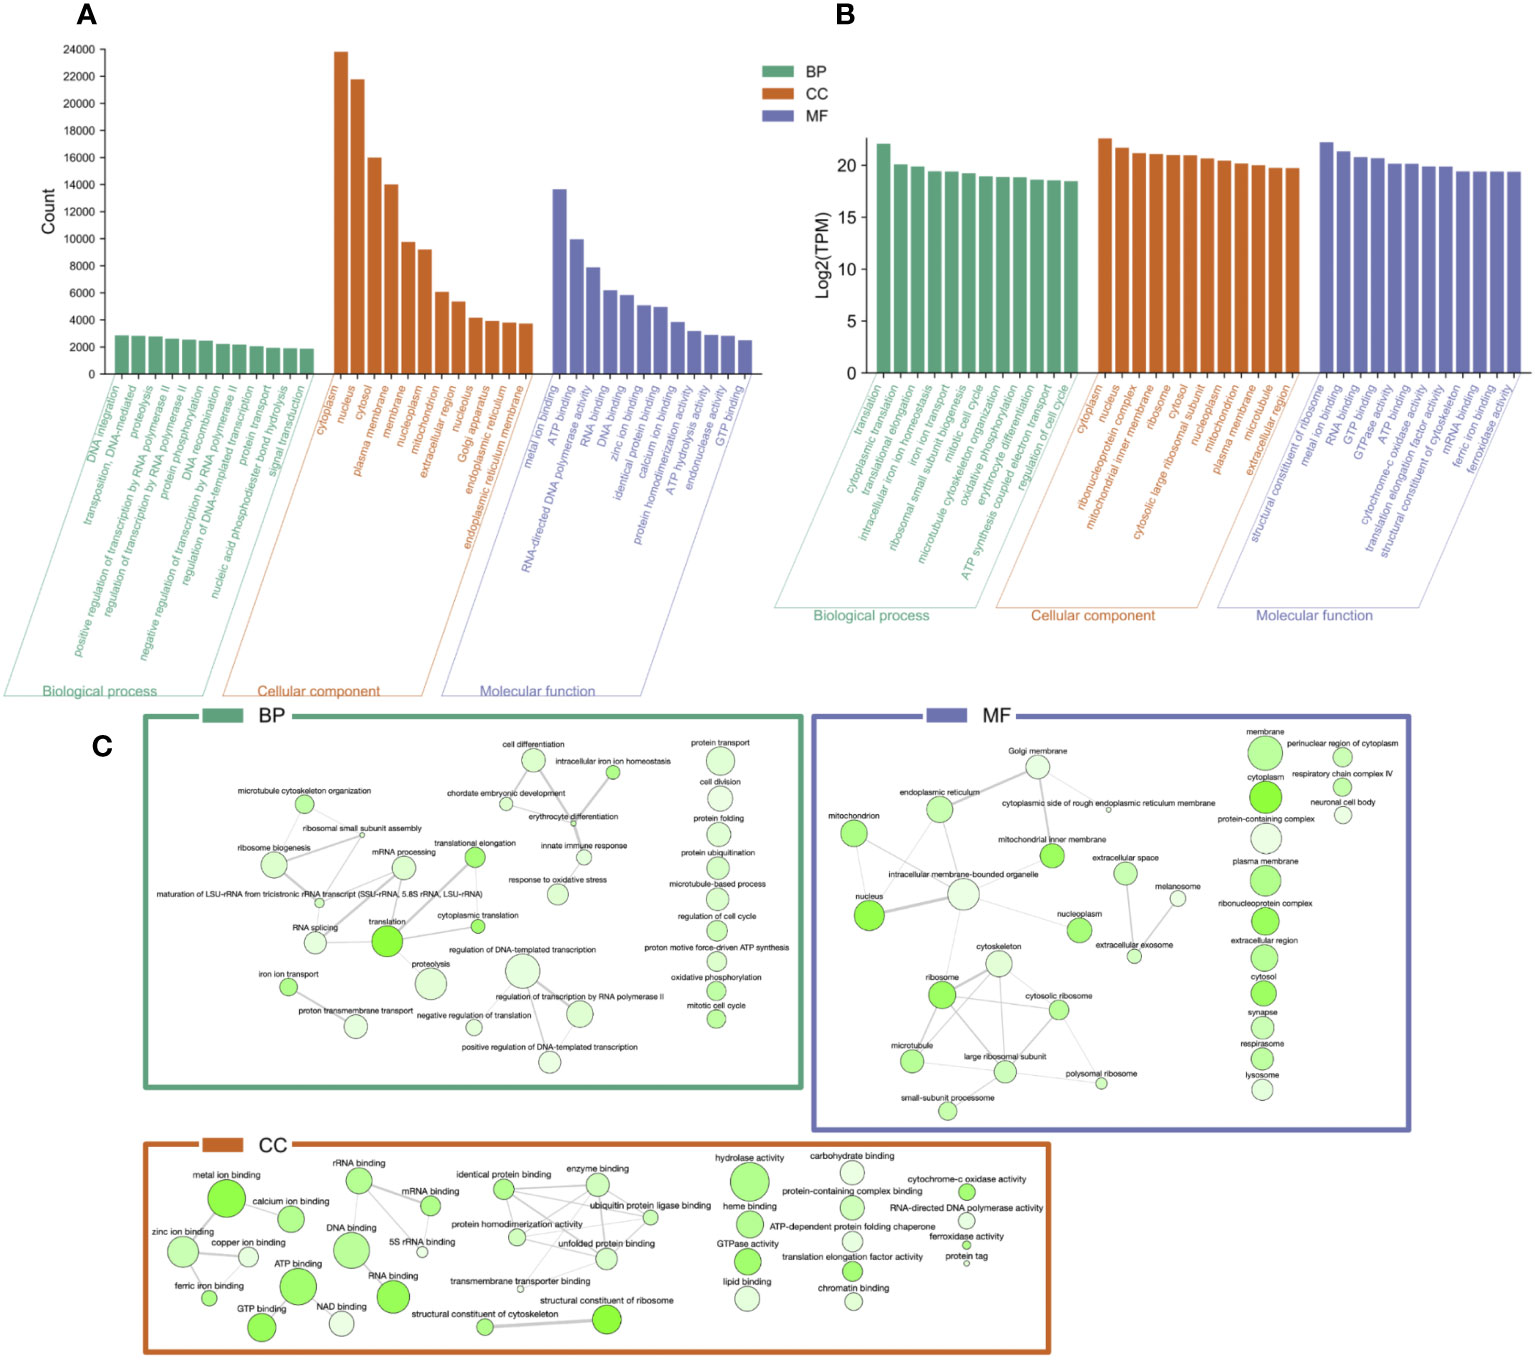
Figure 6 Gene Ontology (GO) categorization [GO category: biological process (BP), molecular function (MF), and cellular component (CC)] of unigenes in the Kelletia kelletii transcriptome. (A) Top 12 occurring GO terms within the K. kelletii transcriptome of each GO category. (B) Top 12 expressed GO terms for each GO term category from the combined transcripts per million (TPM) of 58 K. kelletii RNA-seq samples at peak embryo development. (C) Interaction web of the top 40 expressed GO terms for each GO term category: biological process (BP), molecular function (MF), and cellular component (CC) from the combined transcripts per million (TPM) of 58 K. kelletii RNA-seq samples at peak embryo development. Highly similar GO terms are linked by edges in the graph, where the line width indicates the degree of similarity. Color of the bubble indicates Log2(TPM), with dark green being higher expression and light green being lower expression. Bubble size indicates the frequency of the GO term in the underlying GOA database (Camon et al., 2004).
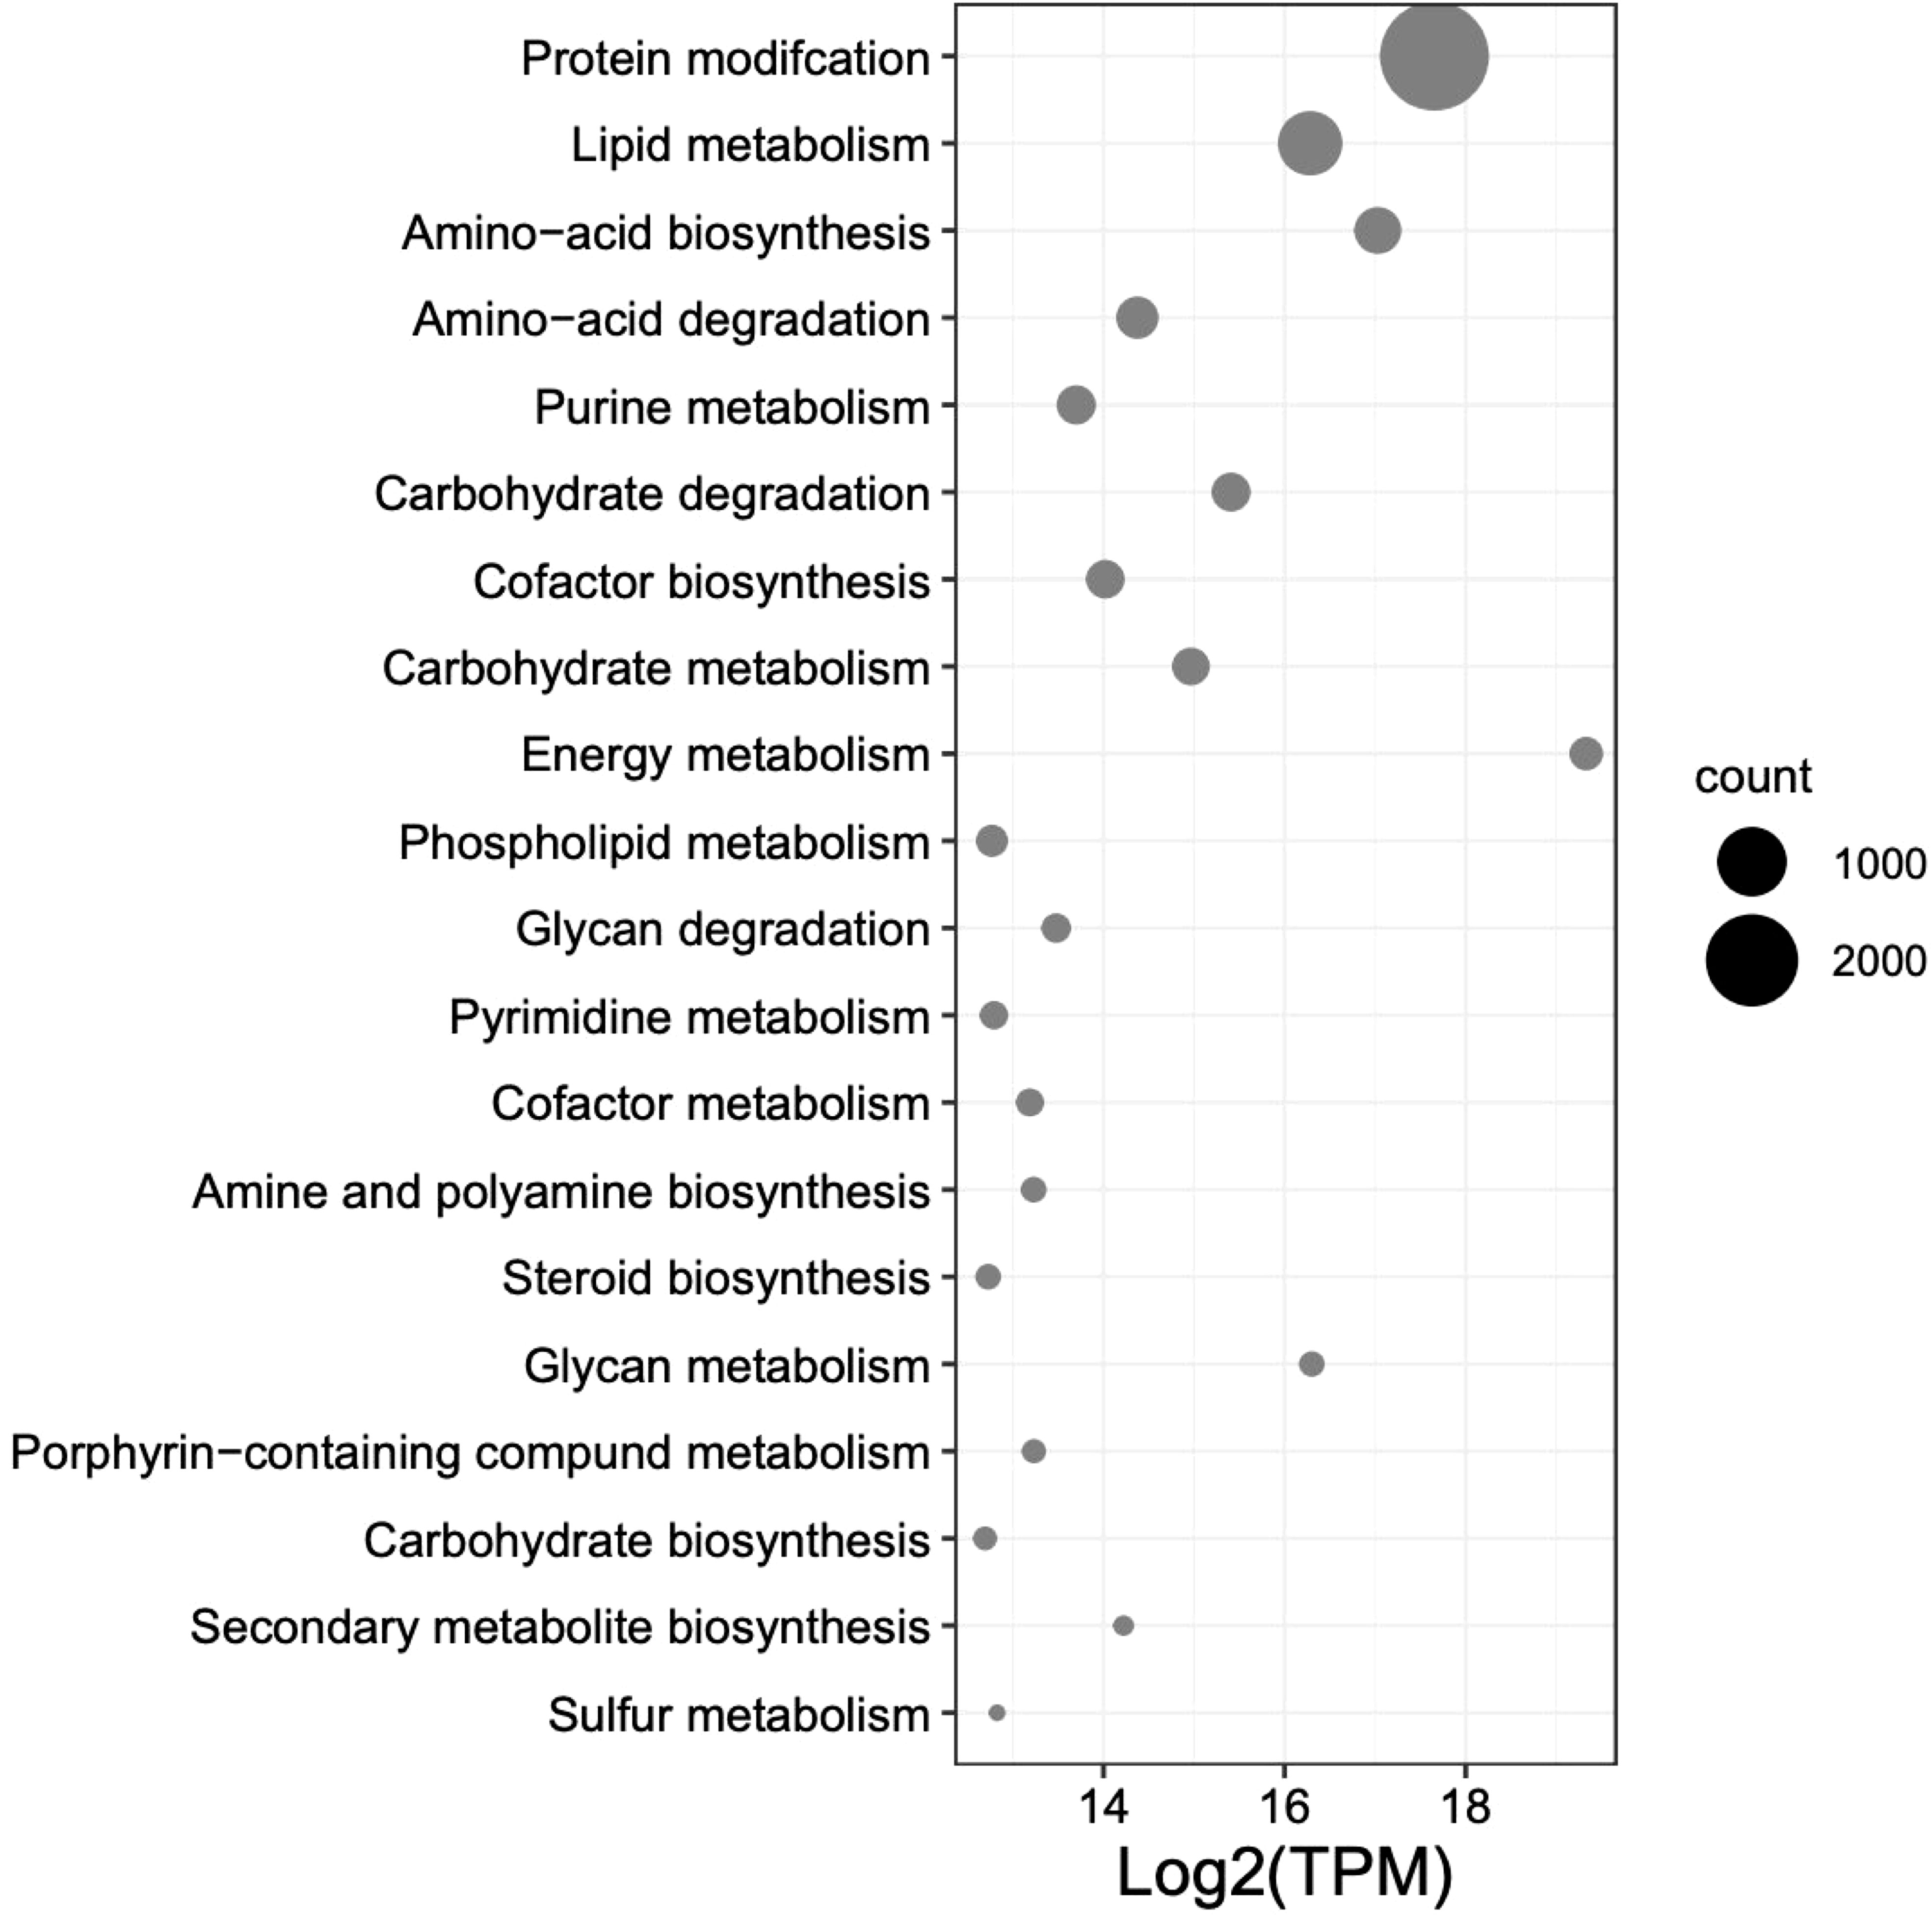
Figure 7 Top 20 expressed pathway terms from UniProt BLASTx results from the combined transcripts per million (TPM) of 58 Kelletia kelletii RNA-seq samples at peak embryo development. Pathways are ordered by gene count within the K. kelletii transcriptome.
3.8 Heat shock gene families
Search results for HSPs within the BLASTx and BLASTp from the transcriptome and genome, respectively, revealed the HSP toolkit conserved by K. kelletii (Table 4; Table S6). A total of 199 heat shock proteins or associated proteins were identified in the transcriptome, with many falling into the heat shock protein families Hsp10/E, Hsp20/small hsp, Hsp40/DnaJ, Hsp60/Chaperonin, Hsp70, Hsp90, and Hsp110 (Table 4). A total of 80 heat shock proteins or associated proteins were identified in the genome (Tables 4, S6). Heat shock protein families were consistent across the transcriptome and genome but varied in their gene counts and composition.
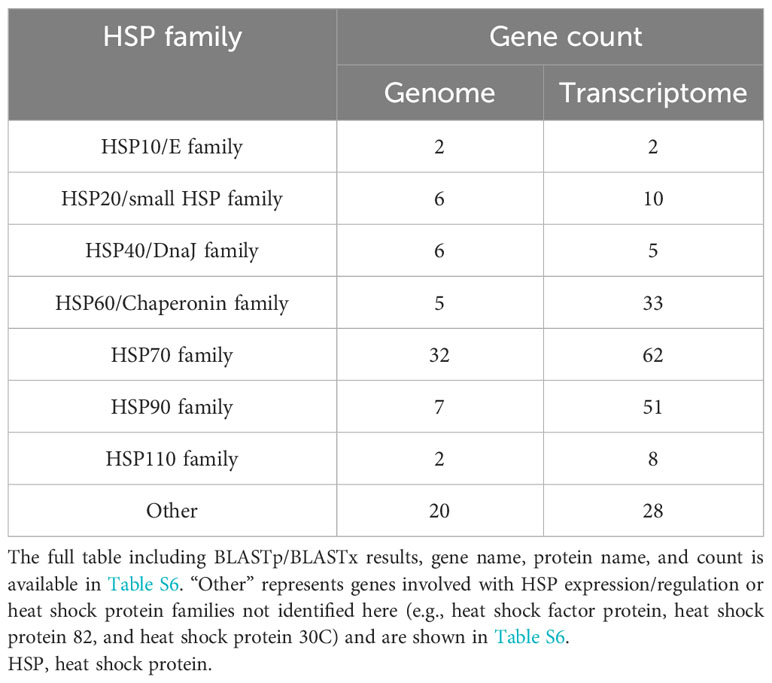
Table 4 HSP gene count from UniProt BLASTp to the genome and BLASTx to the transcriptome.
4 Discussion
We conducted an inclusive comparison of de novo sequencing and assembly tools on a non-model organism using a combination of the leading platforms in genome and transcriptome sequencing. The utility of these platforms and tools for model organisms has been shown repeatedly (Zhang et al., 2011; Senol Cali et al., 2019; Dida and Yi, 2021), yet their application to understudied taxa is minimal (Wang et al., 2021). We have provided insight into the structure and quality of the K. kelletii genome and transcriptome assembly as well as a glimpse into the molecular processes within this non-model organism during its early life history stage. The overall completeness and continuity of the Kellet’s whelk genome are comparable with those of other published gastropod genomes despite having less genome coverage than most high-quality assemblies. The K. kelletii genome represents the most contiguous genome among the Buccinidae family to date (Table 2; Figure 3; https://www.ncbi.nlm.nih.gov). Each sequence read type was remapped to the K. kelletii genome to compare coverage and bias created by each sequencing type. Genome coverage was variable (70.6 ± 155.8x genome coverage) with 1,477 contigs with coverage greater than 200x, suggesting that redundant sequences still in the assembly or sequencing bias occurred at specific regions of the genome (Rieber et al., 2013). Genome annotations revealed a relatively large number of protein-coding genes for K. kelletii, with 76,242 predicted proteins. Among molluscan species with documented genomes, this places K. kelletii with an unusually high number of protein-coding genes, similar to that of sea slugs E. marginata (70,752 protein-coding genes) and P. ocellatus (77,230 protein-coding genes) (Maeda et al., 2021). The larger number of protein-coding genes of K. kelletii may be attributed to its relatively large genome, compared to closely related species (Adachi et al., 2021), or is suggestive of some historic evolutionary processes (e.g., ancestral genome duplication events). Additionally, the combination of two individuals for the genome assembly and the inclusion of larvae from multiple geographic locations for the transcriptome may have introduced more heterozygosity into the assembly and protein predictions. The transcriptome was also found to have a much higher BUSCO score than our assembled genome, possibly due to technical limitations (particularly gene predictions) that may inflate proportions of “fragmented” and “missing” BUSCO due to the genome’s sheer size (Simão et al., 2015).
The genome assembly process for K. kelletii produced intriguing results, with the long-read data outperforming the short-read data despite having nearly 15 times less genome coverage (Figure 4). This highlights the remarkable capabilities of long-read data in assembling de novo genomes by effectively resolving repetitive and ambiguous regions (Li et al., 2017; Amarasinghe et al., 2020). However, the hybrid assembly, which combines the advantages of long-read scaffolding and short-read high coverage, resulted in a lower-quality assembly compared to using only the long-read data. This result could be due to the hybrid assembler’s limited capacity to assemble challenging genomes, such as those found in marine invertebrates known for their complex genome structures (Wang et al., 2017; Powell et al., 2018; Lopez et al., 2019). This observation indicates that surveying multiple assemblers and utilizing tools most appropriate for analyzing one’s data could yield a higher-quality outcome even when one assembler is, in general, favored over others.
Studying the genes associated with biological processes, metabolic pathways, and cellular components of individuals at their peak of embryonic development provides valuable insights into the active molecular processes during development. Gene expression analysis revealed highly expressed genes linked to specific GO terms, possibly emphasizing their significance during this vulnerable life history stage (Wilson, 2017; Clare et al., 2022; Figure 6). The analysis of the transcriptome revealed variations in the top 12 occurring GO terms compared to the top 12 expressed GO terms across all samples (Figure 6). The contrasting distribution between the top occurring and expressed GO terms across all samples indicates complex interactions between gene expression patterns and their functional annotations. The observed variation hints at potential attributing factors, such as post-transcriptional regulatory mechanisms and tissue-specific expression associated with embryonic development. This signifies the importance of considering the inherent conditions and dynamic nature of these biological processes when investigating gene expression.
The top 40 expressed GO terms in each category formed complex networks, representing the prevailing GO terms and their similarities during development (Figure 6). Notably, similar findings of GO functional groups (BP, MF, and CC) were reported in another study during invertebrate embryonic development (Jaramillo et al., 2016). This consistency across studies provides further support for the relevance and reliability of these functional groups in understanding the molecular processes occurring during K. kelletii embryonic development. Mapping the gene expression and transcriptome analysis to known pathways revealed the top 20 highly expressed pathways and their gene counts within the K. kelletii transcriptome (Figure 7). Pathways associated with lipid, carbohydrate, glycan, and phospholipid metabolism exhibited high expression levels, which aligns with the abundance of fatty acid and lipid proteins in K. kelletii biology (Garin et al., 1996; Vasquez et al., 2019). Notably, the perivitelline fluid in which the embryos develop in the egg capsules is rich in lipoproteins and polysaccharides, potentially serving as crucial energy sources for development (Garin et al., 1996; Gilbert and O’Connor, 2012). An abundance of proteins related to the cytoskeleton and antioxidant defenses to reactive oxygen species (ROS) damage to lipid membranes were observed in adult K. kelletii at its thermal extremes, suggesting their use of lipids in regulation of their thermal tolerance (Vasquez et al., 2019). Adult K. kelletii were also found to contain HSP chaperones HSP70 and HSP60, confirming their presence within the K. kelletii proteome (Table 4; Vasquez et al., 2019). The abundance of purine and pyrimidine metabolizing genes has similarly been observed in Macrobrachium olfersi (Jaramillo et al., 2016). Additionally, the high expression of genes related to porphyrin-containing compound metabolism (these compounds contribute to shell pigmentation in other mollusks such as Crassostrea gigas) suggests their involvement in the development of K. kelletii shells (Hu et al., 2021; Figure 7).
When comparing the K. kelletii genome annotations and transcriptome HSP gene family counts, we observed a higher number of gene counts for the HSP60/Chaperonin, HSP70, and HSP90 families within the transcriptome, potentially due to alternative splicing that generated multiple viable isoforms. The HSP90 family, in particular, exhibited an expansion of gene counts (isoforms) in the transcriptome (>7x) compared to the genome, suggesting its crucial role during development (Table 4). The transcriptional expansion of this gene family may be of interest due to its involvement in many cellular processes, including cell cycle control, cell survival, hormones, and other signaling pathways (Jackson, 2013). The HSP gene family results of the K. kelletii genome are comparable to those in other molluscan genomes (Park et al., 2020; Nong et al., 2022). Our genome results are also congruent with previous research indicating an expansion of the HSP70 gene family between Gastropod and Bivalve genomes (Zhang et al., 2012; Takeuchi et al., 2016; Guerin et al., 2019; Nong et al., 2022). The expansion of HSP gene families within Bivalve genomes, where most organisms are fully sessile (following dispersal), may provide plasticity against environmental stressors that are unavoidable (Rossi and Snyder, 2001; Zhang et al., 2012; Rana et al., 2018). K. kelletii larvae exhibit notable thermotolerance, as evidenced by their ability to endure high-temperature ranges surpassing environmental extremes (Clare et al., 2022). Moreover, encapsulated veligers demonstrate resilience against abnormal development when subjected to extreme temperatures, outperforming their free-swimming (post-hatching) veliger counterparts (Clare et al., 2022). Similar to the expansion of HSP gene families in Bivalves, the K. kelletii developing embryo (sessile) may exhibit an adaptive trait by expanding the function of the HSP70 family through alternative splicing, as reflected by conflicting gene counts in the transcriptome compared to the genome (Table 4). Additional analysis of the HSP families could be explored. For example, understanding how the expression of these proteins changes during different life history stages and in response to environmental conditions would enhance understanding of their functionality in the face of rapid environmental changes (Botero et al., 2015).
4.1 Limitations and future directions
Although we have resolved this genome with state-of-the-art assembly tools and sequencing platforms, this draft genome contains moderate fragmentation with >46,000 contigs, which challenges efforts to understand the genomic structure of K. kelletii. Hi-C sequencing can provide valuable information about chromosomal interactions, aiding in the scaffolding and assembly of fragmented genomes and improving the overall understanding of genome organization in non-model organisms (Oluwadare et al., 2019; Pérez-Moreno et al., 2023). Thus, integration of Hi-C sequencing with the results of this study could help further elucidate the complex genome structure of K. kelletii. Further cleaning of the genome using Purg_Dups (https://github.com/dfguan/purge_dups) may be necessary to create a standard haploid reference genome but could also remove potentially informative loci for population genetic studies. Although our methods for producing gene model predictions were sound, they are surprisingly large in number. For future direction, we recommend investigating the gene models of closely related species or a more extensive comparison of gene model predicting tools to either confirm our findings or produce more concise gene models. A greater understanding of K. kelletii genome structure will enable ongoing studies on population dynamics to reveal higher-order conclusions on the species’ population and evolutionary dynamics.
Data availability statement
The Kelletia kelletii genome and transcriptome produced by this study have been deposited in Dryad (https://doi.org/10.5061/dryad.w0vt4b8zn). All raw sequence data, including the PacBio sequel 2, Nanopore MinION, and Illumina NovaSeq DNA sequencing, as well as the Illumina NovaSeq RNA sequencing, are deposited in the NCBI Sequence Read Archive (SRA) under PRJNA999368: https://www.ncbi.nlm.nih.gov/sra/PRJNA999368 and PRJNA1000198: https://www.ncbi.nlm.nih.gov/sra/PRJNA1000198. All codes and parameters used for the bioinformatic analyses carried out (as listed in the Materials and Methods section) are available at https://github.com/bndaniel/Kellets-whelk-genome-assembly.
Ethics statement
The animal study was approved by CDFW Scientific Collection Permit 8018. The study was conducted in accordance with the local legislation and institutional requirements.
Author contributions
BD: Conceptualization, Data curation, Formal Analysis, Investigation, Methodology, Project administration, Validation, Visualization, Writing – original draft. CA: Data curation, Formal Analysis, Investigation, Methodology, Software, Validation, Visualization, Writing – review and editing. NZ: Data curation, Formal Analysis, Investigation, Methodology, Software, Validation, Visualization, Writing – review and editing. AL: Data curation, Formal Analysis, Investigation, Methodology, Validation, Writing – review and editing. CL: Writing – review and editing. MC: Funding acquisition, Project administration, Resources, Supervision, Writing – review and editing. RT: Funding acquisition, Resources, Supervision, Writing – review and editing. CW: Conceptualization, Funding acquisition, Investigation, Project administration, Resources, Supervision, Writing – review and editing. PA: Data curation, Formal Analysis, Methodology, Resources, Software, Supervision, Validation, Writing – review and editing. JD: Data curation, Formal Analysis, Methodology, Resources, Software, Supervision, Validation, Writing – review and editing.
Funding
The author(s) declare financial support was received for the research, authorship, and/or publication of this article. This material is based upon work supported by the National Science Foundation under grant number OCE-1924537.
Acknowledgments
The bioinformatic analysis was carried out through a server at California Polytechnic State University operated by the Bioinformatics Research Group (BIRG). The PacBio Sequel II and Illumina NovaSeq Genome sequencing was carried out by the Genomics and Cell Characterization Core Facility (GC3F) at the University of Oregon, with special thanks to Maggie Weitzman and Jeff Bishop. The RNA sequencing was carried out by Novogene at the University of California, Davis. The Purdue Rosen Center for Advanced Computing helped with the annotation of the transcriptome, with special thanks to Yucheng Zhang. Photos used in Figure 1 were graciously gifted by Drs. Crow White and Jann Vendetti.
Conflict of interest
The authors declare that the research was conducted in the absence of any commercial or financial relationships that could be construed as a potential conflict of interest.
Publisher’s note
All claims expressed in this article are solely those of the authors and do not necessarily represent those of their affiliated organizations, or those of the publisher, the editors and the reviewers. Any product that may be evaluated in this article, or claim that may be made by its manufacturer, is not guaranteed or endorsed by the publisher.
Supplementary material
The Supplementary Material for this article can be found online at: https://www.frontiersin.org/articles/10.3389/fmars.2023.1278131/full#supplementary-material
Supplementary Figure 1 | Length distribution of unigenes on clustered transcriptome assembly.
Supplementary Table 1 | RNA-seq data alignment report.
Supplementary Table 2 | DNA-seq read type coverage across genome.
Supplementary Table 3 | RNA-seq sample metadata.
Supplementary Table 4 | Transcriptome unigene blast, GO, pathway, development, etc.
Supplementary Table 5 | Comparison of transcriptome assemblies rnaSPAdes and Trinity.
Supplementary Table 6 | HSP gene family identification for the transcriptome and genome.
Supplementary information SI 1 | DNA extraction, cleanup, and library prep files.
Supplementary information SI 2 | All scripts and commands Github: https://github.com/bndaniel/Kellets-whelk-genome-assembly.
References
Adachi K., Yoshizumi A., Kuramochi T., Kado R., Okumura S.-I. (2021). Novel insights into the evolution of genome size and at content in mollusks. Mar. Biol. 168, 1–17. doi: 10.1007/s00227-021-03826-x
Adema C. M. (2021). Sticky problems: extraction of nucleic acids from molluscs. Philos. Trans. R. Soc. B 376, 20200162. doi: 10.1098/rstb.2020.0162
Altschul S. F., Gish W., Miller W., Myers E. W., Lipman D. J. (1990). Basic local alignment search tool. J. Mol. Biol. 215, 403–410. doi: 10.1016/S0022-2836(05)80360-2
Amarasinghe S. L., Su S., Dong X., Zappia L., Ritchie M. E., Gouil Q. (2020). Opportunities and challenges in long-read sequencing data analysis. Genome Biol. 21, 1–16. doi: 10.1186/s13059-020-1935-5
Apweiler R., Bairoch A., Wu C. H., Barker W. C., Boeckmann B., Ferro S., et al. (2004). Uniprot: the universal protein knowledgebase. Nucleic Acids Res. 32, D115–D119. doi: 10.1093/nar/gkh131
Aseltine-Neilson D., Brady B., Connell M., Kalvass P., Laughlin L., Leos B., et al. (2006). Review of some california fisheries for 2005: Coastal pelagic finfish, market squid, dungeness crab, sea urchin, abalone, kellet’s whelk, groundfish, highly migratory species, ocean salmon, nearshore live-fish, pacific herring, and white seabass. California Cooperative Oceanic Fisheries Investigations Rep. 47, 9–29.
Astashyn A., Tvedte E. S., Sweeney D., Sapojnikov V., Bouk N., Joukov V., et al. (2023). Rapid and sensitive detection of genome contamination at scale with fcs-gx. bioRxiv, 2023–2006. doi: 10.1101/2023.06.02.543519
Barghi N., Tobler R., Nolte V., Jakšić A. M., Mallard F., Otte K. A., et al. (2019). Genetic redundancy fuels polygenic adaptation in drosophila. PLoS Biol. 17, e3000128. doi: 10.1371/journal.pbio.3000128
Barshis D. J., Ladner J. T., Oliver T. A., Seneca F. O., Traylor-Knowles N., Palumbi S. R. (2013). Genomic basis for coral resilience to climate change. Proc. Natl. Acad. Sci. 110, 1387–1392. doi: 10.1073/pnas.1210224110
Benson D. A., Karsch-Mizrachi I., Lipman D. J., Ostell J., Wheeler D. L. (2006). Genbank. Nucleic Acids Res. 34, D16–D20. doi: 10.1093/nar/gkj157
Bolger A. M., Lohse M., Usadel B. (2014). Trimmomatic: a flexible trimmer for illumina sequence data. Bioinformatics 30, 2114–2120. doi: 10.1093/bioinformatics/btu170
Botero C. A., Weissing F. J., Wright J., Rubenstein D. R. (2015). Evolutionary tipping points in the capacity to adapt to environmental change. Proc. Natl. Acad. Sci. 112, 184–189. doi: 10.1073/pnas.1408589111
Boutet E., Lieberherr D., Tognolli M., Schneider M., Bansal P., Bridge A. J., et al. (2016). Uniprotkb/swiss-prot, the manually annotated section of the uniprot knowledgebase: how to use the entry view. Plant bioinformatics: Methods Protoc., 23–54. doi: 10.1007/978-1-4939-3167-5_2
Bray N. L., Pimentel H., Melsted P., Pachter L. (2016). Near-optimal probabilistic rna-seq quantification. Nat. Biotechnol. 34, 525–527. doi: 10.1038/nbt.3519
Bushmanova E., Antipov D., Lapidus A., Prjibelski A. D. (2019). rnaspades: a de novo transcriptome assembler and its application to rna-seq data. GigaScience 8, giz100. doi: 10.1093/gigascience/giz100
Byrne M., Foo S. A., Ross P. M., Putnam H. M. (2020). Limitations of cross-and multigenerational plasticity for marine invertebrates faced with global climate change. Global Change Biol. 26, 80–102. doi: 10.1111/gcb.14882
Camon E., Magrane M., Barrell D., Lee V., Dimmer E., Maslen J., et al. (2004). The gene ontology annotation (goa) database: sharing knowledge in uniprot with gene ontology. Nucleic Acids Res. 32, D262–D266. doi: 10.1093/nar/gkh021
Chen I.-C., Hill J. K., Ohlemüller R., Roy D. B., Thomas C. D. (2011). Rapid range shifts of species associated with high levels of climate warming. Science 333, 1024–1026. doi: 10.1126/science.1206432
Clare X. S., Kui L., Hofmann G. E. (2022). Larval thermal tolerance of kellet’s whelk (kelletia kelletii) as a window into the resilience of a wild shellfishery to marine heatwaves. J. Shellfish Res. 41, 283–290. doi: 10.2983/035.041.0214
da Fonseca R. R., Albrechtsen A., Themudo G. E., Ramos-Madrigal J., Sibbesen J. A., Maretty L., et al. (2016). Next-generation biology: sequencing and data analysis approaches for non-model organisms. Mar. Genomics 30, 3–13. doi: 10.1016/j.margen.2016.04.012
Danecek P., Bonfield J. K., Liddle J., Marshall J., Ohan V., Pollard M. O., et al. (2021). Twelve years of samtools and bcftools. Gigascience 10, giab008. doi: 10.1093/gigascience/giab008
Daniels B. N., Nurge J., Sleeper O., Lee A., López C., Christie M., et al. (2023). Genomic DNA extraction optimization and validation for genome sequencing using the marine gastropod kellet’s whelk. PeerJ 11, e16510. doi: 10.7717/peerj.16510
Dida F., Yi G. (2021). Empirical evaluation of methods for de novo genome assembly. PeerJ Comput. Sci. 7, e636. doi: 10.7717/peerj-cs.636
Emms D. M., Kelly S. (2017). Stride: species tree root inference from gene duplication events. Mol. Biol. Evol. 34, 3267–3278. doi: 10.1093/molbev/msx259
Emms D., Kelly S. (2018). Stag: species tree inference from all genes. BioRxiv, 267914. doi: 10.1101/267914
Emms D. M., Kelly S. (2019). Orthofinder: phylogenetic orthology inference for comparative genomics. Genome Biol. 20, 1–14. doi: 10.1186/s13059-019-1832-y
Fields P., Graham J., Rosenblatt R., Somero G. (1993). Effects of expected global climate change on marine faunas. Trends Ecol. Evol. 8, 361–367. doi: 10.1016/0169-5347(93)90220-J
Fu L., Niu B., Zhu Z., Wu S., Li W. (2012). Cd-hit: accelerated for clustering the next-generation sequencing data. Bioinformatics 28, 3150–3152. doi: 10.1093/bioinformatics/bts565
Garin C. F., Heras H., Pollero R. J. (1996). Lipoproteins of the egg perivitelline fluid of pomacea canaliculata snails (mollusca: Gastropoda). J. Exp. Zoology 276, 307–314. doi: 10.1002/(SICI)1097-010X(19961201)276:5<307::AID-JEZ1>3.0.CO;2-S
Gilbert L. I., O’Connor J. D. (2012). Lipid metabolism and transport in arthropods. Chem. zoology 5, 229–253. doi: 10.1007/128_2012_356
Grabherr M. G., Haas B. J., Yassour M., Levin J. Z., Thompson D. A., Amit I., et al. (2011). Fulllength transcriptome assembly from rna-seq data without a reference genome. Nat. Biotechnol. 29, 644–652. doi: 10.1038/nbt.1883
Guerin M. N., Weinstein D. J., Bracht J. R. (2019). Stress adapted mollusca and nematoda exhibit convergently expanded hsp70 and aig1 gene families. J. Mol. Evol. 87, 289–297. doi: 10.1007/s00239-019-09900-9
Gurevich A., Saveliev V., Vyahhi N., Tesler G. (2013). Quast: quality assessment tool for genome assemblies. Bioinformatics 29, 1072–1075. doi: 10.1093/bioinformatics/btt086
Halpern B. S., Cottenie K., Broitman B. R. (2006). Strong top-down control in southern california kelp forest ecosystems. Science 312, 1230–1232. doi: 10.1126/science.1128613
Harley C. D., Randall Hughes A., Hultgren K. M., Miner B. G., Sorte C. J., Thornber C. S., et al. (2006). The impacts of climate change in coastal marine systems. Ecol. Lett. 9, 228–241. doi: 10.1111/j.1461-0248.2005.00871.x
Hazen E. L., Jorgensen S., Rykaczewski R. R., Bograd S. J., Foley D. G., Jonsen I. D., et al. (2013). Predicted habitat shifts of pacific top predators in a changing climate. Nat. Climate Change 3, 234–238. doi: 10.1038/nclimate1686
Hu B., Li Q., Yu H. (2021). Rna interference by ingested dsrna-expressing bacteria to study porphyrin pigmentation in crassostrea gigas. Int. J. Mol. Sci. 22, 6120. doi: 10.3390/ijms22116120
Huson D. H., Scornavacca C. (2012). Dendroscope 3: an interactive tool for rooted phylogenetic trees and networks. Systematic Biol. 61, 1061–1067. doi: 10.1093/sysbio/sys062
Jackman S. D., Vandervalk B. P., Mohamadi H., Chu J., Yeo S., Hammond S. A., et al. (2017). Abyss 2.0: resource-efficient assembly of large genomes using a bloom filter. Genome Res. 27, 768–777. doi: 10.1101/gr.214346.116
Jaramillo M. L., Guzman F., Paese C. L., Margis R., Nazari E. M., Ammar D., et al. (2016). Exploring developmental gene toolkit and associated pathways in a potential new model crustacean using transcriptomic analysis. Dev. Genes Evol. 226, 325–337. doi: 10.1007/s00427-016-0551-6
Kapheim K. M., Pan H., Li C., Blatti C. III, Harpur B. A., Ioannidis P., et al. (2019). Draft genome assembly and population genetics of an agricultural pollinator, the solitary alkali bee (halictidae: Nomia melanderi). G3: Genes Genomes Genet. 9, 625–634. doi: 10.1534/g3.118.200865
Kim D., Paggi J. M., Park C., Bennett C., Salzberg S. L. (2019). Graph-based genome alignment and genotyping with hisat2 and hisat-genotype. Nat. Biotechnol. 37, 907–915. doi: 10.1038/s41587-019-0201-4
Kokot M., Długosz M., Deorowicz S. (2017). Kmc 3: counting and manipulating k-mer statistics. Bioinformatics 33, 2759–2761. doi: 10.1093/bioinformatics/btx304
Kolmogorov M., Yuan J., Lin Y., Pevzner P. A. (2019). Assembly of long, error-prone reads using repeat graphs. Nat. Biotechnol. 37, 540–546. doi: 10.1038/s41587-019-0072-8
Kovaka S., Zimin A. V., Pertea G. M., Razaghi R., Salzberg S. L., Pertea M. (2019). Transcriptome assembly from long-read rna-seq alignments with stringtie2. Genome Biol. 20, 1–13. doi: 10.1186/s13059-019-1910-1
Lemay M. A., Henry P., Lamb C. T., Robson K. M., Russello M. A. (2013). Novel genomic resources for a climate change sensitive mammal: characterization of the american pika transcriptome. BMC Genomics 14, 1–12. doi: 10.1186/1471-2164-14-311
Li C., Lin F., An D., Wang W., Huang R. (2017). Genome sequencing and assembly by long reads in plants. Genes 9, 6. doi: 10.3390/genes9010006
Lopez J. V., Kamel B., Medina M., Collins T., Baums I. B. (2019). Multiple facets of marine invertebrate conservation genomics. Annu. Rev. Anim. Biosci. 7, 473–497. doi: 10.1146/annurev-animal-020518-115034
Ma H., Liu Y., Liu D., Sun W., Liu X., Wan Y., et al. (2021). Chromosome-level genome assembly and population genetic analysis of a critically endangered rhododendron provide insights into its conservation. Plant J. 107, 1533–1545. doi: 10.1111/tpj.15399
Maeda T., Takahashi S., Yoshida T., Shimamura S., Takaki Y., Nagai Y., et al. (2021). Chloroplast acquisition without the gene transfer in kleptoplastic sea slugs, plakobranchus ocellatus. Elife 10, e60176. doi: 10.7554/eLife.60176
Matthew R., Hsiao E., Le Billon P., Saintz G. (2022). Species on the move: environmental change, displacement and conservation. Ann. Am. Assoc. Geographers 112, 654–663. doi: 10.1080/24694452.2021.1999200
Nong W., Yu Y., Aase-Remedios M. E., Xie Y., So W. L., Li Y., et al. (2022). Genome of the ramshorn snail biomphalaria straminea—an obligate intermediate host of schistosomiasis. GigaScience 11, giac012. doi: 10.1093/gigascience/giac012
Okonechnikov K., Conesa A., García-Alcalde F. (2016). Qualimap 2: advanced multi-sample quality control for high-throughput sequencing data. Bioinformatics 32, 292–294. doi: 10.1093/bioinformatics/btv566
Oluwadare O., Highsmith M., Cheng J. (2019). An overview of methods for reconstructing 3-d chromosome and genome structures from hi-c data. Biol. procedures Online 21, 1–20. doi: 10.1186/s12575-019-0094-0
Park J. C., Kim D.-H., Lee Y., Lee M.-C., Kim T. K., Yim J. H., et al. (2020). Genome-wide identification and structural analysis of heat shock protein gene families in the marine rotifer brachionus spp.: Potential application in molecular ecotoxicology. Comp. Biochem. Physiol. Part D: Genomics Proteomics 36, 100749. doi: 10.1016/j.cbd.2020.100749
Parmesan C. (2006). Ecological and evolutionary responses to recent climate change. Annu. Rev. Ecol. Evol. Syst. 37, 637–669. doi: 10.1146/annurev.ecolsys.37.091305.110100
Pérez-Moreno J. L., Kozma M. T., DeLeo D. M., Bracken-Grissom H. D., Durica D. S., Mykles D. L. (2023). Crustome: a transcriptome database resource for large-scale analyses across crustacea. G3 Genes Genomes Genet. 13 (7), jkad098. doi: 10.1093/g3journal/jkad098
Pinsky M. L., Worm B., Fogarty M. J., Sarmiento J. L., Levin S. A. (2013). Marine taxa track local climate velocities. Science 341, 1239–1242. doi: 10.1126/science.1239352
Powell D., Subramanian S., Suwansa-Ard S., Zhao M., O’Connor W., Raftos D., et al. (2018). The genome of the oyster saccostrea offers insight into the environmental resilience of bivalves. DNA Res. 25, 655–665. doi: 10.1093/dnares/dsy032
Rana R. M., Iqbal A., Wattoo F. M., Khan M. A., Zhang H. (2018). Hsp70 mediated stress modulation in plants. heat shock Proteins Stress, 281–290. doi: 10.1007/978-3-319-90725-3_13
Ranallo-Benavidez T. R., Jaron K. S., Schatz M. C. (2020). Genomescope 2.0 and smudgeplot for reference-free profiling of polyploid genomes. Nat. Commun. 11, 1432. doi: 10.1038/s41467-020-14998-3
Rieber N., Zapatka M., Lasitschka B., Jones D., Northcott P., Hutter B., et al. (2013). Coverage bias and sensitivity of variant calling for four whole-genome sequencing technologies. PloS One 8, e66621. doi: 10.1371/journal.pone.0066621
Rossi S., Snyder M. J. (2001). Competition for space among sessile marine invertebrates: changes in hsp70 expression in two pacific cnidarians. Biol. Bull. 201, 385–393. doi: 10.2307/1543616
Selkoe K. A., Watson J. R., White C., Horin T. B., Iacchei M., Mitarai S., et al. (2010). Taking the chaos out of genetic patchiness: seascape genetics reveals ecological and oceanographic drivers of genetic patterns in three temperate reef species. Mol. Ecol. 19, 3708–3726. doi: 10.1111/j.1365-294X.2010.04658.x
Senol Cali D., Kim J. S., Ghose S., Alkan C., Mutlu O. (2019). Nanopore sequencing technology and tools for genome assembly: computational analysis of the current state, bottlenecks and future directions. Briefings Bioinf. 20, 1542–1559. doi: 10.1093/bib/bby017
Simão F. A., Waterhouse R. M., Ioannidis P., Kriventseva E. V., Zdobnov E. M. (2015). Busco: assessing genome assembly and annotation completeness with single-copy orthologs. Bioinformatics 31, 3210–3212. doi: 10.1093/bioinformatics/btv351
Stillman J. H., Armstrong E. (2015). Genomics are transforming our understanding of responses to climate change. BioScience 65, 237–246. doi: 10.1093/biosci/biu219
Supek F., Bošnjak M., Škunca N., Šmuc T. (2011). Revigo summarizes and visualizes long lists of gene ontology terms. PloS One 6, e21800. doi: 10.1371/journal.pone.0021800
Takeuchi T., Koyanagi R., Gyoja F., Kanda M., Hisata K., Fujie M., et al. (2016). Bivalve-specific gene expansion in the pearl oyster genome: implications of adaptation to a sessile lifestyle. Zoological Lett. 2, 1–13. doi: 10.1186/s40851-016-0039-2
Vasquez M. C., Lippert M. R., White C., Walter R. K., Tomanek L. (2019). Proteomic changes across a natural temperature gradient in a marine gastropod. Mar. Environ. Res. 149, 137–147. doi: 10.1016/j.marenvres.2019.06.002
Vaux F., Hills S. F., Marshall B. A., Trewick S. A., Morgan-Richards M. (2017). A phylogeny of southern hemisphere whelks (gastropoda: Buccinulidae) and concordance with the fossil record. Mol. Phylogenet. Evol. 114, 367–381. doi: 10.1016/j.ympev.2017.06.018
Vaux F., Hills S. F., Marshall B. A., Trewick S. A., Morgan-Richards M. (2018). Genome statistics and phylogenetic reconstructions for southern hemisphere whelks (gastropoda: Buccinulidae). Data Brief 16, 172–181. doi: 10.1016/j.dib.2017.11.021
Vendetti J. E. (2020). Early development in kelletia kelletii (forbes 1850)(gastropoda: Buccinidae), an eastern pacific gastropod with planktonic larvae. Cienc. marinas 46, 269–282. doi: 10.7773/cm.v46i4.3109
Wang J., Chen K., Ren Q., Zhang Y., Liu J., Wang G., et al. (2021). Systematic comparison of the performances of de novo genome assemblers for oxford nanopore technology reads from piroplasm. Front. Cell. Infection Microbiol. 11, 696669. doi: 10.3389/fcimb.2021.696669
Wang S., Zhang J., Jiao W., Li J., Xun X., Sun Y., et al. (2017). Scallop genome provides insights into evolution of bilaterian karyotype and development. Nat. Ecol. Evol. 1, 0120. doi: 10.1038/s41559-017-0120
White C., Toonen R. J. (2008). Isolation and characterization of polymorphic microsatellite and coi loci from the whelk kelletia kelletii. Mol. Ecol. Resour. 8, 881–883. doi: 10.1111/j.1755-0998.2008.02097.x
Wilson M. N. (2017). Understanding the transition from benthic egg to dispersive larvae: observations on the intra-capsular growth and development of Kelletia kelletii. California Polytechnic State University. B.S. Thesis. 16pp.
Yuan J., Gao Y., Zhang X., Wei J., Liu C., Li F., et al. (2017). Genome sequences of marine shrimp exopalaemon carinicauda holthuis provide insights into genome size evolution of caridea. Mar. Drugs 15, 213. doi: 10.3390/md15070213
Zacherl D., Gaines S. D., Lonhart S. I. (2003). The limits to biogeographical distributions: insights from the northward range extension of the marine snail, kelletia kelletii (forbes 1852). J. Biogeography 30, 913–924. doi: 10.1046/j.1365-2699.2003.00899.x
Zhang W., Chen J., Yang Y., Tang Y., Shang J., Shen B. (2011). A practical comparison of de novo genome assembly software tools for next-generation sequencing technologies. PLoS One 6, e17915. doi: 10.1371/journal.pone.0017915
Zhang G., Fang X., Guo X., Li L., Luo R., Xu F., et al. (2012). The oyster genome reveals stress adaptation and complexity of shell formation. Nature 490, 49–54. doi: 10.1038/nature11413
Zhang Y., Wang J., Lv M., Gao H., Meng L., Yunga A., et al. (2021). Diversity, function and evolution of marine invertebrate genomes. bioRxiv, 2021–2010. doi: 10.1101/2021.10.31.465852
Keywords: genomics, WGS sequencing, genome assembly, transcriptomics, RNA-Seq, heat shock protein
Citation: Daniels BN, Andrasz CL, Zarate N, Lee A, López C, Anderson P, Toonen RJ, Christie MR, White C and Davidson JM (2023) De novo genome and transcriptome assembly of Kelletia kelletii, a coastal gastropod and fisheries species exhibiting a northern range expansion. Front. Mar. Sci. 10:1278131. doi: 10.3389/fmars.2023.1278131
Received: 15 August 2023; Accepted: 13 November 2023;
Published: 05 December 2023.
Edited by:
Nathan Kenny, University of Otago, New ZealandReviewed by:
Jin Sun, Ocean University of China, ChinaLusheng Xin, Chinese Academy of Fishery Sciences (CAFS), China
Copyright © 2023 Daniels, Andrasz, Zarate, Lee, López, Anderson, Toonen, Christie, White and Davidson. This is an open-access article distributed under the terms of the Creative Commons Attribution License (CC BY). The use, distribution or reproduction in other forums is permitted, provided the original author(s) and the copyright owner(s) are credited and that the original publication in this journal is cited, in accordance with accepted academic practice. No use, distribution or reproduction is permitted which does not comply with these terms.
*Correspondence: Benjamin N. Daniels, ben.daniels255@gmail.com