Eukaryotic diversity patterns in the Red Sea: from the surface to the deep
 John K. Pearman
 Burton Jones
 Maryam Qashqari4
  Susana Carvalho
- 1Marine and Algal Ecology, Cawthron Institute, Nelson, New Zealand
- 2Biological and Environmental Sciences and Engineering (BESE), King Abdullah University of Science and Technology (KAUST), Thuwal, Saudi Arabia
- 3Marine Science Program, Red Sea Research Center (RSRC), King Abdullah University of Science and Technology (KAUST), Thuwal, Saudi Arabia
- 4Environmental Protection Department, Saudi Aramco, Dhahran, Saudi Arabia
Understanding how biological communities are assembled is central to many ecological studies. The semi-confined nature of the Red Sea, with limited exchange of waters with other seas and strong environmental gradients, is an ideal ecosystem to investigate assembly processes of biological communities. Sampling through the water column (surface, deep chlorophyll maximum (DCM), oxygen minimum zone (OMZ), and bottom) along the latitudinal axis of the Red Sea was undertaken during cruises in 2015/2016. The composition and assembly of eukaryotic communities were assessed using high-throughput sequencing of the 18S rRNA gene. Distinct differences were noted in the composition of the eukaryotic community across the different depth layers. Dinophyceae were more prevalent in the euphotic zone (surface = 35.3%; DCM = 18.1%), while Syndiniales had the highest relative abundances in the OMZ (45.9%) and the bottom waters (52.6%). We showed that the assembly of eukaryotic communities through the water column was primarily determined by deterministic processes, especially variable selection due to different environmental conditions. The exception was between the OMZ and the bottom, where deterministic and stochastic processes were balanced with homogeneous selection and homogenizing dispersal dominating, indicating similar environmental conditions and high levels of dispersal between the layers. Across the latitudinal gradient, environmental variable selection was predominant in the euphotic zone, most likely driven by the strong environmental gradients present in the Red Sea. In the aphotic zones, homogenizing dispersal was more prevalent, especially in the OMZ. Our study highlights the contrasting assembly mechanisms governing the distribution of eukaryotic planktonic communities through the water column.
Introduction
Understanding how biological communities are assembled is central to many ecological studies. It is generally recognized that a combination of deterministic and stochastic processes drives the structure of biological communities, but the relative importance varies across spatial and temporal scales (Chase, 2010; Chase and Myers, 2011; Zhou and Ning, 2017). Deterministic processes are based on the principle of selection imposed on a taxon by antagonistic and synergistic species interactions and the abiotic environment (Vellend, 2010; Stegen et al., 2012). Deterministic processes can be split into two classes. When environmental conditions are spatially and/or temporally variable, this can drive high variation in community structures and is referred to as variable selection (Zhou and Ning, 2017). In contrast, when environmental conditions do not vary, little variation in community structures are expected, and this is known as homogenous selection (Zhou and Ning, 2017). In contrast, stochastic processes are driven by chance effects such as dispersal and ecological drift, the random fluctuation of communities (Sloan et al., 2006). Stochastic processes can be divided into two groups namely homogenizing dispersal and dispersal limitation. The combination of ecological drift and limited dispersal can lead to increases in community variation (Stegen et al., 2015). In contrast, homogenizing dispersal results in a more homogeneous community because of high levels of dispersal (Zhou and Ning, 2017). These ecological theories were originally developed for terrestrial ecosystems but have been utilized in the marine environment (Wu et al., 2017; Wu et al., 2018; Pearman et al., 2019; Liu et al., 2020; Hardoim et al., 2021; Li et al., 2021; Skouroliakou et al., 2022). The community assembly of planktonic eukaryotic organisms in the marine environment has received relatively little attention. However, in a comparison of the distribution of bacteria and protists through the water column, it was found that protists were governed by deterministic factors to a greater extent than bacteria, while the latter presented a wider niche breadth than protists (Wu et al., 2018). In the East and South China Sea Wu et al. (Wu et al., 2017) also showed that abundant taxa at the surface were driven by dispersal limitation, while the rare taxa were influenced by deterministic processes. In sub-surface layers, dispersal limitation was the dominant driver for both sub-communities.
The semi-confined nature of the Red Sea, with limited exchange of waters with other seas and strong latitudinal environmental gradients (e.g. salinity, nutrients and temperature), is an ideal ecosystem to investigate assembly processes. Over the approximately 2000km extent of the Red Sea, the surface water salinity rises from 36 in the south to nearly 41 in the north due to evaporative losses of approximately 2m/year and little to no freshwater input from either precipitation or terrestrial runoff (Patzert, 1974; Tragou et al., 1999; Yao et al., 2014). Temperature follows the opposite pattern where the 35-year temperature average in the north-western Red Sea is about 24°C and is 29.5-30°C in the southern Red Sea (Karnauskas and Jones, 2018). During winter, SE winds prevail over the Red Sea, driving surface water into the Red Sea through the Gulf of Aden and increasing mixing in the northern Red Sea allowing Red Sea Outflow Water and Red Sea Deep Water to form in the northern reaches of the Red Sea, sinking to intermediate depths or to the near-bottom, where they flow southward and exiting through the Gulf of Aden (Yao et al., 2014; Papadopoulos et al., 2015; Asfahani et al., 2020). In summer, the prevailing winds are from the NW resulting in surface water flowing out into the Gulf of Aden alongside the Red Sea Deep Water (Murray and Johns, 1997).
The eukaryotic planktonic diversity of the Red Sea has been investigated using fingerprinting techniques (Kürten et al., 2014), microscopy, and HPLC (Al-Najjar and El-Sherbiny, 2008; Touliabah et al., 2010; Kheireddine et al., 2017), as well as molecular techniques (de Vargas et al., 2015; Pearman and Irigoien, 2015; Pearman et al., 2016; Pearman et al., 2017; Cordier et al., 2022). However, these investigations have drawbacks, with the studies limited either spatially or temporally. For example, some studies have a wide spatial coverage but are limited to a single temporal period (Kürten et al., 2014; de Vargas et al., 2015; Pearman et al., 2016; Kheireddine et al., 2017), while others investigate seasonal effects but in a restricted geographic range (Al-Najjar and El-Sherbiny, 2008; Touliabah et al., 2010). Further, the majority of the studies focus more on coastal areas with limited investigations of offshore dynamics (but see Kheireddine et al., 2017).
To improve the spatial and temporal understanding of the eukaryotic planktonic community in the offshore waters of the Red Sea we undertook sampling in four distinct depth layers along the central latitudinal axis of the Red Sea across five cruises in the summer and winter of 2015 and 2016. We used 18S rRNA gene metabarcoding to understand the structure and composition of the eukaryotic planktonic community through the water column and along the latitudinal axis of the Red Sea. Using ecological modelling frameworks, we aim to investigate the roles of deterministic and stochastic processes on driving the assembly of eukaryotic plankton communities. Due to the strong environmental gradients through the water column and along the latitudinal axis of the Red Sea, we hypothesized: 1) That deterministic processes and especially variable selection would dominate the assembly processes through the water column; and 2) that the strong gradients along the latitudinal axis of the Red Sea would result in variable selection being the predominant process in assembling the eukaryotic plankton community in the upper layers of the water column but the contribution of variable selection would be lower in the deeper layers as environmental conditions are more homogenous (e.g. Sofianos and Johns, 2007).
Methods
Sample collection
Samples were collected from ten stations during five cruises in 2015 and 2016 (Supplementary Table 1 for details). Samples were collected from four distinct layers (surface, deep chlorophyll maximum (DCM), oxygen minimum zone (OMZ), and the bottom) through the water column. Surface samples were collected at a depth of 5 m. The (DCM) and the oxygen minimum zones were determined during the downcast of the CTD/rosette profiler. The DCM ranged from 50 to 95m while the OMZ ranged from 325 to 570m. Bottom samples were sampled just above the sediment (~ 5m) with depths ranging between 850m and 2700m, depending on the station. Water was collected in 10 L Niskin bottles at the desired depths during the upcast.
For DNA, filtration of 5 L of water (with no prefiltration) was undertaken through 0.22 µm membrane filters (Millipore) in triplicate for each depth at each sampling station. The individual filters were stored in ~ 5 mL of ATL lysis buffer within 15mL tubes and stored at -20°C until analysis.
For the assessment of nutrient concentrations, 50 mL of water was filtered through 0.22 µm membrane filters (Millipore) and frozen until analysis at -20°C. Samples were analyzed for phosphate, nitrite, nitrate and silicate using a Continuous Flow Analyzer from (SEAL AutoAnalyser 3 with XY2/3 Sampler).
DNA extraction and sequencing
DNA was extracted from the filters using a bead beating and phenol:chloroform methodology. Briefly, 540 μL ATL buffer (Qiagen) and 60 μL proteinase K (20 mg mL-1) was added to a 2 mL Eppendorf containing the filter. These tubes were incubated at 55°C for 30 min after which 15 mg of 0.1 mm zirconia/silica beads were added. An equal volume (600 μL) of phenol:chloroform:iso amyl alcohol (IAA; ratio 25:24:1) was added to the samples, and cells were lysed using Qiagen’s Tissue Lyser II machine for 3 min at 30 shakes per second. A single round of chloroform:IAA (ratio of 24:1) was undertaken after the aqueous layer was removed and DNA was precipitated using 0.6 vol. isopropanol. Precipitated DNA was resuspended in DNase-free water after being washed using 70% ethanol.
Polymerase chain reactions (PCRs) were undertaken using 5 ng of DNA and targeted the 18S rRNA gene (v4 region) using the primers (TAReuk454Fwd1: CCAGCASCYGCGGTAATTCC; TAReukRev3: ACTTTCGTTCTTGATYRA) designed by Stoeck et al. (2010). PCR conditions were as described in the Stoeck protocol, except that the second round of amplification did not use varying temperatures but a steady 49˚C. PCR reactions for each sample were undertaken in duplicate and pooled together. A no-addition negative was included during each PCR run and an agarose gel was used to check that amplification had not occurred in the negative. No sequencing of the negatives was undertaken.
Samples were cleaned and normalized with a SequalPrep Normalization Kit (Thermo Fisher) and MiSeq library preparation was undertaken following the Illumina 16S metagenomic sequencing library preparation protocol (https://support.illumina.com/documents/documentation/chemistry_documentation/16s/16s-metagenomic-library-prep-guide-15044223-b.pdf) except for the second round clean-up, which was again performed using the SequalPrep Normalization Kit. Sequencing was performed on a MiSeq sequencing platform (2 x 300 bp paired end sequencing) at the King Abdullah University of Science and Technology (KAUST) Core Laboratory. Raw reads were submitted to the NCBI Single Read Archive (SRA) under the accession: PRJNA955000.
Bioinformatics
To remove the primer sequences, raw reads were processed with cutadapt (Martin, 2011) with a maximum mismatch of one allowed. Subsequent to the removal of the primers, processing was undertaken with DADA2 (Callahan et al., 2016) within R (version 4.2.2; R Core Team, 2022). Reads were trimmed to 230 and 228 bp (maximum number of expected errors (maxEE): forward = 4, reverse = 6). Reads that failed to reach the set thresholds were removed from the analysis. The first 108 bp of the remaining reads were used to construct a parametric error matrix which was subsequently used for the inference of Amplicon Sequence Variants (ASVs). Subsequently paired-end reads were merged (maximum mismatch of 1 bp; minimum overlap of 10 bp) and the resulting ASVs were then checked for chimeras using the removeBimeraDenovo script within the dada2 v 1.26 package. The quality checked ASVs were assigned a taxonomy against the PR2 database (v4.14; Guillou et al., 2013) using the rdp classifier (Wang et al., 2007) with a bootstrap threshold of 70 to enable classifications at higher taxonomic levels.
Statistical analysis
Principal Component Analysis (PCA) was undertaken using base R on the environmental data to give an indication of the environmental gradients sampled. Numeric data (nutrients and depth) was scaled and centered in vegan and season was a factor (2015 winter, 2016 summer and 2016 winter). The PCA was visualized with ggfortify v0.4.14 (Horikoshi et al., 2022) and ggplot2 v3.3.6 (Wickham, 2016).
Further processing of the ASV data was undertaken using the R package phyloseq (version 1.44; McMurdie and Holmes, 2013). To minimize the possibility of spurious ASVs in the data set, for an ASV to be present in a sample, it had to occur in at least two of the three biological replicates of that sample. If the ASV only had reads in a single replicate, then the abundance of that ASV in that sample was converted to zero. For the comparison of samples, replicates were merged (summed), and samples were subsampled to an even depth of 27900 reads. This resulted in a total of 7274 ASVs across the rarefied dataset. A microbial subset was constructed which had a total of 6592 ASVs at an even depth of 23911 reads while a non-microbial metazoan dataset had 361 ASVs at a depth of 2030 reads, removing 18 samples (see Supplementary Table 1 for details of those samples missing) due to low read abundance of this group.
Analysis was undertaken down the water column (vertical) in winter 2015 (DS17, DS1, NR3, NR2, NR1, SR3, SR4, SR5; Figure 1) and 2016 (DS17 summer, DS1 summer, NR3 summer, NR2 summer, NR1 summer, SR1 winter, SR2 winter and summer, SR3 winter and summer, SR4 winter, SR5 summer; Figure 1) and latitudinally for the winter 2015 (DS1, DS1, NR3, NR2, NR1, SR3, SR4, SR5; Figure 1) subset of the data as this sampling effort had the most complete transect in a single season. Sites used for each analysis are further detailed in Supplementary Table 1.
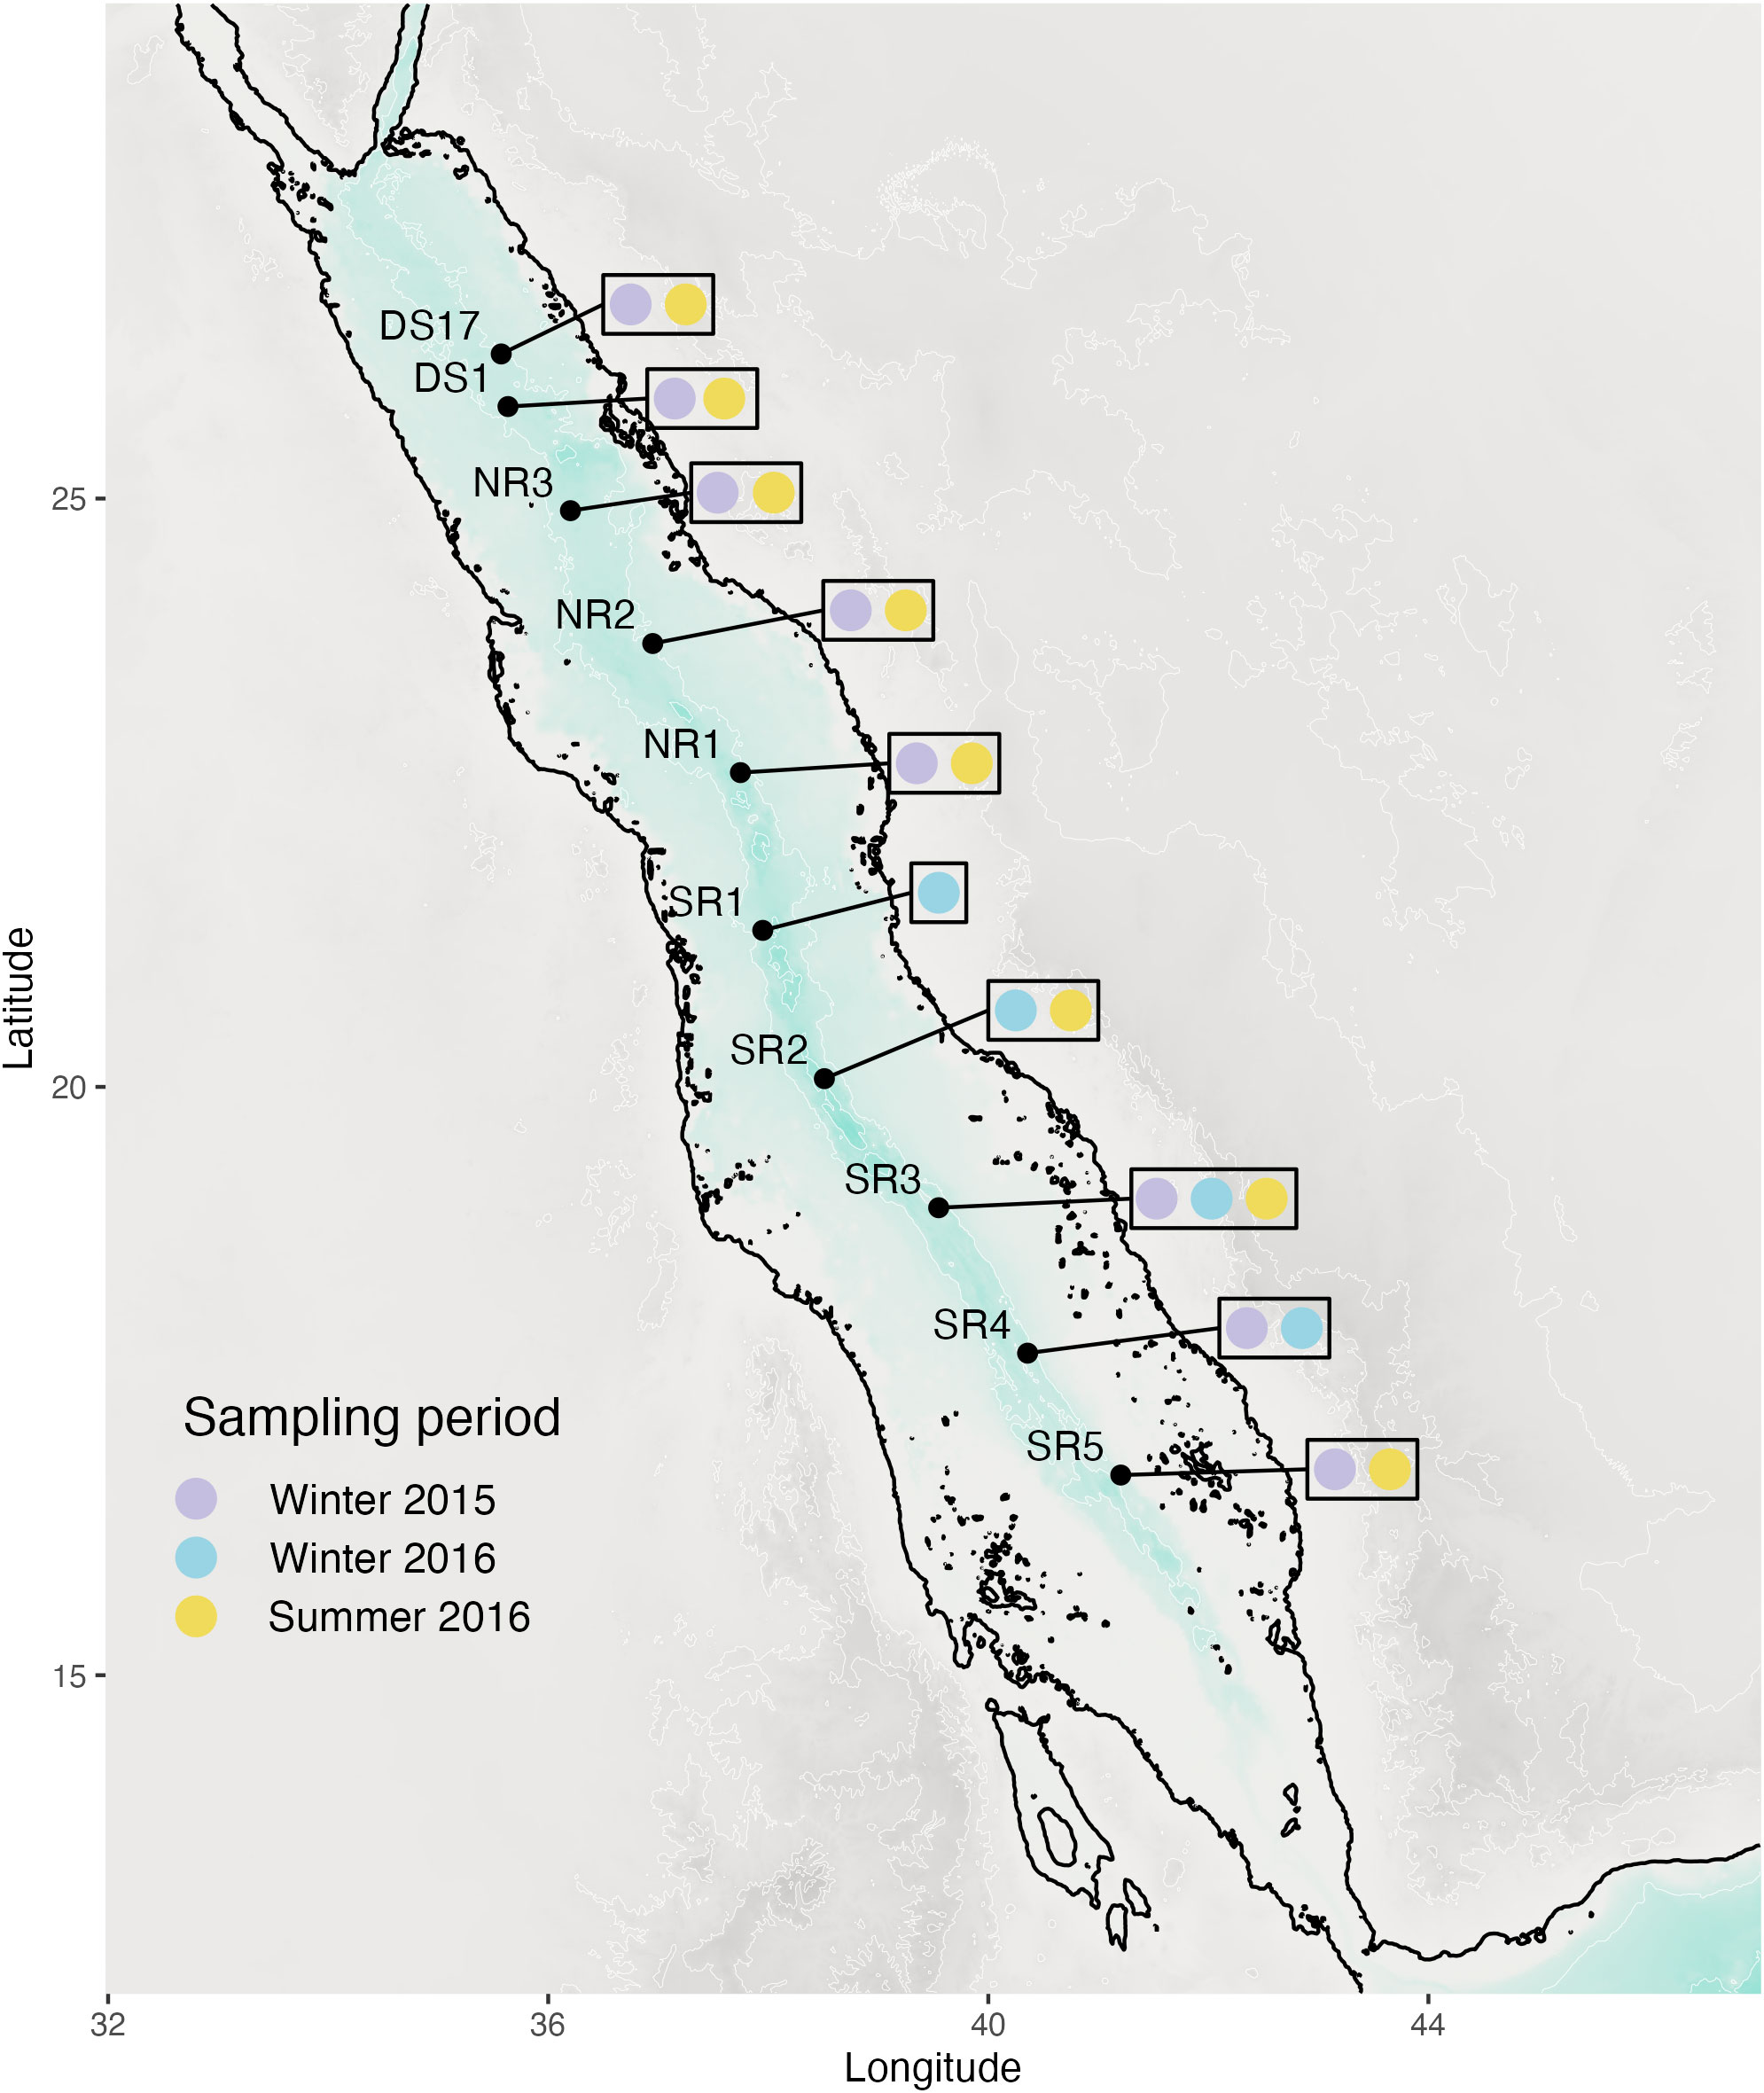
Figure 1 Map of the stations sampled during the investigation.
Alpha diversity was calculated as the number of ASVs per sample using estimate_richness in R’s phyloseq and differences amongst depths were tested using the Kruskal Wallis test as the data were not normally distributed. Pairwise comparisons were undertaken using the pairwise Wilcox text with p values adjusted for multiple comparisons using the Benjamini-Hochberg algorithm. The numbers of shared and unique ASVs per depth layer were visualized using ggvenn v0.1.10 (Yan, 2021). Gamma diversity was measured as the number of ASVs across all samples.
Permutational analysis of variance (PERMANOVA; Anderson, 2017) was used to assess multivariate differences in the community structure with the factors Depth Layer (4 levels: Surface, DCM, OMZ, Bottom) and Season (3 levels: 2015 winter, 2016 summer, 2016 winter). Bray-Curtis distance matrices constructed with the vegan v2.6-4 library (Oksanen et al., 2007) were used for the multivariate analysis. Figures were visualized with ggplot2. Variation partitioning based on distance based redundancy analysis was undertaken using the environmental variables measured and spatial distance calculated between the sampling stations. Environmental variables consisted of temperature, salinity, silicate, nitrate, nitrite and phosphate and the values were centered and scaled prior to inclusion in the variation partitioning. Distance based Moran’s eigenvector maps (dbMEM) were calculated from a geographic distance matrix in adespatial v0.3-21 and used as spatial variables. Bray-Curtis distance matrices were used as the response variable in the variation partitioning using the function varpart in the package vegan.
Ecological modelling frameworks developed and adapted by Stegen and colleagues (Stegen et al., 2013; Stegen et al., 2015) were used to assess the processes that contributed to the assembly of the eukaryotic communities. These processes were assessed on a microbial subset and a non-microbial metazoan subset of the community as well as the total community at the ASV level. For the vertical dataset pairwise comparisons were calculated amongst for each sampling point (station/season) individually (there were no between station/season pairwise comparisons). For the latitudinal analysis pairwise comparisons were undertaken amongst those stations sampled in winter 2015 at each depth layer). A schematic representation of the process for identifying the assembly process is shown in Figure 2 and described below. Phylogenetic turnover between pairs of samples was assessed by calculating the mean nearest-taxon-distance (ßMNTD; Fine and Kembel, 2011) with the msa v1.30.1 (Bodenhofer et al., 2015) and phangorn v2.11.1 (Schliep, 2011) packages. This was achieved by calculating the phylogenetic distance between each ASV in a community and its nearest relative in the pairwise community. Assuming that ecological selection was not the primary cause of differences in pairs of samples a null distribution of ßMNTD was calculated using the R packages picante (Kembel et al., 2010) and iCAMP v1.5.12 (repetitions = 999, Ning et al., 2020). The beta-nearest-taxon-index (ßMNTI) was calculated from differences between the null model and the observed ßMNTD values, normalized by the standard deviation. Deviations away from the null model indicated the prevalence of deterministic processes. ßMNTI values < -2 are attributed to homogeneous selection, which is a result of environmental conditions being similar, leading to consistent selective pressures and leading to low levels of change in the community. Conversely, the second deterministic processes, variable selection, is when higher than expected pairwise differences in community are observed (ßMNTI > 2) due to environmental differences being sufficient to assert selective pressures on the fitness differences amongst taxa. If deterministic processes were weak and did not deviate from the null model, stochastic processes were evaluated. Based on the Raup-Crick metric adapted to account for species relative abundances (RCBray), a stochastic null model was calculated. Observed values were evaluated against the null model and standardized to between -1 and 1 (Stegen et al., 2015). Deviations away from the null model when combined with weak deterministic processes were indications that stochastic processes dominated. Large differences in the community between the pairwise samples, as indicated by RCBray > 0.95, were suggestive of dispersal limitation and subsequent compositional drift of the communities. Higher than expected similarities in the communities (RCBray values < -0.95) suggested that homogenizing dispersal, here high rates of dispersal led to similar communities, was the predominant process. No dominant process were observed if there were no deviations away from the null model for either the deterministic or stochastic processes.
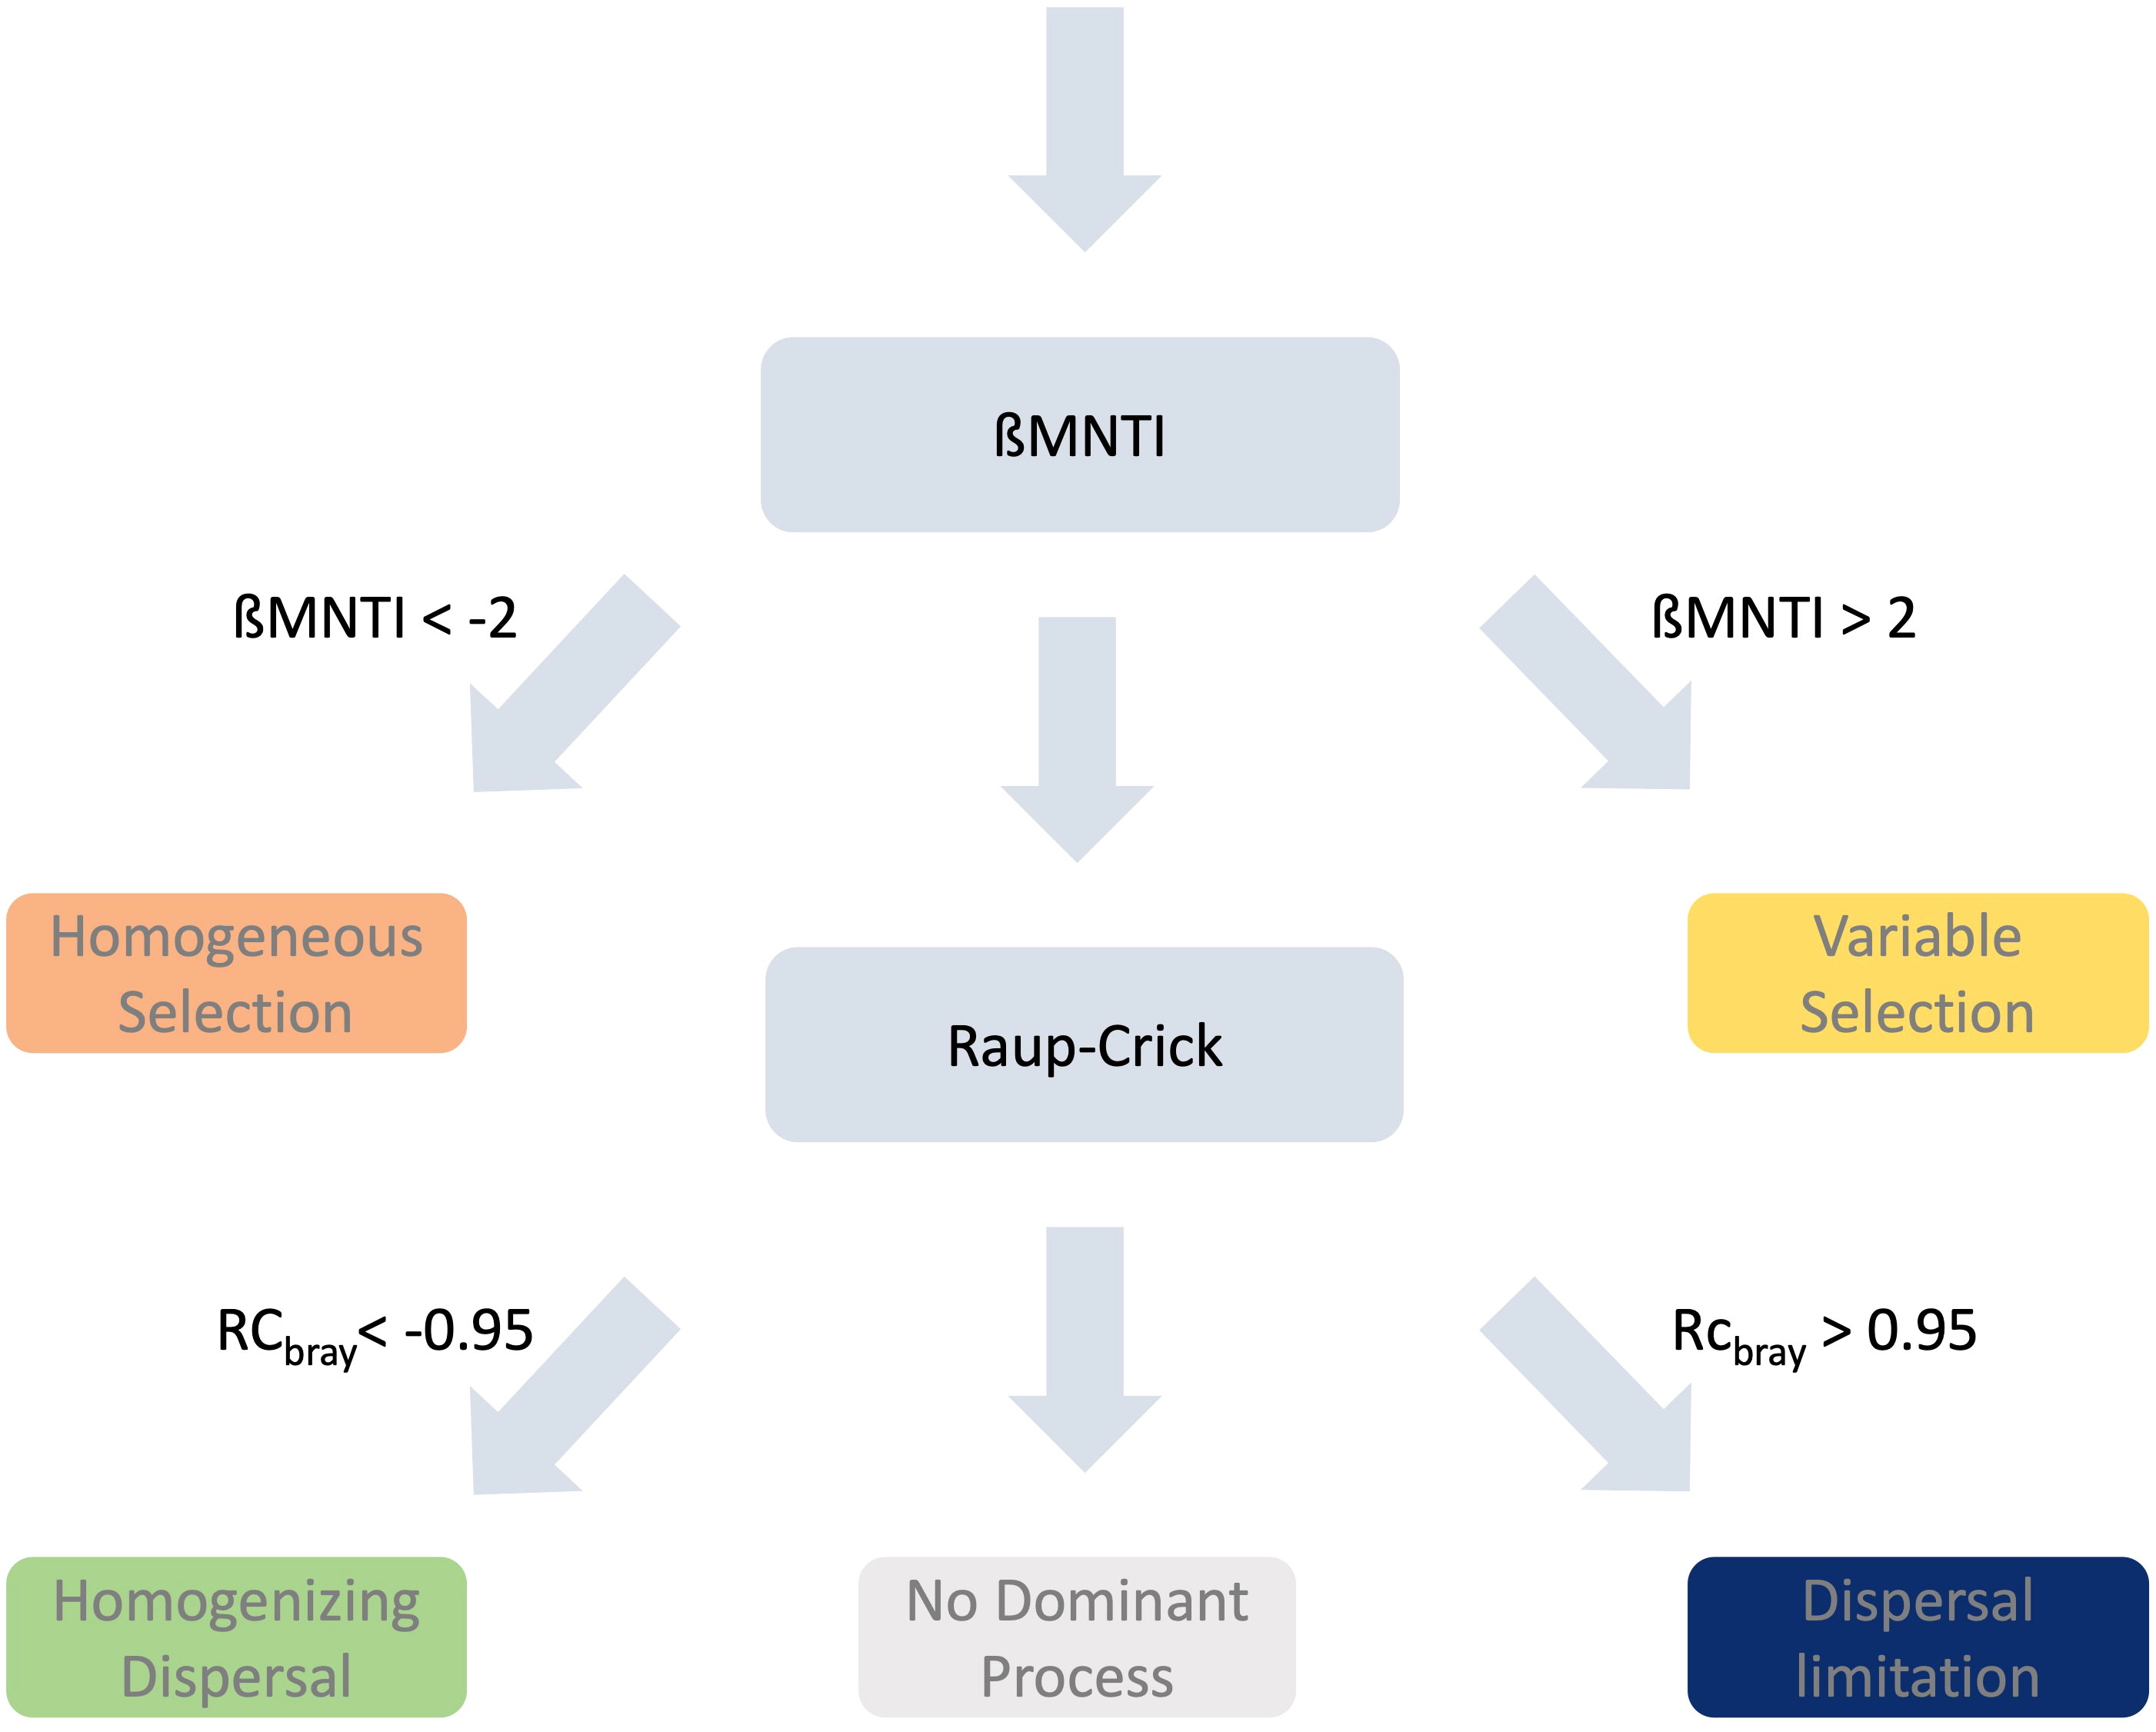
Figure 2 Schematic of the pipeline for the Stegen framework [7, 43].
Results
Principal component analysis showed a distinct separation in environmental characteristics along the depth gradient especially between the photic and aphotic zones, with the samples in the oxygen minimum zone and bottom depth layers being colder and in general more nutrient-rich while those at the surface and DCM were warmer with lower concentrations of nutrients (Figure 3; Supplementary Figure 1). Temperature was more variable temporally in the surface and DCM than the aphotic zone (Supplementary Figure 1).
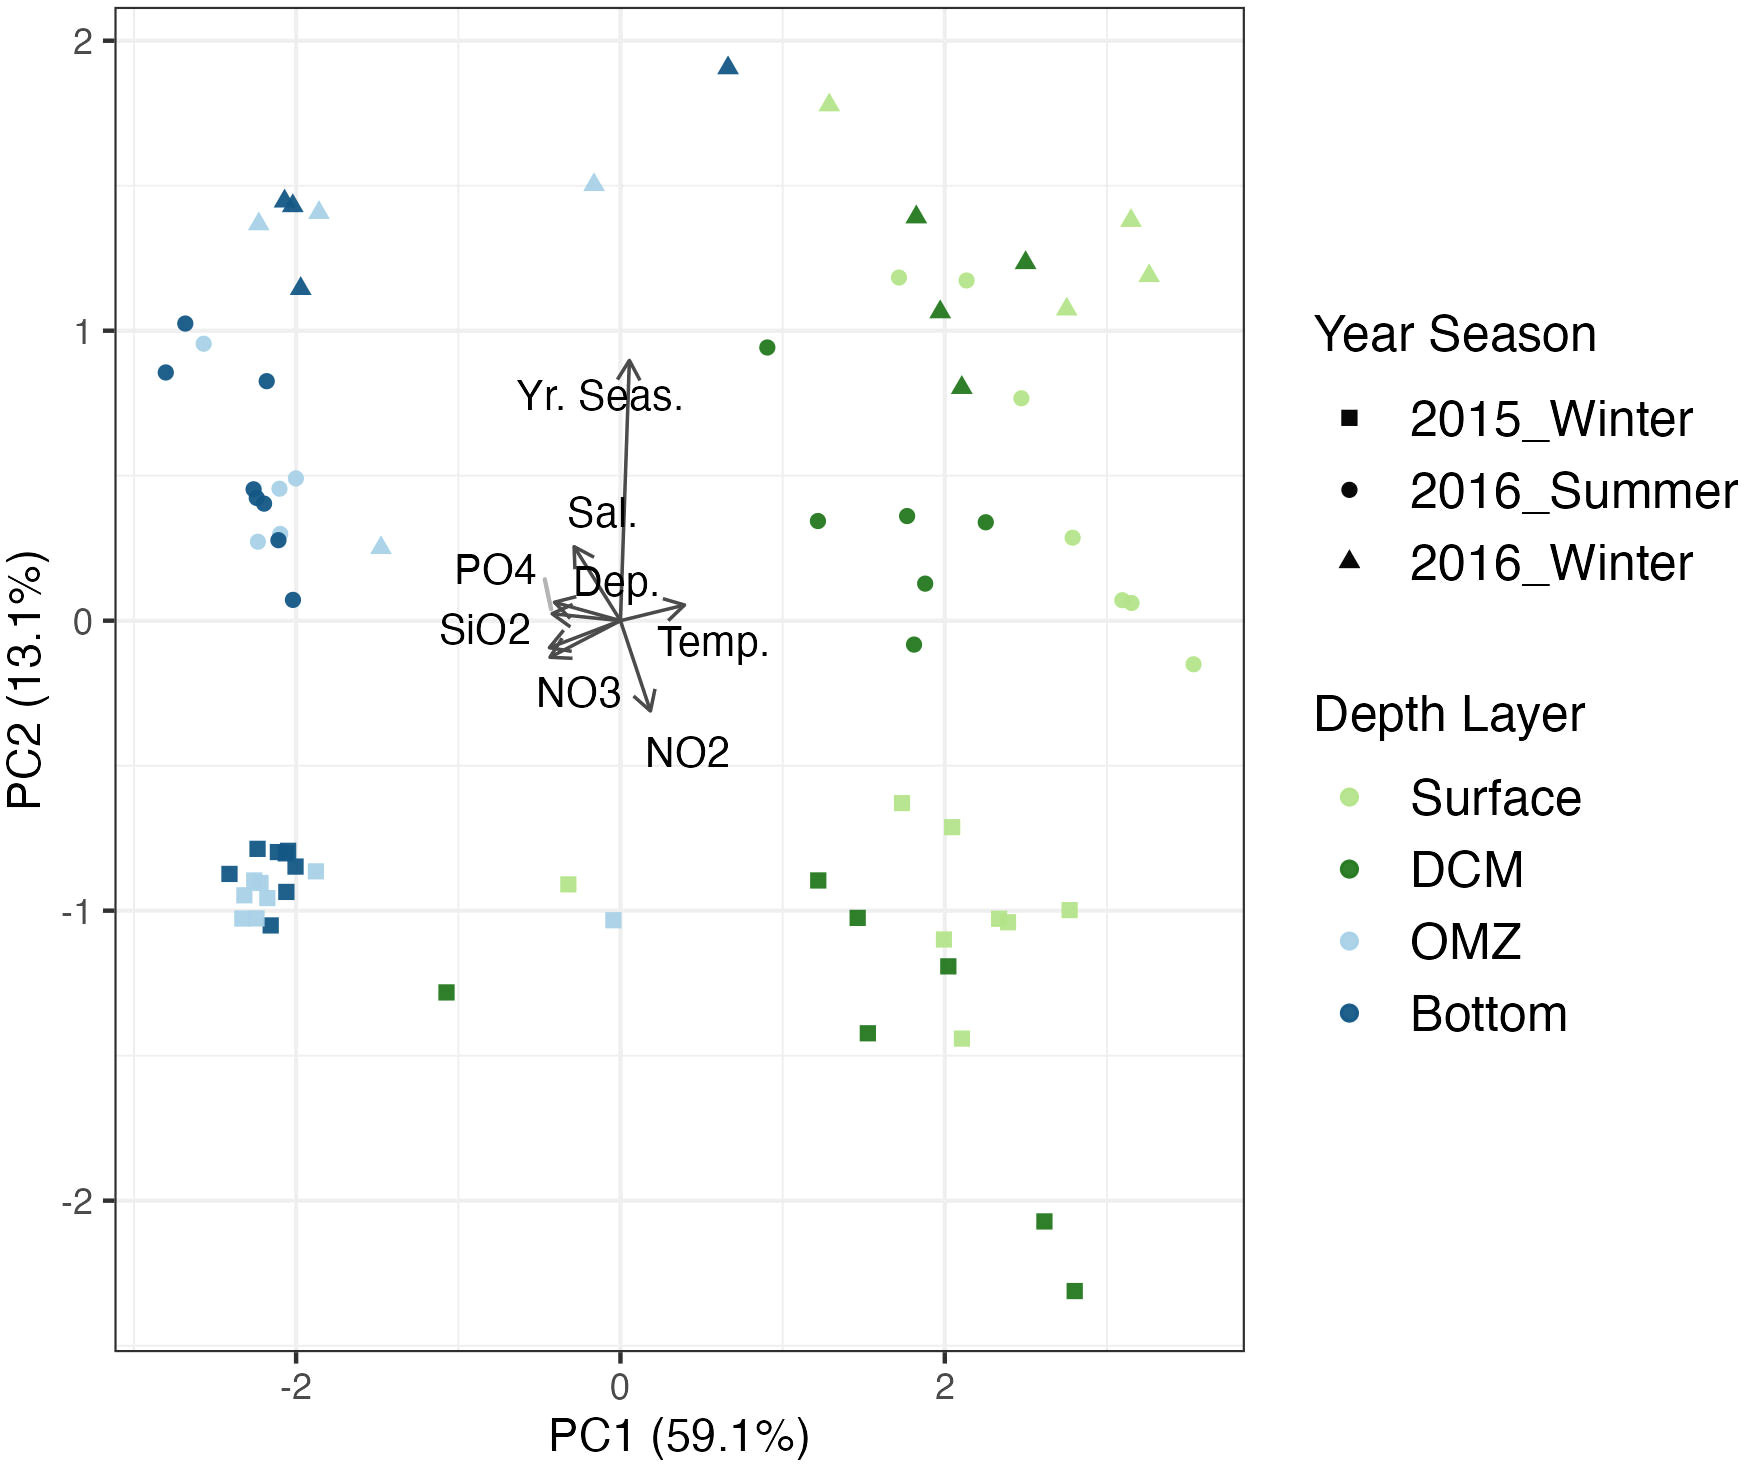
Figure 3 Principal Component plot of environmental variables of sampling stations and layers in the Red Sea. Points are colored by depth layer. The green colors represent the depth layers in the photic zone while the blues are from the aphotic zone. DCM, Deep Chlorophyll Maximum; OMZ, Oxygen Minimum. Si02, Silicate; NO2, Nitrite; NO3, Nitrate; PO4, Phosphate; Dep, Depth; Temp, Temperature; Sal, Salinity.
Variation partitioning showed that environmental variables accounted for the highest proportion of explained variation (Total:19.4%; Microbial: 25.3%; Non-microbial metazoans: 8.1%) compared with depth (Total 5.7%; Microbial: 5.2%; Non-microbial metazoans: 2.5%) and horizontal distance (Total 1.9%; Microbial: 2.1%; Non-microbial metazoans: 4.4%; Figure 4; Supplementary Figure 2). There was also a high proportion (Total 9.6%; Microbial: 20.6%; Non-microbial metazoans: 5.7%) that was explained by a combination of environmental variables and depth. However, a large proportion of the variation was not explained in the variation partitioning.
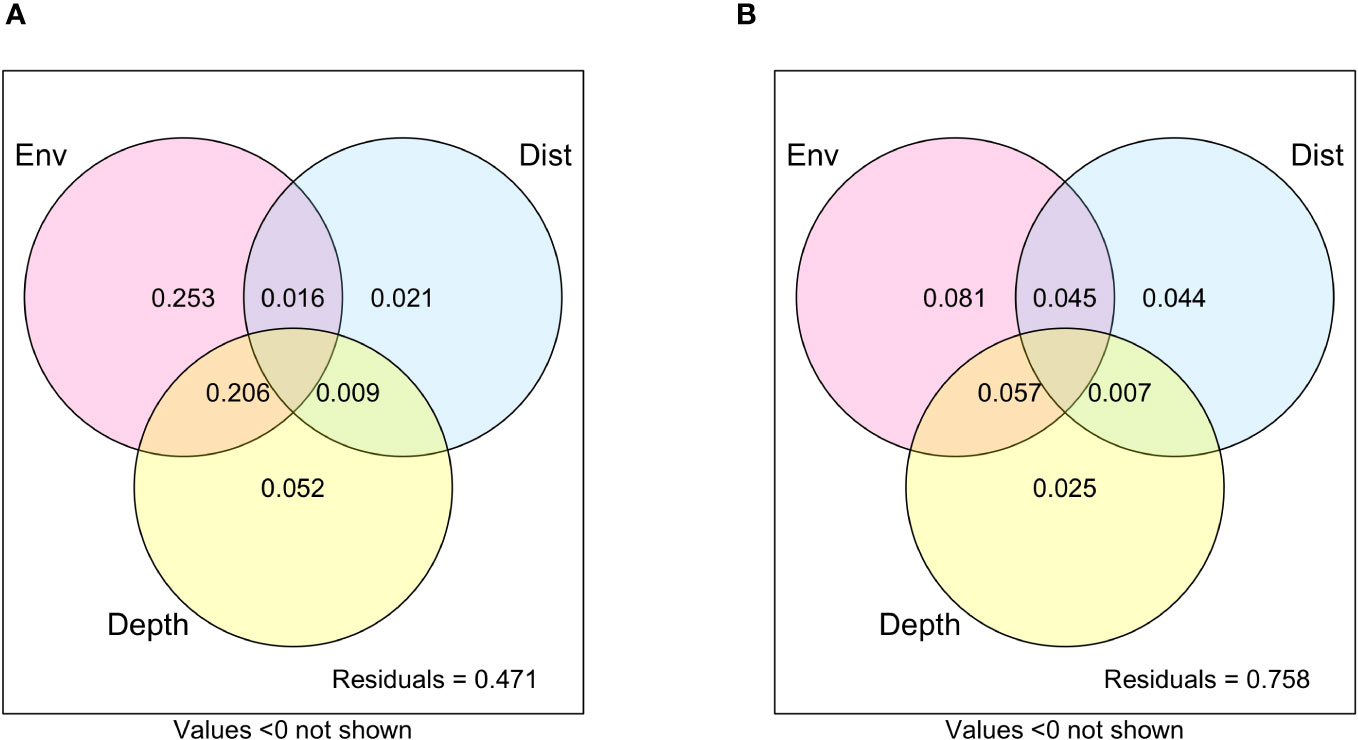
Figure 4 Variation partitioning of the microbial community (A) and non-microbial metazoans (B) by environmental variables (Env), Depth, and spatial distance between stations (Dist). Community dissimilarity was based on Bray-Curtis.
Multivariate analysis showed a significant interaction in the community structure with depth layer and season for both the microbes (PERMANOVA: F = 2.3, p = 0.001; Figure 5A) and the total community (PERMANOVA: F = 2.0, p = 0.001; Supplementary Figure 3).
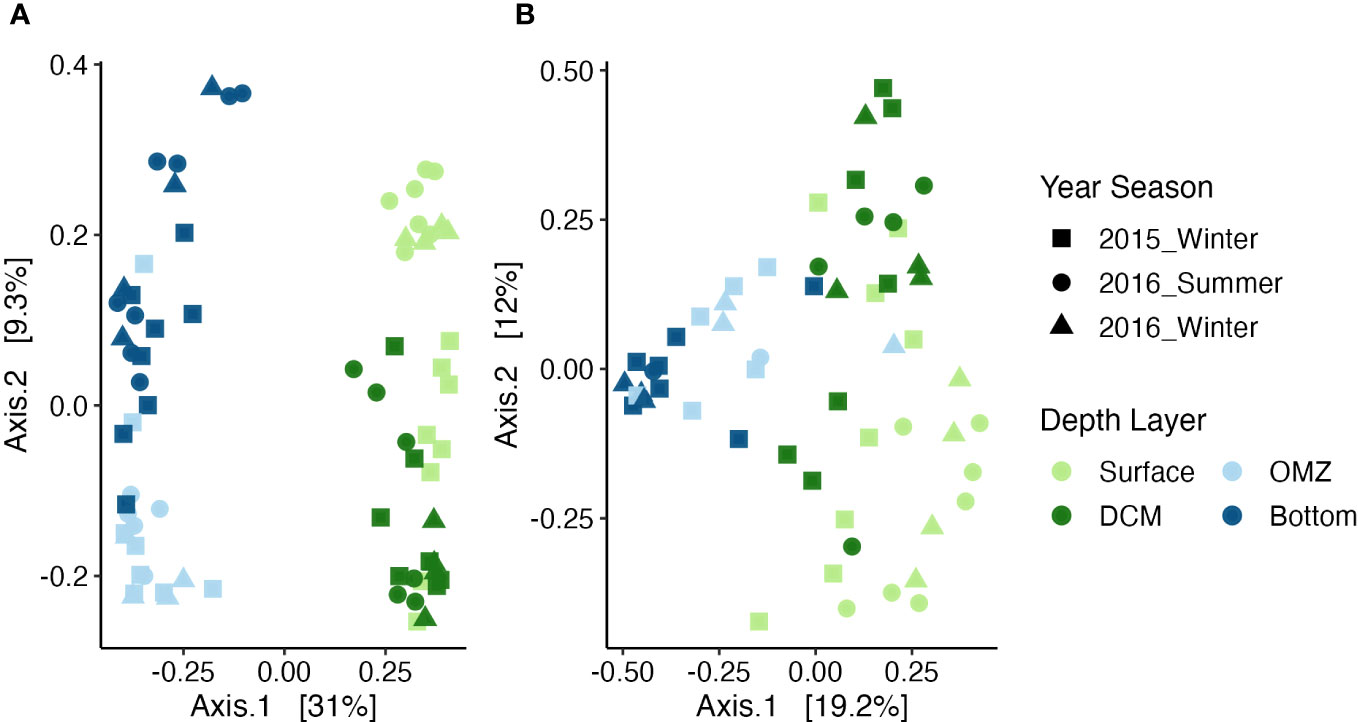
Figure 5 Principal Coordinate Analysis (PCoA) plot showing the distribution of samples for the microbial subset (A) and non-microbial metazoans (B) based on Bray-Curtis dissimilarity with points colored by depth layer and shaped by season. The green colors represent the depth layers in the photic zone while the blues are from the aphotic zone.
For the non-microbial metazoans there was no significant interaction (PERMANOVA: F = 1.2, p = 0.23; Figure 5B) but depth (PERMANOVA: F = 5.6, p = 0.001) and season (PERMANOVA: F = 2.2, p = 0.009) were independently significant.
Vertical patterns in species distribution
Considering that the principal component analysis indicated substantial differences in the environmental variables across the vertical profile, we first investigated changes in the community patterns across the depth layers.
There were significant differences in the number of ASVs observed in the depth layers in the microbial (Kruskal-Wallis: chi-squared = 20.9; p< 0.001; Figure 6A), and total community (Kruskal-Wallis: chi-squared = 20.8; p< 0.001, Supplementary Figure 4A) however not in the non-microbial metazoans (Kruskal-Wallis: chi-squared = 2.11; p=0.55). The DCM had the highest mean alpha diversity (827 ± 434 ASVs) overall as well as in the microbial (778 ± 410 ASVs) and non-microbial metazoan (34 ± 20 ASVs) subsets. For the total community pair wise tests indicated that there was no significant difference between the DCM and the surface (492 ± 401 ASVs; Pairwise Wilcox: p = 0.08) with the DCM being significantly different from the other layers in the microbial component. The lowest average diversity was observed in the bottom layer for the total community (230 ± 186 ASVs) as well as the microbes (206 ± 162 ASVs) while the OMZ had the lowest values for the non-microbial metazoans (24 ± 10 ASVs). The bottom layer had significantly lower diversity compared to the other layers for the total community (Pairwise Wilcox: Surface p = 0.019; DCM p = 0.001; OMZ p = 0.008) and microbes (Pairwise Wilcox: Surface p = 0.024; DCM p < 0.001; OMZ p = 0.006) but for the non-microbial metazoans there was no significant difference with other layers. A total of 312 ASVs (4.3% of the gamma diversity) were shared amongst the depth layers with 4,164 ASVs (57%) being observed in only a single depth layer (Supplementary Figure 4B). The ASVs shared across depths accounted for 51.2% of the total reads in the dataset. A similar pattern was observed for the microbes with 256 ASVs (3.8% of gamma diversity) shared amongst all depth layers and 3772 ASVs (57%) being unique to a single depth layer (Figure 6B). For the non-microbial metazoans 47 ASVs (13.0%) were shared amongst all layers and 192 ASVs (52.6%) were unique to a single layer (Figure 6B).
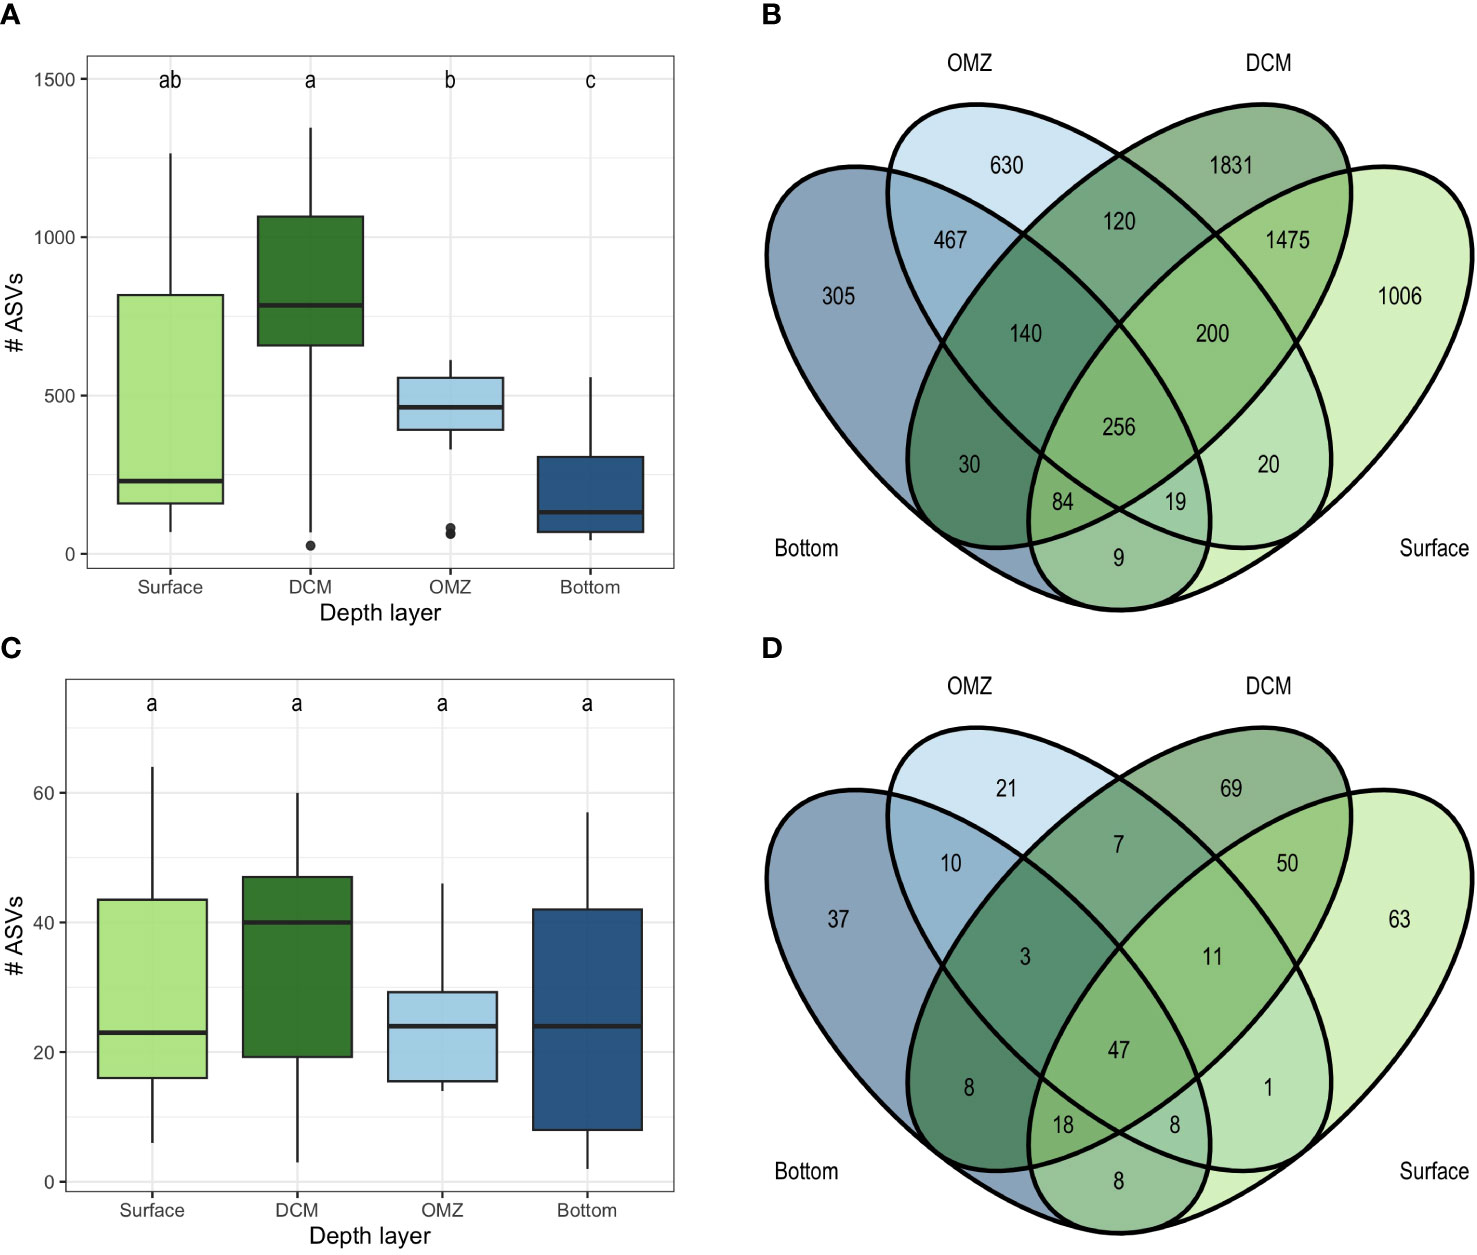
Figure 6 The number of ASVs in each depth layer for the microbial (A) and non-microbial metazoans (C) and the number of ASVs that are shared amongst depth layers for the microbial (B) and non-microbial metazoans (D).
Overall (all stations combined), the eukaryotic planktonic community in the euphotic zone (surface and DCM) pre-dominantly comprised the classes Dinophyceae (surface = 35.3% - 51.4% of microbial; DCM = 18.1%; 24.2% of microbial; Figure 7), Syndiniales (surface = 23.9%; 34.5% of microbial; DCM =35.7%; 44.9% of microbial; Figure 7) and Hexanauplia (surface = 25.5%; 85.5% of non-microbial metazoa; DCM =17.0%; 85.7% of non-microbial metazoa; Figure 7). The Paracalanidae family (class Hexanauplia) had the highest relative abundance (13.6%; 41.5% of non-microbial metazoa) in the surface layer, followed by the Dinophyceae family Gymnodiniaceae (10.7%; 16.1% of microbial; Figure 7). Group I clades 1 and 4 also had high relative abundances at the surface (6.1%; 9.0% of microbial and 5.0%; 7.4% of microbial respectively). The Polycystinea family Astrosphaeridae had the highest relative abundance (7.4%) in the DCM (Figure 7). Syndiniales families Group II clade 10 + 11 (5.7%; 7.2% of microbial), Group I clades 1 (5.1%; 6.8% of microbial) and 4 (5.1%; 6.8% of microbial) and Group I clade 5 (5.3%; 6.4% of microbial) were also prevalent at the DCM. Mamiellophyceae (3.0%), and especially the family Bathycoccace peaked at the DCM. Syndiniales became the dominant group in the oxygen minimum and bottom layers, where they accounted for 45.9% (47.0% of microbial) and 52.6% (56.4% of microbial) of reads, respectively (Figure 7). Compared to the photic zone, there was a different composition of Syndiniales, with Group II clade 7 being dominant in both layers [OMZ: 26.7% (27.2% of microbial); Bottom: 16.9% (17.8% of microbial)]. Acantharea also contributed substantially to the community in these layers accounting for 32.2% (33.0% of microbial) and 25.8% (27.2% of microbial) of reads, respectively. Polycystinea were prevalent (12.0% (12.7% of microbial); predominantly of the family Astrosphaeridae) in the OMZ layer, while the radiolarian class RAD-B (8.4%; 9.7% of microbial) and Hydrozoa (4.6% (67.9% of non-microbial metazoans); predominantly Diphyidae) were most abundant in the bottom layer (Figure 7).
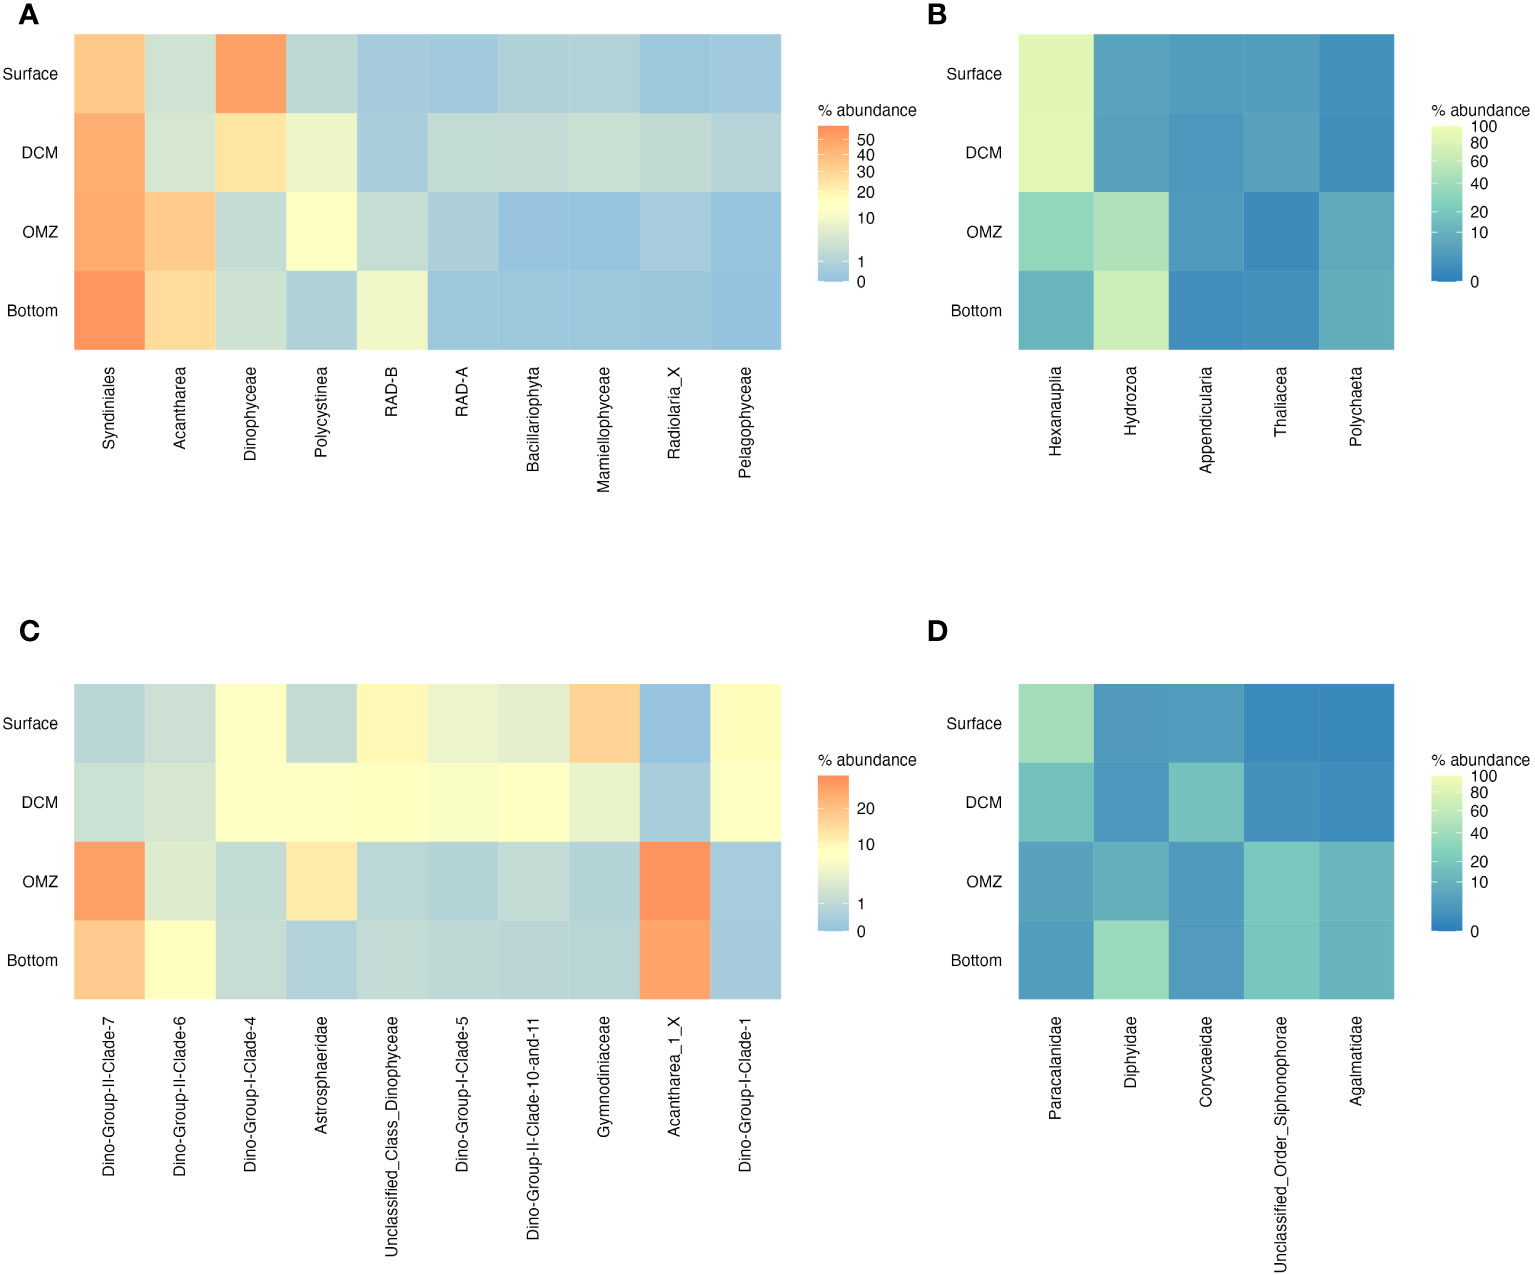
Figure 7 The distribution across depth layers of the most abundant microbial phyla (A), non-microbial metazoan phyla (B), microbial families (C) and non-microbial metazoan families (D). Where taxonomy could not be assigned to the group they were assigned to either unclassified Kingdom or unclassified Class. Only the top 10 taxa were shown for the microbes and top 5 for the non-microbial metazoans.
Investigation of the assembly processes of all ASVs across the depth profiles within stations showed that for the microbial community deterministic processes and especially variable selection were dominant when comparing the surface and DCM (photic) with the other depths (aphotic) (Figure 8; Supplementary Table 2). Homogenizing dispersal (76%) was the dominant assembly processes between the oxygen minimum zone and the bottom.
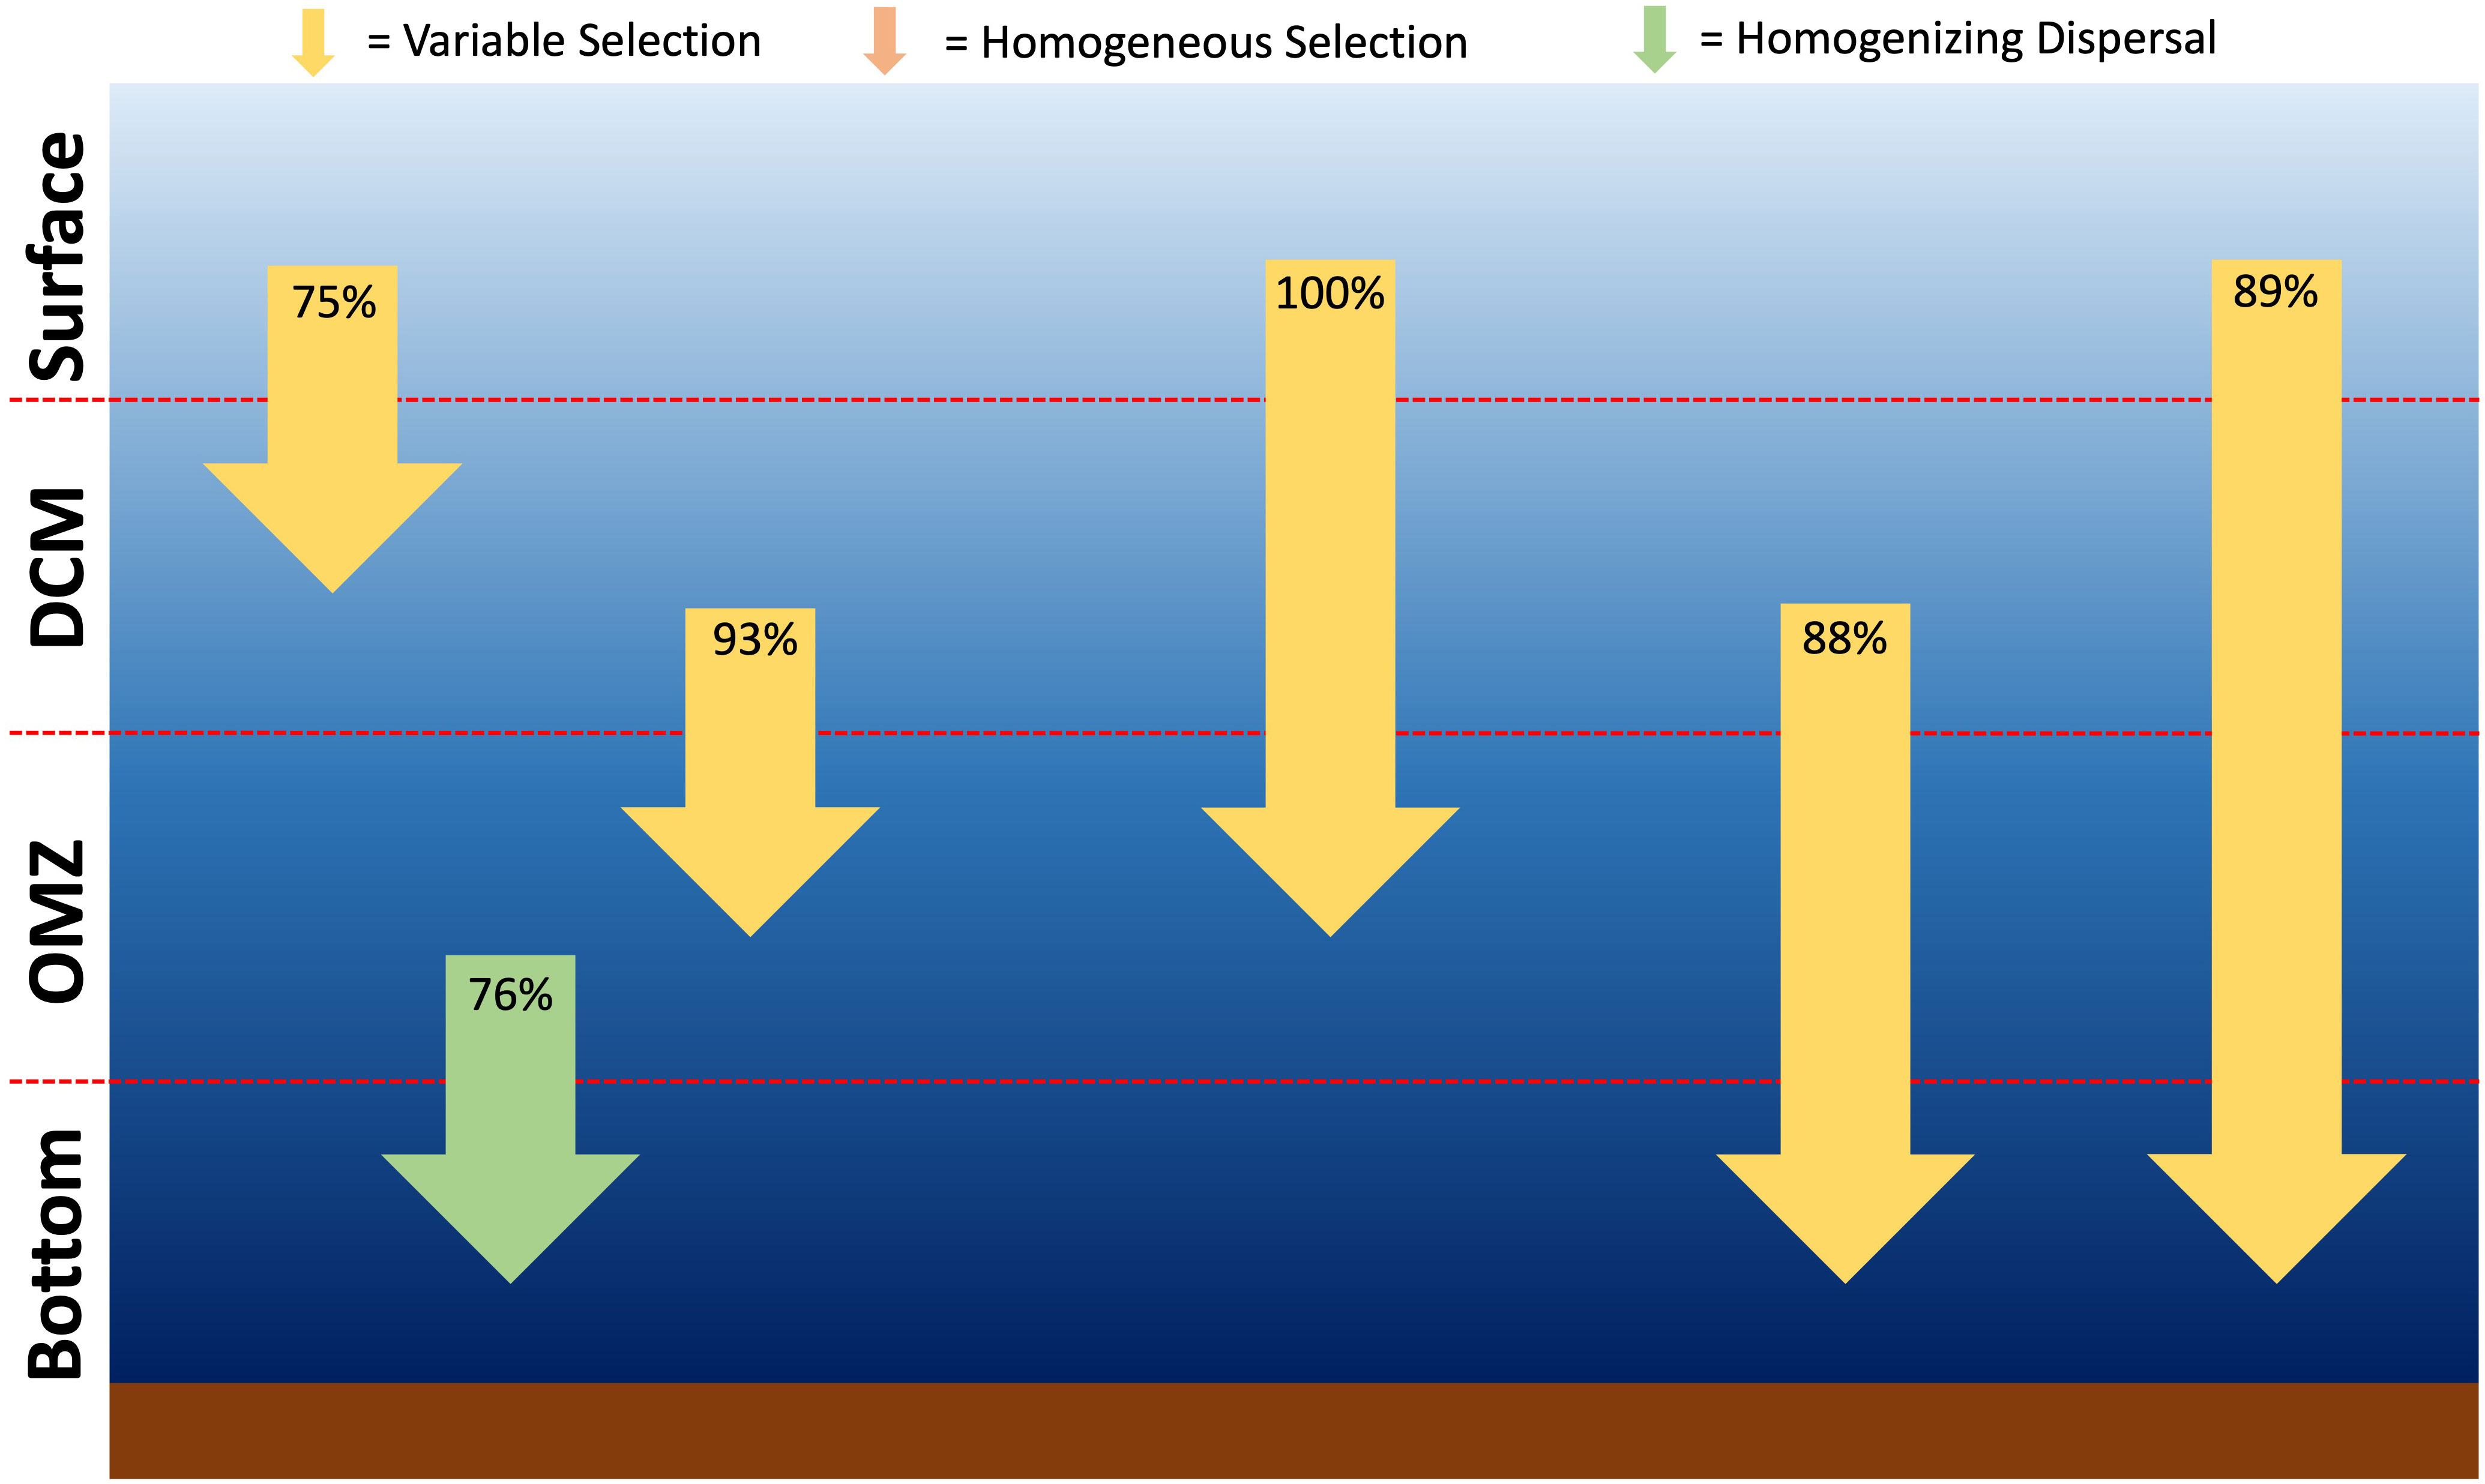
Figure 8 Assembly patterns for the microbial community through the water column based derived from the Stegen framework [7, 43].
For the non-microbial metazoans assembly processes were different with no dominant process being the predominant classification for most comparisons. Consequently, variable selection comprised a smaller proportion although still accounted for a substantial amount of the pairwise comparisons between the photic and aphotic zones (Supplementary Figure 5).
As the majority of the ASVs belonged to the microbial component the assembly processes for the total community closely matched those of the microbial subset (Supplementary Figure 6).
Latitudinal patterns in species distribution
Using the 2015 subset of the data, as it was the most complete transect in a single season, we investigated latitudinal patterns along the transect. In total, 282 microbial ASVs (5.9%) were present in all the stations, with 1731 ASVs (36.1%) only present in a single station (irrespective of depth). When separated by depth, the highest proportion of ASVs shared amongst all stations was in the bottom layer (5.6%), followed by the oxygen minimum layer (5.0%). The surface and DCM layers had a lower proportion of shared ASVs, accounting for 2.7% and 2.7%, respectively. Similar overall patterns were observed for the non-microbial metazoans with only 6 (2%) of ASVs being shared amongst all stations. When separated by depth only one or two ASVs were shared amongst the stations except for in the OMZ where six (6.5%) were shared.
At the family level, there were some differences in the distribution of taxa (Figure 9). In the surface, the dinoflagellate, Gymnodiniaceae had higher relative abundances in the northern and central Red Sea (DS17, DS1 and NR1-3) compared with the southern Red Sea stations (SR3-SR5; Figure 9A). The opposite trend was observed for the zooplankton family Paracalanidae, which reached a maximum relative abundance in the surface of 58% of non-microbial metazoans (Figure 9B). A similar trend in the distribution of Gymnodiniaceae and Paracalanidae was also observed at the DCM, with Astrosphaeridae having higher relative abundance in the northern half of the Red Sea and especially NR2 (35% of microbial). In the oxygen minimum layer (Figure 9), Astrosphaeridae was more predominant in the southern Red Sea (max: SR3 - 40%), although it still accounted for 20% in NR2. Acantharea 1 and Dino-Group II Clade 7 showed a relatively even abundance throughout the transect in the oxygen minimum layer, although a decrease in relative proportion was seen in the most southerly station sampled (SR5; 8.5% and 8.6%, respectively). In the bottom layer, Acantharea 1 and Dino-Group II Clade 7 were the dominant taxa throughout the transect, although there was a decrease in the relative abundance of Dino-Group II Clade 7 in the more southerly stations (Figure 9).
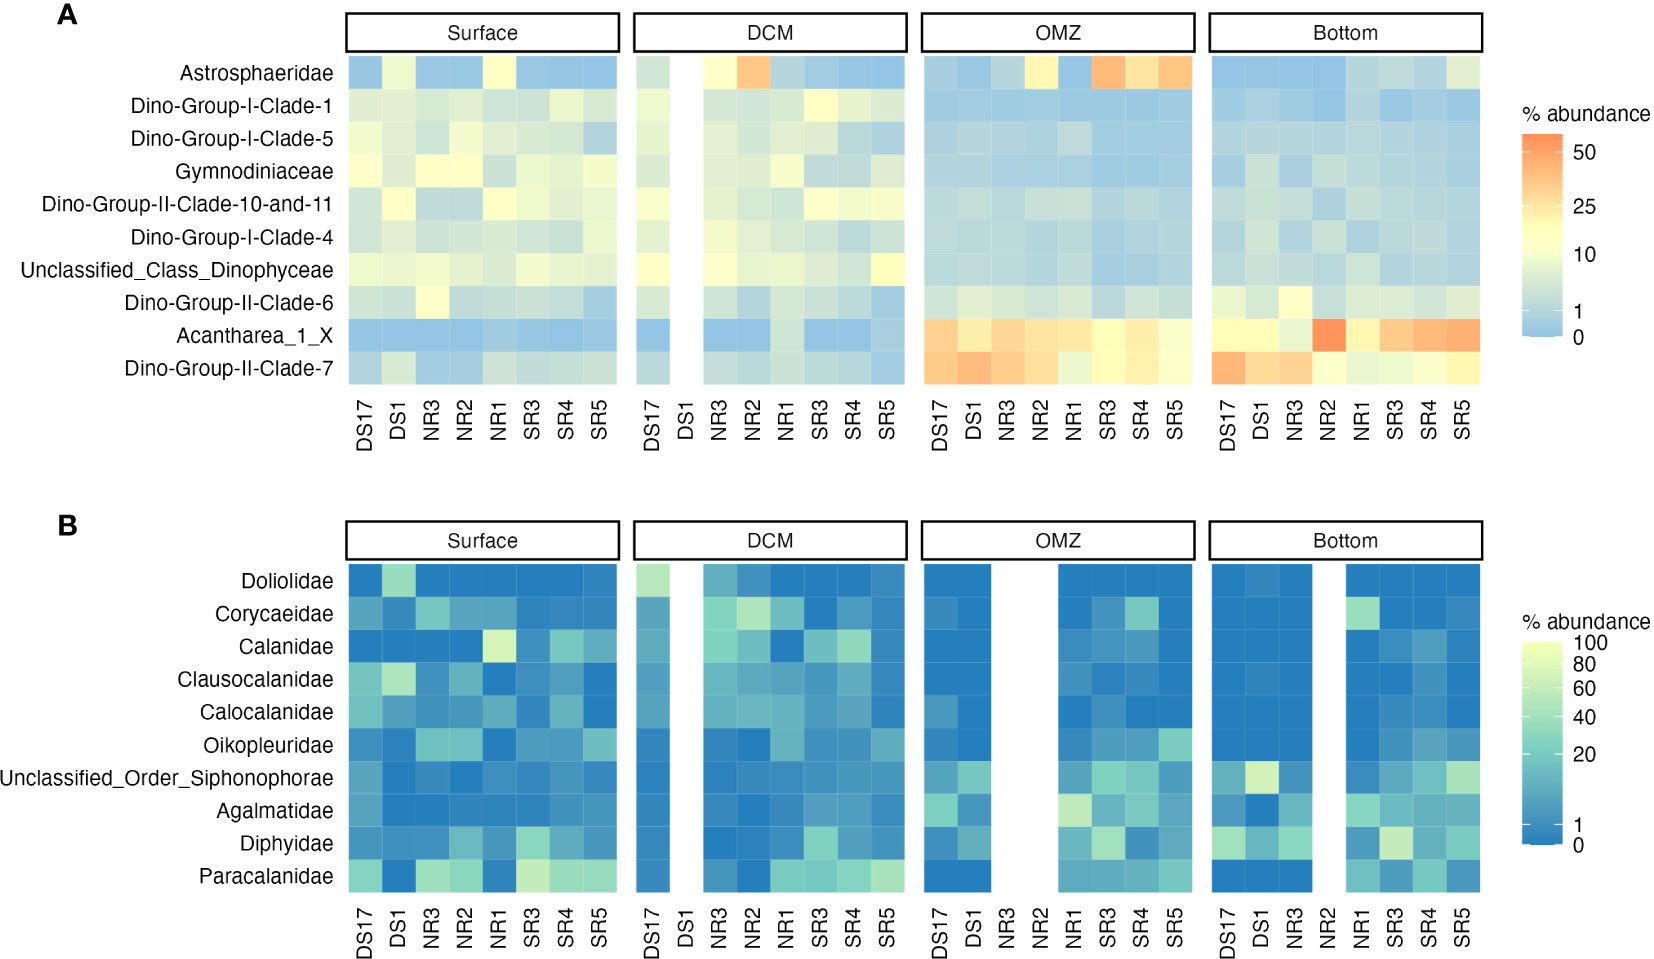
Figure 9 Composition of the eukaryotic community at the family for (A) the microbial subset and (B) the non-microbial metazoans across a latitudinal transect for the different depth layers. Note that the abundance is on a log scale and that only the top 10 families in each dataset are shown.
The Stegen modeling framework inferred that variable selection was the dominant assembly process amongst stations for the microbial community in the surface and DCM layers accounting for 82% and 76% of pairwise comparisons, respectively (Figure 10; Supplementary Table 3) with homogenizing dispersal accounting for the remainder (except for one homogeneous selection comparison in the DCM). In contrast, at the oxygen minimum zone, homogenizing dispersal was the predominant assembly process (75%), with variable selection (14%) and homogeneous selection (11%) accounting for small proportions (Figure 10). In the bottom layer, homogenizing dispersal (53% of pairwise comparisons) is predominant with variable selection accounting for 43%, with a small contribution from homogenous selection (4%) amongst the stations in the northern Red Sea (Figure 10). In the bottom layer, pairwise comparisons that were inferred to have variable selection as the dominant assembly process generally involved stations in the southern Red Sea (Figure 10).
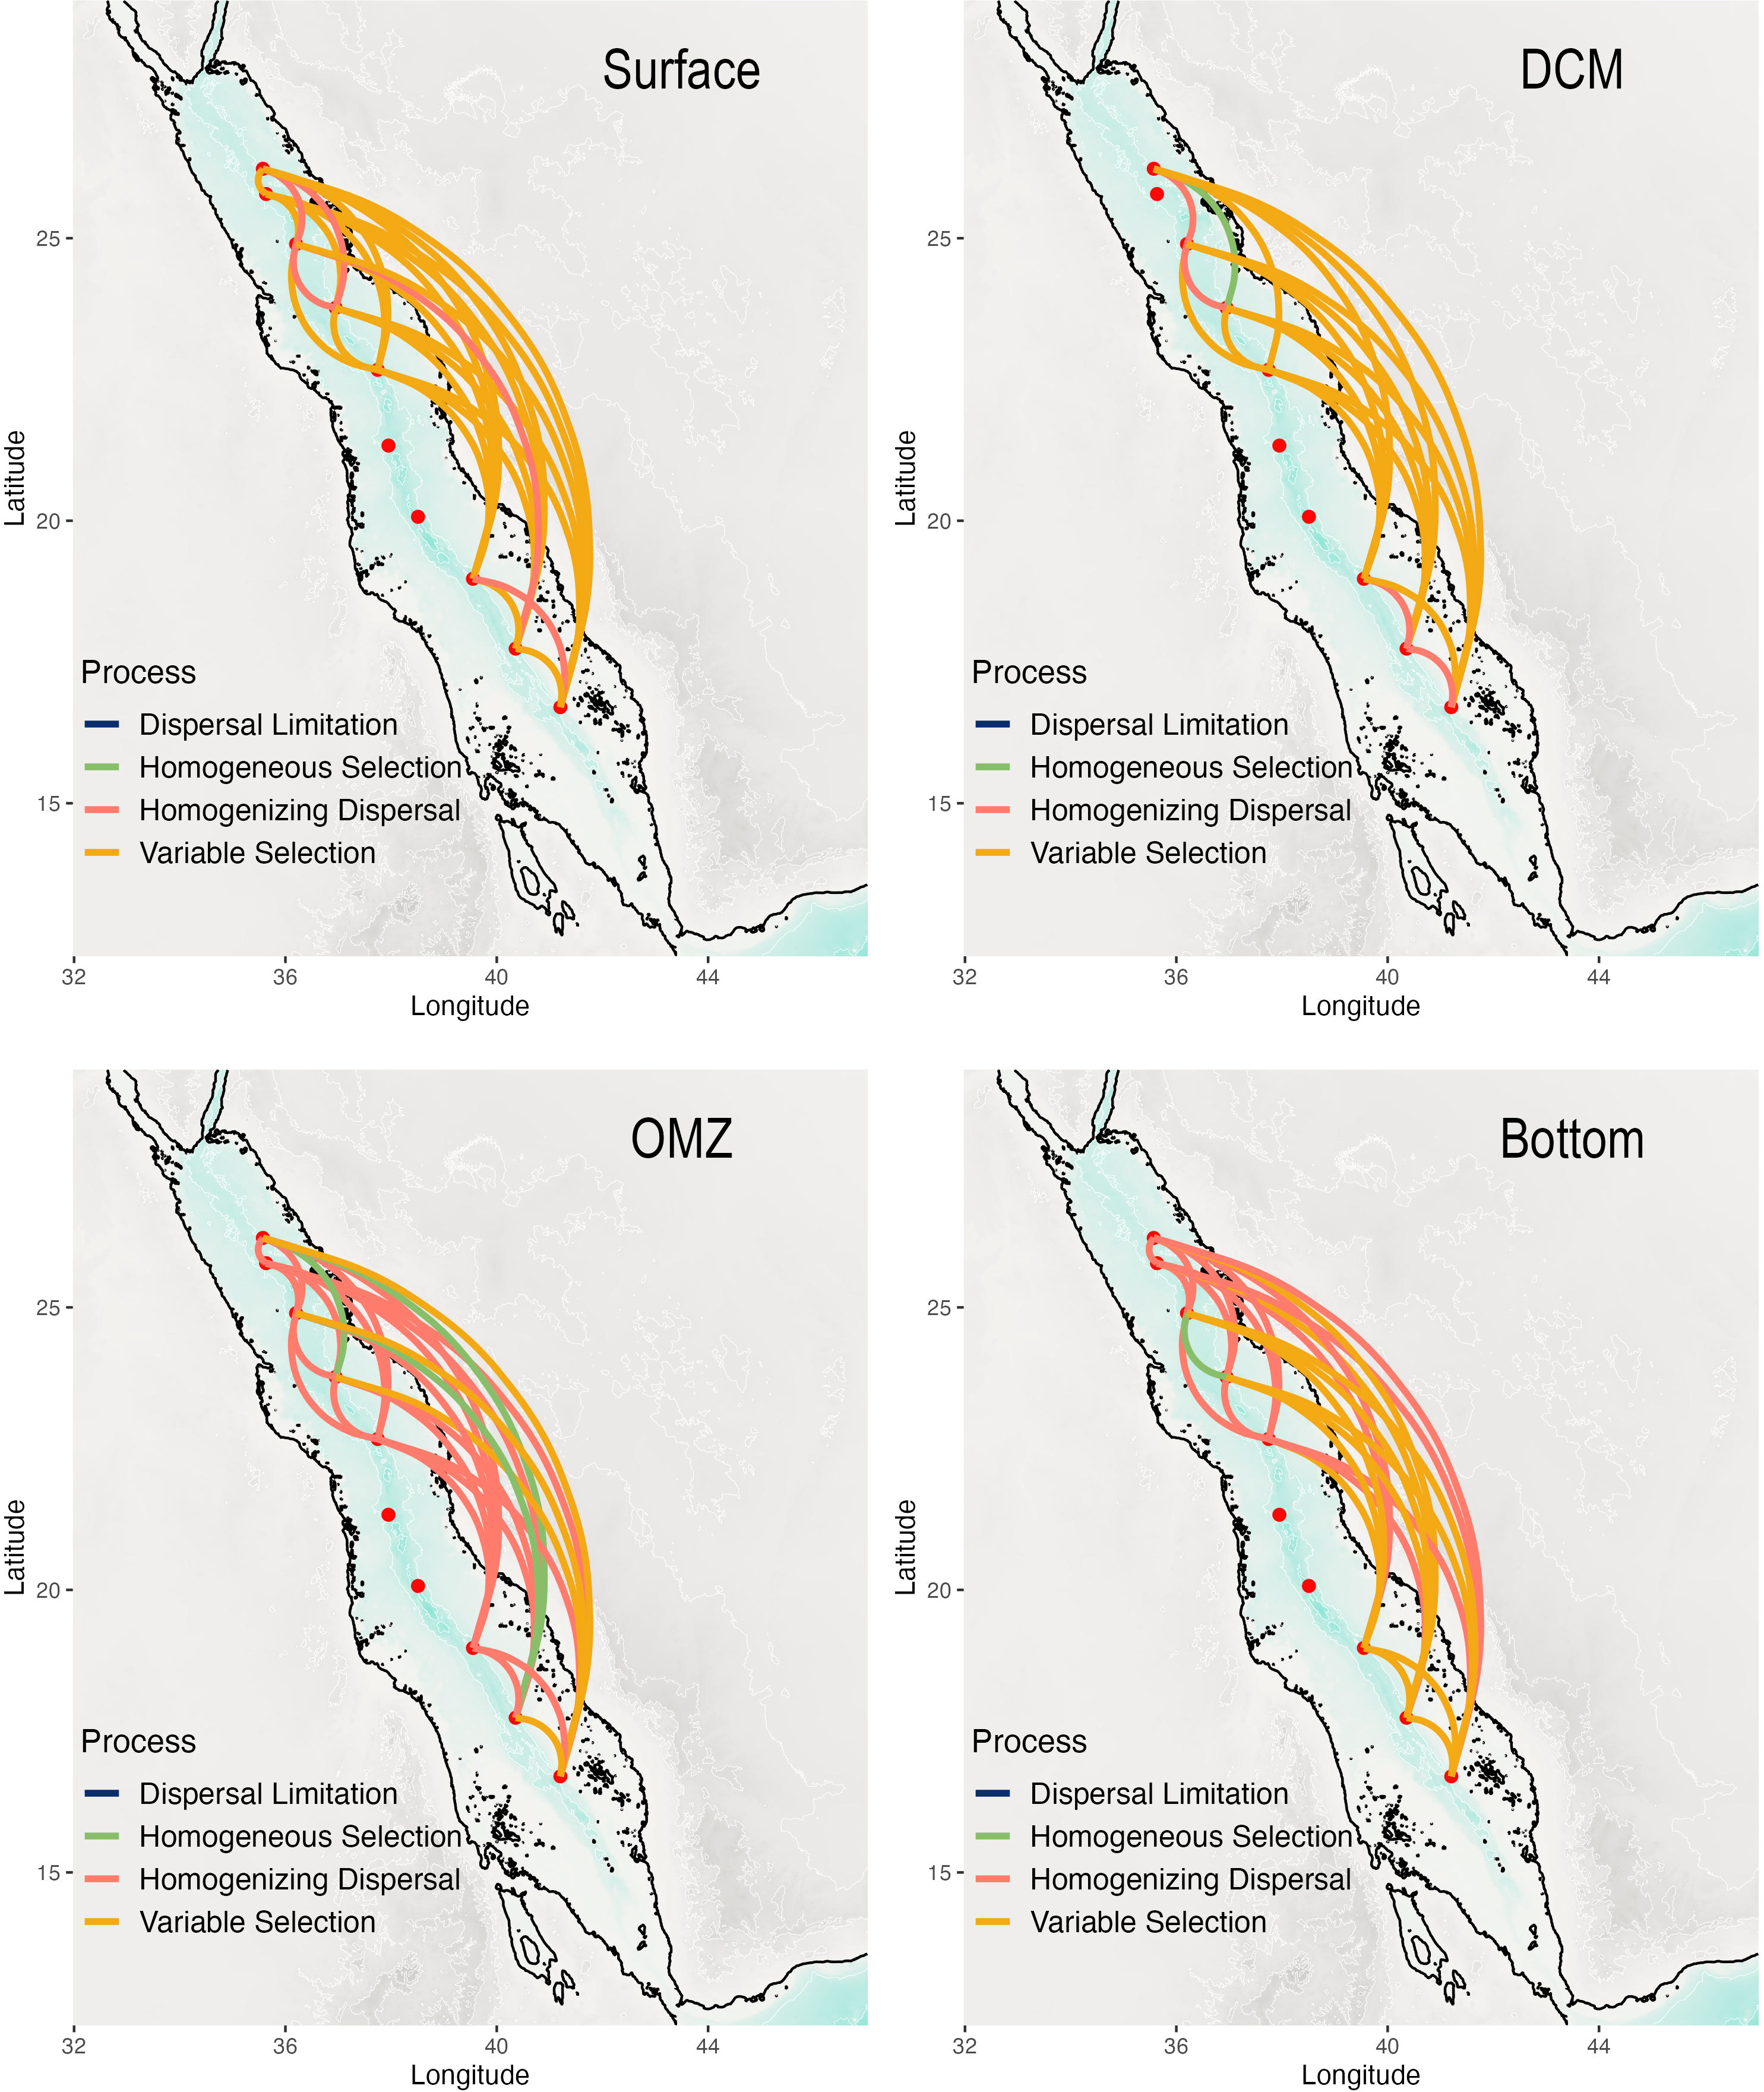
Figure 10 Assembly patterns for the microbial community along a latitudinal gradient based derived from the Stegen framework [7, 43].
For the macro-metazoans no dominant process was the dominant component in all layers. In the surface variable selection was also prevalent (Supplementary Table 3; Supplementary Figure 7) however dispersal limitation was a substantial component of assembly processes in the DCM (19%) especially between the stations at the extreme ends of the Red Sea.
For the total community similar patterns were observed as to the microbial community (Supplementary Table 3; Supplementary Figure 8).
Temporal patterns
Stations SR2 and SR3 had samples taken in the summer and winter of 2016 and the dominant assembly processes between seasons was homogeneous selection in the surface and bottom while in the DCM there was variable selection for the microbial component. No dominant process was the main process for the non-microbial metazoans. No comparisons were available for the oxygen minimum. A number of stations (DS17. DS1, NR3, NR2, NR1, SR3, SR5) were sampled in the winter of 2015 and summer of 2016 allowing seasonal patterns between years to be assessed and consistent patterns for a number of taxa were observed. In the surface Gymodiniaceae had an average relative abundance of 9.2% in winter 2015 and 23.7% in summer 2016. A similar increase in relative abundance was observed for Dino-Group-1-Clade 1 going from 4.7% to 9.0%, while Dino-Group II were in general more abundance in the winter samples in the surface (Supplementary Figure 9B). In the OMZ, Acantherea 1 had a higher relative abundance in the summer (44.6%) than the winter (23.3%). Assembly processes showed that variable selection was predominant in the surface and DCM while homogenizing dispersal was prevalent in the comparisons at the OMZ and bottom for the microbes (Supplementary Table 4). No dominant process was the main assembly process for the non-microbial metazoans. Inter-annual comparisons between the winter of 2015 and 2016 were available for SR3 and SR4 showed that variable selection was the dominant assembly process for the microbial component in the surface and the DCM. Differences in the relative abundance of Dinophyceae were noted for both stations that followed those observed for the seasonal patterns between years (Supplementary Figure 9) with 2016 having higher relative abundances for Dino-Group-I-Clade 4 and Gymodiniaceae compared to 2015 at the surface. The opposite pattern was observed for Dino-Group-I-Clade 1 and Dino-Group-II-Clade 10 and 11 especially in the DCM (Supplementary Figure 9A). Homogenizing dispersal was predominant in the oxygen minimum and bottom (Supplementary Table 4). Again, no dominant process was the main assembly process for the non-microbial metazoans.
Discussion
Eukaryotic diversity and assembly patterns through the water column
The majority of the ~7300 eukaryotic ASVs were only found in a single depth zone, with only 4% (312 ASVs) being observed in all depth layers. However, the latter accounted for over 50% of the reads. This finding agrees with the global trend observed from the surface to the deep-ocean sediment reported by Cordier et al. (2022). Those shared taxa still showed distinct distribution patterns through the water column with classes, such as Dinophyceae and Mamiellophyceae, having high relative abundances in the photic zone and low relative abundances in the deeper depth layers. The observed distribution is likely to reflect that phototrophic organisms are abundant in the photic zone before dying or being consumed and a proportion sinking through the water column, where their DNA is still detected. Indeed, Cordier et al. (2022) calculated that almost half of eukaryotic DNA reads in deep sea sediments could belong to sinking planktonic organisms. Care should thus be taken on deriving habitats of species based on the detection of DNA signatures and future work could incorporate RNA analysis to better distinguish living organisms through the water column. Kheireddine et al. (2020) demonstrated that significant vertical fluxes could occur following winter time blooms in the northern Red Sea. However, multivariate analysis of the eukaryotic planktonic community indicated a significant segregation in the vertical distribution in the open sea. Various studies across the globe have shown vertical patterns through the water column for a variety of eukaryotic organisms (Not et al., 2007; Xu et al., 2018; Giner et al., 2020; Cordier et al., 2022), as well as for specific groups, including ciliates (Zhao et al., 2017; Canals et al., 2020) and zooplankton (Pearman and Irigoien, 2015). A significant difference in the eukaryotic community within the photic zone has previously been reported in more coastal stations in the Red Sea (Pearman et al., 2016; Pearman et al., 2017), in agreement with current findings.
Investigations of assembly processes through the water column indicated that overall, in agreement with our hypothesis, deterministic processes and especially variable selection was the predominant processes driving the differences in the community compositions. This was especially true for the microbial community with the non-microbial metazoans having a higher contribution from no dominant process.
For the microbial community, the prevalence of variable selection between the photic zone (Surface and DCM) and the aphotic (OMZ and Bottom) zone would be expected due to the strong environmental gradients (e.g., light availability, temperature, salinity, nutrient concentrations) between these layers of the water column as well as the presence of stratification within the water column. Indeed, variation partitioning showed that environmental variables accounted for the highest proportion of the explained variance in the community. However, there was a high amount of unexplained variance and further work would need to be undertaken to explain this. This could include the analysis of further environmental variables, such as iron or light, likely to have an effect. But other factors such as non-linear water flow patterns and biological interactions could also be considered to improve the explanation of the community variation.
The changes in the microbial community with depth is highlighted by the reduction in the relative abundance of phototrophs, such as Dinophyceae and Mamiellophyceae, in the aphotic zone compared with the surface and DCM. Dinophyceae were especially prevalent in the photic, a common pattern in the world ocean (Giner et al., 2020; Cordier et al., 2022), although this could partially be related to the high rRNA copy number in dinoflagellates (Liu et al., 2021). Gyrodinium (family Gymnodiniaceae) was the predominant genus of Dinophyceae across the Red Sea basin. While the current study did not aim to identify taxa to the species level, this genus contains species that are mixotrophic, allowing them to meet inorganic nutrient requirements and acquire essential organic nutrients via bacterivory (Unrein et al., 2007; Hartmann et al., 2012), which could suggest adaptations to the oligotrophic surface waters of the Red Sea.
A distinct pattern in the distribution of the parasitic Syndiniales was observed through the water column, as noted elsewhere (Guillou et al., 2008). Syndiniales are prevalent through the water column, but different groups have specificities on the taxa they can parasitize. Syndiniales Group I clades 1 and 4 were found to be a substantial component of the planktonic community in the photic zone, with both declining in relative abundance in the aphotic zone. Clade 1 has previously been shown to have a uniform distribution in the water column (Guillou et al., 2008) and further work would be required to understand the decline in relative abundance in the current study. Syndiniales Group II clade 7 was prevalent in the aphotic zones, aligning with previous studies (Guillou et al., 2008; Duret et al., 2020) and this clade has been speculated to parasitize deep planktonic taxa such as Radiolarians (Guillou et al., 2008). Indeed, in the current study, Radiolarian classes such as Acantharea, Polycystinea and RAD-B had high relative abundances in the OMZ and bottom depth layers and thus could be parasitized by the Syndiniales Group II clade 7, accounting for the clades higher abundance in these depth layers. This highlights that despite the distinct characteristics of the Red Sea, including higher temperatures, even at depth, the taxa distributions are generally conforming to global trends.
Within the photic zone, we showed that variable selection was the dominant process in driving the assembly of planktonic communities between the surface and DCM. This is in contrast to the South Pacific Gyre where environmental conditions were similar and homogeneous selection dominated (Allen et al., 2020). This indicates that at the stations sampled in this study, a gradient in environmental conditions was strong enough for variable selection to predominate. This difference is likely to be driven by changes in light and nutrient levels, with Dinophyceae declining in relative abundance in the DCM while the green algal family Mamiellophyceae becomes more abundant. A similar pattern was reported for coastal sites in the Red Sea (Pearman et al., 2016; Pearman et al., 2017), as well as more generally through the world oceans (Monier et al., 2016; Giner et al., 2020). Bathycoccus was the dominant genera within the Mamiellophyceae and it has been suggested that they are more abundant in areas of the photic zones where nutrients are more prevalent (Choi et al., 2016; Monier et al., 2016; Pearman et al., 2016) and can thus outcompete mixotrophic genera.
In contrast to our hypothesis, between the oxygen minimum and bottom layers, variable selection did not play a large role in assembling the planktonic communities, with homogenizing dispersal and homogeneous selection instead being important. Homogenizing dispersal was more prevalent in the winter samples while homogeneous selection played an increasing role in the summer sampling indicating seasonal shifts in the deep-water column. In the winter sampling homogenizing dispersal was the dominant process with the implication that there is no limitation in dispersal between the two layers and a high amount of transfer, possibly due to dead cells sinking, between the layers. The increased prevalence of homogeneous selection in the summer samples agrees with thermohaline characteristics of Red Sea water masses which indicates that water below ~200m belongs to the Red Sea Deep Water cell (Sofianos and Johns, 2015) – including both the oxygen minimum and bottom samples in the current experiment.
Overall, the non-microbial metazoans had a similar general trend to the microbial community through the water column although no dominant process was the predominant assembly process. This could highlight a limitation of this analysis for multicellular organisms where a large proportion of reads can belong to a single individual and care should be taken when drawing conclusions from metabarcoding of macro-organisms.
Latitudinal assembly processes are depth layer dependent across the sea basin
Assembly processes for the microbial community across the latitudinal extent of the Red Sea showed differences between the photic zone and the aphotic zone. In the photic zone, as we hypothesized, the variable selection was the predominant assembly process, although homogenizing dispersal was observed between some stations. This is in agreement with results from the Malaspina Expedition (Villarino et al., 2022) but contrasts with the results for phytoplanktonic protists in East and South China Seas, where stochastic processes were dominant (Wu et al., 2017), and in the South Pacific Gyre where homogeneous selection was dominant along a longitudinal gradient (Allen et al., 2020). The unique nature of the Red Sea, which is a narrow, semi-enclosed body of water with limited exchange with other seas may explain the strength of variable selection in the photic zone. Water enters the Red Sea from the Gulf of Aden through the strait of Bab-el Mandab (Sofianos and Johns, 2002) and then flows northward, resulting in distinct latitudinal gradients in environmental variables, including temperature, salinity, and nutrients. Salinity increases from less than 36.6 in the Gulf of Aden to nearly 40.6 in the north due to significant evaporation. Temperature is warmest in the south due to the latitudinal gradient in solar insolation, and nutrients enter the Red Sea from the Gulf, some already in organic form as phytoplankton biomass and some in dissolved form in the Gulf of Aden Intermediate Water (Churchill et al., 2014; Wafar et al., 2016). In the surface layer, the family Gymnodiniaceae (class Dinophyceae) is more prominent in the northern part of the Red Sea. The mixotrophic nature of this Dinoflagellate family may explain its distribution patterns with the ability to access inorganic nutrient requirements and essential organic nutrients in the nutrient poor northern regions giving them a competitive advantage over phototrophs. However, in the more nutrient rich southern region of the Red Sea, the mixotrophic nature is less of an advantage, and the relative abundance of Gymnodiniaceae declines. Similar patterns in the distribution of Dinophyceae have been shown in coastal stations along the latitudinal extent of the Red Sea (Pearman et al., 2017).
For the non-microbial metazoans, variable selection was the predominant process in the surface although it was less prevalent in the DCM where no dominant process and dispersal limitation accounted for a higher proportion. Paracalanidae were one of the dominant taxa of non-microbial metazoan in these layers and showed distinct latitudinal patterns with higher relative abundances in the southern Red Sea compared to the north. This distribution may be related to the quantity and quality with nutrition available to the group. Better quality nutrition has been shown to affect the productivity of Paracalanidae (Camus et al., 2021) and the higher nutrients present in the southern Red Sea is likely to improve the quantity of microalgae available for consumption by copepods. In the DCM dispersal limitation is the predominant process for the non-microbial metazoans in contrast to the microbial community where variable selection was predominant. Villarino et al. (2018) has previously show that different size planktonic groups have different patterns of community similarity over spatial distances with larger organisms having shorter dispersal scales and this could explain the differences in assembly processes between the two groups and the higher contribution of distance in the variation partitioning for the non-microbial metazoans.
In the aphotic zone, homogenizing dispersal played a larger role in the assembly of microbial planktonic communities, especially at the oxygen minimum zone. The increased predominance of stochastic processes in community assembly in deeper waters is in agreement with Villarino et al. (2022). The dominance in stochastic processes in deeper water could be explained by a relatively uniform body of deep water flowing along the basin. The formation of Red Sea Deep Water and Red Sea Outflow Water occurring in the northern Red Sea as wintertime cooling causes high salinity water to sink and mix with deeper water before flowing southward (Sofianos and Johns, 2015) allowing for homogenizing dispersal to occur. The characteristics of this region of the water column vary little along the length of the Red Sea, and thus could justify how these communities are predominantly assembled by homogenizing dispersal. The exception to the dominance of homogenizing dispersal to assembling the planktonic communities in the aphotic zone was between the northern and southern Red Sea stations in the bottom layer. While further work would have to be undertaken to explain these differences in this study, the southern stations have a distinctly lower concentration of nitrate in these bottom waters, which could be influencing the community composition.
Temporal assembly patterns
The PCA and multivariate analysis showed that temporal issues played a part in structuring the eukaryotic community in the Red Sea. This is in agreement with previous work undertaken in more coastal regions of the Red Sea (Pearman et al., 2017). However, due to the configuration of the cruises, it was impossible to undertake a detailed investigation of the assembly patterns across seasons and years and further work will be required. For two stations (SR2 and SR3) samples were taken in both the winter and summer of 2016 with homogeneous selection being the dominant processes at the surface and bottom suggesting that environmental conditions in these layers did not vary substantially in the four months between sampling. Two stations were sampled in the same season across the two years with variable selection being prevalent in the photic zone possibly linked to the changes in relative abundance in Dinophyceae groups. Homogenizing dispersal was more prevalent in the aphotic zone in agreement with the other results for this zone reported in this study. Other stations were sampled in different seasons but across the two sampling years making disentangling seasonal vs annual influences complicated. This is highlighted by the fact that Gymnodiniaceae and to a lesser extent Dino Group I Clade 1 had a higher relative abundance in 2016 (both winter and summer) compared to 2015 while Dino Group II Clade 6, 7, 10 and 11 showed the opposite pattern in the surface. This result makes it hard to disentangle the contribution of annual and seasonal changes to the community composition. However, like the within year seasonal differences variable selection was predominant in the surface as well as the DCM implying strong differences in photic zone environmental conditions between seasons. In contrast in the OMZ and bottom samples homogenizing selection and homogenizing dispersal were more prevalent indicating high dispersal and similar environmental conditions prevail even between years and season. More work would be required to test these temporal patterns ideally with the stations being sampled multiple times in a year over a time frame of several years. In an era of global climate change which is impact marine ecosystems (Hoegh-Guldberg and Bruno, 2010), understanding temporal patterns in the ecology patterns and how communities are shifting in time is vital and further research should be undertaken in this area.
Conclusion
This study demonstrates the use of environmental genomics in understanding the assembly processes of eukaryotic plankton across depth profiles along a latitudinal transect. Distinct differences were noted in the eukaryotic community across the depth profile, with deterministic processes predominant between layers except between the oxygen minimum and bottom waters, where deterministic and stochastic processes were balanced. Latitudinal assembly patterns of the eukaryotic plankton were different for the depth layers, with deterministic processes (especially variable selection) being more predominant in the euphotic zone compared with the aphotic zone, where stochastic processes and especially homogenizing dispersal are more predominant.
Data availability statement
The datasets presented in this study can be found in online repositories. The names of the repository/repositories and accession number(s) can be found below: https://www.ncbi.nlm.nih.gov/genbank/, PRJNA955000.
Ethics statement
The manuscript presents research on animals that do not require ethical approval for their study.
Author contributions
JP: Conceptualization, Formal analysis, Methodology, Visualization, Writing – original draft. BJ: Funding acquisition, Writing – review & editing. MQ: Writing – review & editing. SC: Conceptualization, Funding acquisition, Writing – original draft, Writing – review & editing.
Funding
The author(s) declare financial support was received for the research, authorship, and/or publication of this article. The research reported in this publication was supported by funding from a collaboration between KAUST and Saudi Aramco within the framework of SAKMEO (approval number 23-Q2-3222).
Acknowledgments
We would like to thank the crew of RV Thuwal as well as the personnel from the King Abdullah University of Science and Technology (KAUST) Coastal and Marine Resources Core Lab for logistical support. In addition, the authors would also like to thank the members of the Saudi Aramco – KAUST Center for Marine Environmental Observations (SAKMEO) and colleagues from the Red Sea Research Center for their help in sampling collections and processing.
Conflict of interest
The authors declare that the research was conducted in the absence of any commercial or financial relationships that could be construed as a potential conflict of interest.
The author(s) declared that they were an editorial board member of Frontiers, at the time of submission. This had no impact on the peer review process and the final decision.
Publisher’s note
All claims expressed in this article are solely those of the authors and do not necessarily represent those of their affiliated organizations, or those of the publisher, the editors and the reviewers. Any product that may be evaluated in this article, or claim that may be made by its manufacturer, is not guaranteed or endorsed by the publisher.
Supplementary material
The Supplementary Material for this article can be found online at: https://www.frontiersin.org/articles/10.3389/fmars.2023.1295997/full#supplementary-material
Supplementary Figure 1 | Boxplots showing the variation in temperature, oxygen and nutrients amongst the depth layers and temporally.
Supplementary Figure 2 | Variation partitioning of the eukaryotic community by environmental variables (Env), Depth, and spatial distance between stations (Dist). Community dissimilarity was based on Bray-Curtis.
Supplementary Figure 3 | Principal Coordinate Analysis (PCoA) plot showing the distribution of samples for the total community based on Bray-Curtis dissimilarity with points colored by depth layer.
Supplementary Figure 4 | The number of ASVs for the total community in each depth layer (A) and the number of ASVs that are shared amongst depth layers (B).
Supplementary Figure 5 | Assembly patterns for the non-microbial metazoan community through the water column based derived from the Stegen framework [7, 43].
Supplementary Figure 6 | Assembly patterns for the eukaryotic community through the water column based on the Stegen framework [7, 43].
Supplementary Figure 7 | Assembly patterns for the non-microbial metazoan community along a latitudinal gradient based derived from the Stegen framework [7, 43]. NDP = No dominant process.
Supplementary Figure 8 | Assembly patterns for the eukaryotic community along a latitudinal gradient based on the Stegen framework [7, 43].
Supplementary Figure 9 | Composition of the top 10 microbial families in (A) SR3 and SR4 during the winters of 2015 and 2016 and (B) the winter 2015 and summer 2016.
Supplementary Table 1 | Metadata for the samples.
Supplementary Table 2 | Assembly patterns for the eukaryotic community through the water column based derived from the Stegen framework [7, 43].
Supplementary Table 3 | Assembly patterns for the eukaryotic community along a latitudinal gradient based derived from the Stegen framework [7, 43].
Supplementary Table 4 | Assembly patterns for the eukaryotic community temporally based derived from the Stegen framework [7, 43].
References
Allen R., Hoffmann L. J., Larcombe M. J., Louisson Z., Summerfield T. C. (2020). Homogeneous environmental selection dominates microbial community assembly in the oligotrophic South Pacific Gyre. Mol. Ecol. 29, 4680–4691. doi: 10.1111/mec.15651
Al-Najjar T. H., El-Sherbiny M. M. (2008). Spatial and seasonal variations in biomass and size structure of zooplankton in coastal waters of the Gulf of Aqaba. Jordan J. Biol. Sci. 1, 55–59.
Anderson M. J. (2017). “Permutational multivariate analysis of variance (PERMANOVA),” in Wiley statsRef: statistics reference online (American Cancer Society), 1–15.
Asfahani K., Krokos G., Papadopoulos V. P., Jones B. H., Sofianos S., Kheireddine M., et al. (2020). Capturing a mode of intermediate water formation in the red sea. J. Geophys. Res. Oceans 125, e2019JC015803. doi: 10.1029/2019JC015803
Bodenhofer U., Bonatesta E., Horejš-Kainrath C., Hochreiter S. (2015). msa: an R package for multiple sequence alignment. Bioinforma. Oxf. Engl. 31, 3997–3999. doi: 10.1093/bioinformatics/btv494
Callahan B. J., McMurdie P. J., Rosen M. J., Han A. W., Johnson A. J. A., Holmes S. P. (2016). DADA2: high-resolution sample inference from Illumina amplicon data. Nat. Methods 13, 581–583. doi: 10.1038/nmeth.3869
Camus T., Rolla L., Jiang J., Zeng C. (2021). Effects of microalgal food quantity on several productivity-related parameters of the calanoid copepod Bestiolina similis (Calanoida: Paracalanidae). Front. Mar. Sci. 8. doi: 10.3389/fmars.2021.812240
Canals O., Obiol A., Muhovic I., Vaqué D., Massana R. (2020). Ciliate diversity and distribution across horizontal and vertical scales in the open ocean. Mol. Ecol. 29, 2824–2839. doi: 10.1111/mec.15528
Chase J. M. (2010). Stochastic community assembly causes higher biodiversity in more productive environments. Science 328, 1388–1391. doi: 10.1126/science.1187820
Chase J. M., Myers J. A. (2011). Disentangling the importance of ecological niches from stochastic processes across scales. Philos. Trans. R. Soc Lond. B Biol. Sci. 366, 2351–2363. doi: 10.1098/rstb.2011.0063
Choi D. H., An S. M., Chun S., Yang E. C., Selph K. E., Lee C. M., et al. (2016). Dynamic changes in the composition of photosynthetic picoeukaryotes in the northwestern Pacific Ocean revealed by high-throughput tag sequencing of plastid 16S rRNA genes. FEMS Microbiol. Ecol. 92. doi: 10.1093/femsec/fiv170
Churchill J. H., Bower A. S., McCorkle D. C., Abualnaja Y. (2014). The transport of nutrient-rich Indian Ocean water through the Red Sea and into coastal reef systems. J. Mar. Res. 72, 165–181. doi: 10.1357/002224014814901994
Cordier T., Angeles I. B., Henry N., Lejzerowicz F., Berney C., Morard R., et al. (2022). Patterns of eukaryotic diversity from the surface to the deep-ocean sediment. Sci. Adv. 8, eabj9309. doi: 10.1126/sciadv.abj9309
de Vargas C., Audic S., Henry N., Decelle J., Mahe F., Logares R., et al. (2015). Eukaryotic plankton diversity in the sunlit ocean. Science 348, 6237. doi: 10.1126/science.1261605
Duret M. T., Lampitt R. S., Lam P. (2020). Eukaryotic influence on the oceanic biological carbon pump in the Scotia Sea as revealed by 18S rRNA gene sequencing of suspended and sinking particles. Limnol. Oceanogr. 65, S49–S70. doi: 10.1002/lno.11319
Fine P. V., Kembel S. W. (2011). Phylogenetic community structure and phylogenetic turnover across space and edaphic gradients in western Amazonian tree communities. Ecography 34, 552–565. doi: 10.1111/j.1600-0587.2010.06548.x
Giner C. R., Pernice M. C., Balagué V., Duarte C. M., Gasol J. M., Logares R., et al. (2020). Marked changes in diversity and relative activity of picoeukaryotes with depth in the world ocean. ISME J. 14, 437–449. doi: 10.1038/s41396-019-0506-9
Guillou L., Bachar D., Audic S., Bass D., Berney C., Bittner L., et al. (2013). The Protist Ribosomal Reference database (PR2): a catalog of unicellular eukaryote Small Sub-Unit rRNA sequences with curated taxonomy. Nucleic Acids Res. 41, D597–D604. doi: 10.1093/nar/gks1160
Guillou L., Viprey M., Chambouvet A., Welsh R. M., Kirkham A. R., Massana R., et al. (2008). Widespread occurrence and genetic diversity of marine parasitoids belonging to Syndiniales (Alveolata). Environ. Microbiol. 10, 3349–3365. doi: 10.1111/j.1462-2920.2008.01731.x
Hardoim C. C. P., Lôbo-Hajdu G., Custódio M. R., Hardoim P. R. (2021). Prokaryotic, fungal, and unicellular eukaryotic core communities across three sympatric marine sponges from the southwestern Atlantic Coast are dominated largely by deterministic assemblage processes. Front. Microbiol. 12. doi: 10.3389/fmicb.2021.674004
Hartmann M., Grob C., Tarran G. A., Martin A. P., Burkill P. H., Scanlan D. J., et al. (2012). Mixotrophic basis of Atlantic oligotrophic ecosystems. PNAS 109, 5756–5760. doi: 10.1073/pnas.1118179109
Hoegh-Guldberg O., Bruno J. F. (2010). The impact of climate change on the world’s marine ecosystems. Science 328, 1523–1528. doi: 10.1126/science.1189930
Horikoshi M., Tang Y., Dickey A., Grenié M., Thompson R., Selzer L., et al. (2022). ggfortify: data visualization tools for statistical analysis results.
Karnauskas K. B., Jones B. H. (2018). The interannual variability of sea surface temperature in the Red Sea from 35 years of satellite and in situ observations. J. Geophys. Res. Oceans 123, 5824–5841. doi: 10.1029/2017JC013320
Kembel S. W., Cowan P. D., Helmus M. R., Cornwell W. K., Morlon H., Ackerly D. D., et al. (2010). Picante: R tools for integrating phylogenies and ecology. Bioinformatics 26, 1463–1464. doi: 10.1093/bioinformatics/btq166
Kheireddine M., Dall’Olmo G., Ouhssain M., Krokos G., Claustre H., Schmechtig C., et al. (2020). Organic carbon export and loss rates in the Red Sea. Glob. Biogeochem. Cycles 34, e2020GB006650. doi: 10.1029/2020GB006650
Kheireddine M., Ouhssain M., Claustre H., Uitz J., Gentili B., Jones B. H. (2017). Assessing pigment-based phytoplankton community distributions in the Red Sea. Front. Mar. Sci. 4. doi: 10.3389/fmars.2017.00132
Kürten B., Khomayis H. S., Devassy R., Audritz S., Sommer U., Struck U., et al. (2014). Ecohydrographic constraints on biodiversity and distribution of phytoplankton and zooplankton in coral reefs of the Red Sea, Saudi Arabia. Mar. Ecol. 36, 1195–1214. doi: 10.1111/maec.12224
Li H., Liu L., Wang Y., Cai L., He M., Wang L., et al. (2021). T4-like myovirus community shaped by dispersal and deterministic processes in the South China Sea. Environ. Microbiol. 23, 1038–1052. doi: 10.1111/1462-2920.15290
Liu Y., Hu Z., Deng Y., Shang L., Gobler C. J., Tang Y. Z. (2021). Dependence of genome size and copy number of rRNA gene on cell volume in dinoflagellates. Harmful Algae 109, 102108. doi: 10.1016/j.hal.2021.102108
Liu J., Zhu S., Liu X., Yao P., Ge T., Zhang X.-H. (2020). Spatiotemporal dynamics of the archaeal community in coastal sediments: assembly process and co-occurrence relationship. ISME J. 14, 1463–1478. doi: 10.1038/s41396-020-0621-7
Martin M. (2011). Cutadapt removes adapter sequences from high-throughput sequencing reads. EMBnet.journal 17, 10–12. doi: 10.14806/ej.17.1.200
McMurdie P. J., Holmes S. (2013). phyloseq: An R package for reproducible interactive analysis and graphics of microbiome census data. PloS One 8, e61217. doi: 10.1371/journal.pone.0061217
Monier A., Worden A. Z., Richards T. A. (2016). Phylogenetic diversity and biogeography of the Mamiellophyceae lineage of eukaryotic phytoplankton across the oceans. Environ. Microbiol. Rep. 8, 461–469. doi: 10.1111/1758-2229.12390
Murray S. P., Johns W. (1997). Direct observations of seasonal exchange through the Bab el Mandab Strait. Geophys. Res. Lett. 24 (21), 2557–2560. doi: 10.1029/97GL02741
Ning D., Yuan M., Wu L., Zhang Y., Guo X., Zhou X., et al. (2020). A quantitative framework reveals ecological drivers of grassland microbial community assembly in response to warming. Nat. Commun. 11, 4717. doi: 10.1038/s41467-020-18560-z
Not F., Gausling R., Azam F., Heidelberg J. F., Worden A. Z. (2007). Vertical distribution of picoeukaryotic diversity in the Sargasso Sea. Environ. Microbiol. 9, 1233–1252. doi: 10.1111/j.1462-2920.2007.01247.x
Oksanen J., Kindt R., Legendre P., O’Hara B., Stevens M. H. H., Oksanen M. J., et al. (2007). The vegan package. Community Ecol. Package 10, 631–637.
Papadopoulos V. P., Zhan P., Sofianos S. S., Raitsos D., Qurban M., Abualnaja Y., et al. (2015). Factors governing the deep ventilation of the Red Sea. J. Geophys. Res. Oceans 120, 7493–7505. doi: 10.1002/2015JC010996
Patzert W. C. (1974). Wind-induced reversal in Red Sea circulation. Deep Sea Res. Oceanogr. Abstr. 21, 109–121. doi: 10.1016/0011-7471(74)90068-0
Pearman J. K., Aylagas E., Voolstra C. R., Anlauf H., Villalobos R., Carvalho S. (2019). Disentangling the complex microbial community of coral reefs using standardized Autonomous Reef Monitoring Structures (ARMS). Mol. Ecol. 28, 3496–3507. doi: 10.1111/mec.15167
Pearman J. K., Ellis J., Irigoien X., Sarma Y. V. B., Jones B. H., Carvalho S. (2017). Microbial planktonic communities in the Red Sea: high levels of spatial and temporal variability shaped by nutrient availability and turbulence. Sci. Rep. 7, 6611. doi: 10.1038/s41598-017-06928-z
Pearman J. K., Irigoien X. (2015). Assessment of zooplankton community composition along a depth profile in the central Red Sea. PloS One 10. doi: 10.1371/journal.pone.0133487
Pearman J. K., Kurten S., Sarma Y. V. B., Jones B., Carvalho S. (2016). Biodiversity patterns of plankton assemblages at the extremes of the Red Sea. FEMS Microbiol. Ecol. 92. doi: 10.1093/femsec/fiw002
R Core Team (2022). R: A language and environment for statistical computing (Vienna, Austria: R Foundation for Statistical Computing).
Schliep K. P. (2011). phangorn: phylogenetic analysis in R. Bioinforma. Oxf. Engl. 27, 592–593. doi: 10.1093/bioinformatics/btq706
Skouroliakou D.-I., Breton E., Irion S., Artigas L. F., Christaki U. (2022). Stochastic and deterministic processes regulate phytoplankton assemblages in a temperate coastal ecosystem. Microbiol. Spectr. 0, e02427–e02422. doi: 10.1128/spectrum.02427-22
Sloan W. T., Lunn M., Woodcock S., Head I. M., Nee S., Curtis T. P. (2006). Quantifying the roles of immigration and chance in shaping prokaryote community structure. Environ. Microbiol. 8, 732–740. doi: 10.1111/j.1462-2920.2005.00956.x
Sofianos S. S., Johns W. E. (2002). An oceanic general circulation model (OGCM) investigation of the Red Sea circulation, 1. Exchange between the Red Sea and the Indian Ocean. J. Geophys. Res. Oceans 107, 17–1. doi: 10.1029/2001JC001184
Sofianos S. S., Johns W. E. (2007). Observations of the summer Red Sea circulation. J. Geophys. Res. Oceans 112. doi: 10.1029/2006JC003886
Sofianos S., Johns W. E. (2015). “Water mass formation, overturning circulation, and the exchange of the Red Sea with the adjacent basins,” in The Red Sea: The formation, morphology, oceanography and environment of a young ocean basin. Eds. Rasul N. M. A., Stewart I. C. F. (Berlin: Springer).
Stegen J. C., Lin X., Fredrickson J. K., Chen X., Kennedy D. W., Murray C. J., et al. (2013). Quantifying community assembly processes and identifying features that impose them. ISME J. 7, 2069. doi: 10.1038/ismej.2013.93
Stegen J. C., Lin X., Fredrickson J. K., Konopka A. E. (2015). Estimating and mapping ecological processes influencing microbial community assembly. Front. Microbiol. 6, 370. doi: 10.3389/fmicb.2015.00370
Stegen J. C., Lin X., Konopka A. E., Fredrickson J. K. (2012). Stochastic and deterministic assembly processes in subsurface microbial communities. ISME J. 6, 1653. doi: 10.1038/ismej.2012.22
Stoeck T., Bass D., Nebel M., Christen R., Jones M. D., Breiner H. W., et al. (2010). Multiple marker parallel tag environmental DNA sequencing reveals a highly complex eukaryotic community in marine anoxic water. Mol. Ecol. 19 Suppl 1, 21–31. doi: 10.1111/j.1365-294X.2009.04480.x
Touliabah H. E., Abu El-Kheir W. S., Kuchari M. G., Abdulwassi N. I. H. (2010). Phytoplankton composition at Jeddah coast–Red Sea, Saudi Arabia in relation to some ecological factors. JKAU Sci. 22, 115–131. doi: 10.4197/Sci.22-1.9
Tragou E., Garrett C., Outerbridge R., Gilman C. (1999). The heat and freshwater budgets of the Red Sea. J. Phys. Oceanogr. 29, 2504–2522. doi: 10.1175/1520-0485(1999)029<2504:THAFBO>2.0.CO;2
Unrein F., Massana R., Alonso-Saez L., Gasol J. M. (2007). Significant year-round effect of small mixotrophic flagellates on bacterioplankton in an oligotrophic coastal system. Limnol. Oceanogr. 52, 456–469. doi: 10.4319/lo.2007.52.1.0456
Vellend M. (2010). Conceptual synthesis in community ecology. Q. Rev. Biol. 85, 183–206. doi: 10.1086/652373
Villarino E., Watson J. R., Chust G., Woodill A. J., Klempay B., Jonsson B., et al. (2022). Global beta diversity patterns of microbial communities in the surface and deep ocean. Glob. Ecol. Biogeogr. 31, 2323–2336. doi: 10.1111/geb.13572
Villarino E., Watson J. R., Jönsson B., Gasol J. M., Salazar G., Acinas S. G., et al. (2018). Large-scale ocean connectivity and planktonic body size. Nat. Commun. 9, 142. doi: 10.1038/s41467-017-02535-8
Wafar M., Qurban M. A., Ashraf M., Manikandan K. P., Flandez A. V., Balala A. C. (2016). Patterns of distribution of inorganic nutrients in Red Sea and their implications to primary production. J. Mar. Syst. 156, 86–98. doi: 10.1016/j.jmarsys.2015.12.003
Wang Q., Garrity G. M., Tiedje J. M., Cole J. R. (2007). Naive Bayesian classifier for rapid assignment of rRNA sequences into the new bacterial taxonomy. Appl. Environ. Microbiol. 73, 5261–5267. doi: 10.1128/AEM.00062-07
Wu W., Logares R., Huang B., Hsieh C. (2017). Abundant and rare picoeukaryotic sub-communities present contrasting patterns in the epipelagic waters of marginal seas in the northwestern Pacific Ocean. Environ. Microbiol. 19, 287–300. doi: 10.1111/1462-2920.13606
Wu W., Lu H.-P., Sastri A., Yeh Y.-C., Gong G.-C., Chou W.-C., et al. (2018). Contrasting the relative importance of species sorting and dispersal limitation in shaping marine bacterial versus protist communities. ISME J. 12, 485–494. doi: 10.1038/ismej.2017.183
Xu Z., Wang M., Wu W., Li Y., Liu Q., Han Y., et al. (2018). Vertical distribution of microbial eukaryotes from surface to the hadal zone of the Mariana Trench. Front. Microbiol. 9. doi: 10.3389/fmicb.2018.02023
Yao F., Hoteit I., Pratt L. J., Bower A. S., Zhai P., Köhl A., et al. (2014). Seasonal overturning circulation in the Red Sea: 1. Model. validation summer circulation. J. Geophys. Res. Oceans 119, 2238–2262. doi: 10.1002/2013JC009004
Zhao F., Filker S., Xu K., Huang P., Zheng S. (2017). Patterns and drivers of vertical distribution of the ciliate community from the surface to the abyssopelagic zone in the western Pacific Ocean. Front. Microbiol. 8. doi: 10.3389/fmicb.2017.02559
Keywords: eukaryotes, 18S rRNA, Assembly processes, deterministic, stochastic
Citation: Pearman JK, Jones B, Qashqari M and Carvalho S (2024) Eukaryotic diversity patterns in the Red Sea: from the surface to the deep. Front. Mar. Sci. 10:1295997. doi: 10.3389/fmars.2023.1295997
Received: 17 September 2023; Accepted: 18 December 2023;
Published: 08 January 2024.
Edited by:
Leocadio Blanco-Bercial, Bermuda Institute of Ocean Sciences, BermudaReviewed by:
Savvas Genitsaris, National and Kapodistrian University of Athens, GreeceXuelei Zhang, Ministry of Natural Resources, China
Copyright © 2024 Pearman, Jones, Qashqari and Carvalho. This is an open-access article distributed under the terms of the Creative Commons Attribution License (CC BY). The use, distribution or reproduction in other forums is permitted, provided the original author(s) and the copyright owner(s) are credited and that the original publication in this journal is cited, in accordance with accepted academic practice. No use, distribution or reproduction is permitted which does not comply with these terms.
*Correspondence: Susana Carvalho, Susana.carvalho@kaust.edu.sa