Metazoan diversity and community assemblages in sediments across a Western Pacific Trench-Arc-Basin system: insights from eDNA metabarcoding
 Jing Mo
 Xinlong Li
 Anning Mou1
  Ping Gao
 Xuelei Zhang
 Qinzeng Xu
- 1Key Laboratory of Marine Eco-Environmental Science and Technology, First Institute of Oceanography, Ministry of Natural Resources, Qingdao, China
- 2Laboratory for Marine Ecology and Environmental Science, Laoshan Laboratory, Qingdao, China
- 3National Engineering Laboratory for Integrated Aero-Space-Ground-Ocean Big Data Application Technology, Xi’an, China
Trench-arc-basin (TAB) systems are widely distributed in the deep sea, yet our understanding of their biodiversity patterns and community assemblages remains limited. In this study, we collected sediment samples from 22 stations across a Western Pacific TAB system and identified 85 families of marine benthos from 15 phyla by using eDNA metabarcoding with the 18S rRNA gene V4 region. Nematodes were the most dominant metazoan taxa followed by echinoderms, arthropods, and annelids. The highest biodiversity and species specificity were observed at stations located near seamounts. The community assemblages were highly heterogeneous in this TAB system, likely induced by the large geographic barriers and the high habitat heterogeneity. Furthermore, the total organic carbon content and median grain size of the sediment drive the overall community composition, and the water depth exerts a significant influence on species richness and abundance. Our results provide insight into benthos diversity and distribution across a TAB system and data for further comparisons and modeling studies.
1 Introduction
The deep sea, as the largest biome on Earth, hosts rich biodiversity and vast mineral resources, while also performing a range of crucial ecosystem functions (Ramirez-Llodra et al., 2010). Yet, this vast realm is facing significant threats from climate change, such as global warming and ocean acidification, as well as human activities including fisheries, mining, and pollution (Armstrong et al., 2019). As such, it is urgent to collect baseline data and monitor deep-sea biodiversity, for effective assessment and conservation of deep-sea ecosystems.
Deep-sea plains are punctuated with many geological structures, including canyons, ridges, seamounts, trenches, arcs, and back-arc basins (Ramirez-Llodra et al., 2010), which can introduce habitat heterogeneity and therefore support more diverse community structures (Lacey et al., 2016). Among them, the trenches, arcs, and back-arc basins are interconnected through ongoing geological activity (e.g., plate collisions and extrusions), and together they form a system (Mantovani et al., 2002). Research on the biodiversity patterns of trenches has continued over the past two decades, but the results remain controversial (Jamieson et al., 2010). Lacey et al. (2016) and Liu et al. (2022) found a lower level of benthic diversity in trenches compared to adjacent areas, which may result from low food availability in trenches. In contrast, other studies have shown an increase in the number of endemic species and some taxa abundance and richness from abyssal to hadal depth, despite the limited knowledge of the driving forces behind this pattern (Kitahashi et al., 2013; Schmidt et al., 2019). Overall, the community composition, diversity, biomass, and density of the trench often differ from those in the surrounding abyssal areas (Jamieson, 2015). In contrast to trenches, studies of biodiversity patterns in arcs, back-arc basins, or continuous trench-arc-basin (TAB) systems are very limited.
TAB systems are characterized by intricate terrains and geological features, coupled with substantial water depth fluctuations, which likely contribute to highly heterogeneous community compositions (Ashford et al., 2019). In addition, the large geographical barriers (e.g., arc and trench) in TAB systems may affect larval dispersal and reduce population connectivity (Stewart and Jamieson, 2018). For example, Brandt et al. (2020) compared the community assemblages of the Kuril Kamchatka Trench (KKT) with that of the adjacent basin/island and found that the KKT has an isolating effect on benthic species of its sides. The tropical Western Pacific area hosts the most well-developed TAB systems (Xu, 2021). Our study area is located at the triple junction between the Philippine Sea Plate, the Pacific Plate, and the Caroline Plate, experiencing particularly complex plate movements (Zhang and Zhang, 2020). This region encompasses several large geomorphic units, including Parece Vela Basin, Yap Arc, and Yap Trench, which make up a typical TAB system (Kobayashi, 2004).
Deep-sea biodiversity surveys pose great challenges owing to the remoteness, extreme environment, limited sampling techniques, and high numbers of unknown invertebrates (Danovaro et al., 2014; Laroche et al., 2020a). Traditional morphological taxonomy, although valuable, has limitations such as being time-consuming, invasive, taxa-specific, and difficult to identify larvae (Laroche et al., 2020a; Liu et al., 2022; Wee et al., 2023). However, the advancements in next-generation sequencing (NGS) technologies have gradually made molecular taxonomy a feasible auxiliary approach to morphological taxonomy (Pawlowski et al., 2021). Environmental DNA (eDNA) metabarcoding based on NGS is a novel approach to surveying marine biodiversity (Goodwin et al., 2017; Shi et al., 2021). Many recent studies used this method to characterize benthic communities in deep-sea sediments, producing valuable findings. For instance, Laroche et al. (2020a) discovered limited shared species between seamount and plain fauna in the Clarion Clipperton Zone (CCZ) and suggested that the conservation of seamount assemblages would be insufficient to safeguard biodiversity and ecosystem function in areas selected for mining. These studies all revealed that eDNA metabarcoding is a powerful tool for understanding benthic biodiversity and community assemblages in the deep sea (Guardiola et al., 2016; Sinniger et al., 2016; Laroche et al., 2020b; Steyaert et al., 2020; Schoenle et al., 2021; Liu et al., 2022).
In this study, we used an eDNA metabarcoding method to detect the metazoan benthic communities across a TAB system in the Western Pacific Ocean. The present study aims to 1) explore the characteristics of diversity and taxa distribution, 2) validate the high heterogeneity of community composition, and 3) analyze the drivers of community structure, in this TAB system. This study could serve as a foundation for future large-scale modeling studies of biodiversity patterns in TAB systems.
2 Materials and methods
2.1 Study sites and sample collection
The sampling was conducted in a continuous trench-arc-basin area located in the Western Pacific (132.57°E-141.17°E; 8.10°N-10.32°N, Figure 1) on board R/V “Xiangyanghong 01” from August to November 2018. A total of 22 sediment cores were sampled by using a box corer (50 cm × 50 cm × 50 cm). The overlying water was carefully siphoned off to avoid disturbing the surface sediment. To collect surface sediment, single-use sterile syringes were inserted vertically into the sediment from the center of the box core, reaching a depth of 2 cm. For each sample, about 20 g of sediment was packaged in a sterile PE bag and then stored at −80°C. All personnel involved in the sampling process wore disposable rubber gloves and masks to avoid contamination. A map of sampling stations was generated using the Ocean Data View (ODV) software.
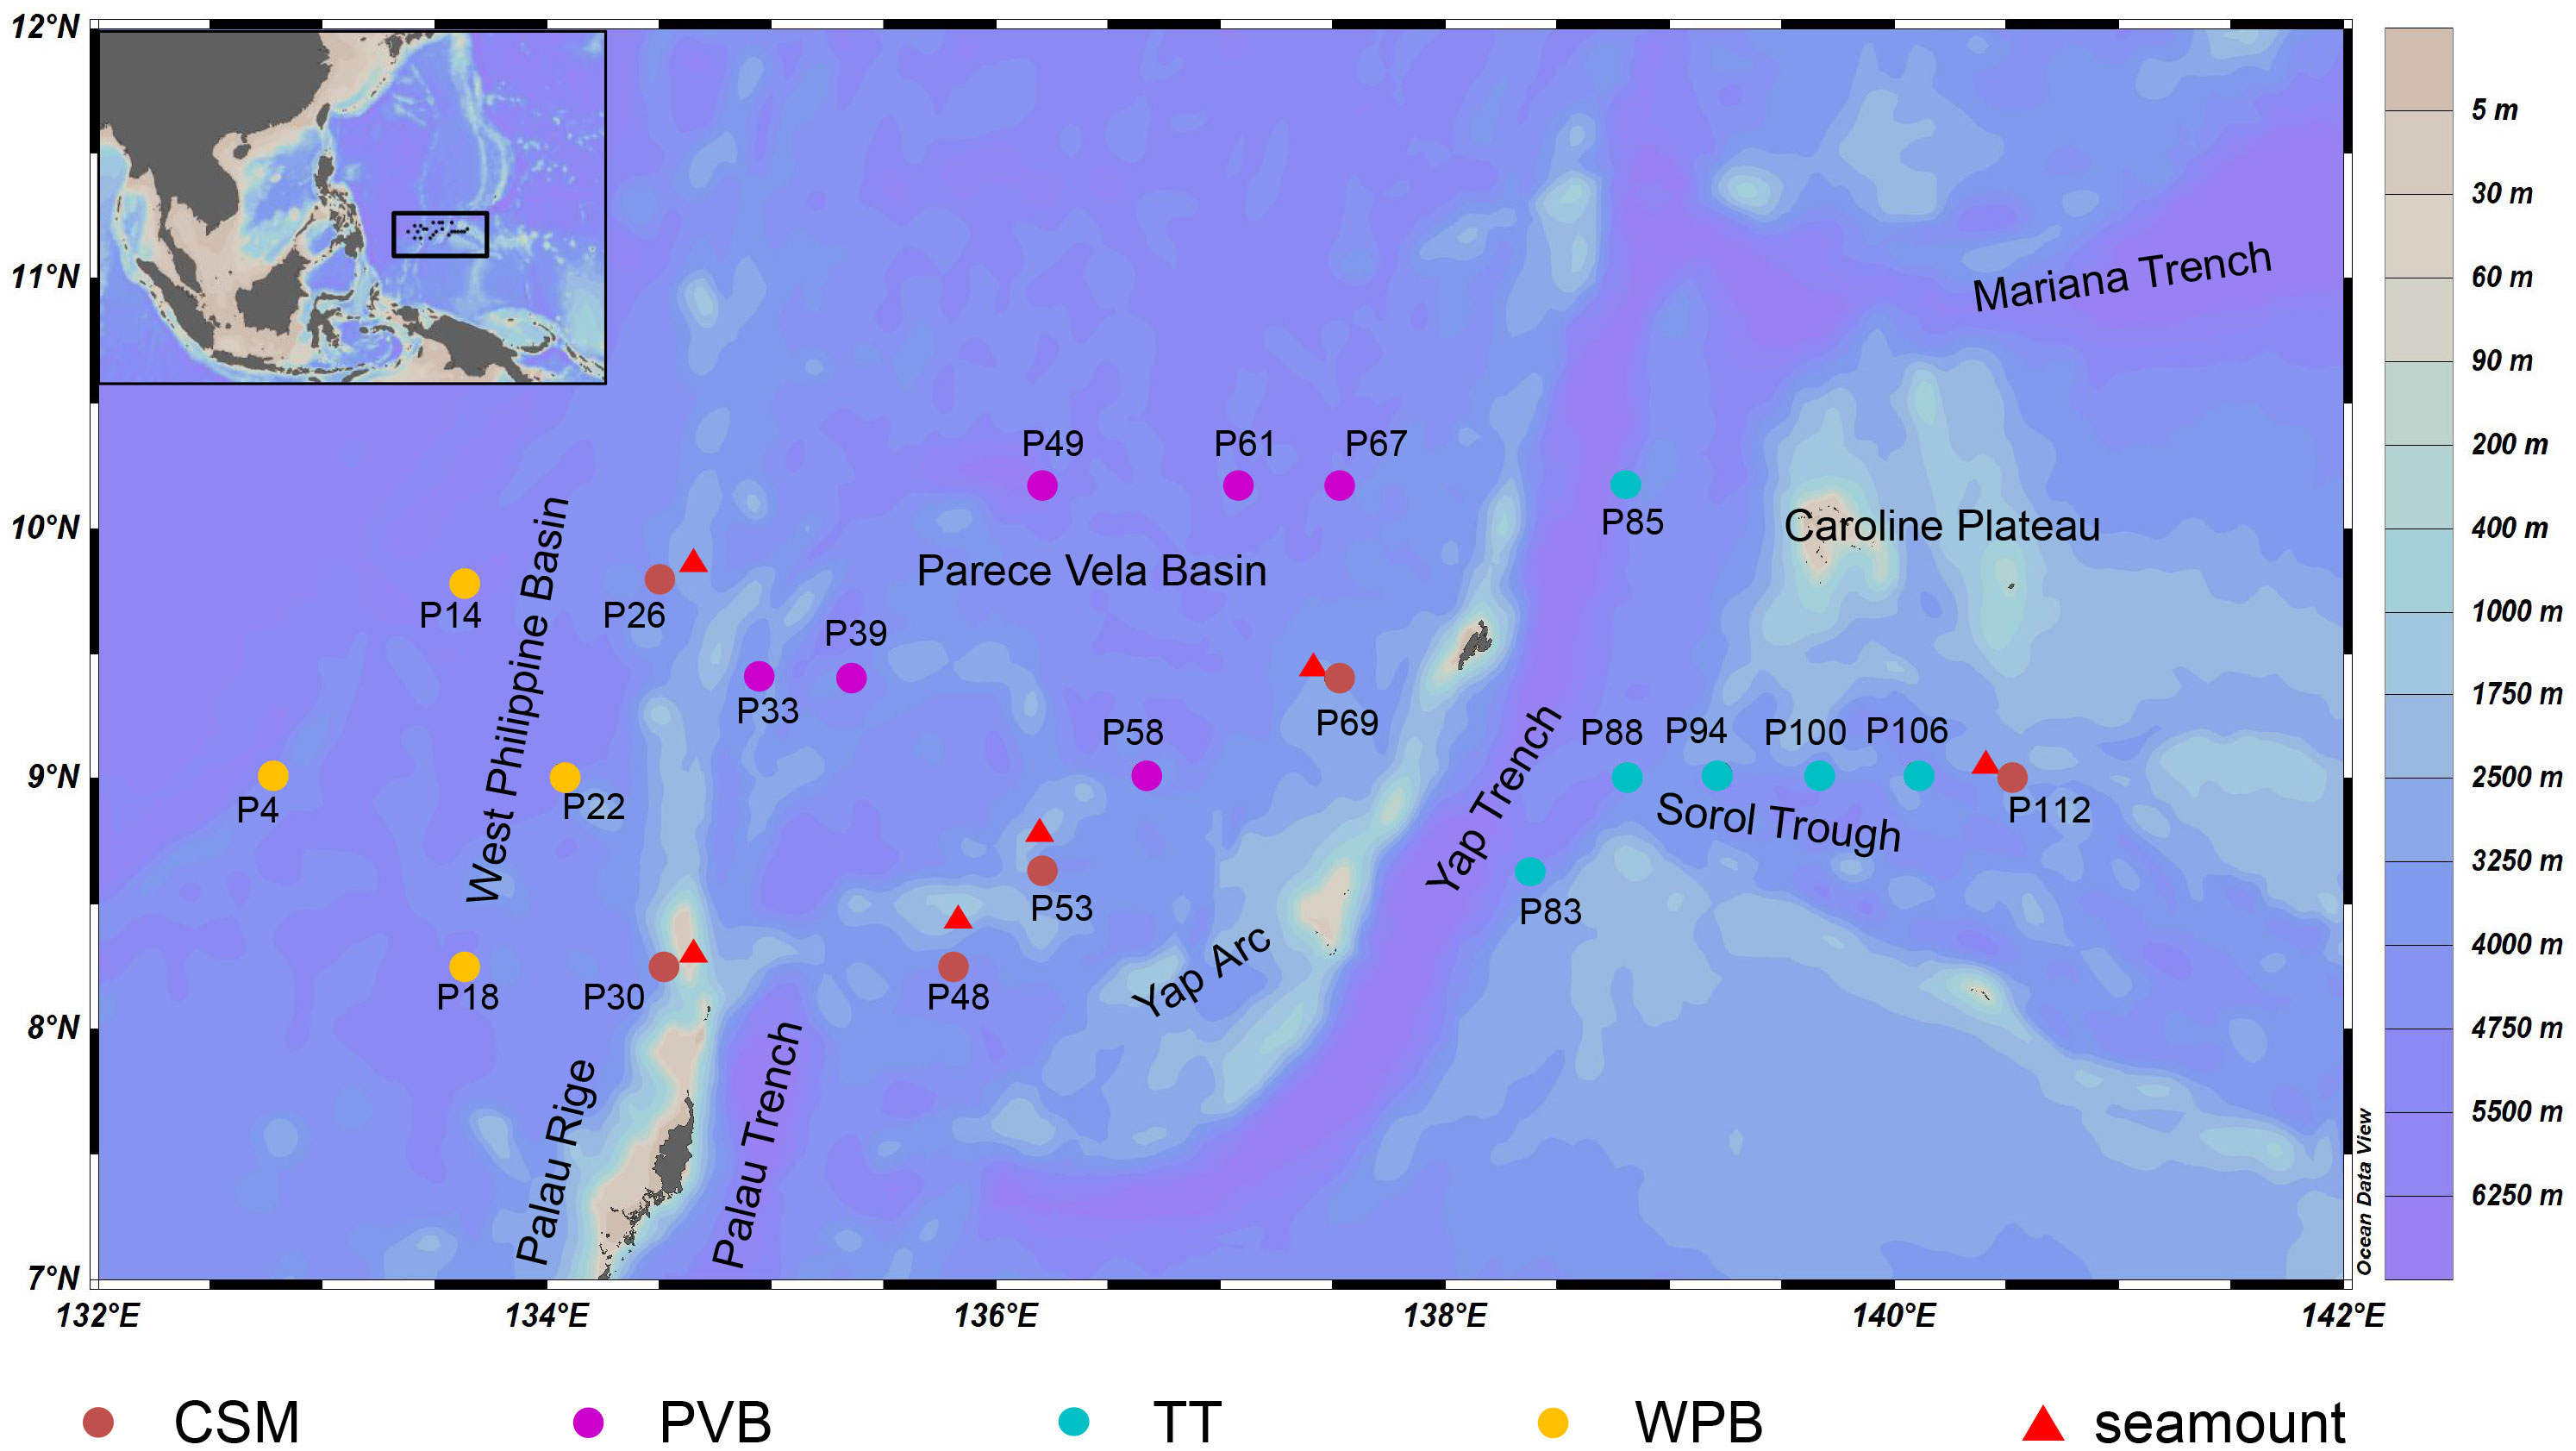
Figure 1 The 22 Sampling stations in the tropical Western Pacific. CSM, close to seamounts; PVB, in Parece Vela Basin; TT, in the edges of trench or trough; WPB, in West Philippine Basin.
2.2 Measurement of environmental factors
The total nitrogen (TN), total carbon (TC), and total organic carbon (TOC) contents were determined using VarioEL III elemental analyzer (Elementar, Germany). The samples were first freeze-dried, ground, and sieved through a 75 µm mesh. After drying for 2 hours at a temperature below 60°C, approximately 40-80 mg sample was directly transferred to the analyzer to measure the content of TC and TN. For TOC content, a 1 g powder sample was ultrasonicated with 2 mL hydrochloric acid (1 mol/L) for 3 hours to eliminate inorganic carbon. After drying, a mass of 40-80 mg of the powder was wrapped in a tin boat and analyzed by CN mode.
To determine the grain size, the sediment sample was dried and sieved using a 2 mm mesh sieve. The sediment retained on the sieve was weighed and analyzed by a laser particle size analyzer - Mastersizer 3000 (Malvern, United Kingdom), which could detect fractions between 2 and 2000 µm. The median value of the grain size was taken as the sediment median diameter (Md). Based on grain size, sediments were categorized as clay (< 4 micrometre), silt (4 - 63 micrometre), or sand (> 63 micrometre) (Ge et al., 2021). The ratio of sand, silt, and clay was then calculated.
2.3 Total DNA extraction and 18S rRNA sequencing
The sediment samples were divided into three replicates (3-5 g per replicate), and eDNA extraction was performed on each replicate to increase the eDNA concentration. The DNeasy Power Soil Kit (Qiagen, Germany) was used to extract eDNA following the manufacturer’s protocol. The yields of three replicates were eluted repeatedly by 30-40 μL eluent and then mixed to total DNA. Afterward, the eDNA extracts were stored at -20°C. An extraction blank (negative control) was included to assess potential contamination during extraction processing.
The V4 hypervariable region of the 18S rRNA gene was amplified using the forward primer EK-NSF573: 5’ CGCGGTAATTCCAGCTCCA3’ and the reverse primer Ek-NSR951: 5’TTGGYRAATGCTTTCGC 3’ (Lepere et al., 2016). The PCR mixture, in a volume of 25 µl, consisted of 30 ng of eDNA template, 12.5 µl of 2 × Taq Plus Master Mix, 3 µl of bovine serum albumin (BSA, 2 ng/µl), 1 µl each of 5 mol/L of primers, and about 7 µl of ddH2O. The negative control, blank control (ddH2O as a template), and normal samples were subjected to PCR amplification under the following conditions: 94°C for 5 min (pre-denaturation), followed by 30 cycles of denaturation at 94°C for 30 s, annealing at 50°C for 30 s, and an extension at 72°C for 60 s, and final extension at 72°C for 7 min. The PCR products were evaluated using 2% agarose gel electrophoresis, ensuring that negative and blank controls did not show any bands in the gel image. Subsequently, PCR products were purified using AxyPrep DNA Gel Recovery Kit (AXYGEN, America) and eluted by Tris-HCl elution (0.05 M, pH=6.8). To verify the quality of the purified PCR products, 2% agarose gel electrophoresis was performed again. Finally, the qualified PCR products were sequenced using an Illumina MiSeq sequencer to produce 300 bp paired-end reads by Allwegene Technology (Beijing, China). After sequencing, the raw paired-end sequences were submitted to the National Center for Biotechnology (NCBI) GenBank (BioProject: RJNA663734, BioSample number: SAMN17010720-17010742l). All experimental procedures of 22 samples were conducted in the same batch to minimize errors.
2.4 Data filtration and operational taxonomic units clustering
Trimmomatic (v0.36, Bolger et al., 2014) was used to filter out the raw paired-end sequences with an average quality score below 20 or with a length below 120 bp. Paired-end reads were then merged using Flash (v1.2.0, Magoc and Salzberg, 2011) with a minimum overlap of 10 bp and a mismatch rate of 0.1. Chimeric sequences were removed using the default settings of the de novo algorithm in UCHIME (Edgar et al., 2011). Clean tags were generated after eliminating short merged sequences (< 200 bp) and then clustered into operational taxonomic units (OTUs) based on 97% similarity (Edgar, 2013) using VSEARCH (v2.7.1, Rognes et al., 2016). The representative sequences of OTUs (the most dominant) were selected and their taxonomic assignments were achieved using the blastn method with an e-value threshold of 1e-5 and query coverage threshold of 90% on the entire GeneBank nucleotide (nt) database (Camacho et al., 2009). We returned the taxonomic information of the best hit sequences to OTUs. To avoid over-annotation, the taxonomic assignments (metazoan OTUs) were manually corrected by employing minimum percent identity values for each taxonomic rank, according to Laroche et al. (2020a). The taxonomic rank thresholds were set at 97, 95, 90, 85, 80, and 75 for species, genus, family, order, class, and phylum levels, respectively. Finally, we check the OTUs’ classification and environmental information one by one on the WoRMS online website (https://www.marinespecies.org/).
2.5 Statistical analysis
We divided the 22 study sites into four habitats according to their large-scale topographic differences (Figure 1). Although WPB and PVB are both basins, their geomorphological features are quite different (Zhang et al., 2020). The sampling information is shown in Table 1.
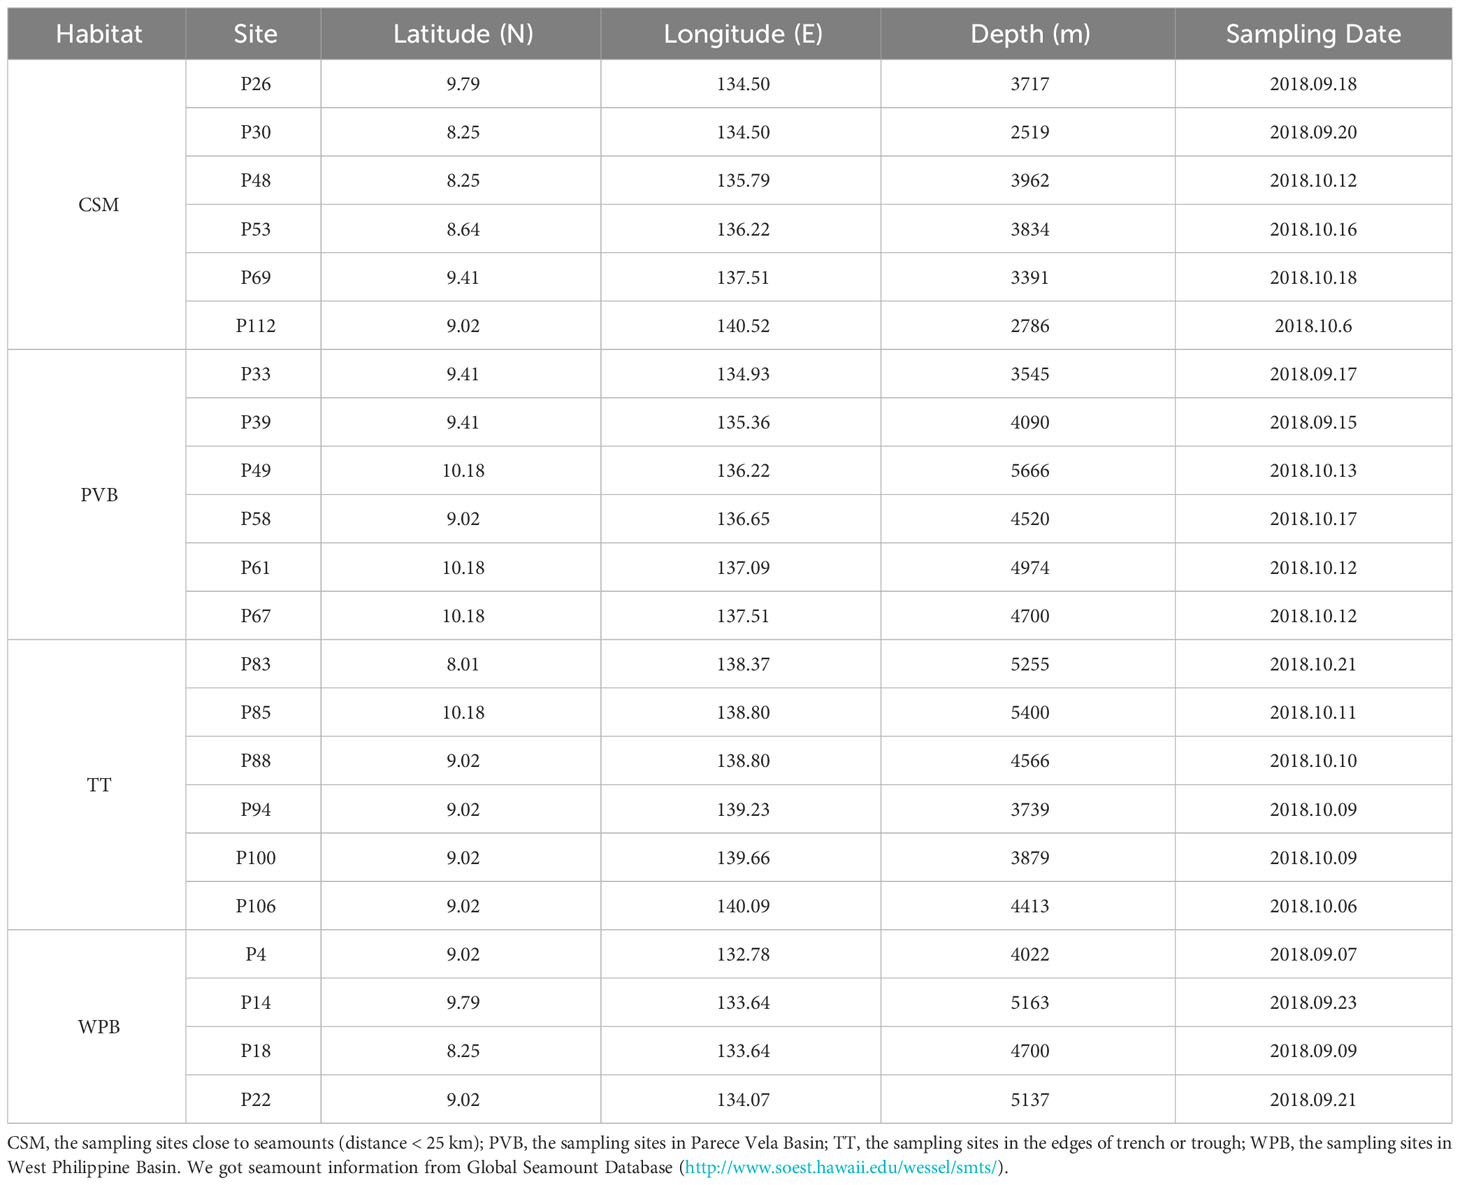
Table 1 Sampling sites information in Western Pacific.
The OTUs dataset was first subsampled down to the size of the smallest sample to minimize bias (subsampled OTUs dataset). OTUs that were unidentified at the kingdom level or assigned to bacteria, fungi, and protist were then removed from the dataset. Two rarefaction plots were generated to investigate the number of recovered OTUs per sample, one based on the subsampled OTUs dataset and the other based on the OTUs specific to metazoan organisms. Four indices of alpha diversity metrics (species richness, Pielou’s evenness, Simpson index, and Shannon index) were calculated based on OTUs level. The α-diversity box plots were constructed using the vegan R package, and the Mann-Whitney U tests were conducted using the Mass R package. The data were normalized as percentages to generate relative abundance diagrams after merging the same phylum/genera. To investigate community biogeography, the OTUs were categorized into four types: widespread (found in all habitats), sub-widespread (found in two or three habitats), habitat-unique (found in two or more than two stations within a single habitat), and station-unique (restricted to a single station). Using presence/absence data, the proportion of taxa in the four biogeographic categories (merged with the same phylum or main family, respectively) was calculated. The community composition and biogeography analyses were visualized using bar plots in Origin (2018).
Beta-diversity analysis was performed using Bray-Curtis distance matrices and visualized through non-metric multidimensional scaling (NMDS) plots within the phyloseq R package (McMurdie and Holmes, 2013). Analysis of similarity (ANOSIM) was performed using PRIMER (v6) to quantify the differences in community composition between the four habitats and test the significance of that difference (Clarke and Gorley, 2006). To mitigate the effect of sparsity OTUs on beta-diversity analysis (Thorsen et al., 2016), NMDS and ANOSIM analyses were conducted using the dominant OTUs (mean of total reads > 10) dataset. After the Z-score normalization of environmental factors data, the principal component analysis (PCA) and the redundancy analysis (RDA) were conducted in CANOCO5 (Braak and Smilauer, 2012). In RDA analysis, forward selection was used to remove some collinearity environmental variables. Pearson correlation analysis was further used to test the significance of the assemblage/environment factors and taxa/taxa correlations in the software IBM SPSS 28.0 (IBM SPSS Inc, New York). In the above analyses, the loge(X+1) transformation of taxa’ abundance data was employed to reduce the skewness (West, 2022).
3 Results
3.1 Environmental factors
The environmental data are shown in Table 2. As this cruise mainly investigated soft sediments, the physicochemical factors stayed within a relatively narrow range. Water depths ranged from 2519 m to 5666 m. The silt content of sediment ranges from 30.0% to 69.1%. The Md and TOC contents varied slightly, ranging from 3.385 μm to 6.989 μm and from 0.16% to 0.43%, respectively.
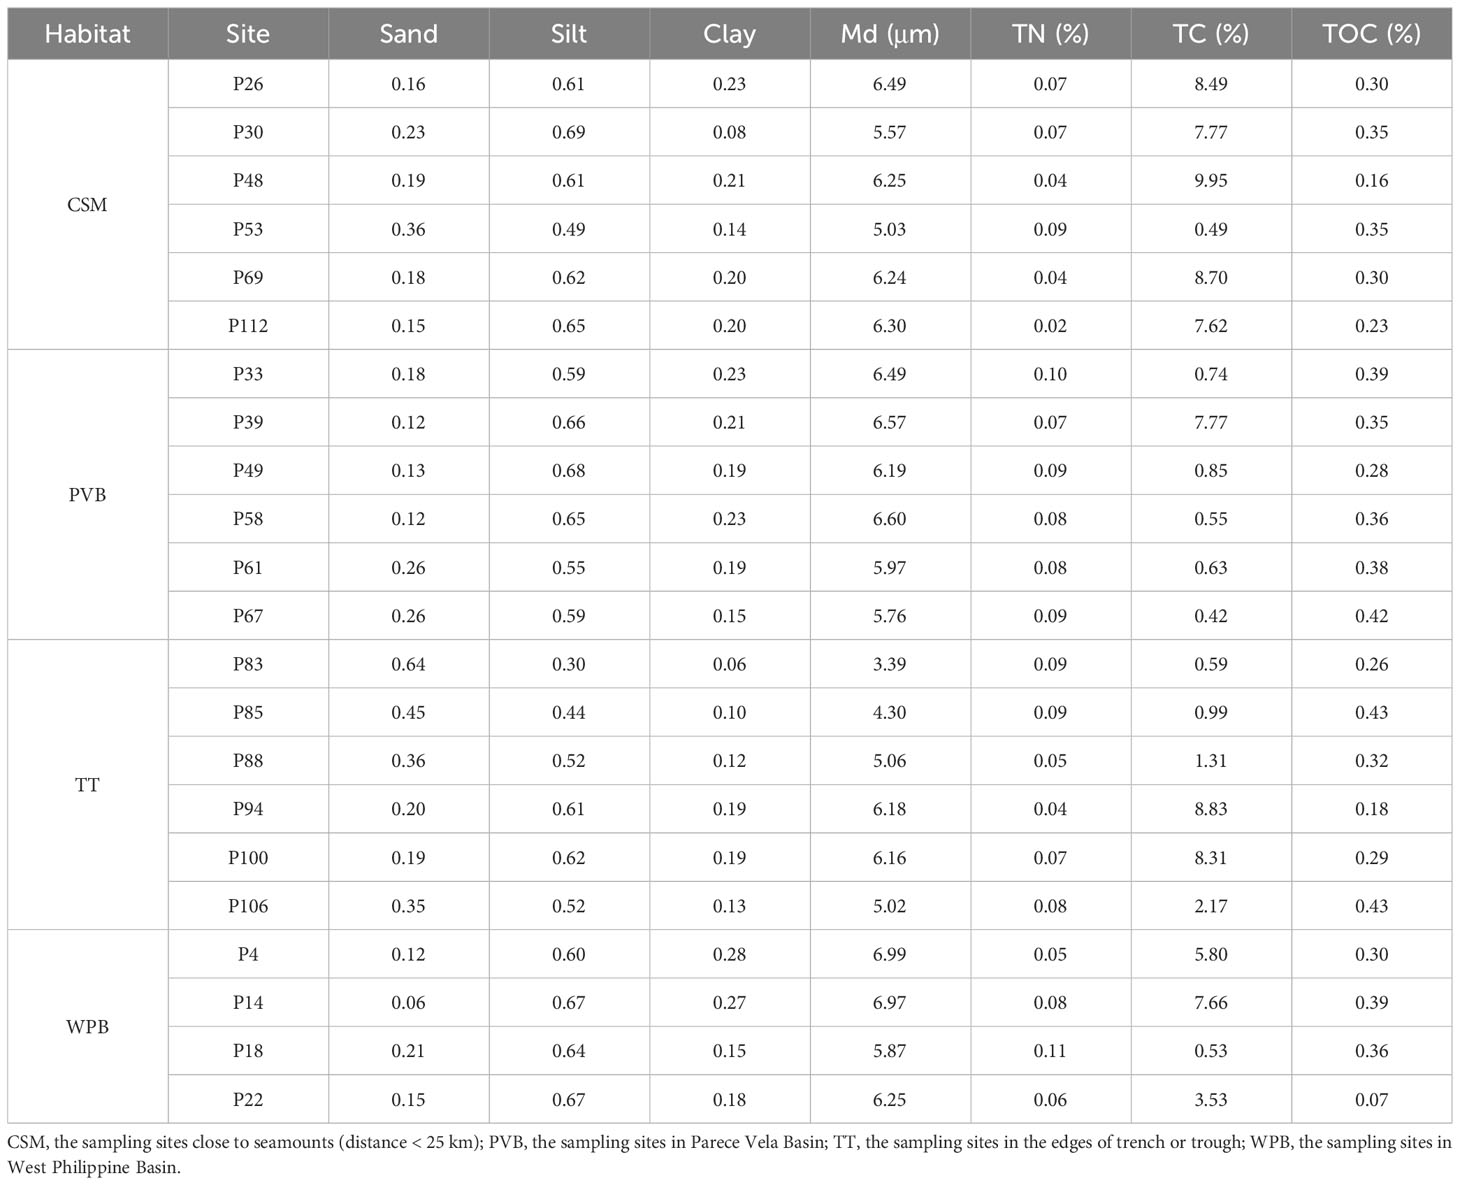
Table 2 Environmental variables of sampling sites in Western Pacific.
The results of PCA show that the sum of two main principal components (PC1 and PC2) accounted for 72.7% of environmental variability (Supplementary Figure S1 and Supplementary Table S1). Sediment factors are the main variables that differentiate the sampling sites on the PC1 axis, including sediment Md (-0.447), the ratio of sand (0.446), silt (-0.411), and clay (-0.386). On the PC2 axis, the most important environmental variables are the percentage of TN (-0.539), TC (0.368), and TOC (-0.364). Overall, the PCA showed no obvious clustering of the four habitats.
3.2 Annotated OTUs and alpha diversity analysis
A total of 1,390,900 clean tags were generated, with a range of 24,166 to 94,402 per sample (Supplementary Table S2), and 81.58% of them have lengths in the range of 320–360 bp (Supplementary Figure S2), indicating good quality. These clean tags were clustered into 5,464 OTUs, which were annotated using the nt database. 1,950 OTUs remained unassigned at the kingdom level and 3264 OTUs were annotated as non-metazoan taxa, which were removed from the dataset. Finally, 250 OTUs are left to make up a dataset for subsequent analysis (Supplementary Information-Data S1, S2). The percent identity between the representative sequences of these OTUs and the hit sequences ranges from 78% to 100%, with a median of 94.28%. Ten out of 250 OTUs whose annotated taxa are shown on WoRMs as being unlikely to inhabit marine environments (Supplementary Information-Data S1). Since the percent identity exceeds 90%, we retain the taxonomy information of these 10 OTUs. The rarefaction curves all reached a plateau, indicating sufficient sequencing depth (Supplementary Figure S3). The numbers of total and exclusive OTUs were counted for each habitat (Figures 2A, B), with CSM having the highest numbers of both (160 and 107, respectively), followed by PVB (79 and 29, respectively), TT (76 and 27, respectively), and WPB (49 and 12, respectively). Some OTUs exhibited wide distribution, with 11 OTUs shared in four habitats (Supplementary Information-Data S2).
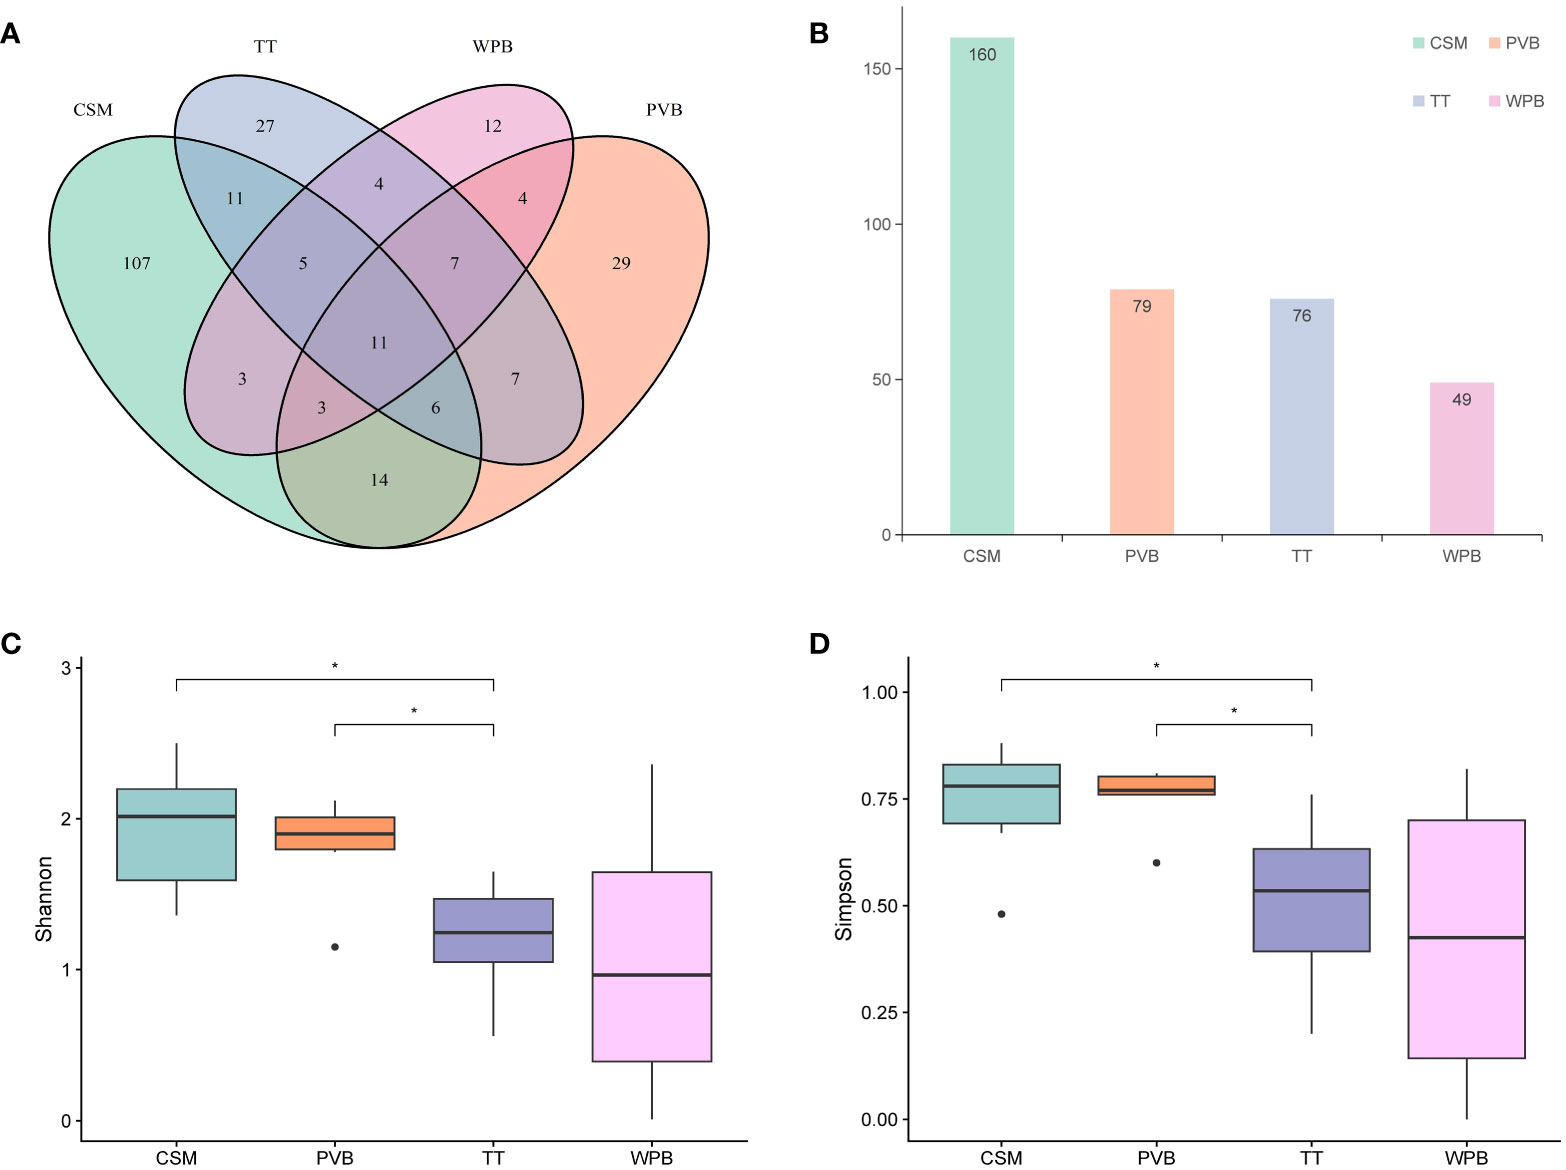
Figure 2 The OTUs count diagram and the Alpha diversity analysis among four habitats in the tropical Western Pacific. (A) Venn diagram (B) Total OTUs histogram (C) Shannon Index (D) Simpson Index. Symbol *p < 0.05, Mann-Whitney U tests. CSM, close to seamounts; PVB, in Parece Vela Basin; TT, in the edges of trench or trough; WPB, in West Philippine Basin.
Alpha diversity analysis showed that the species richness was the highest in the CSM. In contrast, the species richness of WPB was the lowest in the four habitats (Supplementary Table S3). The Shannon and Simpson indices of CSM and PVB were significantly higher than that of TT (Mann-Whitney U tests, p < 0.05, Figures 2C, D). In addition, the Pielou’s evenness of PVB was the highest and that of WPB was the lowest in four habitats (Supplementary Table S3).
3.3 Community composition and biogeography
The identified marine benthos of the 22 surface sediment samples belonged to 85 families from 45 orders, 27 classes, and 15 phyla (Figure 3; Supplementary Information-Data S2). At the phylum level (Supplementary Information-Data S3), Nematoda had the highest overall relative abundance (36.52%), followed by Arthropoda (18.16%), Echinodermata (17.31%), Annelida (8.49%), and Mollusca (8.03%). The relative abundance of Nematoda varied among the CSM, PVB, TT, and WPB habitats, with percentages of 42.98%, 50.75%, 35.21%, and 11.60% respectively. Ten out of the 15 phyla were shared in the four habitats and the phyla Gastrotricha (1.5%) and Hemichordata (0.72%) were exclusive in CSM (site P30, P112), which reflected some divergences of taxa composition in phylum level.
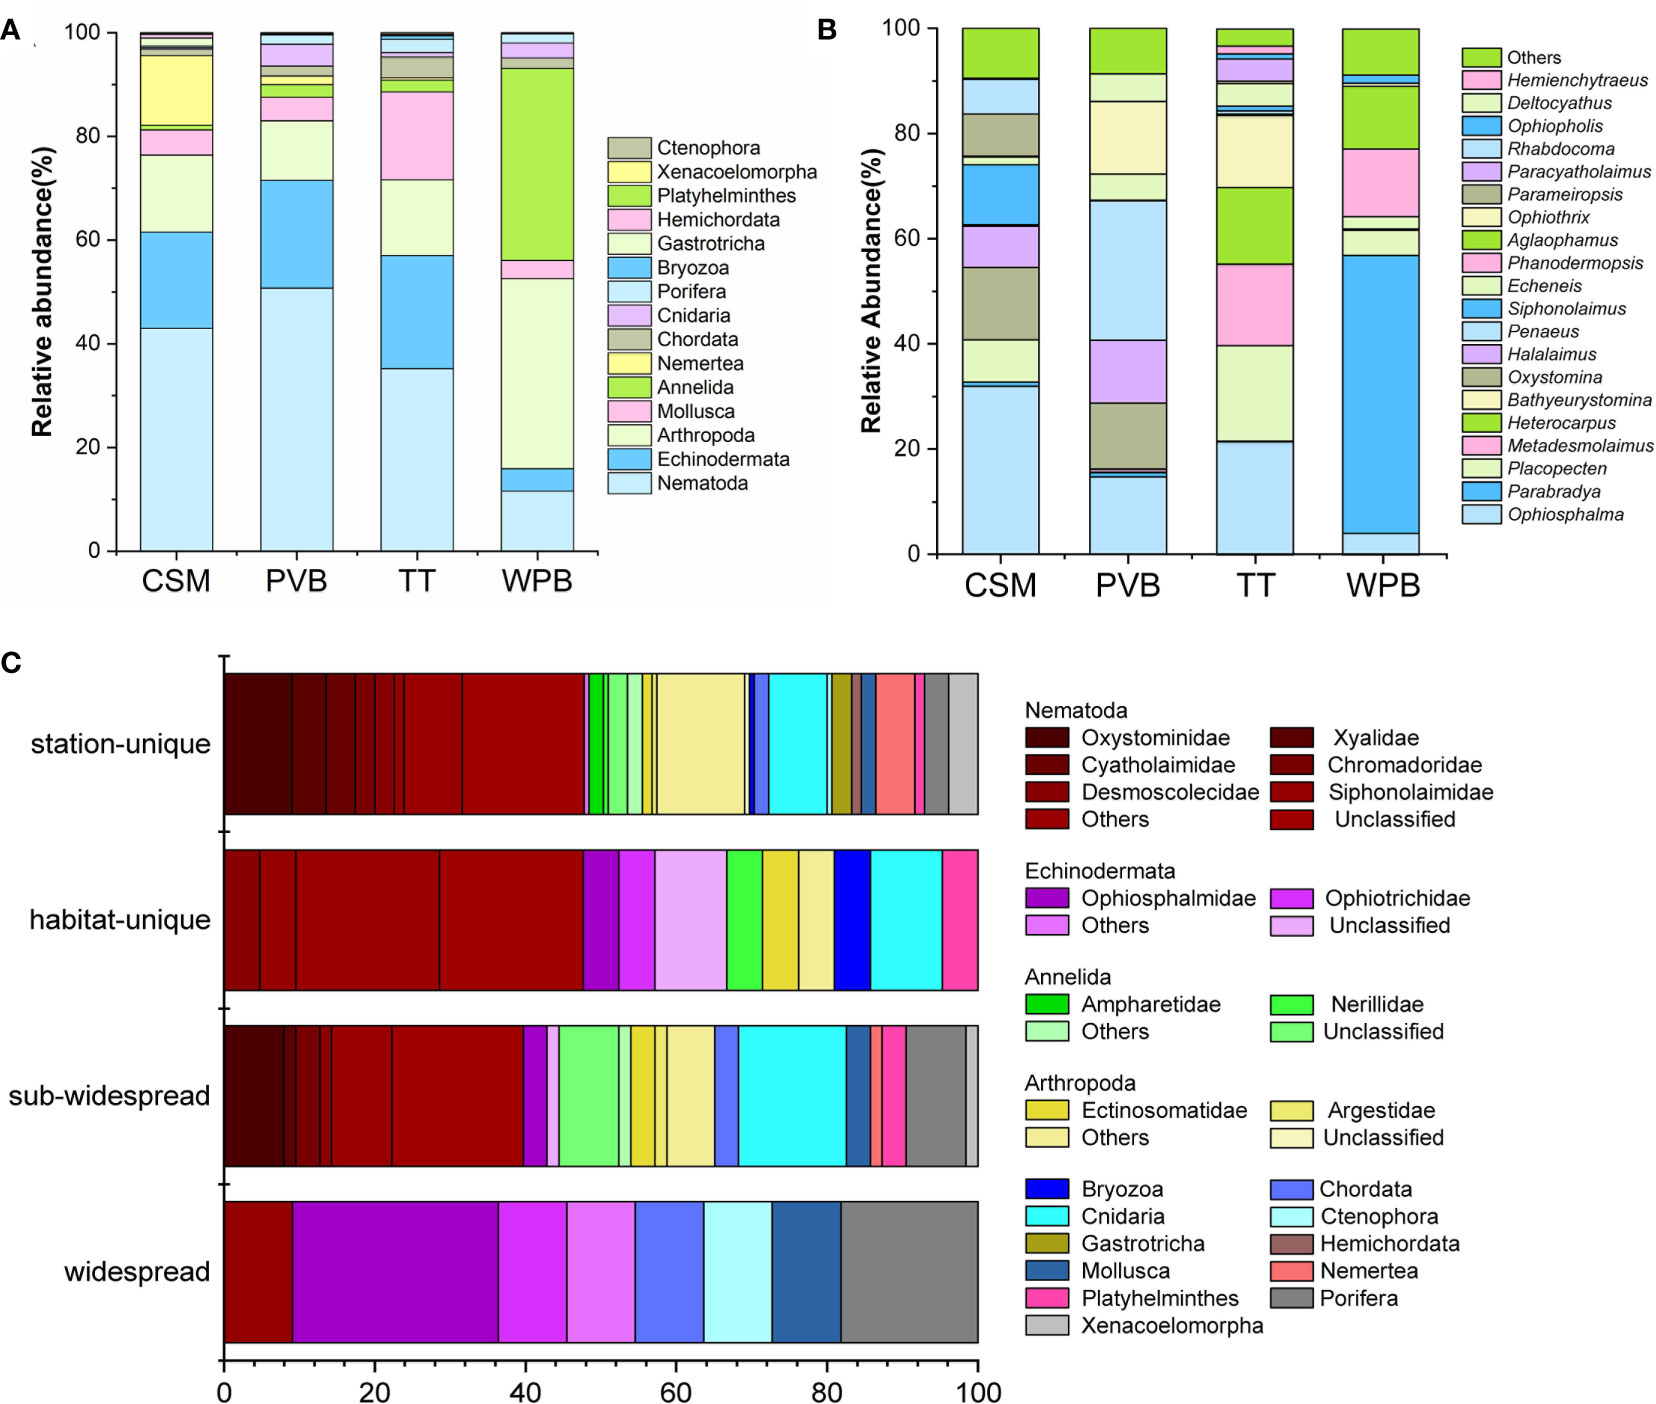
Figure 3 Metazoan community composition and biogeography in the sediments of Western Pacific. Community composition: (A) Phylum level; (B) Genus level (> 1%); NA, unclassified; others, < 1% genera. (C) biogeography analysis, the presence/absence data was used to calculate the proportion of taxa in the four biogeographic categories. Widespread, found in all habitats; sub-widespread, found in two or three habitats; habitat-unique, found in two or more than two stations within a single habitat; station-unique, restricted to a single station. CSM, close to seamounts; PVB, in Parece Vela Basin; TT, in the edges of trench or trough; WPB, in West Philippine Basin.
At the genus level, as depicted in Figure 3B, more pronounced divergences were observed. For example, the genus Placopecten was present in all four habitats with significantly different relative abundance: 18.13% in TT, 7.98% in CSM, 4.76% in WPB, and 0.12% in PVB. Moreover, the genera Parameiropsis (7.99%) and Rhabdocoma (6.62%) were unique to CSM. Deltocyathus (5.21%) was only found in PVB, while Bathyeurystomina (13.67%) was exclusive to TT. The genera Aglaophamus (11.88%) and Phanodermopsis (12.88%) were specific to WPB.
Community biogeographic analysis showed that 11 OTUs were found in all habitats, 63 OTUs were found in two or three habitats, 21 OTUs were habitat-unique, and 155 OTUs were station-unique (Figure 3C). The station-unique taxa mainly include Oxystominidae (9.03%) and Xyalidae (4.51%) within Nematoda (47.74%), Arthropoda (14.19%), and Cnidaria (7.74%) (Figure 3C).
To validate the reliability of the eDNA method, we compared the taxonomic results with published morphology-based examinations on nematodes in similar deep-sea environments (Miljutin et al., 2011; Grzelak et al., 2017; Leduc and Rowden, 2018). Supplementary Table S4 showed that 15 of the 17 nematode families detected in our study were present in the morphological studies Moreover, there existed a strong agreement between the two methods regarding the identification of dominant families, including Xyalidae, Chromadoridae, Oxystominidae, and Desmoscolecidae.
3.4 Multivariate statistical analysis
The NMDS conducted on the dominant OTUs (mean of total reads > 10) dataset showed a large distance between the assemblages of sites in WPB, and a relatively smaller distance between the assemblages of sites in CSM, PVB, and TT (Figure 4A). The assemblage of site 22 deviated from that of other sites, with a high abundance of a particular OTU (OTU 1389, Annelida: Polychaeta: Terebellida: Ampharetidae: Isolda pulchella). The results of ANOSIM (Figure 4B) showed that the intra-group differences of CSM, PVB, and TT were obviously less than the inter-group differences, while that of WPB was slightly less than the inter-area differences. The result of the Global test indicated the validity of grouping (R=0.36, p < 0.01). The differences in assemblages between the CSM and PVB (R=0.52, p < 0.01), between the PVB and TT (R=0.55, p < 0.01), and between the PVB and WPB (R=0.39, p < 0.05) were significant according to the results of pairwise tests (Supplementary Table S5).
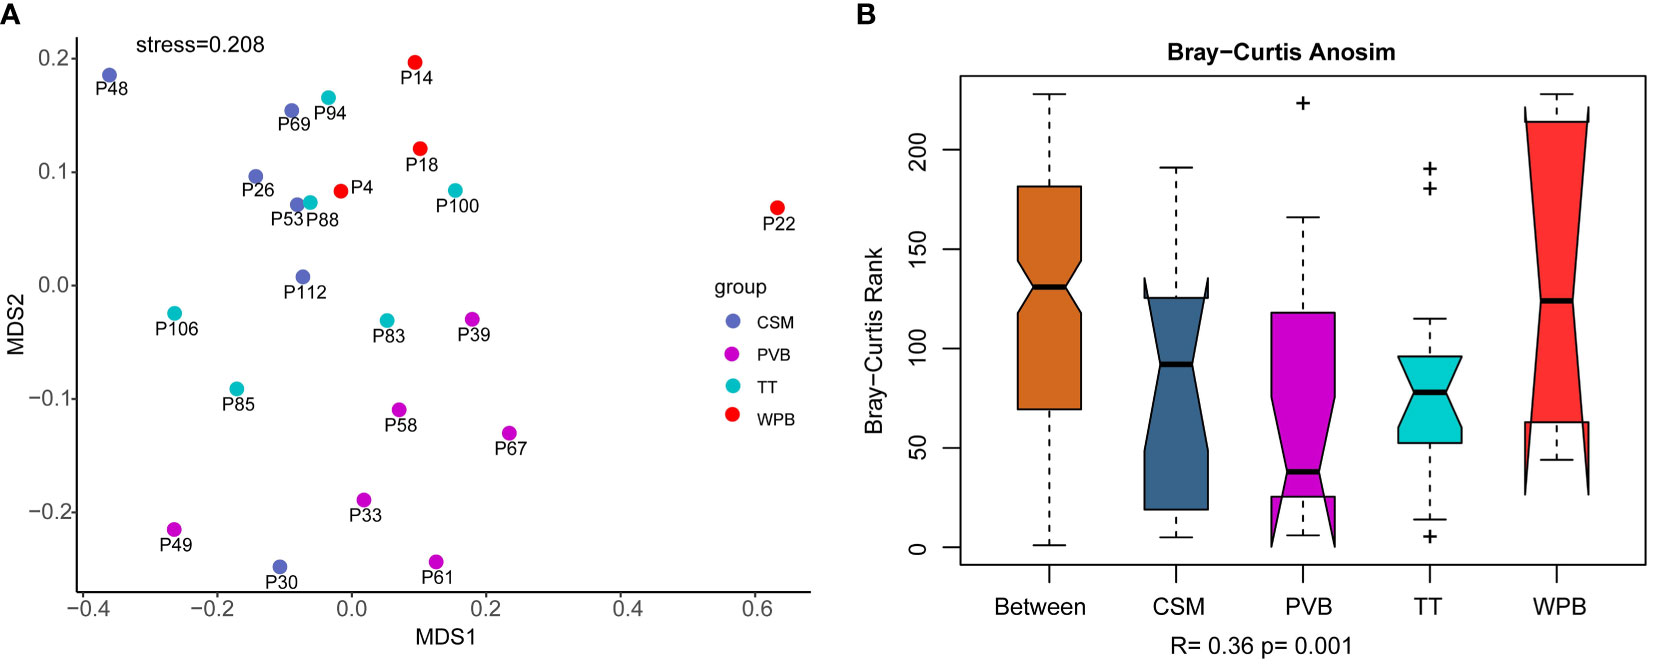
Figure 4 Similarity analysis of community structure performed on dominant OTUs (mean of total reads > 10) dataset, data transformation: loge(X+1). (A) Non-metric Multi-dimensional Scaling (NMDS) analysis; (B) Analysis of similarity (ANOSIM). CSM, close to seamounts; PVB, in Parece Vela Basin; TT, in the edges of trench or trough; WPB, in West Philippine Basin.
3.5 Correlation analysis
Multivariate and univariate methods were used to reflect the correlations between environmental factors and diversity indices/taxa and between different taxa (at the phylum level). The variables of sand, clay, TN, and TC were removed after forward selection in RDA. Among the remaining environmental factors, the TOC (explained 9.5%, p < 0.05) and the Md (explained 8.9%, p < 0.05) were significantly correlated with the overall community composition (Figure 5; Table 3). All 5 environmental factors together explained a 30.3% variation in community composition.
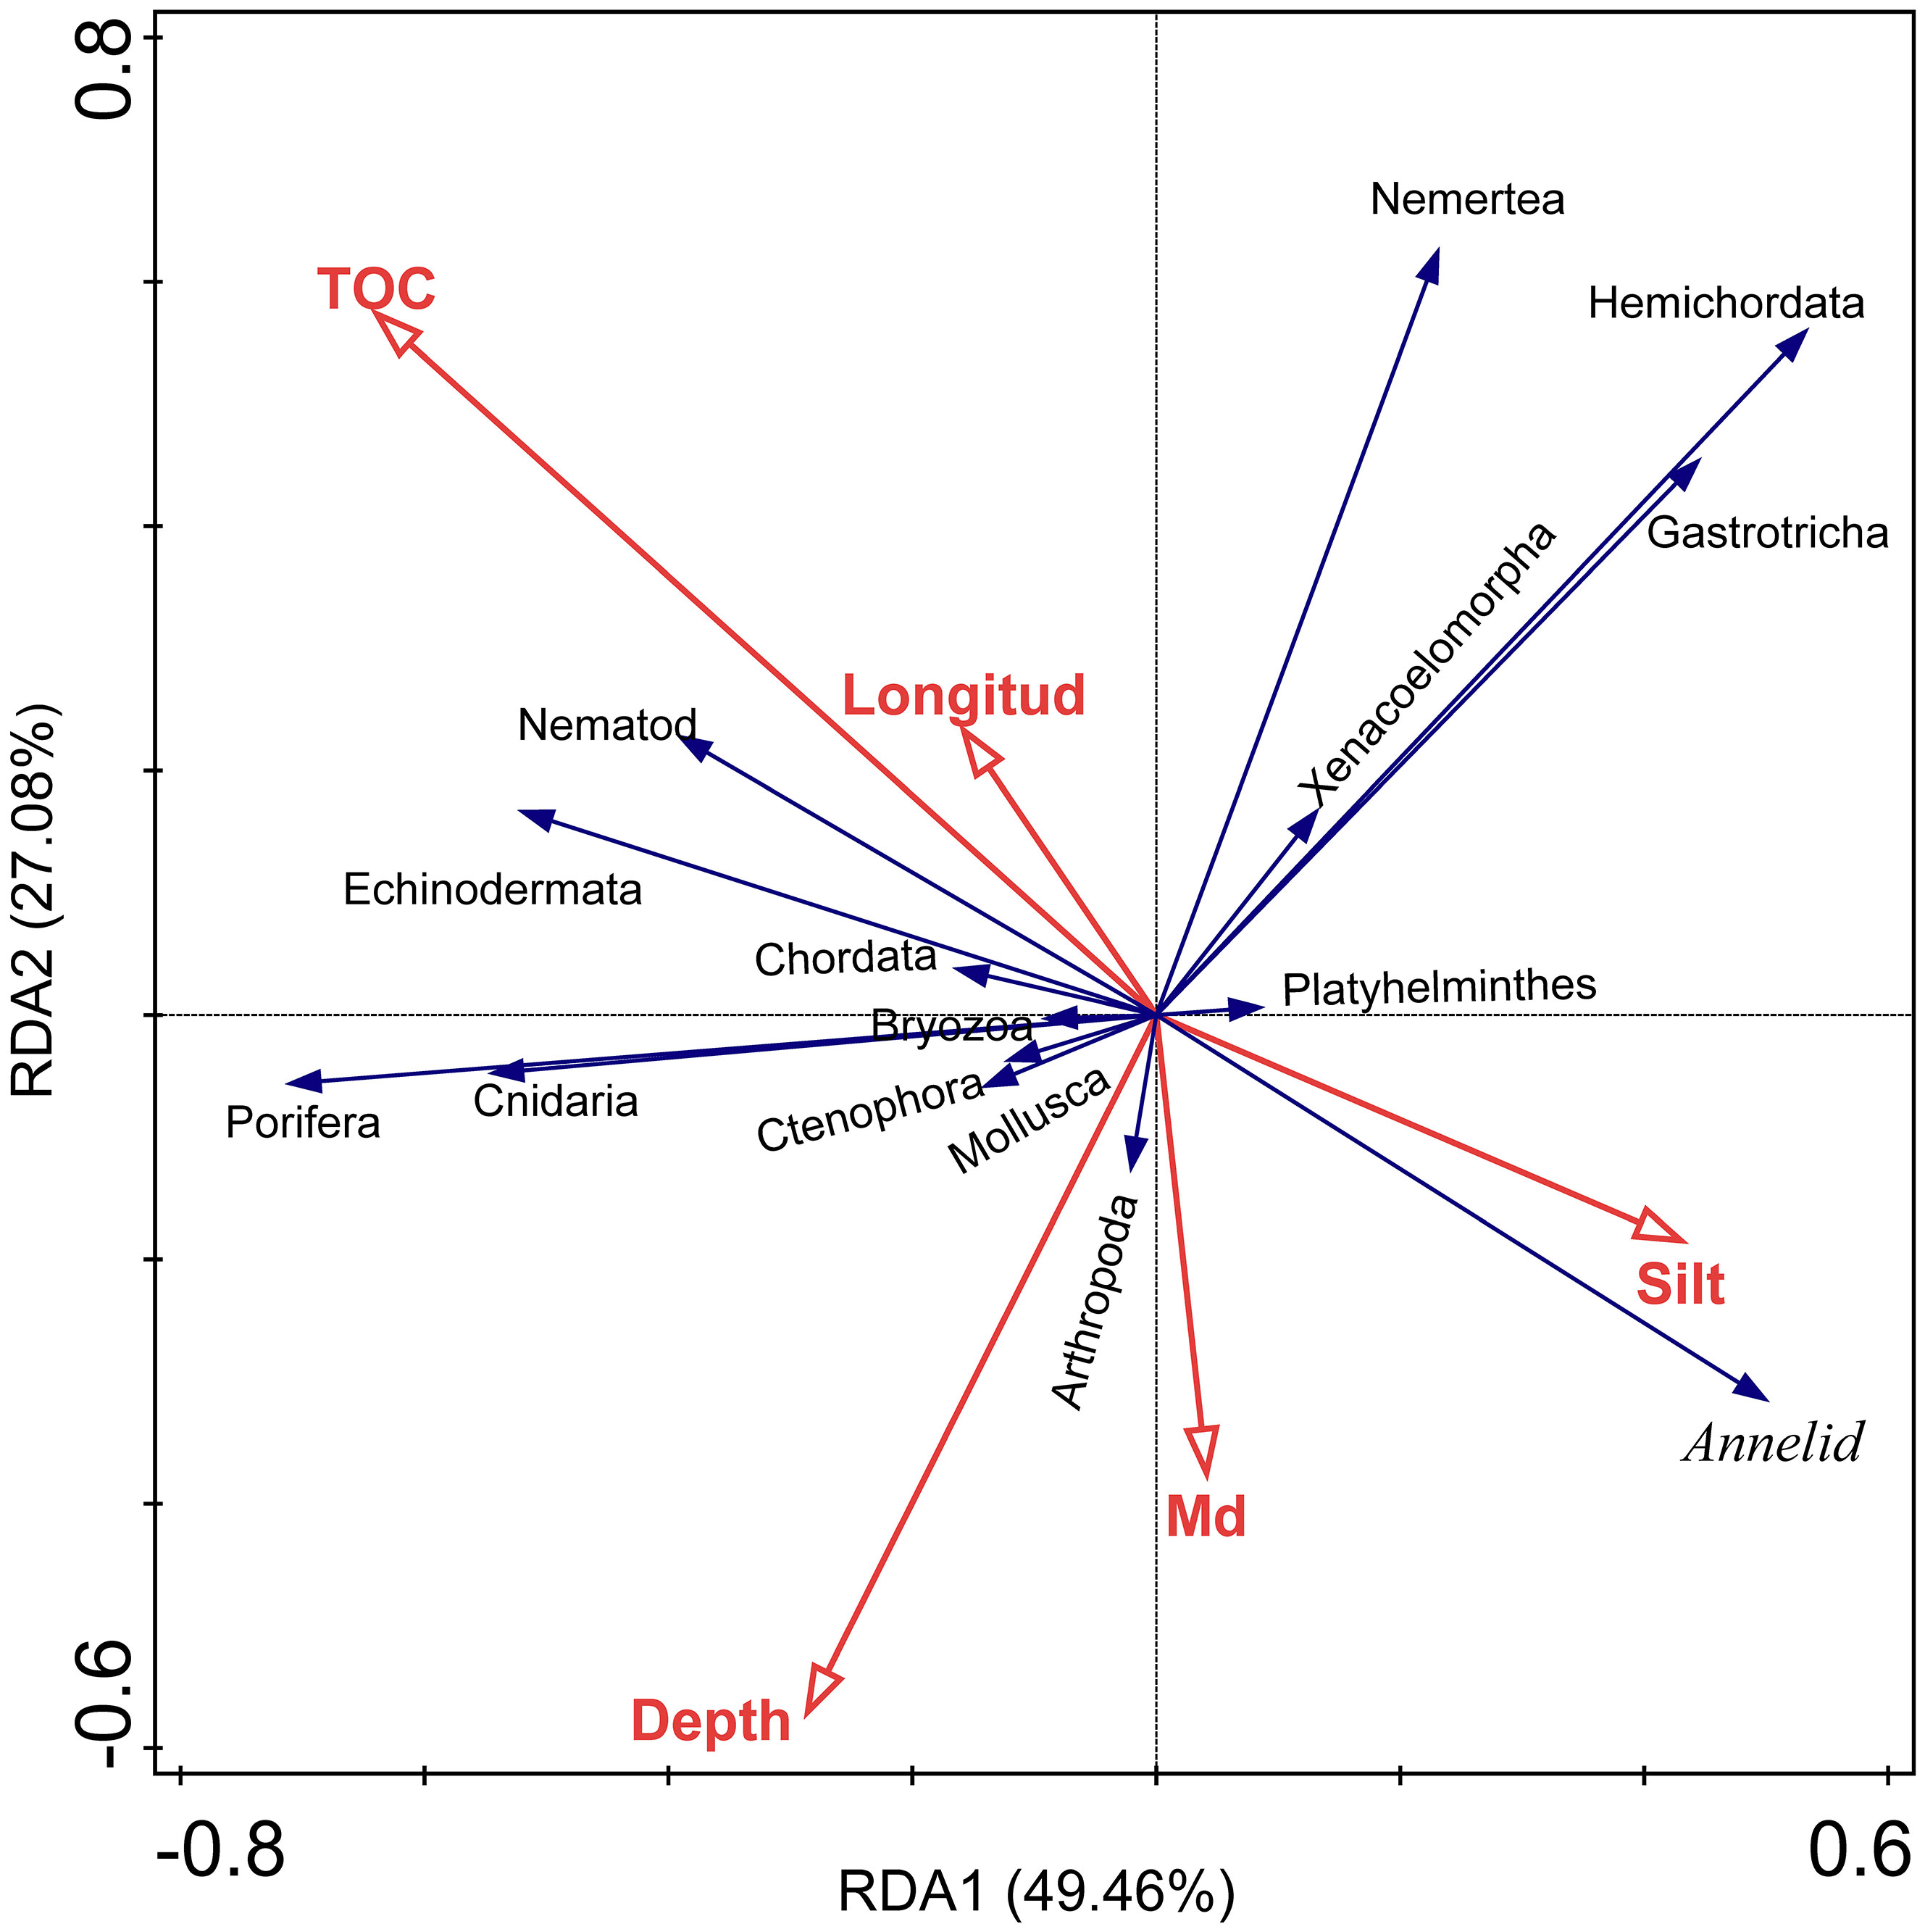
Figure 5 Redundancy analysis (RDA) of taxa (at phylum level) and environmental factors, taxa data transformation: loge(X+1). CSM, close to seamounts; PVB, in Parece Vela Basin; TT, in the edges of trench or trough; WPB, in West Philippine Basin.
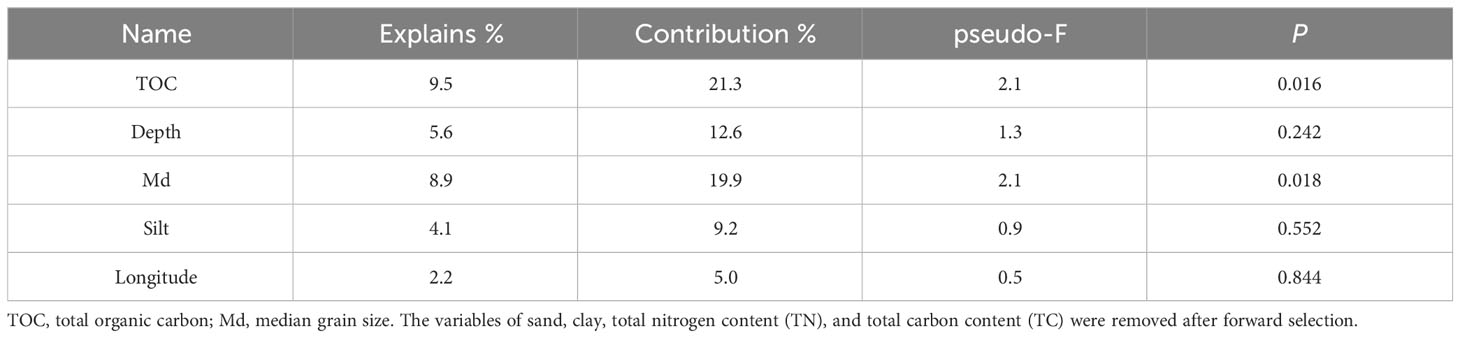
Table 3 Difference test of environmental factors on community composition.
The results of Pearson correlation tests are shown in Supplementary Figure S4. TOC was negatively correlated with the abundance of Annelida (p < 0.05), while positively correlated with that of Cnidaria and Porifera (p < 0.05). Depth was negatively and significantly correlated with the Shannon and Richness index, as well as the abundance of Gastrotricha and Hemichordata. TC was positively correlated with the abundance of Annelida (p < 0.01). TN was negatively correlated with the abundance of Ctenophora (p < 0.01). Furthermore, the abundances of Cnidaria, Porifera, and Nematoda were positively correlated with each other (p < 0.05), with the abundance of Cnidaria strongly correlated with Porifera’s (p < 0.01). The abundance of Nematoda was negatively correlated with Annelida’s (p < 0.05). In addition, the result of linear regression analysis showed a significant negative correlation (R2 = 0.341, p<0.05) between water depth and OTU counts (Supplementary Figure S5).
4 Discussion
4.1 Application of eDNA metabarcoding in deep-sea biodiversity research
Investigating the biodiversity of the deep seafloor is a formidable challenge due not only to the remoteness and limited sampling techniques but also to the vast number of unknown taxa. It is estimated that the deep sea worldwide may contain up to 10 million species (Scheffers et al., 2012). With only about 243,000 currently described (Costello and Chaudhary, 2017), a vast number of species remain to be discovered and cataloged. In this case, eDNA metabarcoding is a more efficient tool for surveying the biodiversity in the deep sea, especially for a broad taxonomic range (Fonseca et al., 2010). In this study, we obtained a total of 250 OTUs assigned to 85 families from 15 metazoan phyla in the western Pacific deep seafloor environment. The percent identity between the representative sequences of these OTUs and the best hit sequences ranges from 78% to 100%, with a median of 94.28% (Supplementary Information-Data S1). Regarding the dominant nematodes, our results showed strong concordance with other morphological studies in similar deep-sea sediments (Miljutin et al., 2011; Grzelak et al., 2017; Leduc and Rowden, 2018). The shared dominant families included Xyalidae, Chromadoridae, Oxystominidae, and Desmoscolecida (Supplementary Table S4). The above results demonstrated the effectiveness of the eDNA metabarcoding method.
Moreover, the taxonomic data indicated the presence of new species. Ten out of 250 OTUs whose annotated taxa are shown on WoRMs as being unlikely to inhabit marine environments (Supplementary Information-Data S1), and their representative sequences all have > 90% percent identity with the best hit sequences. Given the cautious operations to avoid contamination during sampling and experiments and the relatively high percent identity, these sequences are more likely to be derived from potentially new benthic taxa, which may be close relatives to currently annotated taxa. For example, OTU2144 has 96.88% percent identity with the best hit sequence (EU380309.1, Itunella muelleri), so it was annotated as Itunella sp. based on the threshold we set. Historically, the genus Itunella was primarily found in brackish water soft sediments (Berera et al., 2001; Lee and Chang, 2008). Yet, Karanovic (2021) reported a new species Itunella kieferi living in a marine environment. Therefore, OTU2144 may also represent a potential new Itunella species. In addition, given the conserved nature of the 18S gene (Bhadury et al., 2011), these OTUs may also be new species under higher taxonomic levels for over-annotation.
Yet, the detection of species outside the bottom sediments induced by eDNA dispersal causes concern about the accuracy of this method, especially for non-endobenthos like cnidarians and poriferans. However, Laroche et al. (2020a) identified < 1% shared OTUs between the sediments and the benthic boundary water, suggesting minimal interference from water-deposited eDNA. Similarly, Jeunen et al. (2019) found significantly distinct eDNA signals between the sampled habitats within a small spatial scale (< 5 km), suggesting limited eDNA dispersal. Therefore, there may exist some extra positive detection in the present study, but likely a small proportion based on above studies. Overall, although the eDNA dispersal and the assignment based on the unified threshold of taxonomic rank may induce bias (Bevilacqua et al., 2021), the Supplementary Information-Data S1, S2 provides basic benthic diversity information for the specific TAB system and a molecular data reference for future morphological taxonomy.
4.2 The characteristics of diversity and taxa distribution in a TAB system
Water depth exerts a significant influence on species richness and abundance, and constrains many fauna within specific depth ranges (Schmidt and Martinez Arbizu, 2014; Guardiola et al., 2016). In this study, the water depth was linearly and negatively correlated to the Shannon (R= -0.433, p < 0.05), Richness (R= -0.576, p < 0.01) index, and OTU counts (R2 = 0.341, p < 0.05) (Supplementary Figures S4, S5). In addition, two phyla of Gastrotricha and Hemichordata were exclusively found at two stations (P30 and P112) characterized by the shallowest water depth, suggesting their distribution patterns are likely influenced by depth gradients. These results indicated that the alpha diversity declines with the increasing water depth in the studied TAB system, supporting previous findings that depth gradients restricted the distributions of various metazoan taxa in deep seafloor (Brandt et al., 2020; Liu et al., 2022; Oosthuizen et al., 2023).
Nematodes have been identified as the most dominant meiofauna taxa across coastal and deep-sea habitats, as indicated by studies employing both traditional morphology-taxonomy (Leduc et al., 2016) and molecule-taxonomy methods (Guardiola et al., 2016; Sinniger et al., 2016; Laroche et al., 2020a). In the present study, nematodes were the most abundant metazoan taxa in habitat CSM, PVB, and TT (Figure 3A). Yet, annelids were the most abundant taxa in habitat WPB, differing from the other three (Figure 3A). Alongside nematodes and annelids, echinoderms and arthropods, with high relative abundance, were also the dominant taxa (Figure 3A). These dominant metazoan faunas, predominantly belong to mobile organisms, which was consistent with the previous findings that mobile organisms dominated metazoan community in the deep sea sediment (Pawlowski et al., 2011; Bik et al., 2012; Laroche et al., 2020a). The seafloor of our study area is characterized by fine sediments (Table 2) that are not suitable for sessile organisms to anchor on. In addition, the mobile organisms may release more and wider eDNA into the surrounding environment during movement as suggested by Danziger et al. (2022).
Some widely distributed species were detected in all four habitats, like Ophiosphalma cf. glabrum (O.cf.glabrum), Placopecten magellanicus, Ophiothrix oerstedii, and Ophiopholis aculeata (Supplementary Information-Data S2), indicating their strong dispersal and adaption abilities in tropical Western Pacific. Among them, O.cf.glabrum is a very typical Ophiuroid species in the deep-sea environment. Amon et al. (2016) also reported that this species was present at all sampling sites in the CCZ area. In contrast to the widespread species, some meiofauna taxa (e.g., Platyhelminthes, Xenacoelomorpha, and Nemertea, Figure 3A) displayed patchy distributions and were found in random stations. It is difficult to identify them by morphology because they tend to become fragmented (Curini Galletti et al., 2012), and the limited knowledge of their taxonomy and diversity in the deep sea. The eDNA metabarcoding approach is effective in identifying these deep-sea organisms with easily damaged bodies (Kitahashi et al., 2020; Liu et al., 2022).
4.3 High heterogeneity of community composition in the trench-arc-basin system
In this study, the benthic community assemblages showed highly heterogeneous among stations. We found very limited overlap species between various stations, with 155 of 250 OTUs (Figure 3C) and 43 of the 82 genera (Supplementary Information-Data S4) being station-unique. For example, the genus Bathyeurystomina, a purely deep-sea genus of free-living marine nematodes (Bik et al., 2010), was only identified in station P83, with high relative abundance (Figure 3B). This heterogeneity phenomenon was also reported by many other studies of deep-sea benthic biodiversity (Guardiola et al., 2015; Guardiola et al., 2016; Laroche et al., 2020a; Lejzerowicz et al., 2021). In our study, the main contributors to the heterogeneity were Oxystominidae (9.03%) and Xyalidae (4.51%) within Nematoda (47.74%), Arthropoda (14.19%), and Cnidaria (7.74%) (Figure 3C).
The assemblages of the benthic community were distinct among the four habitats, sharing only 11 OTUs (Figures 3A, 4). The CSM habitat (6 sampling sites closed to seamounts, distance < 25 km) had the highest alpha diversity and 107 exclusive OTUs (more than twice the number of the other three habitats). In this habitat, a total of 51 genera from 14 phyla were identified (Supplementary Information-Data S3, S4). Sampling sites of CSM are located within the range of the seamount effect (Laroche et al., 2020a). Therefore, the “seamount effect” may be responsible for the observed biodiversity characteristics of the CSM. (Dower and Mackas, 1996; Lueck and Mudge, 1997; Clark et al., 2010; Lavelle and Mohn, 2010). In addition, the habitats of WPB/PVB and PVB/TT were divided by the southern Palau Ridge, and Yap Arc, respectively. Significant differences in the dominant metazoan assemblages were observed between PVB/WPB, and PVB/TT (p < 0.05, Supplementary Table S5). These results may be attributed to the differences in habitats and the geographic isolation caused by the ridge and trench (Stewart and Jamieson, 2018). Geographic barriers are known to reduce the frequency of dispersal and exchange of organisms between separated areas (Cowen and Sponaugle, 2009).
Overall, the differences in community assemblages may be induced by the large geographic barriers and the high habitat heterogeneity of this TAB system. Diverse geographical structures (e.g., trench, arc, basin, seamount, trough) distributed in the TAB system introduce high habitat heterogeneity, which could support the diverse community assemblages (Lacey et al., 2016; Ashford et al., 2019).
4.4 Drivers of community structure and the correlation between different taxa
Food availability is one of the key factors that influence deep-sea benthic biomass, diversity, and community structure (Woolley et al., 2016; Ashford et al., 2019). The multivariate and univariate correlation analysis showed that TOC, as a proxy of food availability, was the most principal factor driving metazoan assemblages in this study. According to RDA analysis, the overall assemblages were significantly correlated with TOC, which explained 9.5% of the variance (p < 0.05, Table 2). In Pearson correlation analysis, TOC was positively correlated to the abundance of Porifera and Cnidaria but negatively correlated to that of Annelida (Supplementary Figure S4A). The result supported previous findings that the effects of TOC on macrofauna diversity are taxa-specific (Levin and Gage, 1998; Cunha et al., 2011; Nishijima et al., 2015). High levels of TOC can increase microbial diversity and activity, which break down organic matter into smaller molecules more easily absorbed by other organisms but simultaneously consume oxygen further leading to hypoxia, which will harm many organisms especially macrofauna (Levin and Gage, 1998). The lack of data on some important environmental factors, such as currents speed, BPI value, temperature, pH, and dissolved oxygen, limited in-depth analysis of environmental drivers (Ashford et al., 2019) on benthic assemblages. This cruise mainly focused on the sediment environment investigation. Therefore, future studies could focus on filling these data gaps to obtain a more comprehensive understanding of the environmental factors influencing benthic community compositions in this region.
We also found a strong and significant correlation among some taxa. The abundance of Cnidaria was strongly and positively correlated with that of Porifera (Supplementary Figure S4B). Both taxa are suspension feeders and large sessile benthos (Genin et al., 1986). They may require a similar living environment, such as an appropriate rate of currents and sediment structure (Clark et al., 2010). Additionally, many Hydrozoa (Cnidaria) have been reported to be symbiotic with Porifera (Puce et al., 2005). Similarly, the abundance of Hemichordata was correlated with that of Gastrotricha and Nemertea. However, it is unclear whether these correlations are accidental or due to the connection of some biological and ecological processes, and further studies are needed to explore this phenomenon.
5 Conclusion
This study has identified 85 families of marine benthos from 45 orders, 27 classes, and 15 phyla, across a trench-arc-basin system in Western Pacific. The Nematodes, Echinodermata, Arthropoda, and Annelida were dominant metazoan taxa, mainly belonging to mobile organisms. We found the benthic biodiversity and species specificity near seamounts were significantly higher than in other areas, potentially due to the “seamount effect”. The metazoan community assemblages were highly heterogeneous among the four geographical areas. Through multivariate and univariate correlation analysis, we identified TOC and Md as the principal driving factors of metazoan assemblages, comparative studies of biodiversity with precise grouping based on the local-scale topography will be conducted, which will provide insight into the correlation between the topography and biodiversity.
Data availability statement
The original contributions presented in the study are publicly available. This data can be found here: https://www.ncbi.nlm.nih.gov/, BioProject: PRJNA663734, BioSample: SAMN17010720-17010742.
Author contributions
JM: Formal analysis, Software, Validation, Writing – original draft. XL: Formal analysis, Software, Writing – review & editing. AM: Investigation, Validation, Writing – original draft. PG: Data curation, Investigation, Writing – review & editing. XW: Investigation, Software, Validation, Writing – review & editing. XZ: Conceptualization, Project administration, Supervision, Writing – review & editing. QX: Conceptualization, Funding acquisition, Supervision, Writing – review & editing.
Funding
The author(s) declare financial support was received for the research, authorship, and/or publication of this article. This study was supported by the foundation of the National Key R & D Program of China (2023YFC2811401), the National Natural Science Foundation of China (42176135), and the China Deep Ocean Affairs Administration project (Digital Deep-sea Typical Habitats).
Acknowledgments
We are grateful to Mr. Xin Zhong and Prof. Xiaoshou Liu from the Ocean University of China for their assistance in sample collection, as well as Dr. Gang Yang and Prof. Yanguang Liu from FIO for their help in processing samples and determining sediment physicochemical factors. We also appreciate the invaluable support provided by the crew of R/V “Xiangyanghong 01”.
Conflict of interest
The authors declare that they have no known competing financial interests or personal relationships that could have appeared to influence the work reported in this paper.
Publisher’s note
All claims expressed in this article are solely those of the authors and do not necessarily represent those of their affiliated organizations, or those of the publisher, the editors and the reviewers. Any product that may be evaluated in this article, or claim that may be made by its manufacturer, is not guaranteed or endorsed by the publisher.
Supplementary material
The Supplementary Material for this article can be found online at: https://www.frontiersin.org/articles/10.3389/fmars.2023.1320540/full#supplementary-material
References
Amon D. J., Ziegler A. F., Dahlgren T. G., Glover A. G., Goineau A., Gooday A. J., et al. (2016). Insights into the abundance and diversity of abyssal megafauna in a polymetallic-nodule region in the eastern Clarion-Clipperton Zone. Sci. Rep. 6, 30492. doi: 10.1038/srep30492
Armstrong C. W., Vondolia G. K., Foley N. S., Henry L.-A., Needham K., Ressurreição A. (2019). Expert assessment of risks posed by climate change and anthropogenic activities to ecosystem services in the deep North Atlantic. Front. Mar. Sci. 6. doi: 10.3389/fmars.2019.00158
Ashford O. S., Kenny A. J., Barrio Frojan C. R. S., Horton T., Rogers A. D. (2019). Investigating the environmental drivers of deep-seafloor biodiversity: A case study of peracarid crustacean assemblages in the Northwest Atlantic Ocean. Ecol. Evol. 9, 14167–14204. doi: 10.1002/ece3.5852
Berera R., Cottarelli V., Bruno M. C. (2001). Ichnusella improvisa sp. nov. from subterranean waters of Sardinia (Italy) and remarks on Itunella intermedia and Itunella muelleri (Copepoda, Harpacticoida). Ital. J. Zoology 68, 327–334. doi: 10.1080/11250000109356427
Bevilacqua S., Anderson M. J., Ugland K. I., Somerfield P. J., Terlizzi A. (2021). The use of taxonomic relationships among species in applied ecological research: Baseline, steps forward and future challenges. Austral Ecol. 46, 950–964. doi: 10.1111/aec.13061
Bhadury P., Bik H., Lambshead J. D., Austen M. C., Smerdon G. R., Rogers A. D. (2011). Molecular diversity of fungal phylotypes co-amplified alongside nematodes from coastal and deep-sea marine environments. PloS One 6, e26445. doi: 10.1371/journal.pone.0026445
Bik H. M., Sung W., De Ley P., Baldwin J. G., Sharma J., Rocha-Olivares A., et al. (2012). Metagenetic community analysis of microbial eukaryotes illuminates biogeographic patterns in deep-sea and shallow water sediments. Mol. Ecol. 21, 1048–1059. doi: 10.1111/j.1365-294X.2011.05297.x
Bik H. M., Thomas W. K., Lunt D. H., Lambshead P. J. (2010). Low endemism, continued deep-shallow interchanges, and evidence for cosmopolitan distributions in free-living marine nematodes (order Enoplida). BMC Evolutionary Biol. 10, 389. doi: 10.1186/1471-2148-10-389
Bolger A., Lohse M., Usadel B. (2014). Trimmomatic: a flexible trimmer for illumina sequence data. Bioinformatics 30 (15), 2114–2120. doi: 10.1093/bioinformatics/btu170
Braak C., Smilauer P. (2012). Canoco reference manual and user’s guide: software for ordination, version 5.0 (Ithaca USA: Microcomputer Power).
Brandt A., Brix S., Riehl T., Malyutina M. (2020). Biodiversity and biogeography of the abyssal and hadal Kuril-Kamchatka trench and adjacent NW Pacific deep-sea regions. Prog. Oceanography 181, 102232. doi: 10.1016/j.pocean.2019.102232
Camacho C., Coulouris G., Avagyan V., Ma N., Papadopoulos J., Bealer K., et al. (2009). BLAST+: architecture and applications. BMC Bioinf. 10, 421. doi: 10.1186/1471-2105-10-421
Clark M. R., Rowden A. A., Schlacher T., Williams A., Consalvey M., Stocks K. I., et al. (2010). The ecology of seamounts: structure, function, and human impacts. Annu. Rev. Mar. Sci. 2, 253–278. doi: 10.1146/annurev-marine-120308-081109
Costello M. J., Chaudhary C. (2017). Marine biodiversity, biogeography, deep-sea gradients, and conservation. Curr. Biol. 27, R511–R527. doi: 10.1016/j.cub.2017.04.060
Cowen R. K., Sponaugle S. (2009). Larval dispersal and marine population connectivity. Annu. Rev. Mar. Sci. 1, 443–466. doi: 10.1146/annurev.marine.010908.163757
Cunha M. R., Paterson G. L. J., Amaro T., Blackbird S., de Stigter H. C., Ferreira C., et al. (2011). Biodiversity of macrofaunal assemblages from three Portuguese submarine canyons (NE Atlantic). Deep Sea Res. Part II: Topical Stud. Oceanography 58, 2433–2447. doi: 10.1016/j.dsr2.2011.04.007
Curini Galletti M., Artois T., Delogu V., De Smet W., Fontaneto D., Jondelius U., et al. (2012). Patterns of diversity in soft-bodied meiofauna: dispersal ability and body size matter. PloS One 7, e33801. doi: 10.1371/journal.pone.0033801
Danovaro R., Snelgrove P. V., Tyler P. (2014). Challenging the paradigms of deep-sea ecology. Trends Ecol. Evol. 29, 465–475. doi: 10.1016/j.tree.2014.06.002
Danziger A. M., Olson Z. H., Frederich M. (2022). Limitations of eDNA analysis for Carcinus maenas abundance estimations. BMC Ecol. Evol. 22 (1), 14. doi: 10.1186/s12862-022-01969-z
Dower J. F., Mackas D. L. (1996). “Seamount effects” in the zooplankton community near Cobb Seamount. Deep Sea Res. Part I: Oceanographic Res. Papers 43, 837–858. doi: 10.1016/0967-0637(96)00040-4
Edgar R. C. (2013). UPARSE: highly accurate OTU sequences from microbial amplicon reads. Nat. Methods 10, 996–998. doi: 10.1038/nmeth.2604
Edgar R. C., Haas B. J., Clemente J. C., Quince C., Knight R. (2011). UCHIME improves sensitivity and speed of chimera detection. Bioinformatics 27, 2194–2200. doi: 10.1093/bioinformatics/btr381
Fonseca V. G., Carvalho G. R., Sung W., Johnson H. F., Power D. M., Neill S. P., et al. (2010). Second-generation environmental sequencing unmasks marine metazoan biodiversity. Nat. Commun. 1, 98. doi: 10.1038/ncomms1095
Ge M., Wang X., Yang G., Wang Z., Li Z., Zhang X., et al. (2021). Persistent organic pollutants (POPs) in deep-sea sediments of the tropical western Pacific Ocean. Chemosphere 277, 130267. doi: 10.1016/j.chemosphere.2021.130267
Genin A., Dayton P., Lonsdale P., Spiess F. (1986). Corals on seamount peaks provide evidence of current acceleration over deep-sea topography. Nature 322, 59–61. doi: 10.1038/322059a0
Goodwin K. D., Thompson L. R., Duarte B., Kahlke T., Thompson A. R., Marques J. C., et al. (2017). DNA sequencing as a tool to monitor marine ecological status. Front. Mar. Sci. 4. doi: 10.3389/fmars.2017.00107
Grzelak K., Kotwicki L., Hasemann C., Soltwedel T. (2017). Bathymetric patterns in standing stock and diversity of deep-sea nematodes at the long-term ecological research observatory HAUSGARTEN (Fram Strait). J. Mar. Syst. 172, 160–177. doi: 10.1016/j.jmarsys.2017.02.003
Guardiola M., Uriz M. J., Taberlet P., Coissac E., Wangensteen O. S., Turon X. (2015). Deep-sea, deep-sequencing: metabarcoding extracellular DNA from sediments of marine canyons. PloS One 10, e0139633. doi: 10.1371/journal.pone.0139633
Guardiola M., Wangensteen O. S., Taberlet P., Coissac E., Uriz M. J., Turon X. (2016). Spatio-temporal monitoring of deep-sea communities using metabarcoding of sediment DNA and RNA. PeerJ 4, e2807. doi: 10.7717/peerj.2807
Jamieson A. (2015). The hadal zone: life in the deepest oceans (United Kingdom: Cambridge University Press). doi: 10.1017/CBO9781139061384
Jamieson A. J., Fujii T., Mayor D. J., Solan M., Priede I. G. (2010). Hadal trenches: the ecology of the deepest places on Earth. Trends Ecol. Evol. 25, 190–197. doi: 10.1016/j.tree.2009.09.009
Jeunen G. J., Knapp M., Spencer H. G., Lamare M. D., Taylor H. R., Stat M., et al. (2019). Environmental DNA (eDNA) metabarcoding reveals strong discrimination among diverse marine habitats connected by water movement. Mol. Ecol. Resour 19, 426–438. doi: 10.1111/1755-0998.12982
Karanovic T. (2021). Two new species of the problematic harpacticoid genus Itunella (Copepoda, Canthocamptidae). Crustaceana 94, 951–972. doi: 10.1163/15685403-bja10136
Kitahashi T., Kawamura K., Kojima S., Shimanaga M. (2013). Assemblages gradually change from bathyal to hadal depth: A case study on harpacticoid copepods around the Kuril Trench (north-west Pacific Ocean). Deep Sea Res. Part I: Oceanographic Res. Papers 74, 39–47. doi: 10.1016/j.dsr.2012.12.010
Kitahashi T., Sugime S., Inomata K., Nishijima M., Kato S., Yamamoto H. (2020). Meiofaunal diversity at a seamount in the pacific ocean: A comprehensive study using environmental DNA and RNA. Deep Sea Res. Part I: Oceanographic Res. Papers 160, 103253. doi: 10.1016/j.dsr.2020.103253
Kobayashi K. (2004). Origin of the Palau and Yap trench-arc systems. Geophysical J. Int. 157, 1303–1315. doi: 10.1111/j.1365-246X.2003.02244.x
Lacey N., Rowden A., Clark M., Kilgallen N., Linley T., Mayor D., et al. (2016). Community structure and diversity of scavenging amphipods from bathyal to hadal depths in three South Pacific Trenches. Deep Sea Res. Part I: Oceanographic Res. Papers 111, 121–137. doi: 10.1016/j.dsr.2016.02.014
Laroche O., Kersten O., Smith C. R., Goetze E. (2020a). Environmental DNA surveys detect distinct metazoan communities across abyssal plains and seamounts in the western Clarion Clipperton Zone. Mol. Ecol. 29, 4588–4604. doi: 10.1111/mec.15484
Laroche O., Kersten O., Smith C. R., Goetze E. (2020b). From sea surface to seafloor: A benthic allochthonous eDNA survey for the abyssal ocean. Front. Mar. Sci. 7. doi: 10.3389/fmars.2020.00682
Lavelle J., Mohn C. (2010). Motion, commotion, and biophysical connections at deep ocean seamounts. Oceanography 23 (1), 90–103. doi: 10.5670/oceanog.2010.64
Leduc D., Rowden A. A. (2018). Nematode communities in sediments of the Kermadec trench, Southwest Pacific Ocean. Deep Sea Res. Part I: Oceanographic Res. Papers 134, 23–31. doi: 10.1016/j.dsr.2018.03.003
Leduc D., Rowden A. A., Glud R. N., Wenzhöfer F., Kitazato H., Clark M. R. (2016). Comparison between infaunal communities of the deep floor and edge of the Tonga Trench: Possible effects of differences in organic matter supply. Deep Sea Res. Part I: Oceanographic Res. Papers 116, 264–275. doi: 10.1016/j.dsr.2015.11.003
Lee J., Chang C. Y. (2008). Two canthocamptid copepods of the genera Itunella and Mesochra (Harpacticoida, Canthocamptidae) from brackish waters in South Korea. J. Natural History 42, 1729–1747. doi: 10.1080/00222930802130302
Lejzerowicz F., Gooday A. J., Barrenechea Angeles I., Cordier T., Morard R., Apothéloz-Perret-Gentil L., et al. (2021). Eukaryotic biodiversity and spatial patterns in the clarion-clipperton zone and other abyssal regions: insights from sediment DNA and RNA metabarcoding. Front. Mar. Sci. 8. doi: 10.3389/fmars.2021.671033
Lepere C., Domaizon I., Hugoni M., Vellet A., Debroas D. (2016). Diversity and dynamics of active small microbial eukaryotes in the anoxic zone of a freshwater meromictic lake (Pavin, France). Front. Microbiol. 7. doi: 10.3389/fmicb.2016.00130
Levin L. A., Gage J. D. (1998). Relationships between oxygen, organic matter and the diversity of bathyal macrofauna. Deep Sea Res. Part II: Topical Stud. Oceanography 45, 129–163. doi: 10.1016/S0967-0645(97)00085-4
Liu J., Du L., Sun Z., Zhang H. (2022). Comparison of structure and diversity of benthic communities in the Okinawa Trough and Mariana Trench by environmental DNA metabarcoding. Deep Sea Res. Part I: Oceanographic Res. Papers 185, 103806. doi: 10.1016/j.dsr.2022.103806
Lueck R., Mudge T. (1997). Topographically induced mixing around a shallow seamount. Science 276, 1831–1833. doi: 10.1126/science.276.5320.1831
Magoc T., Salzberg S. (2011). FLASH: fast length adjustment of short reads to improve genome assemblies. Bioinf. (Oxford England) 27, 2957–2963. doi: 10.1093/bioinformatics/btr507
Mantovani E., Albarello D., Babbucci D., Tamburelli C., Viti M. (2002). Arc-trench-back arc systems in the Mediterranean area: Examples of extrusion tectonics. J. Virtual Explorer 8, 125–141. doi: 10.3809/jvirtex.2002.00050
McMurdie P. J., Holmes S. (2013). phyloseq: an R package for reproducible interactive analysis and graphics of microbiome census data. PloS One 8, e61217. doi: 10.1371/journal.pone.0061217
Miljutin D. M., Miljutina M. A., Arbizu P. M., Galeron J. (2011). Deep-sea nematode assemblage has not recovered 26 years after experimental mining of polymetallic nodules (Clarion-Clipperton Fracture Zone, Tropical Eastern Pacific). Deep Sea Res. Part I: Oceanographic Res. Papers 58, 885–897. doi: 10.1016/j.dsr.2011.06.003
Nishijima W., Umehara A., Okuda T., Nakai S. (2015). Variations in macrobenthic community structures in relation to environmental variables in the Seto Inland Sea, Japan. Mar. Pollut. Bull. 92, 90–98. doi: 10.1016/j.marpolbul.2014.12.051
Oosthuizen D., Seymour M., Atkinson L., von der Heyden S. (2023). Extending deep-sea benthic biodiversity inventories with environmental DNA metabarcoding. Mar. Biol. 170 (5), 60. doi: 10.1007/s00227-023-04205-4
Pawlowski J., Bruce K., Panksep K., Aguirre F. I., Amafitano S., Apothéloz-Perret-Gentil L., et al. (2021). Environmental DNA metabarcoding for benthic monitoring: A review of sediment sampling and DNA extraction methods. Sci. Total Environ. 818, 151783. doi: 10.1016/j.scitotenv.2021.151783
Pawlowski J., Christen R., Lecroq B., Bachar D., Shahbazkia H. R., Amaral-Zettler L., et al. (2011). Eukaryotic richness in the abyss: insights from pyrotag sequencing. PloS One 6, e18169. doi: 10.1371/journal.pone.0018169
Puce S., Calcinai B., Bavestrello G., Cerrano C., Gravili C., Boero F. (2005). Hydrozoa (Cnidaria) symbiotic with Porifera: A review. Mar. Ecol. 26, 73–81. doi: 10.1111/j.1439-0485.2005.00050.x
Ramirez-Llodra E., Brandt A., Danovaro R., Mol B., Escobar E., German C., et al. (2010). Deep, diverse and definitely different: unique attributes of the world’s largest ecosystem. Biogeosciences 7 (9), 2851–2899. doi: 10.5194/bg-7-2851-2010
Rognes T., Flouri T., Nichols B., Quince C., Mahé F. (2016). VSEARCH: a versatile open source tool for metagenomics. PeerJ 4, e2584. doi: 10.7287/peerj.preprints.2409v1
Scheffers B. R., Joppa L. N., Pimm S. L., Laurance W. F. (2012). What we know and don’t know about Earth’s missing biodiversity. Trends Ecol. Evol. 27, 501–510. doi: 10.1016/j.tree.2012.05.008
Schmidt C., Martinez Arbizu P. (2014). Unexpectedly higher metazoan meiofauna abundances in the Kuril–Kamchatka Trench compared to the adjacent abyssal plains. Deep Sea Res. Part II Topical Stud. Oceanography 111, 60–75. doi: 10.1016/j.dsr2.2014.08.019
Schmidt C., Sattarova V. V., Katrynski L., Martínez Arbizu P. (2019). New insights from the deep: Meiofauna in the Kuril-Kamchatka Trench and adjacent abyssal plain. Prog. Oceanography 173, 192–207. doi: 10.1016/j.pocean.2019.02.010
Schoenle A., Hohlfeld M., Hermanns K., Mahe F., de Vargas C., Nitsche F., et al. (2021). High and specific diversity of protists in the deep-sea basins dominated by diplonemids, kinetoplastids, ciliates and foraminiferans. Communation Biol. 4, 501. doi: 10.1038/s42003-021-02012-5
Shi J., Lei Y., Li H., Li T. (2021). NGS-metabarcoding revealing novel foraminiferal diversity in the Western Pacific Magellan Seamount sediments. J. Oceanology Limnology 39, 1718–1729. doi: 10.1007/s00343-021-0427-0
Sinniger F., Pawlowski J., Harii S., Gooday A. J., Yamamoto H., Chevaldonné P., et al. (2016). Worldwide analysis of sedimentary DNA reveals major gaps in taxonomic knowledge of deep-sea benthos. Front. Mar. Sci. 3. doi: 10.3389/fmars.2016.00092
Stewart H. A., Jamieson A. J. (2018). Habitat heterogeneity of hadal trenches: Considerations and implications for future studies. Prog. Oceanography 161, 47–65. doi: 10.1016/j.pocean.2018.01.007
Steyaert M., Priestley V., Osborne O., Herraiz A., Arnold R., Savolainen V., et al. (2020). Advances in metabarcoding techniques bring us closer to reliable monitoring of the marine benthos. J. Appl. Ecol. 57, 2234–2245. doi: 10.1111/1365-2664.13729
Thorsen J., Brejnrod A., Mortensen M., Rasmussen M. A., Stokholm J., Al-Soud W. A., et al. (2016). Large-scale benchmarking reveals false discoveries and count transformation sensitivity in 16S rRNA gene amplicon data analysis methods used in microbiome studies. Microbiome 4, 62. doi: 10.1186/s40168-016-0208-8
Wee A. K. S., Salmo Iii S. G., Sivakumar K., Then A. Y. H., Basyuni M., Fall J., et al. (2023). Prospects and challenges of environmental DNA (eDNA) metabarcoding in mangrove restoration in Southeast Asia. Front. Mar. Sci. 10. doi: 10.3389/fmars.2023.1033258
West R. M. (2022). Best practice in statistics: The use of log transformation. Ann. Clin. Biochem. 59, 162–165. doi: 10.1177/00045632211050531
Woolley S. N., Tittensor D. P., Dunstan P. K., Guillera-Arroita G., Lahoz-Monfort J. J., Wintle B. A., et al. (2016). Deep-sea diversity patterns are shaped by energy availability. Nature 533, 393–396.
Xu K. (2021). Exploring seamount ecosystems and biodiversity in the tropical Western Pacific Ocean. J. Oceanology Limnology 39, 1585–1590. doi: 10.1007/s00343-021-1585-9
Zhang J., Zhang G. L. (2020). Geochemical and chronological evidence for collision of proto-Yap arc/Caroline plateau and rejuvenated plate subduction at Yap trench. Lithos 370-371, 105616. doi: 10.1016/j.lithos.2020.105616
Keywords: The Western Pacific, deep sea, Trench-arc-basin system, Benthos biodiversity, community composition, environmental DNA metabarcoding
Citation: Mo J, Li X, Mou A, Gao P, Wang X, Zhang X and Xu Q (2024) Metazoan diversity and community assemblages in sediments across a Western Pacific Trench-Arc-Basin system: insights from eDNA metabarcoding. Front. Mar. Sci. 10:1320540. doi: 10.3389/fmars.2023.1320540
Received: 02 November 2023; Accepted: 27 December 2023;
Published: 17 January 2024.
Edited by:
Taewoo Ryu, Okinawa Institute of Science and Technology Graduate University, JapanReviewed by:
Jian-Wen Qiu, Hong Kong Baptist University, Hong Kong SAR, ChinaTakefumi Yorisue, University of Hyogo, Japan
Chunsheng Wang, Ministry of Natural Resources, China
Copyright © 2024 Mo, Li, Mou, Gao, Wang, Zhang and Xu. This is an open-access article distributed under the terms of the Creative Commons Attribution License (CC BY). The use, distribution or reproduction in other forums is permitted, provided the original author(s) and the copyright owner(s) are credited and that the original publication in this journal is cited, in accordance with accepted academic practice. No use, distribution or reproduction is permitted which does not comply with these terms.
*Correspondence: Xuelei Zhang, zhangxl@fio.org.cn; Qinzeng Xu, xqz08@163.com