Fluid mud induced by periodic tidal advection and fine-grained sediment settling in the Yangtze estuary
 Hao Wu
 Jieping Tang
 Weihua Li
 Fei Xing
 Haifei Yang1
  Fan Zhang
 Ya Ping Wang
- 1State Key Laboratory of Estuarine and Coastal Research, East China Normal University, Shanghai, China
- 2Ministry of Education Key Laboratory for Coast and Island Development, Nanjing University, Nanjing, China
- 3School of Electronic and Information Engineering, Guangdong Ocean University, Zhanjiang, China
This study presents in-situ observations of fluid mud in the Yangtze Estuary via a bottom tripod. Six occurrences of periodic fluid muds (F1-F6) were observed at high slack water, with suspended sediment concentration (SSC) exceeding 10 kg/m3. The thickness of the fluid mud varied across the six occurrences, reaching a maximum of 0.32m. Notably, temperature and salinity anomalies were observed within the fluid mud. The formation of fluid mud was found to be influenced by turbulence, with turbulence kinetic energy (TKE) below 5×10⁻⁴ m2/s2 favoring settling as the primary cause of formation. The critical shear stress (τcw) for fluid mud formation was estimated to be approximately 0.09 Pa. The formation of fluid muds during early tidal cycles was attributed to liquefaction and bed erosion resulting from strong waves. However, in most cases, the wave energy was insufficient for erosion, suggesting that advection played a role in sediment supply during the subsequent tide cycles. The increased cross-channel current velocity during flood facilitated the lateral transport of a significant amount of eroded sediment from shallow water into the channel. Due to its short duration, the fluid mud layer was entrained by the current before consolidation. Enhanced turbulence led to the breakdown of fluid mud at the early ebb. The critical τcw for fluid mud breakdown depended on the density and duration of the fluid mud, with a maximum value of up to 0.70 Pa. The absence of the fluid mud layer during low slack water and neap tide was associated with a reduction in advection and tidal pumping, disrupting the original sediment balance between supply and demand. These data provide valuable insights into the formation and breakdown of fluid mud, contributing to estuarine hydrodynamic modeling studies and enhancing the understanding of estuary dynamics.
1 Introduction
Fluid mud is a common, highly concentrated suspension primarily composed of silt and clay, frequently found in the estuarine turbidity maximum (ETM), particularly in the near-bed layer (McAnally et al., 2007; van Rijn, 2016). Within the ETM, the collision process of suspended sediment results in sediment aggregation and floc formation, increasing the settling velocity of suspended sediment and ultimately leading to the formation of fluid mud (Winterwerp, 2002). The suspended sediment concentration (SSC) within fluid mud typically ranges from 10 to >100 kg/m3 (Ross and Mehta, 1989; Winterwerp, 1999), so this study considers the occurrence of fluid mud when the SSC exceeds 10 kg/m3. The thickness of fluid mud can vary, reaching several meters depending on sediment supply and settling time (Azhikodan and Yokoyama, 2018). Fluid mud strongly inhibits turbulence and reduces entrainment due to its high SSC, resulting in the SSC-induced stratification of the water column (Trowbridge and Kineke, 1994; Egan et al., 2020). Consequently, fluid mud has a high deposition rate, leading to siltation in waterways and harbors, affecting ship navigation (Wurpts, 2005). Dredging these sediments requires significant resources to maintain navigational depth in the channel (Dai et al., 2013).
The formation and evolution of fluid mud are primarily governed by two factors: sediment source and hydrodynamics. First, the formation of fluid mud requires sufficient sediment to maintain high SSC (Ge et al., 2020). Second, the hydrodynamics must facilitate the aggregation and retention of suspended sediment near the bed. In fact, due to processes such as consolidation, erosion, and entrainment, fluid mud exhibits strong spatial and temporal variability (Mehta, 1991; Wehr and Malcherek, 2012). Particularly, consolidation plays a crucial role in the evolution of fluid mud, as it gradually solidifies to form a new bed in the absence of external disturbances. Given its importance, there have been a few numerical efforts to incorporate consolidation in the simulation of fluid mud (e.g., Winterwerp, 1999). Moreover, in estuaries and coastal oceans, strong tidal currents have the ability to erode and entrain fluid mud into the upper water column (Becker et al., 2018; Wu et al., 2022).
Extreme weather condition is known to favor the formation of fluid mud (Wright and Friedrichs, 2006). During storm events, the combined forces of strong waves and tidal currents can erode the bed, resuspend and retain sediment near the bed, ultimately resulting in the formation of a fluid sediment layer. This particular form of fluid mud is commonly known as wave-supported fluid mud and is frequently observed on the continental shelf and in estuarine subaqueous deltas (e.g., Hale and Ogston, 2015; Liu et al., 2022; Tang et al., 2023). Prolonged wave action can lead to an increase in excess pore pressure within the bed, resulting in a decrease in bed strength and localized liquefaction (Jeng, 2013; Anderson et al., 2017). In estuarine areas, winds and waves erode shoals and tidal flats, causing the resuspended sediment to converge in the channel under the action of tidal currents, ultimately forming fluid mud in the channel (Wan et al., 2014; Li W. et al., 2023). However, observations of fluid mud during storms are limited. Particularly, ship-based observations are impractical due to the difficulty of ship operations in strong waves and the potential for large measurement errors. Nevertheless, bottom tripod observations using acoustic and optical instruments enable long-term, in-situ observations regardless of weather conditions, although they do have limitations in space coverage.
On the other hand, fluid mud can also form under calm weather conditions. In fact, settling-induced fluid mud is a prominent type of fluid mud found in estuaries (Li et al., 2004). Suspended sediment in the water column gradually settles to form fluid mud during periods of weak hydrodynamics, such as slack water. This phenomenon is more prevalent in estuaries characterized by high SSC, including the Jiaojiang (Li L. et al., 2023), Severn (Manning et al., 2010), Weser (Becker et al., 2013), and Yangtze estuaries (Wu et al., 2022). The flocculation of suspended sediment is crucial for fluid mud formation, as it facilitates the rapid settling of sediment during slack water periods.
This study utilized field observations to examine the dynamics of fluid mud formation and evolution in the South Passage of the Yangtze Estuary. By analyzing in-situ data, we identified the presence of fluid mud during winter storms and elucidated the mechanisms behind its formation and breakdown through the examination of shear stress, liquefaction, erosion, and turbulence parameters. Additionally, we investigate the influence of advection and tidal pumping on the fluid mud process and present a schematic diagram illustrating the various modes of fluid mud formation in the Yangtze Estuary.
2 Study area
Our study area is located at the Yangtze estuary (Figure 1A). The Yangtze estuary is the fourth largest globally in terms of average annual sediment transport, and the runoff brings a huge amount of fine-grained sediments to the estuary (Milliman and Farnsworth, 2011). Its runoff has significant wet and dry season variations, with the wet season being approximately 2.5 times that of the dry season (Figure 1C). The Yangtze estuary is subjected to East Asian monsoon and is significantly affected by winter storms during the dry season, of which the maximum wind speeds can exceed 30 m/s.
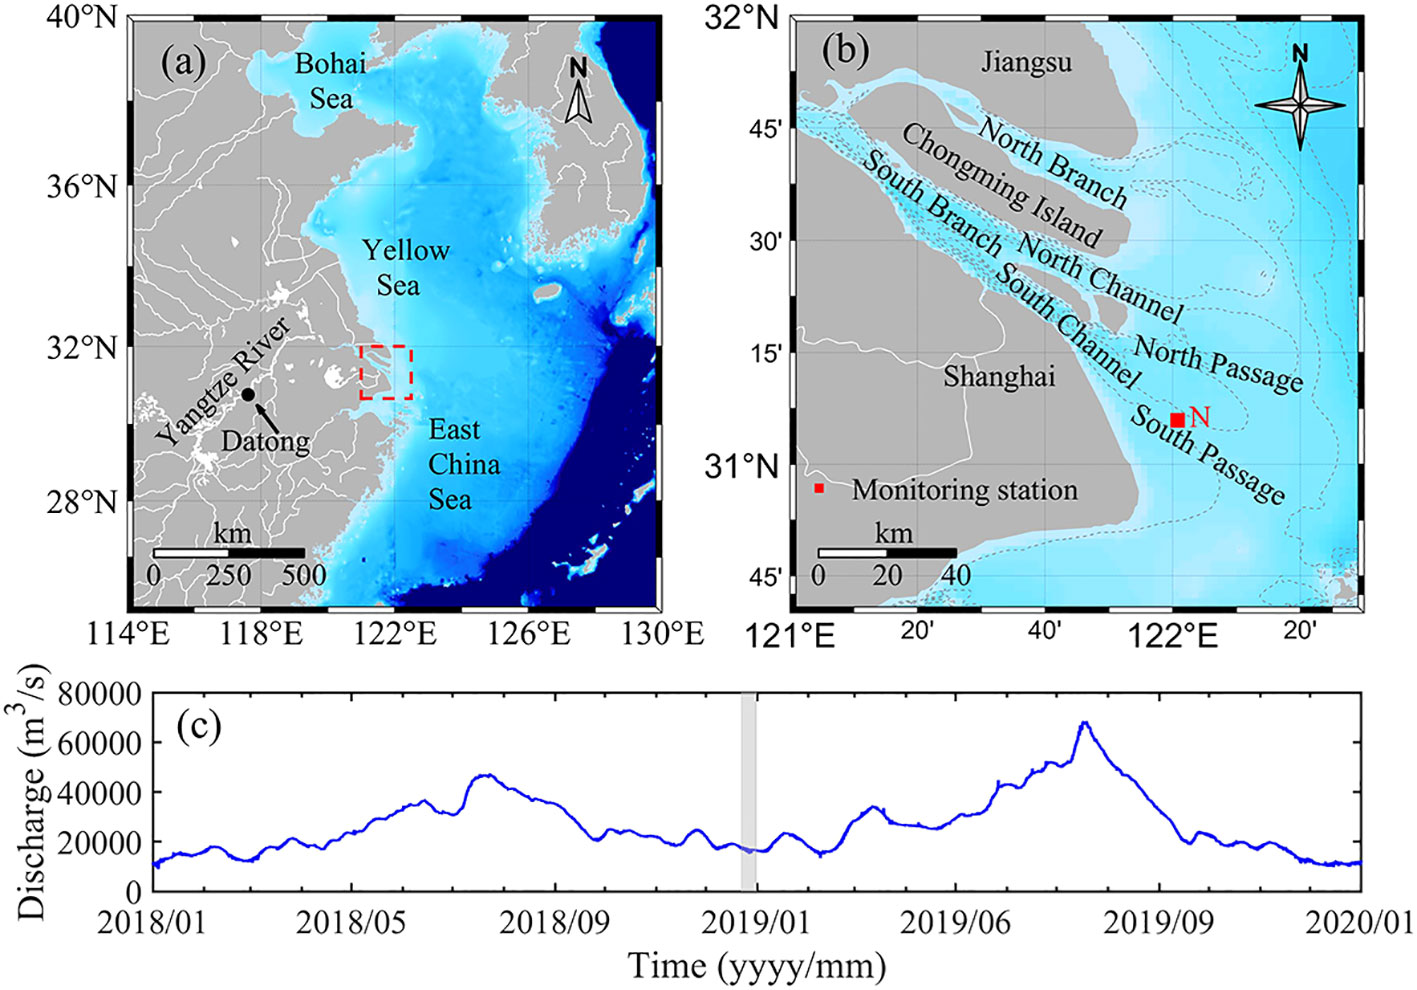
Figure 1 (A) The general location of the study area (dashed red box); (B) the monitoring station (red square) and the study area (Yangtze Estuary); (C) a two-year time series of water discharge at Datong Hydrological Station in Yangtze River (Data source: http://www.cjh.com.cn/), the period of field observation is denoted by the gray shading.
In terms of hydrodynamics, the Yangtze estuary is dominated by irregular semidiurnal tides, with an average tidal range of 2.66 m, and a maximum tidal range of 4.62 m (Chen et al., 1988). Due to shallow water constituents, tidal asymmetry is pronounced in the water level and velocity, with ebb tide dominating. The duration of ebb is generally greater than 7 hours. Waves in the Yangtze estuary are primarily wind waves. The wave climate is highly correlated with local winds, with significant seasonal variations. The average wave height in winter (up to 1.4-2.7 m) is larger than that in spring and summer (1.1-2.1 m).
3 Methods
3.1 Field observation
The observation station was located in the South Passage, near the mouth bar (Figure 1B). The observational period was between December 22 and December 31, 2018, during the transition from spring to neap tide. The observation consisted of a bottom-mounted tripod and a surface wave buoy (Figure 2). The configurations of instruments are briefly introduced below and the details are summarized in Table 1. Near-bed field water samples were collected at 1-hour intervals during the tidal cycle on December 24 and December 30, and three bed sediment samples (S1-S3) were collected during slack tide, as indicated in Figure 3A. S1 and S2 were collected prior to the winter storm event, and S3 was collected after the winter storm.
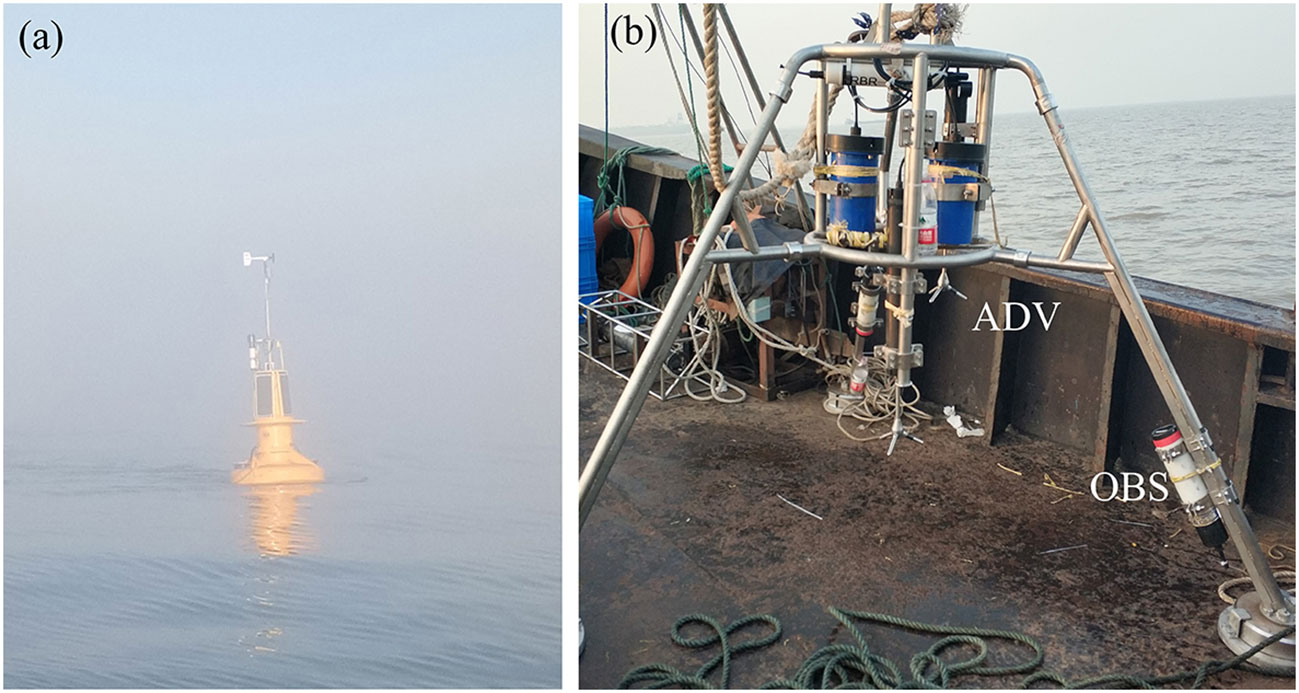
Figure 2 Photographs of field observation. (A) The wave buoy; (B) the bottom-mounted tripod.
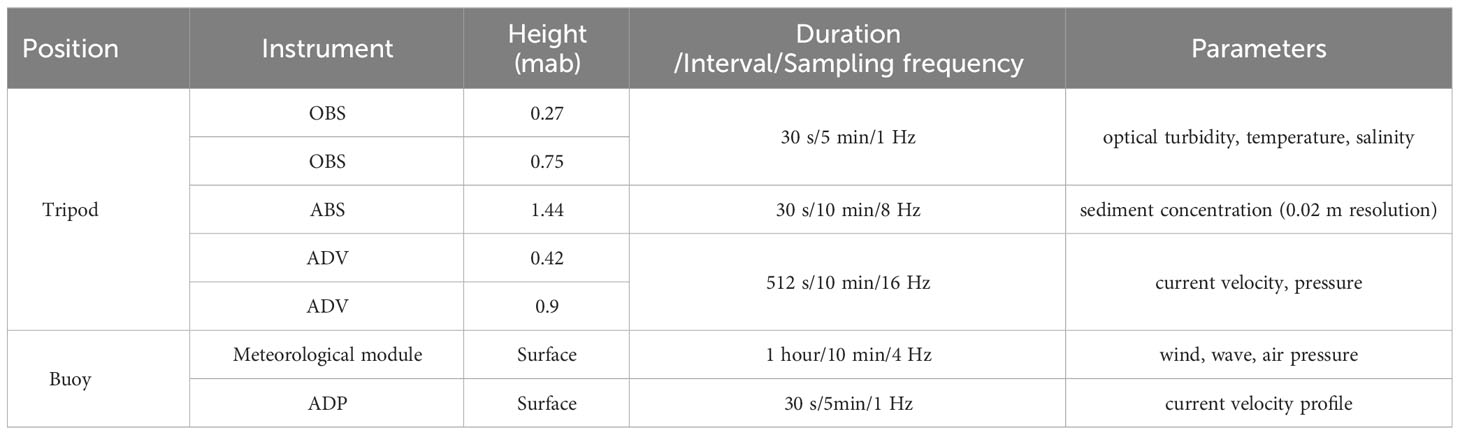
Table 1 Deployment information for instruments in the tripod and wave buoy.
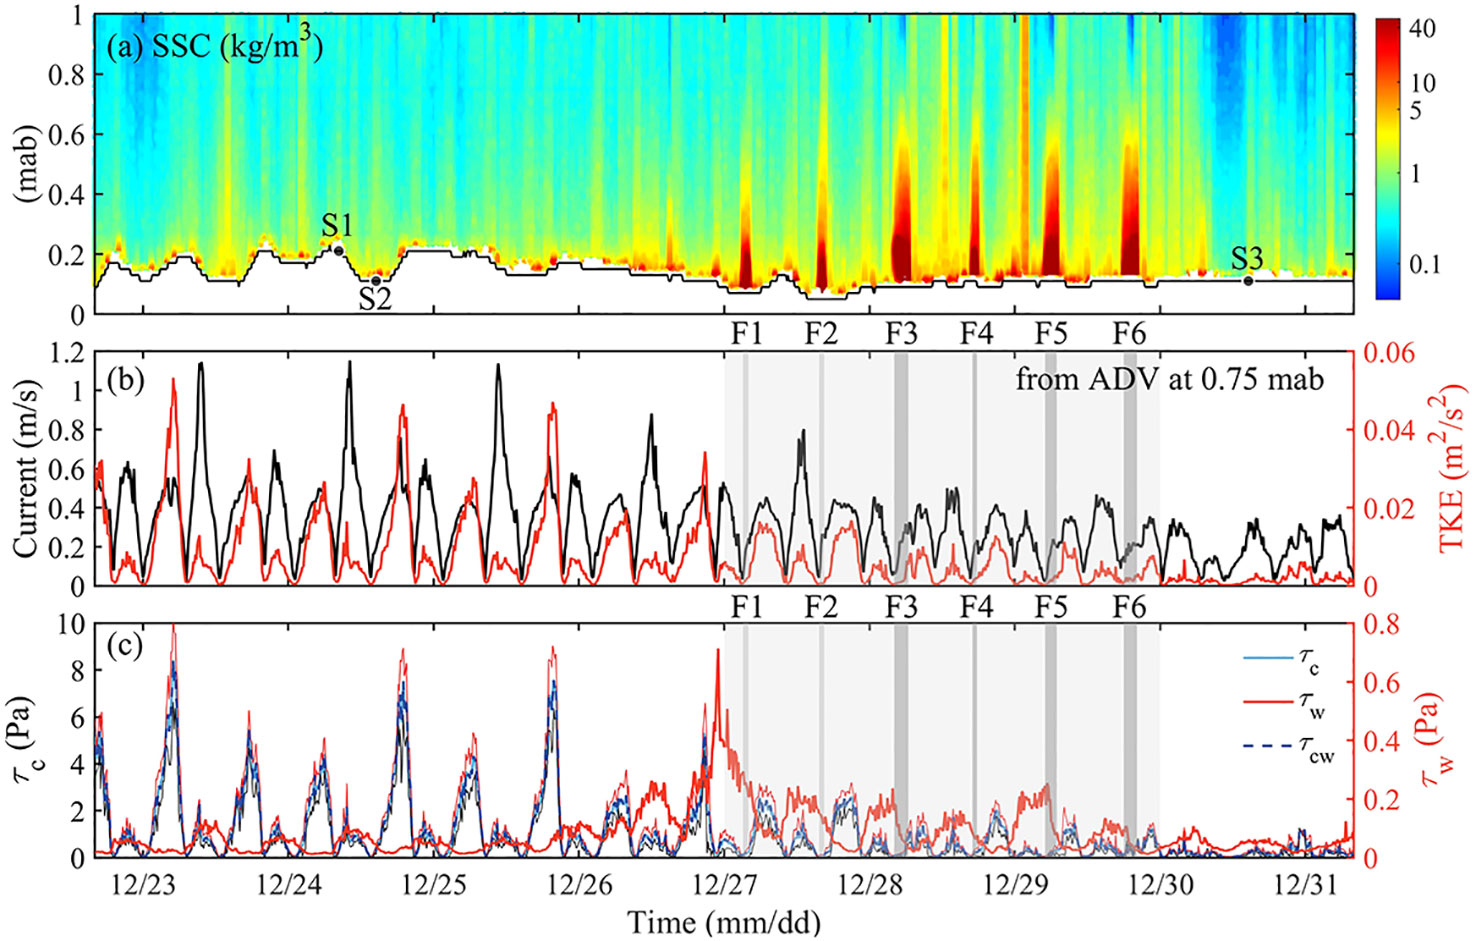
Figure 3 (A) Time-depth distribution of SSC (only show data within 1 m), three bed sediment samples were collected at S1-S3, black solid line indicates seabed variations; (B) current velocity (black line) and turbulent kinetic energy (TKE, red line) calculated from ADV at 0.75 mab; (C) estimated bed shear stress by current (τc, blue line), wave (τw, red line) and combined wave-current action (τcw, dotted line). Light gray shading represents the winter storm event, dark gray shading represents the presence of fluid mud (F1-F6).
On the tripod, two Optical Backscatter Sensors (OBSs) (OBS-3A, D&A Instrument Co.) were deployed at the heights of 0.27 mab (meters above the bed) and 0.75 mab. These OBSs measured near bottom turbidity, temperature, and salinity at 1 Hz frequency with burst mode (Table 1). A downward-looking Acoustic Backscatter Sensor (ABS, Aquatec Group Limited) with four channels (0.5, 1, 2, 4 Hz) was deployed at 1.44 mab to acquire high resolution vertical profiles (0.02 m) of SSC. Two Acoustic Doppler Velocities (ADVs) was mounted at the height of 0.42 mab and 0.9 mab. These ADVs measured high-frequency current velocity and pressure at 16 Hz with burst mode (Table 1).
On the wave buoy, a meteorological module was installed to obtain wind speed and direction, air temperature and pressure, and wave parameters such as significant wave height (Hs), wave period (T) and wave direction. In addition, a downward-looking Acoustic Doppler Profiler was mounted on the buoy to obtain current velocity profile of the water column.
3.2 SSC calibration and grain size
In order to obtain field SSCs, the method described in Wu et al. (2022) was adopted to calibrate OBS turbidity versus SSC; and the OBS turbidities were converted to SSCs based on the regression curves (Figure 4). ABS calibration was conducted with the recursive algorithmic method: the sediment sound-absorption coefficient was acquired by referring to SSCs from OBS, and ABS SSC profiles were then obtained by recursive algorithmic (see details in Wu et al. (2022). The grain size distributions of bed sediment and field water samples were obtained with a laser diffraction particle size analyzer (range 0.02–2000 μm, Malvern MasterSizer 2000).
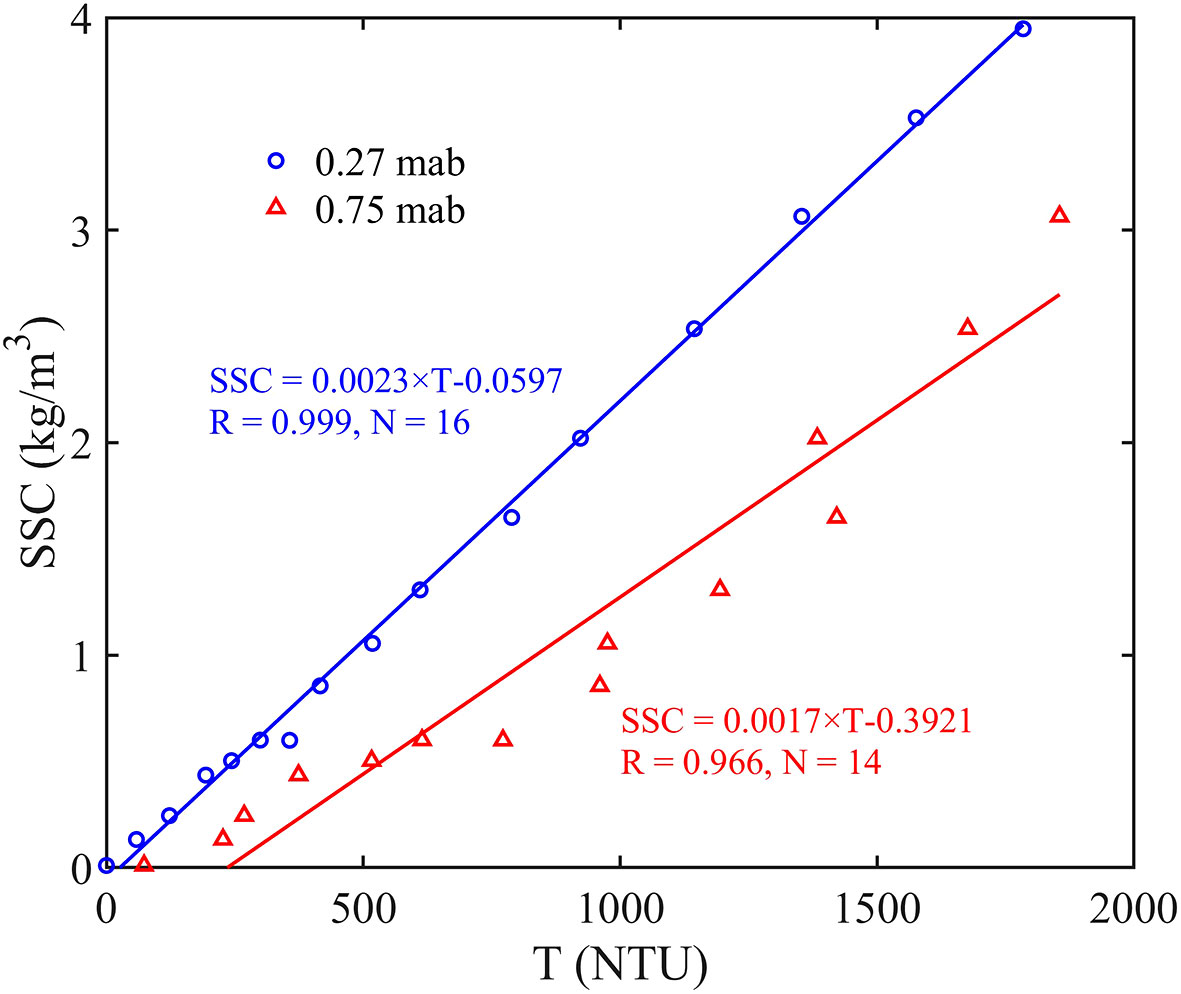
Figure 4 Calibration curves of OBS turbidity (T) and SSC at 0.27 mab (blue dots) and 0.75 mab (red triangles).
3.3 Current velocities
First, the ADV velocity data were quality controlled: data records with good signal-to-noise ratio (>20) or high correlation coefficient (>0.7) were labelled as effective. Then, the near bottom mean velocity was acquired by averaging over each burst which has over 70% effective data. The mean velocity in the upper water column was acquired from ADP with similar approach.
3.4 Liquefaction degree
Klammler et al. (2021) defined a dimensionless liquefaction parameter (liquefaction degree L):
where σz is wave induced vertical effective stress (unit m) and γw and γs are specific weights of seawater and saturated sediment, respectively. The limit of z approaching 0- is due to the fact that liquefaction occurs below the surface of the bed. If σz is negative, it will have a compressive effect on the sediment and stabilize the bed (L = 0). Positive σz values enhance sediment buoyancy and raise the risk of bed instability (L > 0). L ≥ 1 is indicative of a fully liquefied bed (i.e., a fluid state). When 0< L< 1, the low critical bed shear stresses result in an increased likelihood of bed instability and erosion, even though the bed is not fully liquefied.
The wave induced vertical effective stress (σz) can be expressed as:
where am and ϵm are the amplitude and phase of surface waves with different wave number (km) and frequency (ωm), which can be derived from ADV-measured pressure via Fourier analysis. S(z) varies with depth and is a function of bed properties such as porosity, horizontal and vertical hydraulic conductivities, degree of saturation, shear modulus, Poisson ratio, density and elastic modulus of fluid, the absolute pore pressure for average water depth, and vertical thickness of the sediment bed above some assumed rigid impermeable bedrock. For more details, please refer to Klammler et al., 2020).
Once σz exceeds the reduced gravity of sediment (gravity force minus buoyancy force), sediment instability (or bed failure) can take place; and the failure depth is the deepest location where sediment instability can occur, i.e., the depth where σz just balances with the reduced gravity.
3.5 Shear stress
The Reynolds stress method (RS), the turbulent kinetic energy method (TKE), the modified turbulent kinetic energy method (TKEw), and the turbulent inertial dissipation method (ID) are the four mainstream methods for calculating the bed shear stress induced by current (Kim et al., 2000). The specific equations are shown in Table 2, and the results of the four methods are averaged to obtain the final current shear stresses (τc).
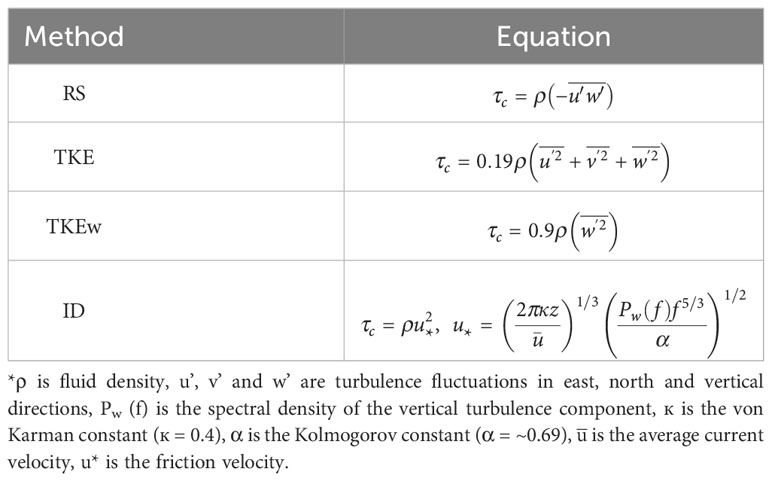
Table 2 The equations of calculating current shear stress (τc).
The bed shear stress induced by wave (τw) can be expressed as follows (Soulsby, 1995),
where fw is the wave friction factor, uw is the wave orbital velocity, Ak=Aw/ks, Aw=uwT/2 is the semi-orbital excursion, ks is the Nikuradse roughness (ks=2.5D50, D50 is the median grain size).
Based on the current and wave shear stress, combined wave and current shear stress can be calculated by Eq. (4) (Soulsby, 1995).
3.6 Suspended sediment flux
Following Dyer (1997), the net suspended sediment flux (F) can be expressed as:
where T is the tidal period, H is the water depth, u is the current velocity, c is the SSC. The subscript 0 denotes the spatial and temporal mean value, the subscript t denotes the vertically averaged tidal variation, the subscript d denotes the deviations from the vertical means, and the subscript dt denotes the temporal deviations from the tidally averaged deviations from the vertical means. Ht denotes the tidal variation in depth. Angled brackets (< >) and overbars (−) denote the means over the depth and the tidal cycle, respectively. The terms F3-F5 in Eq. (6) are tidal pumping terms and the tidal pumping induced sediment transport flux can be expressed as Ftp=F3+F4+F5.
4 Results
4.1 Temporal variation of observations
The time series of observed meteorological and hydrodynamical data are shown in Figure 5. During the observational period, winds were predominantly northerly, with an average wind speed of 8.34 m/s and a maximum wind speed of 12.60 m/s (Figure 5A). The mean depth of the observation station was 7.65 m. The tidal water level was mostly semidiurnal but with diurnal inequality and the maximum tidal range reached 4.20 m (Figure 5B). The significant wave height correlated with wind speed (Figure 5B) and the wave direction was almost identical to the wind direction (Figure 5C), indicating that the waves were dominated by wind waves. The near bottom current was reciprocating flow, which was northwestward/southeastward during flood/ebb tide (Figure 5D). The maximum flood and ebb velocities at 0.75 mab were 1.15 m/s and 0.76 m/s, respectively. The minimum current velocity (i.e., slack water) occurred approximately 80 min after high or low water. Semidiurnal variations were also significant in the temperature, salinity, and SSC time series (Figures 5E–G). The peak of near-bed SSC occurred during slack water, implying that settling led to the aggregation of suspended sediment.
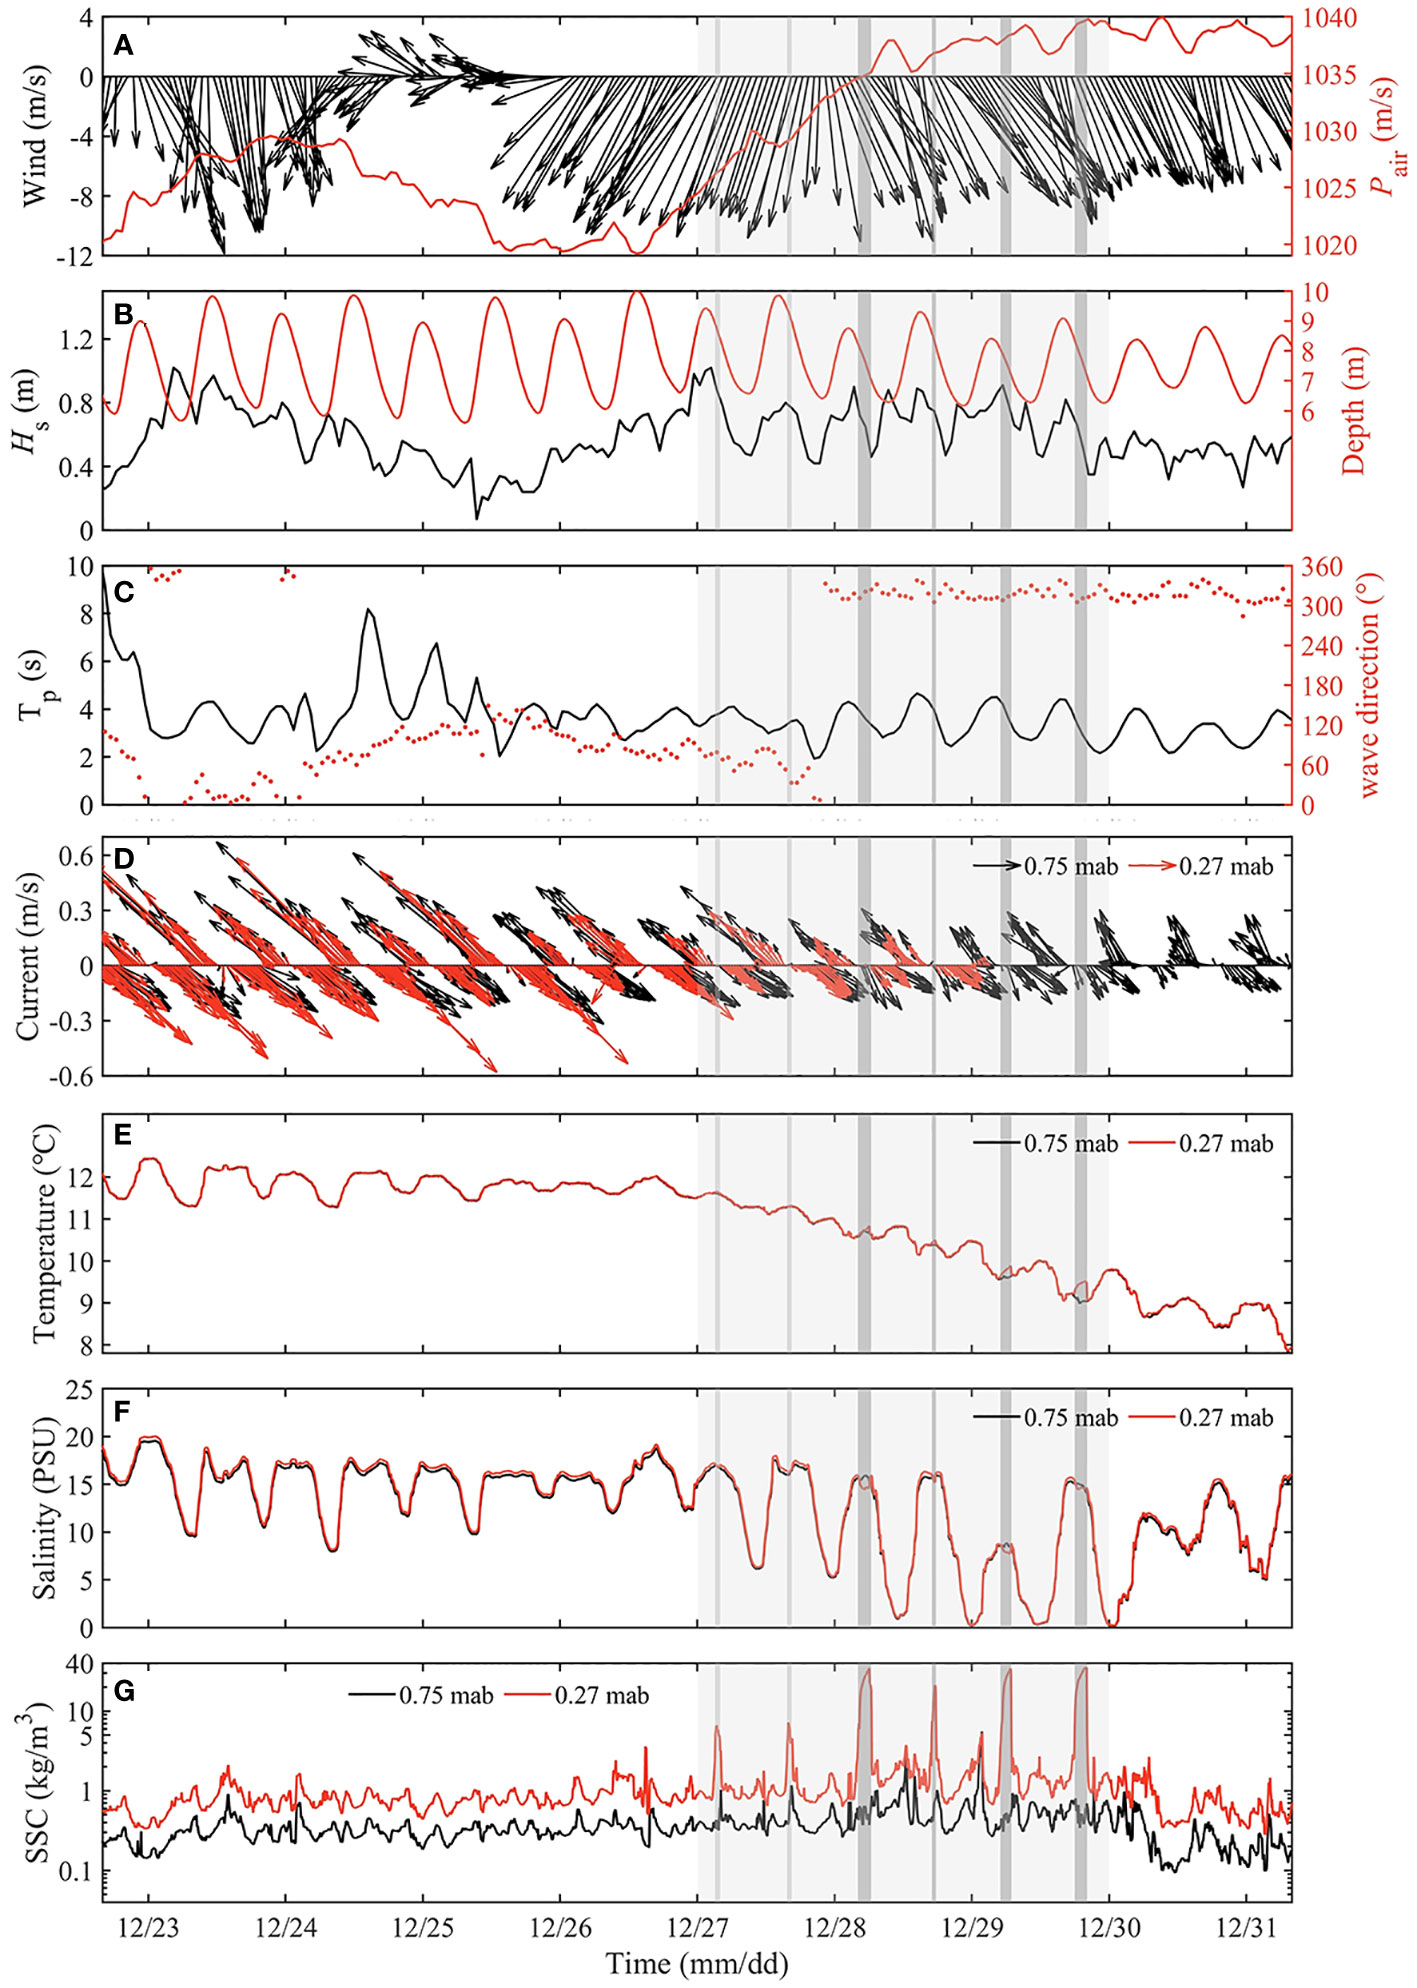
Figure 5 Time series of meteorological, hydrodynamic and water characteristics. (A) wind (black vector) and air pressure (Pair, red line); (B) significant wave height (Hs, black line) and water depth (red line); (C) wave period (Tp, black line) and wave direction (red dots); (D–G) current velocity, temperature, salinity and suspended sediment concentration (SSC) at 0.75 mab (black line) and 0.27 mab (red line). Light gray shading represents winter storm event, dark gray shading represents the presence of fluid mud (F1-F6).
There were two events with wind speeds exceeding 10 m/s (December 23rd 3:00-6:00 and 26th 4:00-29th 16:00), and accompanied by large waves, which Hs reached a maximum of 1.02 m. The windy weather was short-lived on December 23rd, with wind speed exceeding 10m/s for only four hours, and didn’t result in significant changes in near-bed water characteristics (temperature, salinity and SSC). A very distinct winter storm event occurred between December 26th and 29th (light gray shade in Figure 5) with Hs consistently greater than 0.4 m. The winter storm event occurred in the intermediate tide, which was accompanied by a rise in air pressure and a drop in near-bed water temperature of approximate 3 °C (Figures 5A, E), and resulted in a high SSC near the bed, with maximum values exceeding 20 kg/m3 (Figure 5G). Salinity minima near the bed in winter storm event was only 0.19 PSU, significantly smaller than that before the event (~7 PSU) (Figure 5F).
4.2 Characteristics of periodic fluid mud
A total of 6 fluid mud events were detected during the observation, when the near bottom SSC exceeded 10 kg/m3 (labeled F1-F6 in Figure 3A). A closer examination revealed that these events took place during certain phase of the tide. They always formed at high slack water and existed for 1-2 hours before they disappeared during the following ebb tide. The fluid mud thickness is the height difference between the top (contours with SSC of 10 kg/m3) and bottom (sea bed measured by ABS) of the fluid mud layer. The maximum thickness of fluid mud was small (only 0.18 m) for F1 and F2 and approximately 0.30 m for F3-F6 (Table 3). The maximum SSC and density at 0.27 mab in F1 and F2 were also lower than those in F3-F6; and the maximum density at 0.27 mab in F3-F6 were generally greater than 1025 kg/m3. The duration of fluid mud event was relatively short in F1, F2, and F4 (c.a. 1 hour), while it reached approximately 2 hours in F3, F5, and F6.
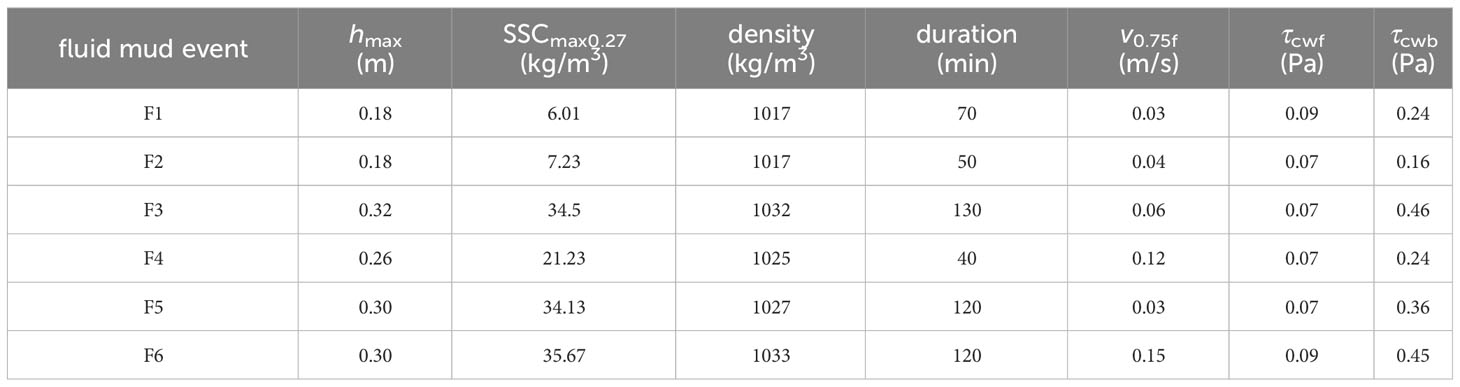
Table 3 The maximum thickness (hmax), maximum SSC at 0.27 mab (SSCmax0.27), maximum density at 0.27 mab (density) and duration of the six fluid mud events (F1-F6); the current velocity at 0.75 mab (v0.75f) and the bed shear stress (τcwf) at the moment of fluid mud formation; the bed shear stress at the moment of fluid mud breakdown (τcwb).
During F3-F6, salinity anomalies due to fluid mud were clearly evident (Figure 5F), especially at 0.27 mab; and up to 1 PSU decrease was observed. Moreover, the vertical gradient of salinity reversed during these events and salinity was lower at 0.27 mab than at 0.75 mab. Given the conductivity of sediment is significantly lower than that of water, the decrease in salinity can be attributed to high SSCs (Traykovski et al., 2004). In addition, temperature anomalies occurred simultaneously with salinity anomalies, which may also be attributed to fluid mud. A similar, but less obvious, situation was also found in F1 and F2 (see section 5.2 for detailed discussion).
4.3 Formation and breakdown of fluid mud
All 6 fluid mud events occurred during periods of high slack water (Figure 3B). In all cases, the bottom velocity was less than 0.15 m/s (v0.75f in Table 3), and TKE was less than 5×10⁻⁴ m2/s2 (Figure 3B) at the moment of fluid mud formation. Therefore, the weak hydrodynamic favored the settling of suspended sediment. Moreover, the in-situ floc particle size in the South Passage of Yangtze estuary can reach 80 μm during slack water, and the settling velocity is approximately 1 mm/s (Lu et al., 2020), which also facilitates the formation of fluid mud in a short period of time. Bed shear stress (τcw) was mainly contributed by tidal-induced shear stress (τc) rather than wave-induced shear stress (τw). Although τw increased significantly during the winter storm, τcw was weak and less than 0.3 Pa during the presence of fluid mud (Figure 3C). According to τcwf in Table 3, the critical shear stress for fluid mud formation was approximately 0.09 Pa.
The breakdown of fluid mud occurred at relatively high current velocity in the ebb tide, when the bottom velocity exceeded 0.2 m/s (Figure 3B). At this time, TKE was greater than 2×10⁻³ m2/s2, four times greater than that at the moment of fluid mud formation, suggesting that sediment entrainment due to enhanced turbulence led to the breakdown of fluid mud. It is worth noting that TKE during ebb tide was much larger than that during flood tide, which favored the sediment entrainment. The τcw was all greater than 0.15 Pa at the breakdown of fluid muds (τcwb in Table 3). However, the critical τcw for fluid mud breakdown varied among these events, which was less than 0.25 Pa in F1, F2, and F4 but reached 0.46 Pa in F3. In fact, the critical τcw depends on the consolidation of fluid mud which is a function of the density and the duration of the fluid mud (Winterwerp, 1999).
5 Discussions
5.1 Sediment sources of fluid mud
5.1.1 Local resuspension
The liquefaction degree (L), which is a dimensionless liquefaction parameter based on the vertical effective stress (Klammler et al., 2021), generally exceeded 0.25 during the winter storm event (Figure 6A). L was larger than 1 only at the maximum Hs and the failure depth caused by liquefaction was 0.047 m, which was comparable to the erosion depth (0.04 m) of the bed before F1 (Figure 3A). Despite the low τcw (< 1 Pa), the bed was eroded by 0.08 m right before F2, indicating that liquefied bed was more susceptible to erosion.
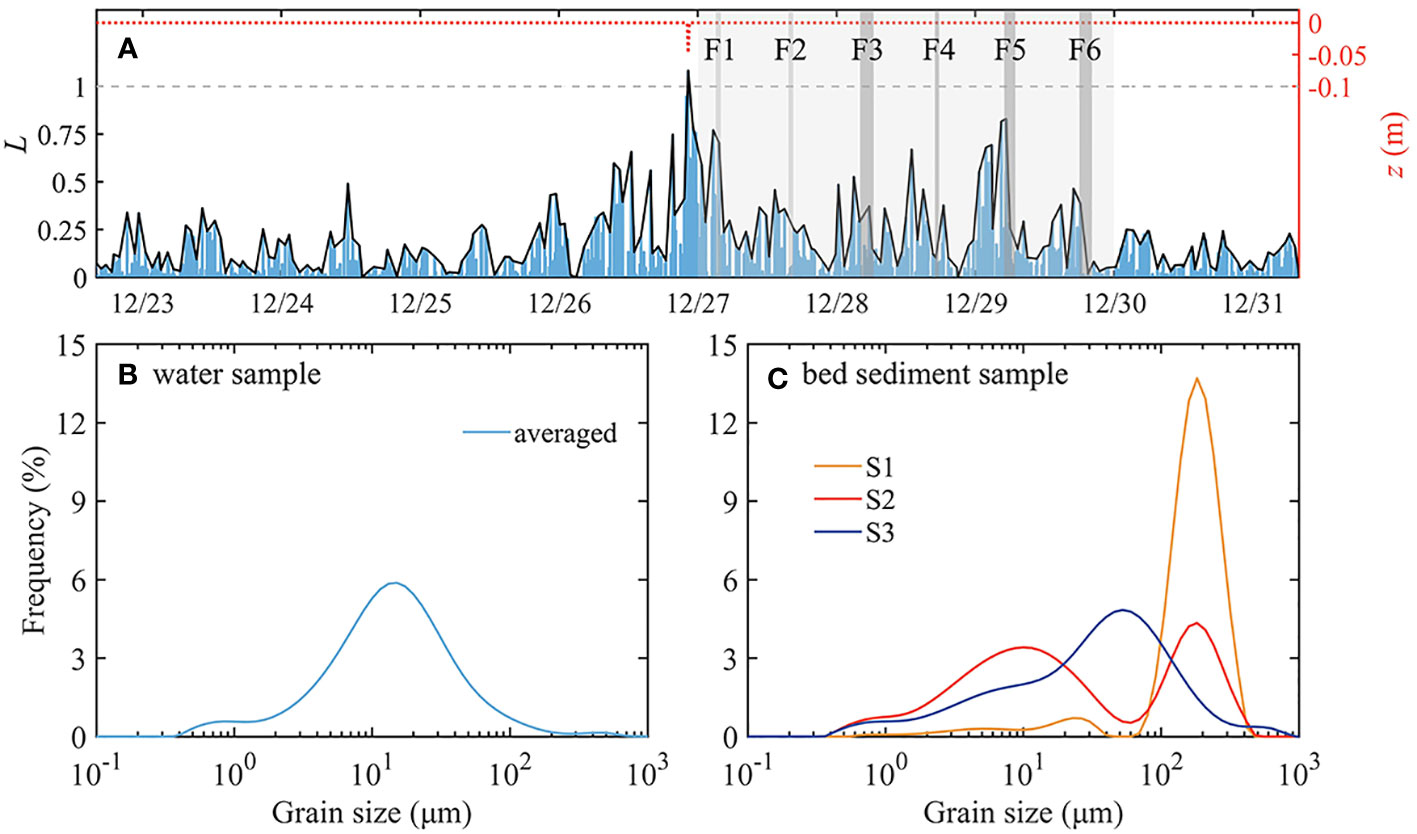
Figure 6 (A) liquefaction degree, L (blue bar) and failure (or liquefaction) depth (red dashed line), black line denote the peak of L for the local maxima of each 1-h interval, L ≥ 1 represents the presence of the liquefaction event, light gray shading represents winter storm event, dark gray shading represents the presence of fluid mud; (B, C) Grain size distribution of water samples (averaged) and bed sediment samples (S1-S3) collected from the observation field.
Compared to the bed sediment sample S1, S2 has an increased fine-grained component, which is consistent with the sediment in the water sample (Figures 6B, C). The increase in fine-grained sediments on the seabed also ensures that eroded sediments can serve as a source of fluid mud (Hale and Ogston, 2015). The grain size distribution from S2 to S3 revealed a transition in the bed sediment from a bimodal distribution to a single-peaked distribution (Figure 6C), which implies these bed sediments were highly active. Thus, locally resuspended sediments due to bed erosion provide a source for F1 and F2 events.
5.1.2 Erosion in shallow water
In contrast to F1, L was smaller than 1 and the seabed elevation did not change significantly during the tidal cycles of F3-F6. However, the thickness of fluid mud during F3-F6 was larger than that in F1, suggesting an additional sediment source. Apart from local resuspension within the channel, shallow waters are more susceptible to erosion during storms. According to the liquefaction equation in Klammler et al. (2020), the failure depth due to liquefaction could be up to 0.2 m in shallow water with an average water depth of only 2 m, which is comparable to the thickness of intertidal flats erosion during storms observed by previous authors (e.g. Li et al., 2004; Shi et al., 2021). Wave-eroded intertidal flats in the storm also contributes to the sediment supply of fluid mud.
5.2 Advection
The time derivative of SSC is attributed to both advection and local resuspension/deposition (Li et al., 2018). With a one-dimensional box model, Li et al. (2021) confirmed that sediment advection dominates over local sediment resuspension in the South Passage of the Yangtze estuary. Indeed, during F3-F6, the influence of wave-induced local resuspension decreased, while the thickness of fluid mud increased, suggesting that advection was the primary sediment source.
In fact, lateral advection in estuaries has an important influence on sediment distribution in the channel-shoal system (Scully et al., 2009; Zhou et al., 2021); and the lateral exchange of sediment between the channel and the adjacent tidal flats was known to be significant (Wang et al., 2010; Zhu et al., 2016). Numerous studies have demonstrated the impact of storm winds and waves on lateral circulation in estuaries (e.g., Chen et al., 2009; Li and Li, 2011; Green and Coco, 2014). On one hand, wind-driven lateral circulation was found to have a strong impact on the lateral distribution of SSCs (Gong et al., 2023). On the other hand, wave-induced erosion of tidal flats can effectively increase SSC over the shoal, and the lateral differences of SSC-induced density can contribute to the cross-channel baroclinic pressure gradient force, enhancing bottom currents from shoal to channel. Such process favors the formation of fluid mud by adding fine sediment to the estuarine pool (Green and Coco, 2014; Zhang et al., 2021).
A comprehensive field investigation on how lateral advection contributes to fluid mud formation requires multiple stations along the cross-channel direction, given its spatially varying nature. Nevertheless, even though this study has only one station, the available data can still provide us some hints about the role of lateral advection in fluid mud formation. Time-averaged vertical profiles of current velocity during the winter storm were compared with those during normal weather conditions (Figures 7A–D). During flood tide, the along-channel current was weaker in the surface and bottom but stronger in the middle water column during the winter storm (Figure 7A). Nevertheless, the storm-driven cross-channel current was significantly stronger in the middle water column, indicating enhanced lateral flow (Figure 7C). Meanwhile, stormy weather can result in significant erosion of sediments from shoal and tidal flats (Li et al., 2001). Therefore, lateral transport of sediment can be greatly enhanced during flood. These sediments can serve as an essential source for the formation of fluid mud during high slack water once they entered the channel. In contrast, winter storm resulted in a clear decrease in current velocities during ebb, particularly in the near-bottom layer (Figures 6D, 7B). Consequently, the lateral transport was inhibited and the insufficient sediment supply prevented the formation of fluid mud during low slack tide. Moreover, the wave direction gradually changed from northeast (cross-channel) to northwest (along-channel) during the storm (Figure 5C). This could also affect the lateral circulation via wave-current interaction (Gong et al., 2023), modulating fluid mud formation.
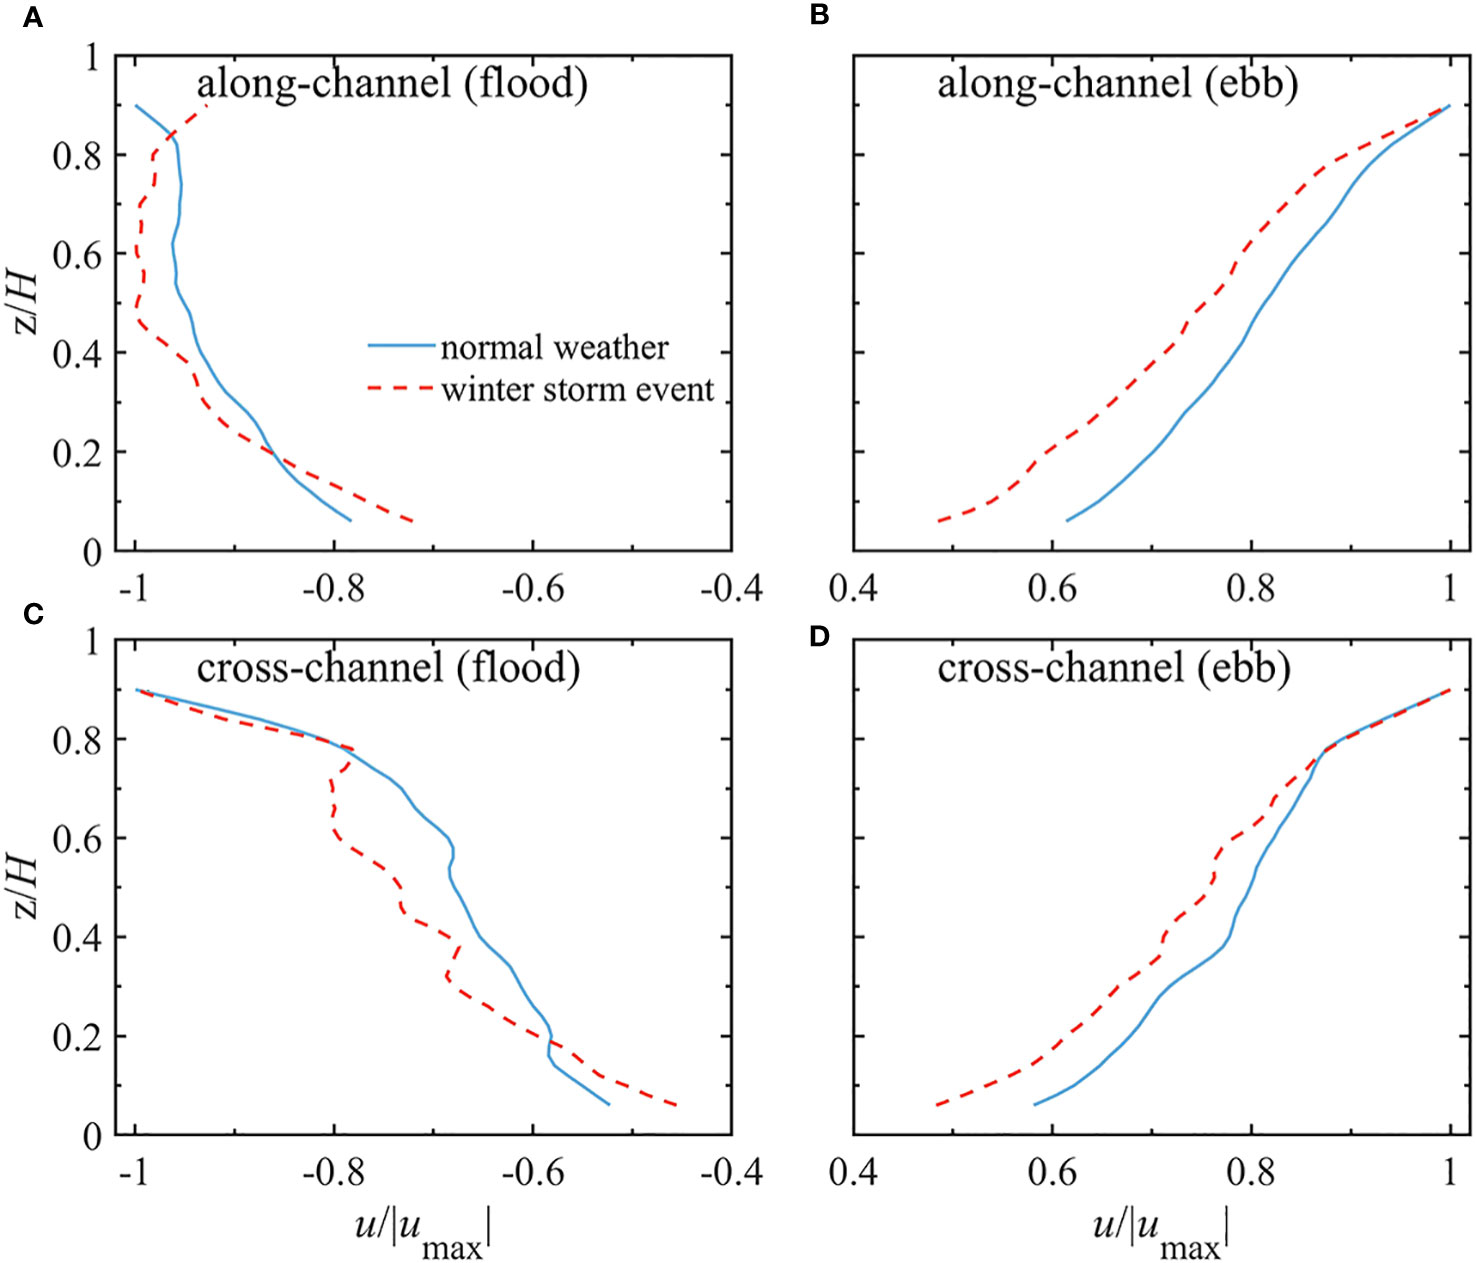
Figure 7 Time-averaged vertical profiles of current velocity in normal weather (December 23rd 19:20:00 – December 26th 22:10:00) and winter storm event (December 26th 22:10:00 – December 30th 01:00:00). (A) along-channel velocity in flood, (B) along-channel velocity in ebb, (C) cross-channel velocity in flood, (D) cross-channel velocity in ebb.
5.3 Tidal pumping
Aggregation of sediments is essential to the formation of fluid mud. In estuaries, a number of effects can lead to sediment aggregation, such as advection, tidal pumping and estuarine circulation. Among them, tidal pumping is widely acknowledged as a primary mechanism responsible for the formation and maintenance of the ETM (Dyer, 1997; Yu et al., 2014). The presence of estuarine fluid mud is typically observed within the ETM (Nichols, 1984; Schrottke et al., 2006), suggesting that tidal pumping plays a role in the formation of the fluid mud layer. Tidal pumping induces sediment convergence within the ETM, ensuring a continuous supply for the formation of fluid mud (Wu et al., 2022).
The depth-integrated sediment transport were analyzed with the decomposition method described in Dyer (1997), and tidal pumping term of each tidal cycle are shown in Figure 8. The tidal pumping flux during the tidal cycle of F3, F5, and F6, which had a thick fluid mud layer, was considerably higher compared to that during peak spring tide and normal weather (December 25). In the case of fluid mud event F4 with weak tidal pumping, there was a reduction in fluid mud thickness, indicating the limited contribution of tidal pumping to fluid mud formation. A continuous sediment supply is necessary to sustain the dynamic equilibrium between fluid mud formation and breakdown (Becker et al., 2018).
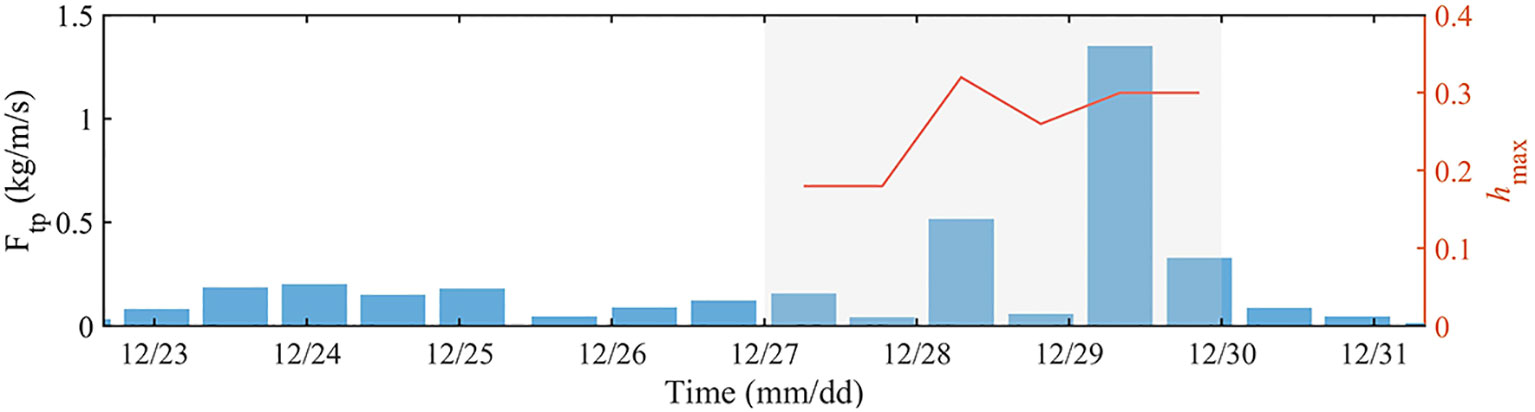
Figure 8 Tidal pumping induced sediment transport flux (Ftp) of each tidal cycle during observation and maximum thickness of fluid mud events F1-F6. Light gray shading represents the time of winter storm event.
In general, weak hydrodynamics during neap tide make it more likely for fluid mud to form and sustain (Uncles et al., 2006; Ge et al., 2020). Adequate sediment supply is a necessary condition for fluid mud formation (Kineke et al., 1996), but the reduction in tidal pumping flux can disrupt the balance between supply and demand, resulting in insufficient sediment to form the fluid mud layer during neap tide (Wu et al., 2022).
5.4 Schematic diagram of storm-induced fluid mud formation in the Yangtze Estuary
A schematic diagram of fluid mud formation under storm condition in the Yangtze Estuary is shown in Figure 9. During storm events, sediments in shallow waters such as intertidal flats can be significantly eroded. The resuspended sediments can be more easily transported to the channel by the enhanced lateral component of flood current. Meanwhile, tidal pumping can facilitate the convergence of sediment flux in the longitudinal direction. The combined effects of lateral advection and tidal pumping lead to high concentration of suspended sediment which settles rapidly to the bed during high slack water, resulting in the formation of fluid mud. The disappearance of fluid mud during the following ebb tide is related to the enhanced bottom shear stress and reduced lateral sediment supply. This fluid mud mode differs from wave-induced fluid mud on the shelf, which is formed by bed liquefaction and sediment resuspension (e.g. Hale and Ogston, 2015).
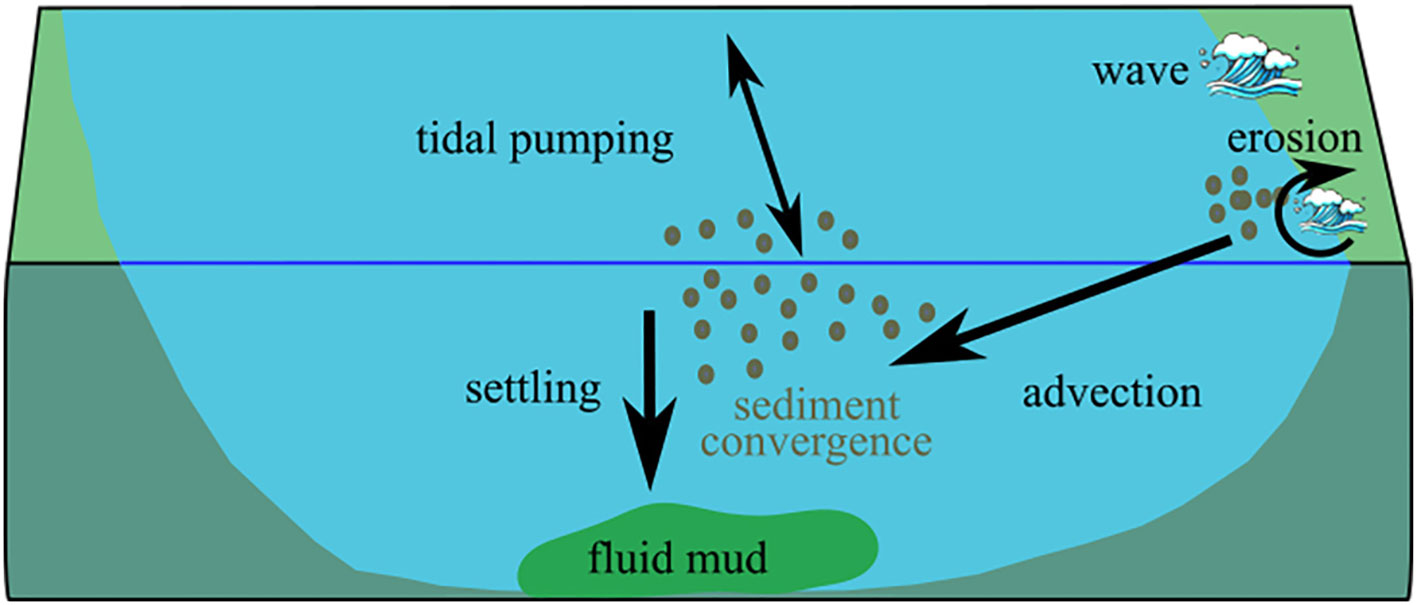
Figure 9 A schematic diagram of the fluid mud formation mode under storm condition in the Yangtze Estuary.
6 Conclusions
A bottom tripod and a wave buoy were deployed during 9 days spring-neap tidal cycle observation. An evident winter storm event occurred during the intermediate tide, characterized by rising air pressure and a decrease in water temperature. The bottom water temperature dropped by approximately 3 °C. Periodic occurrences of fluid mud (F1-F6) were observed with SSC exceeding 10 kg/m3 within the winter storm event. These fluid muds formed during periods of high slack water when hydrodynamics was weak. The thickness of fluid mud varies between the different fluid mud occurrences. Fluid muds F1/F2 have a low thickness, while F3-F6 exhibit a higher thickness, with a maximum of 0.32 m. Temperature and salinity anomalies were observed within the fluid mud occurrences, particularly for F3-F6.
The formation and disappearance of fluid mud during slack water are primarily controlled by settling and entrainment processes. During high slack water, weak hydrodynamic with low TKE favor settling of suspended sediment, resulting in the formation of fluid mud. The in-suit floc particle size can reach up to 80 μm and the settling velocity is approximately 1 mm/s, ensuring rapid settling of sediments. The critical shear stress (τcw) for fluid mud formation is estimated to be approximately 0.09 Pa. Fluid mud is present for a short duration (maximum 130 minutes), leading to its entrainment before consolidation occurs. The breakdown of fluid mud took place at early ebb tide, when the velocity at 0.75 mab exceeded 0.2 m/s. Turbulence enhanced and the τcw exceeded 0.15 Pa during the breakdown of fluid mud. However, the critical τcw for fluid mud breakdown was not constant, and varied depending on the consolidation of fluid mud, which is in relation to the density and duration of the fluid mud. The critical τcw was only 0.16 and 0.24 in F1/F2/F4, and reached a maximum of 0.70 Pa in F3.
Liquefaction and bed erosion caused by strong waves provided a source of material for the formation of fluid muds F1 and F2. However, in most cases, the waves did not reach the level of bed erosion, as observed during the F3-F6 period. Advection served as the primary source of material in F3-F6. The cross-channel current velocity significantly increases in the middle layer of the water column during flood tide, indicating an enhancement in lateral transport. During stormy weather, substantial amounts of sediment are eroded from shoals and tidal flats and transported into the channel through lateral transport. Current velocities and sediment transport by advection are reduced during ebb in the winter storm, which further results in the absence of fluid mud formation during low slack water.
Tide pumping is also a contributing factor in the maintenance of periodic fluid mud during the winter storm, as it continuously supplies sediment for fluid mud formation. The thickness of fluid mud was large during the tidal cycle of F3/F5/F6 when tidal pumping flux was large. The absence of the fluid mud layer during neap tide resulted from a reduction in both tidal pumping flux and lateral transport after the winter storm event, which disrupted the original sediment balance between supply and demand.
Data availability statement
The raw data supporting the conclusions of this article will be made available by the authors, without undue reservation.
Author contributions
HW: Conceptualization, Data curation, Formal Analysis, Investigation, Methodology, Visualization, Writing – original draft. JT: Data curation, Methodology, Writing – review & editing. WL: Data curation, Methodology, Writing – review & editing. FX: Methodology, Writing – review & editing. HY: Methodology, Writing – review & editing. FZ: Conceptualization, Formal Analysis, Resources, Supervision, Writing – review & editing. YW: Conceptualization, Formal Analysis, Resources, Supervision, Writing – review & editing.
Funding
The author(s) declare financial support was received for the research, authorship, and/or publication of this article. Financial support for the study was provided by the National Natural Science Foundation of China (U2240220, 42006151), and the Innovation Program of Shanghai Municipal Education Commission (2019-01-07-00-05-E00027).
Acknowledgments
The authors thank Jiasheng Li, Changchen Ji, Gaolei Cheng, Dezhi Cehn, Yang Chang, Tingfei Lan, Ting Lu, Dongyun Wei, Yaqing Zhao for their assistance in the field works and laboratory measurements.
Conflict of interest
The authors declare that the research was conducted in the absence of any commercial or financial relationships that could be construed as a potential conflict of interest.
The reviewer, JC, declared a past co-authorship with the author, YW.
Publisher’s note
All claims expressed in this article are solely those of the authors and do not necessarily represent those of their affiliated organizations, or those of the publisher, the editors and the reviewers. Any product that may be evaluated in this article, or claim that may be made by its manufacturer, is not guaranteed or endorsed by the publisher.
References
Anderson D., Cox D., Mieras R., Puleo J. A., Hsu T. J. (2017). Observations of wave-induced pore pressure gradients and bed level response on a surf zone sandbar. J. Geophys. Res.: Oceans 122 (6), 5169–5193. doi: 10.1002/2016jc012557
Azhikodan G., Yokoyama K. (2018). Sediment transport and fluid mud layer formation in the macro-tidal Chikugo river estuary during a fortnightly tidal cycle. Estuar. Coast. Shelf Sci. 202, 232–245. doi: 10.1016/j.ecss.2018.01.002
Becker M., Maushake C., Winter C. (2018). Observations of mud-induced periodic stratification in a hyperturbid estuary. Geophys. Res. Lett. 45 (11), 5461–5469. doi: 10.1029/2018gl077966
Becker M., Schrottke K., Bartholomä A., Ernstsen V., Winter C., Hebbeln D. (2013). Formation and entrainment of fluid mud layers in troughs of subtidal dunes in an estuarine turbidity zone. J. Geophys. Res.: Oceans 118 (4), 2175–2187. doi: 10.1002/jgrc.20153
Chen J., Shen H., Yun C. (1988). Dynamic processes and morphological evolution of the Changjiang estuary (Shanghai, China: Shanghai Science and Technology Press), 453.
Chen S. N., Sanford L. P., Ralston D. K. (2009). Lateral circulation and sediment transport driven by axial winds in an idealized, partially mixed estuary. J. Geophys. Res.: Oceans 114 (C12). doi: 10.1029/2008JC005014
Dai Z., Liu J. T., Fu G., Xie H. (2013). A thirteen-year record of bathymetric changes in the North Passage, Changjiang (Yangtze) estuary. Geomorphology 187, 101–107. doi: 10.1016/j.geomorph.2013.01.004
Dyer K. R. (1997). Estuaries: a physical introduction. 2nd edition (U.K: Chichester: John Wiley & Sons), 195.
Egan G., Manning A. J., Chang G., Fringer O. B., Monismith S. G. (2020). Sediment-induced stratification in an estuarine bottom boundary layer. J. Geophys. Res. 125 (8). doi: 10.1029/2019JC016022
Ge J., Chen C., Wang Z. B., Ke K., Yi J. I., Ding P. (2020). Dynamic response of the fluid mud to a tropical storm. J. Geophys. Res. 125 (3). doi: 10.1029/2019JC015419
Gong W., Wang J., Zhang G., Zhu L. (2023). Effect of axial winds and waves on sediment dynamics in an idealized convergent partially mixed estuary. Mar. Geol. 458, 107015. doi: 10.1016/j.margeo.2023.107015
Green M. O., Coco G. (2014). Review of wave-driven sediment resuspension and transport in estuaries. Rev. Geophys. 52 (1), 77–117. doi: 10.1002/2013RG000437
Hale R. P., Ogston A. S. (2015). In situ observations of wave-supported fluid-mud generation and deposition on an active continental margin. J. Geophys. Res.: Earth Surf. 120 (11), 2357–2373. doi: 10.1002/2015jf003630
Jeng D.-S. (2013). Porous Models for Wave-seabed Interactions (Berlin Heidelberg: Springer). doi: 10.1007/978-3-642-33593-8
Kim S.-C., Friedrichs C., Maa J.-Y., Wright L. (2000). Estimating bottom stress in tidal boundary layer from acoustic Doppler velocimeter data. J. Hydraulic Eng. 126 (6), 399–406. doi: 10.1061/(ASCE)0733-9429(2000)126:6(399)
Kineke G. C., Sternberg R. W., Trowbridge J. H., Geyer W. R. (1996). Fluid-mud processes on the Amazon continental shelf. Continental Shelf Res. 16 (5-6), 667–696. doi: 10.1016/0278-4343(95)00050-x
Klammler H., Penko A. M., Staples T., Sheremet A., Calantoni J. (2021). Observations and modeling of wave-induced burial and sediment entrainment: likely importance of degree of liquefaction. J. Geophys. Res.: Oceans 126 (8). doi: 10.1029/2021jc017378
Klammler H., Sheremet A., Calantoni J. (2020). Seafloor burial of surrogate unexploded ordnance by wave-induced sediment instability. IEEE J. Oceanic Eng. 45 (3), 927–936. doi: 10.1109/JOE.2019.2919356
Li J., He Q., Xiang W., Wan X., Shen H. (2001). Fluid mud transportation at water wedge in the Changjiang Estuary. Sci. China Chemistry 44, 47–56. doi: 10.1007/BF02884808
Li J., Wan X., He Q., Ying M., Shi L., Hutchinson S. M. (2004). In-situ observation of fluid mud in the north passage of Yangtze Estuary, China. China Ocean Eng. 18 (1), 149–156.
Li L., Wang J., Zheng Y., Yao Y., Guan W. (2023). Fluid mud dynamics and its correlation to hydrodynamics in Jiaojiang River Estuary, China. Ocean Sci. J. 58 (1), 8. doi: 10.1007/s12601-023-00102-5
Li W., Li M., Zhang X., Li J. (2023). Characteristics of fluid mud in the Yangtze Estuary: Storm, tide, and slope-triggered sediment dynamics and effects. Estuarine Coast. Shelf Sci. 281, 108194. doi: 10.1016/j.ecss.2022.108194
Li Y., Li M. (2011). Effects of winds on stratification and circulation in a partially mixed estuary. J. Geophys. Res.: Oceans 116 (C12). doi: 10.1029/2010JC006893
Li Y., Jia J., Zhu Q., Cheng P., Gao S., Wang Y. P. (2018). Differentiating the effects of advection and resuspension on suspended sediment concentrations in a turbid estuary. Mar. Geol. 403, 179–190. doi: 10.1016/j.margeo.2018.06.001
Li Y., Wang Y. P., Zhu Q., Limaye A. B., Wu H. (2021). Roles of advection and sediment resuspension-settling in the turbidity maximum zone of the Changjiang Estuary, China. Continental Shelf Res. 229, 104559. doi: 10.1016/j.csr.2021.104559
Liu X., Lu Y., Yu H., Ma L., Li X., Li W.-J., et al. (2022). In-situ observation of storm-induced wave-supported fluid mud occurrence in the subaqueous Yellow River delta. J. Geophys. Res.: Oceans 127 (7). doi: 10.1029/2021JC018190
Lu T., Wu H., Zhang F., Li J., Zhou L., Jia J., et al. (2020). Constraints of salinity- and sediment-induced stratification on the turbidity maximum in a tidal estuary. Geo Marine Lett. 40 (5), 765–779. doi: 10.1007/s00367-020-00670-8
Manning A. J., Langston W. J., Jonas P. (2010). A review of sediment dynamics in the Severn Estuary: influence of flocculation. Mar. pollut. Bull. 61, 1–3, 37-51. doi: 10.1016/j.marpolbul.2009.12.012
McAnally W. H., Friedrichs C., Hamilton D., Hayter E., Shrestha P., Rodriguez H., et al. (2007). Management of fluid mud in estuaries, bays, and lakes. I: Present state of understanding on character and behavior. J. Hydraulic Eng. 133 (1), 9–22. doi: 10.1061/(ASCE)0733-9429(2007)133:1(9)
Mehta A. J. (1991). Understanding fluid mud in a dynamic environment. Geo Marine Lett. 11, 113–118. doi: 10.1007/BF02430995
Milliman J. D., Farnsworth K. L. (2011). River Discharge to the Coastal Ocean – A Global Synthesis. Cambridge: Cambridge University Press.
Nichols M. M. (1984). Fluid mud accumulation processes in an estuary. Geo Marine Lett. 4, 171–176. doi: 10.1007/BF02281700
Ross M. A., Mehta A. J. (1989). On the mechanics of lutoclines and fluid mud. J. Coast. Res. 5, 51–62.
Schrottke K., Becker M., Bartholomä A., Flemming B. W., Hebbeln D. (2006). Fluid mud dynamics in the Weser estuary turbidity zone tracked by high-resolution side-scan sonar and parametric sub-bottom profiler. Geo Marine Lett. 26, 185–198. doi: 10.1007/s00367-006-0027-1
Scully M. E., Geyer W. R., Lerczak J. A. (2009). The influence of lateral advection on the residual estuarine circulation: A numerical modeling study of the Hudson River estuary. J. Phys. Oceanogr. 39 (1), 107–124. doi: 10.1175/2008JPO3952.1
Shi B., Yang S. L., Temmerman S., Bouma T. J., Ysebaert T., Wang S., et al. (2021). Effect of typhoon-induced intertidal-flat erosion on dominant macrobenthic species (Meretrix meretrix). Limnol. Oceanogr. 66 (12). doi: 10.1002/lno.11953
Soulsby R. (1995). “Bed shear-stresses due to combined waves and currents,” in Advances in Coastal Morphodynamics: An Overview of the G8-Coastal Morphodynamics Project. Eds. Stive M. J. F., et al. (Delft, Netherlands: Delft Hydraul.), pp. 4.20–4.23.
Tang J., Wu H., Xing F., Zhang F., Tang B., Li G., et al. (2023). Formation and transport of fluid mud triggered by typhoon events in front of the subaqueous Changjiang Delta. Mar. Geol. 460, 107052. doi: 10.1016/j.margeo.2023.107052
Traykovski P. A., Geyer W. R., Sommerfield C. K. (2004). Rapid sediment deposition and fine-scale strata formation in the Hudson estuary. J. Geophys. Res. 109 (F2). doi: 10.1029/2003JF000096
Trowbridge J. H., Kineke G. C. (1994). Structure and dynamics of fluid muds on the Amazon Continental Shelf. J. Geophys. Res. 99 (C1), 865–874. doi: 10.1029/93jc02860
Uncles R. J., Stephens J. A., Law D. J. (2006). Turbidity maximum in the macrotidal, highly turbid Humber Estuary, UK: Flocs, fluid mud, stationary suspensions and tidal bores. Estuarine Coast. Shelf Sci. 67 (1), 30–52. doi: 10.1016/j.ecss.2005.10.013
van Rijn L. (2016) Fluid Mud Formation. Available at: www.leovanrijn-sediment.com.
Wan Y., Roelvink D., Li W., Qi D., Gu F. (2014). Observation and modeling of the storm-induced fluid mud dynamics in a muddy-estuarine navigational channel. Geomorphology 217, 23–36. doi: 10.1016/j.geomorph.2014.03.050
Wang Y., Shen J., He Q. (2010). A numerical model study of the transport timescale and change of estuarine circulation due to waterway constructions in the Changjiang Estuary, China. J. Mar. Syst. 82, 154–170. doi: 10.1016/j.jmarsys.2010.04.012
Wehr D., Malcherek A. (2012). Numerical Simulation of Fluid Mud Dynamics – The isopycnal Model MudSim. Die Küste 79 (79), 1–52.
Winterwerp J. C. (1999). On the dynamics of high-concentrated mud suspensions. PhD thesis. (Delft, The Netherlands: Delft University of Technology), 171.
Winterwerp J. C. (2002). On the flocculation and settling velocity of estuarine mud. Continental Shelf Res. 22 (9), 1339–1360. doi: 10.1016/S0278-4343(02)00010-9
Wright L. D., Friedrichs C. T. (2006). Gravity-driven sediment transport on continental shelves: A status report. Continental Shelf Res. 26 (17), 2092–2107. doi: 10.1016/j.csr.2006.07.008
Wu H., Wang Y. P., Gao S., Xing F., Tang J., Chen D. (2022). Fluid mud dynamics in a tide-dominated estuary: A case study from the Yangtze River. Continental Shelf Res. 232, 104623. doi: 10.1016/j.csr.2021.104623
Wurpts R. (2005). 15 Years Experience with Fluid Mud: Definition of the Nautical Bottom with Rheological Parameters. Terra et Aqua 99, 22–32.
Yu Q., Wang Y., Gao J., Gao S., Flemming B. (2014). Turbidity maximum formation in a well-mixed macrotidal estuary: The role of tidal pumping. J. Geophys. Res.: Oceans 119 (11), 7705–7724. doi: 10.1002/2014jc010228
Zhang G., Chen Y., Cheng W., Zhang H., Gong W. (2021). Wave effects on sediment transport and entrapment in a channel-shoal estuary: the pearl river estuary in the dry winter season. J. Geophys. Res.: Oceans 126 (4), e2020JC016905. doi: 10.1029/2020JC016905
Zhou Z., Ge J., van Maren D. S., Wang Z. B., Kuai Y., Ding P. (2021). Study of sediment transport in a tidal channel-shoal system: lateral effects and slack-water dynamics. J. Geophys. Res. 126 (3). doi: 10.1029/2020JC016334
Keywords: fluid mud, bed shear stress, advection, tidal pumping, Yangtze estuary
Citation: Wu H, Tang J, Li W, Xing F, Yang H, Zhang F and Wang YP (2023) Fluid mud induced by periodic tidal advection and fine-grained sediment settling in the Yangtze estuary. Front. Mar. Sci. 10:1323692. doi: 10.3389/fmars.2023.1323692
Received: 18 October 2023; Accepted: 20 November 2023;
Published: 06 December 2023.
Edited by:
Yifei Zhao, Nanjing Normal University, ChinaCopyright © 2023 Wu, Tang, Li, Xing, Yang, Zhang and Wang. This is an open-access article distributed under the terms of the Creative Commons Attribution License (CC BY). The use, distribution or reproduction in other forums is permitted, provided the original author(s) and the copyright owner(s) are credited and that the original publication in this journal is cited, in accordance with accepted academic practice. No use, distribution or reproduction is permitted which does not comply with these terms.
*Correspondence: Fan Zhang, fzhang@sklec.ecnu.edu.cn