Site fidelity and population parameters of pantropical spotted dolphins in the Eastern Caribbean through photographic identification
 Baptiste Courtin1,2
  Cédric Millon1 Aurore Feunteun2 Morjane Safi2 Nathalie Duporge2
  Jaime Bolaños-Jiménez3,4
  Dalia C. Barragán-Barrera5,6,7
  Laurent Bouveret1
  Benjamin de Montgolfier2,8*
- 1Observatoire des Mammifères Marins de l’Archipel Guadeloupéen (OMMAG), Route Hégésippe Légitimus, Port-Louis, Guadeloupe
- 2Aquasearch, Zone Artisanale et Commerciale (ZAC) Les Côteaux, Sainte-Luce, Martinique
- 3Laboratorio de Mamíferos Marinos (LabMMar-IIB-ICIMAP-UV), Universidad Veracruzana, Xalapa, Mexico
- 4Caribbean-Wide Orca Project (CWOP), Universidad Veracruzana, Xalapa, Mexico
- 5Instituto Javeriano del Agua, Pontificia Universidad Javeriana, Bogotá, Colombia
- 6R&E Ocean Community Conservation Foundation, Oakville, ON, Canada
- 7Fundación Macuáticos Colombia, Medellín, Colombia
- 8Institut des Sciences de la Mer de Rimouski, Rimouski, QC, Canada
The Agoa protected marine area, located in the French West Indies, eastern Caribbean, holds several cetacean species, of which the pantropical spotted dolphin Stenella attenuata is the most commonly observed. This species is the focus of whale-watching activities off the leeward coasts of Guadeloupe and Martinique, which has allowed the development of a citizen science program to characterize individuals through the collection of photographic data. Here, we conducted a photo-identification study with a sample of 115,705 photos collected between 2014 and 2019, in which 290 marked individuals (179 in Guadeloupe and 111 in Martinique) were identified. Based on an Agglomerative Hierarchical Classification (AHC) analysis, dolphins from each island were separated into two residency clusters. The Catch–Mark–Release (CMR) POPAN statistical model for open populations estimated the pantropical spotted dolphin populations in Guadeloupe and Martinique at 657 (95% CI: 525–821) and 336 (95% CI: 253–446) individuals for frequent users, respectively, while occasional visitors were estimated at 3,063 (95% CI: 2,133–4,398) and 1,443 (95% CI: 1,024–2,033), respectively. The Martinique population tended to use a reduced coastal area and appeared to be smaller and stable, while the Guadeloupe population showed a slight decline in abundance throughout the study period. These results showed that the leeward coasts of Guadeloupe and Martinique are of particular importance for pantropical spotted dolphin populations, highlighting the need for continued monitoring through both scientific and citizen science programs to fill information gaps on this species in the eastern Caribbean.
1 Introduction
The monitoring of wild animal species is essential for the effective assessment of the movements, structure, and size of their populations—information that is key to the development of management plans (Gormley et al., 2012; Chan and Karczmarski, 2017). Capture-recapture is one of the most common methods used to estimate these parameters (Cormack, 1964; Jolly, 1965; Seber, 1982; Wells and Scott, 1990; Whitehead, 1990; Hammond, 1990a). Particularly for cetaceans, CMR modeling coupled with non-intrusive and relatively inexpensive techniques such as photo identification have been widely used to determine these parameters, either with systematic surveys (Miller, 1990; Chan and Karczmarski, 2017; Haughey et al., 2020) or via opportunistic observations (Robbins et al., 2006; Robbins et al., 2020). This has led to a better understanding of marine mammal ecology, which remained poorly studied because of technical difficulties related to the fact that they have wide distributional ranges and are observable only when they surface (Dufault et al., 1999; Gowans et al., 2007; Shirihai and Jarett, 2007; Jefferson et al., 2015).
Photo identification (Adams et al., 2006; Rosel et al., 2011; Urian et al., 2015; Nowacek et al., 2016) has allowed the identification of inter-island movements of short-finned pilot whales (Globicephala macrorhynchus) and sperm whales (Physeter macrocephalus) between the Lesser Antillean islands (Gero et al., 2007; De Vries, 2017), annual migrations of humpback whales (Megaptera novaeangliae) across the Atlantic (Whitehead and Moore, 1982; Katona and Beard, 1990; Smith et al., 1999), and long-distance movements of common bottlenose dolphins (Tursiops truncatus) off the Irish coast (O’Brien et al., 2009). Moreover, combining photo identification with statistical CMR models that take into account population heterogeneity and different residency patterns within a population (Hammond, 1990b; Pradel et al., 1997; Whitehead and Wimmer, 2005; Morteo et al., 2012; Pradel and Sanz-Aguilar, 2012) has allowed the estimation of the structure, size, and residency parameters of dolphin populations such as Indo-Pacific bottlenose dolphins (Tursiops aduncus; Zanardo et al., 2016; Hunt et al., 2017; Haughey et al., 2020), common bottlenose dolphins (Silva et al., 2009; Bolaños-Jiménez et al., 2021), and spinner dolphins (Stenella longirostris; Tyne et al., 2014). However, no similar studies have been conducted for other Stenella dolphins.
The pantropical spotted dolphin (Stenella attenuata; hereafter PSD) is distributed worldwide in tropical oceanic zones between latitudes 30–40°N and 20–40°S, and it is one of the most common cetacean species in the Atlantic Ocean (Shirihai and Jarett, 2007; Jefferson et al., 2015; Perrin, 2018; Perrin, 2020). Because of its wide distribution and its top-predator trophic position, it is often considered an umbrella species, meaning that conservation efforts implemented for this species will benefit many other species sharing the same habitat (Jefferson et al., 2015). In the French West Indies, PSD is observed year-round in the western area near the leeward (western) coasts of Guadeloupe and Martinique (Mayol et al., 2016). The species is frequently observed within Agoa Sanctuary, a 140,000 km² marine protected area created in 2010 that covers the entire exclusive economic zone of French waters in the Caribbean, including Guadeloupe and Martinique (Ministère de l’Écologie, du Développement durable, des Transports et du Logement, 2011; Office Français de la Biodiversité, 2012). However, PSD is subject to multiple natural and anthropogenic pressures such as chemical and acoustic pollution, injuries related to commercial fishing, repeated disturbances caused by maritime traffic, climate change, hunting, and bycatch (Cuzange, 2011; Gandilhon, 2012; Mayol et al., 2016; Avila et al., 2018; Feunteun et al., 2018; Safi et al., 2020). Adverse interactions with fisheries and bycatch in particular have been reported as the main threats for PSD worldwide and even in the Caribbean (Avila et al., 2018). For example, populations in the eastern tropical Pacific have experienced dramatic mortalities caused by the purse seine fishery for tuna, with about 3 million individuals being killed from 1959 to 1972; some populations still do not show clear signs of recovery (Gerrodette et al., 2008; Jefferson et al., 2015). Although no information on PSD bycatch is available for the Caribbean, a recent study based on overlapping purse-seine fishing areas and areas of potential PSD distribution suggests that coastal areas of Venezuela as well as surrounding eastern areas have a potentially high risk of bycatch (Pino and Laura, 2021). Thus, this species may be exposed to several pressures that can vary from one island to another in the West Indies (Cuzange, 2011), which highlights the importance of knowing population movements with the aim of proposing adequate conservation plans for each area.
For the islands of Guadeloupe and Martinique, the whale-watching industry has increasingly focused on PSD since it is the most commonly observed cetacean species on the leeward coasts of these islands (more than 50% of observations; Gandilhon, 2012; Mayol et al., 2016; Feunteun et al., 2019). For this reason, PSD conservation is a priority for both ecological and economic reasons. As a result, a citizen science program has been implemented in the area, and the number of observations has allowed the study of PSD for both islands. A preliminary study based on data from 2018 and 2019 (Courtin et al., 2022) suggested separate PSD populations for Guadeloupe and Martinique, with very little exchange between them. In addition, the study showed a heterogeneity in the Martinique population, with two resident clusters: one composed of frequent users and the other of occasional or transient individuals.
Studies on PSD ecology in the Caribbean are scarce (but see, e.g., Mignucci-Giannoni et al., 2003; Barragán-Barrera et al., 2019), and works based on PSD photo-ID data have been conducted only in Hawaii (Psarakos et al., 2003; Machernis et al., 2021). In Martinique and Guadeloupe, a first study using 2018 and 2019 citizen science data revealed preliminary information on the movement, abundance, and residency patterns of PSD individuals between islands (Courtin et al., 2022). Here, we continued that previous work, using a novel dataset on PSD collected from 2014 to 2017 to confirm movements between the islands as well as to determine the size and residency patterns of PSD populations of both islands using the photo-identification technique and CMR statistical modeling. This study shows the effectiveness of a citizen science program to obtain relevant biological, ecological, and population data on a little-studied cetacean species in the Caribbean such as PSD.
2 Materials and methods
2.1 Study area
Martinique and Guadeloupe are two islands in the eastern Caribbean within the French West Indies; PSD is observed off their leeward coasts year-round. These islands are part of Agoa Sanctuary, a maritime area where cetaceans and their habitats are fully protected: killing or approaching within 300 m of an individual is prohibited. However, professional enterprises such as whale-watching companies can approach to within 100 m of cetaceans by following additional regulations and after signing an approach chart (Ministère de l’Écologie, du Développement durable, des Transports et du Logement, 2011; Office Français de la Biodiversité, 2012). The leeward side of these islands offer an area protected from the swell and trade winds of the Atlantic Ocean. In addition, these waters have depths up to 1,000 m near the coast, which appears to be favorable to the presence of PSD (Gowans et al., 2007; Barragán-Barrera et al., 2019). This species occurs relatively close to the coast, within 2.5 and 3.5 nautical miles from Martinique and Guadeloupe, respectively, which facilitates their observation by small and medium-sized whale-watching boats. The islands share a similar climate due to their geographical proximity (Figure 1A). Two seasons are commonly described: the dry season (carême) from December to May, and the wet season (hivernage) from June to November, which corresponds to the hurricane season (DEAL Guadeloupe, 2012). The seasons are separated by transition periods in terms of rainfall and temperature (Cerema, 2020; Météo France, 2020). Following Courtin et al. (2022), each year was divided into four sampling periods to homogenize the data and refine the statistical models as follows: early dry season: (ED = December to February), late dry season (LD = March to May), early wet season (EW = June to August), and late wet season (LW = September to November), yielding a total of 24 sampling periods (Rosel et al., 2011). Given the overlap of the early dry seasons among years and because December 2013 was not included in our data sample, ED 2014 consists only of January and February 2014 for both islands.
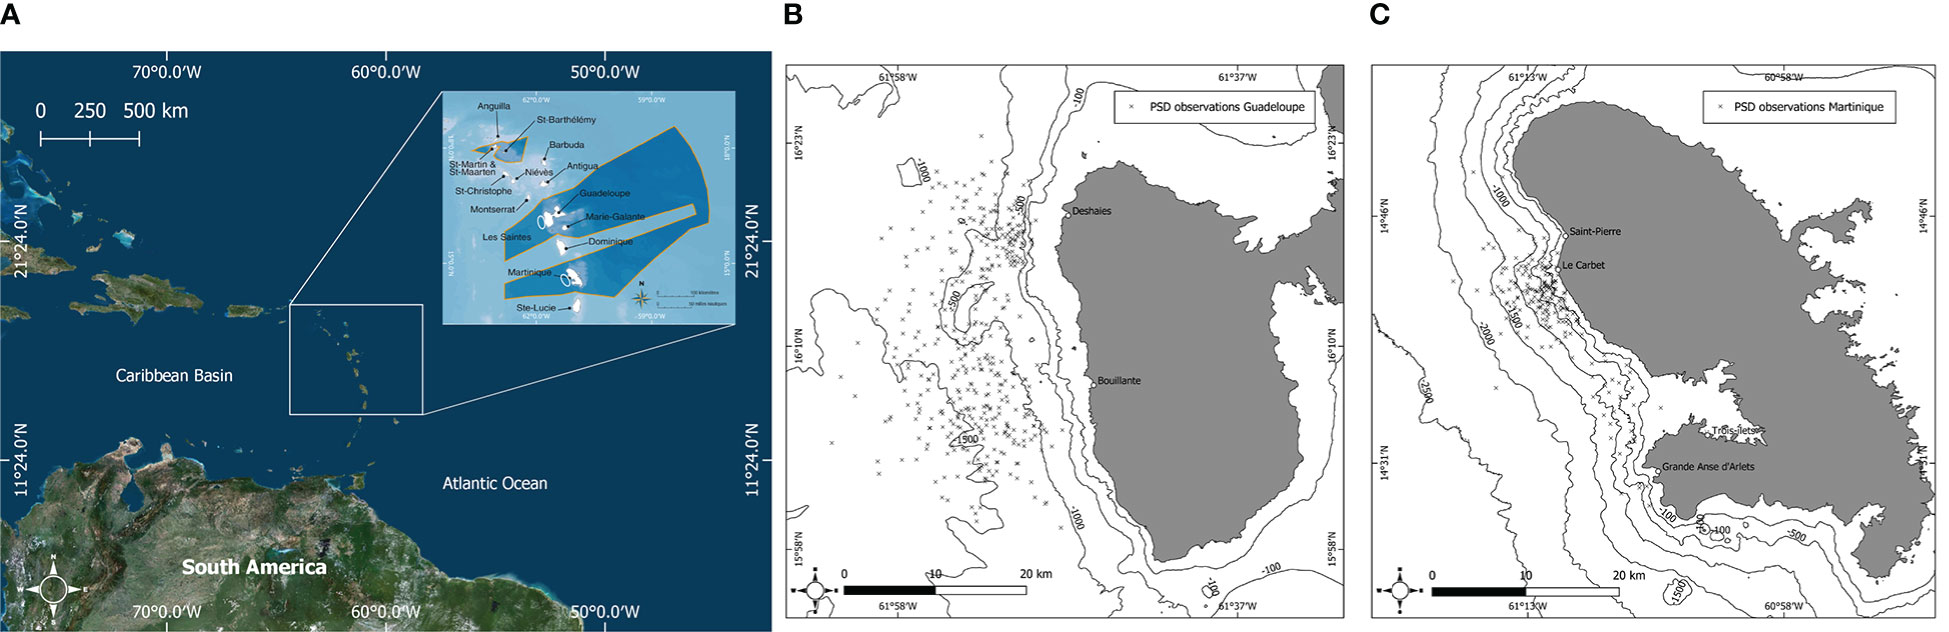
Figure 1 (A) Map of the eastern Caribbean showing the location of Agoa Sanctuary (dark blue polygon). The study sites in Guadeloupe and Martinique are shown by white encircled areas. Map of the leeward coasts of Guadeloupe (B) and Martinique (C) showing the locations of observed pantropical spotted dolphins, Stenella attenuata, between 2014 and 2019.
2.2 Data collection
Data were collected between January 2014 and November 2019 from 0730 to 1800 h. Except for LD 2016 in Guadeloupe, when no photos were taken, all sampling periods were covered. Based on the methodology in Courtin et al. (2022), data collection in Guadeloupe was carried out through citizen-based science programs of the “Observatoire des Mammifères Marins de l’Archipel Guadeloupéen” (OMMAG), which involves whale-watchers, citizens, and researchers. OMMAG is a network that gathers photos of cetaceans around the Guadeloupe archipelago and classifies them to make them available for science programs. Photos were taken between latitudes 16°23’N and 15°58’N and between longitudes 061°63’W and 061°48’W (Figure 1B). More than 95% of the photos in Guadeloupe were taken by the whale-watching companies Guadeloupe Evasion Découverte (GED) and Cétacés Caraïbes, which departed from Deshaies and Bouillante, respectively (Figure 1B), while the remaining 5% were taken by other OMMAG members. In Martinique, data were collected by the Aquasearch scientific team during dedicated surveys departing from Trois-îlets or onboard whale-watching boats departing from Grande-Anse d’Arlets and Trois-îlets (Figure 1C). Photos were taken between latitudes 14°28’N and 14°44’N and between longitudes 61°05’W and 61°17’W (Figure 1C). When a group of PSD was observed, an observation record was created that included date, time, GPS position, estimated group size, predominant activity, heading, and age class of the group (mothers and calves, juveniles, sub-adults, and adults). Age classes were determined by considering the size of individuals and their color pattern, with calves being less than ¾ the size of an adult, showing no spotting, and always staying close to an adult, and juveniles being ¾ the size of an adult, having dark ventral spotting, and usually swimming in close association with an adult (Shirihai and Jarett, 2007; Jefferson et al., 2015; Perrin, 2018). However, for subsequent analysis, only data from adults were considered. A group of dolphins was defined as a group of individuals performing the same activity (Shane, 1990) with group members remaining in relative proximity (<50 m; Mann, 1999). Individuals were photographed at each observation, targeting their dorsal fins whenever possible. Whale watchers associated with OMMAG used Nikon D500, D7200, and D3200 cameras mounted with 70- to 200-mm and 18- to 300-mm lenses. Aquasearch observers used Nikon D7100 and D3500 cameras, both with 70- to 300-mm lenses. GPS positions of each observation were compiled to build PSD distributional maps for each island.
2.3 Photo-identification analysis
Dolphin photo-ID analyses were mainly based on the dorsal fin marks of each individual. To avoid false-positive or false-negative identifications because some fin marks were too similar (Würsig and Jefferson, 1990; Urian et al., 2015), analyses were limited to well-marked individuals by a careful sorting of photos according to their quality as well as their distinctiveness (Urian et al., 2015; Passadore et al., 2017). A quality score was assigned to each photo based on its sharpness, contrast, and angle of view of the dorsal fin: Q1 = very good quality, Q2 = good quality, and Q3 = average or poor quality. A score for the distinctiveness of the individual was also assigned, independently of the photo quality score: D1 = very distinctive, D2 = fairly distinctive, and D3 = moderately or not distinctive (Figure 2). Only photos with Q1 and Q2 quality as well as D1 and D2 distinctiveness were used for the analysis (Urian et al., 2015). The best photo (left or right side of the fin) of each individual was chosen to be compared with a catalog that had been developed during the preliminary study (Courtin et al., 2022) with the Windows® software Photos. If there was no match, a new ID was assigned to the individual before adding it to the catalog. An individual was considered “captured” when it was photo-identified for the first time and “recaptured” if it was subsequently photo-identified. These results were compiled into a capture–recapture matrix (or sighting history) for analysis. Discovery curves (Fisher et al., 1943; Colwell et al., 2004) were obtained by compiling the cumulative number of marked individuals identified for the first time according to each consecutive month of sampling.
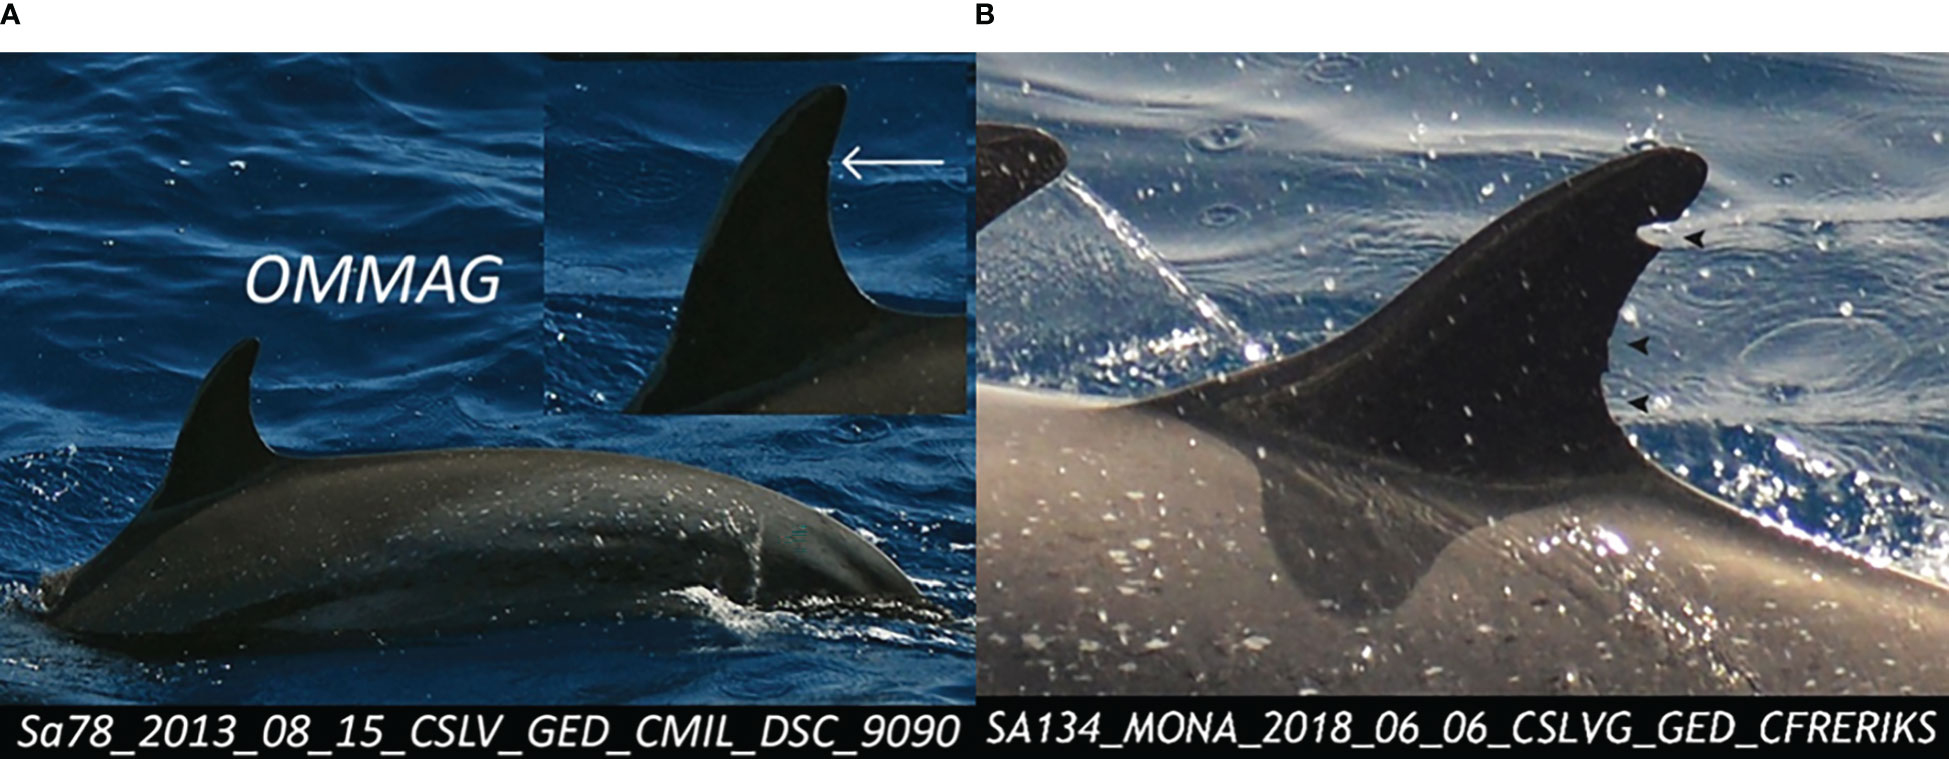
Figure 2 Images of a lightly marked individual (D3) pantropical spotted dolphin, Stenella attenuata, with a simple superficial notch (A, left) vs. a well-marked individual (D2) with deep and multiple notches (B, right).
2.4 Individual encounter rates
The number of photos, observations, identifications, and identified individuals were calculated. The recapture rate R% was determined for each island using the following equation:
where R is the number of individuals that have been recaptured at least once and N is the total number of individuals identified in the study area.
2.5 Closure test and goodness of fit
The CloseTest program was used to test population closure (Stanley and Burnham, 1999). To avoid any bias in parameter estimations, several assumptions were considered under POPAN models for an open population (Jolly, 1965; Schwarz and Arnason, 1996). To verify the goodness of fit of our data for the POPAN model, the following tests were conducted using a fully parameterized CJS model considering two groups for each island with U-CARE (Choquet et al., 2009): TEST 2, which examined significant difference in capture probabilities between individuals, and TEST 3, which examined whether all identified individuals have the same probability of survival between sampling occasions. These tests were partitioned into four different tests: (1) TEST 2.CT, which tests for a significant trap effect (trap happiness or trap shyness), which, in our case, is a virtual trap effect since individuals are not physically captured; (2) TEST 2.CL, which tests for a significant variation in the time between re-encounters for captured and non-captured individuals that are assumed to be alive; (3) TEST 3.SR, which tests for a significant excess or lack of transient individuals; and (4) TEST 3.SM, which tests for a significant effect of capture on survival. GLOBAL TEST combines TEST 2 and TEST 3 to assess significant overdispersion of the data (Choquet et al., 2005; Choquet et al., 2009).
2.6 Site fidelity estimates and clustering analysis
The recently developed Standardized Site Fidelity Index (SSFI) IH4 was used to assess site fidelity and residency patterns at the population level using the following equation (Tschopp et al., 2018):
with ITas the permanence, which is the difference between the first and last sighting of an individual, and It as the periodicity, which is the recurrence of an individual, determined by the inverse of the average time (in days) between consecutive recaptures (Balance, 1990; Morteo et al., 2012; Tschopp et al., 2018). If an animal was identified more than once on the same day, only the first observation of the day was retained, and only observations separated by at least 1 day were included in the site fidelity analysis to avoid the probability of data dependency. SSFI indexes were calculated using four sighting histories with different temporal scales: SSFId using sighting histories by sampling day, SSFIm by month, SSFIp by sampling period, and SSFIs by season. SSFIp was used to compare site fidelity between sites and clusters using a Wilcoxon–Mann–Whitney test in R (R Core Team, 2023).
These SSFI indexes were used to separate populations into separate residency clusters with an Agglomerative Hierarchical Classification (AHC) analysis (Zanardo et al., 2016; Hunt et al., 2017; Passadore et al., 2018; Haughey et al., 2020). The Euclidean distance and Ward’s method (minimum variance) were used to build the AHC as the dissimilarity measure and the agglomerative clustering algorithm, respectively (Ward, 1963). Clustering analysis was conducted using R 4.0.3 (R Core Team, 2023) with the pvclust package (Suzuki and Shimodaira, 2006) following Passadore et al. (2018; see Acknowledgments).
2.7 Model selection and estimation of population parameters
The capture–recapture history was used to find the most appropriate model for our data using the MARK 9.0 software (White and Burnham, 1999). The POPAN formulation of the Jolly–Seber model for an open population (Jolly, 1965; Schwarz and Arnason, 1996) was used, considering two clusters for each island and 24 sampling periods for Martinique and 23 sampling periods for Guadeloupe (no late wet 2016). Models were compared considering a time (t), group (g), or group and time (g*t) variable structure or constancy (.) for the following parameters (Jolly, 1965; Schwarz and Arnason, 1996): (1) apparent survival φ, which is the probability that an individual or group of individuals captured in sampling period i will survive and not emigrate before sampling period i+1; (2) recapture probability p, which is the probability that an individual or group of individuals captured at sampling period i will be recaptured at sampling period i+1; and (3) probability β of entry into the population, which is the probability that an individual or group of individuals coming from the superpopulation will survive, not emigrate, and become part of the population in the study area (i.e., the studied population, in our case the marked part of the population). Following the goodness-of-fit tests and based on the separation between two distinct residency groups, only models incorporating both temporal and group variabilities in β were chosen, giving a total of 16 candidate models. The Akaike Information Criterion, corrected for small samples (AICc), was used to determine the best model fitting our data for each island (White and Burnham, 1999; Burnham and Anderson, 2002). That model was then used to estimate p, β, and φ between sampling periods and annually, and seasonal and total abundances of PSD populations in Guadeloupe and Martinique.
2.8 Total population abundance
The POPAN capture–recapture model only estimated the abundance of marked (D1+D2) individuals (). The superpopulation size and total abundances were determined by incorporating the proportion of unmarked individuals () in the calculation (Tyne et al., 2014; Sprogis et al., 2016; Passadore et al., 2017; Haughey et al., 2020). That proportion was calculated for each island by dividing the number of marked individuals (D1+D2) by the number of all individuals (D1+D2+D3) present on high-quality photographs (Q1) (Sprogis et al., 2016). To avoid repeated inclusion of the same D3 individuals, all dolphins, including those marked and previously identified, were counted again. Standard errors from the total population size were calculated following the “delta method” (Seber, 1982; Williams et al., 2002):
Log-normal 95% confidence intervals of the total population size were calculated with upper and lower limits obtained by either multiplying or dividing by the factor C following Burnham et al. (1987):
3 Results
A total of 783 survey trips (400 in Guadeloupe and 383 in Martinique) conducted between January 2014 and November 2019 resulted in the collection of 115,705 photos, of which 46,825 were usable (Q1 and Q2 = 40%; Table 1). Survey effort is presented in more detail in Figure 3. PSD groups ranged from 1 to 500 individuals in Guadeloupe, with an average group size of 160 (95% CI: 150–170), while group sizes in Martinique ranged from 5 to 500 individuals, with an average group size of 97 (95% CI: 88–107). A total of 290 marked individuals were identified, 179 in Guadeloupe and 111 in Martinique (Table 2). We identified 29 of the 64 (45%) Guadeloupe individuals and 31 of 54 (57%) Martinique individuals in our 2014–2017 images. None of the 290 identified individuals was found in both Martinique and Guadeloupe. The analyses were therefore carried out considering two distinct populations, one for each island. The proportion of marked individuals within the population was estimated at 0.12 (SE = 0.02) in Guadeloupe and 0.09 (SE = 0.02) in Martinique.
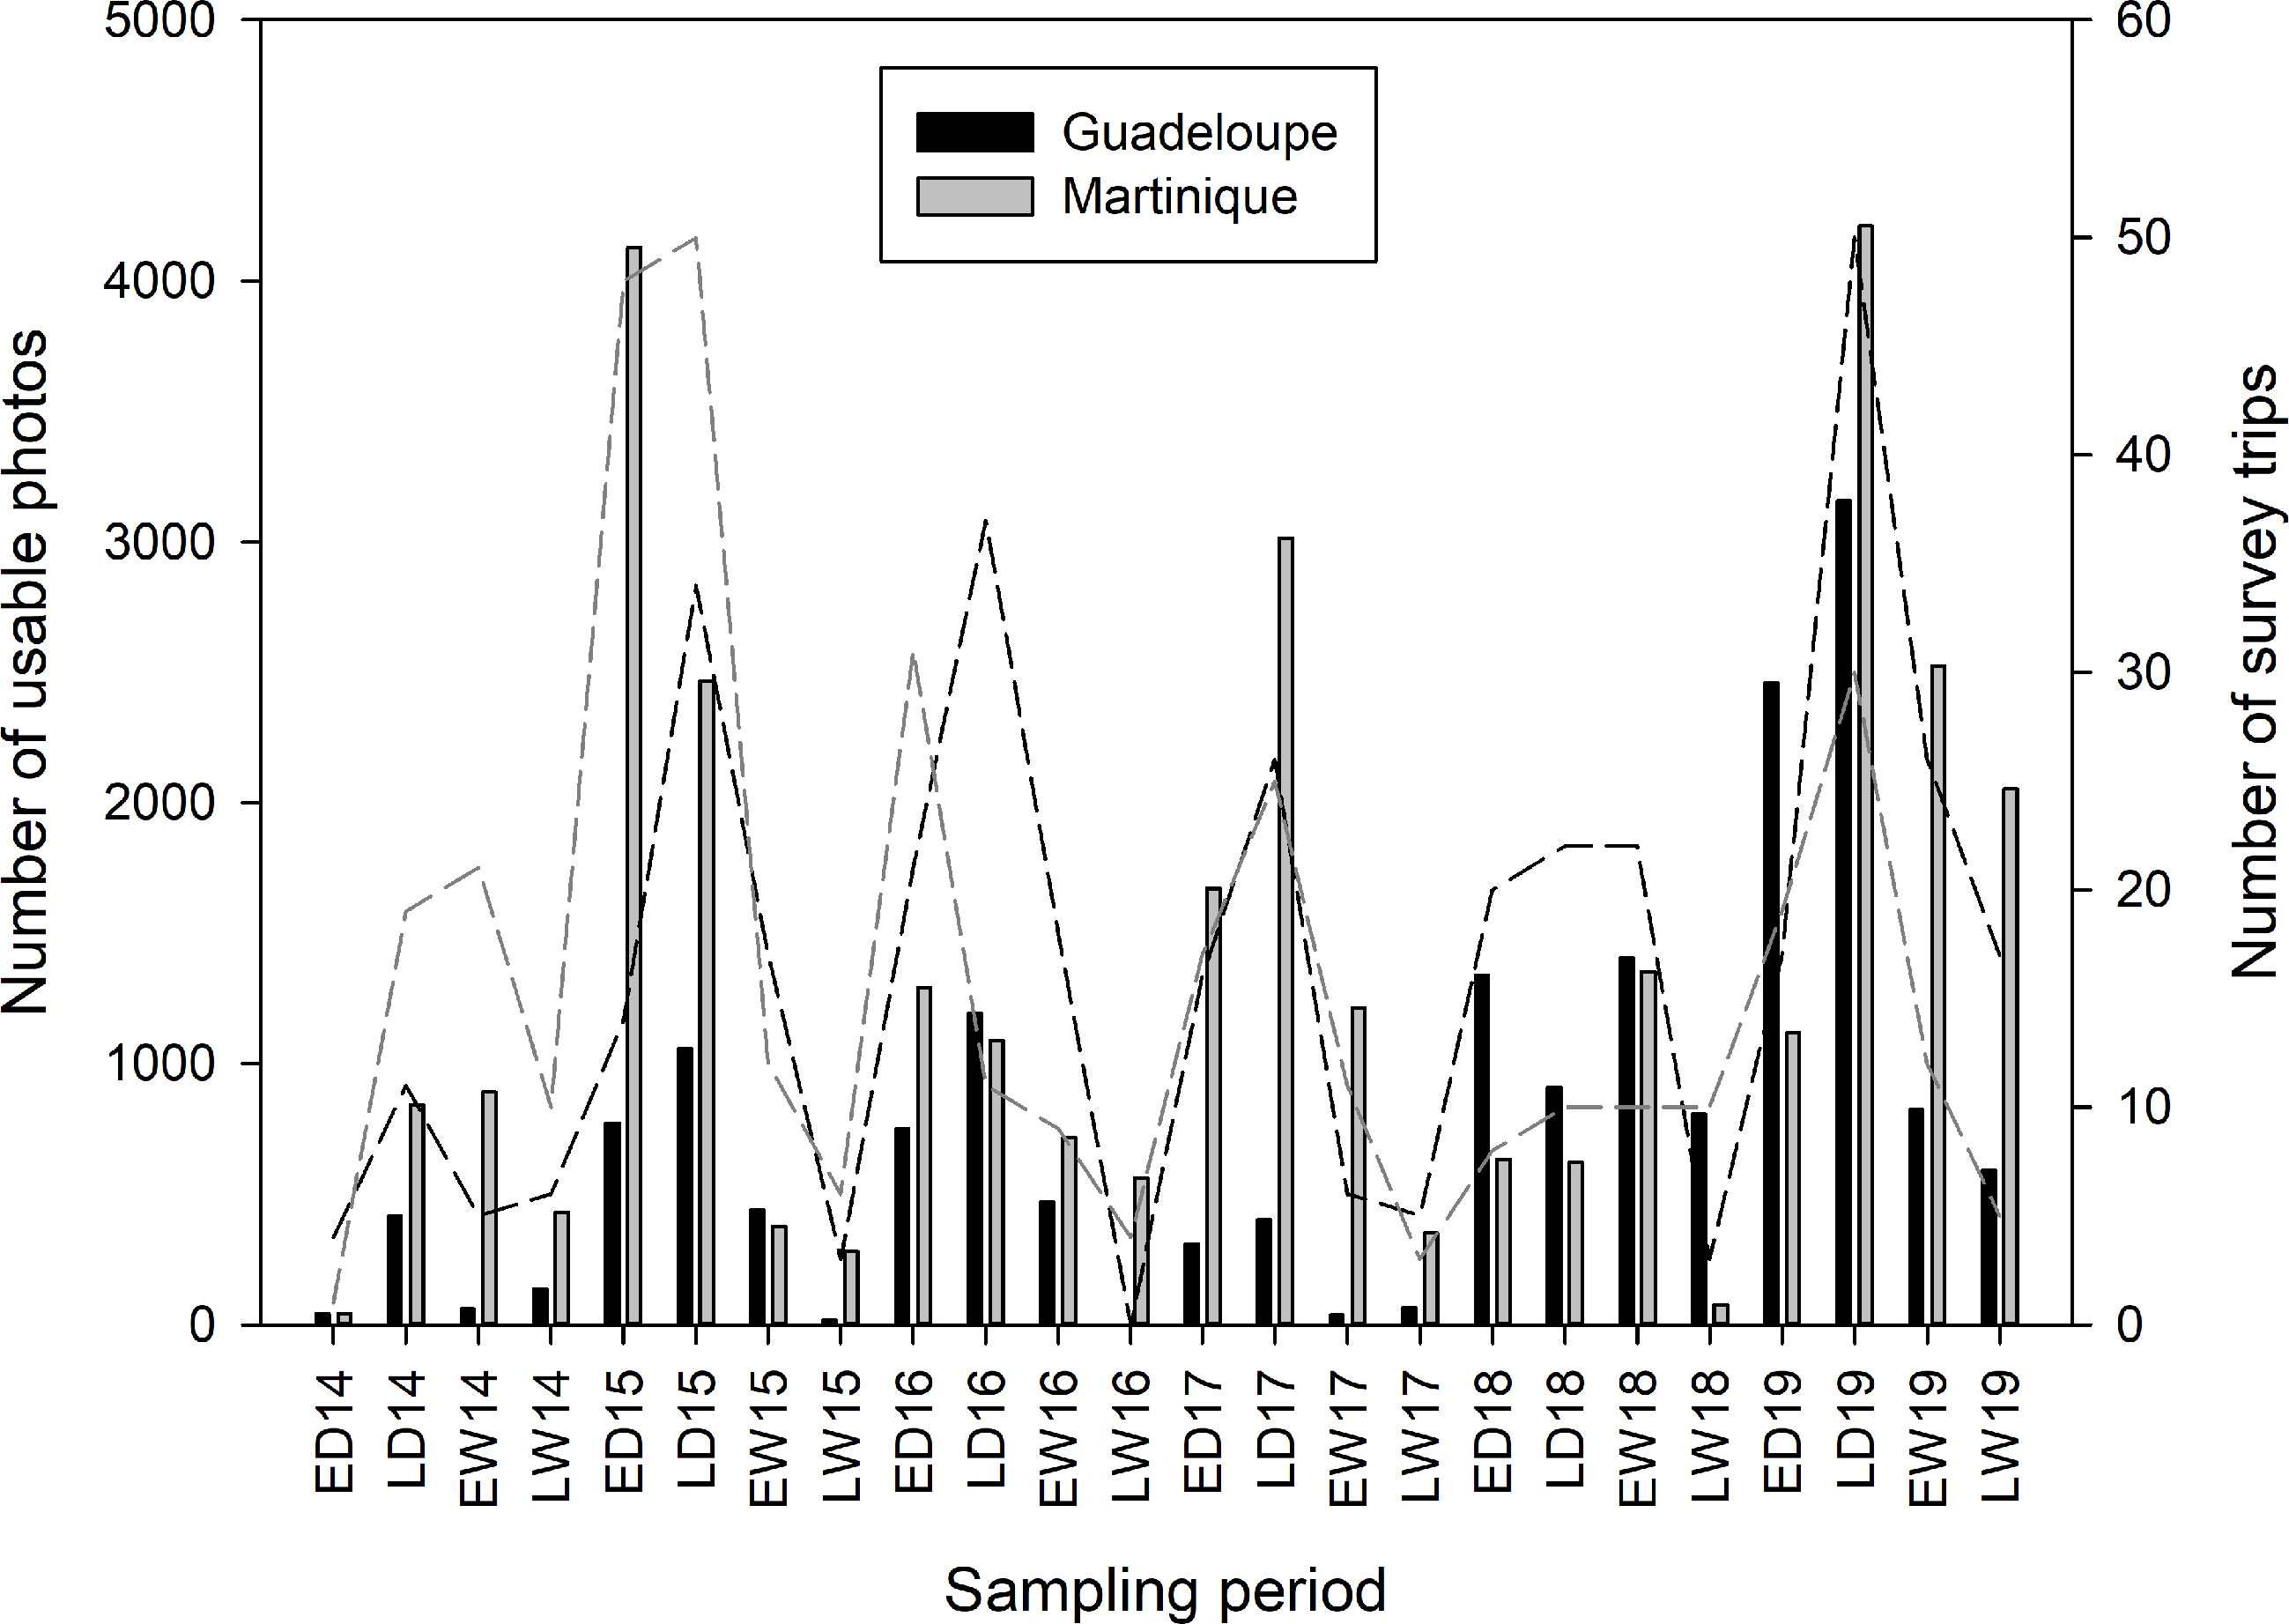
Figure 3 Sampling effort of pantropical spotted dolphins, Stenella attenuata, in Agoa Sanctuary along the leeward coasts of Guadeloupe and Martinique islands between 2014 and 2019, covering the early dry season (ED = December to February), late dry season (LD = March to May), early wet season (EW = June to August), and late wet season (LW = September to November).
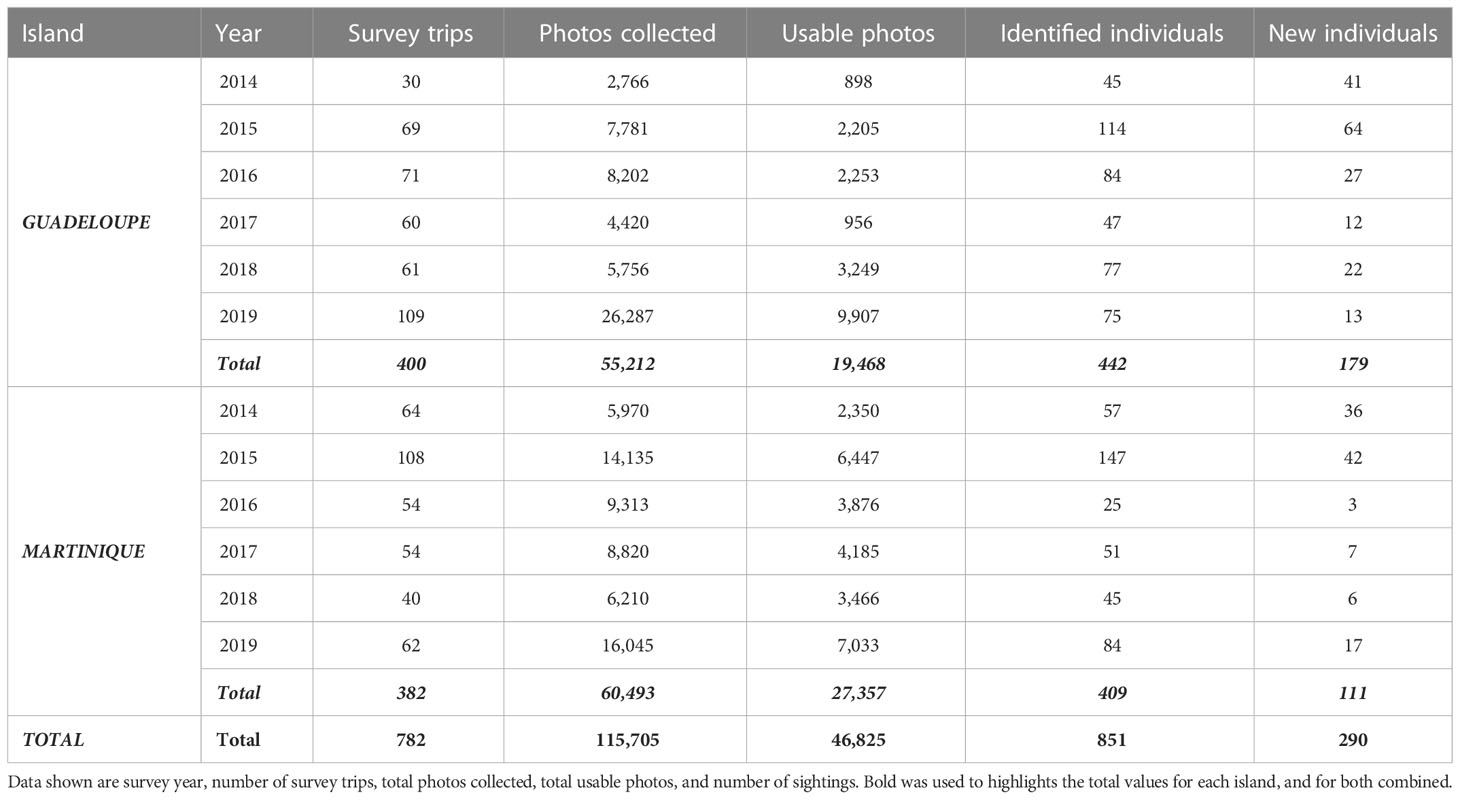
Table 1 Data collected on pantropical spotted dolphins, Stenella attenuata, in Agoa Sanctuary along the leeward coasts of Guadeloupe and Martinique (Eastern Caribbean).
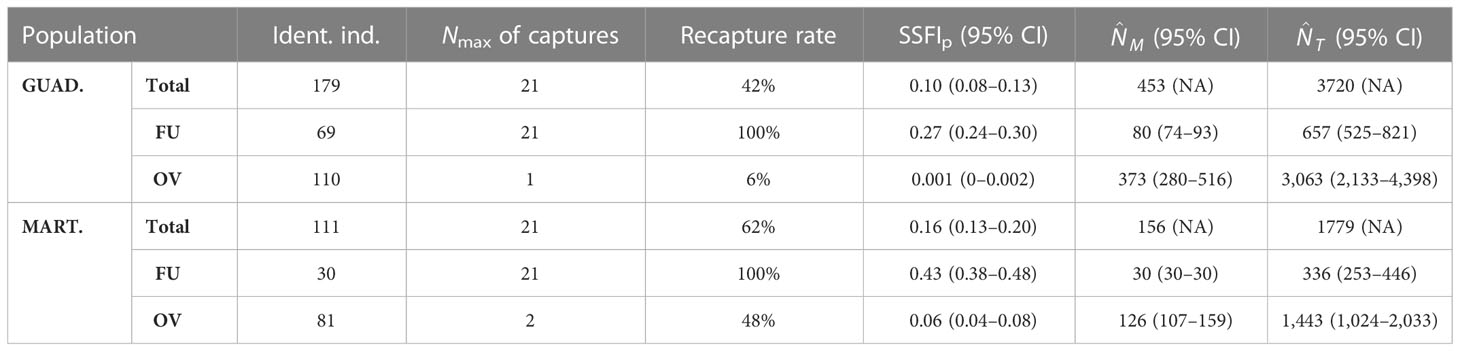
Table 2 Summary of the number of individuals identified, maximum number of captures, recapture rates, Standardized Site Fidelity Index by sampling period (SSFIp), and abundance estimates for the marked () and total () population of pantropical spotted dolphins Stenella attenuata off Guadeloupe and Martinique (eastern Caribbean) between 2014 and 2019 according to the total population and the residency cluster [frequent users (FU) or occasional visitors (OV)].
3.1 Pantropical spotted dolphin distributions off the coasts of Guadeloupe and Martinique
The PSD population in Guadeloupe seemed to be distributed homogeneously in waters with bathymetries ranging from 500 m to 1,500 m (Figure 1B). Conversely, PSD population in Martinique preferred shallower waters, mainly concentrating in waters with bathymetries ranging from 100 m to 1,500 m depth off the town of Le Carbet, located south of the bay of Saint-Pierre (Figure 1C).
3.2 Goodness-of-fit tests and clustering analysis
Closure for each population was tested and revealed that both populations were open (Stanley & Burnham Closure Test in Guadeloupe p-value< 0.01; in Martinique p-value< 0.01). Goodness-of-fit tests were first performed considering total populations for each island, and significant excesses of transient individuals were detected for both (TEST3.SR in Guadeloupe, p-value = 3.4e-06; TEST3.SR in Martinique, p-value = 8.7e-07). A significant trap-happiness effect was also detected for the Guadeloupe population (TEST2.CT, p-value = 0.01). To refine the population analysis, populations were separated into separate residency clusters. The AHC analysis separated each marked population into two residency clusters, which were classified as frequent users (FU) or occasional visitors (OV). These clusters in Guadeloupe consisted of 69 FU (38%) and 110 OV individuals (62%), while in Martinique, they consisted of 30 FU (27%) and 81 OV individuals (73%; Table 2). Goodness-of-fit tests were again performed considering FU and OV clusters, and while no significant excess of transient individuals was detected, a significant trap-happiness effect was still present for the Guadeloupe population (TEST2.CT, p-value = 0.02). GLOBAL TEST did not detect any overdispersion of the data considering two clusters for each population (GLOBAL TEST for Guadeloupe: χ2 = 56.30, DF = 56, p-value = 0.46; GLOBAL TEST for Martinique: χ2 = 48.84, DF = 71, p-value = 0.98), indicating a good fit of our model to the data.
3.3 Encounter rates of pantropical spotted dolphin
The cumulative number of newly identified individuals did not reach a plateau in the total marked population discovery curve for Guadeloupe (Figure 4A), but it seems to approach an asymptote. A plateau was reached for FU individuals while new OV individuals were continuously identified in the area (Figure 4A). Similar results were obtained in Martinique for both FU and OV (Figure 4B), indicating that most FU of both islands were identified while more OV individuals, which have not been identified, were present in the area. The maximum number of recaptures of the same individual in Guadeloupe was 21 for individual SA081 “ARNOLD,” while 100% of the FU, 6% of the OV, and 42% of the total population were recaptured at least once (Table 2). In Martinique, the maximum number of recaptures was 21 for SA159 “PIKACHU,” while 100% of the FU, 48% of the OV, and 62% of the total population were recaptured at least once (Table 2).
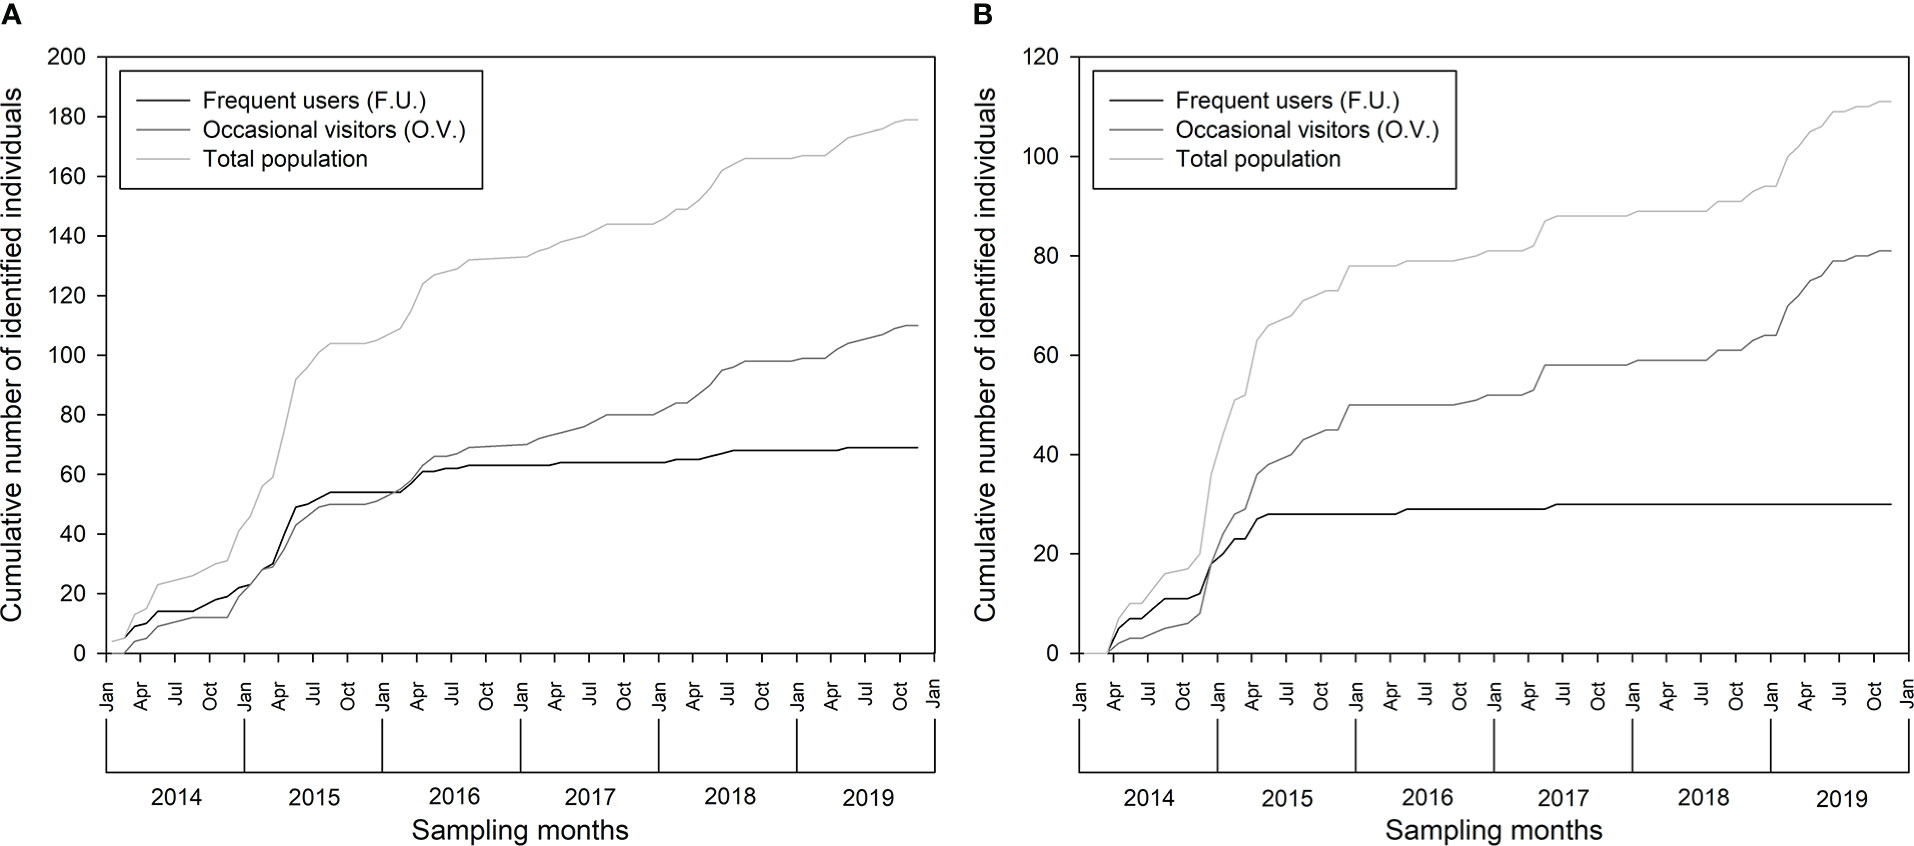
Figure 4 Discovery curve of identified pantropical spotted dolphin, Stenella attenuata, in (A) Guadeloupe and (B) Martinique between 2014 and 2019.
3.4 Estimation of pantropical spotted dolphin site fidelity
The site fidelity index (SSFIp; Table 2) in Guadeloupe was estimated at 0.10 (95% CI: 0.08–0.13) for the whole marked population, 0.27 (95% CI: 0.24–0.30) for FU, and 0.001 (95% CI: 0–0.002) for OV. In Martinique, it was estimated at 0.16 (95% CI: 0.13–0.20) for the whole marked population, 0.43 (95% CI: 0.38–0.48) for FU, and 0.06 (95% CI: 0.04–0.08) for OV.
3.5 Survival rates and abundance of pantropical spotted dolphin
The model that best fit out data was the same for both islands (Table 3). In Guadeloupe, the apparent survival φ of the marked population was constant over time but differed among residency clusters. It was estimated at 0.94 (95% CI: 0.92–0.96) for FU and 0.33 (95% CI: 0.23–0.45) for OV between sampling periods, and at 0.80 (95% CI: 0.72–0.85) for FU and 0.01 (95% CI: 0.003–0.04) for OV annually. The recapture probability p was constant among clusters but varied temporally and was higher during dry seasons (pds = 0.14–0.65) than during wet seasons (pws = 0–0.56; Figure 5A), likely because of variations in sampling effort. The probabilities β of entry into the population varied with both time and cluster. Approximately 6% of the FU individuals were present in the study area just before the start of the study. β values were higher at the start of the study, with a maximum of 0.63 (95% CI = 0.36–0.83) between late wet 2014 and early dry 2015 and almost null during subsequent intervals (Figure 5B), indicating that more than 80% of FU recruitment from the super-population occurred before early dry 2015. For OV, probabilities β of entry varied according to intervals, with a maximum at 0.28 (95% CI = 0.17–0.43) reached between late wet 2014 and early dry 2015 (Figure 5B), indicating that more than 40% of recruitment from the super-population occurred before early dry 2015. No OV individuals were present just before the start of the study. The maximum number of FU individuals in the area (FU = 71, 95% CI: 58–86) was reached during late wet 2014, after which their abundance showed a progressive and stable decline until the end of the study period (LW19 = 28, 95% CI = 10–39; Figure 5C). Abundances of OV individuals in the area varied among sampling periods, showing higher values during dry seasons (ds = 7–111) than during wet seasons (ws = 5–50), and they decreased until the end of the study period (OV/2019 = 5–12). The total population followed the same tendency, with a maximum of 179 marked individuals in early dry 2015, followed by slight variations caused by the proportion of OV individuals and a slow decline in abundance until the study’s end in late wet 2019 (Tot/2019 = 38–42). The total number of marked individuals throughout the study period was estimated at 80 FU individuals (95% CI: 74–93) and 373 OV individuals (95% CI: 280–516; Table 2). The total population size in Guadeloupe, including the non-marked proportion of the population, was estimated at 657 FU individuals (95% CI: 525–821) and 3,063 OV (95% CI: 2,133–4,398; Table 2).
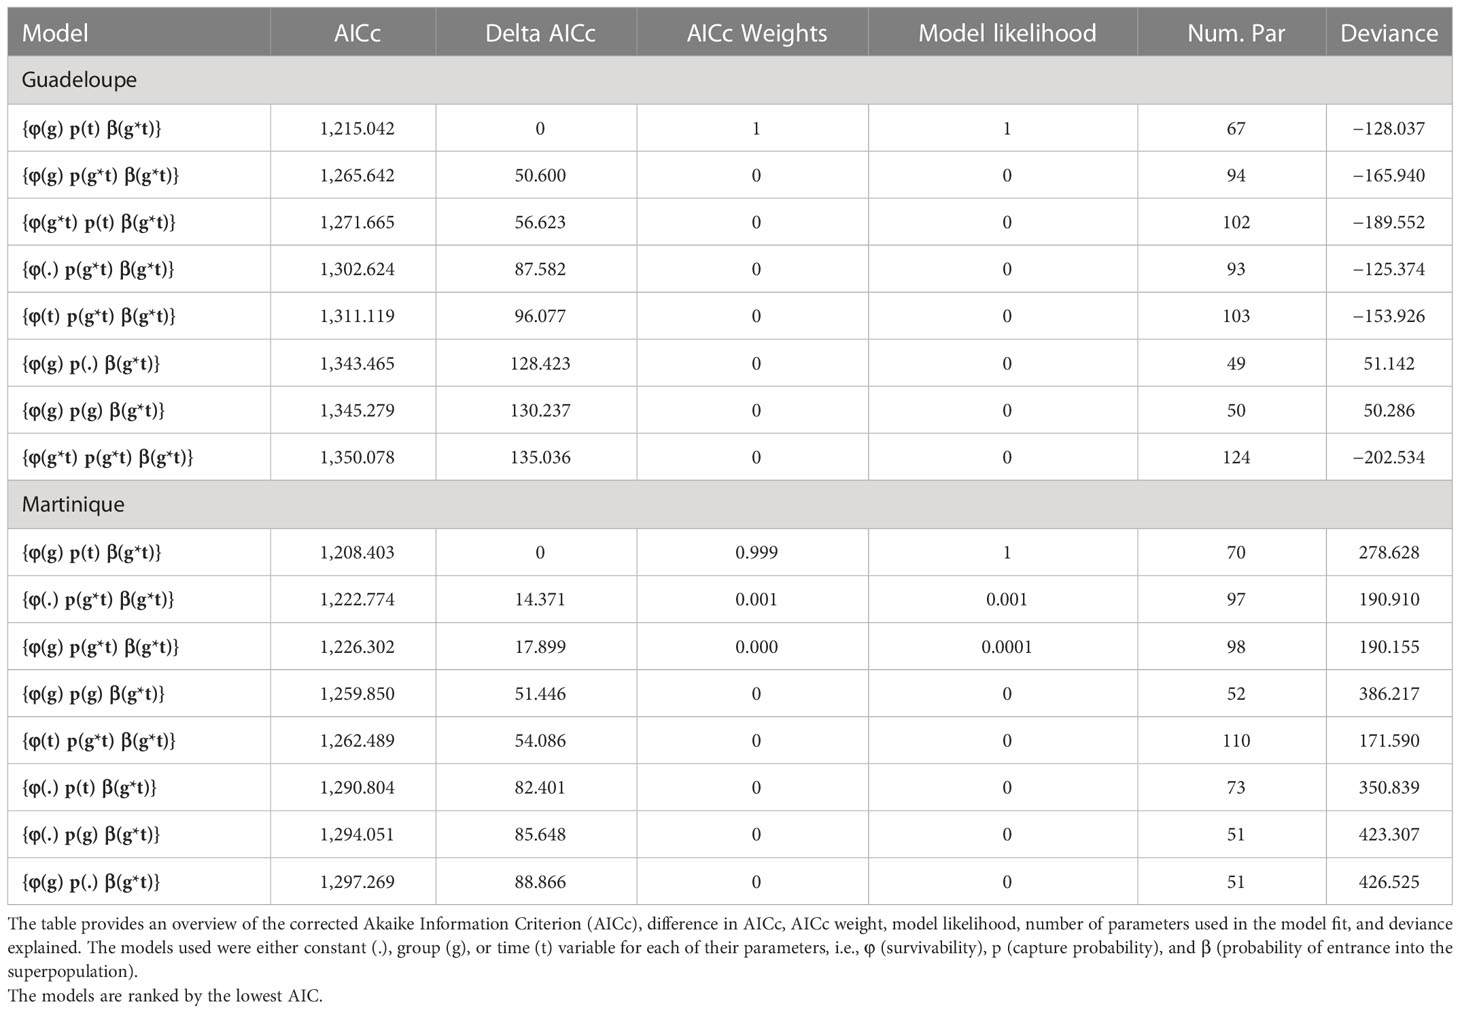
Table 3 POPAN model results considering 24 sampling periods and two residency groups [frequent users (FU) or occasional visitors (OV)] of pantropical spotted dolphins Stenella attenuata in Guadeloupe and Martinique (eastern Caribbean).
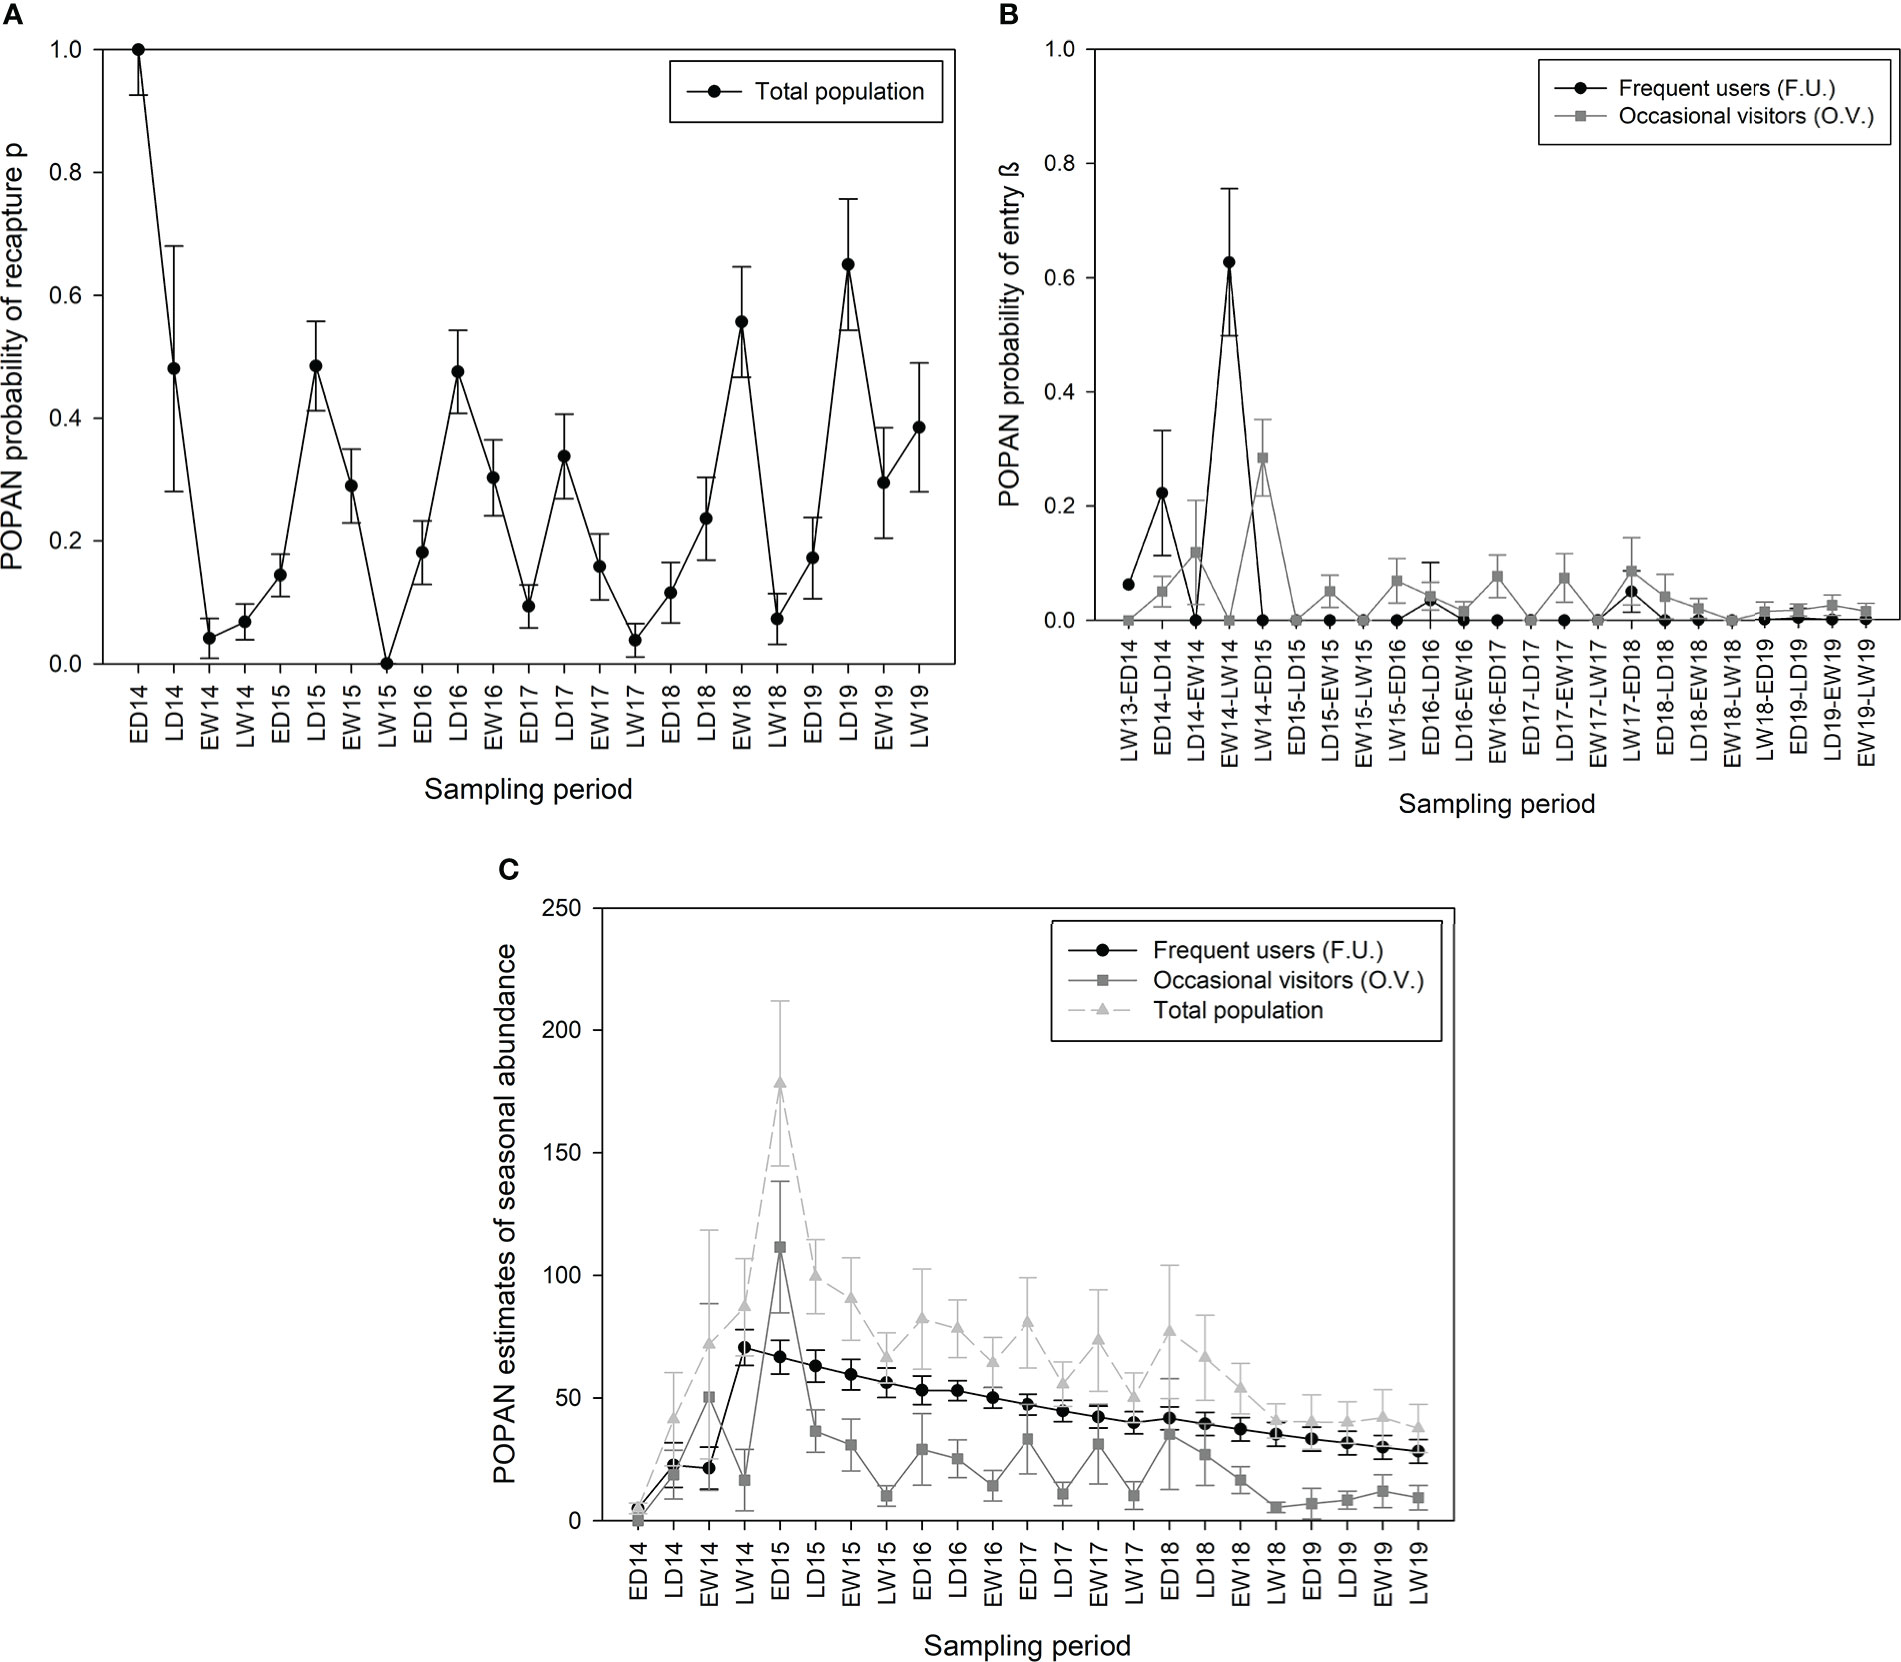
Figure 5 POPAN estimates of (A) capture probability, (B) probability β of entry, and (C) abundance among sampling periods of pantropical spotted dolphin, Stenella attenuata, in Guadeloupe between 2014 and 2019. Bars show estimated standard error.
In Martinique, the apparent survival φ of the marked population was constant over time and varied by cluster. It was higher than in Guadeloupe for both clusters and was estimated at 1 for FU (95% CI: 1–1) and 0.84 for OV (95% CI: 0.79–0.88) among sampling periods, and at 1 for F.U. (95% CI: 1–1) and 0.50 for OV (95% CI: 0.39–0.60) annually (Table 2). Like Guadeloupe, the recapture probability p in Martinique was constant between clusters but varied temporally and was higher during dry seasons (pds = 0.11–0.60) than during wet seasons (pws = 0.03–0.50; Figure 6A), following the patterns of sampling effort (Figure 3). Probabilities β of entry in Martinique also followed the same tendency as in Guadeloupe. For FU, β values were higher at the start of the study, with an average maximum of 0.50 (95% CI = 0.23–0.77) between late wet 2014 and early dry 2015, and 0.48 (95% CI = 0.21–0.76) between late dry 2014 and early wet 2014. Probabilities β of entry were almost null during subsequent intervals (Figure 6B), and more than 95% of the FU superpopulation was captured before early dry 2015. No FU or OV individuals were present in the study area just before the start of the study. For OV, β varied according to the intervals, with a maximum of 0.25 (95% CI = 0.04–0.74) between early wet 2014 and late wet 2014 (Figure 6B), and only 35% of the OV superpopulation was captured before early dry 2015. The number of FU individuals was stable for most of the study period (FU = 30) while the abundance of OV individuals varied according to the sampling period, with a maximum during early wet 2015 (EW15 = 52, 95% CI = 39–70) and a minimum during late dry 2018 (LD18 = 12, 95% CI = 7–21). OV abundance seemed to be stable between the start and the end of the study (LW14 = 38, 95% CI = 11–131 and LW19 = 30, 95% CI = 17–52, Figure 6C). Like the OV cluster, total population abundance varied according to the sampling periods. The total number of marked individuals in the Martinique area over the entire study period was lower than in Guadeloupe, with estimations of 30 for FU (95% CI: 30–30) and 126 for OV (95% CI: 107–159, Table 2). The total population size in Martinique () was estimated at 336 for FU (95% CI: 253–446) and 1,443 for OV (95% CI: 1,024–2,033; Table 2).
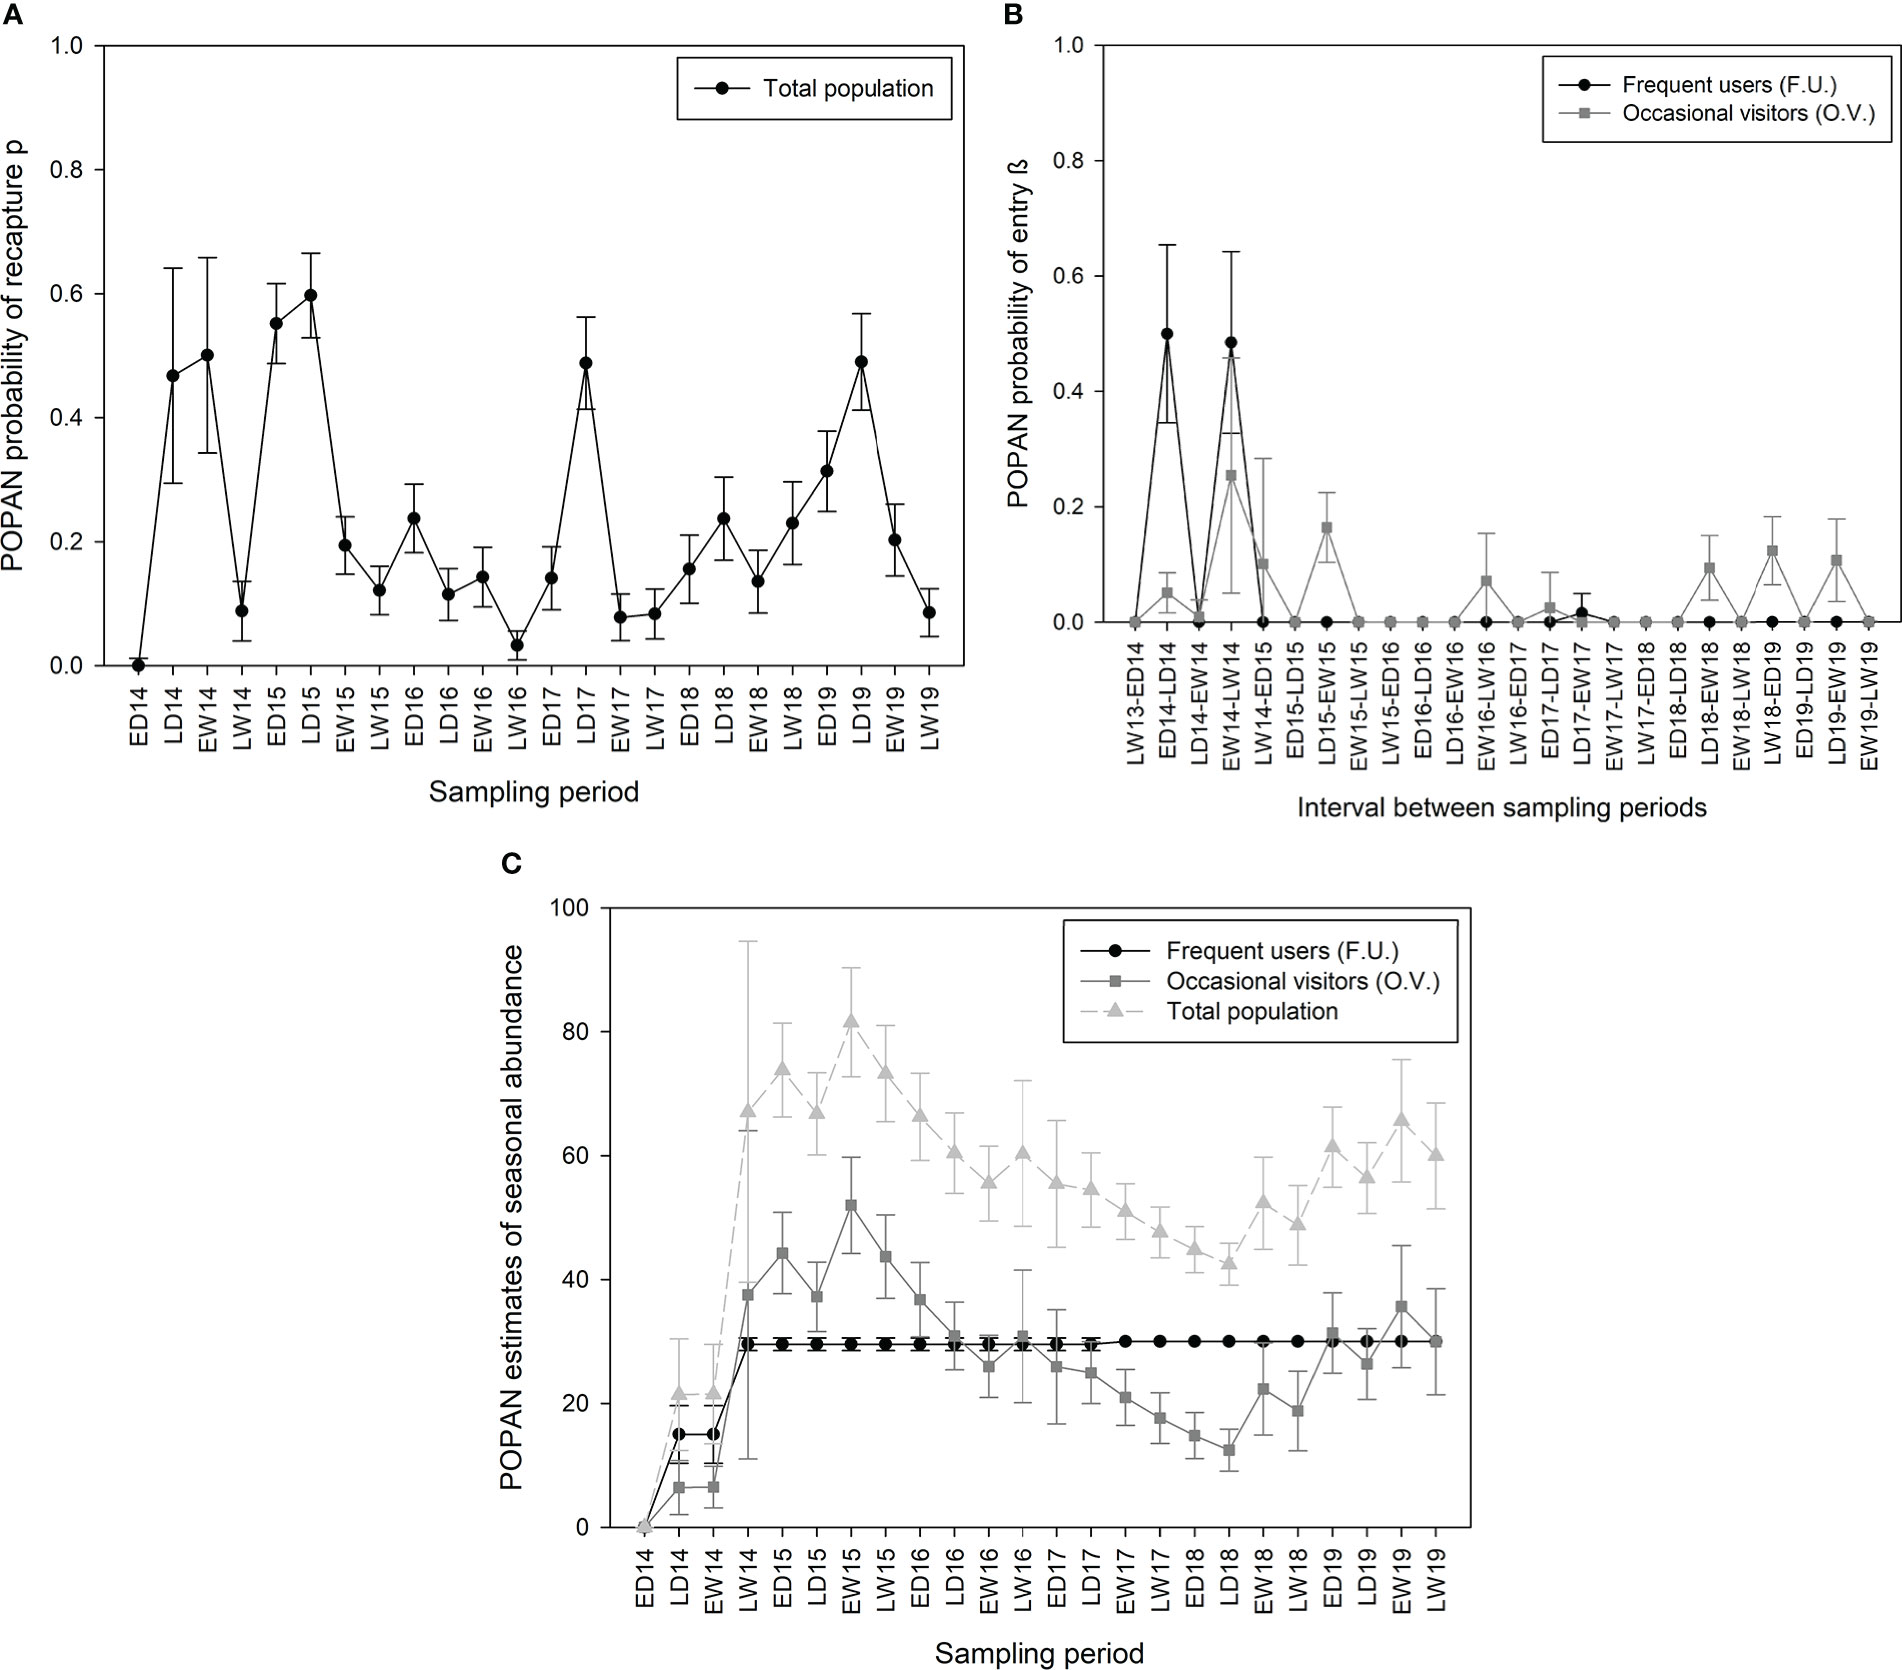
Figure 6 POPAN estimates of (A) capture probability, (B) probability β of entry, and (C) abundance among sampling periods of pantropical spotted dolphin, Stenella attenuata, in Martinique between 2014 and 2019. Bars show estimated standard error.
4 Discussion
This study extended the preliminary work reported by Courtin et al. (2022) and allowed the identification of 179 marked PSD individuals in Guadeloupe (115 newly identified individuals) and 111 marked PSD individuals in Martinique (57 newly identified) over a period of six consecutive years. Although there are some difficulties in accurately counting the number of cetaceans because all individuals may not surface while being observed, we provide some insights into PSD individuals present for both Guadeloupe and Martinique islands.
4.1 Sampling effort and group size
The number of usable photos for both islands were lower during wet seasons (Figure 3), which is the consequence of fewer survey trips during these periods. Indeed, the wet (hurricane) season (Cerema, 2020; Météo France, 2020), with poor sea conditions, did not allow the same sampling effort as during the dry season. However, this should not affect estimates produced by the POPAN model since it does not assume equal sampling effort (Cooch and White, 2019). Even though the number of usable photos in Martinique (27,357 photos) was higher than in Guadeloupe (19,468 photos), more marked individuals were identified in Guadeloupe (179) than in Martinique (111). Conversely, the previous study (Courtin et al., 2022) showed a higher number of usable photos in Guadeloupe (13,156 photos) than in Martinique (10,499 photos), reporting 70 and 54 individuals for each island, respectively. Consequently, these findings suggest that differences in abundances are not related to sampling effort; thus, it is possible that the population of marked PSD is larger in Guadeloupe than in Martinique. These results are consistent with the group sizes observed for both islands, with larger groups observed in Guadeloupe (mean group size = 160, 95% CI: 150–170) than in Martinique (mean group size = 97, 95% CI: 88–107). PSD group sizes are generally higher in most populations worldwide, but these estimates can vary among populations and localities. For example, the coastal group size of PSD in Murcielago Archipelago, Costa Rican Pacific, was estimated to be between 1 and 50 (mean = 9.95, SE = 10.28; May-Collado and Forcada, 2012), while offshore groups of PSD in Hawaii were found to range from 10 to 150 individuals (mean = 60, SE = 26; Baird et al., 2001). Larger groups have been reported in the Northern Gulf of Mexico, ranging from 5 to 210 (mean = 49, SE = 4.5) and 3 to 650 individuals (mean = 71.3, SE = 3.45; Mullin et al., 2004; Maze-Foley and Mullin, 2007); in Brazil, with groups from 3 to 250 individuals off the coast (Moreno et al., 2005); and in Golfo Dulce, Costa Rica, with groups from 50 to 300 individuals (Cubero-Pardo, 2007). The small groups of PSD reported in Guadeloupe and Martinique could suggest that dolphins are mainly coastal individuals.
4.2 Goodness of fit and residency clusters
The heterogeneity in the data detected by the goodness-of-fit tests separated each population into two residency clusters. These clusters do not necessarily correspond to social groups of individuals, but rather to individuals sharing a common residency pattern (Whitehead and Wimmer, 2005; Haughey et al., 2020). However, the heterogeneity previously detected in Martinique (Courtin et al., 2022) was confirmed, and the heterogeneity tests also detected a significant excess of transient (OV) individuals in Guadeloupe, which was not detected previously, probably because of the short study period (2 years).
PSD groups preferring different geographic areas have been reported worldwide, with coastal populations occurring close to islands and the mainland while others are distributed in offshore waters, thus showing slight differences in ecological niches and habits (Jefferson et al., 2015; Perrin, 2018). The existence of different residency clusters in populations from both Guadeloupe and Martinique may suggest that both coastal and offshore individuals are transiting the Eastern Caribbean island waters, with FU individuals belonging to the coastal form and OV individuals belonging to the offshore one. This remains to be confirmed.
The trap-happiness effect detected in the goodness-of-fit tests showed that the survey method in Guadeloupe resulted in an increased probability for some marked individuals to be captured, which can result in an underestimation of the parameters produced by the models, such as the size of the marked population (Pollock et al., 1990; Pradel, 1993; Parra et al., 2006; Pradel and Sanz-Aguilar, 2012). Determining the factors leading to a trap-happiness effect can be laborious (Choquet et al., 2005). However, the regularly observed bow-riding behavior of PSD (Jefferson et al., 2015; Perrin, 2018), which attracts some individuals to boats, might be one of the reasons. Moreover, observers in Guadeloupe acknowledged that distinctively marked individuals were more frequently photographed than less distinct or unmarked individuals (Millon, personal observation) compared to the situation in Martinique, where the scientific team was on the boat, randomly photographing individuals. In addition, some individuals showed strong site fidelity, which could induce heterogeneity in recapture probability (Pradel, 1993). This effect would probably be less prevalent in Guadeloupe than in Martinique, where site fidelity is higher. In addition, because marked individuals in Guadeloupe might be overrepresented in photographs, the total size of that population might be underestimated by an exaggerated mark ratio (Eguchi, 2014; Wickman et al., 2021).
4.3 Distribution and site fidelity of pantropical spotted dolphins in Guadeloupe and Martinique
Most PSD observations in Guadeloupe were made in areas where the bathymetries ranged between 500 and 1,500 m while bathymetries ranged between 100 m and 1,500 m in Martinique. PSD occurrence at these depths is consistent with previous observations (600 m to 2,500 m; Mignucci-Giannoni et al., 2003) and with predictions from ecological niche modeling (500 m to 1,600 m; Barragán-Barrera et al., 2019) in the Caribbean, but they are shallower than depths predicted from observations (850 m to 4,000 m; Moreno et al., 2005) and ecological niche modeling (1,500 m to 5,000 m; do Amaral et al., 2015) off Brazil in the southern Atlantic Ocean. The apparent preference by PSD for “shallower” waters in the Eastern Caribbean may be related to prey availability: coastal Caribbean waters are oligotrophic environments (Corredor, 1979); hence, PSD tend to travel long distances looking for food ((Davis et al., 2002; Barragán-Barrera et al., 2019).
Most FU individuals from both islands were identified in contrast to OV individuals; this is consistent with their respective residency patterns. FU individuals, which are regularly present and are probably mainly of the coastal form that prefers shallower areas, are more likely to be identified than OV individuals, who are likely offshore individuals ranging over a broader area and who periodically enter and leave the area. The high site fidelity of FU from both islands indicates that the same individuals return regularly to the study area while OV rarely return to the study area because of low site fidelity. Both islands have resident individuals, which could be indicative of the high ecological suitability of their leeward coasts. Indeed, these areas are sheltered from climate hazards, especially during the hurricane season, and may offer several advantages for delphinid species, such as complex and shallow habitats for protection from predators (Wells et al., 1999; Connor, 2000), as well as predictable food resources (Gowans et al., 2007). These factors might be more diffuse along the Guadeloupe coast, where PSD observations are more spread out. PSD near Martinique are frequently sighted offshore of Le Carbet and are likely the coastal form, making them attractive for whale-watching activities (Mayol et al., 2016).
Habitat use by delphinids may differ according to age and sex (Heithaus and Dill, 2002; Gowans et al., 2007) since individuals form structured age and sex groups throughout their lifetimes (Gowans et al., 2007; Jefferson et al., 2015). In Martinique, marked individuals may not be evenly distributed according to age or sex (Safi et al., 2020), which could lead to an overrepresentation of age and sex classes in the observed distribution. However, the areas of observation seem to be the same whether or not marked individuals are present in the group (de Montgolfier, personal observation; Mayol et al., 2016; Safi et al., 2020). More information on individuals’ sex and their social structure is needed to determine whether spatial segregation according to social groups exists in these two islands.
4.4 Movement of pantropical spotted dolphins between Guadeloupe and Martinique
Photo-identification studies between islands in Agoa Sanctuary have shown movements of short-finned pilot whales (De Vries, 2017) and sperm whales (Gero et al., 2007; De Vries, 2017), confirming the effectiveness of the technique to assess cetacean migration and movement patterns. However, no PSD individual was observed in both Guadeloupe and Martinique between 2014 and 2019, showing that exchanges between these two populations are very low, as suggested by the preliminary study (Courtin et al., 2022). Only one individual, known as SA054 “Victoire,” was observed at both islands. This individual was first identified in Martinique on 12 January 2013 and again in Guadeloupe on 23 June 2013 (Bouveret, Millon, and de Montgolfier, unpublished data). Victoire was subsequently identified twice in Guadeloupe, on 26 April 2015 and 13 May 2019, but never again in Martinique. This movement is likely exceptional behavior; thus, movements of marked PSD between Guadeloupe and Martinique appear to be extremely rare.
Nevertheless, undetected movements of PSD individuals may occur if conducted by unmarked or slightly marked dolphins, which were not distinctive enough to be identified in this study. It would be possible to examine this with an increased and more systematic research effort. The presence of transient individuals in both populations suggest that a high proportion of individuals move outside of the study area. Even if some anecdotal observations of PSD have been reported in other areas (Windward-coast and Grand-Cul-de-Sac-Marin in Guadeloupe, Robert and François bays in Martinique), most populations tend to be concentrated on the leeward coast (Cuzange, 2011; Mayol et al., 2016). It is likely that these transient individuals move further offshore from the island, toward either the Caribbean or the Atlantic basin. PSD have also been reported off the coasts of various other islands of the West Indies, such as Dominica (Watkins, 1985), Sainte-Lucie (Burks and Swartz, 2000), and Saint-Vincent (Caldwell et al., 1971). As Dominica is located between Guadeloupe and Martinique, transient individuals from both populations might move to Dominica, maintaining genetic connectivity between these populations, even if no direct movements between Guadeloupe and Martinique exist. It is also possible that transient individuals from Martinique may move further south to nearby islands such as St Lucia or St Vincent. However, no studies have been published on the populations of these islands. Research focusing on the connectivity of these populations by similar photo-identification techniques linked to genetic assessments would help to better understand the population genetic structure and movements of this species in the West Indies.
4.5 Modeling estimation of population parameters
It is difficult to estimate the true survivability of long-lived species (Hunt et al., 2017; Passadore et al., 2017; Haughey et al., 2020) because it is challenging to separate permanent emigration from the survival probability of one individual (Jolly, 1965). PSD are long-living mammals (Shirihai and Jarett, 2007; Edwards et al., 2013; Jefferson et al., 2015; Perrin, 2018); hence, it is not expected that natural mortality would affect the survivability estimate during our 6-year study period. Furthermore, only a few PSD stranding events were reported in both islands between 2014 and 2019 (two and three strandings in Guadeloupe and Martinique, respectively; Réseau National Échouage, 2021), which is not indicative of unusual mortality events. However, currents and trade winds from the Atlantic Ocean may carry dead animals offshore instead of bringing them to the coast.
FU individuals from both islands display higher residency patterns than OV individuals, while OV individuals, which include transients, are more mobile and less regularly present, leading to higher permanent emigration since they likely rely on a habitat larger than our study area (Haughey et al., 2020; Bolaños-Jiménez et al., 2021). This is particularly evident for the Guadeloupe population, where the annual apparent survival of FU individuals (φ = 0.80, 95% CI: 0.72–0.85) is 80 times higher than that of OV individuals (φ = 0.01, 95% CI: 0.003–0.04), but is also seen in the Martinique population of (φ = 1, 95% CI: 1–1 for FU and φ = 0.50, 95% CI: 0.39–0.60 for OV). The PSD population in Martinique displayed higher apparent survival than that in Guadeloupe, perhaps because of the increased dispersion of individuals in Guadeloupe. The annual apparent survivability of the FU individuals in Guadeloupe was slightly lower (φ = 0.80) while that of FU individuals in Martinique was similar (φ = 1). Likewise, other resident populations of Stenella worldwide showed similar survival estimations, such as spinner dolphins in Hawaii (φ = 0.97 ± 0.05; Tyne et al., 2014), which were suggested to be representative of closed populations with little movement in or out of the study area, or other resident delphinids such as common bottlenose dolphins of the southwestern Gulf of Mexico (φ = 1; 95% CI: 1–1; Bolaños-Jiménez et al., 2021). Thus, the lower FU survival rate in Guadeloupe might be the result of some individuals moving in or out from the study area, whereas FU survival rates in Martinique indicate both high survival and very low emigration rates.
Variations in recapture probability in both islands appeared to be the result of variations in sampling effort, which is common with POPAN models (Chan and Karczmarski, 2017; Hunt et al., 2017; Passadore et al., 2017). Recapture probabilities are lower when few survey trips are made—and few photos taken—as it is the case during the wet hurricane season (Cerema, 2020). In CJS models that consider temporal variations in recapture probability, it is common that the recapture probability of the first period is not estimated correctly (Cooch and White, 2019). This explains why the recapture probability of early dry 2014 in both islands appear to represent extreme and imprecise values (p = 1, 95% CI: 0–1 in Guadeloupe and p = 0, 95% CI: 0.00–0.02 in Martinique). Almost all FU individuals of both islands were recruited at the start of the study: they are regularly present in the area and thus are more likely to be observed and identified. This can also explain the low abundances estimated for the first year, when only a small portion of individuals had been identified. Conversely, OV individuals were recruited continuously throughout the study period when new individuals entered the population. After most FU individuals had been identified, their abundance remained constant while the number of OV individuals varied according to the arrival of new individuals and the emigration of identified individuals.
The number of PSD individuals in Guadeloupe declined slightly and continuously during the study. In Guadeloupe and Martinique, marine species are subject to multiple anthropogenic pressures, such as maritime traffic, fishing activities, and water pollution (Cuzange, 2011; Mayol et al., 2016; Feunteun et al., 2019), which can lead to injury and death (Read and Murray, 2000; Reynolds et al., 2009; Luksenburg, 2014). However, stressors like maritime traffic and competition for food linked to fishing are more important on the Caribbean coast of Martinique than in Guadeloupe (Cuzange, 2011). A decrease in PSD abundance seemed to occur in Martinique from 2018 to 2019 (Courtin et al., 2022), but extending the study period from 2014 to 2019 showed that PSD abundance was relatively constant over the years. It is likely that the decrease in PSD abundance was the result of permanent emigration out of the study area rather than an increase in mortality. Productive ecosystems in the Caribbean basin such as coral reefs have been greatly perturbed (Pandolfi et al., 2003); this has reduced food availability and could force PSD to travel further offshore to find prey (Barragán-Barrera et al., 2019). The decline in PSD abundance needs to be monitored more closely to understand better its causes and consequences.
The number of individuals in the superpopulation estimated by POPAN were two to three times larger in Guadeloupe (FU = 80, OV = 373) than in Martinique (FU = 30, OV = 126), and the total population size estimates were two times larger in Guadeloupe (FU = 657, OV = 3063) than in Martinique (FU = 336, OV = 1443), which confirms preliminary findings regarding the number of identifications and abundances for each island (Courtin et al., 2022). However, the presence of a trap-happiness effect in Guadeloupe may have produced an underestimation of the marked population estimates (Pradel, 1993; Parra et al., 2006; Pradel and Sanz-Aguilar, 2012), which may be even more important because increased photographing of distinctively marked individuals might lead to a higher mark ratio, and thus a lower estimate of the total population size (Wickman et al., 2021). To overcome such biases on the trap effect and the mark ratio estimations, the sampling method should specify that photographs be taken randomly of all individuals, whether or not they have distinctive markings and by taking a number of photographs proportional to the size of the group observed (Eguchi, 2014; Wickman et al., 2021). Our abundance estimates, which were determined from a relatively small study area, seem to indicate rather large populations. For comparison, our estimates were similar to the number of PSD estimated from much larger study areas, e.g., the southeastern Atlantic off the US (N = 6,593, CV = 0.51; Garrison, 2020), the northwestern Gulf of Mexico (N = 5,876, CV = 0.43 and N = 5,097, CV = 0.24; Jefferson, 1996 and Mullin et al., 2004, respectively), and in Pacific waters off Colombia (N = 3,934, 95% CI: 1,755–8,820; Palacios et al., 2012).
4.6 Implications for the conservation of pantropical spotted dolphins in Agoa Sanctuary
The management and conservation of marine species can be complex due to the lack of baseline studies on the species and the environment in which they live (O’Brien and Whitehead, 2013; Haughey et al., 2020). It is essential to improve the current knowledge of these species to carry out specific and effective action plans to protect them (Holt, 2009). Our results indicate that PSD populations in Guadeloupe and Martinique consist of individuals with different levels of residency—individuals showing high site fidelity and transients displaying low site fidelity, with individuals regularly entering and leaving the study area. Despite the presence of mobile transient individuals, there is little to no exchange between the populations of Guadeloupe and Martinique apart from the exceptional case documented in 2013. PSD individuals in Martinique seemed to be concentrated in one specific area, off the coast of Carbet, and their abundance in the study area, although lower than in Guadeloupe, appeared to be stable. Conversely, the larger Guadeloupe population seemed to be more dispersed off the leeward coast and showed a continuous decline in numbers. It is highly recommended that management measures be implemented within Agoa Sanctuary considering these new findings to most effectively protect the species.
To protect mobile species whose habitats include the waters of several countries, international cooperation is essential, especially in the West Indies, where islands are frequently located less than a hundred kilometers from each other and with national jurisdictions of marine territories varying from one island to the next. This concern led to the creation of the Cartagena Convention Protocol Concerning the Protection of Areas and Wildlife (CAR-SPAW), which has been signed by various Caribbean countries with the aim of coordinating protection measures (Vanzella-Khouri, 1998) and would be an excellent support to carry out such projects. Coordinated cetacean monitoring, both visual and acoustics, as well as genetic studies with neighboring islands would permit the assessment of genetic connectivity between populations and allow a better understanding of the range and distribution of PSD in the West Indies.
Resident marine mammal populations are more sensitive to anthropogenic pressures because their site fidelity is high (e.g., Currey et al., 2009; Atkins et al., 2016; Barragán-Barrera et al., 2017), and fortunately, they are also the most responsive to targeted conservation actions (Gormley et al., 2012). Considering resident individuals in Martinique, a reduction or limitation in the anthropogenic pressures off the Carbet coast is essential as well as determining the reasons for PSD concentrations in this area in the first place. Regarding PSD in Guadeloupe, factors influencing their apparent population decline should be investigated so that they can be controlled by future action plans.
Data availability statement
The raw data supporting the conclusions of this article will be made available by the authors, without undue reservation.
Ethics statement
The animal study was reviewed and approved by Office français de la biodiversité - Sanctuaire Agoa.
Author contributions
BC collected field data with CM,MS, AF and ND. BC made data analysis with JB-J, DB-B, LB and BM. LB and BM supervised this study. BC wrote the first draft of the manuscript and JB-J, DB-B and BM critically reviewed the manuscript. All authors contributed to the article and approved the submitted version.
Funding
The authors are grateful to the French Office for Biodiversity (OFB) - Agoa Sanctuary for the financial support for this study. Participation of Jaime Bolaños-Jiménez in this study was possible because of grants by the Animal Welfare Institute (AWI), Asociación Civil Sea Vida (Venezuela), and the doctoral fellowship 291197/CVU636908 by the Mexican National Council for Science and Technology (CONACyT).
Acknowledgments
The authors would like to thank the whale-watching companies Dauphin-Passion, Aliotis Plongée, Madisea Dauphin Emotion, Schéhérazade, and Cétacés Caraïbes for their friendly help in taking us to collect the photo-ID data. We thank volunteers from Aquasearch, OMMAG, and Claire Freriks from Guadeloupe Evasion Découverte whale-watching company for sharing their photos for this project. We are grateful to Dr. Cecilia Passadore for sharing the R scripts needed for the clustering analysis.
Conflict of interest
The authors declare that the research was conducted in the absence of any commercial or financial relationships that could be construed as a potential conflict of interest.
Publisher’s note
All claims expressed in this article are solely those of the authors and do not necessarily represent those of their affiliated organizations, or those of the publisher, the editors and the reviewers. Any product that may be evaluated in this article, or claim that may be made by its manufacturer, is not guaranteed or endorsed by the publisher.
Abbreviations
AICc, Akaike Information Criterion corrected; AHC, Agglomerative Hierarchical Classification; CMR, Catch–Mark–Release; EW, Early Wet sampling period; ED, Early Dry sampling period; PSD, Pantropical Spotted Dolphin; LW, Late Wet sampling period; LD, Late Dry sampling period; OMMAG, Observatoire des Mammifères Marins de l’Archipel Guadeloupéen; FU, Frequent Users; OV, Occasional Visitors.
References
Adams J. D., Speakman T., Zolman E., Schwacke L. H. (2006). Automating image matching, cataloging, and analysis for photo-identification research. Aquat. Mammals 32, 374–384. doi: 10.1578/AM.32.3.2006.374
Atkins S., Cantor M., Pillay N., Cliff G., Keith M., Parra G. J. (2016). Net loss of endangered humpback dolphins: integrating residency, site fidelity, and bycatch in shark nets. Mar. Ecol. Prog. Ser. 555, 249–260. doi: 10.3354/meps11835
Avila I. C., Kaschner K., Dormann C. F. (2018). Current global risks to marine mammals: Taking stock of the threats. Biol. Conserv. 221, 44–58. doi: 10.1016/j.biocon.2018.02.021
Baird R. W., Ligon A. D., Hooker S. K., Gorgone A. M. (2001). Subsurface and nighttime behaviour of pantropical spotted dolphins in hawai′i. Can. J. Zool. 79, 9. doi: 10.1139/cjz-79-6-988
Balance L. T. (1990). “Residence patterns, group organization, and surfacing associations of bottlenose dolphins in kino bay, gulf of California, Mexico,” in The bottlenose dolphin. Eds. Leatherwood S., Reeves R. R. (San Diego: Academic Press), 267–283.
Barragán-Barrera D. C., May-Collado L. J., Tezanos-Pinto G., Islas-Villanueva V., Correa-Cárdenas C. A., Caballero S., et al (2017). High genetic structure and low mitochondrial diversity in bottlenose dolphins of the Archipelago of Bocas del Toro, Panama: A population at risk? PLoS One 12, e0189370. doi: 10.1371/journal.pone.0189370
Barragán-Barrera D. C., do Amaral K. B., Chávez-Carreño P. A., Farías-Curtidor N., Lancheros-Neva R., Botero-Acosta N., et al. (2019). Ecological niche modelling of three species of stenella dolphins in the Caribbean basin, with application to the seaflower biosphere reserve. Front. Mar. Sci. 6. doi: 10.3389/fmars.2019.00010
Bolaños-Jiménez J., Morteo E., Delfín-Alfonso C. A., Fruet P. F., Secchi E. R., Bello-Pineda J. (2021). Population dynamics reveal a core community of the common bottlenose dolphin (Tursiops truncatus) in open waters of the south-Western gulf of Mexico. Front. Mar. Sci. 8. doi: 10.3389/fmars.2021.753484
Burks C., Swartz S. L. (2000). Cruise results, windwards humpback (Megaptera novaeangliae) survey: NOAA ship Gordon Gunter cruise GU-00-01, 9 February to 3 April 2000. 31. (Miami, FL USA: U.S. Department of Commerce, NOAA Technical Memorandum NMFS-SEFSC-438).
Burnham K. P., Anderson D. R. (2002). Model selection and multimodel inference: A practical information-theoretic approach. 2nd edn (New York: Springer-Verlag).
Burnham K. P., Anderson D. R., White G. C., Brownie C., Pollock K. H. (1987). Design and analysis methods for fish survival experiments based on release-recapture (Bethesda, MD USA: American Fisheries Society Monographs) No 5, 414–420.
Caldwell D. K., Caldwell M. C., Rathjen W. F., Sullivan J. R. (1971). Cetaceans from lesser antillean island of St-Vincent. Fish. Bull. Natl. Oceanic Atmospheric Administration 69, 303.
Cerema (2020) Dynamiques et évolution du littoral fascicule 13 : Synthèse des connaissances de l’archipel de Guadeloupe. Available at: https://www.cerema.fr/fr/centre-ressources/boutique/general/.
Chan S. C. Y., Karczmarski L. (2017). Indo-pacific humpback dolphins (Sousa chinensis) in Hong Kong: Modelling demographic parameters with mark-recapture techniques. PloS One 12, e0174029. doi: 10.1371/journal.pone.0174029
Choquet R., Lebreton J.-D., Gimenez O., Reboulet A.-M., Pradel R. (2009). U-CARE: Utilities for performing goodness of fit tests and manipulating CApture–REcapture data. Ecography 32, 1071–1074. doi: 10.1111/j.1600-0587.2009.05968.x
Choquet R., Reboulet A.-M., Lebreton J.-D., Gimenez O., Pradel R. (2005). U-CARE 2.2 (Utilities–CApture-REcapture) user’s manual (Montpellier, France: CEFE). Available at: https://www.cefe.cnrs.fr/fr/recherche/bc/bbp/264-logiciels.
Colwell R. K., Mao C. X., Chang J. (2004). Interpolating, extrapolating, and comparing incidence-based species accumulation curves. Ecology 85, 2717–2727. doi: 10.1890/03-0557
Connor R. C. (2000). “Group living in whales and dolphins,” in Cetacean societies: Field studies of dolphins and whales. Eds. Mann J., Connor R. C., Tyack P. L., Whitehead H. (Chicago, IL.: University of Chicago Press), 199–218.
Cooch E. G., White G. C. (2019). Program MARK - a gentle introduction. 19th edition (Fort Collins: Colorado State University).
Cormack R. M. (1964). Estimates of survival from the sighting of marked animals. Biometrika 51, 429–438. doi: 10.1093/biomet/51.3-4.429
Corredor J. E. (1979). Phytoplankton response to low level nutrient enrichment through upwelling in the Columbian Caribbean basin. Deep Sea Res. Part A Oceanogr. Res. Papers 26, 731–741. doi: 10.1016/0198-0149(79)90010-4
Courtin B., Millon C., Feunteun A., Safi M., Duporge N., Bolaños-Jiménez J., et al. (2022). Insights on the residency status and inter-island movement patterns of pantropical spotted dolphins Stenella attenuata in the agoa sanctuary, Eastern Caribbean. Latin Am. J. Aquat. Mammals 17, 22–34. doi: 10.5597/lajam00277
Cubero-Pardo P. (2007). Environmental factors governing the distribution of the bottlenose (Tursiops truncatus) and the spotted dolphin (Stenella attenuata) in golfo dulce, south pacific, off Costa Rica. Investigaciones marinas 35, 15–23. doi: 10.4067/S0717-71782007000200002
Currey R. J., Dawson S. M., Slooten E., Schneider K., Lusseau D., Boisseau O. J., et al. (2009). Survival rates for a declining population of bottlenose dolphins in doubtful sound, new Zealand: an information theoretic approach to assessing the role of human impacts. Aquat. Conserv.: Mar. Freshw. Ecosyst. 19, 658–670. doi: 10.1002/aqc.1015
Cuzange P.-A. (2011). Les Pressions anthropiques s’exerçant dans le sanctuaire pour les mammifères marins aux antilles françaises (Agoa). 200. Office Français de la Biodiversité. Available at: http://oai.afbiodiversite.fr/cindocoai/download/AAMP/91/1/536AAMP_2011_Rapport_Agoa_CUZANG20011E.pdf/.
Davis R. W., Ortega-Ortiz J. G., Ribic C. A., Evans W. E., Biggs D. C., Ressler P. H., et al. (2002). Cetacean habitat in the northern oceanic gulf of Mexico. Deep Sea Res. Part I: Oceanogr. Res. Papers 49, 121–142. doi: 10.1016/S0967-0637(01)00035-8
DEAL Guadeloupe (2012). Profil environnemental régional de la Guadeloupe (France: Ministère de l’Écologie, du Développement durable et de l’Énergie). Available at: http://www.guadeloupe.developpement-durable.gouv.fr/IMG/pdf/.
De Vries L. (2017). First characterization of cetacean’s movement in the eastern Caribbean: application to sperm whale, short-finned pilot whale and bottlenose dolphin (France: Université Jean Monnet (Saint-Étienne).
do Amaral K. B., Alvares D. J., Heinzelmann L., Borges-Martins M., Siciliano S., Moreno I. B. (2015). Ecological niche modeling of stenella dolphins (Cetartiodactyla: Delphinidae) in the southwestern Atlantic ocean. J. Exp. Mar. Biol. Ecol. 472, 166–179. doi: 10.1016/j.jembe.2015.07.013
Dufault S., Whitehead H., Dillon M. (1999). An examination of the current knowledge on the stock structure of sperm whales (Physeter macrocephalus) worldwide. J. cetacean Res. Manage. 1, 1–10. doi: 10.47536/jcrm.v1i1.447
Edwards E. F., Kellar N. M., Perrin W. F. (2013). Form, function and pathology in the pantropical spotted dolphin (Stenella attenuata). 81. (La Jolla, USA: NOAA technical memorandum NMFS NOAA-TMNMFS-SWFSC-516).
Eguchi T. (2014). Estimating the proportion of identifiable individuals and group sizes in photographic identification studies. Mar. Mammal Sci. 30, 1122–1139. doi: 10.1111/mms.12119
Feunteun A., de Schrevel C., Verhaegen M., Chevallier D., Duchemin M., Ziani N., et al. (2018). First evaluation of the cookie-cutter sharks (Isistius sp.) predation pattern on different cetacean species in Martinique. Environ. Biol. Fish. 101, 749–759. doi: 10.1007/s10641-018-0735-1
Feunteun A., Safi M., de Mongolfier B. (2019) État des connaissances sur la fréquentation des cétacés en baie de fort-De-France et les risques de perturbations liés au trafic maritime. Available at: https://www.grandebaiemartinique.com/document/etat-de-frequentation-baie-cetaces-feunteun-et-al-2019-gpmm-v1/.
Fisher R. A., Corbet A. S., Williams C. B. (1943). The relation between the number of species and the number of individuals in a random sample of an animal population. J. Anim. Ecol. 12, 42. doi: 10.2307/1411
Gandilhon N. (2012). Contribution au recensement des cétacés dans l’archipel de Guadeloupe (Pointe-à-Pitre, France: Université des Antilles et de la Guyane, Campus Fouillole).
Garrison L. (2020) Abundance of marine mammals in waters of the U.S. southeastern Atlantic during summer 2016. Available at: https://repository.library.noaa.gov/view/noaa/27294.
Gero S., Gordon J., Carlson C., Evans P., Whitehead H. (2007). Population estimate and inter-island movement of sperm whales, Physeter macrocephalus, in the Eastern Caribbean Sea. J. Cetacean Res. Manage. 9, 143–150.
Gerrodette T., Waters G., Perryman W., Balance L. T. (2008). Estimates of 2006 dolphin abundance in the eastern tropical pacific, with revised estimates from 1986-2003 43. NOAA technical memorandum NOAA-TM-NMFS-SWFSC-422 (La Jolla, CA: NOAA National Marine Fisheries Service.).
Gormley A. M., Slooten E., Dawson S., Barker R. J., Rayment W., du Fresne S., et al. (2012). First evidence that marine protected areas can work for marine mammals: Protected areas for marine mammals. J. Appl. Ecol. 49, 474–480. doi: 10.1111/j.1365-2664.2012.02121.x
Gowans S., Würsig B., Karczmarski L. (2007). The social structure and strategies of delphinids: predictions based on an ecological framework. Adv. Mar. Biol. 53, 195–294. doi: 10.1016/s0065-2881(07)53003-8
Hammond P. S. (1990a). Capturing whales on film–estimating cetacean population parameters from individual recognition data. Mammal Rev. 20, 17–22. doi: 10.1111/j.1365-2907.1990.tb00099.x
Hammond P. S. (1990b). Heterogeneity in the gulf of Maine? estimating humpback whale population size when capture probabilities are not equal. Rep. Int. Whaling Commission Special Issue 12, 135–139.
Haughey R., Hunt T., Hanf D., Rankin R. W., Parra G. J. (2020). Photographic capture-recapture analysis reveals a Large population of indo-pacific bottlenose dolphins (Tursiops aduncus) with low site fidelity off the north West cape, Western Australia. Front. Mar. Sci. 6. doi: 10.3389/fmars.2019.00781
Heithaus M. R., Dill L. M. (2002). Food availability and tiger shark predation risk influence bottlenose dolphin habitat use. Ecology 83, 480–491. doi: 10.1890/0012-9658(2002)083[0480:FAATSP]2.0.CO;2
Holt E. (2009). “Marine protected areas,” in Encyclopedia of marine mammals. Eds. Würsig B., Perrin W. F., Thewissen J. G. M.“Hans” (Amsterdam: Elsevier), 696–705.
Hunt T., Bejder L., Allen S., Rankin R., Hanf D., Parra G. (2017). Demographic characteristics of Australian humpback dolphins reveal important habitat toward the southwestern limit of their range. Endangered Species Res. 32, 71–88. doi: 10.3354/esr00784
Jefferson T. A. (1996). Estimates of abundance of cetaceans in offshore waters of the northwestern gulf of Mexico 1992-1993. Southwestern Nat. 41, 279–287.
Jefferson T. A., Webber M. A., Pitman R. L., Gorter U. (2015). Marine mammals of the world: a comprehensive guide to their identification. 2nd edn (London, UK: Academic Press/Elsevier).
Jolly G. M. (1965). Explicit estimates from capture-recapture data with both death and immigration-stochastic model. Biometrika 52, 225. doi: 10.2307/2333826
Katona S. K., Beard J. A. (1990). Population size, migrations and feeding aggregations of the humpback whale (Megaptera novaeangliae) in the western north Atlantic ocean. Rep. Int. Whaling Commission Special Issue 12, 295–306.
Luksenburg J. A. (2014). Prevalence of external injuries in small cetaceans in aruban waters, southern Caribbean. PloS One 9, e88988. doi: 10.1371/journal.pone.0088988
Machernis A. F., Stack S. H., Olson G. L., Sullivan F. A., Currie J. J. (2021). External scarring as an indicator of fisheries interactions with bottlenose (Tursiops truncatus) and pantropical spotted (Stenella attenuata) dolphins in Maui nui, hawai’i. Aquat. Mammals 47, 482–498. doi: 10.1578/AM.47.5.2021.482
Mann J. (1999). Behavioral sampling methods for cetaceans: A review and critique. Mar. Mammal Sci. 15, 102–122. doi: 10.1111/j.1748-7692.1999.tb00784.x
May-Collado L. J., Forcada J. (2012). Small-scale estimation of relative abundance for the coastal spotted dolphins (Stenella attenuata) in Costa Rica: the effect of habitat and seasonality. Rev. Biología Trop. 60, 133. doi: 10.15517/rbt.v60i2.19997
Mayol P., de Montgolfier B., Ratel M., Bordes R., Costales L., Iatropoulos D., et al. (2016) ). caractérisation des activités d’observation commerciale des cétacés à l’échelle du sanctuaire agoa. Available at: http://www.souffleursdecume.com/docs/.
Maze-Foley K., Mullin K. (2007). Cetaceans of the oceanic northern gulf of Mexico: Distributions, group sizes and interspecific associations. J. Cetacean Res. Manage. 8, 203.
Météo France (2020) Bulletin climatique annuel 2015 - 2020 - Martinique. Available at: https://donneespubliques.meteofrance.fr/.
Mignucci-Giannoni A. A., Schartz S. L., Martinez A., Burks C. M., Watkins W. A. (2003). First records of the pantropical spotted dolphin (Stenella attenuata) for the Puerto Rican bank, with a review of the species in the Caribbean. Caribbean J. Sci. 39, 381–392.
Miller E. J. (1990). Photo-identification techniques applied to dall’s porpoise (Phocoenoides dalli) in puget sound, Washington. Rep. Int. Whaling Commission Special Issue 12, 429–437.
Ministère de l’Écologie, du Développement durable, des Transports et du Logement (2011). Arrêté du 1er juillet 2011 fixant la liste des mammifères marins protégés sur le territoire national et les modalités de leur protection. J. Officiel de la République Française. France.
Moreno I., Zerbini A., Danilewicz D., de Oliveira Sa S., Simões-Lopes P., Lailson-Brito J., et al. (2005). Distribution and habitat characteristics of dolphins of the genus stenella (Cetacea: Delphinidae) in the southwest Atlantic ocean. Mar. Ecol. Prog. Ser. 300, 229–240. doi: 10.3354/meps300229
Morteo E., Rocha-Olivares A., Morteo R. (2012). Sensitivity analysis of residency and site fidelity estimations to variations in sampling effort and individual catchability. Rev. Mexicana Biodiversidad 83, 487–495. doi: 10.22201/ib.20078706e.2012.2.972
Mullin K. D., Hoggard W., Hansen L. J. (2004). Abundance and seasonal occurrence of cetaceans in outer continental shelf and slope waters of the north-central and northwestern gulf of Mexico. Gulf Mexico Sci. 22, 62–73. doi: 10.18785/goms.2201.06
Nowacek D. P., Christiansen F., Bejder L., Goldbogen J. A., Friedlaender A. S. (2016). Studying cetacean behaviour: new technological approaches and conservation applications. Anim. Behav. 120, 235–244. doi: 10.1016/j.anbehav.2016.07.019
O’Brien J. M., Berrow S. D., Ryan C., Mcgrath D., O’Connor I., Pesante G., et al. (2009). A note on long-distance matches of bottlenose dolphins (Tursiops truncatus) around the Irish coast using photo-identification. J. Cetacean Res. Manage. 11, 71–76.
O’Brien K., Whitehead H. (2013). Population analysis of endangered northern bottlenose whales on the scotian shelf seven years after the establishment of a marine protected area. Endangered Species Res. 21, 273–284. doi: 10.3354/esr00533
Office Français de la Biodiversité (2012) Plan de gestion du sanctuaire AGOA. Available at: http://www.aires-marines.fr/Documentation/.
Palacios D. M., Herrera J. C., Gerrodette T., Garcia C., Soler G. A., Avila I. C., et al. (2012). Cetacean distribution and relative abundance in colombia’s pacific EEZ from survey cruises and platforms of opportunity. J. Cetacean Res. Manage. 12, 45–60.
Pandolfi J. M., Bradbury R. H., Sala E., Hughes T. P., Bjorndal K. A., Cooke R. G., et al. (2003). Global trajectories of the long-term decline of coral reef ecosystems. Science 301, 955–958. doi: 10.1126/science.1085706
Parra G. J., Corkeron P. J., Marsh H. (2006). Population sizes, site fidelity and residence patterns of Australian snubfin and indo-pacific humpback dolphins: Implications for conservation. Biol. Conserv. 129, 167–180. doi: 10.1016/j.biocon.2005.10.031
Passadore C., Möller L., Diaz-Aguirre F., Parra G. J. (2017). Demography of southern Australian bottlenose dolphins living in a protected inverse estuary. Aquat. Conserv.: Mar. Freshw. Ecosyst. 27, 1186–1197. doi: 10.1002/aqc.2772
Passadore C., Möller L., Diaz-Aguirre F., Parra G. J. (2018). High site fidelity and restricted ranging patterns in southern Australian bottlenose dolphins. Ecol. Evol. 8, 242–256. doi: 10.1002/ece3.3674
Perrin W. F. (2018). “Pantropical spotted dolphin,” in Encyclopedia of marine mammals, 2nd edn. Eds. Würsig B., Perrin W. F., Thewissen J. G. M.“Hans” (London, UK.: Academic Press Inc.), 676–678.
Perrin W. F. (2020) World cetacea database. Available at: http://www.marinespecies.org/cetacea/ (Accessed 16 Feb 2020).
Pino O., Laura V. (2021). Riesgo potencial de captura incidental del delfín manchado pantropical (Stenella attenuata) por pesquerías de atún en el Pacífico Oriental Tropical y el Gran Caribe. (Santiago de Cali, Colombia: Universidad del Valle).
Pollock K. H., Nichols J. D., Brownie C., Hines J. E. (1990). Statistical inference for capture-recapture experiments. Wildlife Monographs, 3–97.
Pradel R. (1993). “Flexibility in survival analysis from recapture data: Handling Trap-Dependence,” in Marked individuals in the study of bird populations. Eds. North P. M., Lebreton J.-D. (Bale, Switzerland: Birkhäuser Verlag), 29–37.
Pradel R., Hines J. E., Lebreton J.-D., Nichols J. D. (1997). Capture-recapture survival models taking account of transients. Biometrics 53, 60–72. doi: 10.2307/2533097
Pradel R., Sanz-Aguilar A. (2012). Modeling trap-awareness and related phenomena in capture-recapture studies. PloS One 7, e32666. doi: 10.1371/journal.pone.0032666
Psarakos S., Herzing D. L., Marten K. (2003). Mixed-species associations between pantropical spotted dolphins (Stenella attenuata) and Hawaiian spinner dolphins (Stenella longirostris) off Oahu, Hawaii. Aquat. Mammals 29, 390–395. doi: 10.1578/01675420360736578
R Core Team (2023). R: A language and environment for statistical computing. (Vienna: R Foundation for Statistical Computing).
Read A. J., Murray K. T. (2000). Gross evidence of human-induced mortality in small cetaceans. 21. (Silver Spring, MD USA: U. S. Department of Commerce, NOAA Technical Memorandum NMFS-OPR-15).
Réseau National Échouage (2021) BDD ECHOUAGE : Histogrammes & cartes echouage. Available at: http://pelagis.in2p3.fr/public/histo-carto/ (Accessed 4 Sep 2021).
Reynolds J. E. III, Marsh H., Ragen T. J. (2009). Marine mammal conservation. Endangered Species Res. 7, 23–28. doi: 10.3354/esr00179
Robbins J., Allen J. M., Clapham P. J., Mattila D. K. (2006). Stock identity of a humpback whale taken in a southeastern Caribbean hunt. J. Cetacean Res. Manage. 8, 29–31.
Robbins J. R., Babey L., Embling C. B. (2020). Citizen science in the marine environment: estimating common dolphin densities in the north-east Atlantic. PeerJ 8, e8335. doi: 10.7717/peerj.8335
Rosel P. E., Mullin K. D., Garrison L., Schwacke L., Adams J., Balmer B., et al. (2011). Photo-identification capture-mark-recapture techniques for estimating abundance of bay, sound and estuary populations of bottlenose dolphins along the U.S. East coast and gulf of Mexico: a workshop report. 38. (Cajundome Boulevard Lafayette, LA, USA: U.S. Department of Commerce, NOAA Technical Memorandum NMFS-SEFSC-621).
Safi M., Eymard M., Janssen A., Feunteun A., de Mongolfier B. (2020) Etat de santé des populations résidentes et semi-résidentes des cétacés présentes dans les eaux de la Martinique. Available at: https://projets.beecee.fr/baie-fdf/document/.
Schwarz C. J., Arnason A. N. (1996). A general methodology for the analysis of capture-recapture experiments in open populations. Biometrics 52, 860–873. doi: 10.2307/2533048
Seber G. A. F. (1982). The estimation of animal abundance and related parameters (New York, NY: MacMillan).
Shane S. H. (1990). “Behavior and ecology of the bottlenose dolphin at sanibel island, Florida,” in The Bottlenose Dolphin eds. Leatherwood S., Reeves R. R. (San Diego: The Bottlenose Dolphin, Academic Press), 245–265.
Silva M., Magalhães S., Prieto R., Santos R., Hammond P. (2009). Estimating survival and abundance in a bottlenose dolphin population taking into account transience and temporary emigration. Mar. Ecol. Prog. Ser. 392, 263–276. doi: 10.3354/meps08233
Smith T. D., Allen J., Clapham P. J., Hammond P. S., Katona S., Larsen F., et al. (1999). An ocean-Basin-Wide mark-recapture study of the north Atlantic humpback whale (Megaptera novaeangliae). Mar. Mammal Sci. 15, 1–32. doi: 10.1111/j.1748-7692.1999.tb00779.x
Sprogis K. R., Pollock K. H., Raudino H. C., Allen S. J., Kopps A. M., Manlik O., et al. (2016). Sex-specific patterns in abundance, temporary emigration and survival of indo-pacific bottlenose dolphins (Tursiops aduncus) in coastal and estuarine waters. Front. Mar. Sci. 3. doi: 10.3389/fmars.2016.00012
Stanley T. R., Burnham K. P. (1999). A closure test for time-specific capture-recapture data. Environ. Ecol. Stat 6, 197–209. doi: 10.1023/A:1009674322348
Suzuki R., Shimodaira H. (2006). Pvclust: an r package for assessing the uncertainty in hierarchical clustering. Bioinformatics 22, 1540–1542. doi: 10.1093/bioinformatics/btl117
Tschopp A., Ferrari M. A., Crespo E. A., Coscarella M. A. (2018). Development of a site fidelity index based on population capture-recapture data. PeerJ 6, e4782. doi: 10.7717/peerj.4782
Tyne J. A., Pollock K. H., Johnston D. W., Bejder L. (2014). Abundance and survival rates of the hawai’i island associated spinner dolphin (Stenella longirostris) stock. PloS One 9, e86132. doi: 10.1371/journal.pone.0086132
Urian K., Gorgone A., Read A., Balmer B., Wells R. S., Berggren P., et al. (2015). Recommendations for photo-identification methods used in capture-recapture models with cetaceans. Mar. Mammal Sci. 31, 298–321. doi: 10.1111/mms.12141
Vanzella-Khouri A. (1998). Implementation of the protocol concerning specially protected areas and wildlife (SPAW) in the wider Caribbean region. Univ. Miami Inter-American Law Rev. 30, 53–83.
Ward J. J. H. (1963). Hierarchical grouping to optimize an objective function. J. Am. Stat. Assoc. 58, 236–244. doi: 10.1080/01621459.1963.10500845
Watkins W. A. (1985). Investigations of sperm whale acoustic behaviors in the southeast Caribbean. Cetology 49, 1–15.
Wells R., Boness D., Rathbun G. (1999). “Behavior,” in Biology of Marine Mammals, eds. Reynolds J. E. III, Rommell S. (Washington, DC: Biology of Marine Mammals. Smithsonian Institution Press), 324–422.
Wells R. S., Scott M. D. (1990). Estimating bottlenose dolphin population parameters from individual identification and capture-release techniques. Rep. Int. Whaling Commission Special Issue 12, 407–415.
White G. C., Burnham K. P. (1999). Program MARK: survival estimation from populations of marked animals. Bird Study 46, S120–S139. doi: 10.1080/00063659909477239
Whitehead H. (1990). Mark-recapture estimates with emigration and re-immigration. Biometrics 46, 473–479. doi: 10.2307/2531451
Whitehead H., Moore M. J. (1982). Distribution and movements of West Indian humpback whales in winter. Can. J. Zool. 60, 2203–2211. doi: 10.1139/z82-282
Whitehead H., Wimmer T. (2005). Heterogeneity and the mark–recapture assessment of the scotian shelf population of northern bottlenose whales (Hyperoodon ampullatus). Can. J. Fish. Aquat. Sci. 62, 2573–2585. doi: 10.1139/f05-178
Wickman L., Rayment W., Slooten E., Dawson S. M. (2021). Recommendations for estimating mark rate of cetaceans in photo-ID research: A critique of field sampling protocols and variance estimation. Mar. Mammal Sci. 37, 328–343. doi: 10.1111/mms.12723
Williams B. K., Nichols J. D., Conroy M. J. (2002). Analysis and management of animal populations. (San Diego, CA, USA: Academic Press).
Würsig B., Jefferson T. A. (1990). Methods of photo-identification for small cetaceans. Rep. Int. Whaling Commission Special Issue 12, 43–52.
Keywords: abundance, distribution, capture-recapture, pantropical spotted dolphin, stenella attenuata, French West Indies
Citation: Courtin B, Millon C, Feunteun A, Safi M, Duporge N, Bolaños-Jiménez J, Barragán-Barrera DC, Bouveret L and de Montgolfier B (2023) Site fidelity and population parameters of pantropical spotted dolphins in the Eastern Caribbean through photographic identification. Front. Mar. Sci. 10:939263. doi: 10.3389/fmars.2023.939263
Received: 09 May 2022; Accepted: 31 January 2023;
Published: 22 February 2023.
Edited by:
Filipe Alves, Center for Marine and Environmental Sciences (MARE), PortugalReviewed by:
Denise Lore Herzing, Florida Atlantic University, United StatesSalvatore Siciliano, Fundação Oswaldo Cruz (Fiocruz), Brazil
Copyright © 2023 Courtin, Millon, Feunteun, Safi, Duporge, Bolaños-Jiménez, Barragán-Barrera, Bouveret and de Montgolfier. This is an open-access article distributed under the terms of the Creative Commons Attribution License (CC BY). The use, distribution or reproduction in other forums is permitted, provided the original author(s) and the copyright owner(s) are credited and that the original publication in this journal is cited, in accordance with accepted academic practice. No use, distribution or reproduction is permitted which does not comply with these terms.
*Correspondence: Benjamin de Montgolfier, b.montgolfier@aquasearch.fr