Phenotypic plasticity and carryover effects in an ecologically important bivalve in response to changing environments
 Lindsay Alma1,2*
  Paul McElhany3
  Ryan N. Crim4
  Jan A. Newton5
  Michael Maher3
  John B. Mickett5
  Jacqueline L. Padilla-Gamiño1
- 1School of Aquatic and Fishery Sciences, University of Washington, Seattle, WA, United States
- 2Bodega Marine Laboratory, College of Biological Sciences, University of California Davis, Bodega Bay, CA, United States
- 3Conservation Biology Division, National Marine Fisheries Service, National Oceanic and Atmospheric Administration, Seattle, WA, United States
- 4Puget Sound Restoration Fund, Bainbridge Island, WA, United States
- 5Applied Physics Laboratory, Washington Ocean Acidification Center, University of Washington, Seattle, WA, United States
Phenotypic plasticity can improve an organism’s fitness when exposed to novel environmental conditions or stress associated with climate change. Our study analyzed spatiotemporal differences in phenotypic plasticity and offspring performance in Olympia oysters Ostrea lurida. This species is an ecosystem engineer and is of great interest for commercial and restoration aquaculture. We used a multidisciplinary approach to examine acute and long-term physiological differences in O. lurida in response to in situ oceanographic conditions in a dynamic inland sea. We outplanted oysters to different areas in Puget Sound, Washington, affixing cages to anchor lines of oceanographic monitoring buoys. This allowed us to couple high-resolution oceanographic data with organism’s phenotypic response. To assess spatiotemporal differences in oyster physiological performance, we collected oysters after six-months and one year of acclimatization at four field sites. During each collection period we evaluated changes in shell properties, diet, metabolism, and reproduction. Adult growth, δ13C and δ15N isotopic signatures, and gametogenesis were affected by both seasonal and environmental conditions. In the winter, oysters from all sites had higher respiration rates when exposed to acute thermal stress, and lower respiration response to acute pH stress. Lipid content, sex ratio and shell strength were unchanged across locations. Offspring growth rates between sites at experimental temperature 20°C closely reflected parental growth rate patterns. Offspring survival was not correlated with growth rates suggesting different energetic trade-offs in oyster offspring. The metabolic response (respiration) of larvae reached its highest point at 20°C but sharply decreased at 25°C. This indicates that larvae are more sensitive to temperature stress, as adults did not exhibit a reduction in metabolic response at 25°C. By deploying genetically similar oysters into distinct environments and employing a wide range of physiological methodologies to examine performance and fitness, our results indicate that Olympia oysters exhibit a high degree of phenotypic plasticity and show evidence of parental carryover.
Introduction
In recent years, we have witnessed substantial changes in our environment due to anthropogenically driven climate change (IPCC, 2019). The land and sea are warming, the water is becoming more acidic, and we have experienced more extreme and frequent weather events (Doney et al., 2009; Stott et al., 2016; O’Neill et al., 2017). Co-occurring stressors may have unpredictable interactive effects on organismal physiology and their progeny (Todgham and Stillman, 2013; Stevens and Gobler, 2018). Phenotypic plasticity, or the ability of individual genotypes to produce different phenotypes when exposed to different environmental conditions (Gauze, 1947) can enable organisms to survive in a rapidly changing environment. However, there is evidence that shows not all plastic responses are adaptive and some can slowly adapt by modifying the distribution of phenotypes in the population (Sultan, 2000; Fox et al., 2019). Novel environments associated with climate change may result in mal-adaptive plasticity (e.g., slow growth), or there may be a lag time between the emergence of novel environments and population-level expression of beneficial phenotypes, which can lead to extinction or very rapid adaptive evolution through natural selection (Gibert et al., 2019). Conversely, acclimatization and phenotypic plasticity are thought to be a means by which the populations may expand their ecological breadth, occupy a wider range of niches, and drive natural selection (Sultan, 2000; Ghalambor et al., 2007; Lancaster et al., 2015; Li et al., 2018; Gibert et al., 2019). In highly variable environments, such as the intertidal zone, phenotypic plasticity plays an important role, especially with sessile organisms.
In this study we performed a series of field and laboratory experiments to better understand the role of phenotypic plasticity in a rapidly changing environment. Our experiments were performed in a marginal sea using the ecologically important native species, the Olympia oyster Ostrea lurida (Carpenter 1864). Field studies are extremely important because environmental parameters do not occur in isolation and simultaneous exposure to stressors can have unpredictable interactive effects on organismal physiology and potential carryover effects (Todgham and Stillman, 2013; Stevens and Gobler, 2018). Multi-stressor experiments performed in the lab rarely include realistic physiochemical variation into their design. Although interpretation may be complex, it is crucial to conduct field-based experiments where ocean conditions are spatiotemporally dynamic (Duarte et al., 2013; Gobler, 2020). By coupling high resolution environmental data with physiological responses at multiple levels of biological organization, this study fills important gaps in understanding the phenotypic plasticity and carryover effects of O. lurida.
Our study was conducted in Puget Sound, an inland fjord-like estuarine system in Washington state, USA (Fassbender et al., 2018; Bednaršek et al., 2021; Cai et al., 2021). Its unique glacial history has resulted in finger-like inlets and channels which have distinct seasonal stratification, and large spatial variations. Significant fluctuations in carbonate chemistry in Puget Sound often result in periods of aragonite undersaturation which greatly affects the calcification capacity of shellfish (Pelletier et al., 2018; Bednaršek et al., 2021; Cai et al., 2021). Generally, in the colder months, the water column in Puget Sound is well-mixed, water is cold, acidified, and has low dissolved oxygen. Conversely, in the warmer months the water column is highly stratified and surface water is warm with low acidification, and higher salinity and DO relative to the colder months. These variable conditions provide an ideal experimental system to examine how multiple environmental drivers affect (or not) the plasticity of several phenotypic traits including growth, shell strength, physiological performance, reproductive characteristics, and offspring quality.
Washington is the leading producer of farmed shellfish in the U.S., with bivalves holding significant cultural and economic importance (Washington Sea Grant, 2015; USDA, 2018). The state’s shellfish industry, valued at $270 million annually and supporting over 2000 jobs, faced larval die-offs in the early 2000s attributed to undersaturated aragonite levels (Barton et al., 2015; Washington Sea Grant, 2015). To combat ocean acidification, local hatcheries now supplement water with sodium carbonate buffer (Washington State Blue Ribbon Panel on Ocean Acidification, 2012; Wallace et al., 2014; Barton et al., 2015). In June 2021, a record-breaking heat wave led to massive mortality among wild and farmed bivalves in Puget Sound, driven by extreme low tides and high temperatures (Washington Sea Grant, 2021; Raymond et al., 2022). Such events are expected to increase in frequency and intensity due to climate change (IPCC, 2019).
Beyond aquaculture, bivalves in Washington play vital roles in the ecosystem as food web contributors and ecosystem engineers (Dumbauld et al., 2009; Barber et al., 2016). Olympia oysters, the only native oyster to Washington, are ecosystem engineers, filtering water, stabilizing substrate, and creating reefs for other organisms (zu Ermgassen et al., 2020). Despite their ecological importance, native Olympia oyster populations in the Pacific Northwest have suffered severe losses, with restoration efforts ongoing in the Salish Sea (Peter-Contesse and Peabody, 2005; Blake and Bradbury, 2012; Pritchard et al., 2015; Spencer et al., 2020; McIntyre et al., 2021; Ridlon et al., 2021).
There is growing evidence that environmental stressors like temperature, acidification, and food quantity/quality can affect O. lurida fitness, reproduction, offspring performance, susceptibility to predation, and competition for space (especially by non-native Pacific oysters Crassostrea gigas) (Hettinger et al., 2012; Hettinger et al.,2013; Sanford et al., 2014; Silliman et al., 2018; Spencer et al., 2020, Spencer et al., 2021). In Puget Sound, O. lurida populations have different growth rates, survival, and reproductive fitness depending on location and it is likely that high thermal tolerance in some populations may be the result of increased stress resilience in offspring from parents exposed to temperature extremes (Heare et al., 2017). Parental acclimatization capacity and carryover effects will likely be essential to ensure the survival of this sensitive species as the environment becomes more extreme. Work by Spencer et al. (2020) found that environmental history of the O. lurida parents can affect the tolerance and physiology of the offspring. By understanding phenotypic plasticity, physiological capacity and multigenerational responses of O. lurida, we may further improve breeding programs to restore populations to withstand ocean warming and extreme events (Parker et al., 2011; Rossi and Tunnicliffe, 2017).
Our study involved outplanting young adult O. lurida to four sites in Puget Sound that had considerable spatiotemporal environmental variation. We collected environmental data from monitoring buoys at each site and coupled it with oyster phenotypic characteristics after six months and one year of acclimatization. At six months of acclimatization we also moved a subset of oysters from each site to a hatchery where we induced spawning for each cohort to obtain larvae and study carryover effects in offspring quality depending on the parent’s environmental history. Specifically, we sought to address these important questions: (i) Will there be differences in phenotypic plasticity and tolerance in O. lurida depending on spatiotemporal variation in the field? (ii) Is there evidence of parental carryover in larval offspring based on parent’s environmental history?
Methods
Oceanographic monitoring
In situ oceanographic readings of temperature, dissolved oxygen (DO), chlorophyll-a (chl-a), and salinity were acquired from Oceanic Remote Chemical-Optical Analyzer (ORCA) buoys, managed by University of Washington Applied Physics Laboratory, Northwest Association of Networked Ocean Observing Systems (NANOOS), and Integrated Ocean Observing System (IOOS). Three ORCA buoys within Puget Sound were used as our study sites: Carr Inlet (CI) (47° 16.8’ N, 122° 43.8’ W) in South Puget Sound, Dabob Bay (DB) (47° 48.205’ N, 122° 48.175’ W) in Hood Canal, and Point Wells (PW) (47° 45.67’ N, 122° 23.83’ W) in Central Puget Sound (Figure 1A). When sensors on ORCA buoys malfunctioned during the course of the study, data from the LiveOcean Model were used instead to estimate a continuous profile of conditions (MacCready et al., 2021). pH, pCO2, and aragonite saturation state (Ωara) were calculated by entering values for dissolved inorganic carbon (DIC), total alkalinity (TA), temperature, and salinity into R package seacarb version 3.2.14 (Gattuso et al., 2016).
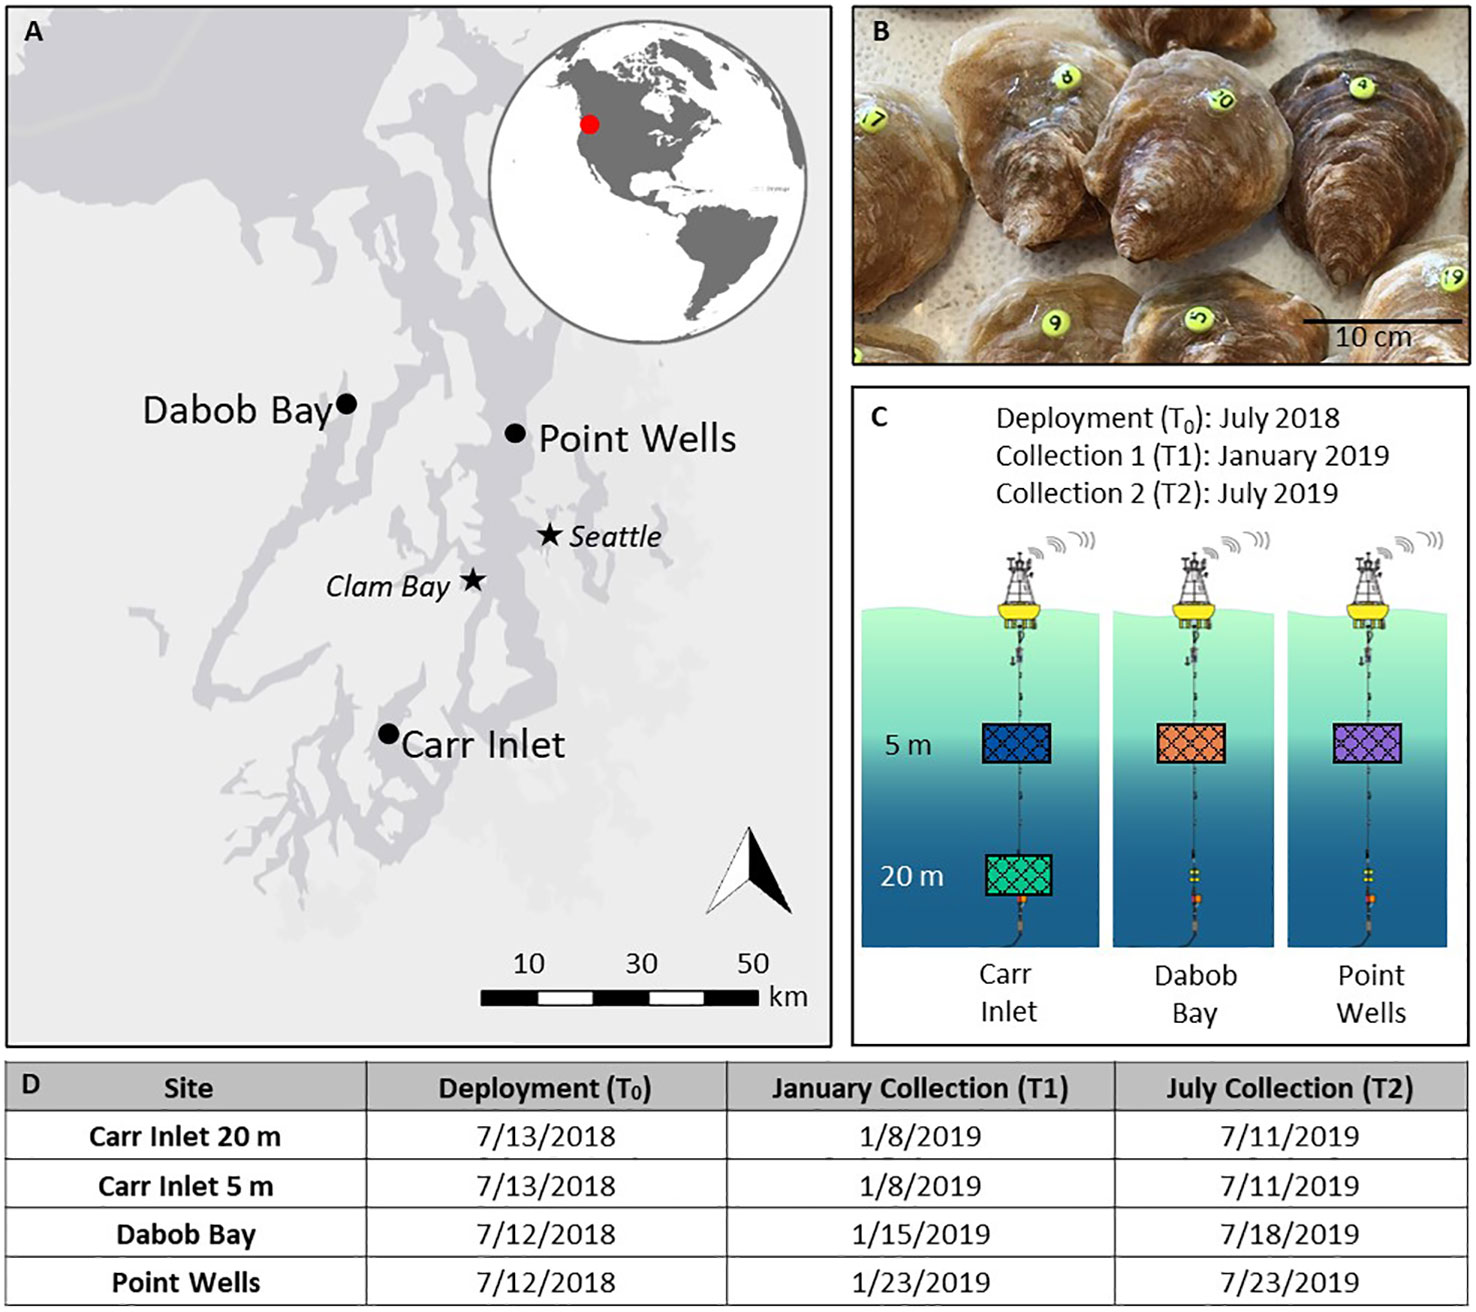
Figure 1 (A) Map of Puget Sound in Northwest Washington State showing the study sites where the Oceanic Remote Chemical-Optical Analyzer (ORCA) buoys were deployed (Dabob Bay, Point Wells and Carr Inlet). The map also shows Clam Bay where Olympia oysters Ostrea lurida were breed and grown-out before the experiment, and Seattle for reference. (B) O. lurida, marked with numbered tags (photo by Dr. Julieta Martinelli). (C) A study design schematic, outlining the deployment and collection dates, location, and depth of shellfish cages. Cages are color-coded to coordinate with other figures: Carr Inlet at 5 m is blue, Carr Inlet at 20 m is green, Dabob Bay at 5 m is orange, and Point Wells at 5 m is purple. (D) Specific dates of deployment and collections at each site.
Cage deployment and collection
One-year old O. lurida oysters from South Puget Sound parentage were obtained from Puget Sound Restoration Fund in Manchester, Washington. During their first-year oysters were grown in natural Puget Sound conditions in Clam Bay offshore of Kenneth K. Chew Center for Shellfish Research and Restoration (47° 34.16’ N, 122° 33.05’ W). All individuals in this study were the same age and raised in the same conditions before the outplanting. We used farmed oysters because wild caught animals may differ in age, environmental history, and nutritive status, and would further confound our results (Byrne, 2011).
Before outplanting the oysters, a portion were measured and tagged by adhering numbered “bee tags” (Betterbee, Greenwich, NY) to their shells with superglue (Pacer Technology Zap-A-Gap Adhesives) (Figure 1B). Then, shellfish were placed in identical rigid mesh plastic bags and secured inside in a metal cage using cable ties. The cages containing the shellfish were attached with a clamp and tether to the anchor line of the ORCA buoys by SCUBA divers. Cages were affixed to the CI buoy at 5 m and 20 m below the surface on July 13, 2018. Cages were affixed to the DB and PW buoys at 5 m below the surface on July 12, 2018 (Figures 1C, D). Cages at 20 m below the surface were affixed at DB and PW, however they sank due to strong current, and were unretrievable by the divers due to the deep depths of the sites (> 100 m). After six months, half of the oysters were removed from the cages and brought back to the lab for physiological analysis. Oysters at CI were collected on January 8, 2019, oysters at DB were collected on January 15, 2019, and oysters from PW were collected on January 23, 2019. The final collections for CI took place on July 11, 2019, for DB on July 18, 2019, and for PW on July 23, 2019 (Figure 1D). Tagged shellfish were immediately brought to the laboratory at the School of Aquatic and Fishery Sciences at the University of Washington, dissected, flash-frozen, and stored at -80°C for further analysis. Shells containing the numbered tags were cleaned with terrycloth and preserved at room temperature.
Growth
A digital caliper (0.1 mm precision) was used to measure the shell height (from hinge to apex) and shell length (from anterior to posterior) of the larger valve. The final measurement was subtracted from the initial shell height and length to obtain total growth. The growth value was divided by the total number of months in the field to obtain a growth rate (n = 70 - 108 per cohort).
Shell strength
Shell strength was estimated using a modified method from Alma et al. (2023, 2020). Dried shells were rehydrated in seawater for 24 hours prior to shell strength tests to mimic the aquatic environment (Ikejima et al., 2003). Hydrated shells were taken to the University of Washington Mechanical Engineering Department where they were point-crushed using an Instron 5585H 250 kN electro-mechanical test frame (Carnarius et al., 1996; Ikejima et al., 2003; Wilkie and Bishop, 2012). Shells (n = 170 - 236 per cohort) were placed on the stage of the Instron and a hydraulic upper mount was pressed down on the shell with one newton of force to hold it in place before crushing. Bluehill Software (v.2) (Illinois Tool Works Inc., IL, USA) recorded the force (newtons) it took to create a 2.5 mm puncture hole.
Total lipids
Total lipids were extracted from whole body tissue (n = 10 per cohort). Tissue was freeze dried and ground to a fine powder using a mortar and pestle, then 15 ± 0.2 mg of tissue was weighed out for each individual using a microbalance (sensitivity 10 μg), and lipids were extracted using the Bligh Dyer method (Bligh and Dyer, 1959). Chloroform:methanol and nanopure water was added, vortexed, and sonicated to extract lipids from the cell. The sample was centrifuged, and polar and non-polar metabolites were separated into phases. The bottom most layer containing the lipids suspended in chloroform was removed using a Pasteur pipette and placed into a metal tin to dry. The Bligh Dyer extraction protocol was repeated twice for each sample to ensure full lipid extraction. Total lipids were quantified gravimetrically by weighing the lipids and subtracting from the initial tissue weight.
Isotopes
Frozen whole body shellfish tissue (n = 10 per cohort) was freeze-dried and ground in the same fashion as the lipid analysis. Dry tissue was weighed using a microbalance (sensitivity 10 μg) to 0.6 ± 0.01 mg per sample. The tissue was placed into a small tin 8 x 5 mm and the tin was closed and pressed onto itself to create a compact sample. Samples of Glutamic Acid I, II, (0.42 µg) and Bristol Bay Salmon (0.339 µg) of known isotopic values were interspersed with our samples to serve as a reference. Samples were analyzed at the University of Washington Earth and Space Sciences Department Isolab where they were first placed in a Costech Elemental Analyzer, Conflo III, MAT253 with continuous flow, and then to a Finnigan MAT253 mass spectrometer (Fry et al., 1992). Using an algorithm in Matlab, the output data were corrected to the Air-N2 scale, for δ15N, and to the VPDB scale, for δ13C. C:N ratio was calculated by dividing the mass of carbon by the mass of nitrogen in the sample.
To determine relative proportions of broad diet categories, we used isotopic signatures of diet endmembers (diet sources) from the literature specific to the Salish Sea. We clustered primary production sources based on isotopic values, and created three major categories (Kasai and Nakata, 2005); (i) marine phytoplankton and POM (Conway-Cranos et al., 2015; Eccles et al., 2018; Pelletier et al., 2018; Costalago et al., 2020), (ii) phytobenthos (marine macroalgae, eelgrass) (Liedtke et al., 2011; Mueller, 2017; Costalago et al., 2020), and (iii) terrestrial matter (C3 plant material washed in from land) (Conway-Cranos et al., 2015). Averages and standard deviations were calculated for δ13C and δ15N signatures of end members. We plotted the end member and consumer data on a biplot to make estimates of diet proportion.
Respirometry
A subset of outplanted oysters were taken to National Oceanic and Atmospheric Administration (NOAA) Mukilteo Research Station, Mukilteo, Washington (47° 56.56’ N, 122° 18.10’ W) to perform respiration measurements. Oysters were placed in holding tanks with filtered flow-through seawater. Oysters were starved 24 hours prior to respirometry trials to eliminate signals of metabolic activity due to digestion (Parker et al., 2017). The respirometry system consisted of 650 mL chambers equipped with a temperature and fiberoptic oxygen probes connected to an OXY-10 SMA G2 meter box, which was then connected to a computer with software PreSens Measurement Studio 2 (version 2.0.0.28). Prior to trials, the system was calibrated using a two-point oxygen calibration. 100% oxygen was achieved by leaving a beaker of fresh seawater overnight to equilibrate with the atmosphere. 0% oxygen was achieved by combining 1 g of sodium sulfate (Na2SO3) (Sigma-Aldrich) with 50 µl of cobalt standard for ICP (Co(NO3)2) (Sigma-Aldrich) and 100 mL of DI water. Individual oysters were placed in the water within airtight chambers, and chambers were placed in a water bath controlled by an Aqualogic heat pump (DSHP-4) (± 0.1°C). A magnetic stir bar was also placed into the chamber, and eight chambers were placed onto a custom-made magnetic submersible stir plate. Constant water movement via the stir bar allowed homogenous temperature and oxygen levels within the chamber. Trials were run for one hour with n = 8 individuals per cohort per trial. We ran blank chambers with seawater to determine a baseline oxygen consumption due to microbial and background respiration; we subtracted that value from each individual’s respiration rate. Volume displacement from oysters was measured using a graduated cylinder and subtracted from the total volume of each chamber. Respirometry trials were run at five different temperatures (3, 8.5, 14, 19.5, and 25°C), and five different pH levels (6.6, 6.9, 7.2, 7.6, and 7.8). Temperatures were achieved by adjusting the Aqualogic heat pump, and pH was achieved by bubbling CO2 controlled by a solenoid valve. The pH probe (Honeywell) was calibrated with tris buffer and verified using a spectrophotometer and m-cresol purple dye in accordance with Dickson et al. (2007). Temperature treatments were performed at pH 7.8 and pH treatments were performed at 11°C. These values reflect average conditions experienced in Puget Sound. Each individual was only used once and was allowed to acclimate to treatment water for 30 min prior to the trial. After respirometry trials were completed, individuals were dissected, and visceral mass was placed in a labeled metal tin. Oyster visceral mass was dried in a 60°C oven for 48 hours to ensure full dehydration, and individual dry weight (DW) was measured. Appropriate start and end points were chosen for each individual’s respiration curve, and oxygen consumption was converted from % oxygen saturation to mg/L of oxygen, using an equation (Benson and Krause, 1984) which takes into account temperature and salinity. Standard metabolic rate (SMR) of each individual (mg O2 g− 1 DW h− 1) was calculated as oxygen consumption in mg/L per hour and gram of dry weight.
Gonad histology
A pea-sized piece of gonad (~3 – 12 cm2) was excised from the visceral mass (n = 10 per cohort) the day of collection, fixed for 24 hours in 10% formalin and subsequently preserved in 70% ethanol. Fixed samples were sent to Histology Consultation Services (Everston, WA) for staining with hematoxylin counterstaining with eosin staining, paraffin wax embedding, slicing, and mounting onto slides (da Silva et al., 2009; Hassan et al., 2018; Spencer et al., 2020). The slides were examined using a high-powered microscope (Nikon Eclipse Ni) and photographed using the Nikon DS -Fi3 camera with the program NIS-Elements Basic Research. Sex of each individual was recorded and gonad maturation was determined using a scale of 0-5, a scale previously used on O. lurida and Ostrea edulis (da Silva et al., 2009; Oates, 2013; Hassan et al., 2018). The gonad maturation scale is as follows: (0) no gametes present, (1) some evidence of gametes, (2) moderately developed follicles, (3) ripe gametes, follicles fully expanded, (4) spawning, follicles begin to empty, (5) resorbing, follicles empty and reduced. Since O. lurida is a hermaphroditic species, sex was determined using a scale (da Silva et al., 2009; Oates, 2013; Spencer et al., 2020); Indeterminate – empty follicles, Male – only spermatogonia found, Hermaphroditic primarily male (HPM) – spermatogonia abundant, some evidence of oocytes, and Hermaphroditic primary female (HPF) – oocyte stages abundantly found, some evidence of spermatogonia, Female – only oocytes found.
Adult spawning
After the first collection period, a subset of oysters was immediately transported to the Kenneth K. Chew Center for Shellfish Research and Restoration at NOAA Manchester Research Station. Oysters were separated by cohort, placed in mesh bags, and suspended in flow-through 19 L tanks with flow rates of 4 L/min. Seawater was UV sterilized, filtered to 1 µm, and fed into a series of 189 L header tanks with submersible heaters (Teco Aquarium Chiller TK-500 and Finnex HC 810-M, ± 0.1°C). Oysters were fed a constant supply of a cultured live mixed algal diet (brown and green phytoplankton) ad libitum using an Iwaki dosing pump attached to the inflow waterline. To stimulate spawning, the water temperature was raised 1°C daily until 18°C was reached. We monitored the oysters daily for up to 45 days for sperm and/or larvae release. Outflow was emptied into a smaller 7.5 L tank with 100 µm screens to catch any veliger larvae. Larvae from each cohort were collected and placed in 18 L flow through-tanks fed by the same header tanks containing seawater that the adults received. All flow-through tanks received constant aeration using an air stone and were emptied bi-weekly for cleaning using a strong stream of fresh water and vortex.
Larvae counts growth and survival
A subset of larvae from each cohort were stocked in 1 L plastic tripour beakers (jar) with 800 mL FSW (fresh seawater) at a density of ~1 larvae mL-1. Each jar was fitted with a 100 µm screen insert made of PVC and nitex mesh, so the larvae could be easily filtered during water changes. The jar was emptied and filled daily with FSW containing a mixed culture of fresh live phytoplankton. To thermally challenge the larvae, jars were placed in water baths heated or cooled to 14 or 20°C ± 0.1. Each cohort had n = 6 replicate jars in each water bath temperature. We performed counts to assess survival and growth two to three times per week for 14 days. To obtain samples for survival and growth, larvae from each tripour were rinsed using a steady stream of seawater and filtered down to 100 mL volume. We used a “plunger” (device consisting of a circular disk with a handle) to evenly homogenize the larvae within the seawater. We used a micropipette to extract six 1 mL samples and placed each sample into a well within a 6-well plate. We used a dissecting microscope to count total larvae within each well and recorded mortalities. We used an Amscope MD35 digital microscope camera to capture photos of larvae, and ImageJ v1.51 to measure shell length (Gurr et al., 2021).
Larvae respirometry
Additional larvae collected from site specific broodstock populations were allowed to grow in the 189 L flow-through stock tanks at 18°C until they reached pediveliger stage. On April 26, 2019, pediveliger larvae ranging from 180 – 200 µm from each stock tank were sorted and placed in 19 L tanks using a series of nitex mesh filters. Subsequently, larvae were homogenized within seawater and serial dilutions were prepared at densities of 0.1, 1, 2, 3, and 4 mL from the stock tanks. Dilutions of larvae from each cohort were placed in 4 mL glass vials containing a Planar Trace Oxygen Sensor Spot SP-PST6, topped off with filtered seawater, and sealed with a cap. Vials were placed in a 24-well plate and placed on a PreSens Sensor Dish Reader (SDR) to measure oxygen consumption rate (Gurr et al., 2021; Maboloc and Chan, 2021). The sensor was calibrated using the corresponding PreSens SDR software in a similar fashion to the fiberoptic Presens sensors used for the adult oysters. The sensor spot fixed to the bottom of the vial contains a luminescent dye and when the dye is excited by the lasers below, a luminescence signal based on oxygen partial pressure is emitted back to the sensor to be interpreted by the software. The PreSens SDR plate containing serial larval dilutions from each cohort along with blanks of 0 and 100% saturated seawater were placed in a dark incubator and oxygen consumption was measured overnight at five temperatures (5, 10, 15, 20, 25°C) to create thermal performance curves for each larval population. Following the respirometry trials, larvae from each vial were preserved in 70% ethanol and counted using a Leica M60 dissecting microscope. Respiration rate was calculated in a similar fashion to the adult oysters, but oxygen consumption was normalized by number of larvae in each vial instead of dry weight.
Data analysis
All analyses were performed in R version 1.3.959 (R Core Team, 2020) with a significance threshold of α < 0.05. A Shapiro-Wilk Test was performed to assess normality and if needed, values were log, arcsine, or square root transformed to meet normality assumptions before a model was run. ANOVAs and post-hoc Tukey-HSD tests were performed for multiple comparisons for growth, shell strength, lipids, stable isotopes, and respiration rates. To find if effects of collection time and site were mediated by growth, growth was added as a cofactor to the statistical model. A Pearson’s Chi-square test based on 10,000 replicates with a Bonferroni correction for multiple comparisons was performed to evaluate sex ratio and gonad maturation (da Silva et al., 2009; Spencer et al., 2021). A correlation plot was created using oceanographic data and larval survival hazard ratio with R package corrplot version 0.87 (Taiyun, 2014) and a Pearson’s correlation coefficient was calculated. R2 and p-values correlating shell strength and growth were calculated. When trials used multiple replicates from a single population, we ran a linear mixed-effects model, using R package lme4 version 1.1-28 (Bates et al., 2015), where each response variable is a fixed effect, and treatment replicate is a random effect.
To evaluate the effect of temperature on survival of the four larval populations across time, we used the survival version 3.3-0 (Therneau, 2020) and survminer version 0.4.8 (Kosinski et al., 2020) packages in R (R Core Team, 2022.02.2). The functions Surv and survfit were used to format data for the models. A non-parametric Kaplin-Meier survival analysis with right censoring (Pernet et al., 2015; Maboloc and Chan, 2021) determined overall significance between treatments. Our target stock density was calculated to 800 larvae per jar, but to account for uncertainty and noise of larval subsampling and equal stock density, we evaluated the chances of sampling a larva in a binomial process. We used Bayes Theorem assuming uniform prior (Rish, 2001) to predict the number of larvae in a jar given actual count input. We simulated time series data for each of our 48 jars, selecting only for monotonically decreasing iterations until we had 500 replicates per jar. With high simulated replication, we can approach uniform assumption, and reduce uncertainty around sampling probability. Larval mortalities were assigned a binary status of 1 on the day of death and larvae who remained alive by the end of the 14 days were considered right censored and assigned a binary status of 0. To further explore differences between larval cohorts, we ran a multivariate Cox proportional hazards regression model (Cox, 1972; Maboloc and Chan, 2021) with the coxph function using temperature and parental acclimatization location as covariates in the model. We looped all 500 x 48 replicate jars into the model and extracted the log hazard ratios (lnHR, mean of coefficients) and 5% confidence intervals (two tailed, 2.5, 97.5% quantiles) from the model output to evaluate 27 significance tests for each possible temperature/parental site interaction. We performed an exponential transformation on the lnHR and confidence intervals (95%) before plotting their interactions in a forest plot and heatmap using ggplot2 version 3.3.6. Data and R codes used for the analysis are publicly available in a supplemental GitHub repository (Alma et al., 2022).
Results
Environmental variability
There were clear differences in oceanographic conditions between study sites and between study periods (Supplementary Table A1, Figures 2, 3). At all sites, temperature was on average higher in July 2018-January 2019 (T1) when compared to January-July 2019 (T2). DB had the highest variation in temperature at both time periods while CI20 had the lowest. The maximum temperature of 18.1°C was reached at DB on June 14th, 2019, and the lowest temperature of 6.9°C was also seen at DB on February 14th, 2019. At all sites, T1 had higher average salinities than T2 (Supplementary Table A1, Figures 2, 3). DB has the lowest salinity at both time periods, with a salinity reaching a recorded as low of 20.7 PSU on January 18, 2019, and CI20 registered the highest salinity at 31.0 PSU on December 17, 2018. CI20 had a higher salinity than CI5 at both time periods. Average chlorophyll-a (chl-a) was highest at CI5 for both time periods. On average, there was higher chl-a in T2 than there was in T1. The highest variation of chl-a occurred at DB in the T2 time period (0.64 - 37.8 mg m-3). On average, dissolved oxygen (DO) was higher at all sites in T2 compared to T1. CI5 had the highest average DO levels during T1, and DB had the highest in T2 (8.32 mg/L and 10.48 mg/L, respectively). At both time periods, CI20 had the lowest average DO levels (6.18mg/L for T1 and 8.28 mg/L for T2). Average pH was higher at all sites during T2 compared to T1 (Supplementary Table A1, Figures 2, 3). pH had the highest variation at both time periods at DB, and the lowest variation at CI20. Aragonite saturation state was higher in T2 than T1. In both time periods DB had the highest variation of Ωara and CI20 the lowest. The lowest Ωara and pH recorded during this experiment was 0.62 and 7.51, respectively at DB. pCO2 was, on average, higher in T1 than T2. DB had the highest variation of pCO2 in both time periods, and CI20 had the lowest variation.
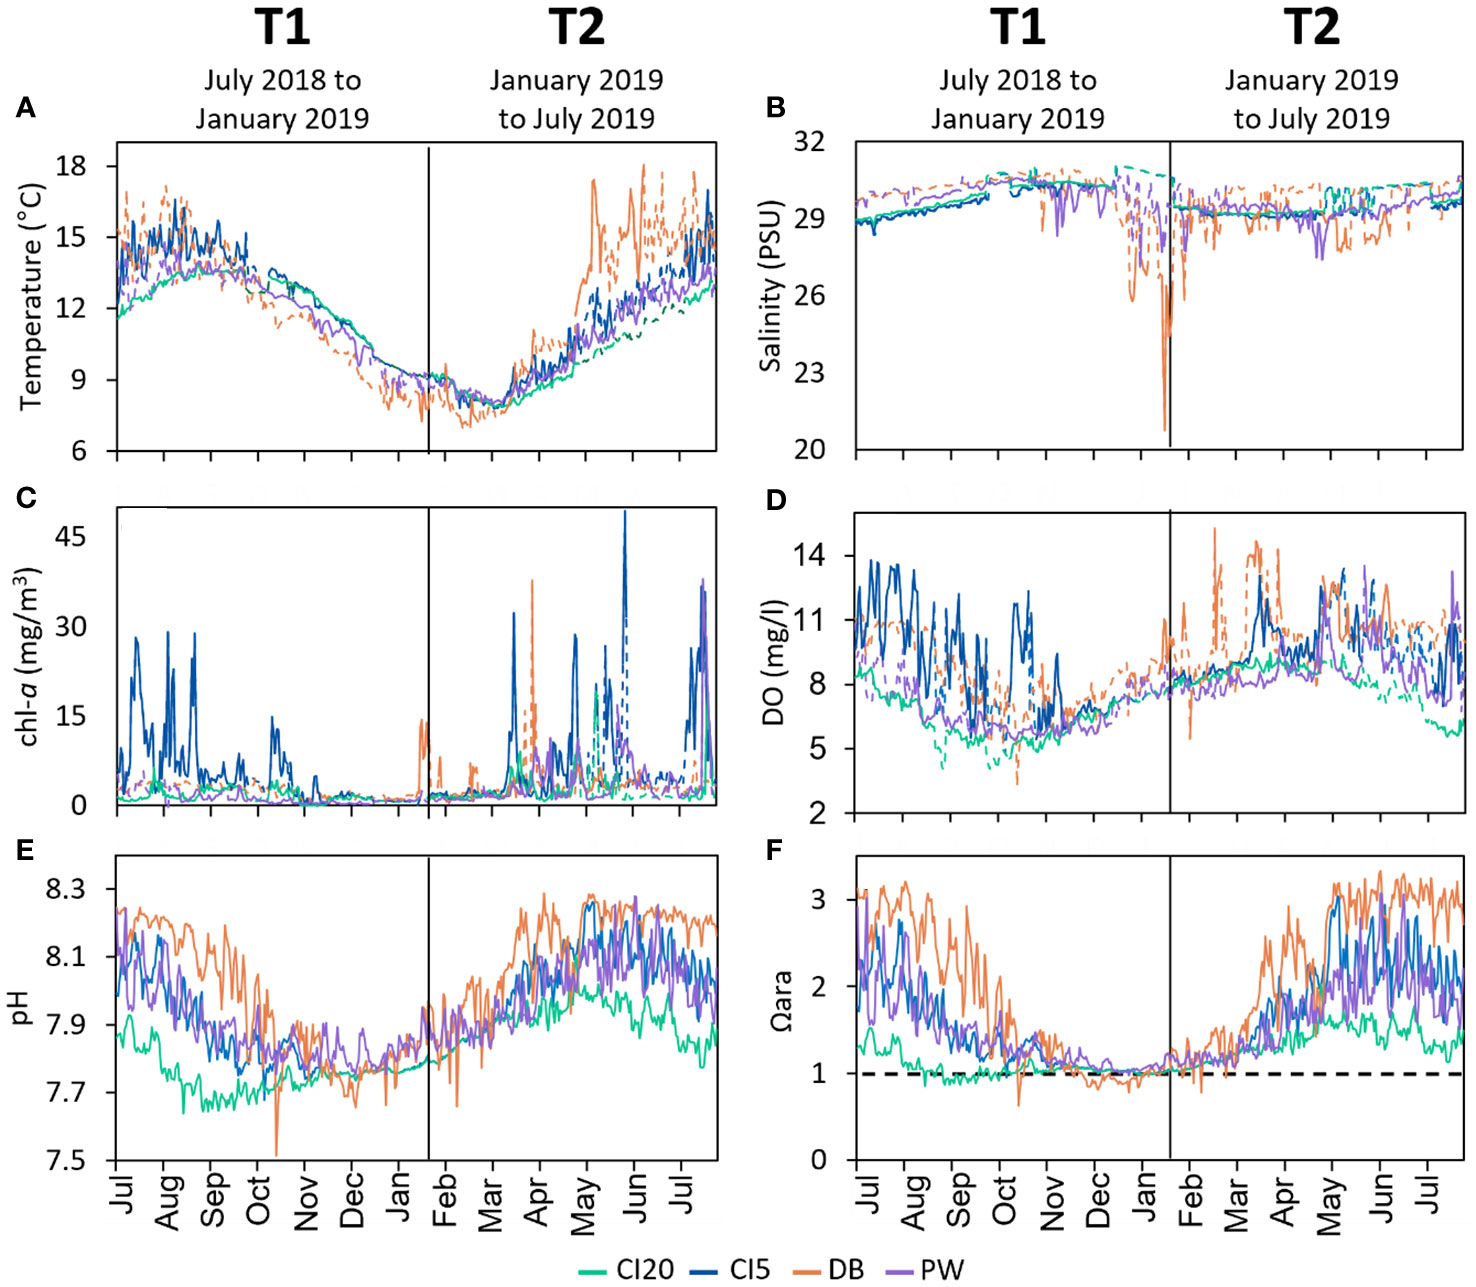
Figure 2 Timeseries of oceanographic conditions at four study sites in Puget Sound, Washington, USA. CI20 represents Carr Inlet at 20 m, and CI5 at 5 m. DB is Dabob bay at 5 m, and PW is Point Wells at 5 m. (A) temperature, (B) salinity, (C) chlorophyll-a, (D) dissolved oxygen, (E) pH, and (F) aragonite saturation state (horizontal dotted line represents aragonite saturation horizon). Colors correspond to the different sites. Data from ORCA buoys and the LiveOcean Model were combined and one reading per day at 12:00 PM was plotted. In panels A-D, solid lines indicate that the data was collected in situ from the ORCA buoy locations. Dotted lines represent data from the LiveOcean Model which were added to the graphs during times when the buoys were malfunctioning. Carbonate chemistry (E, F) are comprised entirely of LiveOcean data. On each panel, the vertical line down the middle represents the midpoint collection (January 2019) that separates the first (T1) and second half (T2) of the one-year outplant.
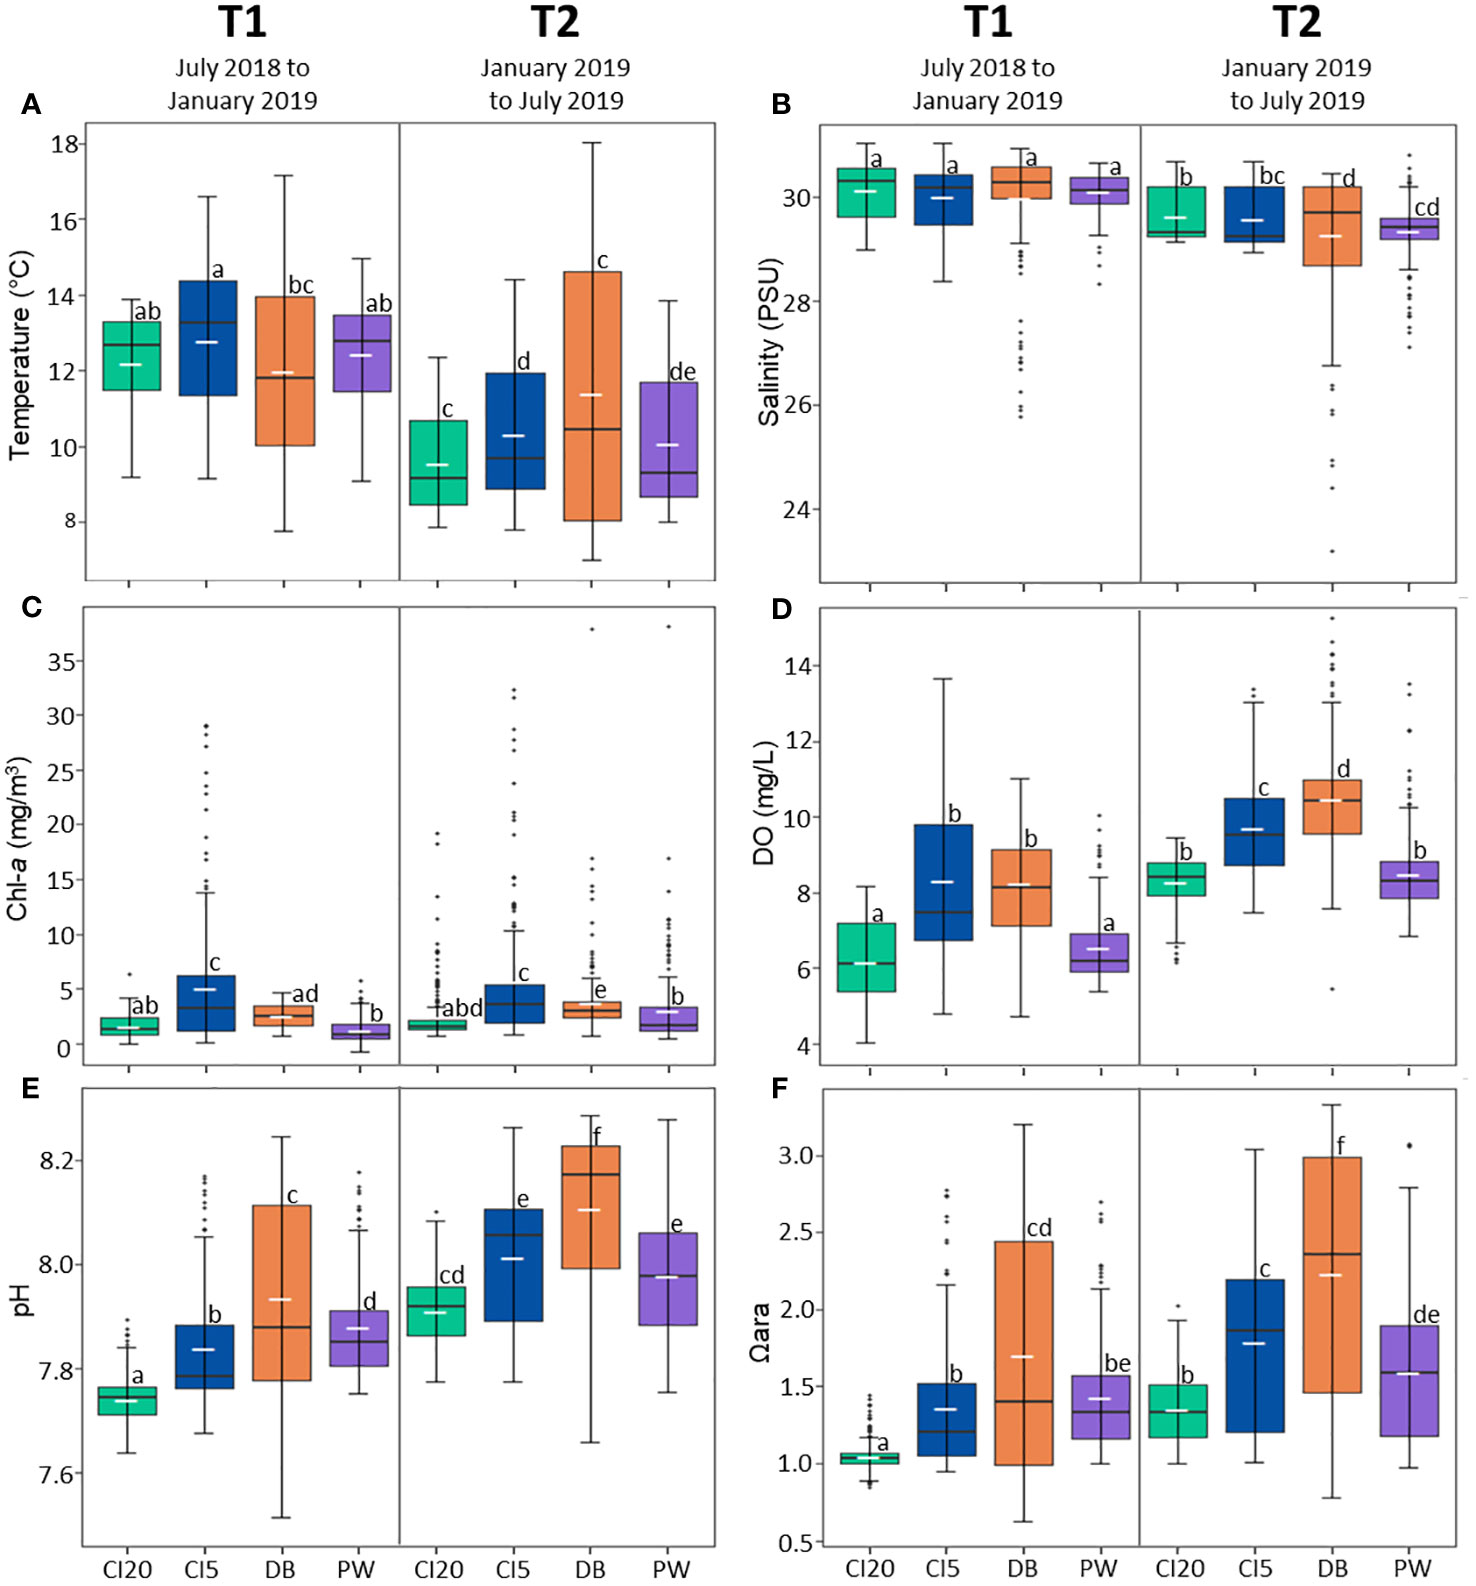
Figure 3 Boxplots that summarize oceanographic data at each site (CI20: Carr Inlet at 20 m, CI5: Carr Inlet at 5 m. DB: Dabob Bay at 5 m, PW: Point Wells at 5 m) during the study period. Parameters represented in each panel are as follows: (A) temperature, (B) salinity, (C) chlorophyll-a, (D) dissolved oxygen (E) pH, (F) aragonite saturation state. Each panel is separated by collection time, left size shows data from July 2018 to January 2019 (T1) and right-side shows data from January 2019 to July 2019 (T2). The median is represented by a crossbar within each box and mean is plotted on the box using a small white dash. Upper and lower parts of the box represent third (75th percentile, Q3) and first quartile (25th percentile, Q1). The upper limit for outliers (top and bottom of the whiskers) are calculated by multiplying the interquartile range (IRQ) by Q1-1.5 or Q3 + 1.5, respectively. Outliers are depicted by dots beyond the bounds of the whiskers. The wider the data spreads, the more variation there is at that location.
Correlations comparing the oceanographic parameters at each site were performed (Supplementary Figure A1). At all sites mean chl-a was positively correlated with DO, pH, and Ωara and negatively correlated with mean salinity and pCO2. DO was positively correlated with Ωara and pH, and negatively correlated with salinity and pCO2 at all sites. Ωara was highly correlated with pCO2 and pH. Ωara was highly correlated with temperature at DB, but negatively correlated at CI20. pCO2 was highly correlated with pH and correlated with salinity at all sites except DB. pCO2 also had a negative correlation to temperature at DB, PW, and CI5, but a strong positive correlation at CI20. pH was negatively correlated with salinity at all locations except DB. pH was positively correlated with temperature at all locations except CI20, where it is negatively correlated. Finally, salinity had a weak positive correlation with temperature at all locations except CI5.
Shell growth and strength
Our results show that the relationship between oyster growth rates and location depends on the time period (p < 0.001, Figures 4A, B, Table 1). In T1, CI20 oysters grew slower than all other cohorts, and oysters at CI5 and DB had faster growth rates compared to the other sites. In T2, CI20 and PW cohorts grew slower, and oysters at CI5 grew faster than the other cohorts. Overall, oysters grew 61.6% faster in the T1 time period compared to the T2 time period. Shell length (anterior to posterior) growth rates also differed by site and time of collection (p < 0.001, Figures 4C, D, Table 1). Slower lengthwise growth rates were observed in oysters at CI20 and PW in T1 and higher growth rates were observed in oysters from CI5 and DB. In T2 oysters from CI20 grew less lengthwise than oysters at CI5, but the oysters from other sites did not differ from each other. Oyster lengthwise growth was 59.7% faster in T1 compared to T2.
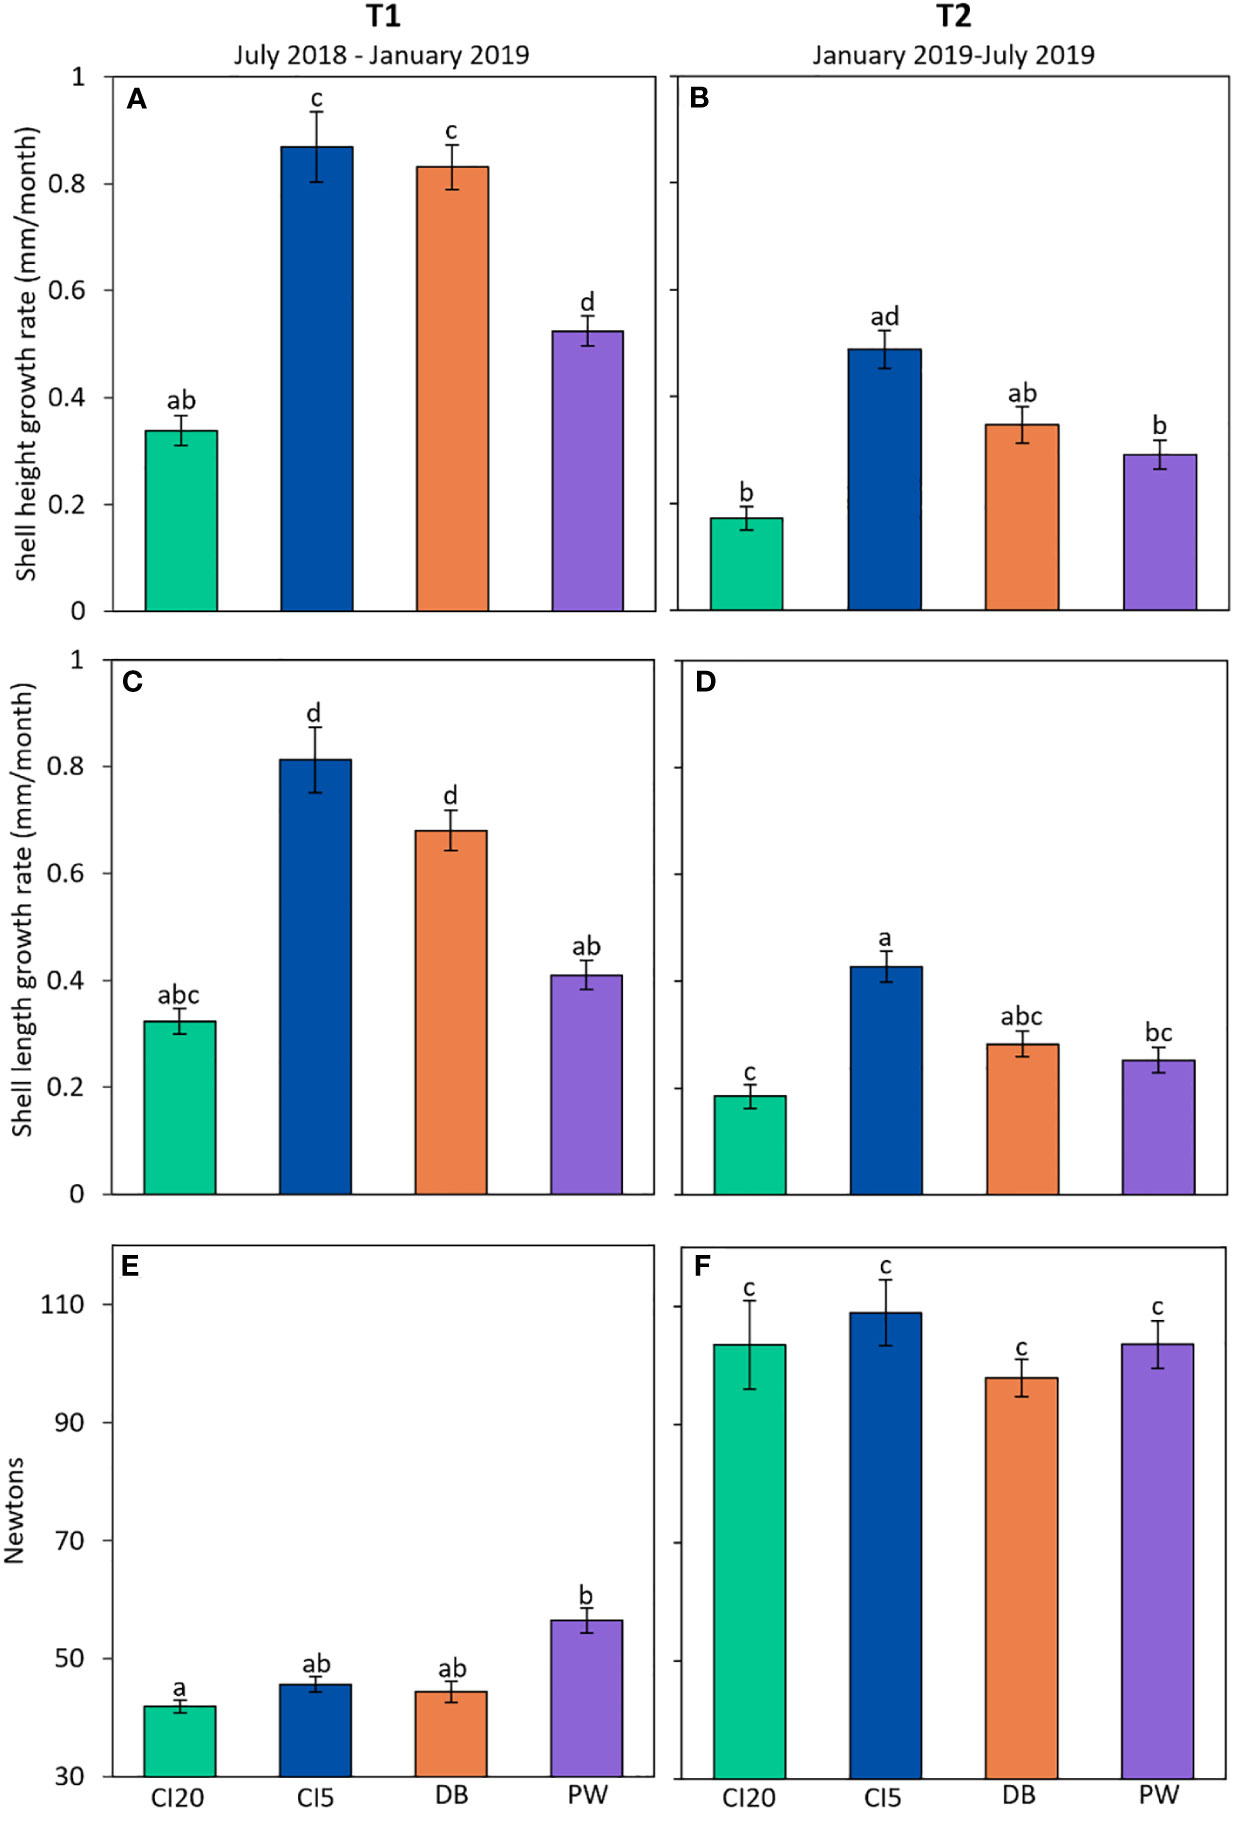
Figure 4 Adult Olympia oyster growth (n = 70 - 108) and shell strength (n = 170 - 236) in Puget Sound. CI20 represents Carr Inlet at 20 m, and CI5 at 5 m. DB is Dabob Bay at 5 m, and PW is Point Wells at 5 m. Panels on the left (A, C, E) show results of oysters acclimatized for six months (July 2018 to January 2019), while panels on the right (B, D, F) represent oysters which were allowed to acclimatize for an additional six months (January 2019 to July 2019). (A, B) show growth rate using shell height, and (C, D) depict lengthwise growth rate. (E, F) show shell strength. Error bars represent standard error. Post-hoc statistics were run on both collection periods together and are represented with letters. Bars with no common letters indicate significant differences (p < 0.05).

Table 1 Summary of ANOVA statistics used in this study.
Shell strength differed between time periods (p < 0.001, Figures 4E, F, Table 1). In T1, shell strength in oysters from CI20 was significantly lower than oysters from PW, but not DB and CI5. In T2 there was no difference in shell strength among cohorts. Shells from oysters collected at the end of T2 were on average 74% stronger than shells collected after T1, presumably because these oysters are older and grew thicker. Shell strength was not mediated by growth (Supplementary Figure A2, p = 0.35).
Lipid and isotopic composition
Lipid content did not differ among sites (p = 0.08) or collection period (p = 0.41, Supplementary Figure A3; Table 1). Lipids were not correlated or mediated by growth (p = 0.46). The only relationship found was a negative correlation between lipids and shell strength for oysters at DB in the end of T1 (R2 = 0.48, p = 0.025).
There was a difference in δ13C signatures between sites in the different collection times (p = 0.006, Figure 5; Supplementary Figure A4, Table 1). Oysters at CI (both depths) had higher δ13C signatures compared to the other sites, whereas the DB cohorts had the lowest values in both collection times. Between collection periods, CI5 and CI20 signatures did not differ. Carbon isotope was not mediated by growth (p = 0.50). There was a difference in δ15N signatures between sites in the different collection times (p = 0.004, Figure 5; Supplementary Figure A4, Table 1). In T1, δ15N signatures at DB were the lowest, and the highest at CI20. In contrast, there were no site differences of δ15N levels in T2 oysters. CI20 δ15N signatures were higher in T1 than T2. There is both a treatment and growth effect on nitrogen isotopes in oyster tissue (p = 0.02). C:N differed between sites in the different collection periods (p < 0.001, Table 1; Supplementary Figure A4). Oysters in CI5 had the highest C:N ratios during both collection times. Oysters from DB experienced temporal differences in C:N. Oysters collected in T1 had higher C:N ratios than in T2. In T1, C:N ratios at CI20 and PW were significantly lower than CI5. In T2, C:N ratios at DB were significantly lower than all other cohorts.
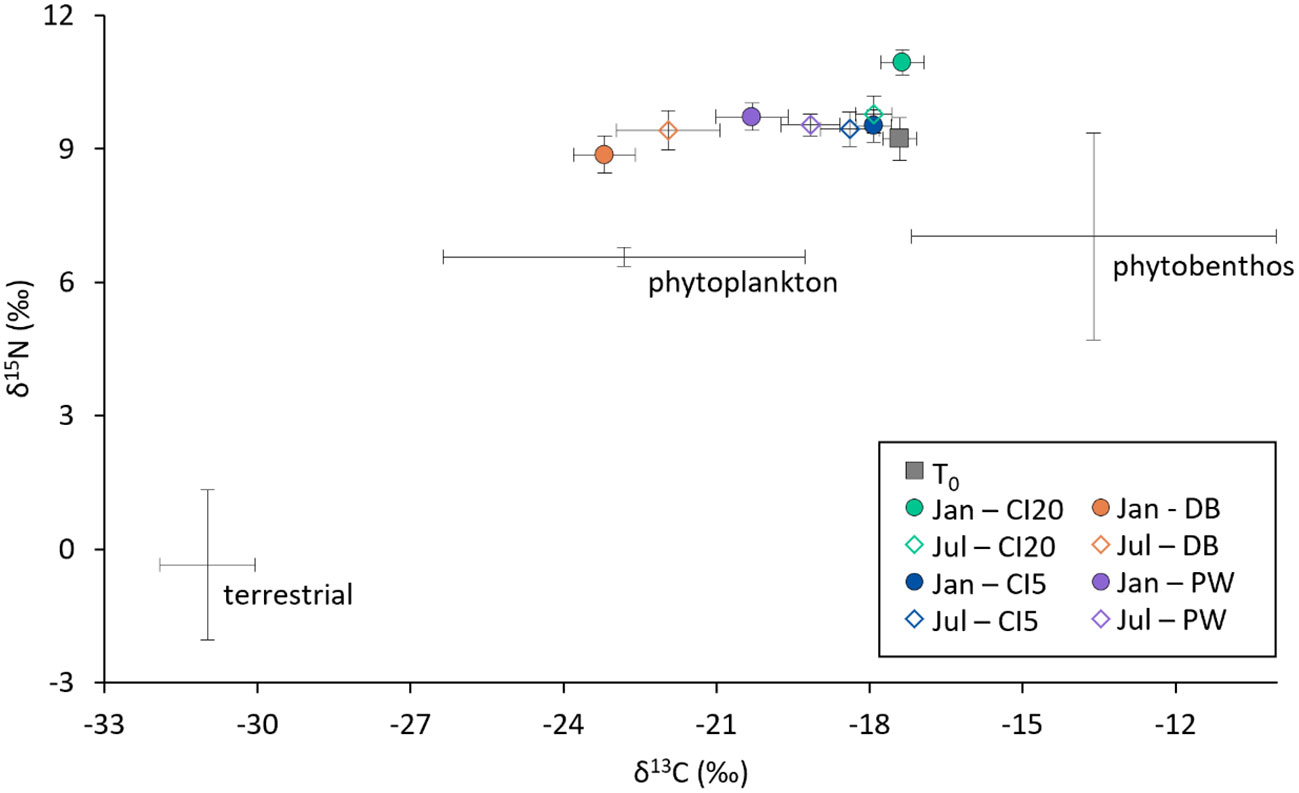
Figure 5 Isospace plot showing δ15N and δ13C stable isotopic signatures of consumer cohorts (O. lurida from different sites and collection times, colored dots, n = 10) and end members (diet sources: phytoplankton, phytobenthos, terrestrial). Consumer signatures were not adjusted for trophic enrichment factor (ΔTEF) in this plot.
Effects of temperature and pH on adult oyster metabolism
Oysters collected in T1 had a higher respiration rate than those from T2 (Figure 6, Table 1) when challenged with temperature stress. Rates increased with temperature at all sites during both time periods. The only exception occurred in oysters collected in T2 from DB, which had lower respiration rates at temperatures above 14°C. CI20, CI5 and DB cohorts had higher respiration rates in T1 compared to T2 (Figure 6). PW cohort showed similar respiration rates both time periods (p = 0.31, Figure 6). Respiration rates were lower in T1 than T2 under different pH levels (Figure 7, Table 1). Oysters from CI (5 and 20m) did not change respiration rates under different pH levels. Oysters at DB and PW significantly increased respiration rates at the lowest pH level (pH = 6.6). Notably, respiration rates of oysters under different pH levels never exceeded 10 mg/l g DW-1 h-1.
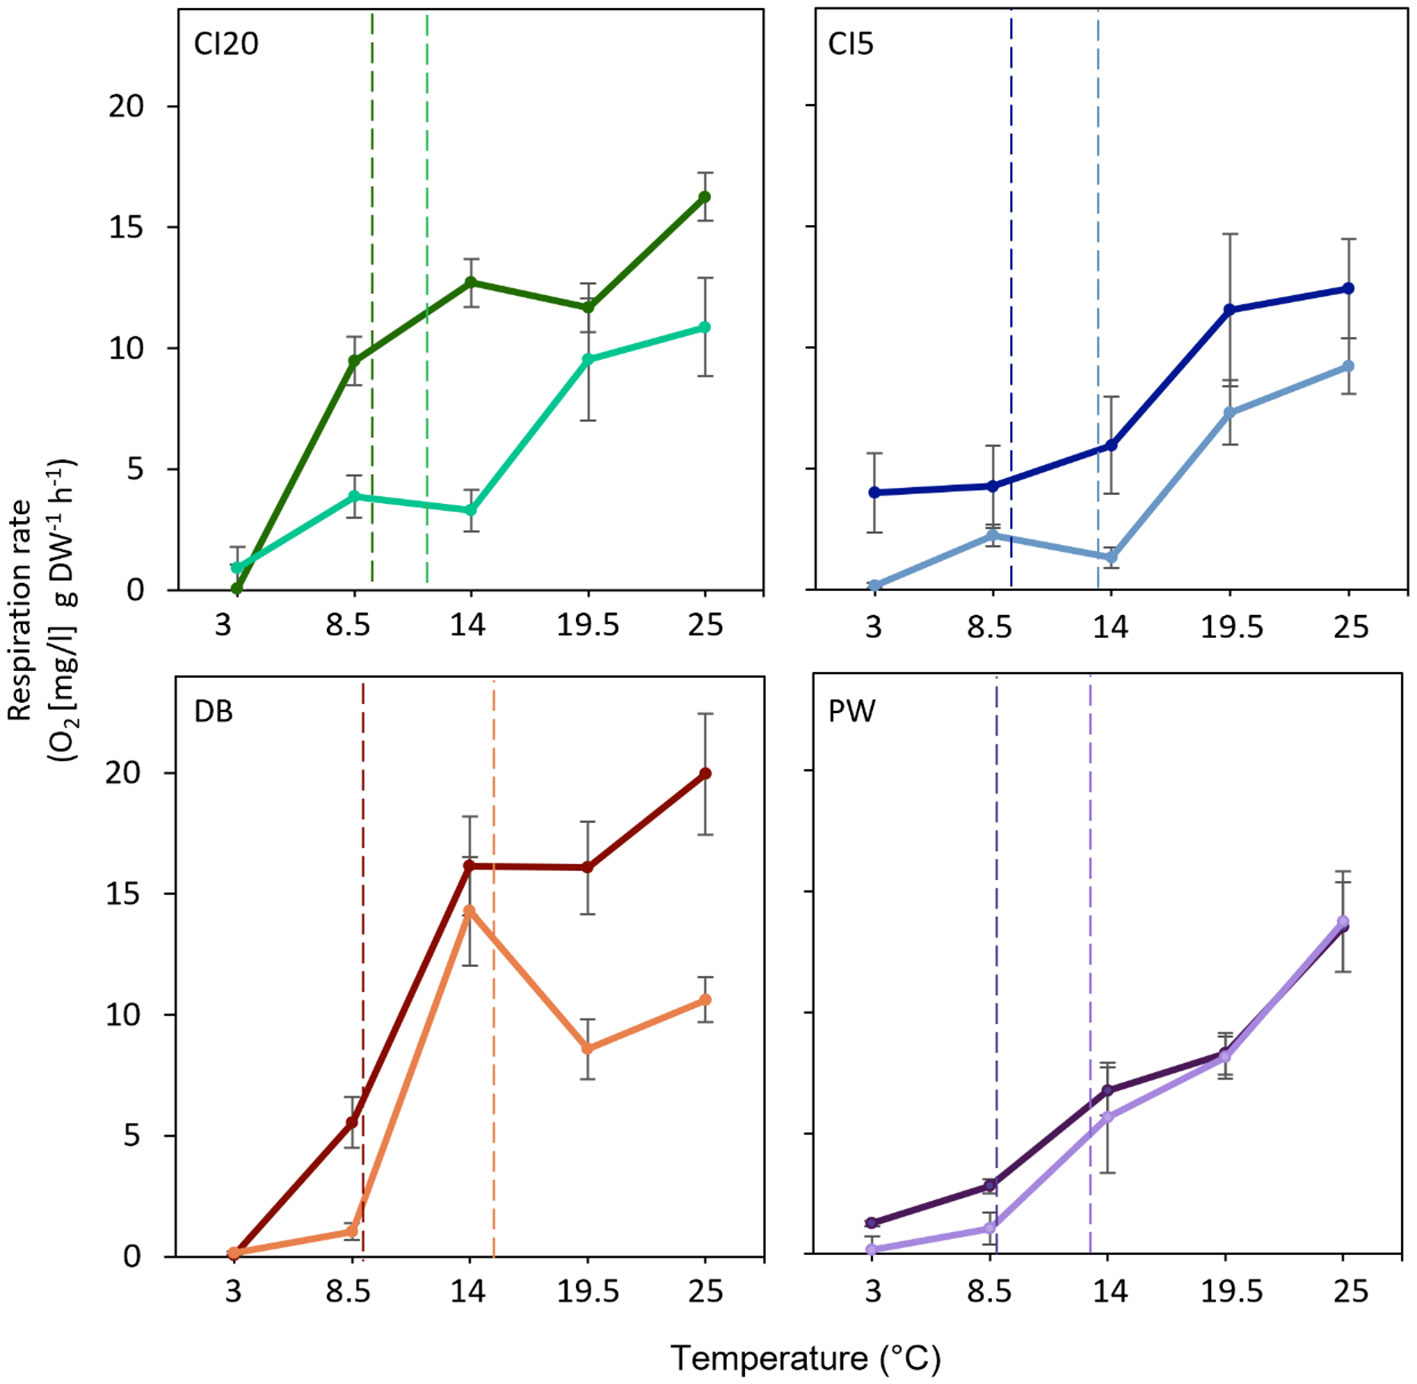
Figure 6 Short-term metabolic response of O. lurida (n = 8) to temperature at each collection period (T1 = January 2019 [darker colors], T2 = July 2019 [lighter colors]) and study site (CI20 = Carr Inlet at 20 m [green], CI5 = Carr Inlet at 5 m [blue], DB = Dabob Bay at 5 m [orange], and PW= Point Wells at 5 m [purple]). Vertical dotted lines represent temperatures at the collection sites one week prior to collecting the oysters (in January CI20 = 7.8°C, CI5 = 8.1°C, DB = 8.2°C, and PW = 8.0°C; in July CI20 = 11.9°C, CI5 = 13.4°C, DB = 15.2°C, and PW = 13.2°C). Temperature trials were run at pH 7.8.
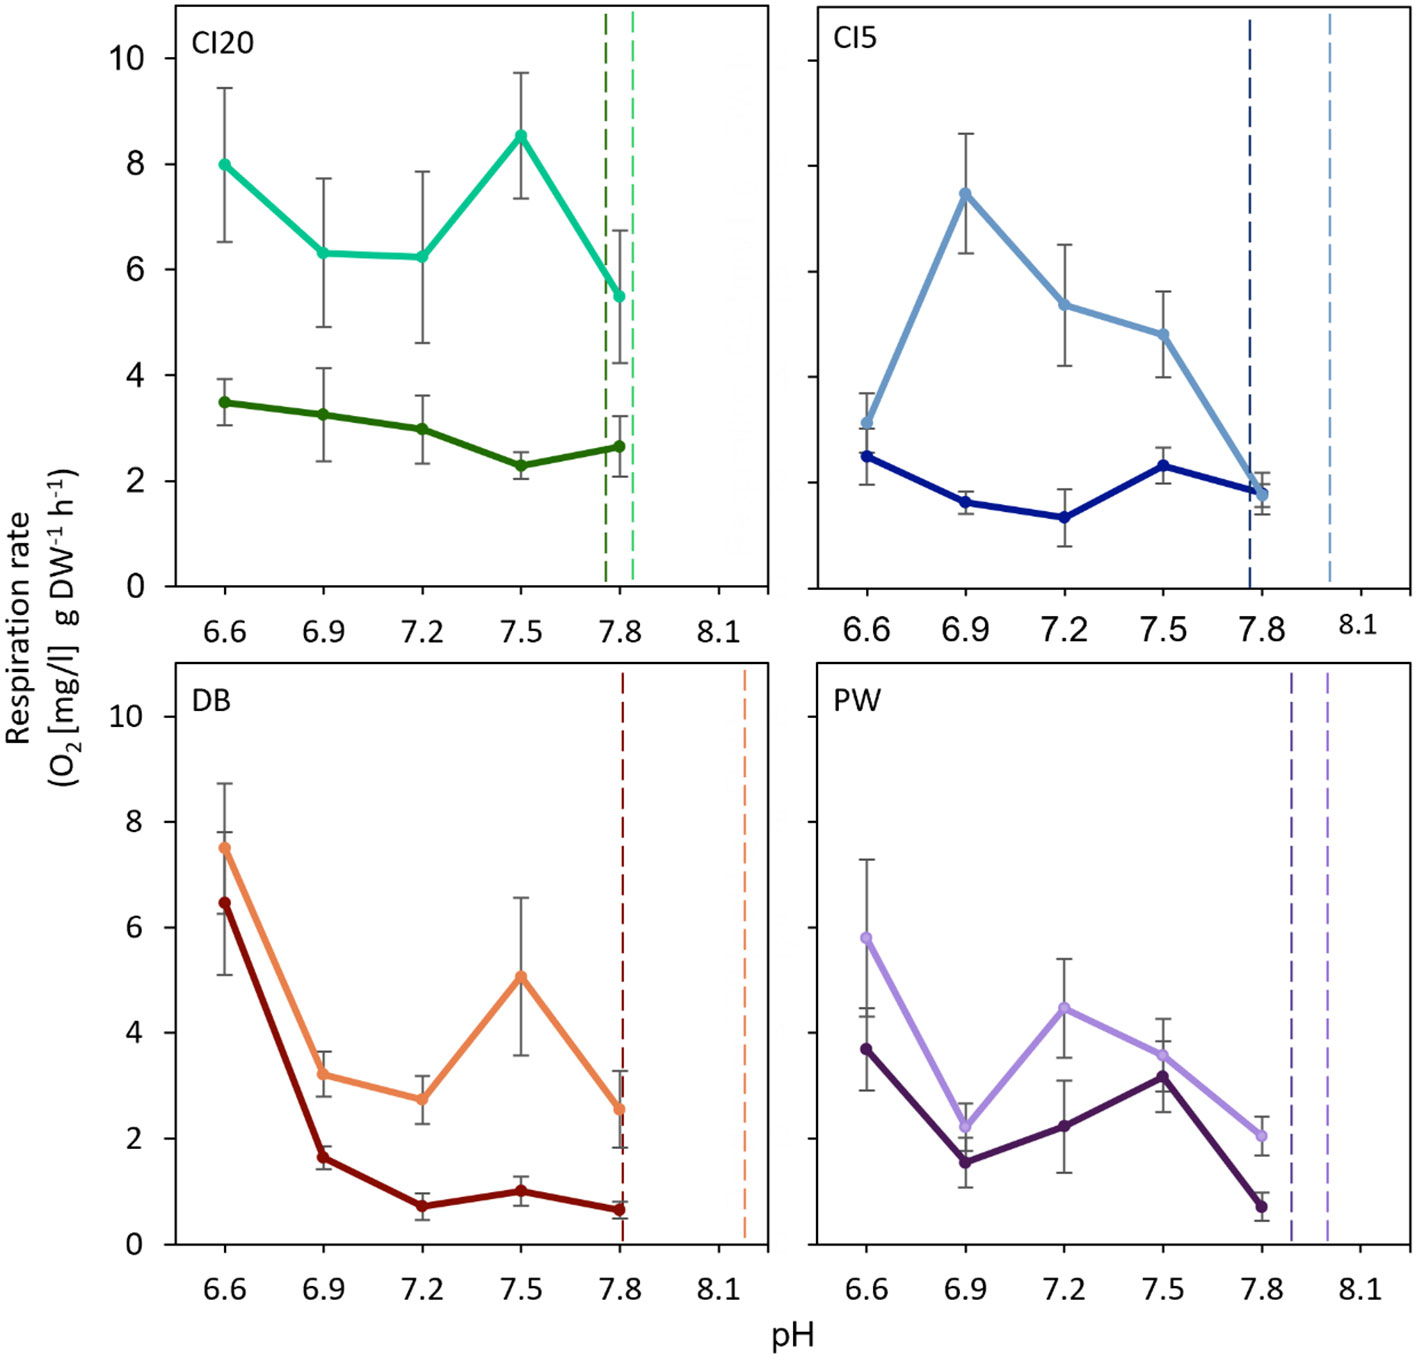
Figure 7 Short-term metabolic response of O. lurida (n = 8) to pH challenge at each collection period. T1 = January 2019 [darker colors], T2 = July 2019 [lighter colors]) and study site (CI20 = Carr Inlet at 20 m [green], CI5 = Carr Inlet at 5 m [blue], DB = Dabob Bay at 5 m [orange], and PW= Point Wells at 5 m [purple]). Vertical dotted lines represent pH levels at the collection sites one week prior to collecting the oysters (in January, CI20 and CI5 = 7.76, DB = 7.84, and PW = 7.89; in July CI20 = 7.83, CI5 = 8.07, DB = 8.19, PW = 7.98). pH trials were run at 11°C.
Reproductive characteristics: gamete development and sex ratio
Gonad maturation stage differed for the different sites (p = 0.003) and collection times (p = 0.048, Figure 8A). Before the start of the experiment (T0) 30% were at advanced reproduction, 50% were mature, and 20% were resorbing. In T1, 80% of oysters at CI20 had spawned (either spawned or resorbing states), while only 20% of oysters had spawned at CI5, 50% at DB, and 70% at PW. In T2, 40% of CI20 oysters had spawned, 20% at CI5, 100% at DB, and 10% at PW. When considering oysters at advanced and mature stages (i.e., developed gametes), we found different seasonal patterns. In T1, oysters from CI20 had 20% developed gametes, CI5 had 70%, DB had 50%, and PW had 30%. In T2, oysters from CI20 had 50% developed gametes, CI5 had 80%, DB had 0%, and PW had 90%. Oysters from CI20 appeared to have spawned sometime between July 2018 and January 2019, and they began to develop gametes again between January 2019 and July 2019. Oysters from CI5 appeared not to have spawned between July 2018 – January 2019 because their maturation patterns in T1 were similar to T0, However, it is also possible that this population spawned earlier and developed their next set of gametes faster than the other populations. CI5 oysters likely went through another full cycle and spawned soon after our T2 collection as well, as 80% of oysters had advanced/mature gametes. Most oysters collected in T1 from DB were still developing gametes; however, in T2 none of the oysters at this site were developing gametes, suggesting recent spawning. Finally, at PW, 60% of the oysters had spawned by T1, and oysters appear to be redeveloping gametes in T2. When maturation stages were binned into “pre-spawn” and “post-spawn” (Supplementary Figure A5), there were several differences between collection times, but interestingly, there was a difference between DB in T2 and all the other T2 cohorts in that all oysters analyzed were in post-spawn stages (p = 0.04, 0.002, and < 0.001 at CI20, CI5 and PW, respectively).
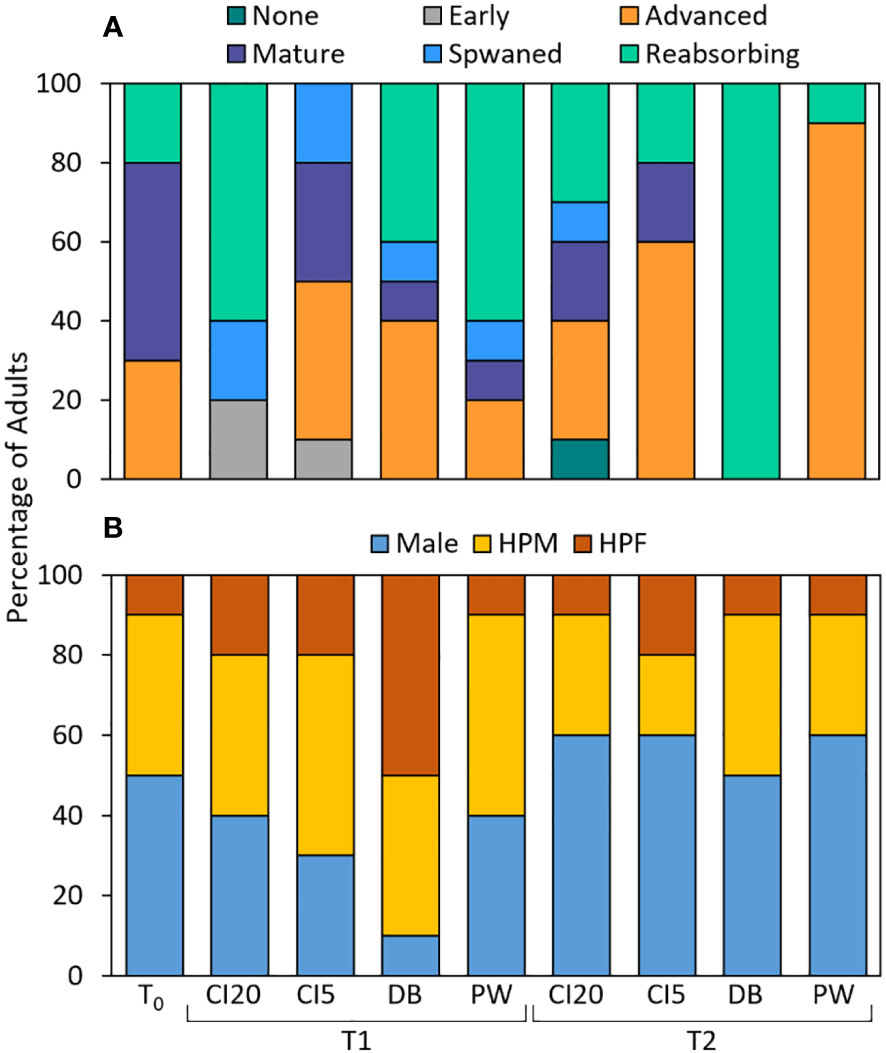
Figure 8 Stacked bar plot showing histological data from Olympia oyster (Ostrea lurida, n=10) gonads. (A) Percentage of adult at each gametogenesis maturation stage, and (B) sex ratio. T0 indicates oysters from before the start of the experiment (July 2018). Oysters were outplanted to four sites (CI20: Carr Inlet at 20 m, CI5: Carr Inlet at 5 m, DB: Dabob Bay at 5 m, PW: Point Wells at 5 m) for either 6 months (Jan = January 2019, T1) or 1 year (Jul = July 2019, T2). HPM = hermaphrodite primary male and HPF = hermaphrodite primary female.
There were no differences in sex ratios between site or collection times (p = 0.84, 0.14, respectively, Figure 8B). Overall, 44.4% of the oysters were classified as fully male, 37.7% hermaphroditic primarily male (HPM), and 17.8% hermaphroditic primarily female (HPF). We did not observe any oysters that were exclusively female. When comparing differences in hermaphrodism patterns, there were no significant differences across sites (p = 0.69) but there were differences between collection period (p = 0.042). Before the experiment 50% were male and 50% hermaphrodites. In T1, 60% were hermaphrodites at CI20 and PW, CI5 had 70%, and DB had 90%. In T2, there were fewer hermaphrodites and more males, with CI20, CI5 and PW displaying 40%, and DB had 50% hermaphrodites. The oysters collected in T1 from the DB population had the highest amount of HPF individuals. If sexes are grouped by the dominant sex, the sex ratio is highly skewed toward male/HPM at 82%, and HPF at 18%. The ratios are equal (50%) when grouped by hermaphrodites and full males.
Larval growth
After running a liner mixed-effects model, we found no significant “tank” effect among replicates from the same cohort. There was a significant effect of parental origin (p < 0.001) and temperature (p < 0.001) on larval growth (Figure 9, Table 1). Larvae grew ~138% faster at 20°C than those challenged to 14°C. At 20°C larvae whose parents were from CI5, and DB grew significantly larger than those whose parents were from CI20 and PW. At 14°C, larval growth at PW was lower than at CI5.
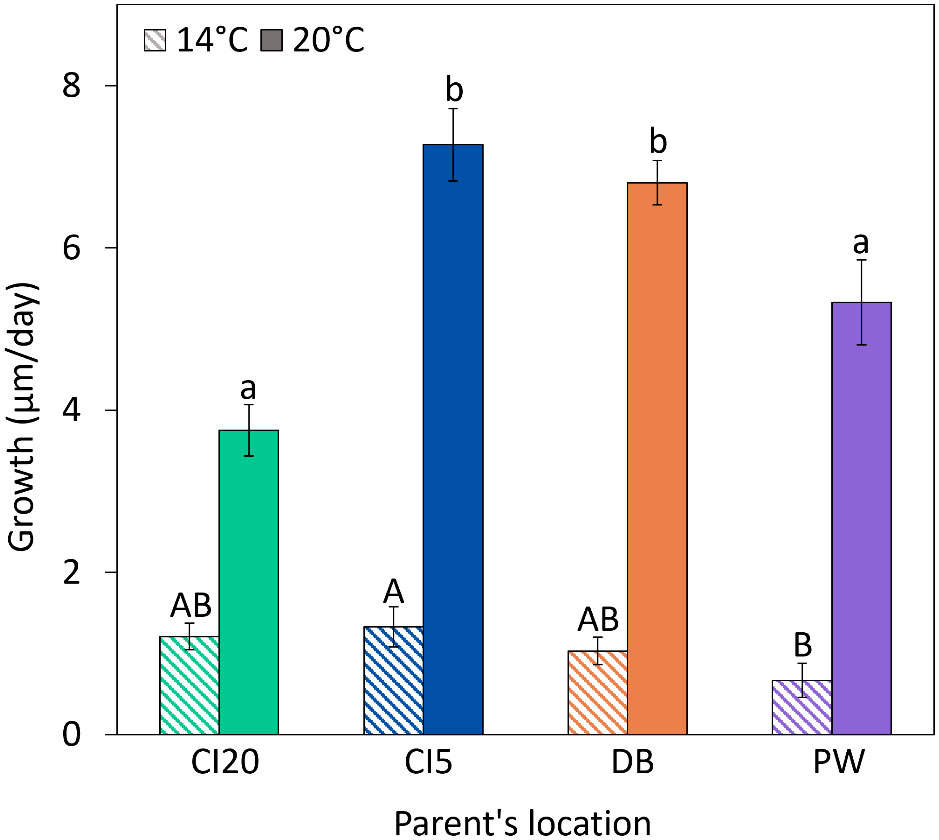
Figure 9 Growth rate of Olympia oyster (Ostrea lurida n = 10) larvae from parents outplanted to four locations (CI20: Carr Inlet at 20 m, CI5: Carr Inlet at 5 m. DB: Dabob Bay at 5 m, PW: Point Wells at 5 m). Oyster larvae from all locations were exposed to 14°C or 20°C for two weeks. Post-hoc statistics were performed on both thermal challenge levels separately, with capital letters representing differences at 14°C and lowercase letters for 20°C. Bars with no common letter/capitalization indicate significant differences (p < 0.05).
Larval survival
Larval cohorts had a higher survival at 20°C than 14°C. CI5 larvae had a lower chance of survival than larvae from DB and PW (HR (hazard ratio), 0.63; CI (confidence interval), 0.50, 0.82, and HR, 0.60; CI 0.48, 0.76, respectively, Figures 10, 11). At 14°C, larvae from CI5 had a lower chance of survival than larvae from DB and PW (HR, 0.55; CI, 0.44, 0.68, and HR, 0.66; CI 0.54, 0.80, respectively). At 14°C, CI20 larvae also had a reduced probability of survival than DB and PW (HR, 0.58; CI, 0.46, 0.71, and HR, 0.70; CI 0.50, 0.84, respectively). Larvae from CI20, CI5, and PW had higher survival at 20°C vs 14°C (HR, 0.54; CI, 0.43, 0.67, HR, 0.71; CI 0.58, 0.89, and HR, 0.62; CI 0.50, 0.77, respectively). At 20°C, CI20 had a higher chance of survival than CI5 at 14 and 20°C, and PW at 14°C (HR, 1.97; CI, 1.58, 2.47, HR, 1.64; CI 1.35, 2.05, and HR, 1.29; CI 1.04, 1.64, respectively). At 14°C, CI20 had higher survival than DB at 20°C (HR, 1.54; CI 1.14, 2.06).
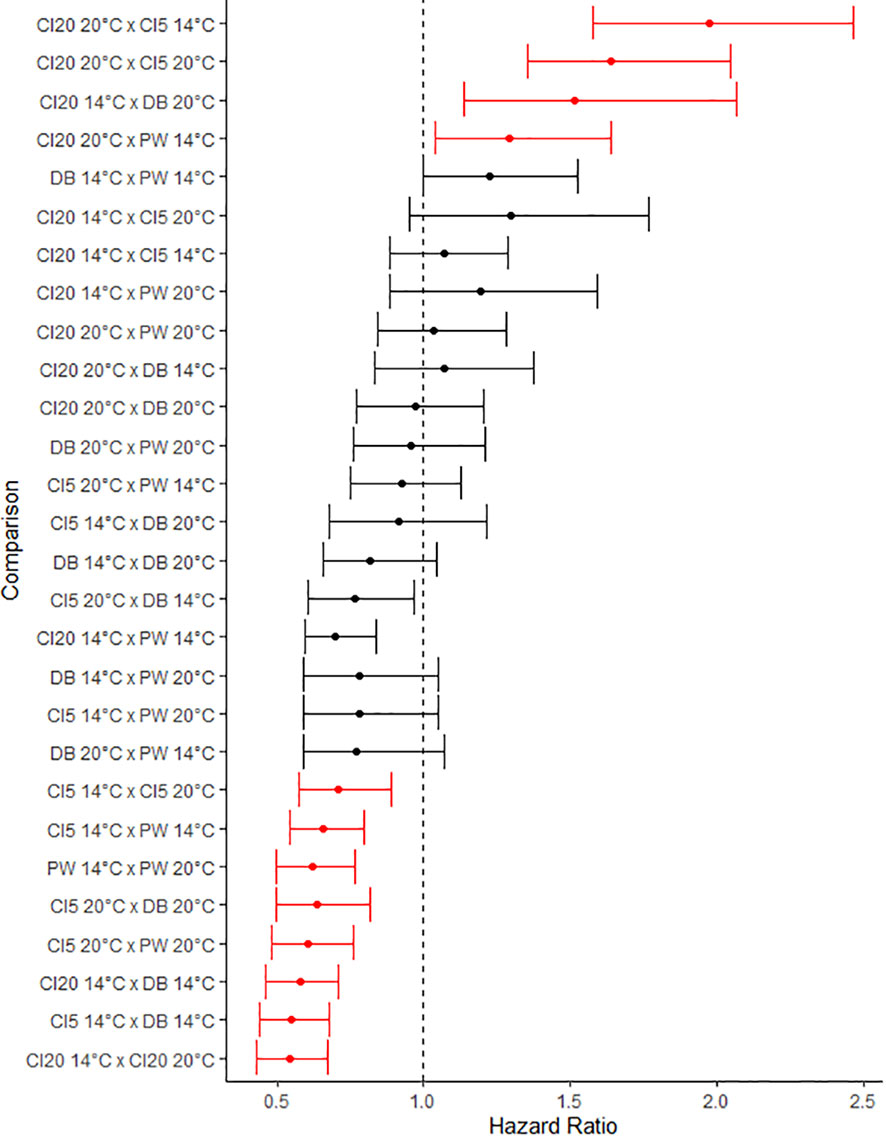
Figure 10 Forest plot summarizing survival results of multivariate Cox regression analysis. Points represent hazard ratio (HR, the ratio of the rates of death between the two) with error bars signifying 95% confidence interval (CI). Larvae from different parental families were exposed to thermal challenges of either 14°C or 20°C for 14 days. Each identifier on the y-axis represents a comparison between two O. lurida cohorts of larvae, spawned from parents acclimatized to various environmental conditions. Points are sorted based on the lower limit confidence interval value. Comparisons can be considered significantly different from each other when the HR and CI values are greater than or less than 1. Points highlighted in red represent a treatment pairing that are statistically significant.
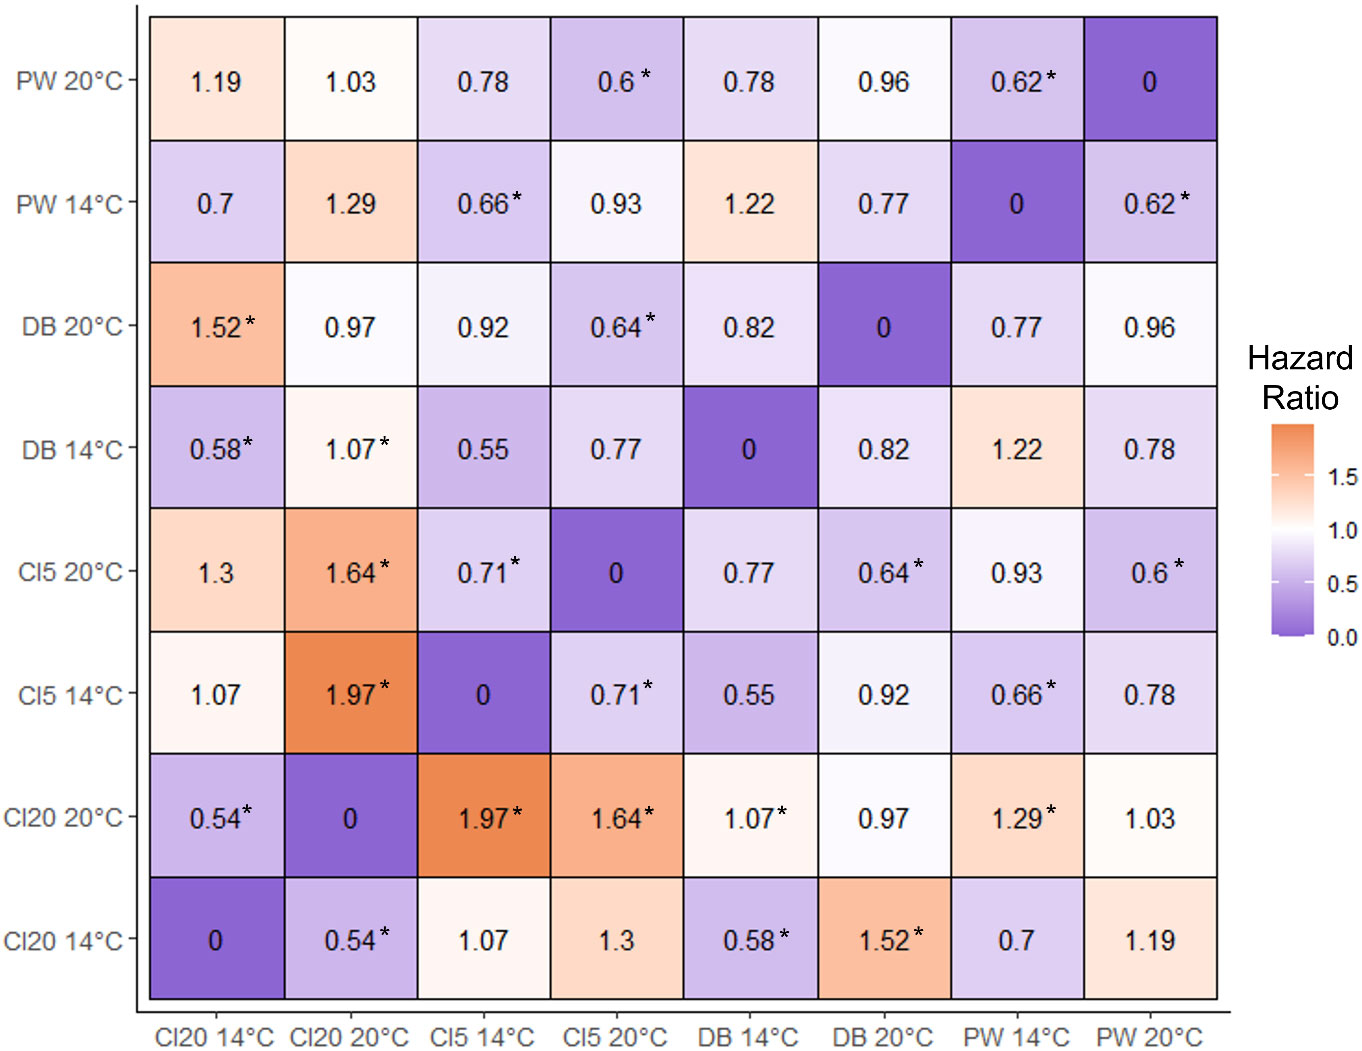
Figure 11 Heat map matrix depicting hazard ratio (HR) values for each comparison between two O. lurida cohorts of larvae, spawned from parents acclimatized to various environmental conditions. Results summarize survival outcomes of multivariate Cox regression analysis. Larvae from different parental families were exposed to thermal challenges of either 14°C or 20°C for two weeks. Asterisks (*) next to the HR value represent a significant relationship between the two cohorts. When considering the values above the row of zeros, significant HR (± CI, *) >1 (more orange) depicts a relationship in which the cohort on the horizontal has a higher chance of survival than the vertical axis, and a significant relationship < 1 (more purple) denotes a greater chance of survival on the vertical axis.
Larval respirometry
The response of larvae to different temperatures depended on the parental site (Figure 12, Table 1, p < 0.001). Maximum respiration rates for all locations were observed at 20°C. However, larval respiration rates at 20°C were higher for larvae from CI20 and PW parents compared to those from CI5 and DB. The lowest respiration rates were found at 5 - 10°C. Respiration at 15 and 25°C did not differ from each other.
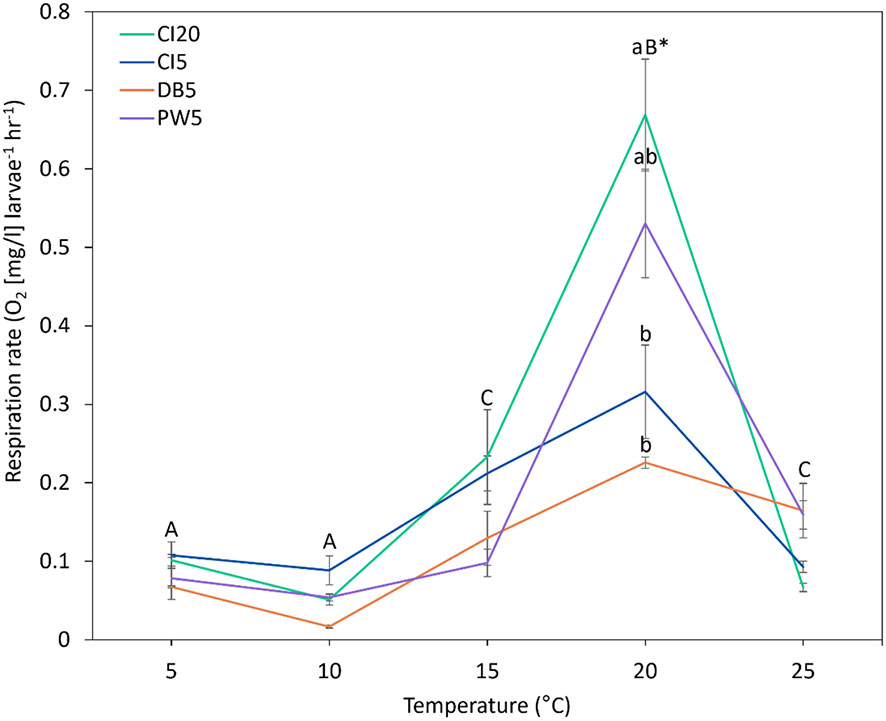
Figure 12 Short-term respiration rate of Olympia oyster (Ostrea lurida) larvae. Oxygen consumption (mg/l) of larvae per hour and larval count, were measured at five temperature levels. Parents were conditioned for six-months at various sites within Puget Sound, Washington. Different colors represent different parental acclimatization sites (CI20: Carr Inlet at 20 m, CI5: Carr Inlet at 5 m, DB: Dabob Bay at 5 m, PW: Point Wells at 5 m). Capital letters signify differences in respiration between temperatures. If a temperature does not include lowercase letters, then there were no differences in respiration between sites at that temperature (p < 0.05). Lowercase letters indicate differences between sites at that temperature (only at 20°C).
Discussion
This multidisciplinary study examines how temporal and spatial environmental variability influences phenotypic changes and carryover effects in the Olympia oyster. Our results show high acclimatization potential and phenotypic responses in growth, metabolism, and reproduction in oysters outplanted to different locations in Puget Sound, Washington. Larvae whose parents were acclimatized to Dabob Bay in Hood Canal, were more resilient than others, having the highest survival, growth, and low metabolic rate when exposed to thermal stress. Our results provide important information to support restoration efforts to increase the abundance of this native species and to support shellfish growers’ efforts focused on improving broodstock, offspring quality, and resilience.
Oceanography
Puget Sound is a remarkably complex and dynamic fjord estuary system which experiences large environmental fluctuations between season, location, and depth (Feely et al., 2010; Reum et al., 2014; Thom et al., 2018). We used long-term monitoring buoys to profile this oceanographic complexity at our sites over one year. We found more extreme and variable temperatures at DB (Hood Canal), while CI20 (South Puget Sound at 20 m) and PW (Central Puget Sound) experienced lower and less variable temperatures. Higher temperatures in the warmer T1 period (July 2018 – Jan 2019) were associated with lower oxygen values, especially at CI20 and PW. At the CI location (5 or 20 m depth), water was well mixed from late October (~13°C) to early March (~8°C), so temperatures were very similar at both our shallow and deep sites. In fact, there were 113 days where the 20 m depth was warmer than the 5 m depth at CI, likely due to rainfall/runoff/freshwater inflow/snowmelt and strong vertical mixing in the colder months. Salinity was lower during the T2 period (January 2019 – July 2019), which is likely due to winter and spring rainfall/runoff. Extreme low values of salinity were observed at the DB site compared to the other sites. This site has historically exhibited a high freshwater inflow (Newton et al., 2007; Conway-Cranos et al., 2015), which can be exemplified in our data by short periods of low salinity. Hood Canal is especially prone to episodic upwelling and seiche (Newton et al., 2007; Moore et al., 2017), which may explain the environmental variability in our data at this site. The lowest pH was observed at CI-20, but highest pH variability was observed at DB. During upwelling old deep water is carried to the surface, bringing cold, nutrient-rich water with low pH and DO. Many hatcheries, like Taylor Shellfish Farms, whose hatchery is located near the DB site, are already feeling the effects of OA on profits and now buffer their water with sodium carbonate to increase the carbonate availability to their larval shellfish (Barton et al., 2015; Washington Sea Grant, 2015). The highest variability in chlorophyll values was observed at CI5 during the summers of 2018 and 2019. These high values could have been associated with toxic dinoflagellate algal blooms (Protoceratium reticulatum and Akashiwo sanguinea) that resulted in mass mortality of shellfish in different parts of Puget Sound (King et al., 2021). In both 2018 and 2019, the combination of stress due to increased environmental variability and exposure to yessotoxin (which affects metabolic and immune pathways) from the algae resulted in many cultured and wild bivalve mortalities in Puget Sound within a matter of weeks (King et al., 2021).
Shell growth and strength
Growth rates of adult O. lurida were higher in the beginning half of our experiment when the temperatures were higher compared to the second half. The internal body temperature of ectotherms varies depending on the environmental temperature, so as the temperature is reduced below their optimal range, the organism’s metabolism, and consequently growth, slow (Pörtner et al., 2000; Brockington and Clarke, 2001; Schulte, 2015). During T2, oysters experienced more favorable carbonate chemistry levels for calcification, higher DO, and greater chl-a levels compared to T1. However, they also experienced a greater number of days with colder than average temperatures, which may explain the reduced growth rates during this period. Oysters located at CI20 had the lowest growth, likely due to low levels of chlorophyll, oxygen, and pH, associated with stratification and upwelling during warmer months.
Unlike growth rates, shell strength of O. lurida did not differ much between sites, but there was a clear difference in strength between collection times. Shell strength was higher in T2 when the oysters were older and had thicker shells. Shell strength was not correlated with shell growth (Supplementary Figure A2). This is consistent with studies that show no correlation between growth and shell strength in blue mussels M. edulis, and clams Arctica islandica after being exposed to temperature and pH stress (Hiebenthal et al., 2013). Oyster growth is likely prioritized when the individuals are young, and growth rates decrease as they age (Kraeuter et al., 2007). As maturity is reached, it is likely that shell strength is prioritized over growth. Ontogenetic increase in shell strength was also observed in the acclimatized Mytilus edulis (Nagarajan et al., 2006). Alternatively, more favorable carbonate chemistry parameters (high pH, aragonite and calcite saturation, and low pCO2), and higher oxygen levels in the second half of the field experiment may be responsible for changes in calcification and subsequently increased shell strength (Bible and Sanford, 2016; Lowe et al., 2019). It is important to note that shell strength by T2 remained the same for all sites, despite the high variability in environmental characteristics and differences in shell growth rates between sites. Thus, allocation of energy to shell strength is an important process that is prioritized in O. lurida, regardless of external conditions. Not having a strong shell may be detrimental as oysters may become more vulnerable to predators and shell boring parasites (Duckworth and Peterson, 2013; Coleman, 2014; Mostofa et al., 2015). In future studies, more frequent collection of organisms throughout the year would allow the implementation of models to quantify what environmental variables best predicts shell growth and integrity at the different locations and time periods.
Lipid and isotopic composition
Oysters from different sites and collection periods had the same total lipid content. This was surprising considering the seasonal and spatial variability of environmental parameters at our collection sites. This suggests that oysters from different sites may be mobilizing glycogen (main storage form of glucose) for energy similarly and/or may not need to tap into their fat reserves (Berthelin et al., 2000; Hassan et al., 2018). Similar results were seen in several lab-based climate change related experiments. There was no significant difference in lipid content between developmental stages in urchin Strongylocentrotus purpuratus acclimated to pCO2 365, 1030, or 1450 μatm for six days (Matson et al., 2012). Conversely, environmental variation with season caused differences in C. gigas total lipid profile in Kali Estuary, India, suggesting different metabolic trade-offs between species and environments (Subasinghe et al., 2019). Performing specific fatty acid assays may elucidate differences in saturation, and distribution of fatty acids to better understand diet source and environmental stress responses (Berthelin et al., 2000).
Isotopic signatures collected in the present study demonstrate that oysters acclimatized to different locations and time periods accessed different food sources and assimilated different sources of nitrogen and carbon into their tissue. Carbon isotopic signatures show that O. lurida mainly consumes phytoplankton with some evidence that they may consume POM or sinking POM (SPOM) from other primary production sources (phytobenthos) depending on biogeographic availability (Hill and McQuaid, 2008). Oysters from T1 collected at CI20 had higher δ15N signatures compared to the other sites. Enriched δ15N signals are often associated with higher consumer trophic position (Malet et al., 2007; McMahon et al., 2021). It is likely that oysters at this location consumed more zooplankton, animal based POM and/or SPOM during this time period. A high δ15N signature may also be indicative of heavy nitrates associated with upwelling, which are consumed by primary producers which shellfish feed on (Emery, 2015; Feddern et al., 2021). The primary consumers from the southwest/west facing coasts in South Africa: nematode Trichuris serrata, gastropod Oxystele variegate, and limpet Scutellastra cochlear also had enriched δ15N and δ15C due to biogeographic location and upwelling when compared to east facing locations (Hill and McQuaid, 2008). Similarly, native mussel Mytilus trossulus isotopic signatures were tied closely to seasonal changes, and differences between locations in Puget Sound (Howe and Simenstad, 2015).
The differences between T1 and T2 δ15N signatures among sites indicate that the driver of nitrogenous sources for some sites (CI20 and DB) shifts seasonally (likely upwelling). Temperature and metabolic rate may also affect δ15N as shown for the oyster Crassostrea virginica in Chesapeake Bay, where tissue δ15N values decreased during warmer months when the oysters were more metabolically active, and tissue turnover is higher (Fertig et al., 2010). Coastal nitrogenous sources may come from rivers, runoff (Feely et al., 2012), and anthropogenic sources like stormwater, agriculture, or upwelling (Khangaonkar et al., 2018). Runoff, containing nitrates from synthetic fertilizers, have a low δ15N signature (Fertig et al., 2010), and increased runoff may explain the decreased δ15N signature in oysters at DB during T1. However, this signature was absent at the end of T2, a period with a higher likelihood of increased runoff due to snowmelt and winter precipitation, suggesting that runoff may not be the largest contributing factor. We can also assume that effects of the nitrogen isotope occur through two pathways, a direct effect of study site and collection period, and effects mediated through growth.
Effects of temperature and pH on adult oyster metabolism
With increasing fluctuations in our oceans due to climate change, it is critical that we examine the tolerance and metabolic plasticity of marine organisms. We used short-term experiments to examine temperature and pH tolerance of adult O. lurida from different sites and seasons (Jan vs. Jul).
Higher respiration rates were found in oysters from T1 than T2 for all sites across temperatures. In January, oysters were cold-acclimatized and thus were more responsive to increases in temperature. Similar responses were observed in the adult oysters C. gigas and C. gigas angulate collected in either Qingdao (northern site, colder) or Xiamen (south site, warmer) off the coast of China (Li et al., 2017). Southern oysters had higher metabolic rates and tended to have a higher plasticity than the northern oysters. In our respiration trials we did not see evidence of metabolic depression due to high temperatures. Only the T2 DB cohort showed slight metabolic depression at warmer temperatures (19 and 25°C), which were higher than the maximum temperature experienced in the field in our study (18°C). This has also been observed in arctic blue mussels Mytilus edulis, whose metabolic rate continued to rise past 7°C, despite their lowest environmental temperature being around 5°C (Thyrring et al., 2015). We must consider that respiration measurements were a response to acute stress (1 hour exposure) and thus may not reflect in situ resting metabolic rate. Further oxygen consumption is a proxy, but may not necessarily be a perfect indicator of cellular respiration (Schulte, 2015) or long-term response.
Our high temperatures in the respiration trials exceed levels predicted for year 2100 (IPCC, 2019), which may potentially indicate that these bivalves are equipped to survive these warmer temperatures. It may also suggest that their thermal tolerance deviates from the traditional bell shaped thermal performance curve or may not reflect the oxygen and capacity limitation of thermal tolerance (OCLTT) hypothesis (Schulte, 2015; Pörtner et al., 2017; Jutfelt et al., 2018). Thermal stress and oyster tolerance can vary between habitats and oyster survival may be compromised in different environments due to heightened extreme weather events and heatwaves associated with climate change (Frölicher and Laufkötter, 2018; Gobler, 2020; Scanes et al., 2020). For example, the northeastern Pacific warm-water anomaly of 2015 (Khangaonkar et al., 2021) resulted in water temperatures of up to 21.5°C, and the Pacific Northwest heat wave of 2021 resulted in air temperatures of up to 49.4°C, killing many cultured and wild bivalves in the intertidal zone (Bond et al., 2015).
It has been well documented that, similar to temperature, OA causes bioenergetic trade-offs, narrowing the aerobic scope, and thermal breadth of an organism (Pörtner, 2008; Sokolova et al., 2012). Our results show seasonal differences in respiration rates under different pH levels for all sites. Oysters collected in T1, which were experiencing lower pH at the time of collection than oysters collected in T2, showed lower respiration rates across pH levels. OA exposure is thought to directly affect ectotherms’ metabolism by inducing hypercapnia and increasing the amount of ATP needed to maintain homeostasis and ion regulation (Byrne, 2011; Ivanina and Sokolova, 2015). Increased metabolic rate in July may be indicative of short-term acidosis followed by release of stress hormones which can temporarily increase oxygen intake and delivery to cells (Lefevre, 2016). Seasonal respiration patterns may also reflect differences in pH response between cold and warm acclimatized oysters. DB and PW showed a strong increase in respiration rates below pH 6.9 during both time periods, but this trend was not observed for CI. We exposed oysters to very low pH levels (6.6 and 6.9) and pH levels of 7.5 and 7.2 are nearest to the Representative Concentration Pathway (RCP) 8.5 climate change scenario predicted for year 2100 (IPCC, 2019). It should be noticed that while the progression of OA may be faster than in recent history, it is not expected to occur extremely quickly, and organisms may have the potential to adapt to these changes. Respiration rates were measured in single stressor experiments in this study, but these stressors do not occur in isolation in situ suggesting that to better predict responses, interactive responses will need to be explored.
Reproductive characteristics: gamete development and sex ratio
Gametogenesis in O. lurida begins in the winter, where typically, a cold thermal cue triggers a reproductive quiescence (Coe, 1932). Spawning is stimulated by warmer water temperatures; extending from the spring to early fall but differences in environmental cues due to abnormally warm waters may cause gametogenesis to continue through the winter (Coe, 1932). In our study we examined gamete development and sex ratio of O. lurida transplanted to different sites in Puget Sound. All oysters were raised in the same hatchery conditions before the outplants (broodstock consisted of ~100 individuals) and therefore, any differences in reproductive maturity can be attributed to differences in field conditions.
At the start of the experiment, 80% of oysters had mature gametes, but after the first six months (June to January) of acclimatization in the different environments, oysters showed different reproductive characteristics. In T1, oysters from all shallow sites had gametes in advanced or mature stages. CI5 and DB sites had the largest proportion of oysters with gametes, and at these sites we also found the largest shell growth rates and C:N ratios. Oysters from the deep location (CI20), the site with lowest oyster growth, only showed gametes in early stages, recently spawned, or being resorbed in T1. Reproduction is an energy demanding processes that depends on physical, chemical, and biological characteristics. Slower gametogenesis at greater depth may be due to changes in temperature, food quantity and quality, and stressors like more acidic conditions or lower oxygen content (Coe, 1932; Neto et al., 2013; Barber and Blake, 2016; Xu et al., 2016; Silliman et al., 2018). A similar result was found in Ostrea edulis from different geographic regions across Europe where there was a asynchrony in gonad maturation and differences in thresholds for initiation of gametogenesis based on the location of collection and acclimatization (da Silva et al., 2009). Interestingly, a large proportion of oysters from all sites (except for CI5) showed resorbed eggs in T1 which may be a strategy to preserve energy in times of low food or stress in bivalves (Hassan et al., 2018).
By the end of T2 (12 months after the outplants), the CI20 cohort appeared to be reproducing actively with a larger proportion of oysters with gametes in advanced and mature stages. PW and CI5 showed the largest proportions of oysters with gametes in advanced stages. These two sites showed similar temperature values and variability throughout the year. At the end of T2, oysters from DB had recently undergone a spawning event and were in a phase of inactive gametogenesis (based on excessive connective tissue), suggesting that they were able to go through another full gametogenesis cycle in less than 6 months. The temperature at DB during T2 was the highest and extremely variable, possibly accelerating the rate of gonad development at this site. O. lurida and an oyster within the same genus, O. edulis, have been seen to undergo two rounds of gametogenesis within a year (Joyce et al., 2013; Grossman et al., 2020; Spencer et al., 2021). Evidence of reproductive maturation during colder months may be beneficial for the cultivation of the species and may be a favorable trait that restoration aquaculture may select to maximize reproductive yield.
We have shown that the reproductive phenology of O. lurida is plastic with gamete development and spawning timing changing depending on environmental conditions. As climate change progresses, we will likely see more extreme differences in reproductive timing across geographic zones and between depths. This may be of concern because asynchrony in gonad maturation may lead to asynchrony in spawning, which may affect the fate of this species (Hassan et al., 2018). A larvae who was born in one location, may travel and settle in a different habitat where locally adapted populations have evolved different reproductive phenology (da Silva et al., 2009; Barber et al., 2016; Hassan et al., 2018a). It was long thought that O. lurida needed to be subjected to at least 12.5°C to spawn and brood, however Barber et al. (2016) found that, in Puget Sound, they may spawn at temperatures as low as 10.5°C. The authors suggest that this result could signify a widening of their tolerance threshold to parallel the recent dramatic variations experienced in the environment. With predicted increase in environmental variation due to climate change, it is probable that O. lurida will experience shifts in reproductive phenology with important consequences for future oyster populations throughout Puget Sound.
The Ostrea genus is unique compared to most other oysters because they exhibit sequential hermaphrodism, in which there are sexual phases that oscillate between male and female; individuals are often found to be in transition, making them appear as simultaneous hermaphrodites (Coe, 1932; Hassan et al., 2018). All oysters start as male, and though the sequence of sex determination is genetically controlled, reproductive patterns and speed of progression between sexual phases are strongly influenced by environmental conditions (Coe, 1932; Ingle, 1951; Ruiz et al., 1992; da Silva et al., 2009; Joyce et al., 2013). Lower food availability and temperature reduces metabolic scope and favors spermatogenesis because it is less energetically demanding than oogenesis. In our study, sex ratios of O. lurida were not significantly different between sites. Similarly, O. lurida from Puget Sound did not exhibit differences in sex ratio after being exposed to pH and temperature stress in the lab (Spencer et al., 2021). It is worth noting, there were more males/hermaphroditic primarily males than hermaphroditic primarily females sampled in all cohorts throughout the year, and we did not observe any individuals that were fully female. It is possible that, since these were young oysters, the male phenotype was dominant (Coe, 1932). Additionally, the reduction in the female phenotype due to sub-lethal stress may result in reduced fertilization and may be detrimental to the species. Notably, in January (six months after acclimatization) oysters at the DB site had substantially more HPF, and fewer males, which deviated greatly from the ratio of other sites. A ratio skewed toward male dominance was also observed in Ostrea angasi, that were similar in size to our oysters (Hassan et al., 2018). The authors suggest that this pattern may have been due to the young age of these oysters. Skewed sex ratios and timing of cyclical sex turnover should be considered in aquaculture and restoration, as they may affect the short-term reproductive success of oysters that are outplanted as part of restoration efforts and of breeding programs who use younger oysters that are male dominant (Joyce et al., 2013).
Evidence of carryover effects: larval growth, survival and physiological performance
When organisms experience stress, energetic trade-offs occur likely resulting in a phenotypic response (e.g. smaller body size) and/or reduced energy allocation toward reproduction (Bayne, 2004; Pörtner et al., 2005; Fitzgerald-Dehoog et al., 2012; Sokolova et al., 2012; Silliman et al., 2018). Energetic trade-offs can be reflected in offspring through the process of maternal provisioning and/or epigenetic inheritance (Ross et al., 2016). In our study we studied the growth, survival and physiology of offspring from parents outplanted to different sites in Puget Sound. At 14°C we did not find notable differences in larval growth between sites. However, when challenged to 20°C, larvae from DB and CI5 oysters had higher growth rates compared to the CI20 and PW sites and at this temperature larval growth patterns closely resembled the growth patterns of their parents. Consistent with our findings, previous studies have shown that larvae of O. lurida have higher growth rates in warm and variable environments (Lawlor and Arellano, 2020; Spencer et al., 2020), like DB in our study. Parker et al. (2021) similarly found that larvae from S. glomerata oyster parents acclimatized to the highly variable intertidal habitat had faster growth than deeper subtidal populations with more homogenous conditions, suggesting that parents exposed to shallower sites and high variation would yield more resilient larvae. Conversely, elevated temperature reduced larval size of C. gigas, indicating that carryover effects are variable and can be species specific (Gibbs et al., 2021).
Larvae from CI20 and PW with slow growth rates may have higher energetic costs to reach settlement size since they likely need to spend longer time as plankton, increasing opportunities for environmentally related mortality, starvation, and predation (Ross et al., 2016). Differences in larval growth rates between different sites at 20°C could have also been attributed to differences in gamete quality. Artificially stimulated spawns may result in premature gamete release, regardless of reproductive maturity. Our gonad maturation data shows that, at the time the oysters were stimulated to spawn, both CI20 and PW populations appear to have spawned recently and were in the process of resorbing tissue, while DB and CI5 had a larger percentage of developing gametes.
It has been shown that sub-lethal temperature stress can promote energetic trade-offs between bivalve larval survival and growth (Fitzgerald-Dehoog et al., 2012; Peng et al., 2016; Silliman et al., 2018; Pan et al., 2021). Our study found differences in larval survival depending on site and temperature. Interestingly larvae from CI5 parents had lower survival when compared to all other sites at both temperatures, despite having high growth rates. PW and CI20 oyster larvae had high survival but slower growth which may suggest an adaptive energetic trade-off based on parental environmental history, favoring phenotypes with higher maternal provisioning or epigenetic changes that may increase the likelihood of offspring survival (Parker et al., 2015). It is important to monitor long-term survival to understand beneficial and negative carryover effects of calcifiers like O. lurida across multiple generations.
There is evidence that temperature and environmental variability experienced by parents shape the physiological performance and tolerance of offspring (Cavieres et al., 2019). It has also been shown that bivalve larval physiology is more sensitive to environmental stressors than that of adults (Waldbusser and Salisbury, 2014) and climate change stress is predicted to breech larval temperature thresholds pushing early life history stages to metabolic collapse (Byrne, 2011). We found that, when tested under five temperature levels, larval respiration rates resembled a classic thermal performance curve following the concept of OCLTT (Pörtner, 2008; Sokolova et al., 2012; Schulte, 2015). Unlike parental respiration rates, larval oxygen consumption rate peaked at 20°C, showing that O. lurida larvae are more vulnerable to thermal stress than adults. Larvae from all sites reduced respiration drastically at 25°C whereas adults did not show any evidence of metabolic decrease at 25°C. In recent years, summer high temperatures in Puget Sound have surpassed 20°C, and it is possible that future ocean warming and short-term extreme weather events may affect the metabolism and survival of future oyster offspring with important consequences for dispersal and settlement (Stamps, 2006; O’Connor et al., 2007). Our results highlight the importance of examining carryover effects under different scenarios to better assess the potential and limitations of parental investment in providing resilience to offspring performance. This information on parental effects may allow aquaculturists to select parents for breeding programs that enable offspring that are more resilient to climate change (Joyce et al., 2013; Parker et al., 2015; Foo and Byrne, 2016).
Conclusion
Olympia oysters play a crucial role in the ecosystem as ecosystem engineers and have cultural importance, particularly in regions where they are native, like Puget Sound. Studying their physiology and response to environmental factors is vital for sustainable management and successful aquaculture practices, which can contribute to local economies.
Our study on Olympia oysters in Puget Sound has important implications for oyster farmers and restoration practitioners. The research highlights the species’ remarkable acclimatization capacity across sites and seasons. Our findings show lower oyster growth during colder months, suggesting an energetic trade-off with increased shell strength during this period. Spatial and temporal variations in the oyster’s diet sources, influenced by physiological differences at different sites, are also noted.
While sex ratios remain stable across sites, the study reveals asynchronization in gametogenesis based on acclimatization conditions, potentially affecting local populations. Parental carryover effects are observed, with offspring from parents experiencing high and variable thermal conditions exhibiting faster growth. However, concerns arise about future temperatures exceeding larvae’s physiological tolerance thresholds, posing a potential bottleneck. Our results showed slower growth in oysters cultured at deeper depths, a trait inherited by the offspring. However, traits like shell strength, lipid content, and sex ratio remain consistent regardless of location or depth.
Despite the challenges in establishing causation due to interacting drivers, field-based studies provide a more realistic understanding of acclimatization capacity and long-term survival. Future studies should increase the number of sites and collection times to better understand how physiological processes relate to co-occurring environmental variables. Our study emphasizes the need for more multigenerational and field-based experiments to project the impact of various environmental factors on the acclimatization and adaptation of economically and ecologically significant bivalve species. This approach aims to enhance the resilience of future generations, ecosystem services, and the productivity of commercial and restoration aquaculture in the coming century.
Data availability statement
The datasets presented in this study can be found in online repositories. The names of the repository/repositories and accession number(s) can be found below: Parental Carryover in Olympia Oysters - Survival Analysis 10.6084/m9.figshare.19765924.
Ethics statement
Ethical review and approval was not required for the study on animals in accordance with the local legislation and institutional requirements.
Author contributions
LA: Conceptualization, Methodology, Formal analysis, Investigation, Data Curation, Writing - Original Draft, Writing - Review & Editing, Visualization. PE: Methodology, Formal analysis, Resources, Writing - Review & Editing. RC: Investigation, Resources, Writing - Review & Editing. JN: Conceptualization, Project administration, Funding acquisition. MM: Investigation, Resources, Writing - Review & Editing. JM: Conceptualization, Project administration, Funding acquisition. JP-G: Conceptualization, Writing - Review & Editing, Supervision, Funding acquisition, Project administration. All authors contributed to the article and approved the submitted version.
Funding
The author(s) declare financial support was received for the research, authorship, and/or publication of this article. This project was funded by Victor and Tamara Loosanoff Endowed Fellowship awarded to LA. The Joint Institute for the Study of the Atmosphere and Ocean (JISAO)/Cooperative Institute for Climate, Ocean, & Ecosystem Studies (CICOES) Graduate Student Fellowship awarded to LA. School of Aquatic and Fishery Sciences Capstone Program awarded to LA and JP-G, Royalty Research Fund Fellowship, the Sloan Foundation Fellowship, and the NOAA-Saltonstall-Kennedy Grant Program (No. 12493539) awarded to JP-G.
Acknowledgments
We would like to express our sincerest thanks to: Gordon Holtgrieve, Steven Roberts, and Parker McCready for their mentorship, support, and insightful feedback on the manuscript. Our colleagues from University of Washington (UW) School of Aquatic and Fishery Sciences (SAFS) Jon Wittouck, Laura Spencer, Eileen Bates, Miranda Roethler, Beka Stiling, Evan Fiorenza, and the entire Padilla-Gamiño lab for their support and generosity in assisting with various aspects of this project. Bill Kuykendall of UW Mechanical Engineering for assistance with the Instron machine, and Andy Schauer of UW Isolab provided instruction for the use of the elemental analyzer and mass spectrometer. Betsy Peabody, Olivia Cattau, and Stuart Ryan of Puget Sound Restoration Fund for the provision of adult oysters and for assisting with larval rearing. Danielle Perez and Kelsey Donahue from NOAA Mukilteo Field Station for help with aquarium and instrumentation. UW Dive Safety Officer Will Love and collaborators at UW Applied Physics Lab Chris Archer, Robert Danials, Ryan Newell, Zoe Parsons, Derik Martin, and Wendy Ruef for assistance with SCUBA work, maintenance of buoys, engineering support, provision of boats, and buoy data acquisition. This work would not have been possible without all the hard work of these talented young scientists: Undergraduates Lealand Wood, Owen Oliver, Linnea Stavney, Elizabeth Landefeld, Angel Sar, Claudia Penny, Leila Arafeh, Delaney Lawson, Josie Dodd, Davi Borromeo, Andrew Olivero, Lilly Stair, Sarah Elgin; Capstone student Trevor Derie; and Hutton Scholar high school students Gabriel McMillen, and Victoria Hsieh. We would like to thank the reviewers of this manuscript for their helpful and insightful comments.
Conflict of interest
The authors declare that the research was conducted in the absence of any commercial or financial relationships that could be construed as a potential conflict of interest.
Publisher’s note
All claims expressed in this article are solely those of the authors and do not necessarily represent those of their affiliated organizations, or those of the publisher, the editors and the reviewers. Any product that may be evaluated in this article, or claim that may be made by its manufacturer, is not guaranteed or endorsed by the publisher.
Supplementary material
The Supplementary Material for this article can be found online at: https://www.frontiersin.org/articles/10.3389/fmars.2024.1178507/full#supplementary-material
References
Alma L., Kram K. E., Holtgrieve G. W., Barbarino A., Fiamengo C. J., Padilla-Gamiño J. L. (2020). Ocean acidification and warming effects on the physiology, skeletal properties, and microbiome of the purple-hinge rock scallop. Comp. Biochem. Physiol. -Part A Mol. Integr. Physiol. 240. doi: 10.1016/j.cbpa.2019.110579
Alma L., McElhany P., Padilla-Gamiño J. L. (2022b). Parental carryover in olympia oysters - survival analysis [WWW document]. Parent. Carryover Olympia Oysters - Surviv. Anal. doi: 10.6084/m9.figshare.19765924
Alma L., Fiamengo C. J., Alin S. R., Jackson M., Hiromoto K., Padilla-Gamiño J. L. (2023). Physiological responses of scallops and mussels to environmental variability: Implications for future shellfish aquaculture. Mar. Pollut. Bull. 194, 115356. doi: 10.1016/j.marpolbul.2023.115356
Barber B. J., Blake N. J. (2016). “Reproductive physiology,” in Developments in Aquaculture and Fisheries Science 35 (2), 351–357. doi: 10.1016/B978-0-444-62710-0.00006-7
Barber J. S., Dexter J. E., Grossman S. K., Greiner C. M., McArdle J. T. (2016). Low temperature brooding of olympia oysters (Ostrea lurida) in Northern Puget Sound. J. Shellfish Res. doi: 10.2983/035.035.0209
Barton A., Waldbusser G. G., Feely R. A., Weisberg S. B., Newton J. A., Hales B., et al. (2015). Impacts of coastal acidification on the Pacific Northwest shellfish industry and adaptation strategies implemented in response. Oceanography 28, 146–159. doi: 10.5670/oceanog.2015.38
Bates D., Mächler M., Bolker B. M., Walker S. C. (2015). Fitting linear mixed-effects models using lme4. J. Stat. Soft. doi: 10.18637/jss.v067.i01
Bayne B. L. (2004). “Phenotypic flexibility and physiological tradeoffs in the feeding and growth of marine bivalve molluscs,” in Integrative and Comparative Biology. doi: 10.1093/icb/44.6.425
Bednaršek N., Newton J. A., Beck M. W., Alin S. R., Feely R. A., Christman N. R., et al. (2021). Severe biological effects under present-day estuarine acidification in the seasonally variable Salish Sea. Sci. Total Environ. 765, 142689. doi: 10.1016/j.scitotenv.2020.142689
Benson B. B., Krause D. (1984). The concentration and isotopic fractionation of oxygen dissolved in freshwater and seawater in equilibrium with the atmosphere. Limnol. Oceanogr. 29 (3), 620–632. doi: 10.4319/lo.1984.29.3.0620
Berthelin C., Kellner K., Mathieu M. (2000). Storage metabolism in the Pacific oyster (Crassostrea gigas) in relation to summer mortalities and reproductive cycle (West Coast of France). Comp. Biochem. Physiol. - B Biochem. Mol. Biol. 125 (3), 359–369. doi: 10.1016/S0305-0491(99)00187-X
Bible J. M., Sanford E. (2016). Local adaptation in an estuarine foundation species: Implications for restoration. Biol. Conserv. 193, 95–102. doi: 10.1016/j.biocon.2015.11.015
Blake B., Bradbury A. (2012). Washington Department of Fish and Wildlife Plan for Rebuilding Olympia Oyster (Ostrea lurida) Populations in Puget Sound with a Historical and Contemporary Overview. 1–26.
Bligh E. G., Dyer W. J. (1959). a rapid method of total lipid extraction and purification. Can. J. Biochem. Physiol. 37, 911–917. doi: 10.1139/y59-099
Bond N. A., Cronin M. F., Freeland H., Mantua N. (2015). Causes and impacts of the 2014 warm anomaly in the NE Pacific. Geophys. Res. Lett. 42, 3414–3420. doi: 10.1002/2015GL063306
Brockington S., Clarke A. (2001). The relative influence of temperature and food on the metabolism of a marine invertebrate. J. Exp. Mar. Bio. Ecol. 258 (1), 87–99. doi: 10.1016/S0022-0981(00)00347-6
Byrne M. (2011). Impact of ocean warming and ocean acidification on marine invertebrate life history stages: Vulnerabilities and potential for persistence in a changing ocean. Oceanogr. Mar. Biol. Annu. Rev. 49, 1–42.
Cai W. J., Feely R. A., Testa J. M., Li M., Evans W., Alin S. R., et al. (2021). Natural and anthropogenic drivers of acidification in large estuaries. Ann. Rev. Mar. Sci. 13, 23–55. doi: 10.1146/annurev-marine-010419-011004
Carnarius K. M., Conrad K. M., Mast M. G., Macneil J. H. (1996). Relationship of eggshell ultrastructure and shell strength to the soundness of shell eggs. Poult. Sci. 75, 656–663. doi: 10.3382/ps.0750656
Cavieres G., Alruiz J. M., Medina N. R., Bogdanovich J. M., Bozinovic F. (2019). Transgenerational and within-generation plasticity shape thermal performance curves. Ecol. Evol. 9, 2072–2082. doi: 10.1002/ece3.4900
Coe (1932). Development of the gonads and the sequence of the sexual phases in the California oyster (Ostrea lurida). Bull. Scripps Inst. Oceanogr 3, 119–144.
Coleman S. E. (2014). The effects of boring sponge on oyster soft tissue, shell integrity, and predator-related mortality. Masters Abstr. Int. 53, 62.
Conway-Cranos L., Kiffney P., Banas N., Plummer M., Naman S., MacCready P., et al. (2015). Stable isotopes and oceanographic modeling reveal spatial and trophic connectivity among terrestrial, estuarine, and marine environments. Mar. Ecol. Prog. Ser. 533, 15–28. doi: 10.3354/meps11318
Costalago D., Forster I., Nemcek N., Neville C., Perry R. I., Young K., et al. (2020). Seasonal and spatial dynamics of the planktonic trophic biomarkers in the Strait of Georgia (northeast Pacific) and implications for fish. Sci. Rep. 10 (1), 8517. doi: 10.1038/s41598-020-65557-1
Cox D. R. (1972). Regression models and life-tables. J. R. Stat. Soc Ser. B 34, 187–202. doi: 10.1111/j.2517-6161.1972.tb00899.x
da Silva P. M., Fuentes J., Villalba A. (2009). Differences in gametogenic cycle among strains of the European flat oyster Ostrea edulis and relationship between gametogenesis and bonamiosis. Aquaculture 287 (3-4), 253–265. doi: 10.1016/j.aquaculture.2008.10.055
Dickson A. G., Sabine C. L., Christian J. R. (2007). Guide to Best Practices for Ocean CO2 measurements (PICES Special Publication).
Doney S. C., Fabry V. J., Feely R. A., Kleypas J. A. (2009). Ocean acidification: The other CO2 problem. Ann. Rev. Mar. Sci. 1, 169–192. doi: 10.1146/annurev.marine.010908.163834
Duarte C. M., Hendriks I. E., Moore T. S., Olsen Y. S., Steckbauer A., Ramajo L., et al. (2013). Is ocean acidification an open-ocean syndrome? Understanding anthropogenic impacts on seawater pH. Estuaries Coasts 36, 221–236. doi: 10.1007/s12237-013-9594-3
Duckworth A. R., Peterson B. J. (2013). Effects of seawater temperature and pH on the boring rates of the sponge Cliona celata in scallop shells. Mar. Biol. 160, 27–35. doi: 10.1007/s00227-012-2053-z
Dumbauld B. R., Ruesink J. L., Rumrill S. S. (2009). The ecological role of bivalve shellfish aquaculture in the estuarine environment: A review with application to oyster and clam culture in West Coast (USA) estuaries. Aquaculture 290 (3-4), 196–223. doi: 10.1016/j.aquaculture.2009.02.033
Eccles J., Greene C. M., Sobocinski K., Stevik B., Carson H. (2018). Reconstructing historical patterns of primary production in Puget Sound using growth increment data from shells of long-lived geoducks (Panopea generosa).
Emery K. A. (2015). Coastal bivalve aquaculture carbon cycling, spatial distribution and resource use in Virginia, USA and Baja California, Mexico. [MS Thesis] (Charlottesville, Virginia, USA: University of Virginia). 97.
Fassbender A. J., Alin S. R., Feely R. A., Sutton A. J., Newton J. A., Krembs C., et al. (2018). Seasonal carbonate chemistry variability in marine surface waters of the US Pacific Northwest. Earth Syst. Sci. Data 10 (3), 1367–1401. doi: 10.5194/essd-10-1367-2018
Feddern M. L., Holtgrieve G. W., Ward E. J. (2021). Stable isotope signatures in historic harbor seal bone link food web-assimilated carbon and nitrogen resources to a century of environmental change. Glob. Change Biol. 27 (11), 2328–2342. doi: 10.1111/gcb.15551
Feely R. A., Alin S. R., Newton J., Sabine C. L., Warner M., Devol A., et al. (2010). The combined effects of ocean acidification, mixing, and respiration on pH and carbonate saturation in an urbanized estuary. Estuar. Coast. Shelf Sci. 88, 442–449. doi: 10.1016/j.ecss.2010.05.004
Feely R. A., Sabine C. L., Byrne R. H., Millero F. J., Dickson A. G., Wanninkhof R., et al. (2012). Decadal changes in the aragonite and calcite saturation state of the pacific ocean. Global Biogeochem. Cycles 26. doi: 10.1029/2011GB004157
Fertig B., Carruthers T. J. B., Dennison W. C., Fertig E. J., Altabet M. A. (2010). Eastern oyster (Crassostrea virginica) δ15N as a bioindicator of nitrogen sources: Observations and modeling. Mar. Pollut. Bull. 60, 1288–1298. doi: 10.1016/j.marpolbul.2010.03.013
Fitzgerald-Dehoog L., Browning J., Allen B. J. (2012). Food and heat stress in the California mussel: Evidence for an energetic trade-off between survival and growth. Biol. Bull. 223 (2), 205–216. doi: 10.1086/BBLv223n2p205
Foo S. A., Byrne M. (2016). “Acclimatization and adaptive capacity of marine species in a changing ocean,” in Advances in Marine Biology. doi: 10.1016/bs.amb.2016.06.001
Fox R. J., Donelson J. M., Schunter C., Ravasi T., Gaitán-Espitia J. D. (2019). Beyond buying time: The role of plasticity in phenotypic adaptation to rapid environmental change. Philos. Trans. R. Soc B Biol. Sci. 376 (1768). doi: 10.1098/rstb.2018.0174
Frölicher T. L., Laufkötter C. (2018). Emerging risks from marine heat waves. Nat. Commun. 9 (1), 650. doi: 10.1038/s41467-018-03163-6
Fry B., Mersch F. J., Tholke K., Garritt R., Brand W. (1992). Automated analysis system for coupled δ13C and δ15N measurements. Anal. Chem. 64, 288–291. doi: 10.1021/ac00027a009
Gattuso J.-P., Epitalon J.-M., Lavigne H. (2016). seacarb: Seawater Carbonate Chemistry R package version 3.0.14.
Ghalambor C. K., McKay J. K., Carroll S. P., Reznick D. N. (2007). Adaptive versus non-adaptive phenotypic plasticity and the potential for contemporary adaptation in new environments. Funct. Ecol. 21 (3), 394–407. doi: 10.1111/j.1365-2435.2007.01283.x
Gibbs M. C., Parker L. M., Scanes E., Byrne M., O’Connor W. A., Ross P. M. (2021). Adult exposure to ocean acidification and warming leads to limited beneficial responses for oyster larvae. ICES J. Mar. Sci. 78 (6), 2017–2030. doi: 10.1093/icesjms/fsab071
Gibert P., Debat V., Ghalambor C. K. (2019). Phenotypic plasticity, global change, and the speed of adaptive evolution. Curr. Opin. Insect Sci. 35, 34–40. doi: 10.1016/j.cois.2019.06.007
Gobler C. J. (2020). Climate change and harmful algal blooms: insights and perspective. Harmful Algae 91, 101731. doi: 10.1016/j.hal.2019.101731
Grossman S. K., Grossman E. E., Barber J. S., Gamblewood S. K., Crosby S. C. (2020). Distribution and transport of olympia oyster Ostrea lurida larvae in northern Puget sound, Washington. J. Shellfish Res. 39 (2), 215–233. doi: 10.2983/035.039.0204
Gurr S. J., Trigg S. A., Vadopalas B., Roberts S. B., Putnam H. M. (2021). Repeat exposure to hypercapnic seawater modifies growth and oxidative status in a tolerant burrowing clam. J. Exp. Biol. 224 (13), jeb233932. doi: 10.1242/jeb.233932
Hassan M. M., Qin J. G., Li X. (2018). Gametogenesis, sex ratio and energy metabolism in Ostrea angasi: Implications for the reproductive strategy of spermcasting marine bivalves. J. Molluscan Stud. 84, 38–45. doi: 10.1093/mollus/eyx041
Heare J. E., Blake B., Davis J. P., Vadopalas B., Roberts S. B. (2017). Evidence of Ostrea lurida carpenter 1864, population structure in Puget Sound, WA, USA. Mar. Ecol. 38 (5), e12458. doi: 10.1111/maec.12458
Hettinger A., Sanford E., Hill T. M., Hosfelt J. D., Russell A. D., Gaylord B. (2013). The influence of food supply on the response of Olympia oyster larvae to ocean acidification. Biogeosciences 10 (10), 6629–6638. doi: 10.5194/bg-10-6629-2013
Hettinger A., Sanford E., Hill T. M., Russell A. D., Sato K. N. S., Hoey J., et al. (2012). Persistent carry-over effects of planktonic exposure to ocean acidification in the Olympia oyster. Ecology 93 (12), 2758–2768. doi: 10.1890/12-0567.1
Hiebenthal C., Philipp E. E. R., Eisenhauer A., Wahl M. (2013). Effects of seawater pCO2 and temperature on shell growth, shell stability, condition and cellular stress of Western Baltic Sea Mytilus edulis (L.) and Arctica islandica (L.). Mar. Biol. 160, 2073–2087. doi: 10.1007/s00227-012-2080-9
Hill J. M., McQuaid C. D. (2008). δ13C and δ15N biogeographic trends in rocky intertidal communities along the coast of South Africa: Evidence of strong environmental signatures. Estuar. Coast. Shelf Sci. 80 (2), 261–268. doi: 10.1016/j.ecss.2008.08.005
Howe E., Simenstad C. A. (2015). Using isotopic measures of connectivity and ecosystem capacity to compare restoring and natural marshes in the Skokomish River Estuary, WA, USA. Estuaries Coasts 38, 639–658. doi: 10.1007/s12237-014-9831-4
Ikejima I., Nomoto R., McCabe J. F. (2003). Shear punch strength and flexural strength of model composites with varying filler volume fraction, particle size and silanation. Dent. Mater. 19, 206–211. doi: 10.1016/S0109-5641(02)00031-3
Ingle R. (1951). Spawning and setting of oysters in relation to seasonal environmental changes. Bull. Mar. Sci. 1 (2), 111–135.
Ivanina A. V., Sokolova I. M. (2015). Interactive effects of metal pollution and ocean acidification on physiology of marine organisms. Curr. Zool. 61 (4), 653–668. doi: 10.1093/czoolo/61.4.653
Joyce A., Holthuis T. D., Charrier G., Lindegarth S. (2013). Experimental effects of temperature and photoperiod on synchrony of gametogenesis and sex ratio in the european oyster Ostrea edulis (Linnaeus). J. Shellfish Res. 32 (2), 447–458. doi: 10.2983/035.032.0225
Jutfelt F., Norin T., Ern R., Overgaard J., Wang T., McKenzie D. J., et al. (2018). Oxygen- and capacity-limited thermal tolerance: Blurring ecology and physiology. J. Exp. Biol. 221 (1), jeb169615. doi: 10.1242/jeb.169615
Kasai A., Nakata A. (2005). Utilization of terrestrial organic matter by the bivalve Corbicula japonica estimated from stable isotope analysis. Fish. Sci. 71, 151–158. doi: 10.1111/j.1444-2906.2005.00942.x
Khangaonkar T., Nugraha A., Yun S. K., Premathilake L., Keister J. E., Bos J. (2021). Propagation of the 2014–2016 northeast Pacific marine heatwave through the Salish sea. Front. Mar. Sci. 8. doi: 10.3389/fmars.2021.787604
Khangaonkar T., Nugraha A., Xu W., Long W., Bianucci L., Ahmed A., et al. (2018). Analysis of hypoxia and sensitivity to nutrient pollution in salish sea. J. Geophys. Res. Ocean. 123, 4735–4761. doi: 10.1029/2017JC013650
King T. L., Nguyen N., Doucette G. J., Wang Z., Bill B. D., Peacock M. B., et al. (2021). Hiding in plain sight: Shellfish-killing phytoplankton in Washington State. Harmful Algae 105, 102032. doi: 10.1016/j.hal.2021.102032
Kraeuter J. N., Ford S., Cummings M. (2007). Oyster growth analysis: A comparison of methods. J. Shellfish Res. 26 (2), 479–491. doi: 10.2983/0730-8000(2007)26[479:OGAACO]2.0.CO;2
Lancaster L. T., Dudaniec R. Y., Hansson B., Svensson E. I. (2015). Latitudinal shift in thermal niche breadth results from thermal release during a climate-mediated range expansion. J. Biogeogr. 42 (10), 1953–1963. doi: 10.1111/jbi.12553
Lawlor J. A., Arellano S. M. (2020). Temperature and salinity, not acidification, predict near-future larval growth and larval habitat suitability of Olympia oysters in the Salish Sea. Sci. Rep. 10 (1), 13787. doi: 10.1038/s41598-020-69568-w
Lefevre S. (2016). Are global warming and ocean acidification conspiring against marine ectotherms? A meta-analysis of the respiratory effects of elevated temperature, high CO2 and their interaction. Conserv. Physiol. cow009. doi: 10.1093/conphys/cow009
Li L., Li A., Song K., Meng J., Guo X., Li S., et al. (2018). Divergence and plasticity shape adaptive potential of the Pacific oyster. Nat. Ecol. Evol. 2 (11), 1751–1760. doi: 10.1038/s41559-018-0668-2
Li A., Li L., Song K., Wang W., Zhang G. (2017). Temperature, energy metabolism, and adaptive divergence in two oyster subspecies. Ecol. Evol. 7 (16), 6151–6162. doi: 10.1002/ece3.3085
Liedtke T., Smith C., Rondorf D. (2011). “Stable isotopes of nitrogen and carbon as tools to monitor eutrophication and trophic dynamics,” in Hydrogr. Biochem. Inputs to Lib. Bay, a small urban embayment Puget Sound, Washingt, 69–84.
Lowe A. T., Bos J., Ruesink J. (2019). Ecosystem metabolism drives pH variability and modulates long-term ocean acidification in the Northeast Pacific coastal ocean. Sci. Rep. 9, 1–11. doi: 10.1038/s41598-018-37764-4
Maboloc E. A., Chan K. Y. K. (2021). Parental whole life cycle exposure modulates progeny responses to ocean acidification in slipper limpets. Glob. Change Biol. 27 (14), 3272–3281. doi: 10.1111/gcb.15647
MacCready P., McCabe R. M., Siedlecki S. A., Lorenz M., Giddings S. N., Bos J., et al. (2021). Estuarine circulation, mixing, and residence times in the Salish sea. J. Geophys. Res. Ocean. 126. doi: 10.1029/2020JC016738
Malet N., Sauriau P. G., Faury N., Soletchnik P., Guillou G. (2007). Effect of seasonal variation in trophic conditions and the gametogenic cycle on δ13C and δ15N levels of diploid and triploid Pacific oysters Crassostrea gigas. Mar. Ecol. Prog. Ser. 346, 203–217. doi: 10.3354/meps06953
Matson P. G., Yu P. C., Sewell M. A., Hofmann G. E. (2012). Development under elevated pCO2 conditions does not affect lipid utilization and protein content in early life-history stages of the purple sea urchin, Strongylocentrotus purpuratus. Biol. Bull. 223 (3), 312–327. doi: 10.1086/BBLv223n3p312
McIntyre B. A., McPhee-Shaw E. E., Hatch M. B. A., Arellano S. M. (2021). Location matters: passive and active factors affect the vertical distribution of olympia oyster (Ostrea lurida) larvae. Estuaries Coasts 44, 199–213. doi: 10.1007/s12237-020-00771-8
McMahon K. W., Ambrose W. G., Reynolds M. J., Johnson B. J., Whiting A., Clough L. M. (2021). Arctic lagoon and nearshore food webs: Relative contributions of terrestrial organic matter, phytoplankton, and phytobenthos vary with consumer foraging dynamics. Estuar. Coast. Shelf Sci. 257, 107388. doi: 10.1016/j.ecss.2021.107388
Moore S., Wold R., Stark K., Bos J., Williams P., Hamel N., et al. (2017). Puget Sound marine waters 2016 overview 56. Available at: https://repository.library.noaa.gov/view/noaa/46965NOAAReport.
Mostofa K. M. G., Liu C. Q., Zhai W. D., Minella M., Vione D., Gao K., et al. (2015). Reviews and Syntheses: Ocean acidification and its potential impacts on marine ecosystems. Biogeosciences Discuss. 12, 10939–10983. doi: 10.5194/bgd-12-10939-2015
Mueller S. (2017). Morphological and trophic differences between kelp crabs (Pugettia producta) inhabiting kelp and pilings. (University of Puget Sound).
Nagarajan R., Lea S. E. G., Goss-Custard J. D. (2006). Seasonal variations in mussel, Mytilus edulis L. shell thickness and strength and their ecological implications. J. Exp. Mar. Bio. Ecol. 339, 241–250. doi: 10.1016/j.jembe.2006.08.001
Neto R. M., Zeni T. O., Ludwig S., Horodesky A., Girotto M. V. F., Castilho-Westphal G. G., et al. (2013). Influence of environmental variables on the growth and reproductive cycle of Crassostrea (Mollusca, Bivalvia) in Guaratuba Bay, Brazil. Invertebr. Reprod. Dev. 57 (3), 208–218. doi: 10.1080/07924259.2012.747449
Newton J., Bassin C., Devol A., Kawase M., Ruef W., Warner M., et al. (2007). “Hypoxia in Hood Canal: an overview of status and contributing factors,” in Proceedings of the 2007 Georgia Basin Puget Sound Research Conference. (Olympia: Puget Sound Action Team).
Oates M. S. (2013). Obervations of gonad structure and ametogenic timing in a recovering population of Ostrea lurida (Carpenter 1864). Thesis Univ. Oregon, 56 p.
O’Connor M. I., Bruno J. F., Gaines S. D., Halpern B. S., Lester S. E., Kinlan B. P., et al. (2007). Temperature control of larval dispersal and the implications for marine ecology, evolution, and conservation. Proc. Natl. Acad. Sci. U. S. A. 104, 1266–1271. doi: 10.1073/pnas.0603422104
O’Neill B. C., Oppenheimer M., Warren R., Hallegatte S., Kopp R. E., Pörtner H. O., et al. (2017). IPCC reasons for concern regarding climate change risks. Nat. Clim. Chang. 7 (1), 28–37. doi: 10.1038/nclimate3179
Pan F. T. C., Applebaum S. L., Manahan D. T. (2021). Differing thermal sensitivities of physiological processes alter ATP allocation. J. Exp. Biol. 224 (2), jeb233379. doi: 10.1242/jeb.233379
Parker L. M., Ross P. M., O’Connor W. A., Borysko L., Raftos D. A., Pörtner H. O. (2011). Adult exposure influences offspring response to ocean acidification in oysters. Glob. Change Biol. 18 (1), 82–92. doi: 10.1111/j.1365-2486.2011.02520.x
Parker L. M., O’Connor W. A., Raftos D. A., Pörtner H. O., Ross P. M. (2015). Persistence of positive carryover effects in the oyster, Saccostrea glomerata, following transgenerational exposure to ocean acidification. PloS One 10, 1–19. doi: 10.1371/journal.pone.0132276
Parker L. M., Scanes E., O’Connor W. A., Coleman R. A., Byrne M., Pörtner H. O., et al. (2017). Ocean acidification narrows the acute thermal and salinity tolerance of the Sydney rock oyster Saccostrea glomerata. Mar. Pollut. Bull. 122, 263–271. doi: 10.1016/j.marpolbul.2017.06.052
Parker L. M., Scanes E., O’Connor W. A., Ross P. M. (2021). Transgenerational plasticity responses of oysters to ocean acidification differ with habitat. J. Exp. Biol. 224 (12), jeb239269. doi: 10.1242/jeb.239269
Pelletier G., Roberts M., Keyzers M., Alin S. R. (2018). Seasonal variation in aragonite saturation in surface waters of Puget Sound - A pilot study. Elementa 6, 5. doi: 10.1525/elementa.270
Peng T. C., Vengatesen T., Hwai A. T. S. (2016). Assessment of temperature effects on early larval development survival of hatchery-reared tropical oyster, Crassostrea iredalei. Trop. Life Sci. Res. 27 (supp1), 111. doi: 10.21315/tlsr2016.27.3.15
Pernet F., Tamayo D., Petton B. (2015). Influence of low temperatures on the survival of the Pacific oyster (Crassostrea gigas) infected with ostreid herpes virus type 1. Aquaculture 445, 57–62. doi: 10.1016/j.aquaculture.2015.04.010
Peter-Contesse & Peabody. (2005). Reestablishing Olympia oyster populations in Puget Sound, Washington (Washingt. Sea Grant).
Pörtner H. O., Van Dijk P. L. M., Hardewing I., Sommer A. (2000). “Levels of metabolic cold adaptation: tradeoffs in eurythermal and stenothermal ectotherms,” in Antarctic Ecosystems: Models for Wider Ecological Understanding.
Pörtner H. O., Storch D., Heilmayer O. (2005). Constraints and trade-offs in climate-dependent adaptation: Energy budgets and growth in a latitudinal cline. Sci. Mar. 69 (S2), 271–285. doi: 10.3989/scimar.2005.69s2271
Pörtner H. O. (2008). Ecosystem effects of ocean acidification in times of ocean warming: A physiologist’s view. Mar. Ecol. Prog. Ser. 373, 203–217. doi: 10.3354/meps07768
Pörtner H. O., Bock C., Mark F. C. (2017). Oxygen- & capacity-limited thermal tolerance: Bridging ecology & physiology. J. Exp. Biol. 220 (15), 2685–2696. doi: 10.1242/jeb.134585
Pritchard C., Shanks A., Rimler R., Oates M., Rumrill S. (2015). The olympia oyster Ostrea lurida: Recent advances in natural history, ecology, and restoration. J. Shellfish Res. 34 (2), 259–271. doi: 10.2983/035.034.0207
R Core Team. (2020). R: A language and environment for statistical computing (Vienna, Austria: R Foundation for Statistical Computing). Available at: https://www.R-project.org/.
Raymond W. W., Barber J. S., Dethier M. N., Hayford H. A., Harley C. D. G., King T. L., et al. (2022). Assessment of the impacts of an unprecedented heatwave on intertidal shellfish of the Salish Sea. Ecology 103 (10), 1–7. doi: 10.1002/ecy.3798
Reum J. C. P., Alin S. R., Feely R. A., Newton J., Warner M., McElhany P. (2014). Seasonal carbonate chemistry covariation with temperature, oxygen, and salinity in a fjord estuary: Implications for the design of ocean acidification experiments. PloS One 9. doi: 10.1371/journal.pone.0089619
Ridlon A. D., Wasson K., Waters T., Adams J., Donatuto J., Fleener G., et al. (2021). Conservation aquaculture as a tool for imperiled marine species: Evaluation of opportunities and risks for Olympia oysters, Ostrea lurida. PloS One 16 (6), e0252810. doi: 10.1371/journal.pone.0252810
Rish I. (2001). An empirical study of the naive Bayes classifier. IJCAI 2001 Work. Empir. Methods Artif. Intell 3 (2001), 41–46. doi: 10.1039/b104835j
Ross P. M., Parker L., Byrne M. (2016). Transgenerational responses of molluscs and echinoderms to changing ocean conditions. ICES J. Mar. Sci. 73 (3), 537–549. doi: 10.1093/icesjms/fsv254
Rossi G. S., Tunnicliffe V. (2017). Trade-offs in a high CO2 habitat on a subsea volcano: Condition and reproductive features of a bathymodioline mussel. Mar. Ecol. Prog. Ser. 574, 49–64. doi: 10.3354/meps12196
Ruiz C., Martinez D., Mosquera G., Abad M., Sánchez J. L. (1992). Seasonal variations in condition, reproductive activity and biochemical composition of the flat oyster, Ostrea edulis, from San Cibran (Galicia, Spain). Mar. Biol. 112, 67–74. doi: 10.1007/BF00349729
Sanford E., Gaylord B., Hettinger A., Lenz E. A., Meyer K., Hill T. M. (2014). Ocean acidification increases the vulnerability of native oysters to predation by invasive snails. Proc. R. Soc B Biol. Sci. 281 (1778), 20132681. doi: 10.1098/rspb.2013.2681
Scanes E., Parker L. M., O’Connor W. A., Dove M. C., Ross P. M. (2020). Heatwaves alter survival of the Sydney rock oyster, Saccostrea glomerata. Mar. Pollut. Bull. 158, 111389. doi: 10.1016/j.marpolbul.2020.111389
Schulte P. M. (2015). The effects of temperature on aerobic metabolism: Towards a mechanistic understanding of the responses of ectotherms to a changing environment. J. Exp. Biol. 218, 1856–1866. doi: 10.1242/jeb.118851
Silliman K. E., Bowyer T. K., Roberts S. B. (2018). Consistent differences in fitness traits across multiple generations of Olympia oysters. Sci. Rep. 8 (1), 6080. doi: 10.1038/s41598-018-24455-3
Sokolova I. M., Frederich M., Bagwe R., Lannig G., Sukhotin A. A. (2012). Energy homeostasis as an integrative tool for assessing limits of environmental stress tolerance in aquatic invertebrates. Mar. Environ. Res. 79, 1–15. doi: 10.1016/j.marenvres.2012.04.003
Spencer L. H., Horkan E., Crim R., Roberts S. B. (2021). Latent effects of winter warming on Olympia oyster reproduction and larval viability. J. Exp. Mar. Bio. 542, 151604. doi: 10.1016/j.jembe.2021.151604
Spencer L. H., Venkataraman Y. R., Crim R., Ryan S., Horwith M. J., Roberts S. B. (2020). Carryover effects of temperature and pCO2 across multiple Olympia oyster populations. Ecol. Appl. 30 (3), e02060. doi: 10.1002/eap.2060
Stamps J. A. (2006). The silver spoon effect and habitat selection by natal dispersers. Ecol. Lett. 9, 1179–1185. doi: 10.1111/j.1461-0248.2006.00972.x
Stevens A. M., Gobler C. J. (2018). Interactive effects of acidification, hypoxia, and thermal stress on growth, respiration, and survival of four North Atlantic bivalves. Mar. Ecol. Prog. Ser. 604, 143–161. doi: 10.3354/meps12725
Stott P. A., Christidis N., Otto F. E. L., Sun Y., Vanderlinden J. P., van Oldenborgh G. J., et al. (2016). Attribution of extreme weather and climate-related events. Wiley Interdiscip. Rev. Clim. 7 (1), 23–41. doi: 10.1002/wcc.380
Subasinghe M. M., Jinadasa B. K. K. K., Navarathne A. N., Jayakody S. (2019). Seasonal variations in the total lipid content and fatty acid composition of cultured and wild Crassostrea madrasensis in Sri Lanka. Heliyon 5 (2). doi: 10.1016/j.heliyon.2019.e01238
Sultan S. E. (2000). Phenotypic plasticity for plant development, function and life history. Trends Plant Sci. 5 (12), 537–542. doi: 10.1016/S1360-1385(00)01797-0
Thom R., Gaeckle J., Buenau K., Borde A., Vavrinec J., Aston L., et al. (2018). Eelgrass (Zostera marina L.) restoration in Puget Sound: development of a site suitability assessment process. Restor. Ecol. 26 (6), 1066–1074. doi: 10.1111/rec.12702
Thyrring J., Rysgaard S., Blicher M. E., Sejr M. K. (2015). Metabolic cold adaptation and aerobic performance of blue mussels (Mytilus edulis) along a temperature gradient into the High Arctic region. Mar. Biol. 162, 235–243. doi: 10.1007/s00227-014-2575-7
Todgham A. E., Stillman J. H. (2013). Physiological responses to shifts in multiple environmental stressors: Relevance in a changing world. Integr. Comp. Biol. 53, 539–544. doi: 10.1093/icb/ict086
Waldbusser G. G., Salisbury J. E. (2014). Ocean acidification in the coastal zone from an organism’s perspective: Multiple system parameters, frequency domains, and habitats. Ann. Rev. Mar. Sci. 6, 221–247. doi: 10.1146/annurev-marine-121211-172238
Wallace R. B., Baumann H., Grear J. S., Aller R. C., Gobler C. J. (2014). Coastal ocean acidification: The other eutrophication problem (Estuar). doi: 10.1016/j.ecss.2014.05.027
Washington Sea Grant. (2021). Impacts from the Summer 2021 Heatwave on Washington Shellfish (WSG News Blog).
Washington State Blue Ribbon Panel on Ocean Acidification. (2012). Ocean Acidification: From Knowledge to Action (Washington State’s Strategic Response).
Wilkie E. M., Bishop M. J. (2012). Differences in shell strength of native and non-native oysters do not extend to size classes that are susceptible to a generalist predator. Mar. Freshw. Res. 63, 1201–1205. doi: 10.1071/MF12078
Xu X., Yang F., Zhao L., Yan X. (2016). Seawater acidification affects the physiological energetics and spawning capacity of the Manila clam Ruditapes philippinarum during gonadal maturation. Comp. Biochem. Physiol. -Part A Mol. Integr. Physiol. 196, 20–29. doi: 10.1016/j.cbpa.2016.02.014
Keywords: bivalve, parental investment, larvae, metabolic rate, stable isotopes, reproduction, acclimatization, tolerance
Citation: Alma L, McElhany P, Crim RN, Newton JA, Maher M, Mickett JB and Padilla-Gamiño JL (2024) Phenotypic plasticity and carryover effects in an ecologically important bivalve in response to changing environments. Front. Mar. Sci. 11:1178507. doi: 10.3389/fmars.2024.1178507
Received: 02 March 2023; Accepted: 05 February 2024;
Published: 13 March 2024.
Edited by:
Anthony (Tony) John Hickey, The University of Auckland, New ZealandReviewed by:
Simon Morley, British Antarctic Survey (BAS), United KingdomKatja Anttila, University of Turku, Finland
Brett Dumbauld, United States Department of Agriculture (USDA), United States
Copyright © 2024 Alma, McElhany, Crim, Newton, Maher, Mickett and Padilla-Gamiño. This is an open-access article distributed under the terms of the Creative Commons Attribution License (CC BY). The use, distribution or reproduction in other forums is permitted, provided the original author(s) and the copyright owner(s) are credited and that the original publication in this journal is cited, in accordance with accepted academic practice. No use, distribution or reproduction is permitted which does not comply with these terms.
*Correspondence: Lindsay Alma, lindsay.m.alma@gmail.com