Density and abundance estimates of cetaceans in the Black Sea through aerial surveys (ASI/CeNoBS)
 Romulus-Marian Paiu1,2*
  Ana Cañadas3*
  Ayhan Dede4,5
  Galina Meshkova6
  Dumitru Murariu2
  Ayaka Amaha Ozturk4,5
  Dimitar Popov6,7
  Arda M. Tonay4,5 Costin Timofte1
  Natia Kopaliani8
  Pavel Gol’din9,10*
  Simone Panigada11
- 1Mare Nostrum NGO, Constanta, Romania
- 2Faculty of Biology, Bucharest University, Bucharest, Romania
- 3Marine Geospatial Ecology Lab, Duke University, Durham, NC, United States
- 4Faculty of Aquatic Sciences, Istanbul University, Istanbul, Türkiye
- 5Turkish Marine Research Foundation, Istanbul, Türkiye
- 6Green Balkans NGO, Plovdiv, Bulgaria
- 7Department of Zoology, Faculty of Biology, Plovdiv University, Plovdiv, Bulgaria
- 8Institute of Ecology, Ilia State University, Tbilisi, Georgia
- 9Schmalhausen Institute of Zoology, National Academy of Sciences of Ukraine, Kyiv, Ukraine
- 10Ukrainian Centre of Ecology of the Sea, Odesa, Ukraine
- 11Tethys Research Institute, Milan, Italy
Introduction: Population abundance is amongst the most basic and crucial parameters for the assessment of conservation status of any species. Three species of odontocetes, all represented by local subspecies, inhabit the Black Sea: the Black Sea common dolphin Delphinus delphis ponticus, the Black Sea bottlenose dolphin Tursiops truncatus ponticus, and the Black Sea harbour porpoise Phocoena phocoena relicta. Their populations are threatened by multiple factors, including overfishing of their prey, bycatch, pollution and epizootics. Despite this, there are no basinwide estimates for any cetacean species in the Black Sea.
Methods: In 2019, a systematic study was carried out under the EU CeNoBS project. Six strata were designed in the waters of Bulgaria, Georgia, Romania, Türkiye and Ukraine, covering most of territorial and offshore waters, which were surveyed between June 19 and July 4. A line transect distance sampling approach was used, following predefined transects within each stratum, achieving a 5% coverage of the surveyed area. A total of 7,344 kilometres of transects were surveyed recording a total of 1,744 cetacean sightings. Design-based abundance estimates were obtained using a Multiple Covariate Distance Sampling (MCDS) approach. Model-based abundance estimates were also derived using a Generalized Additive Models (GAM) approach, linking species sightings with a number of environmental covariates (e.g., bathymetric features, sea surface temperature, chlorophyll-a) over a grid of 10x10 km.
Results and discussion: The uncorrected (for perception and availability bias) estimates obtained through the model-based analysis were 108,283 (CV=0.07) common dolphins, 22,720 (CV=0.15) bottlenose dolphins and 93,808 (CV=0.06) harbour porpoises. These aerial surveys yielded the first insights on overall abundance, density and distribution, providing current regional baseline values and density maps for all three cetacean species of the Black Sea during the summer months, to be used for the elaboration of effective conservation measures and to address national and international requirements.
1 Introduction
The Black Sea is a semi-enclosed sea, connected to the Mediterranean Sea only with the narrow Istanbul Strait, and the world largest meromictic water body with an oxygen-depleted deep layer, known as a unicum hidrobiologicum due to its unique physico-chemical properties (Vespremeanu, 2007; Bologa, 2015) and highly vulnerable marine ecosystem (Zaitsev and Mamaev, 1997; Daskalov, 2003). Monitoring and assessing environmental status (based on the ecosystem’s biodiversity, functions and services) is crucial to ensure the long-term sustainability of the Black Sea. Cetaceans are apex predators that may be keystone species with a structuring role within ecosystems and the food webs (Power et al., 1996).
Three species of small odontocetes inhabit the Black Sea and adjoining Marmara and Azov Seas (Zalkin, 1938b; Barabash-Nikiforov, 1940; Zalkin, 1940; Kleinenberg, 1956; Tomilin, 1957; Antonescu, 1966; Öztürk and Öztürk, 1996; Gol’din, 2004; Viaud-Martinez et al., 2007; Birkun, 2008b; Notarbartolo di Sciara and Tonay, 2021; Fontaine et al., 2012; Murariu, 2012; Birkun et al., 2014; Ben Chehida et al., 2020), each represented by an endemic subspecies, the Black Sea common dolphin (Delphinus delphis ponticus Barabasch, 1935), the Black Sea common bottlenose dolphin (Tursiops truncatus ponticus Barabash-Nikiforov, 1940), and the Black Sea harbour porpoise (Phocoena phocoena relicta Abel, 1905).
Based mostly on indirect evidence, such as risk assessment and observations of mass mortality or some local surveys, these populations are characterised by IUCN (https://www.iucnredlist.org/) as either Endangered or Vulnerable (Birkun, 2008a; Birkun and Frantzis, 2008; Birkun, 2012). All three cetacean species are listed under Annex IV of the EU Habitats Directive 92/43/EEC, while the harbour porpoise and bottlenose dolphins are listed under Annex II as well. It is believed that a number of threats, including past direct takes, habitat degradation, depletion of prey stocks and zoonoses, had already led to drastic declines by the end of 1980s (Birkun, 2002a; Daskalov, 2003). This, plus the ongoing high cetacean bycatch rates (Tonay, 2016; Popov et al., 2020; Aiken et al., 2023; Popov et al., 2023), emphasises the urgent need for new data on the status of Black Sea cetaceans and the threats they face. Also, this means that they require strict protection and their key habitats to be designated as Special Areas of Conservation (SACs) within the NATURA 2000 network.
A robust estimate of population abundance (or ideally a series of such estimates over time) is one of the fundamental parameters needed for assessing conservation status. In the 1970s and 1980s, abundance estimates were extrapolated from partial surveys to the entire Black Sea (Zemsky and Yablokov, 1974; Çelikkale et al., 1989). More comprehensive historical records had been collected for cetacean distribution by the 1980s (Zalkin, 1938a; Freiman, 1950; Kleinenberg, 1956; Danilevsky et al., 1978; Mikhalev, 2005a; Mikhalev, 2005b; Mikhalev, 2008). Since 2000, research on the distribution and abundance of cetaceans in the Black Sea has been increasing, but covering mostly local areas and the coastal waters (Birkun et al., 2003; Birkun et al., 2004; Birkun et al., 2006; Dede and Tonay, 2010; Birkun et al., 2014; Kopaliani et al., 2015; Panayotova and Todorova, 2015; Gladilina and Gol’din, 2016; Gladilina et al., 2017; Panayotova et al., 2017; Akkaya Baş et al., 2019; Paiu et al., 2019; Uludüz et al., 2020; ANEMONE, 2021; Popov et al., 2021; Paiu et al., 2021a). Prior to the surveys reported here, the latest large scale abundance estimation was made in 2013, when an aerial survey, as well as a ship survey, was coordinated along the NW Black Sea (Birkun et al., 2014) covering Bulgarian, Romanian and Ukrainian (partially) waters.
The EU Marine Strategy Framework Directive (hereinafter MSFD) and the EU Water Framework Directive (WFD) are components of a suite of environmental controls linked to the Directives related to the environment (Borja et al., 2010). The MSFD established a framework for the development of measures designed to achieve the “Good Environmental Status” (GES) in the marine environment, using 11 qualitative descriptors. Descriptor 1 requires that biological diversity is maintained and that the quality and occurrence of habitats and the distribution and abundance of species are in line with prevailing physiographic, geographic, and climatic conditions (Palialexis et al., 2019). The main aim of this paper is to provide a regional assessment of abundance (D1C2) and distribution (D1C4) of cetacean populations, to fill gaps and provide baseline data at the Black Sea regional scale.
In 2019, in cooperation and with support from the Agreement on the Conservation of Cetaceans of the Black Sea, Mediterranean Sea and contiguous Atlantic Area (ACCOBAMS), within the framework of the ACCOBAMS Survey Initiative (ASI, ACCOBAMS, 2021a; ACCOBAMS, 2021b), the “Support MSFD implementation in the Black Sea through establishing a regional monitoring system of cetaceans (D1) and noise monitoring (D11) for achieving Good Environmental Status” CeNoBS project has implemented an aerial survey to assess cetacean density and abundance in the Black Sea, using robust methods. Standardised protocols were used to facilitate data comparison and to create a baseline of abundance and distribution data which will allow future analyses of trends in space and time. A robust analytical modelling framework was applied to the dataset and is reported in the present article.
2 Materials and methods
Distribution and abundance were assessed using agreed protocols for a regional aerial survey (e.g., Hammond et al., 2002, 2013 and Hammond et al., 2017). Aerial surveys allow large areas to be covered in a short period of time, which is especially important in places, such as the Black Sea, known for rough sea conditions and the capacity of going from 0 (calm sea) to 5 (rough sea) Beaufort wind force scale quickly. The collected data were analysed to estimate abundance, density and assess distribution of the different species, using both model-based and design-based analytical frameworks (see section 2.3 and 2.4).
The aerial survey was conducted using two small twin-engined planes, Cessna 337, with high wings and bubble windows, to allow the observers to view the trackline below the plane. One plane surveyed the waters of Bulgaria, Romania and Ukraine, and the other one surveyed the waters of Georgia and Türkiye. Flights were conducted during daytime in good weather and sea states <4 on the Beaufort wind force scale.
2.1 Study area and timeframe
The survey covered the waters of Bulgaria, Georgia, Romania, Türkiye, and Ukraine, in total 52% of the of Black Sea (Supplementary Figure S1). The survey was conducted between June 19th and July 4th, 2019.
2.2 Survey design and data collection
Distance sampling methods were used following pre-determined transects with a random start, designed to ensure an equal coverage probability and representation of the study area (Buckland, 2001; Buckland, 2004; Thomas et al., 2010; Buckland et al., 2015). This standardised approach has been used in several other regional contexts e.g., Hammond et al. (Hammond et al., 2002, 2013 and 2017) and the ASI project (ACCOBAMS, 2021a; ACCOBAMS, 2021b; Cañadas et al., 2023; Panigada et al., 2024). For each stratum, an equal spaced zigzag design was selected (using the dedicated software Distance 7.3; Thomas et al., 2010) taking into account depth contours and the coastline to ensure sampling across the gradient of expected cetacean density. The strata boundaries represented the best compromise amongst oceanographic zones, bathymetric characteristics and political/jurisdictional constraints. The selected tracks allowed a final coverage of 5% for all the areas.
The target altitude was 183 m (600 feet), as is customary for small cetacean surveys, with a target speed of 100 knots (e.g., see Hammond et al., 2002 and ACCOBAMS, 2021a). The survey was conducted in passing mode (i.e., not diverting from the trackline when sightings were made) unless it was deemed necessary to close with the sighting to obtain reliable estimates of group size or confirm species identity. In such cases, the survey was resumed at the exact point it was left. ‘Secondary sightings’ (i.e., the additional sightings made after leaving the predetermined trackline) were recorded but not used to obtain the abundance and density estimates.
For each sighting, a minimum of species identity, group size, and declination angle to the sighting – when abeam - were recorded. Where possible, group composition (adults and calves), direction of swimming and group behaviour were also recorded. An overall subjective assessment of the detection conditions (i.e., “excellent”, “good”, “moderate” or “poor”, hereafter referred to as “Sightability score”) for each observer was also recorded where, as an instance, “good” conditions corresponded to an observer perceiving the likelihood of spotting a small delphinid within the searching area (within approx. 300 m from the track line) to be good (e.g., Beaufort wind scale ≤ 2, turbidity < 2 and glare moderate, good or absent). The variables collected were the sea state (Beaufort wind force scale), glare, cloud cover, turbidity and a subjective assessment of overall detectability conditions. Additional information such as the presence of human activities was also recorded.
All data were recorded on a laptop with software (SAMMOA 1.1.2), dedicated to data acquisition on marine megafauna from visual observations during aerial surveys. SAMMOA is connected to a GPS and has a simultaneous audio recording system. The flight plan and tracklines were programmed before take-off, along with observers’ position onboard. The software also allowed data validation based on the voice recordings associated with each observation. The plane’s position, speed and altitude were continuously recorded through a GPS and the angle to each sighting was measured with a clinometer.
2.3 Design-based analysis
Analysis of the data followed standard line transect distance sampling methodology (Buckland, 2001). Density of animals (D) was estimated as:
where is the estimated density, n is the number of sightings of groups, si is the group size for sighting i, L is the total length of transect searched under acceptable conditions and f(0|zi) represents the probability density function of the perpendicular distance [f(0)] given the covariates zi.
Abundance was estimated as:
where A is the size of the survey area.
The design-based analysis was performed in R (R Core Team, 2017), with an ad-hoc script prepared for this dataset, using package Distance (Miller et al., 2019). Segments of tracks and sightings with sea state 4 (Beaufort wind force scale) or above were excluded from the analysis. Detection functions were fitted to the perpendicular distance data to estimate the effective strip half-width, esw. Multi-Covariate Distance Sampling methods were used to allow detection probability to be modelled as a function of other covariates, additional to perpendicular distance from the transect line Marques et al., 2007). These covariates were defined in the survey design phase and are shown in Supplementary Table S1.
After exploration of the data (histograms of perpendicular distances), it was clear that left truncation was necessary only for Black Sea bottlenose dolphins (40 m) and for Black Sea harbour porpoise (50 m). Given that the planes used bubble windows and there was visibility under the plane, the reduced number of sightings in those first metres from the trackline could be due to observer behaviour (tending to look further away rather than closer to the track line), although this did not happen with common dolphins. The left truncation was treated as a strip transect, where the probability of detecting is considered uniform, at the same level of the chosen left truncation. This means that the detection functions treats the strip as a proper left truncation, but during abundance estimation those observations are taken into account and given the probability of detection at the 40 m distance for Black Sea bottlenose dolphins and 50 m for Black Sea harbour porpoise, including those distances in the effective strip width. It is important to highlight, however, that treating left truncation as a strip transect in a detection function could potentially mean an overestimation of the probability of detection close to the trackline, creating therefore a potential slight underestimation of the abundance estimate.
Different right truncation distances were also tested. A compromise between the comparison of the diagnostics of each of the different truncation distances and the percentage of data lost in each one was considered to decide on the final right truncation. The diagnostics used were the qq-plots and the Cramér-von Mises diagnostics. The final right truncation distances were: 511 m for Black Sea common dolphins, 482 m for Black Sea harbour porpoises and 312 m for Black Sea bottlenose dolphins. Considering both left and right truncation, the number of observations discarded for modelling the detection function were 2 (0.3%) for Black Sea common dolphins, 116 (14.74%) for Black Sea harbour porpoises and 13 (11.93%) for Black Sea bottlenose dolphins. Considering only right truncation, the number of observations discarded for the model-based analysis were 2 (0.3%) for Black Sea common dolphins, 5 (0.64%) for Black Sea harbour porpoise, and 4 (3.67%) for Black Sea bottlenose dolphins.
The best functional form (Hazard Rate model) of the detection function and the covariates retained by the best fitting models were selected based on model fitting diagnostics: AIC, goodness of fit tests, Q-Q plots, and inspection of plots of fitted functions.
2.4 Model-based analysis
Density surface models were produced by modelling species abundance as a function of environmental covariates. These were derived from a large number of data sources and included variables such as water depth (m), distance to the several depth contours (as proxies for coastal, continental shelf, oceanic habitats, etc.), distance to canyons and seabed slope. As indices of marine hydrology and/or biological activity/primary productivity, variables such as sea surface temperature and levels of chlorophyll-a were examined. For a complete list of variables used, see Supplementary Table S2.
All on-effort transects (i.e., where searching conditions were acceptable) were divided into segments (mean=10.1 km) with homogeneous effort types, and under the assumption that little variability in physical and environmental features occurred. Each segment was associated with the values of the covariates of the specific cell (10 x10 km) in which their centroid fell. As for the design-based method, segments of tracks and sightings with sea state more than 3 (or, for the harbour porpoise, more than 2) were excluded from the analysis, as were sightings beyond the truncation distances for each species. All estimates were produced for each individual strata, as well as for the whole study area (all strata pooled together).
The count of animals in each segment was used as the response variable. The abundance of animals was modelled using a Generalized Additive Model (GAM) with a logarithmic link function, and a Tweedie error distribution. The general structure of the model was:
where ni is the number of animals in the ith segment, the offset ai is the effective search area for the ith segment (calculated as the length of the segment multiplied by twice the effective strip half-width – esw), Θ is the intercept, fk are smoothed functions of the explanatory covariates, and zik is the value of the kth explanatory covariate in the ith segment. The esw was obtained for each species/species group from their detection function, according to the covariates included in it.
An exploration of correlations was performed amongst covariates. As a result, “families” of covariates were created such that only one element of each family could be tested in each model. Supplementary Figure S2 shows the collinearity plots resulting for fixed and dynamic covariates. All correlations equal or above 0.7 were considered as collinear and therefore not used together in the same model. REML (Restricted maximum likelihood) was used to fit the models. Shrinkage smoothers were also used in all models, which reduces the effective degrees of freedom to zero if a covariate explains little variation in the data. A full model (including all covariates) was run. Using REML and shrinkage smoothers, the non-useful covariates were discarded, reducing it only to the covariates to be tested in the final models. The final models were run using all the potential combinations of the “useful” covariates selected by REML and the shrinkage smoothers from the full model, sequentially testing each covariate from each collinear family. The resulting models were judged and ranked automatically by AIC avoiding time consuming and potentially unreliable manual selection.
Two sets of models were run for each species; one allowing for the inclusion of the two-dimension spatial smoothness of the interaction between Longitude and Latitude (“LonLat” from now on), and another one not allowing it. The rationale behind this is that very often the inclusion of the LonLat improves the fit of the model and the precision of the prediction, being responsible for a large proportion of the deviance explained by the model. This is the most desirable output if your model is predictive (as are ours), and you try to obtain the best possible estimate of density and spatial distribution of the species, as opposed to an explanatory model where the objective is to explain the causes of the observed distribution. However, sometimes it is interesting to explore which environmental covariates would allow a good model, without the help of LonLat.
Abundance of animals in each grid cell was estimated by multiplying the predicted density of animals from the model by the surface area of the grid cell. The total abundance estimates for the whole study area and for each stratum were obtained by summing up the abundance of all the grid cells within the target study area.
Variance of abundance was estimated by a parametric bootstrap procedure (“posterior simulation”). This method generates bootstrap replicates based on resampling the parameters of the best fitting model, instead of resampling the data itself. The delta method was used to combine the CV from the bootstrap with the CV from the detection function and from the model. The 95% CIs were obtained using the final CV and assuming the estimates were lognormally distributed. All modelling was carried out using the statistical software R (R Core Team, 2017) using the mgcv package (Wood, 2011), within an ad hoc script created for this dataset.
3 Results
A total of 1,744 cetacean sightings were recorded (Paiu et al., 2021b), with 3,669 individuals from three species (two delphinids and one phocoenid: this order will be kept along the sections) in the study area (Table 1). A total of 12,387.25 kilometers was surveyed by the two planes in the different strata, with 7,324.1 km on effort and 5,063.15 km off effort, as summarised in Table 2. All the analysis and results presented are reflecting the surveyed area (52%) and are not being extrapolated to the rest of 48% of the Black Sea area.

Table 1 Total number of sightings and individuals observed during the aerial surveys.
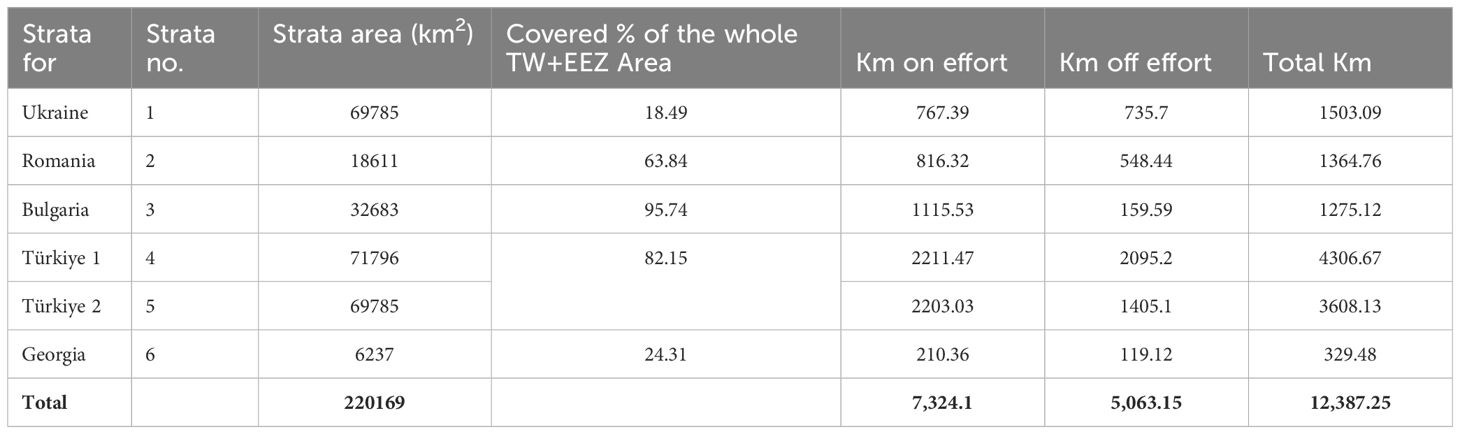
Table 2 Total number of kilometres covered per strata on-effort and off-effort.
3.1 Design-based analysis
The final detection functions chosen for each species and their diagnostics are presented in Supplementary Table S3; Supplementary Figures S3–S5. For common dolphins, the covariates retained in the model were glare under the aircraft, aircraft name and sea state as a factor; for bottlenose dolphins, the only covariate retained was turbidity; for harbour porpoises the final covariates were swell, glint and aircraft name.
The abundance estimates obtained with the design-based analysis for the three species of cetaceans are shown in Tables 3–5. In these tables, “mean group size” is the mean of the observed group sizes, while “expected group size” is the result of dividing the estimated abundance of individuals by the estimated abundance of groups.

Table 3 Results of the design-based analysis for Black Sea common dolphins.
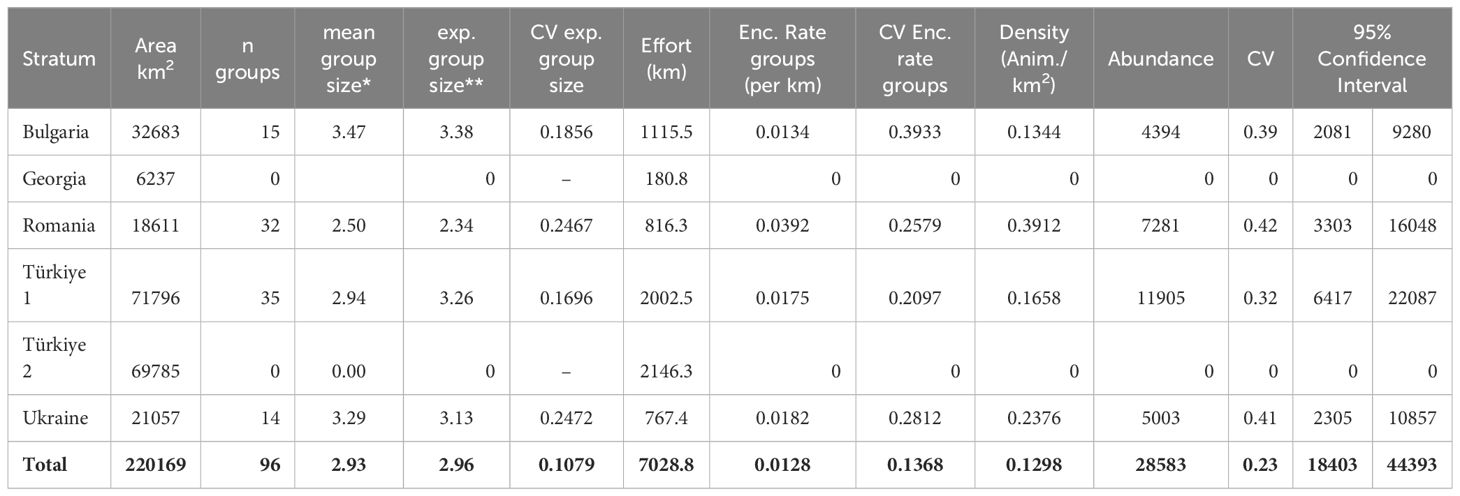
Table 4 Results of the design-based analysis for Black Sea bottlenose dolphins.
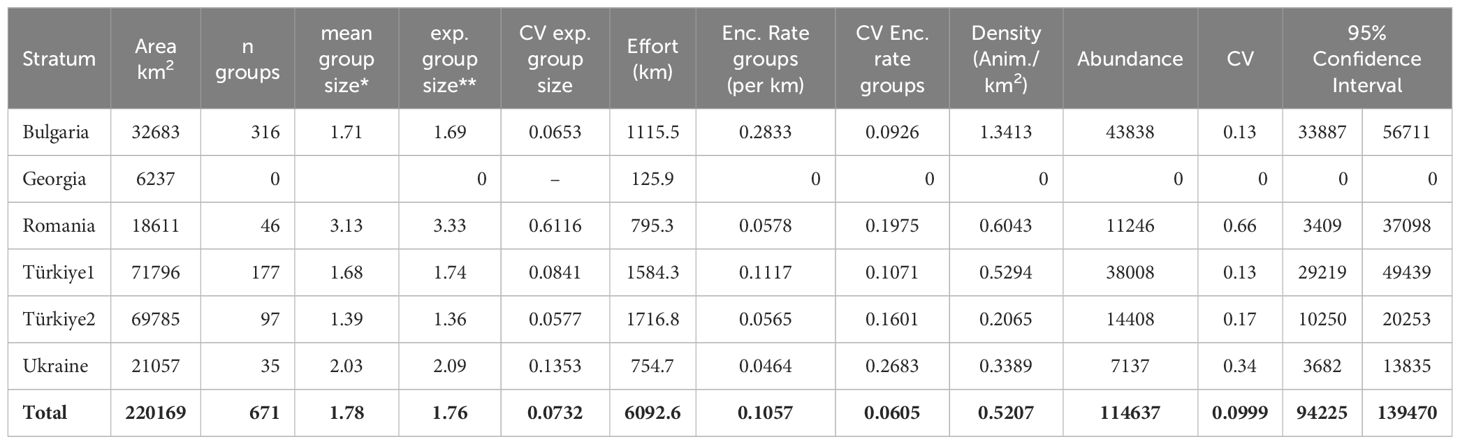
Table 5 Results of the design-based analysis for Black Sea harbour porpoises.
3.2 Model-based analysis
The parameters and selected covariates for the density surface modelling for each species are presented in Table 6.
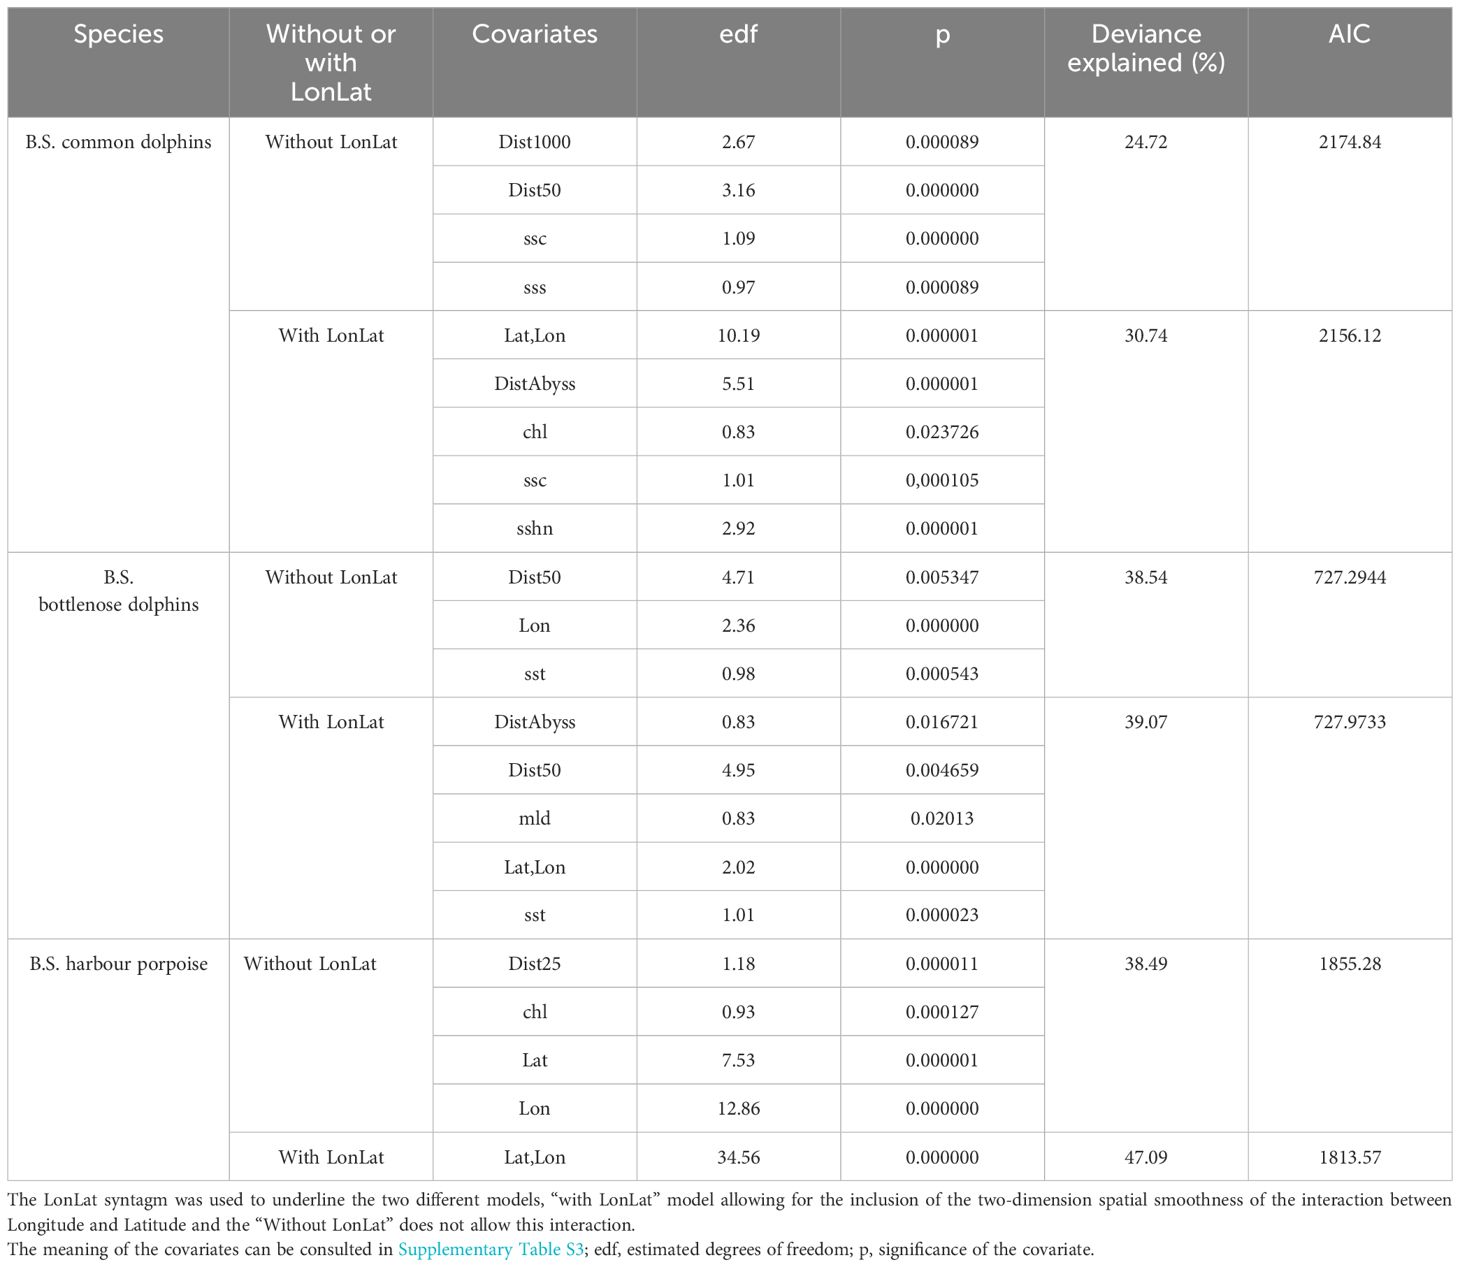
Table 6 Density surface modelling results.
Black Sea common dolphins, which were expected to be the most observed species, were the second most frequently encountered species (Figure 1) with 715 sightings. When it comes to the recorded number of animals, with 1,762 individuals, the species ranks first.
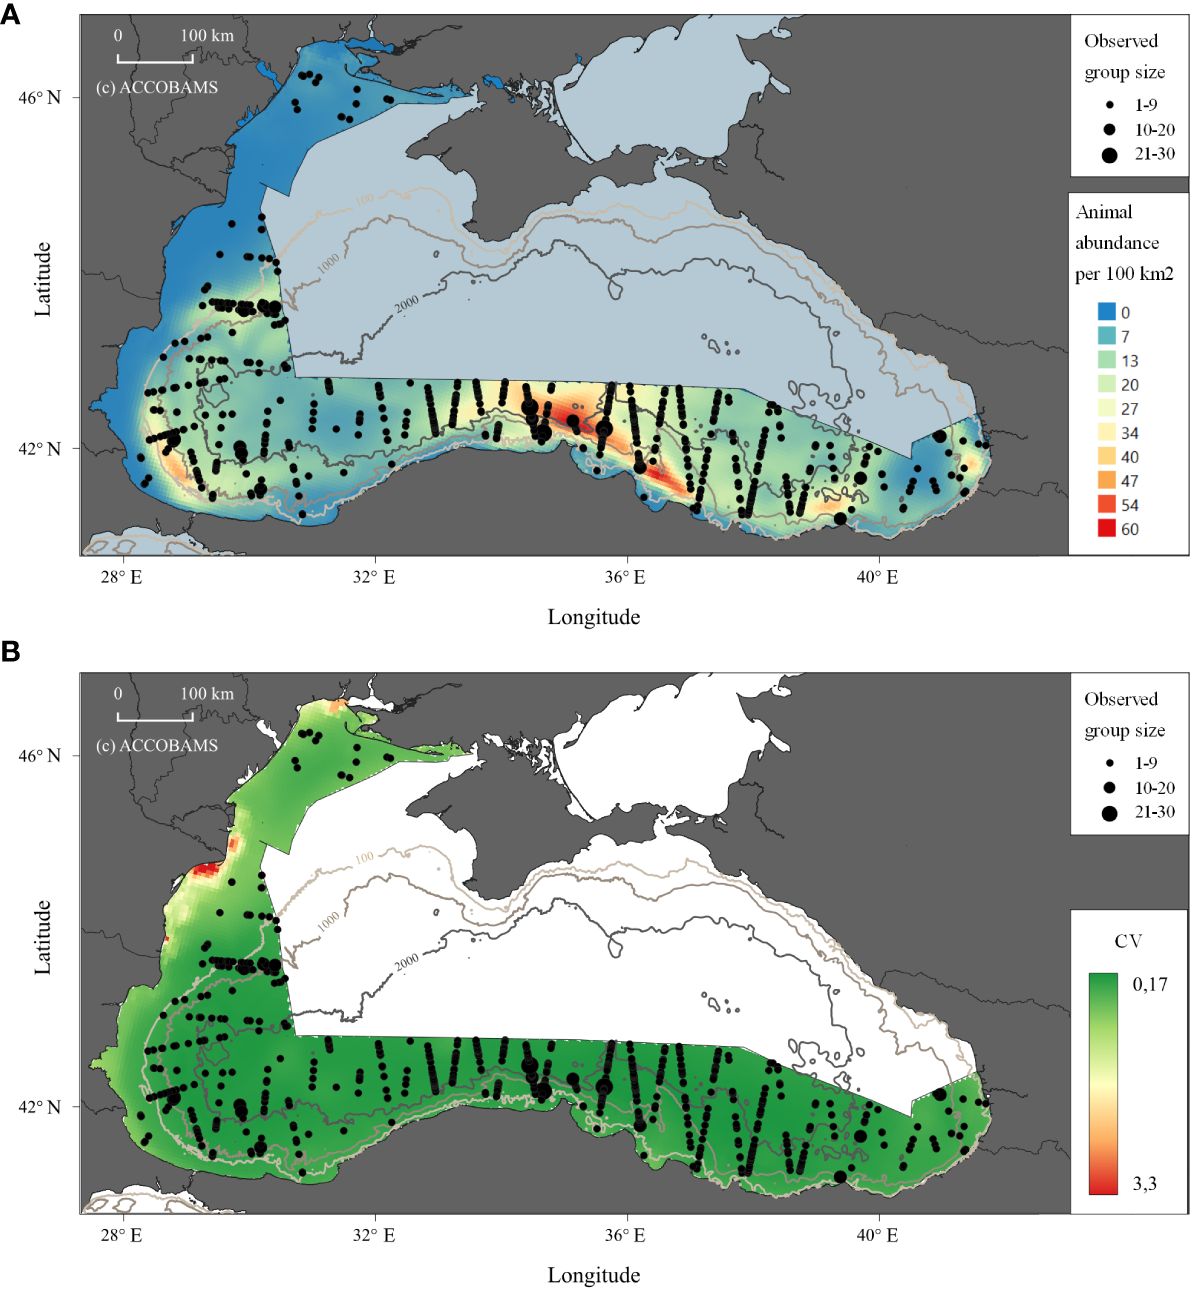
Figure 1 Prediction of abundance of animals for Black Sea common dolphins modelling in the study area. (A) Density shown as the animal abundance/100km2. (B) CV for the density.
Black Sea bottlenose dolphins were the least frequently observed species during the aerial survey (Figure 2), with 117 sightings, totalling 335 individuals.
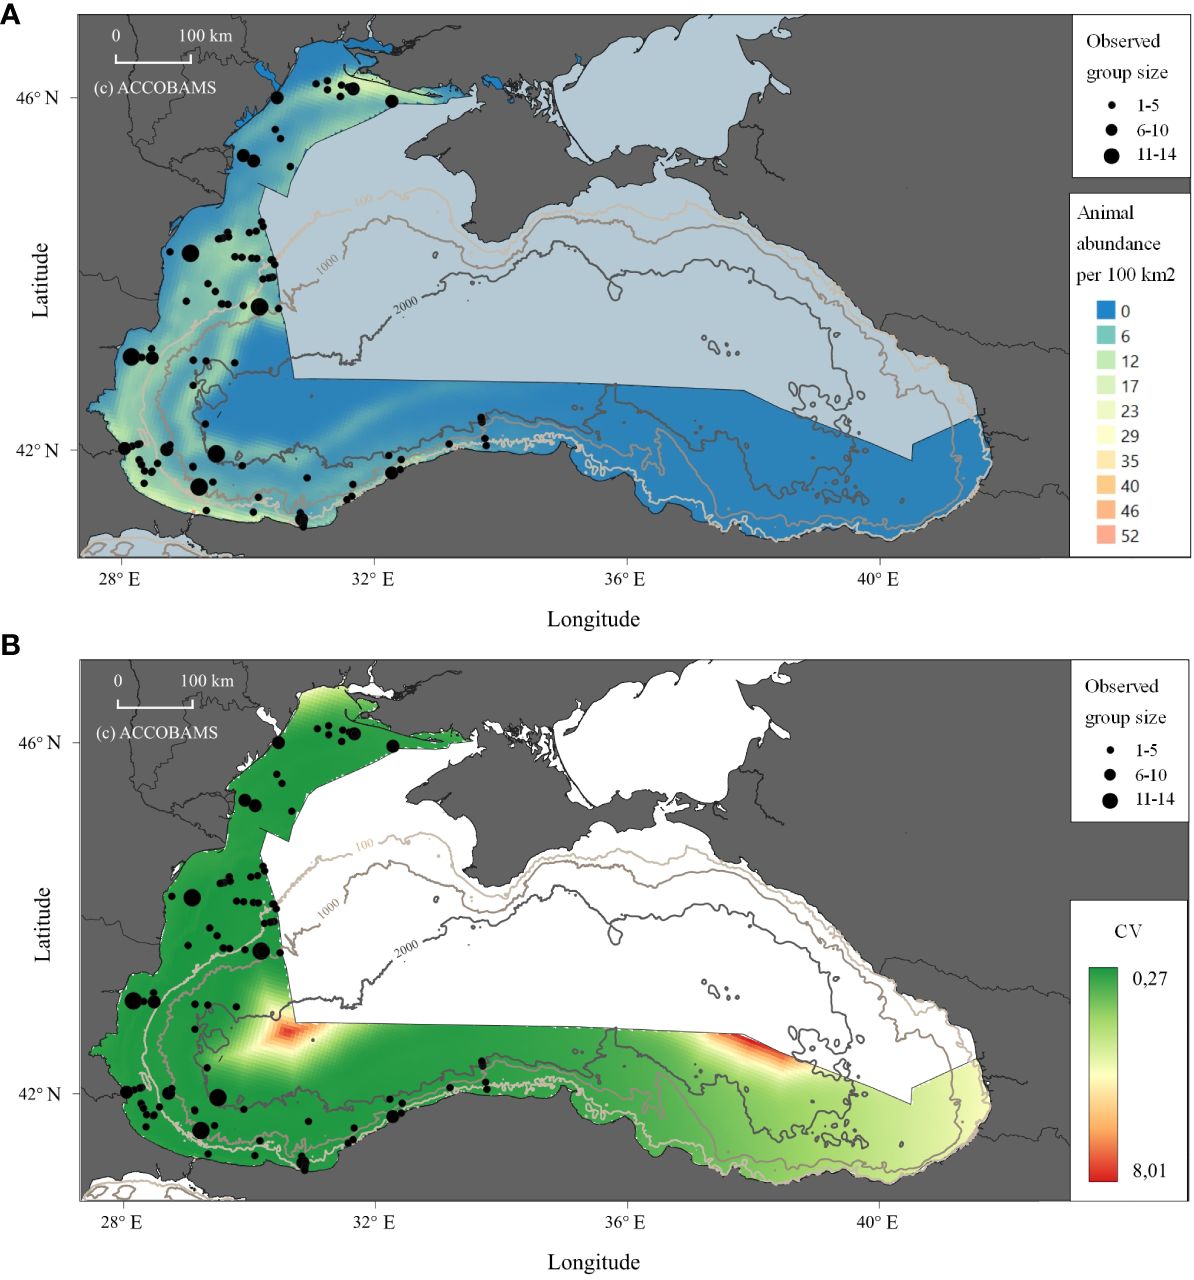
Figure 2 Prediction of abundance of animals for Black Sea bottlenose dolphins in the study area. (A) Density shown as the animal abundance/100km2. (B) CV for the density.
Black Sea harbour porpoises were the most frequently observed species, with 884 sightings (1,522 individuals). Based on the recorded sightings, a prediction of abundance maps was created (Figure 3), in which one of the historical hotspots was identified, within the Western Black Sea area, in Bulgarian and Romanian waters (details in the next section).
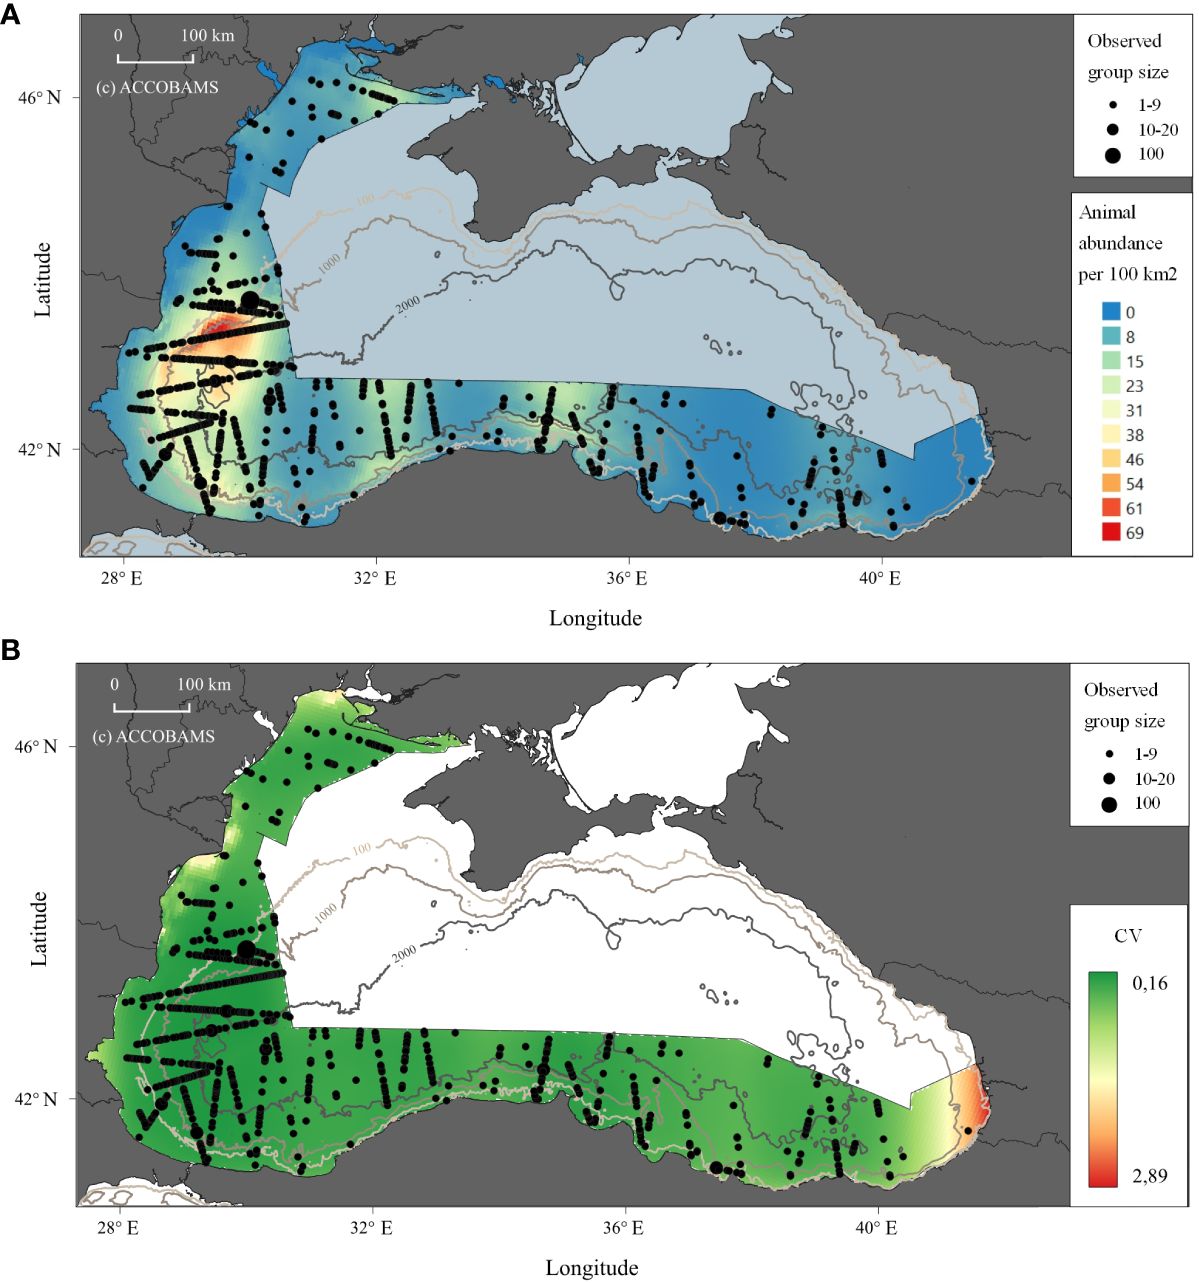
Figure 3 Prediction of abundance of animals for Black Sea harbour porpoises in the study area. (A) Density shown as the animal abundance/100km2. (B) CV for the density.
Tables 7–9 show the results of abundance estimates for the model-based analysis for each species, with and without spatial covariates. Thus, the uncorrected (for perception and availability bias) estimates obtained through the model-based analysis were 108,283 (CV=0.07) (model with LonLat) common dolphins, 22,720 (CV=0.15) (model without LonLat) bottlenose dolphins and 93,808 (CV=0.06) (model without LonLat) harbour porpoises. The best models for common dolphins and bottlenose dolphins were chosen based on the AIC. For harbour porpoises, none of the models with LonLat were significant, except using only LonLat, which caused a strong edge effect, reason for which it was discarded (also gave a higher estimate: 104,567 than all the other models ranging from 88,000 to 93,000). Therefore, the second best model was chosen based on the AIC (Table 6).
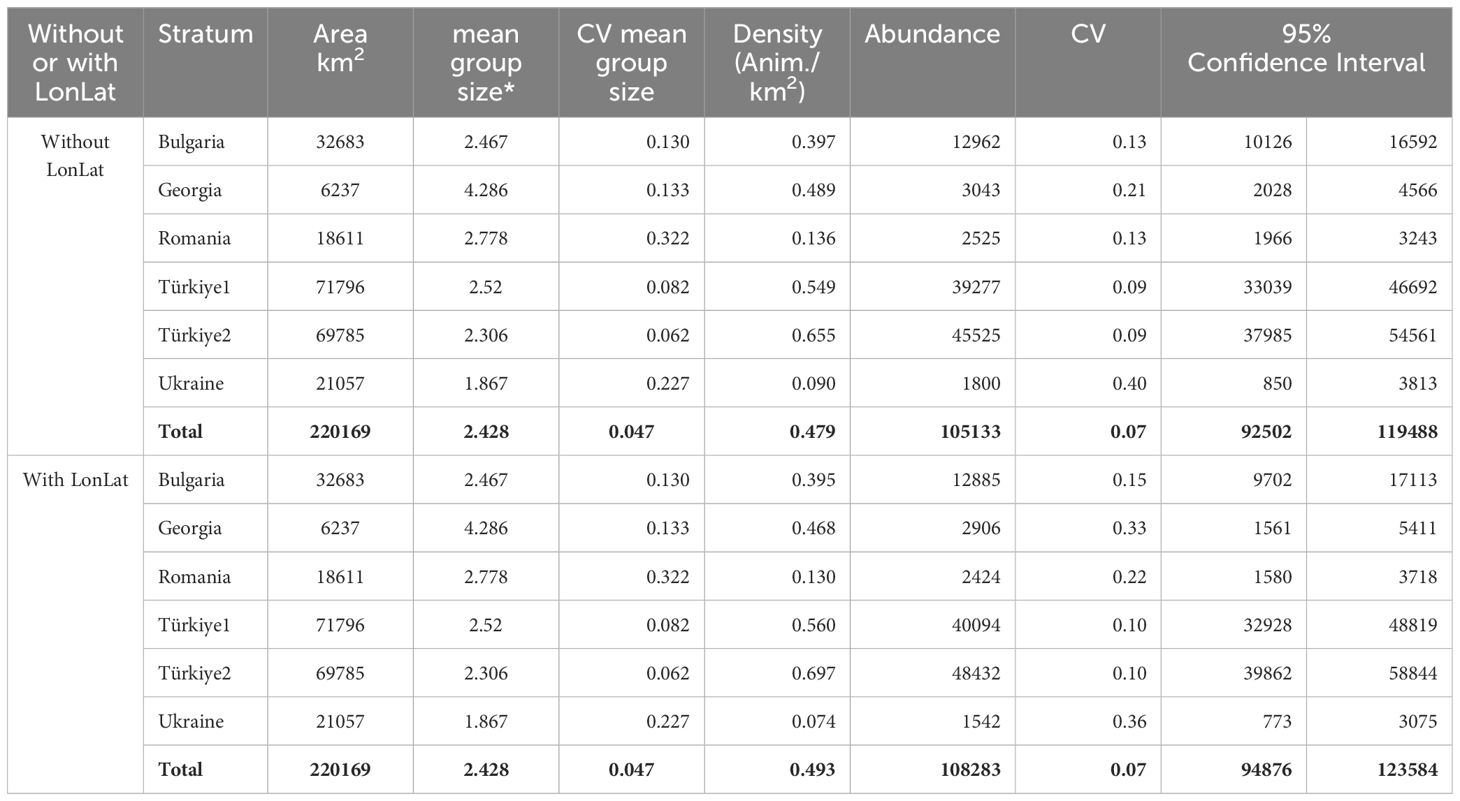
Table 7 Results of the model-based analysis for Black Sea common dolphins.
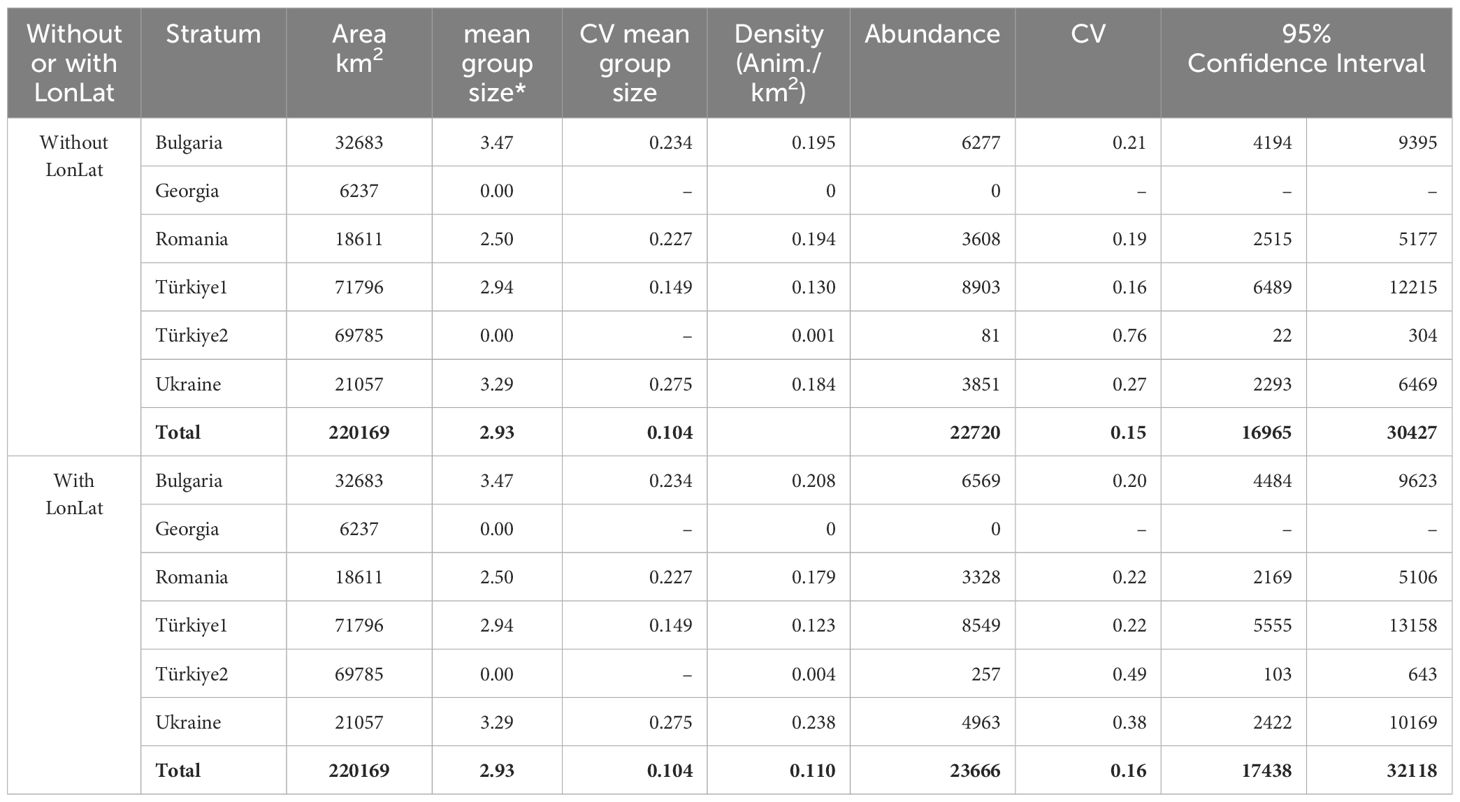
Table 8 Results of the model-based analysis for Black Sea bottlenose dolphins.
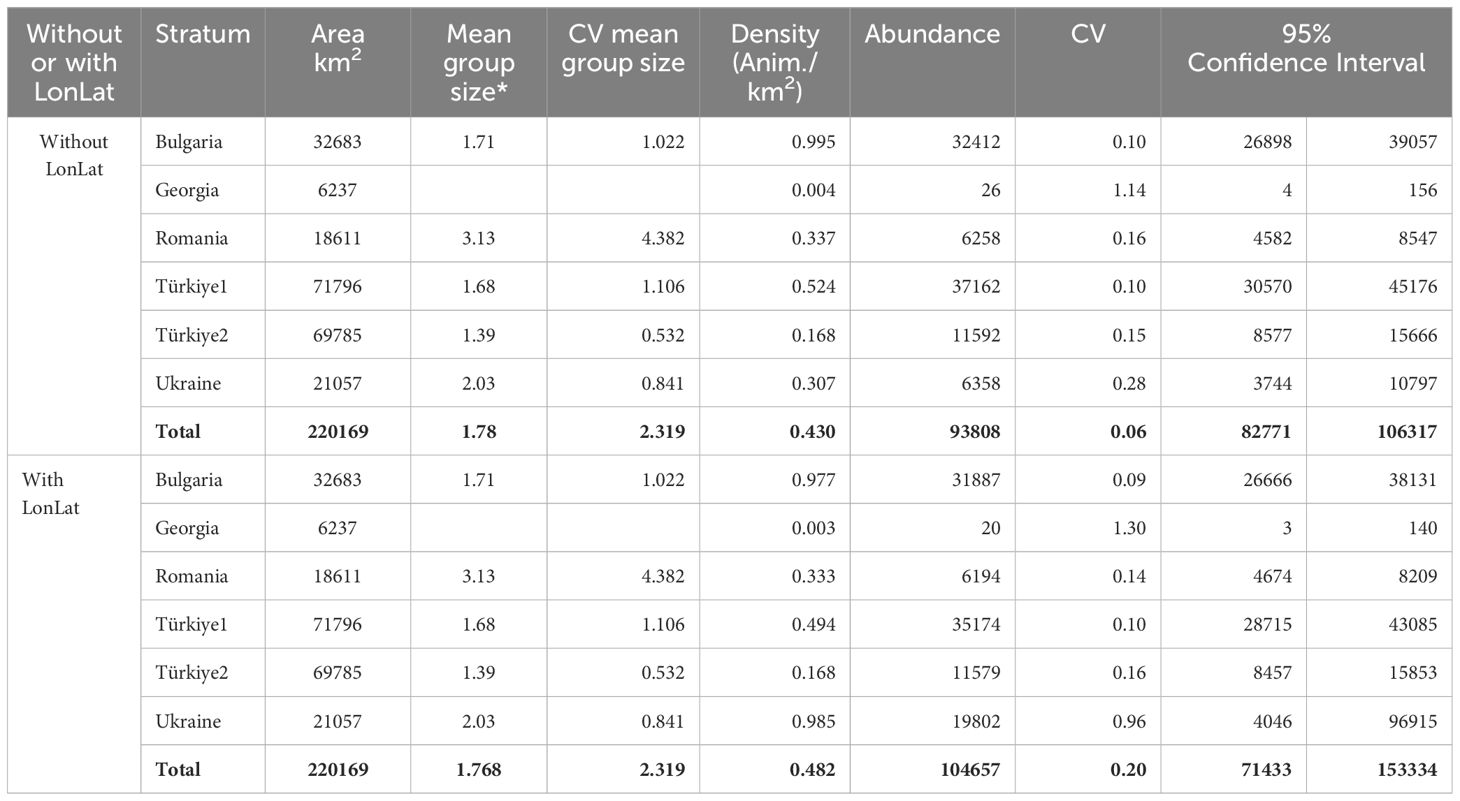
Table 9 Results of the model-based analysis for harbour porpoise.
4 Discussion
4.1 Methodological considerations
The observations, abundance estimates and data on distribution shown here represent solely the data for the survey area (52% of the whole Black Sea) and are not extrapolated in any way on the whole Black Sea. Also, data from this study characterise a single time period, two weeks during the summer 2019, and are not extrapolated to other seasons or years. The models of animal distribution used by us do not intend to be “explanatory” models, and here we recognise that most physical covariates used by us are proxies for other important processes, such as prey density. However, our models are “predictive”, which means that we use the covariates available to us (including geographic coordinates in some of the models), as proxies in most cases, to identify the areas with higher or lower density.
Moreover, the abundance estimates provided here are underestimates for the survey area, in that they have not yet been corrected for availability bias (animals on the trackline below the surface that could not be seen), or perception bias (animals missed by observers that were available to be seen). It may be possible to collect data in the future that will allow for such correction or use available data from other surveys. In an aerial survey, correction for perception and availability bias occurs simultaneously when using the circle-back or “racetrack” method (Hiby and Lovell, 1998; Hiby, 1999; Hammond et al., 2013, 2017) given that the right amount of time between aircraft passes is enough (around 3 minutes; Hiby and Lovell, 1998). In the cases of an additional two observers behind and isolated from the ‘primary’ two observers (‘double platform’ approach), only perception bias would be accounted for, and availability bias would need to be derived from diving/surfacing times independently.
Correction for such biases can be significant and is essential to obtain the best estimates of absolute abundance. However, trends can be assessed also using uncorrected abundance when data collection methods and estimation models are the same and it can be assumed that the levels of these biases remain constant over time. While the uncorrected estimates can be used as minimum estimates for management, corrected estimates need to reliably assess the impact of human-induced mortality, such as bycatch. For example, using the estimates obtained through the model-based analysis and the correction factors of 0.364 for the harbour porpoise and 0.805 for common dolphins under good sighting conditions in the European Atlantic waters and the North Sea area (SCANS) (Hammond et al., 2017), the abundance estimates for the study area would be around 258,000 harbour porpoises and 135,000 common dolphins on a model-based estimation basis. Although the justification of the use of correction factors from the NE Atlantic to the Black Sea is debatable, given that the Black Sea subspecies might be different surfacing/diving times, such rough numbers suggest the importance of obtaining local data to correct the Black Sea estimates. For example, the corrected estimate for the harbour porpoise helps to provide a conservative estimate of its bycatch (11,826 - 16,200 individuals) in the Black Sea that suggest annual bycatch affects 5–7% of the estimated population (Popov et al., 2023). Non-corrected abundance estimates could be challenged as unreliably high as it will mean the annual bycatch level is above 10% (14–17%), resulting in extinction of the species in less than 10 years, which obviously is not the case.
4.2 Distribution, habitat preference and factors driving it
Based on the information on the variables available to us (Supplementary Table S2), the proxies of animal density shared by all the cetacean species were the geographic coordinates (when they were allowed in the model). This shows the importance of geographic area for understanding cetacean distribution in the Black Sea during our survey. However, it is clear that prey availability is one of, if not the major factor, determining distribution linked to the migration of fish species (e.g., Kleinenberg, 1956; Bushuev, 2000), and the incompleteness of updated quantitative information on this limits habitat preference modelling considerably. However, recent reviews summarising the distribution of most abundant fish species and status of their stocks are available (STECF, 2010; STECF, 2012; STECF, 2017), and can be considered for partial interpretations of cetaceans’ distribution. Also, there can be at least several other locality-related factors independent of, or weakly correlating environmental covariates assessed here: these include sources of underwater noise (including marine traffic) and intra- and inter-species biotic interactions. When LonLat was not allowed in the model, amongst the proxies for cetacean occurrence there were the univariate longitude (Lon) and latitude (Lat) measures, distance from the 25, 50 and 1000 m isobaths (Dist25, Dist50, and Dist1000), the current intensity and surface salinity for common dolphins, the mean sea surface temperature (sst) for bottlenose dolphins, and chlorophyll concentration (chl) for harbour porpoises. Also, depth of the mixed layer is an important environmental factor in a meromictic Black Sea, where the water column is stratified and the deep waters are anoxic: not surprisingly, all the three species showed preference for its positive values, since all the prey fish were concentrated only in the oxygen rich layer (Zaitsev and Mamaev, 1997). Equally, the summer sea temperature (and especially the surface temperature) in the Black Sea comes to the higher limit of optimum for the most widespread fish species, such as sprat (Sprattus sprattus) and anchovy (Engraulis encrasicolus) (Dubinets and Gubanov, 1988), so the negative preference for it by cetaceans following their prey seems obvious. Changes in sea surface height (mean ssh anomaly) affect ocean dynamics, including the upwelling and mixing of nutrient-rich deep waters: negative values enhance upwellings and therefore higher levels of productivity, while positive values tend to suppress such upwellings (Chelton et al., 2011). E.g., common dolphins showed preference for negative values of mean ssh anomaly (i.e., higher productivity upwelling waters) during our survey.
4.2.1 Black Sea common dolphins
Common dolphin was the only species for which the model with LonLat was chosen because: a) the AIC was smaller, and b) the deviance explained was larger. The difference with the next model without LonLat was small, but no parameters suggested that we should choose the model without LonLat. The spatial model predicts that common dolphins are most abundant in the southern part of the Black Sea, off the coasts of Türkiye and Bulgaria (Figure 1). The number of sightings increases with a gradient from north to south in the western portion of the Black Sea, with a higher number of sightings starting from the border between exclusive economic zones (EEZ) of Bulgaria and Romania. A relatively small group size was recorded by our study, concurrent with other surveys of the post-industrial dolphin fishery era (Mikhalev, 2008; Birkun et al., 2014) and possibly showing long-term alterations of the population structure.
Underwater profile seems to be a proxy for the distribution of common dolphins, with higher densities in deeper waters, and lower densities in the shallower northwestern coastal water of the Black Sea. These findings concur with views of earlier authors (e.g. Zalkin, 1938a; Freiman, 1950; Kleinenberg, 1956; Mikhalev, 2008) and more recently (Dede and Tonay, 2010; Birkun et al., 2014; Sánchez-Cabanes et al., 2017). A straightforward explanation for this is their preference for and association with aggregations of the most abundant fish species (e.g. see Kleinenberg, 1956; Dubinets and Gubanov, 1988; Birkun, 2002b; Mikhalev, 2008; Gol’din et al., 2017; Bilgin et al., 2018), most importantly the anchovy (Engraulis encrasicolus) and the sprat (Sprattus sprattus), which are the primary prey items for common dolphins (Zalkin, 1940; Kleinenberg, 1956). The anchovy is an epipelagic species and the sprat is vertically migrating between the sea bottom and surface layers. Both species in their summer distribution prefer the shelf areas of 15–110 m deep (sprat) or shelf and sea slope areas of 100–200 m deep (anchovy), and the area of maximum preference by common dolphins (100–500 m deep) fits the area simultaneously occupied by these fishes in summer (STECF, 2010; STECF, 2012; STECF, 2017). Importantly, the sprat and anchovy at present are by far the most abundant (by biomass) fish species in the Black Sea (STECF, 2017) and therefore the common dolphin has the best historically preserved prey resource in comparison to the other cetaceans.
4.2.2 Black Sea bottlenose dolphins
Sightings of Black Sea bottlenose dolphins in all the strata were rarer than those of two other Black Sea cetacean species. The spatial model predictions for the Black Sea bottlenose dolphins (Figure 2) showed a relatively uniform pattern in the waters of Ukraine, Romania and Bulgaria, preference for shallower and coastal waters (not uncommon for this species). This was also true for the coast of Türkiye, in the western part, but with no sightings east of 34° E, including the waters of Georgia. Association with shallow depths in the western Black Sea concurs both with historical evidence (Kleinenberg, 1956) and more recent research (Shpak et al., 2006; Dede and Tonay, 2010; Kopaliani et al., 2015; Panayotova and Todorova, 2015; Gladilina and Gol’din, 2016; Gladilina et al., 2017; Paiu et al., 2019; Uludüz et al., 2020). Çelikkale et al. (1989) also reported that this species was found in the western and central Turkish Black Sea coast, but rarely seen along the eastern Black Sea coast, with no sighting east of 36°E (Samsun). There were very few sighting records in the eastern Turkish Black Sea and Georgia between March and May 2010 (Sánchez-Cabanes et al., 2017) in Ordu near 38°E in 2021 (Özsandıkçı et al., 2022), and some strandings have been recorded around longitude 35°E (Sinop) by Özsandıkçı et al. (2019). In addition, data from earlier surveys in Georgian waters showed the abundance of bottlenose dolphins was low, 100 to 150 individuals, and they were unevenly distributed (Kopaliani et al., 2015).
Factors underlying occurrence or distribution of Black Sea bottlenose dolphins are less evident than for common dolphins. They are opportunistic feeders with a flexible feeding behaviour (Bushuev, 2000). Amongst their prey items, there are at least 23 fish species, and the pelagic horse mackerel (Trachurus spp.) and benthic dwelling, vertically migrating whiting (Merlangius merlangus) were found to be the dominants (Gladilina and Gol’din, 2014). However, pelagic sprats and anchovies are equally important for some stocks or seasons, and regular foraging near trawling vessels is observed (Gladilina, 2018). Therefore, these prey preferences alone hardly can explain the patchy distribution of the Black Sea bottlenose dolphins.
Black Sea bottlenose dolphins are believed to have a complex sub-population structure, forming a coastal metapopulation, as seen from several recent photo identification studies (Gladilina, 2018; Gladilina et al., 2018). A number of local areas with summer resident or seasonally migrating local groupings have been identified in recent studies (Kopaliani et al., 2015; Gladilina et al., 2017; Gladilina, 2018; Akkaya Baş et al., 2019). It can be suggested that specific cultural traditions of feeding and migration patterns for local stocks, rather than common physical or trophic factors, could explain the overall uneven distribution of bottlenose dolphins in the Black Sea.
4.2.3 Black Sea harbour porpoises
Black Sea harbour porpoises (Figure 3) were the most commonly sighted cetacean species during the survey. Sightings peaked in western waters (Bulgarian and south Romanian EEZ) and decreased in the north and the southeastern Black Sea, with even fewer observations towards the eastern part of the study area, off Türkiye and in Georgia. Similarly, fewer sightings were recorded towards Ukraine, although some individuals occurred in shallower waters in the northern part of the Ukrainian study area.
The distribution found in this survey partly follows previously reported ‘preferences’ (Kleinenberg, 1956), with sightings close to shelf waters, the highest preference for 50 m deep. Another preference was found for slope habitats which are often situated at areas 50–200 m deep. Nevertheless, the overall distribution was broader with sightings close to the coast, mainly in the western Black Sea and along the central-east Turkish coasts, as well as offshore, in deep Turkish waters. Historically, such an offshore distribution was pointed out by Mikhalev (2005a).
No sightings were recorded in southeastern (Georgian) waters. The species has been observed there (Kopaliani et al., 2015), with reported seasonal fluctuations in occurrence with the fewest sightings in summer. Combined with our data, this shows seasonality with low summer densities in the eastern Black Sea.
The spatial model predicts highest harbour porpoise density along the border between Bulgaria and Romania. While this concurs with relatively recent evidence from the western Black Sea (Birkun et al., 2014), evidence from the 1980s showed four summer hotspots in the northwest, southwest, northeast and southeast (Mikhalev, 2005a) but only a single southwestern hotspot was confirmed by this survey, despite covering three of the four historical hotspots. Also, interestingly, the spatial model did not predict hotspots in the other areas. It might be only speculated that the environmental proxies for the past distribution of the porpoises could have changed and shifted to a single western area.
The distribution of porpoises, small animals with high energy intake (Yasui and Gaskin, 1986; Rojano-Doñate et al., 2018), would be expected to be driven by the distribution of their prey, especially during the summer, which is the nursing season. The main prey species for Black Sea harbour porpoises are sprats and small whitings (Tonay et al., 2007: data for April-June), anchovies, horse mackerels, sand smelts (Atherina spp.), and the once dominating and preferred gobies (Zalkin, 1940; Kleinenberg, 1956; Bilgin et al., 2018). Porpoise summer distribution would be expected to be linked to shallow waters if there are gobies or sand smelts in the area, shelf waters for sprats and whitings, and pelagic grounds for anchovies and horse mackerels (Dubinets and Gubanov, 1988; Yakovlev, 1995; STECF, 2010; STECF, 2012; STECF, 2017). Thus, they are mostly observed across the northwestern and northern waters of the Black Sea (Bulgarian and Romanian EEZs) shelf and sea slope zone, for the offshore areas in correlation with the pelagic fish aggregation. The low-density areas recorded in this study are similar to the densities recorded earlier in the northernmost Ukrainian Black Sea (Birkun et al., 2003, 2004).
4.2.4 Considerations for the area not covered by the survey
Clearly, cetaceans inhabit the areas of the Black Sea which were not covered by this survey. There are some recent and many historical data on cetacean occurrence and distribution in the northern and north-eastern Black Sea areas, in the waters of Crimea and Caucasus. For example, common dolphins were commonly recorded during the summer throughout the Black Sea, including its central part, at depths of 100–1000 m, quite similar to this study (Mikhalev, 2008; Birkun et al., 2014), and it is not unlikely that there is a single basin wide pattern of distribution of this species (Mikhalev, 2008). Bottlenose dolphins form several local aggregations of different size in coastal waters of Crimea and Caucasus including the Kerch Strait and visiting the Azov Sea (Gladilina, 2018; Gladilina et al., 2018); amongst them, particularly large is the aggregation in the waters of the south-eastern Crimea which can number 1500 individuals or even more (Gladilina, 2012; Gladilina and Gol’din, 2016; Gladilina et al., 2018). Other large aggregations can be found near the southern Crimea (Birkun et al., 2014; Gladilina, 2018) and Caucasus (Shpak et al., 2006). However, the details of their overall distribution (especially in offshore areas) or abundance, as well as common environmental predictors, are mostly obscure (Mikhalev, 2005b; Gladilina, 2018), while cultural traditions of prey chasing, or depredation may be important in some areas (Gladilina, 2018). The situation with the distribution of the harbour porpoise is the least clear since it is subject to interannual fluctuations. At least, it is permanently present in Crimean waters, including the Kerch Strait (Gol’din, 2004; Vishnyakova, 2017). Also, the harbour porpoise inhabits the whole Azov Sea at the north-eastern corner of the Black Sea basin during the warm season, and the distinct population in that small sea is believed to be endangered (Vishnyakova, 2017). Thus, future effort extending the assessment of distribution and abundance of cetaceans onto the whole Black Sea will certainly improve data analysis and modelling frameworks. Moreover, it would be impossible to draw any basin wide extrapolations by simple arithmetical operations or assumptions, since the distribution of cetaceans is uneven and it varies interannually.
4.3 Historical changes in abundance and distribution
Cetacean populations in the Black Sea are believed to have undergone a serious decline during the 20th century. The pristine state of total cetacean population in the Black Sea is unknown, but some estimates exist. Zemsky and Yablokov (1974) and Zemsky (1975) suggested it was between 1,500,000 and 2,000,000. Arseniev et al. (1973) stated that the latter estimate was for common dolphins only, and thus the total population was larger. The animals’ distribution was described as ecologically stratified: common dolphins were believed to be mostly pelagic, while bottlenose dolphins and harbour porpoises were primarily or solely coastal.
All the Black Sea cetaceans were extensively hunted between 1931 and 1983 (Kleinenberg, 1956; Smith, 1982; Birkun et al., 2014). The overall catch during this period could exceed 5,000,000 animals (Zemsky, 1996; Birkun, 2002a), and the abundance of common dolphins was thought to have dropped to below 200,000 individuals (Arseniev et al., 1973). Extensive bycatch in bottom gillnets in all the Black Sea added to the direct takes (Pavlov et al., 1996; Birkun et al., 2014). In addition to these removals, the habitat quality of the Black Sea severely deteriorated in 1970–2000 (Daskalov, 2002; Daskalov, 2003), and, despite some improvement during the last decade (Zhang et al., 2020), probably is still well below its pristine state. Changes in river catchment, overfishing, IUU fishing, eutrophication, chemical pollution, degradation of coastal habitats and invasions of alien species eventually led to decline of prey fish stocks (Daskalov, 2003), which have likely become the major factor limiting the restoration of cetacean populations (Bushuev, 2000).
The first direct estimates of cetacean abundance were produced from aerial surveys covering the northern Black Sea, although at that time the methods used were based on extrapolative assumptions and did not include correction on detection probability and confidence intervals (Buckland et al., 1992) (this is not the case here, where the results reflect solely the abundance estimates of the surveyed areas). The 1967–73 average abundance of the common dolphin was estimated at around 155,000 and the bottlenose dolphin as around 85,000 (Zemsky and Yablokov, 1974; Smith, 1982). Further estimates from 1977–86 showed the average abundance of common dolphins as around 140,000 and bottlenose dolphins as around 50,000 (Bushuev, 2002). Çelikkale et al. (1989), based on vessel surveys of 1987 in the southern Black Sea, estimated cetacean abundance in the entire Black Sea as around 454,000 animals: of which some 53% (237,000) were thought to be harbour porpoises, 33% (149,820) common dolphins and 15% (67,257) bottlenose dolphins.
However, the peak of cetacean population decline is believed to have been reached due to the depletion of fish stocks, particularly after the outbreak of the invasive ctenophore Mnemiopsis leidyi in the late 1980s (Vinogradov et al., 1989; Shiganova and Bulgakova, 2000). The subsequent mass mortality of cetaceans in 1989–90, as well as bycatch (Pavlov et al., 1996; Tonay and Öztürk, 2012), primarily affected the harbour porpoise. It has been suggested that the 1988–1997 decade was the time of lowest cetacean abundance in the Black Sea (Birkun, 2002a; Birkun, 2002b), before another alien ctenophore Beroe ovata effectively regulated Mnemiopsis population and brought some balance to the food webs (Shiganova et al., 2000). Another important change found since the 1970s was the shift in distribution of the harbour porpoises and bottlenose dolphins, which began to frequently occur in pelagic waters (Mikhalev, 2005a; Mikhalev, 2005b). This was interpreted as a response to depletion of once richest benthic fish stocks (Bushuev, 2000).
In 2013, a combined aerial and vessel survey of cetacean abundance using distance sampling methods was conducted in the western Black Sea and included the entire waters of Bulgaria and Romania and, partially, Ukraine (Birkun et al., 2014): the abundance of common dolphins was approximately 60,400 (95% CI = 41316 – 88298), with 26,400 (95% CI = 19586 – 35751) bottlenose dolphins, and 29,400 (95% CI = 19568 – 44368) harbour porpoises. These more robust estimates are difficult to compare with previous estimates due to inter alia differences in the surveyed areas. However, the abundance estimates presented in the current study are generally comparable with those by Birkun et al. (2014), although comparison can be made between data on Romanian and Bulgarian waters, the only area for which a direct comparison. It shows differences for all the species, most probably due to interannual variation in distribution (Supplementary Table S4). The most significant new feature is the single hotspot of harbour porpoises observed in the western Black Sea in 2019.
Overall, the current distribution patterns in the western and southern parts of the Black Sea are similar to those reported for the 1980s. Recognising that methodological differences render comparisons difficult, the data presented here show that cetacean populations in the Black Sea are still below their pristine state. Their abundance has not reached back to the baseline estimates of the 1930s and no indications for its growth are observed. However, since direct hunting has stopped, at a broad level, it seems that the abundance of common dolphins and possibly harbour porpoises may have returned to the level of 1977-1987, whereas the population of bottlenose dolphins has not.
The Black Sea cetaceans are dependent on small sized pelagic fish known for their fluctuations in abundance (Galtsoff, 1924; Shulman, 2002; Yankova, 2011). They are also vulnerable to various factors such as underwater noise, bycatch in fishing gears, epidemics, and pollution (Notarbartolo di Sciara et al., 2002; Birkun, 2008b; Notarbartolo di Sciara and Tonay, 2021) and new potential threats posed by regional conflicts such as wars (Vishnyakova et al., 2023; Vyshnevskyi et al., 2023). To elaborate long-term effective conservation strategies for these cetaceans, regular surveys covering wider areas and seasons should be realised, as well as appropriate mitigation measures to reduce or eliminate anthropogenic pressures.
5 Conclusions
1. The abundance estimates, obtained by us for 52% of the Black Sea during the 15-day survey at good weather conditions, are less than the hypothetical historical estimates of 1.5–2 million individuals, but they are broadly comparable, with all the precautions and methodological limitations, to those for 1977–87 and more recent ones which were also based on partial sea surveys. This implies that the cetacean populations in the Black Sea have not fully recovered from various human pressures, including direct hunting (continued until 1983) or on-going bycatch in fisheries. Common dolphins and bottlenose dolphins hypothetically passed the lowest point of population decline, as they are under less heavy pressure of bycatch, than harbour porpoises. But new war related threats in most recent years could change this.
2. The distribution of common dolphins and harbour porpoises in the Black Sea can be broadly associated with prey availability in a changing ecosystem, primarily the sprat and anchovy and also whiting, horse mackerel and possibly other fishes. Additional factors may also be important for the bottlenose dolphin. The resources of prey species historically preferred by common dolphins (sprat and anchovy) are in a better condition than those for other cetacean species. Finally, all the species share epipelagic fish as a prey resource and therefore occur in the open sea waters.
3. Shifts in the hotspots of the species distribution were identified from the historic literature, mainly for Black Sea harbour porpoises and Black Sea bottlenose dolphins, together with low or no sightings in areas known to be used by both species. This underlines the need of a broad scale, long-term monitoring programme to be implemented. Considering the seasonal difference in distribution of cetaceans, the temporal and spatial coverage should be increased.
4. These results provide essential information for the assessment of the Criteria under main Descriptor D1, marine biodiversity, in particular for D1C2 (cetaceans populations abundance) and D1C4 (cetacean distributional range), within the framework of European Commission’s Marine Strategy Framework Directive. In addition, they could contribute to the other descriptors and should be evaluated in relation to human pressures such as anthropogenic underwater noise and fisheries interactions.
5. This first synoptic, collaborative, and coordinated aerial survey for cetaceans in the Black Sea yielded comprehensive data and the first robust insights on global abundance, distribution and density for all three cetacean species. This systematic effort, complemented with previous data, has provided robust baseline information for identifying Important Marine Mammal Areas (IMMAs) (IUCN Marine Mammal Protected Areas Task Force, 2021; Tetley et al., 2022), evaluating their current conservation status under the IUCN criteria for Red List Species, assessing their population trends in line with ACCOBAMS provisions and allowing coastal countries to fulfil their commitments under different legal frameworks, such as the EU Habitats Directive, Black Sea Integrated Monitoring and Assessment Programme (Black Sea Commission - BSC).
6. Replication of this large-scale effort should be considered at least every 6 years, following the EU MSFD cycles, to allow the creation of a robust time series, to be used for identification of temporal and spatial trends. The Black Sea Integrated Monitoring and Assessment Programme of BSC as well as Long Term Monitoring Programme of ACCOBAMS (adopted in Malta, during the MOP 8, December 2022, with a specific Resolution) could provide a framework for the basin-wide synergetic cooperation.
Data availability statement
The datasets presented in this study can be found in online repositories. The names of the repository/repositories and accession number(s) can be found below: EMODNET Biology (https://ipt.vliz.be/upload/resource?r=marine_mammal_sightings_black_sea_recorded_by_cenobs_aerial_expedition_2019) for the CeNoBS datasets and at by request on the ACOBAMS website (https://accobams.org/asi-data-access-request/). The datasets analysed for this study can be found in the text of this paper and publicly available at https://cenobs.eu/content/deliverables.
Ethics statement
Ethical review and approval was not required for the study on animals in accordance with the local legislation and institutional requirements.
Author contributions
RMP, SP, DP, and PG planned the study; RMP, DP, AD, GM, AT, CT, and PG collected data; AC led the analysis; RMP, SP, DP, AO, and PG analysed data with input from GM, AD, CT, NK, DM, and AC. RMP, PG, DP, and SP wrote the initial manuscript draft with input from all the authors. All authors contributed to the article and approved the submitted version.
Funding
The author(s) declare financial support was received for the research, authorship, and/or publication of this article. Current study was conducted with the cetacean related datasets collected during “CeNoBS: Support MSFD implementation in the Black Sea through establishing a regional monitoring system of cetaceans (D1) and noise monitoring (D11) for achieving GES”, Contract No 110661/2018/794677/SUB/ENV.C2 co-financed by the European Union, ACCOBAMS, Mare Nostrum NGO and Green Balkans NGO.
Acknowledgments
We are sincerely grateful to CeNoBS/ASI Advisory board members and contributors, Paolo Carpenteri and Margherita Sessa (FAO/GFCM), Alessio Maglio and Florent Le Courtois (Sinay), Florence Descroix-Comanducci, Julie Belmont, Célia Le Ravallec, Susana Salvador (ACCOBAMS Secretariat), Philip Hammond (St Andrews University/SMRU), Irina Makarenko (BSC), Vincent Ridoux (La Rochelle University), Mihaela Cândea-Mirea (Mare Nostrum), Bayram Öztürk (Istanbul University and TUDAV), Karina Vishnyakova (UkrSCES), Olga Shpak (Ukraine) for the inspiration and insights which backed this study; Greg Donovan (IWC) for comments on the early draft of the paper; Natalia Brusentsova (Tuzlivski Lymany) for help on map design; Mare Nostrum and ACCOBAMS Secretariat for overall organisation and coordination support. Special thanks to the National Authorities of countries involved, to the aerial company Action Air Environment, to the ACCOBAMS Secretariat and its Scientific Committee for its ambition and continuous support to the development of the ACCOBAMS Survey Initiative project since the ACCOBAMS origin, and not least to the European Commission for its continuous efforts towards achieving the Good Environmental Status of the European Seas. We are also grateful to our reviewers for their time and dedication on improving the present article. Parts of this manuscript (materials and methods section) has been released as Estimates of abundance and distribution of cetaceans in the Black Sea from 2019 surveys report at [https://accobams.org/wp-content/uploads/2021/04/ASI_CeNoBS-Black-Sea-report.pdf] (ACCOBAMS, 2021b. Estimates of abundance and distribution of cetaceans in the Black Sea from 2019 surveys. By Paiu, R.M., Panigada, S., Cañadas, A., Gol’din, P., Popov, D., David, L., Amaha Ozturk, A., Glazov, D. Ed. ACCOBAMS - ACCOBAMS Survey Initiative/CeNoBS Projects, Monaco, 54 pages.).
Conflict of interest
The authors declare that the research was conducted in the absence of any commercial or financial relationships that could be construed as a potential conflict of interest.
The handling editor RC declared a past co-authorship with the author AD.
Publisher’s note
All claims expressed in this article are solely those of the authors and do not necessarily represent those of their affiliated organizations, or those of the publisher, the editors and the reviewers. Any product that may be evaluated in this article, or claim that may be made by its manufacturer, is not guaranteed or endorsed by the publisher.
Supplementary material
The Supplementary Material for this article can be found online at: https://www.frontiersin.org/articles/10.3389/fmars.2024.1248950/full#supplementary-material
Supplementary Figure 1 | Survey plan used during the sampling over the 6 strata.
Supplementary Figure 2 | Collinearity plot for fixed and dinamic covariates
Supplementary Figure 3 | (A) Q-q plot (left) and (B) detection function (right) for B.S. common dolphins. The detection function is scaled to 1.0 at the left-truncated perpendicular distance, and the histograms represent the frequency of the observed sightings at different perpendicular distances. Dots represent individual sightings and the effect of the covariates considered. Kilometre is the distance measurement unit.
Supplementary Figure 4 | (A) Q-q plot (left) and (B) detection function (right) for B.S. bottlenose dolphins. The detection function is scaled to 1.0 at the left-truncated perpendicular distance, and the histograms represent the frequency of the observed sightings at different perpendicular distances. Dots represent individual sightings and the effect of the covariates considered. Kilometre is the distance measurement unit.
Supplementary Figure 5 | (A) Q-q plot (left) and (B) detection function (right) for harbour porpoise. The detection function is scaled to 1.0 at the left-truncated perpendicular distance, and the histograms represent the frequency of the observed sightings at different perpendicular distances. Dots represent individual sightings and the effect of the covariates considered. Kilometre is the distance measurement unit.
Supplementary Table 1 | Covariates tested in the models and their ranges or factor levels.
Supplementary Table 2 | Covariates tested in the spatial models. The dynamic covariates sst and chl-a were obtained from SeaWiFS and MODIS-Aqua sensors and the sst of MODIS-Terra and MODIS-Aqua. Depth was extracted from ETOPO (a 1 arc-minute global relief model of Earth’s surface that integrates land topography and ocean bathymetry, https://ngdc.noaa.gov/mgg/global/global.html). Its derivatives were obtained using ArcGis 10.5.
Supplementary Table 3 | Parameters and results of the detection functions. Codes: Truncation: L= left truncation (km), R= right truncation (km); n = number groups in detection function; key function HR =hazard-rate; p=probability of detection; CV p = coefficient of variation of the probability of detection; esw = effective half-strip width (km); CvM p = p-value of the Cramér-von Mises goodness of fit.
Supplementary Table 4 | Comparing the abundance estimates of CeNoBS and Birkun et al. (2014) for Romania and Bulgaria.
References
Abel O. (1905). Eine Stammtype der delphiniden aus dem Miocän der Halbinsel Taman. (Vienna: Jahrbuch der geologischen Reichsanstalt) 55 (2), 375–392.
ACCOBAMS (2021a). Estimates of abundance and distribution of cetaceans, marine megafauna and marine litter in the Mediterranean Sea from 2018–2019 surveys. Eds. Panigada S., Boisseau O., Cañadas A., Lambert C., Laran S., McLanaghan R., Moscrop A. (Monaco: ACCOBAMS - ACCOBAMS Survey Initiative Project), 177.
ACCOBAMS (2021b). Estimates of abundance and distribution of cetaceans in the Black Sea from 2019 surveys. Eds. Paiu R. M., Panigada S., Cañadas A., Gol’din P., Popov D., David L., Amaha Ozturk A., Glazov D. (Monaco: ACCOBAMS - ACCOBAMS Survey Initiative/CeNoBS Projects), 54.
Aiken M., Gladilina E., Çakırlar C., Telizhenko S., van den Hurk Y., Bejenaru L., et al. (2023). Prehistoric and historic exploitation of marine mammals in the Black Sea. Quaternary Sci. Rev. 314, 108210. doi: 10.1016/j.quascirev.2023.108210
Akkaya Baş A., Öztürk B., Öztürk A. A. (2019). Encounter rate, residency pattern and site fidelity of bottlenose dolphins (Tursiops truncatus) within the Istanbul Strait, Turkey. J. Mar. Biol. Assoc. United Kingdom 99, 1009–1016. doi: 10.1017/S0025315418000577
ANEMONE (2021). Black Sea state of environment based on ANEMONE Joint Cruise. Ed. Lazăr L. (Bucuresti: CD PRESS), ISBN: ISBN 978–606-528–530-9. 185 pp.
Antonescu C. S. (1966). Mamifere din mari şi oceane. [Mammals of seas and oceans.] (Bucuresti: Editura Ştiinţifică şi Pedagogică), 155–165.
Arseniev V. A., Zemsky V. A., Studenetskaya I. S. (1973). Marine Mammals (Moscow: Pishchevaya Promyshlennost).
Barabash-Nikiforov I. I. (1940). Cetacean fauna of the Black Sea, its composition and origin (Voronezh: Izd-vo Voronezh. Gos. Un-ta).
Barabasch I. I. (1935). Delphinus delphis ponticus subsp. n. Bull. Moskovskogo Obshchestva Ispytateley Prirody (Biol. Div.). 44, 246–249.
Ben Chehida Y., Thumloup J., Vishnyakova K., Gol’din P., Fontaine M. C. (2020). Genetic homogeneity in the face of morphological heterogeneity in the harbor porpoise from the Black Sea and adjacent waters (Phocoena phocoena relicta). Heredity 124, 469–484. doi: 10.1038/s41437-019-0284-1
Bilgin S., Onay H., Köse O., Yeşilçiçek T. (2018). About dolphins (Cetacea) that stranded and bycatch in the Black Sea: Causes of death, nutritional properties and pregnancy status. Turkish J. Agric. Natural Sci. 5, 447–454. doi: 10.30910/turkjans.471239
Birkun A. Jr. (2002a). “Direct killing and live capture,” in Cetaceans of the Mediterranean and Black Seas: state of knowledge and conservation strategies. A report to the ACCOBAMS Secretariat. Ed. Notarbartolo di Sciara G. (Monaco: IUCN).
Birkun A. Jr. (2002b). “Natural mortality factors affecting cetaceans in the Black Sea,” in Cetaceans of the Mediterranean and Black Seas: state of knowledge and conservation strategies. A report to the ACCOBAMS Secretariat. Ed. Notarbartolo di Sciara G.(Monaco: Commission on the Protection of the Black Sea against pollution). 13 p.
Birkun A. Jr. (2008a). Delphinus delphis ssp. ponticus. In: The IUCN Red List of Threatened Species 2008 (Accessed March 15, 2022).
Birkun A. (2008b). The state of cetacean populations. State of the environment of the Black Sea, (2001–2006/7) Vol. 3 (Publications of the Commission on the Protection of the Black Sea Against Pollution (BSC).
Birkun A. Jr. (2012)Tursiops truncatus ssp. ponticus. In: The IUCN Red List of Threatened Species 2012 (Accessed March 15, 2022).
Birkun A. Jr., Frantzis A. (2008). Phocoena phocoena ssp. relicta. In: The IUCN Red List of Threatened Species 2008 (Accessed March 15, 2022).
Birkun A. Jr., Glazov D., Krivokhizhin S., Nazarenko E., Mukhametov L. (2003). “Species composition and abundance estimates of cetaceans in the Kerch Strait and adjacent areas of the Black and Azov Seas: The second series of aerial surveys (August 2002),” in Abstr. 17th Annual Conf. of the European Cetacean Society, Las Palmas de Gran Canaria, 9–13 March 2003. 271–272, 285 pp.
Birkun A. Jr., Krivokhizhin S. V., Glazov D. M., Shpak O. V., Zanin A. V., Mukhametov L. M. (2004). “Abundance estimates of cetaceans in coastal waters of the northern Black Sea: Results of boat surveys in August-October 2003,” in Marine Mammals of the Holarctic: Collection of Scientific Papers after the 3rd Internat. Conf, Koktebel, Ukraine, 11–17 October 2004. 64–68, Moscow, 609.
Birkun A. Jr., Krivokhizhin S., Komakhidze A., Mukhametov L., Shpak O., Goradze I., et al. (2006). “Wintering concentrations of Black Sea cetaceans off the Crimean and Caucasian coasts,” in 20th Annual Conference of the European Cetacean Society, Gdynia, 2–7 April 2006.
Birkun A. Jr., Northridge S. P., Willsteed E. A., James F. A., Kilgour C., Lander M., et al. (2014). Studies for Carrying Out the Common Fisheries Policy: Adverse Fisheries Impacts on Cetacean Populations in the Black Sea (Brussels: Final report to the European Commission). 347 pp.
Bologa A.Ş. (2015)Unicitatea Mării Negre. In: Revista Ştiinţă şi tehnică. Available online at: https://stiintasitehnica.com/%EF%BB%BF%EF%BB%BFunicitatea-%E2%80%A8marii-negre/ (Accessed April 10, 2022).
Borja Á., Elliott M., Carstensen J., Heiskanen A. S., van de Bund W. (2010). Marine management–towards an integrated implementation of the European Marine Strategy Framework and the Water Framework Directives. Mar. pollut. Bull. 60, 2175–2186. doi: 10.1016/j.marpolbul.2010.09.026
Buckland S. T. (2001). Introduction to distance sampling: estimating abundance of biological populations (Oxford; New York: Oxford University Press). doi: 10.1093/oso/9780198506492.001.0001
Buckland S. T., Rexstad E. A., Marques T. A., Oedekoven C. S. (2015). Distance Sampling: Methods and Applications (Cham: Springer International Publishing). doi: 10.1007/978-3-319-19219-2
Buckland S. T., Smith T. D., Cattanach K. L. (1992). Status of small cetacean populations in the Black Sea: Review of current information and suggestions for future research. Rep. Int. Whaling Commission. 42, 513–516.
Bushuev S. G. (2000). “Depletion of forage reserve as a factor limiting population size of Black Sea dolphins, 437–452,” in Ecological Safety of Coastal and Shelf Areas and a Composite Utilization of Shelf Resources (Proceedings Marine Hydrophysical Institute, Sevastopol).
Bushuev S. G. (2002). “Principal results of the aerial observations of the Black Sea dolphins in 1970s-80s,” in Marine Mammals of the Holarctic (KMK, Moscow), 60–61.
Cañadas A., Pierantonio N., Araújo H., David L., Di Meglio N., Dorémus G., et al. (2023). Distribution patterns of marine megafauna density in the Mediterranean Sea assessed through the ACCOBAMS Survey Initiative (ASI). Front. Mar. Sci. 10. doi: 10.3389/fmars.2023.1270917
Çelikkale M. S., Karaçam H., Düzgünes E., Ünsal S., Durukanoglu H. F. (1989). Size and distribution of dolphin populations in the Black Sea. Doga Türk Zooloji Dergisi 13, 189–196.
Chelton D. B., Schlax M. G., Samelson R. M. (2011). Global observations of nonlinear mesoscale eddies. Prog. Oceanogr. 91, 167–216. doi: 10.1016/j.pocean.2011.01.002
Danilevsky N. N., Sirotenko M. D., Shlyakhov V. A., Medvedev L. P. (1978). “On the summer distribution of dolphins in the Black Sea,” in Morskie Mlekopitayuschie, Abstr. 7th USSR Meeting, Moscow. 99–100.
Daskalov G. M. (2002). Overfishing drives a trophic cascade in the Black Sea. Mar. Ecol. Prog. Ser. 225, 53–63. doi: 10.3354/meps225053
Daskalov G. M. (2003). Long-term changes in fish abundance and environmental indices in the Black Sea. Mar. Ecol. Prog. Ser. 255, 259–270. doi: 10.3354/meps255259
Dede A., Tonay A. M. (2010). Cetacean sightings in the Western Black Sea in autumn 2007. J. Environ. Prot. Ecol. 11, 1491–1494.
Dubinets G. A., Gubanov E. P. (Eds.) (1988). Promyslovoe Opisanie Chornogo Moria. (Fishery Description of the Black Sea) (Moscow: Glavnoe Upravlenie Navigatsii i Kartografii Ministerstva Oborony dlia Ministerstva Rybnogo Hoziaistva SSSR). 139 p.
Fontaine M. C., Alodie Snirc A., Frantzis A., Koutrakis E., Birkun A. Jr., Ozturk B., et al. (2012). A history of expansion and anthropogenic collapse in a top marine predator of the Black Sea estimated from genetic data. Proc. Natl. Acad. Sci. United States America 109, E2569–E2576. doi: 10.1073/pnas.1201258109
Freiman S. (1950). On the distribution of the common dolphin in summer months near the shores of Crimea and northern Caucasus. Trudy AzCherNIRO 14, 77–87.
Galtsoff P. S. (1924). Seasonal migrations of mackerel in the Black Sea. Ecology 5, 1–5. doi: 10.2307/1929159
Gladilina E. V. (2012). Observations of Cetaceans (Cetacea) in the waters of Karadag nature reserve and the adjacent waters. 2010 Vol. 25 (Scientific Notes of Taurida V.I. Vernadsky National University), 51–59.
Gladilina O. V. (2018). The bottlenose dolphin (Tursiops truncatus) in the waters of the northern Black Sea: biology and population structure. Kyiv: Schmalhausen Institute of Zoology, National Academy of Sciences of Ukraine.
Gladilina E. V., Gol’din P. E. (2014). New prey fishes in diet of Black Sea bottlenose dolphins, Tursiops truncatus (Mammalia, Cetacea). Vestnik Zoologii 48, 83–92. doi: 10.2478/vzoo-2014-0009
Gladilina E. V., Gol’din P. E. (2016). Abundance and summer distribution of a local stock of Black Sea bottlenose dolphins, Tursiops truncatus (Cetacea, Delphinidae), in coastal waters near Sudak. Vestnik zoologii 50, 49–56. doi: 10.1515/vzoo-2016-0006
Gladilina E., Shpak O., Serbin V., Kryukova A., Glazov D., Gol’din P. (2018). Individual movements between local coastal populations of bottlenose dolphins (Tursiops truncatus) in the northern and eastern Black Sea. J. Mar. Biol. Assoc. United Kingdom 98, 223–229. doi: 10.1017/S0025315416001296
Gladilina E. V., Vishnyakova K. A., Neprokin O. O., Ivanchikova Y. F., Derkacheva T. A., Kryukova A. A., et al. (2017). Linear transect surveys of abundance and density of Cetaceans in the area near the Dzharylgach Island in the North-Western Black Sea. Vestnik zoologii 514, 335–342. doi: 10.1515/vzoo-2017-0038
Gol’din P. E. (2004). Growth and body size of the harbour porpoise, Phocoena phocoena (Cetacea, Phocoenidae), in the Sea of Azov and the Black Sea. Vestnik Zoologii 38, 59–73.
Gol’din P., Gladilina E., Savenko O., Vishnyakova K., Neprokin O., Ivchenko Y. (2017). Identification and initial assessment of cetacean groupings in coastal waters of the northwestern Black Sea, Ukrainian sector (final report) (UkrSCES, Odesa: MoU ACCOBAMS). Available at: https://accobams.org/wp-content/uploads/2019/04/MOP7.Inf06_Final_Report_UkrSCES.pdf. N° 09/2016/FAC, 100 p.
Hammond P. S., Berggren P., Benke H., Borchers D. L., Collet A., Heide-Jørgensen M. P., et al. (2002). Abundance of harbour porpoises and other cetaceans in the North Sea and adjacent waters. J. Appl. Ecol. 39, 361–376. doi: 10.1046/j.1365-2664.2002.00713.x
Hammond P. S., Lacey C., Gilles A., Viquerat S., Börjesson P., Herr H., et al. (2017) Estimates of cetacean abundance in European Atlantic waters in summer 2016 from the SCANS-III aerial and shipboard surveys. SCANS-III project report 1. Available online at: https://synergy.st-andrews.ac.uk/scans3/files/2017/05/SCANS-III-design-basedestimates-2017–05-12-final-revised.pdf.
Hammond P. S., Macleod K., Berggren P., Borchers D. L., Burt M. L., Cañadas A., et al. (2013). Cetacean abundance and distribution in European Atlantic shelf waters to inform conservation and management. Biol. Conserv. 164, 107–122. doi: 10.1016/j.biocon.2013.04.010
Hiby L. (1999). “The objective identification of duplicate sightings in aerial survey for porpoise,” in Marine Mammal Survey and Assessment Methods. Ed. Garner G. W., Amstrup S. C., Laake J. L., Manly B. F.J., McDonald L. L., Robertson D. G.. (Balkema, Rotterdam: A.A. Balkema), 179–189.
Hiby A. R., Lovell P. (1998). Using aircraft in tandem formation to estimate abundance of harbour porpoise. Biometrics 54, 1280–1289. doi: 10.2307/2533658
IUCN Marine Mammal Protected Areas Task Force (2021) Final Report of the Seventh IMMA Workshop: Important Marine Mammal Area Regional Workshop for the Black Sea, Turkish Straits System and Caspian Sea. Available online at: https://www.marinemammalhabitat.org/download/final-report-regional-workshop-for-the-black-sea-turkish-straits-system-and-caspian-sea-important-marine-mammal-areas/ (Accessed September 01, 2023).
Kleinenberg S. E. (1956). Mammals of the Black Sea and the Sea of Azov: an experience of biological and fisheries research (Moscow: Izdatelstvo Akademii Nauk SSSR).
Kopaliani N., Gurielidze Z., Devidze N., Ninua L., Dekanoidze D., Javakhishvili Z., et al. (2015). Monitoring of Black Sea Cetacean in Georgian Waters (Tbilisi: Report. Supported by Kolkheti National Fund. Adopted by the Ministry of Natural Resources and Environment Protection of Georgia).
Marques T. A., Thomas L., Fancy S. G., Buckland S. T. (2007). Improving estimates of bird density using multiple covariate distance sampling. The Auk 127, 1229–1243. doi: 10.1093/auk/124.4.1229
Mikhalev Y. (2005a). The peculiarities of the distribution of the harbour porpoise, Phocoena phocoena relicta (Cetacea), in the Black Sea. Vestnik zoologii 39, 25–35.
Mikhalev Y. (2005b). The peculiarities of the distribution of the bottlenose dolphin, Tursiops truncatus (Cetacea), in the Black Sea. Vestnik Zoologii 39, 29–42.
Mikhalev Y. (2008). Characteristics of distribution of the common dolphins, Delphinus delphis (Cetacea), in the Black Sea. Vestnik zoologii 42, 325–337.
Miller D. L., Rexstad E., Thomas L., Marshall L., Laake J. L. (2019). Distance sampling in R. J. Stat. Softw. 89, 1–28. doi: 10.18637/jss.v089.i01
Notarbartolo di Sciara G., Aguilar A., Bearzi G., Birkun A. Jr., Frantzis A. (2002). “Overview of known or presumed impacts on the different species of cetaceans in the Mediterranean and Black Seas,” in Cetaceans of the Mediterranean and Black Seas: state of knowledge and conservation strategies. Ed. Notarbartolo di Sciara G. (A report to the ACCOBAMS Secretariat, Monaco). Section 17, 4.
Notarbartolo di Sciara G., Tonay A. M. (2021). Conserving Whales, Dolphins and Porpoises in the Mediterranean Sea, Black Sea and adjacent areas: an ACCOBAMS status report (Monaco: ACCOBAMS). 160 pp.
Özsandıkçı U., Şahin F., Öztekin A. (2022). “Abundance estimatıon and distrıbutıon of Cetaceans in the south Black Sea, (2021–2022). III,” in National Marine Monitoring and Assessment Symposium Book of Abstracts, 135–138.
Özsandıkçı U., Tonay A. M., Danyer E., Dede A. (2019). “Cetacean stranding records on the central Turkish Black Sea coast in May 2017-April 2019,” in World Marine Mammals Conference, 9–12 December 2019. 324–325 (Barcelona: Society for Marine Mammalogy).
Öztürk B., Öztürk A. A. (1996). On the biology of the Turkish Straits System Vol. 17 (Istanbul: Bulletin de l’Institut Oceanographique), 205–221.
Paiu R. M., Olariu B., Paiu A. I., Mirea Candea M. E., Gheorghe A. M., Murariu D. (2019). Cetaceans in the coastal waters of southern Romania: initial assessment of abundance, distribution, and seasonal trends. J. Black Sea/Mediterranean Environ. 25, 266–279.
Paiu R. M., Panigada S., Gol’din P., Popov D., Tonay A., Dede A., et al. (2021b). Marine mammal sightings in the Black Sea recorded by CeNoBS Aerial Expedition in 2019. doi: 10.14284/475
Paiu R.-M., Timofte C., Paiu A.-I., Mirea Candea M.-E., Murariu D. (2021a). Local abundance and distribution of phocoenidae and delphinidae families in the black sea territorial water of Romania. Cercetări Mar. 51, 178–187. doi: 10.55268/CM.2021.51.178
Palialexis A., Connor D., Damalas D., Gonzalvo J., Micu D., Mitchel I., et al. (2019). Indicators for status assessment of species, relevant to MSFD Biodiversity Descriptor (Luxembourg: EUR 29820 EN, Publications Office of the European Union), JRC117126, ISBN: ISBN 978–92-76–09156-1. doi: 10.2760/282667
Panayotova M., Slavova K., Marinova V., Popov D. (2017). Studying of the distribution and abundance of marine mammals in the Bulgarian Black Sea area by combination of visual and acoustic observations. Proc. Instit. Fish. Resour. 28, 34–40.
Panayotova M., Todorova V. (2015). Distribution of three cetacean species along the Bulgarian Black Sea coast in 2006–2013. J. Black Sea/Mediterranean Environ. 21, 45–53.
Panigada S., Pierantonio N., Araújo H., David L., Di-Méglio N., Dorémus G., et al. (2024). The ACCOBAMS survey initiative: the first synoptic assessment of cetacean abundance in the Mediterranean Sea through aerial surveys. Front. Mar. Sci. 10. doi: 10.3389/fmars.2023.1270513
Pavlov V., Artov A., Zhuravleva T. (1996). “Impact of fishing on Black Sea dolphins off the Crimea coasts,” in Proceedings of the First International Symposium on the Marine Mammals of the Black Sea, Istanbul, Turkey, 27–30 June 1994. 41–43 (Istanbul: ACAR Matbaacilik A.S.).
Popov D. V., Meshkova G. D., Hristova P. D., Gradev G. Z., Rusev D. Z., Panayotova M. D., et al. (2020). Pingers as Cetacean bycatch mitigation measure in Bulgarian turbot fishery. Acta Zool. Bulgarica 15, 235–242.
Popov D., Meshkova G., Hristova P., Miteva A., Ilieva T., Dimitrov H. (2021). Line transect surveys of abundance and density of cetaceans in the marine area of the Bulgarian Natura 2000 BG0001001 Ropotamo Site of Community Importance, Black Sea. Acta Zool. Bulgarica 73, 297–304.
Popov D., Meshkova G., Vishnyakova K., Ivanchikova J., Paiu M., Timofte C., et al. (2023). Assessment of the bycatch level for the Black Sea harbour porpoise in the light of new data on population abundance. Front. Mar. Sci. 10. doi: 10.3389/fmars.2023.1119983
Power M. E., Tilman D., Estes J. A., Menge B. A., Bond W. J., Mills L. S., et al. (1996). Challenges in the quest for keystones. Bioscience 46, 609–620. doi: 10.2307/1312990
R Core Team (2017) R: A Language and Environment for Statistical Computing. Available online at: https://www.R-project.org/ (Accessed January 12, 2019).
Rojano-Doñate L., McDonald B. I., Wishniewska D. M., Johnson M., Teilmann J., Wahlberg M., et al. (2018). High field metabolic rates of wild harbour porpoises. J. Exp. Biol. 221, 1–12. doi: 10.1242/jeb.185827
SAMMOA 1.1.2 Système d’Acquisition des données sur la Mégafaune Marine par Observations Aériennes, Software developed by UMS 3462 Pelagis LRUniv-CNRS and Code Lutin, (2012–2019). Available online at: https://www.observatoire-pelagis.cnrs.fr/tools/sammoa/?lang=en.
Sánchez-Cabanes A., Nimak-Wood M., Harris N., de Stephanis R. (2017). Habitat preferences among three top predators inhabiting a degraded ecosystem the Black Sea. Scientia Marina 81, 217–227. doi: 10.3989/scimar.04493.07A
Shiganova T. A., Bulgakova Y. V. (2000). Effect of gelatinous plankton on the Black and Azov Sea fish and their food resources. ICES J. Mar. Sci. 57, 641–648. doi: 10.1006/jmsc.2000.0736
Shiganova T. A., Bulgakova J. V., Sorokin P. Y., Lukashev Y. F. (2000). Investigation of a new invader, Beroe ovata in the Black Sea. Biol. Bull. 27, 247–255.
Shpak O., Glazov D., Kryukova A., Mukhametov L. (2006). “Using photoidentification for studying seasonal distribution of the Black Sea dolphins along the resort coastline of Big Sochi,” in Marine mammals of Holarctic. Ed. Belkovich V. M. (St. Petersburg: RPO Marine Mammal Council), 561–563.
Shulman G. E. (2002). Anchovies of the Sea of Azov and the Black Sea: Regularities of wintering migrations (Brief review). Morskoi Ekologicheskii Zhurnal 1, 67–77.
Smith T. D. (1982). Current understanding of the status of the porpoise populations in the Black Sea. Mamm. Seas 5, 121–130.
STECF (2010). Scientific, Technical and Economic Committee for Fisheries (STECF) – Review of Scientific Advice for 2011 Part 3b Advice on Stocks of Interest to the European Community in the Black Sea. Eds. Daskalov G., Ratz H.-J. (Luxembourg: Publications Office of the European Union).
STECF (2012). Scientific, Technical and Economic Committee for Fisheries (STECF) – Assessment of Black Sea Stocks (STECF-12–15). Eds. Daskalov G., Osio C., Charef A. (Luxembourg: Publications Office of the European Union).
STECF (2017). Scientific, Technical and Economic Committee for Fisheries (STECF) – Stock assessments in the Black Sea (STECF-17–14) (Luxembourg: Publications Office of the European Union).
Tetley M. J., Braulik G. T., Lanfredi C., Minton G., Panigada S., Politi E., et al. (2022). The important marine mammal area network: A tool for systematic spatial planning in response to the marine mammal habitat conservation crisis. Front. Mar. Sci. 9. doi: 10.3389/fmars.2022.841789
Thomas L., Buckland S. T., Rexstad E. A., Laake J. L., Strindberg S., Hedley S. L., et al. (2010). Distance software: design and analysis of distance sampling surveys for estimating population size. J. Appl. Ecol. 47, 5–14. doi: 10.1111/j.1365-2664.2009.01737.x
Tomilin A. G. (1957). Mammals of the USSR and Adjacent Countries. Vol. IV. Cetaceans (Moscow: USSR Academy Science Publication House), 717.
Tonay A. M. (2016). Estimates of cetacean by-catch in the turbot fishery on the Turkish Western Black Sea Coast in 2007 and 2008. Marine Biological Association of the United Kingdom. J. Mar. Biol. Assoc. United Kingdom 96, 993–998. doi: 10.1017/S0025315416000060
Tonay A. M., Dede A., Öztürk A. A., Öztürk B. (2007). Stomach content of harbour porpoises (Phocoena phocoena) from the Turkish western Black Sea in spring and early summer. Rapport Commission Internationale Pour l’Explor. Scientif. la Mer Méditerranée 38, 616.
Tonay A. M., Öztürk A. A. (2012). Historical records of cetacean fishery in the Turkish seas. J. Black Sea/Mediterranean Environ. 18, 388–399.
Uludüz N., Yanchukov A., Sözen M. (2020). Seasonal dynamics of occurrence and group size of three species of cetaceans (Delphinidae and Phocoenidae) on the southwestern coast of the Black Sea. Scientia Marina 84, 431–439. doi: 10.3989/scimar.2020.84n4
Viaud-Martinez K. A., Vergara M. M., Gol’din P. E., Ridoux V., Özturk Amaha A., Özturk B., et al. (2007). Morphological and genetic differentiation of the Black Sea harbour porpoise Phocoena phocoena. Mar. Ecol. Prog. Ser. 338, 281–294. doi: 10.3354/meps338281
Vinogradov M. E., Shushkina E. A., Musaeva E. I., Sorokin P. Y. (1989). New settler in the black sea-comb jelly mnemiopsis leidyi (Agassiz). Okeanologiya 29, 293–299.
Vishnyakova K. A. (2017). Black Sea harbour porpoise (Phocoena phocoena) in the Sea of Azov and the north-eastern part of the Black Sea: population morphology and demography. Schmalhausen Institute of Zoology, Kyiv.
Vishnyakova K., Tonay A. M., Popov D., Meshkova G., Paiu M., Danyer I. A., et al. (2023). “An unusually high number of cetacean strandings in the Black Sea 2022 - is it the consequence of war?,” in 34th ECS Conference, Galicia, O Grove. 256.
Vyshnevskyi V., Shevchuk S., Komorin V., Oleynik Y., Gleick P. (2023). The destruction of the Kakhovka dam and its consequences. Water Int. 48, 631–647. doi: 10.1080/02508060.2023.2247679
Wood S. N. (2011). Fast stable restricted maximum likelihood and marginal likelihood estimation of semiparametric generalized linear models. J. R. Stat. Soc (B) 73, 3–36. doi: 10.1111/j.1467-9868.2010.00749.x
Yakovlev V. N. (Ed.) (1995). Status of Biological Resources of the Black Sea and the Sea of Azov (Kerch: YugNIRO).
Yankova M. (2011). An overview of the distribution of horse mackerel Trachurus mediterraneus in the Black Sea. Proc. Union Scientists–Varna Ser. Tech. Sci., 89–91.
Yasui W. Y., Gaskin D. E. (1986). Energy budget of a small cetacean, the harbour porpoise, Phocoena phocoena (L.). Ophelia 25, 183–197. doi: 10.1080/00785326.1986.10429749
Zaitsev Y., Mamaev V. (1997). Marine Biological Diversity in the Black Sea: A Study of Change and Decline (New York: United Nations Publishers).
Zalkin V. I. (1938a). Distribution of the Black Sea common dolphin during the summer and autumn. Trudy AzCherNIRO. 2, 211–230.
Zalkin V. I. (1938b). Morphological characteristics, systematic status and zoogeographic significance of the harbour porpoise from the Azov and Black Seas. Zoologichesky Zhurnal 17, 706–733.
Zalkin V. I. (1940). Certain observations on biology of Azov and Black Sea dolphins. Bulleten’ Moskovskogo Obshchestva Ispytateley Prirody (Biology Division) 49, 61–70.
Zemsky V. A. (1996). “History of the Russian fishery of dolphins in the Black Sea,” in Proceedings of the First International Symposium on the Marine Mammals of the Black Sea, Istanbul, Turkiye, 27–30 June 1994. 46–48 (Istanbul: ACAR Matbaacilik AS).
Zemsky V. A., Yablokov A. V. (1974). “Catch statistics, short history of exploitation and present status of Delphinus delphis, Tursiops truncatus and Phocoena phocoena in the Black Sea,” in FAO/ACMRR Group II Meeting, La Jolla, USA, 16–19 December 1974. FAO, Rome.
Keywords: Black Sea dolphins, Black Sea porpoises, aerial survey, abundance, distribution, ASI, CeNoBS, MSFD
Citation: Paiu R-M, Cañadas A, Dede A, Meshkova G, Murariu D, Amaha Ozturk A, Popov D, Tonay AM, Timofte C, Kopaliani N, Gol’din P and Panigada S (2024) Density and abundance estimates of cetaceans in the Black Sea through aerial surveys (ASI/CeNoBS). Front. Mar. Sci. 11:1248950. doi: 10.3389/fmars.2024.1248950
Received: 27 June 2023; Accepted: 24 May 2024;
Published: 11 June 2024.
Edited by:
Roberto Carlucci, University of Bari Aldo Moro, ItalyReviewed by:
Luis Cardona, University of Barcelona, SpainThomas Doniol-Valcroze, Fisheries and Oceans Canada (DFO), Canada
Copyright © 2024 Paiu, Cañadas, Dede, Meshkova, Murariu, Amaha Ozturk, Popov, Tonay, Timofte, Kopaliani, Gol’din and Panigada. This is an open-access article distributed under the terms of the Creative Commons Attribution License (CC BY). The use, distribution or reproduction in other forums is permitted, provided the original author(s) and the copyright owner(s) are credited and that the original publication in this journal is cited, in accordance with accepted academic practice. No use, distribution or reproduction is permitted which does not comply with these terms.
*Correspondence: Romulus-Marian Paiu, romulus.marian@gmail.com; Ana Cañadas, anacanadas65@gmail.com; Pavel Gol’din, pavelgoldin412@gmail.com