Algal symbiont genera but not coral host genotypes correlate to stony coral tissue loss disease susceptibility among Orbicella faveolata colonies in South Florida
 Allison M. Klein1*
  Alexis B. Sturm1
  Ryan J. Eckert1
  Brian K. Walker2
  Karen L. Neely2
  Joshua D. Voss1*
- 1Harbor Branch Oceanographic Institute at Florida Atlantic University, Fort Pierce, FL, United States
- 2Halmos College of Natural Sciences and Oceanographic Nova Southeastern University, Davie, FL, United States
Stony coral tissue loss disease (SCTLD) has spread throughout the entirety of Florida’s Coral Reef (FCR) and across the Caribbean, impacting at least 30 coral species. The threatened hermatypic coral, Orbicella faveolata, demonstrates intraspecific variation in SCTLD affectedness with some colonies experiencing chronic disease lesions, while other nearby O. faveolata colonies appear unaffected with no disease signs over long monitoring periods. This study evaluated potential genotypic underpinnings of variable disease responses to SCTLD by monitoring and sampling 90 O. faveolata colonies from southeast Florida and the lower Florida Keys. High resolution analyses of >11,000 single nucleotide polymorphisms (SNPs) generated from 2bRAD sequencing indicated there were no SNP loci or genetic lineages significantly associated with O. faveolata SCTLD affectedness. Genotypic differences may still contribute to SCTLD susceptibility; however, these differences were not captured using this reduced representation sequencing approach. Algal symbiont community structure characterized from 2bRAD data revealed that the presence of Durusdinium spp. corresponded with SCTLD-affected colonies as compared to unaffected colonies, suggesting that algal symbiont community make-up may play some role in SCTLD resistance. Data generated by this study will be combined with complementary molecular and physiological approaches to further investigate the complex drivers of intraspecific SCTLD susceptibility and resilience.
Introduction
Florida’s Coral Reef (FCR) has experienced drastic declines in coral cover and reef accretion related to many stressors including thermal anomalies and coinciding bleaching events driven by global climate change (Ruzicka et al., 2013; Kemp et al., 2014; Toth et al., 2018), nutrient pollution (Lapointe et al., 2019), and disease events (Porter and Meier, 1992). In 2014, a novel white disease termed stony coral tissue loss disease (SCTLD) emerged and, due to its rapid lesion progression, high mortality rate, large number of affected species, and extensive spatial and temporal persistence, became the most detrimental Caribbean coral disease to date (Precht et al., 2016; Florida Coral Disease Response Research & Epidemiology Team, 2018; Alvarez-Filip et al., 2019; Meiling et al., 2021; Dobbelaere et al., 2022; Hayes et al., 2022). SCTLD was first observed in Miami-Dade County, Florida in 2014, Florida and by 2020 had spread throughout the entirety of FCR and other parts of the Caribbean (AGRRA, 2023). By early 2023, 22 countries and jurisdictions were affected by SCTLD ranging from the Bahamas in the northeast, to Grenada in the southeast, to the coasts of Mexico, Belize, and Honduras on the western edge of the Caribbean basin (AGRRA, 2023). This highly transmissible disease affects at least 30 coral species, and following the SCTLD outbreak, the northern portion of FCR experienced a 59% decline in live coral tissue area (Hayes et al., 2022). Monitoring efforts of 4 reefs spanning over 10 kilometers in the Middle Keys revealed that within just one month of its initial detection at a singular site, SCTLD had rapidly spread to all four monitoring sites, underscoring the disease’s remarkable capacity for rapid transmission (Sharp et al., 2020). Further south, SCTLD has also affected hundreds of kilometers of reef throughout the Florida Keys with severe losses in coral cover (Muller et al., 2020; Williams et al., 2021).
Coral species vary in their susceptibility to SCTLD, and are categorized into three susceptibility groups: high, intermediate, and low (Meiling et al., 2020; Florida Coral Disease Response Research & Epidemiology Team, 2018). Highly susceptible species such as Dendrogyra cylindrus, Dichocoenia stokesii, and Meandrina meandrites succumb very rapidly to the disease, with total colony mortality occurring within one week to two months of initial disease onset (Florida Coral Disease Response Research & Epidemiology Team, 2018). Low- susceptibility species such as Acropora cervicornis and A. palmata are rarely affected during an outbreak (Florida Coral Disease Response Research & Epidemiology Team, 2018). Intermediately susceptible species include important reef-builders such as Montastraea cavernosa, Orbicella annularis, O. faveolata, O. franksi, and Siderastrea siderea. These species have relatively high disease prevalence but relatively slow disease lesion progression across the colony (Florida Coral Disease Response Research & Epidemiology Team, 2018).
In addition to the interspecific variation in SCTLD susceptibility, intraspecific variation has also been observed, especially within the intermediately susceptible coral species category (Aeby et al., 2021; Kelley et al., 2022; Walker et al., 2023). Long-term SCTLD monitoring studies tracking individual, conspecific colonies suggest that variations in disease susceptibility may have genotypic underpinnings (Brunelle, 2020). SCTLD is transmissible through the water column and sediment (Aeby et al., 2021; Dobbelaere et al., 2022; Studivan et al., 2022), suggesting that all neighboring colonies on a reef are exposed to SCTLD and variances in disease resistance may be driven by intrinsic differences among colonies. For example, in southeast Florida and the lower Florida Keys some O. faveolata colonies exhibit multiple SCTLD lesions either simultaneously or overtime, in some cases resulting in whole colony mortality. However, other nearby O. faveolata colonies on the same reef consistently appear unaffected by SCTLD with no lesions or tissue loss observed. Orbicella faveolata is an important reef-building coral in the Caribbean that contributes significantly to the three-dimensional structure and reef framework along FCR. Members within the Orbicella genus have relatively slow growth (0.76 cm/yr) and a long lifespan, making it difficult to restore these populations with current outplanting techniques or for populations to naturally recover to pre-disturbance levels of live coral cover (Gladfelter et al., 1978). Micro-fragmentation of boulder corals such as O. faveolata has been shown to lead to rapid growth and colony fusion, however restoring new colonies to historic sizes (exceeding 2 meters) remains time intensive (Forsman et al., 2015; Page et al., 2018). Due to extreme die-offs, O. faveolata has been listed as a threatened species under the Endangered Species Act (NMFS, 2014). Investigation into the genetic framework of O. faveolata is important as genetic variation within a species can serve as the basis for their physiological responses or capacity to withstand stressors such as disease or thermal anomalies (Yetsko et al., 2020; Cunning et al., 2021; Drury et al., 2022). A. cervicornis corals in Panama have variable disease responses to white band disease (WBD) suggesting that disease resistance may have an underlying genetic basis. Similarly, in the Florida Keys 12.5% of A. cervicornis and 17% of A. palmata genotypes were resistant to an uncharacterized tissue loss disease (Miller et al., 2019). Recent research found disease resistance in A. cervicornis to be polygenic with 10 genomic regions and 73 loci identified to be associated with disease resistance (Vollmer et al., 2023).
Differences in disease prevalence and resistance have also been linked to varying abundances of algal symbionts. Increased algal symbiont densities within the host in O. faveolata have been linked to a reduction in overall host immunity (Fuess et al., 2020). More recent research has proposed a hierarchy among the four dominant symbiont genera, Symbiodinium, Breviolum, Cladocopium, and Durusdinium and their influence on susceptibility to SCTLD (Dennison et al., 2021). This hierarchy from least to highest susceptibility is tentatively ranked as Breviolum >> Cladocopium >> Durusdinium >> Symbiodinium (Dennison et al., 2021). Due to the complexity of the coral holobiont and challenges associated with identifying a causative agent of SCTLD, holistic investigation into the internal and external drivers of host susceptibility and resistance are needed.
To investigate if coral host genotype is driving varying resistance to SCTLD in O. faveolata colonies along FCR, we used a high-resolution 2bRAD single nucleotide polymorphism (SNP) genotyping approach (Wang et al., 2012). This method allows for the generation of thousands of SNP markers dispersed throughout the genome that can quantify O. faveolata genomic diversity and genetic structure among the varying resistance levels and across collection sites. This type of sequencing can potentially link host genotype to SCTLD susceptibility and resistance. RAD-sequencing techniques can also allow for algal symbiont sequences to be aligned to genomic references available from the four dominant algal symbiont genera known to associate with scleractinian hosts, generating a proxy of algal symbiont community structure (Manzello et al., 2019). Although 2bRAD’s resolution for algal symbionts is limited to genus level, it is comparable to genus-level community structure characterized by other sequencing markers such as ITS2 amplicon sequencing (Sturm et al., 2022; Eckert et al., 2023). Assessing corals’ algal assemblages can be beneficial for understanding coral holobiont ecology and for examining the potential relationship between algal symbiont community variation and SCTLD affectedness. This may be especially helpful as histopathological findings have linked SCTLD lesion emergence with a breakdown of the host-zooxanthellae relationship (Landsberg et al., 2020). More recent research into SCTLD pathology suggests an infection of the Symbiodiniaceae itself rather than the coral host, furthering the need for investigation into both host and holobiont disease dynamics (Beavers et al., 2023).
To further our understanding of SCTLD dynamics, 90 O. faveolata colonies with varying disease susceptibility were sampled along Florida’s Coral Reef (Figure 1) and analyzed using a high-resolution 2bRAD single-nucleotide polymorphism (SNP) genotyping approach. This approach generated a suite of thousands of SNP markers dispersed throughout the genome (Wang et al., 2012) providing insight about the roles of both host genetics and symbiont community on SCTLD affectedness.
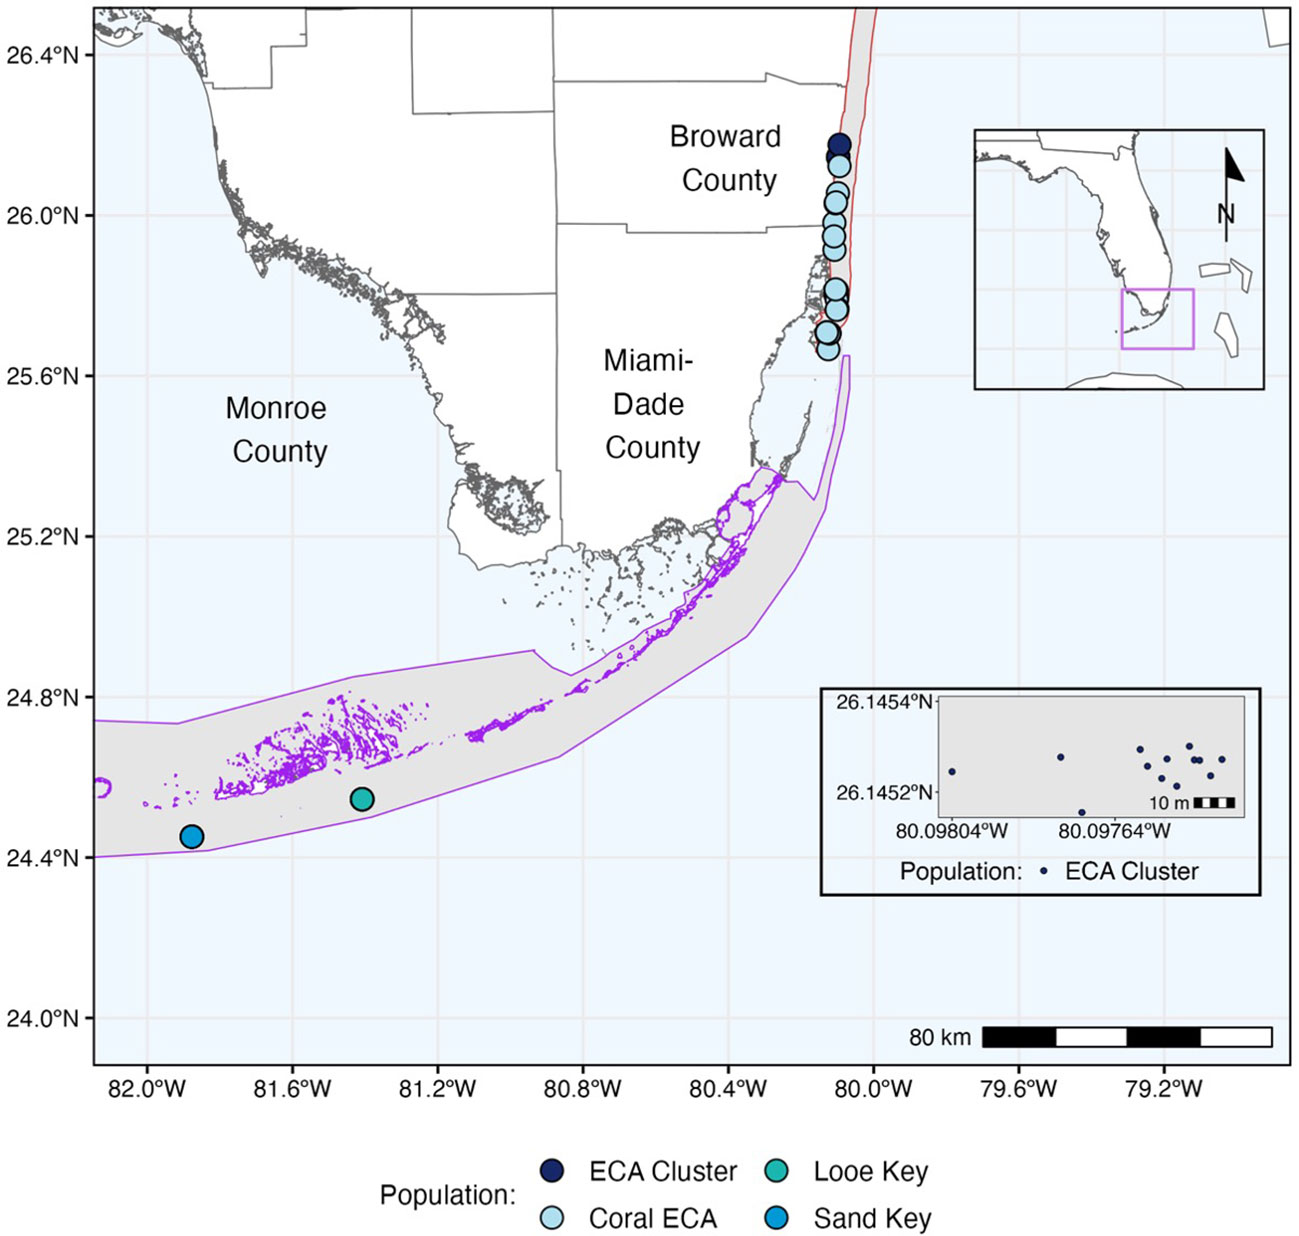
Figure 1 Map of Florida’s Coral Reef (FCR) with O. faveolata sample sites denoted by dots, colored by site. Kristen Jacobs Coral Reef Ecosystem Conservation Area (ECA) and Florida Keys National Marine Sanctuary boundaries are shown as red and purple polygons, respectively. The box in the bottom right shows an insert of the ECA cluster site.
Materials and methods
Preliminary site and colony determination
As SCTLD spread across southeast Florida (SEFL) and Florida Keys reefs, intervention efforts included treatment of large priority O. faveolata colonies along with consistent follow-up monitoring (Neely et al., 2021; Walker et al., 2021). Colonies within the ECA were monitored monthly since 2018. Colonies in the Lower Keys were monitored semi-monthly since February 2019 (Looe Key) and October 2019 (Sand Key). Additionally, the proportion of times each monitored colony was observed with active SCTLD lesions was recorded (Supplementary Table 1). Observed intraspecific differences in SCTLD susceptibility from these efforts led to the development of the SCTLD Resistance Research Consortium (RRC), in which multiple collaborators are using complementary multidisciplinary approaches to evaluate the potential biological drivers of variable SCTLD susceptibility among O. faveolata (Walker et al., 2023). Tracked colonies were classified into resistance groups based on the observed frequency of SCTLD lesions across multiple monitoring events. Orbicella faveolata colonies that were never observed with active lesions and appeared completely unimpacted by the disease were characterized as SCTLD-unaffected. Colonies that were affected at least once or colonies that regularly developed new SCTLD lesions over time were characterized as SCTLD-affected.
Corals from two regions were sampled and analyzed. The first lies within the Kristin Jacobs Coral Reef Ecosystem Conservation Area (Coral ECA) in Broward County, just north of where SCTLD was first observed in Miami (Precht et al., 2016) (Supplementary Figure 1). At the time of sampling in 2021, SCTLD had been present in the Coral ECA for seven years, and overall prevalence had declined since the initial outbreak (Walker et al., 2021; Hayes et al., 2022). Tissue samples in the Coral ECA region (n=45) were collected from O. faveolata colonies in shallow (< 10m) nearshore habitats in the Broward-Miami coral reef ecoregion (Walker, 2012) within the Coral ECA. In the Lower Keys region, O. faveolata tissue samples came from colonies at both Looe Key (n=24) and Sand Key (n=21) within the Florida Keys National Marine Sanctuary (FKNMS) (Supplementary Figure 2). Within each region, 30 SCTLD-affected colonies and 15 SCTLD-unaffected colonies were sampled. At the time of sampling, SCTLD had been present at Looe Key for three years and at Sand Key for two years.
Colonies were monitored throughout sampling and data from this monitoring has been included in this manuscript as of August 2023. The number of times a colony was actively diseased when monitored was recorded (Supplementary Table 2).
Sample collection
Tissue and upper skeletal cores were taken from O. faveolata colonies by SCUBA divers using 1 cm diameter leather punches. Photos of each colony were taken before and after sampling. Depth, location, and orientation of the core location were recorded. Voids from sample punches were plugged with modeling clay to aid in colony recovery. Coral cores were placed in whirl-paks and immediately transferred to the surface after sampling. At the surface, core samples were placed into sterile 5 ml tubes with ~3 ml of Zymo DNA/RNA shield preservative and kept on ice while transported back to the lab where they were stored at -80°C until genomic DNA extraction.
Genomic DNA extraction and 2bRAD library preparation
Orbicella faveolata coral cores were halved using a hammer and chisel and genomic DNA was extracted using a modified dispersion buffer extraction optimized for increasing DNA quality and downstream 2bRAD library preparation success following current protocols (Sturm et al., 2021). Extracted DNA was purified using the Zymo DNA Clean and Concentrate Kit following manufacturer’s protocols and eluted into 20 µl of nuclease free water. Purified DNA quality was then quality checked on a NanoDrop 2000 (Thermofisher) and quantified on a Qubit 4.0 fluorometer (Thermofisher). DNA concentrations were then normalized to 25 ng µl-1 as a template for SNP genotyping using the 2bRAD RAD-seq method (Sturm et al., 2021). 2bRAD libraries were prepared using an existing protocol with the summarized modifications (Wang et al., 2012). Digestion of 100 ng DNA was completed using the type IIB restriction enzyme BcgI. Unique in-line index adapters were ligated onto digested DNA fragments and subsequent dual indices were added to pooled ligations via PCR. Digestion, ligation, and PCR amplification were performed in triplicate on three samples as a method for identifying naturally occurring clones (Manzello et al., 2019). Pooled, uniquely indexed libraries were sequenced on a single lane of the Illumina NovaSeq using a S1 SR-100 flowcell. Sequence data were demultiplexed into eight pools by the sequencing facility based on their unique indices, further demultiplexed using their in-line index, then quality-filtered and trimmed using custom Perl scripts (https://github.com/z0on/2bRAD_denovo).
Coral host genotyping
Along with DNA from the coral host, DNA from the algal symbionts is also co-extracted and prepared into 2bRAD libraries. To isolate coral host sequences from algal sequences, high-quality 2bRAD reads were first mapped to a concatenated Symbiodiniaceae metagenome using the Symbiodinium microadriacticum (Aranda et al., 2016), Breviolum minutum (Shoguchi et al., 2013) Cladocopium goreaui (Liu et al., 2018), and Durusdinium trenchii (Shoguchi et al., 2013) genomes with the software package Bowtie 2 (Langmead et al., 2009). These reads were then aligned to the O. faveolata genome (Prada et al., 2016). Sequence reads that mapped to both the Symbiodiniaceae metagenome and the O. faveolata genome were discarded from subsequent analyses as the sequence origin could not be determined.
High-quality reads that aligned uniquely to the O. faveolata genome were used for downstream population genetic analyses. The program ANGSD was used to identify SNP loci from sequencing reads using the following filters: minimum mapping quality scores of 20, minimum base quality scores of 30, p-value of 10-5 for variable locus, a baseline of at least 80% of non-missing genotypes across samples, minimum p-value of 10-5 for Hardy Weinberg equilibrium, minimum p-value of 10-5 for strand bias, minimum p-value of 10-6 for polymorphic sites, minimum allele frequency of 0.05, and a filter that removed tri-allelic SNPs. ANGSD also generated genotype likelihoods and created an identity-by-state (IBS) genetic distance matrix which was used to create a cluster dendrogram identifying patterns of genetic similarity (Korneliussen et al., 2014). A minimum genetic distance threshold for clonal groups was defined by the lowest level of genetic similarity among a set of technical replicates; any sample clusters that fell below this threshold were identified as natural genetic clones (Manzello et al., 2019). One member of each clonal group was kept for subsequent analyses based on the highest number of reads and coverage. Three samples later identified as O. franksi were removed from all subsequent analyses.
Two distinct O. faveolata lineages were observed in the clustered dendrogram. To avoid ascertainment bias, ANGSD was run on each lineage separately using the same filters as above. SNP sites were extracted from each lineage to find common SNPs across lineages, then ANGSD was re-run on both lineages together using only these common sites. A new genetic distance IBS matrix was created and used to conduct a Principal Coordinates Analysis (PcoA). An Analysis of Molecular Variance (AMOVA, 99 permutations) was conducted using the program poppr v2.9.2, and adegenet v2.1.4 on the BCF file produced by ANGSD, using both SCTLD affectedness and region as factors (Jombart and Ahmed, 2011; Kamvar et al., 2014).
Pairwise fixation index (FST) values between each SCTLD disease status as well as between sampling regions were calculated using the package STAMPP v1.6.3, and heatmaps of these values were generated (Pembleton et al., 2013). Heterozygosity was calculated across all SNPs using ANGSD v0.933 and a custom R script (Manzello et al., 2019). Inbreeding and relatedness coefficients for all samples were calculated using the software NgsRelate (Korneliussen and Moltke, 2015). Differences between heterozygosity, inbreeding, and relatedness coefficients across populations were assessed using one-way ANOVAs. Tukey tests were run as post hoc analysis for significant ANOVAs using the package rstatix v0.7.0 (Kassambara, 2021).
Population structure was assessed using NGSadmix for K = 1−8 (the number of populations sampled plus 3 to identify potential sub-population structure; Skotte et al., 2013). The programs Clumpak and StuctureSelector were then used to assess K likelihoods. Clumpak uses the Evanno method, and Structure Selector uses the Puechmaille method (Kopelman et al., 2015; Puechmaille, 2016; Li and Liu, 2018). Using two different but complementary programs to assess population structure is a common practice in population genetic studies as multiple methods can help validate the consistency of population structure inference (Puechmaille, 2016). The program BayeScan was used to identify any outlier SNPs (50,000 burn-in, 5,000 iterations; Foll and Gaggiotti, 2008).
Algal symbiont typing
High-quality reads that aligned uniquely to the concatenated Symbiodiniaceae metagenome were used to determine the dominant algal symbiont type for each sample. Relative alignment rates to each of the four symbiont genomic references were used as a proxy for the relative abundance of the four algal symbiont genera associated with each colony. A permutational multivariate analysis of variance (PERMANOVA, 999 permutations) was run using a beta diversity metric to assess differences in the population structure across differing disease susceptibility status as well as across sites. Abundances of each symbiont genera were square root transformed for this PERMANOVA to minimize influence of the most abundant symbiont group. An Indicator Species Analysis (999 permutations) was conducted using the package ‘indiscpecies’ in R to identify potential taxa associated with SCTLD affectedness.
Results
Population genetic structuring
The 2bRAD sequencing approach produced 248 M raw reads before filtering. After trimming, quality filtering, and removal of PCR duplicates, 165 M reads remained with an average of 1.8 M reads per sample. Three samples dropped out in sequencing; one was a unique sample, two were technical replicates in which 2 replicates remained. This left 93 libraries for analyses of the original 96 libraries (90 samples plus 3 sets of replicates). Samples that exhibited high levels of genetic similarity to one another near to the level of technical replicate groups were identified as naturally occurring genetic clones (Pembleton et al., 2013). We identified a total of 16 clones among six clonal groups (Figure 2A). There was one clonal group with five individuals, one clonal group with three individuals, and four clonal groups with two individuals (Figure 2A). Clonal groups occurred in both study regions; within clonal groups, all samples were from the same region, yet there was varying disease affectedness within some clonal groups (Figure 2A).
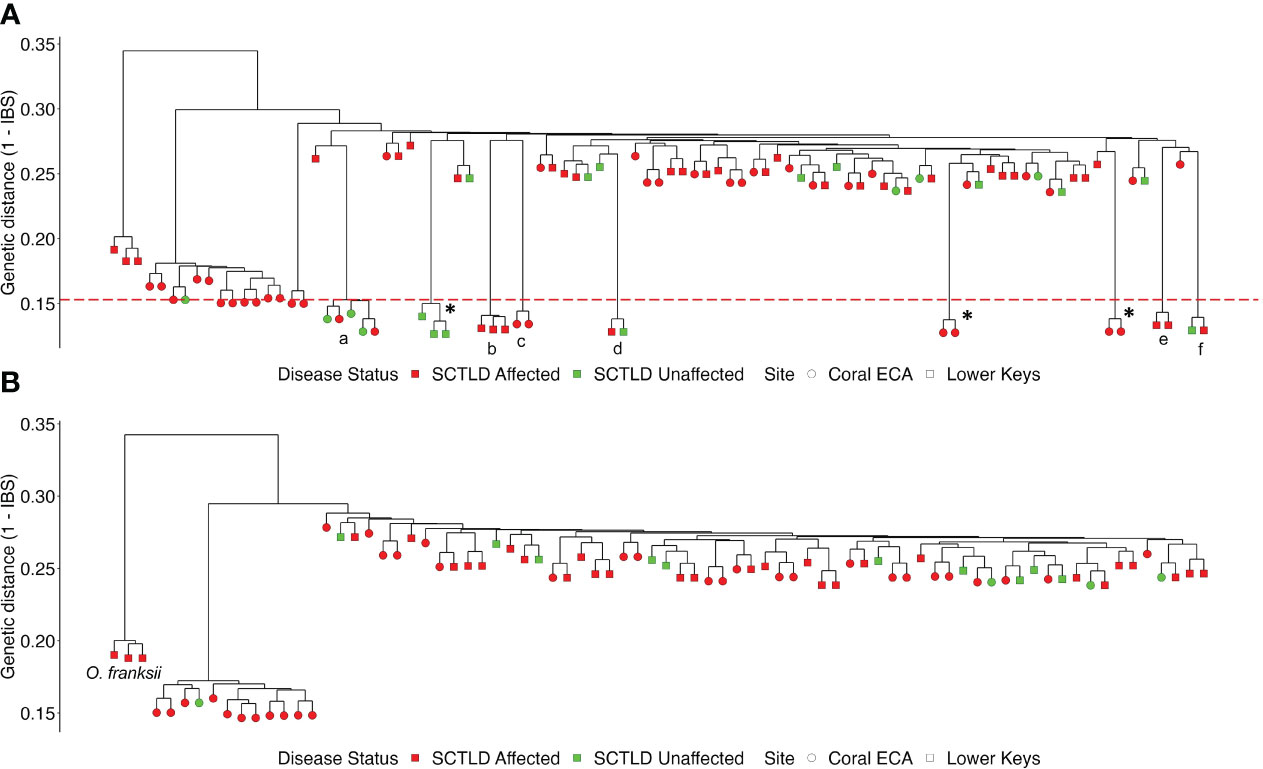
Figure 2 Dendrograms identifying clusters of samples based on Identity-by-State matrix calculations; (A) dataset with clones, (B) clones-removed dataset. Regions are denoted by shape; disease affectedness is denoted by color. The dashed red line indicates the minimum genetic distance threshold for clonal groups. Technical replicates denoted by “*”, clonal groups denoted by letter. Orbicella franksi colonies are labeled and were later removed from further analyses.
There was no visual separation into genetic clusters based on disease affectedness and AMOVA did not attribute any significance among variation in disease affectedness (p = 0.71). Branches produced by the dendrogram were mixed with both SCTLD-affected and SCTLD-unaffected individuals (Figure 2). After the removal of clones and technical replicates, two outgroups remained (Figure 2B on the left). One group consisted of three colonies from Sand Key, which had the highest genetic distance from the rest of the samples. These samples were subsequently identified as colonies of the congener O. franksi, based on further in situ observations and review of photographs. The O. franksi samples were removed from the dataset for all subsequent analyses. The second outgroup cluster included colonies that were all sampled from a tight cluster of colonies at the northernmost collection site in the Coral ECA. These O. faveolata colonies are a distinct lineage from that of the rest of the colonies sampled and deemed Lineage 1 ECA (L1_ECA).
Both Clumpak and StuctureSelector K selection approaches identified the optimal number of genetic clusters as K = 2 (Figure 3). The genetic cluster indicated in yellow represents 12 colonies collected at the northernmost ECA collection site, L1_ECA. These colonies make up a cluster patch along FCR and all reside within 10m of one another. All other colonies were dominated by a second genetic lineage indicated in blue (Figure 3). Colonies in the blue lineage were from both the coral ECA and the Lower Keys; Lineage 2 ECA (L2_ECA) and Lineage 2 Lower Keys (L2_LK). The same analysis was re-run with L1_ECA colonies removed as a quality check and no genetic structuring among remaining colonies was observed. Outlier SNPs were not detected when populations were defined by sampling region, lineage, or disease affectedness.
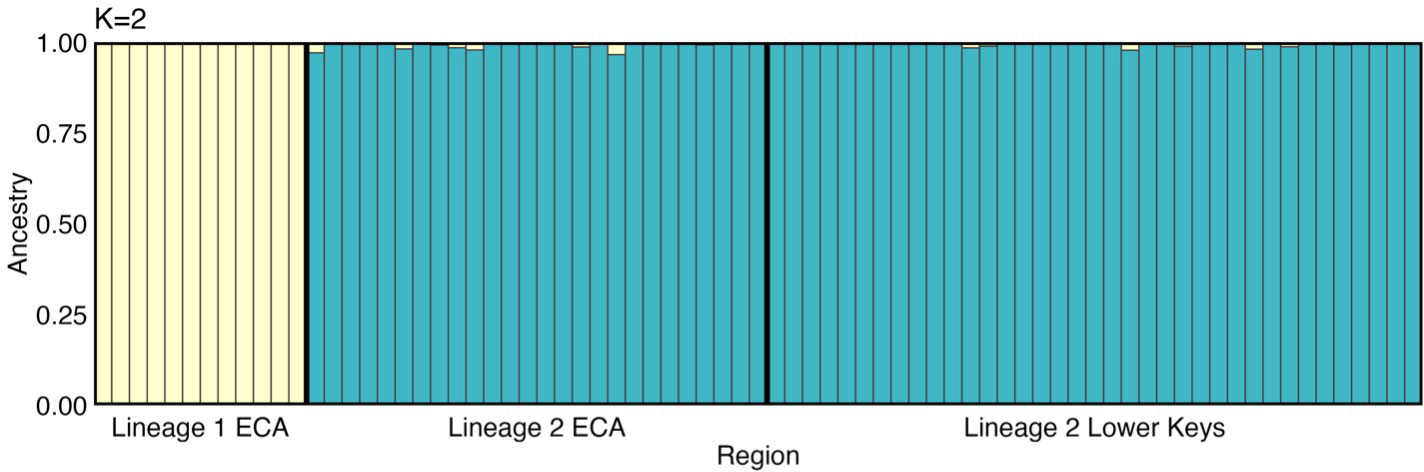
Figure 3 Population structure model (K = 2) generated by admixture analyses using genotype likelihoods. Genetic clusters are represented by the colors blue and yellow. Site denoted on x-axis.
After clones, technical replicates, and O. franksi samples were removed, ANGSD was re-run using common SNP sites between the two lineages and a total of 2,623 SNPs were identified. Two tight clusters were identified by PCoA, the first consisting of L1_ECA and the second consisting of Lineage 2. (Figure 4A). To better visualize potential differences among these lineages, two separate PCoAs were conducted; one with just L1_ECA, and one with all Lineage 2 colonies. Neither PCoA showed distinct differentiation or clustering among individuals according to disease affectedness (Figures 4B, C). The AMOVA indicated significant differentiation among regions, explaining 5.90% of the total genetic variation across samples (p = 0.01), however, there was no significant differentiation between disease affectedness. Pairwise FST values indicated that colonies from Lineage 1 were significantly differentiated (post FDR-correction, p < 0.05) from all other colonies in both regions (Figure 5), which is consistent with the clustering exhibited in the PCoA. Pairwise FST values demonstrated no significant differentiation among colonies of differing disease affectedness.
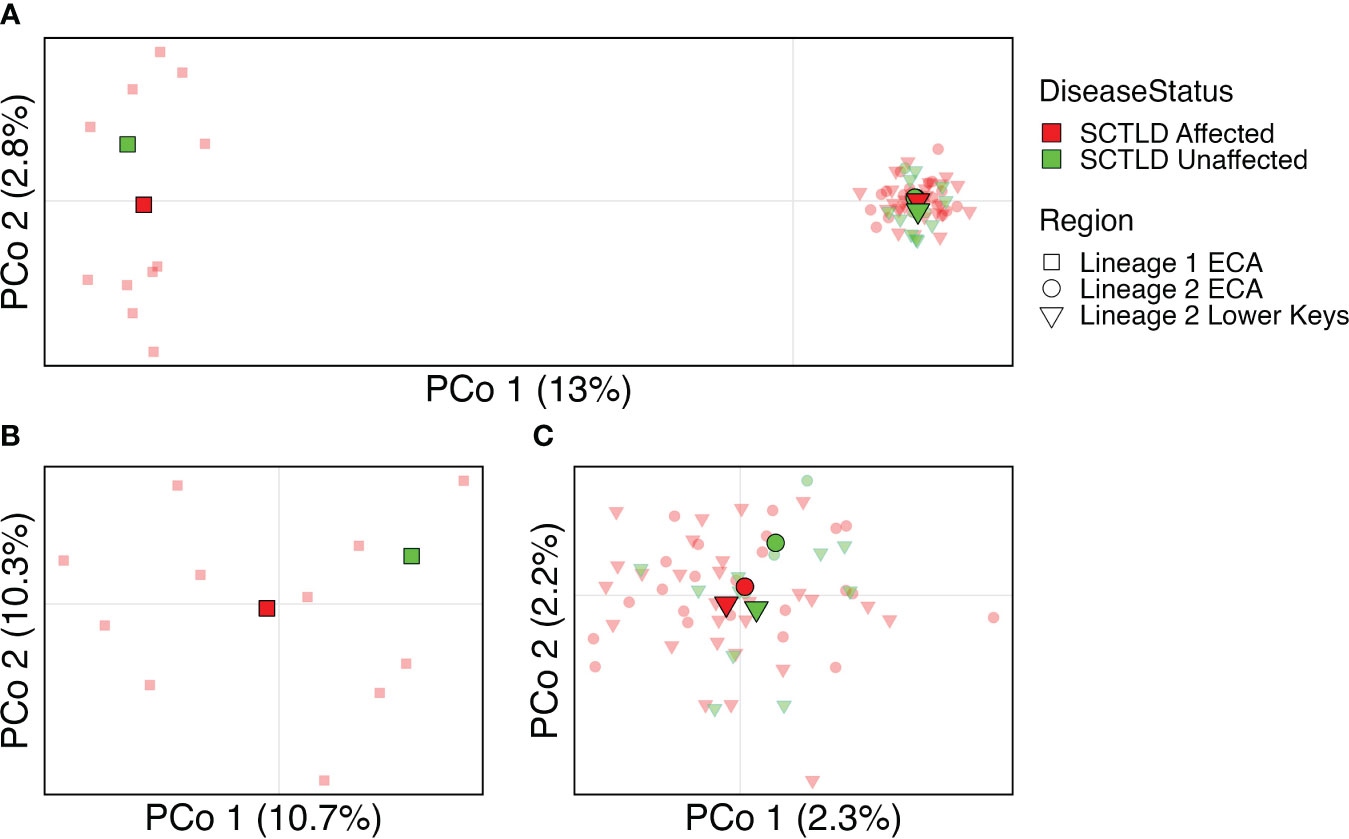
Figure 4 Principal coordinates analysis showing clustering of samples by disease affectedness (color) and region (shape). Individual samples are represented by transparent points. Population centroids are indicated by solid points. Percent variation is explained by each axis is indicated. (A) shows all samples, (B) shows Lineage 1 ECA, (C) shows Lineage 2 ECA and Lower Keys.
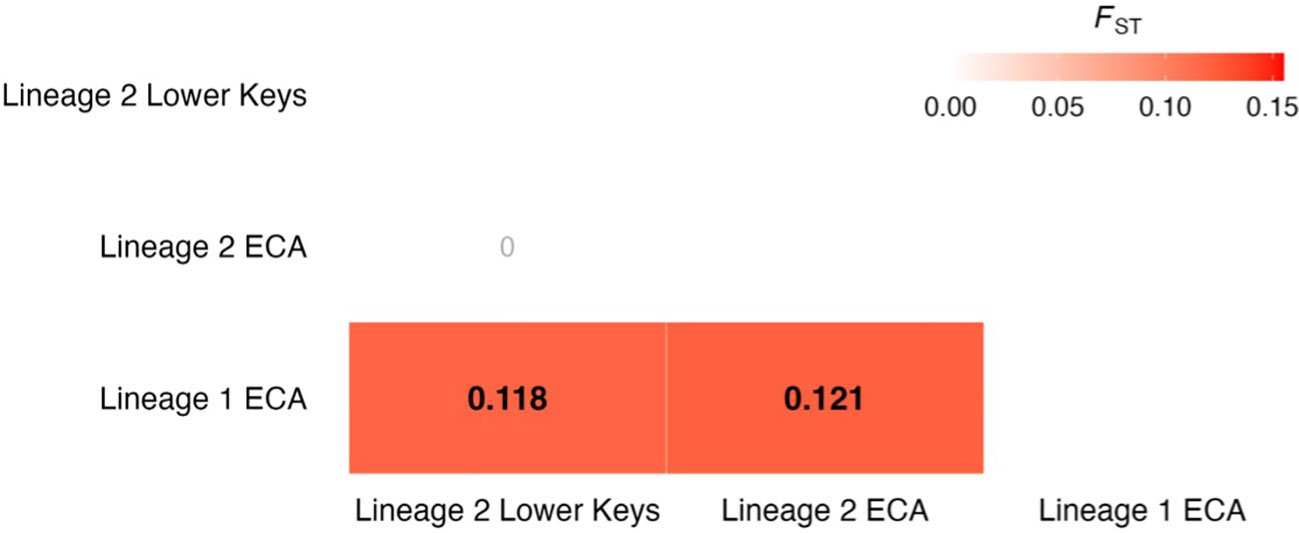
Figure 5 Pairwise fixation index values (FST) for all sample sites displayed as a heat map. Statistically significant values are bolded (post FDR-correction, p < 0.05).
To further visualize potential relations of individuals with differing disease status, colonies were assigned rankings based on the percentage of monitoring visits during which a colony was actively diseased (Supplementary Table 2). There was no visual separation into genetic clusters based on these disease affectedness rankings in the modified dendrogram (Supplementary Figure 3) nor the PCoA (Supplementary Figure 4).
Heterozygosity, inbreeding, and relatedness
No significant differences in heterozygosity (F(1, 73) = 0.894) or inbreeding (F(1, 73) = 0.171) were identified between SCTLD-affected and SCTLD-unaffected O. faveolata (ANOVA, Figure 6). Lineage 1 ECA had significantly higher levels of heterozygosity across SNPs than both Lineage 2 regions (one-way ANOVA, F(2,72) = 2049, p < 0.001). Lineage 1 also had significantly lower levels of inbreeding (one-way ANOVA, F(2,72) = 19.46, p < 0.001) among colonies compared to Lineage 2.
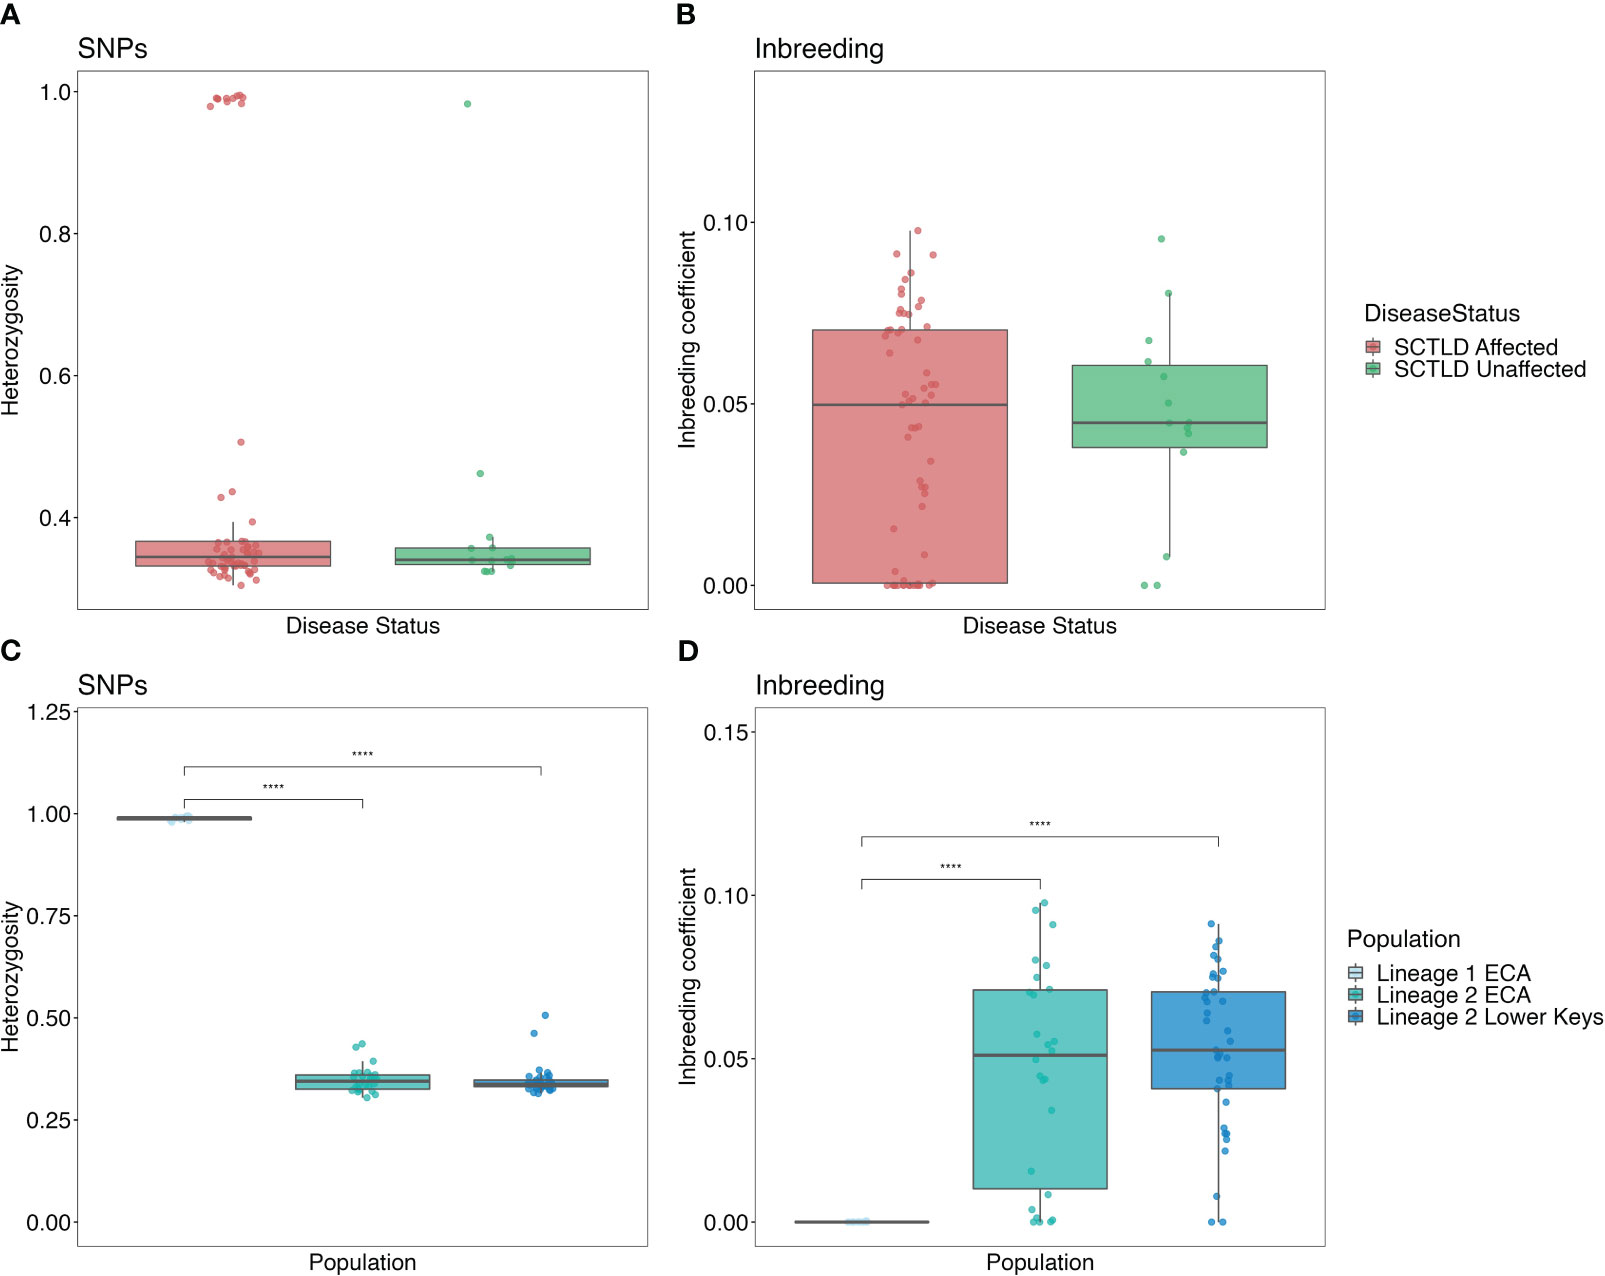
Figure 6 Box and whisker plots displaying heterozygosity and inbreeding coefficient values. Top row displays values for each resistance level, bottom row displays values for each lineage/region. (A, C) Heterozygosity values were calculated using only SNPs and (B, D) inbreeding coefficients. Asterisks are used to denote significance (p < 0.0001).
Algal symbiont analyses
The PERMANOVA analysis revealed that dominant symbiont type had a significant effect on disease affectedness (PERMANOVA F(1,89)= 3.687, p < 0.01). Overall, the majority of reads that aligned to the algal symbiont genomes aligned to Breviolum (Figure 7). However, all coral samples dominated by Durusdinium (n=7) fell under the SCTLD-affected category (Figure 7A). The Indicator Species Analysis found that Durusdinium was a notable indicator species in SCTLD-affected colonies as compared to SCTLD-unaffected colonies (Indicator value: 0.281, p < 0.001). Clonal groups also had variation in dominant symbiont taxa (Table 1). Clonal group ‘a’ had three individuals dominated by Breviolum and two samples dominated by Cladocopium, in which one sample dominated by Cladocopium was SCTLD-affected while all other clonal members were unaffected. Clonal group ‘e’ had one individual dominated by Breviolum and one individual dominated by Durusdinium. Both clones were affected by SCTLD (Table 1).
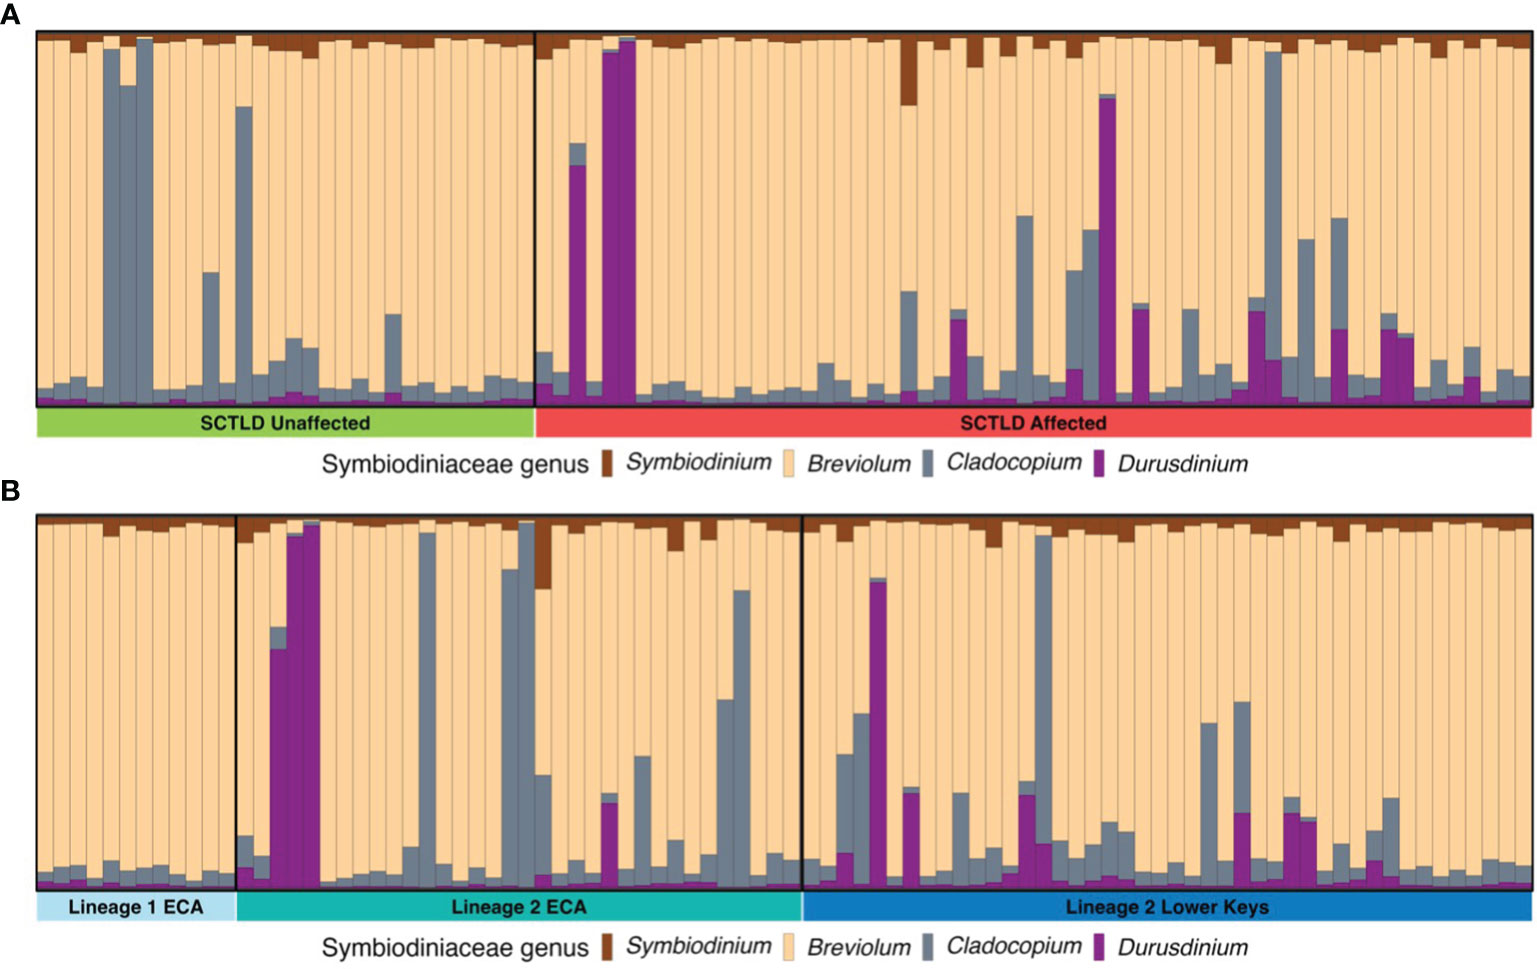
Figure 7 Bar plot representing the proportion of algal symbionts for each coral sample based on mapped reads to genomes of four different genera of algal symbionts, Symbiodinium, Breviolum, Cladocopium, and Durusdinium. Groupings are separated out by disease affectedness (A) and lineage/region (B).
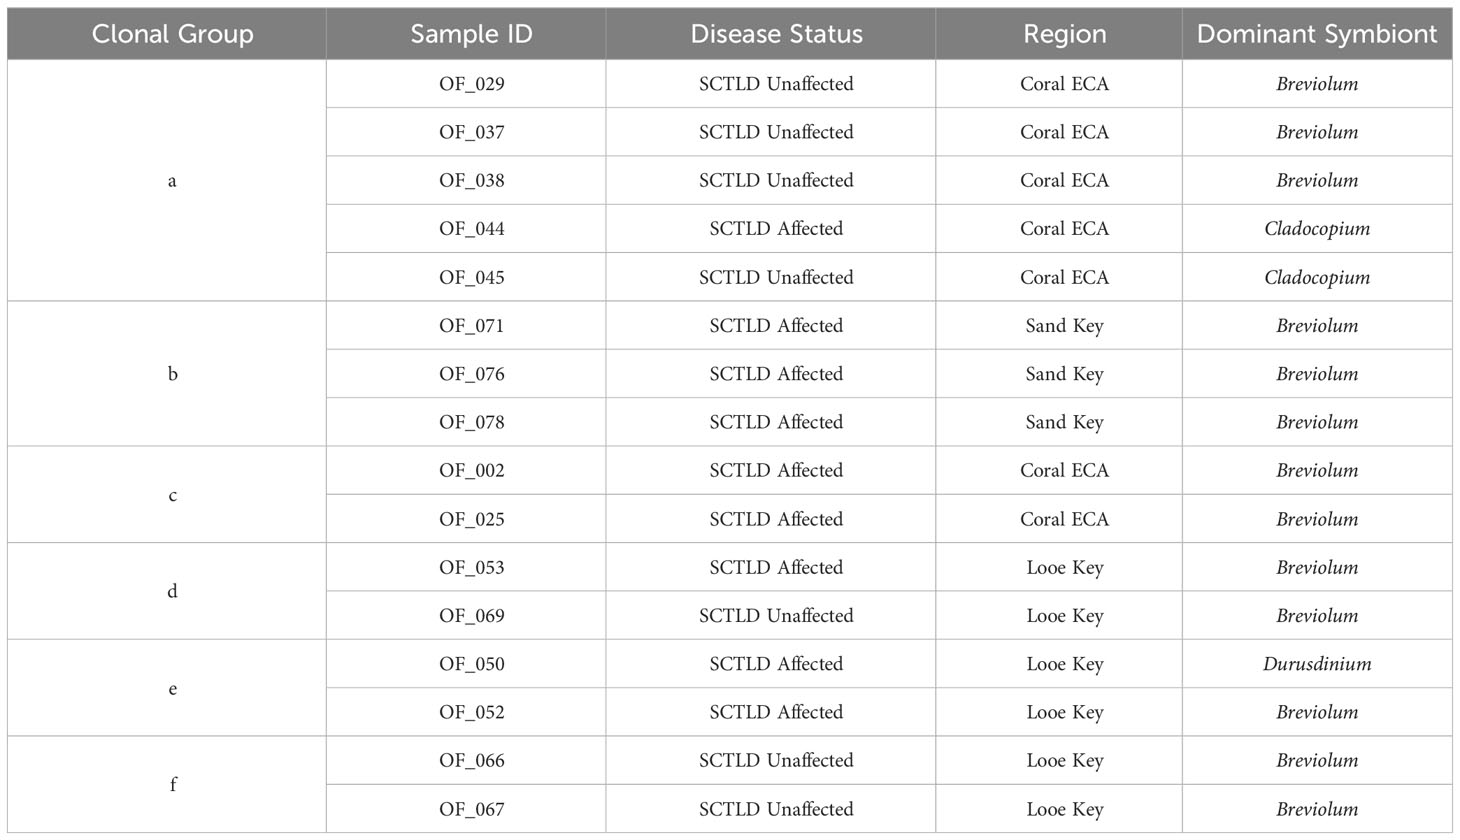
Table 1 Table displaying 6 identified clonal groups with disease status, collection site, and dominant symbiont taxa for each individual noted.
Discussion
Results from this study suggest that there are neither uniquely SCTLD-susceptible nor SCTLD-resistant genetic lineages within O. faveolata in South Florida. Rather, across the sampled populations, each genetic lineage identified included both SCTLD-affected and SCTLD-unaffected colonies. Even within clonal groups we observe both SCTLD-affected and unaffected colonies. Complementary FST results indicated no significant differentiation among SCTLD-affected and SCTLD-unaffected colonies. In the PCoA with L1_ECA removed, a scatter of points along the second axis was observed, however the pairwise FST analyses indicate that this differentiation was not significant. There were also no significant differences in heterozygosity, or inbreeding levels between disease affected and unaffected colonies. Similar results were found in a study in which M. cavernosa from the Flower Garden Banks National Marine Sanctuary were genotyped using the 2bRAD method and their susceptibility to pathogenic Vibrio was subsequently assessed (Kelley et al., 2022). Although individual genotypes had no significant effect on resistance, differences in predictive gene expression to Vibrio infection were observed, suggesting that disease resistance may be driven not by genotypic differences but by differences at the gene expression level (Kelley et al., 2022).
Since this study was conducted in situ, it is impossible to know the exact exposure each colony had to SCTLD. However, compiled research along the Florida Reef Tract has shown corals in close proximity to one another have similar disease exposures. The SCTLD pathogen is likely waterborne and coastal currents appear to be the primary driver of its spread within a region (Precht et al., 2016; Dobbelaere et al., 2020; Muller et al., 2020). Patterns of SCTLD spread appear to be site-wide, for example, Sharp et al., 2020 monitored sites 10km apart in the Middle Keys prior to SCTLD exposure. Once SCTLD was observed to be present at one site, all 4 neighboring sites had signs of the disease in less than a month. Given the proximity of the corals within sample sites, it seems likely that once SCTLD was present on the reef, all sampled colonies were exposed to the disease. Given the assumed equalized exposure, our results indicate that none of the O. faveolata genetic lineages identified show complete resistance to SCTLD.
Notably, the 2bRAD method is a reduced-representation approach that targets a relatively small subset of the entire genome and does not specifically target gene regions. Therefore, we cannot rule out other genomic regions that may underlie disease resistance status that may not have been captured. Future efforts could specifically target gene regions with known involvement in coral immunity or employ increasingly cost-accessible whole-exome or whole-genome sequencing approaches for genome-wide association studies. However, based on the results generated from this 2bRAD approach we find that SCTLD affectedness is not driven by host genetic lineage. Other factors including epigenetic, transcriptomic, metabolomic, or holobiont interactions and environmental stressors must be assessed individually and in combination. All of these factors are presently under investigation in tandem with this study as part of the SCTLD Resilience Research Consortium.
RAD-sequencing is commonly used to identify even fine-scale population genetic structure across spatially variable or heterogeneous environments, and in this study, it identified significant patterns of genetic structure across Florida’s Coral Reef, particularly the differentiation between Lineage 1 and all other colonies across both regions. Population structuring analysis including pairwise FST comparisons identified no significant differentiation across colonies within Lineage 2 suggesting that there are high levels of gene flow among these populations. These findings are in line with other larger scale population genetics studies of O. faveolata throughout the Caribbean that also identified high levels of genetic connectivity across large (>100 km) spatial scales (Rippe et al., 2017; Manzello et al., 2019; Alegría-Ortega et al., 2021).
A larval connectivity modeling study of another broadcast spawning coral species, M. cavernosa, predicted that modeled larvae sourced from the Lower Keys are frequently transported to the outer reef shelf and carried northward by the Florida Current where they commonly settled in northern parts of FCR (Frys et al., 2020). Larval competency in O. faveolata can be up to 30 days (Miller, 2014), and given the velocity of the Florida Current, it would be possible for larvae from the Lower Keys to travel to and successfully recruit in the Coral ECA. Countercurrent eddies spinning off from the Florida Current can also contribute to population connectivity of larval organisms from Broward County to the Florida Keys (Lee and Williams, 1999; Drury et al., 2018; Frys et al., 2020).
High levels of connectivity may play a crucial role in the potential recovery of O. faveolata populations following SCTLD driven mortality events. The loss of large numbers of colonies to SCTLD will reduce the reproductive potential of the population and may exacerbate Allee effects (Aalto et al., 2019; Watt-Pringle et al., 2022). Apparently resistant colonies from the Lower Keys may have the potential to act as population refugia and sources for downstream regions. It’s unknown if SCTLD resistance would be conferred to the offspring of these SCTLD-unaffected adult colonies. Along FCR, SCTLD-unaffected colonies likely play an increasingly important role in the potential recovery and persistence of future O. faveolata populations in this region. Understanding which populations can serve as potential refugia and sources of genetic diversity to others will be critical for implementing effective policy and resource management.
Along with coral host genetics, the present study also investigated variation within the endosymbiotic algal community. Most colonies sampled were dominated by the genus Breviolum. However, Durusdinium was a notable indicator species in SCTLD-affected colonies as compared to unaffected colonies. Breviolum has historically been the dominant symbiont genera associated with O. faveolata, however shuffling to D. trenchii has been well-documented (Kemp et al., 2014). D. trenchii is known to be thermally resilient, surviving through large temperature fluctuations and demonstrating resistance to disassociation with their coral host. This tolerance may come at physiological and energetic costs to the host with tradeoffs including reduced growth, reduced fecundity, reduced calcification, reduced carbon acquisition, and higher disease susceptibility (Jones and Thornber, 2010; Cunning et al., 2015; Pettay et al., 2015; LaJeunesse et al., 2018; Shore-Maggio et al., 2018; Cunning and Baker, 2020). Other members within the genus Durusdinium have also been linked to increased disease susceptibility. Montipora capitata in Hawai’i, dominated by Cladocopium spp. were more susceptible to bleaching, but had lower incidence of disease (Shore-Maggio et al., 2018). Meanwhile, M. capitata colonies dominated by Durusdinium had higher resistance to bleaching, but increased disease susceptibility. In a transmission experiment, M. cavernosa colonies that harbored higher abundances of Durusdinium were more susceptible to SCTLD than M. cavernosa colonies harboring Cladocopium, further suggesting that symbiont communities can play a significant role in a coral’s susceptibility and resistance to SCTLD (Titus et al., 2022) Conversely, ex situ research on manipulated colonies found that corals associating predominantly with Cladocopium and Durusdinium were significantly less likely to contract SCTLD and form lesions than colonies associating predominantly with Breviolum (Dennison et al., 2021). Orbicella faveolata colonies sampled in Florida in 2015 were mostly Durusdinium dominated. It is hypothesized that repetitive bleaching events were driving symbiont shuffling to Durusdinium domination not previously observed in the region (Manzello et al., 2019). It is possible that O. faveolata colonies in this study that acquired Durusdinium may have potentially been more bleaching resistant but also consequently increased their susceptibility to disease. Direct tests would be required to evaluate this hypothesis.
Clonal O. faveolata groups harboring different dominant symbiont genera further suggest algal symbiont rather than coral host may be linked to SCTLD susceptibility in O. faveolata. Orbicella faveolata are known to harbor multiple symbiont genera simultaneously across different areas of the colony (Kemp et al., 2008). Ongoing research within the SCTLD Resilience Research Consortium is investigating how a mosaic algal symbiont community structure may be impacting SCTLD susceptibility in O. faveolata and further characterizing algal symbiont community structure to the sub-genus level with ITS2 markers (Buckley et al., 2022). It is also plausible that SCTLD susceptibility is driving dominant symbiont state within a coral host, however this would need to be evaluated experimentally and was beyond the scope of this study.
Ultimately, no significant link between host genetic lineage and SCTLD affectedness was identified in this study. However, evaluation of symbiont communities suggests that holobiont dynamics may be a more significant driver in overall SCTLD susceptibility. This project identified genetic connectivity among O. faveolata colonies in southeast Florida and the Lower Florida Keys. As SCTLD continues to spread throughout the Caribbean and impact reef ecosystems, understanding connectivity of species within a region can provide valuable information for population maintenance and replenishment following a disease outbreak. At all sites, both SCTLD affected and unaffected colonies were present, indicating diverse disease responses throughout the study regions. This experiment was conducted due to the unexplained nature of variable responses O. faveolata colonies exhibited to SCTLD. We acknowledge that the methods implemented in this in situ study may not be the most optimal way to tease apart the underlying cause for a coral host’s resistance to disease. Expanding preemptive molecular sampling of corals and maintaining consistent monitoring across Florida’s reefs is essential to establish a more comprehensive baseline in preparation for future reef disturbances. Consistent monitoring will allow for early detection of deviation from this established baseline which can help inform and advance both disease mitigation efforts and reef restoration strategies.
Data availability statement
The datasets presented in this study can be found in online repositories. The names of the repository/repositories and accession number(s) can be found below: https://www.ncbi.nlm.nih.gov/, PRJNA982851.
Ethics statement
The manuscript presents research on animals that do not require ethical approval for their study.
Author contributions
AK: Writing – original draft. AS: Writing – review & editing. RE: Writing – review & editing. BW: Conceptualization, Funding acquisition, Writing – review & editing. KN: Conceptualization, Writing – review & editing. JV: Conceptualization, Funding acquisition, Supervision, Writing – review & editing.
Funding
The author(s) declare financial support was received for the research, authorship, and/or publication of this article. Funding for this research was awarded by the Florida Department of Environmental Protection’s Coral Protection and Restoration Program to JV under award C0CD87 and to BW under award B96800, both through the SCTLD Resistance Research Consortium. All corals were collected under permit SAL-21-2322-SRP from Florida Fish and Wildlife Conservation Commission and permit FKNMS-2021-073 from the Florida Keys National Marine Sanctuary.
Acknowledgments
Additional members of the GIS Spatial and Ecology Lab Hunter Noren, Samantha Buckley, Thomas Ingalls, Brooke Enright, Allie Kuzachuk, Sasha Wheeler, Katherine Toth, Zach Graff, and Reagan Sharkey), and Disease Intervention Lab (Kevin Macaulay, Syndey Gallagher, Michelle Dobler) supported this study. The University of Texas at Austin’s Genome Sequencing and Analysis Facility provided sequencing support and computation capacity was provided by Research Computing Services at Florida Atlantic University. We thank A. Carreiro for assistance with sampling, N. Parr and K. Kerrigan for support and coordination, and L. Gregg and J. Delaney for assistance with permits. Discussion and feedback from the Florida Coral Disease Advisory Committee enhanced this study design.
Conflict of interest
The authors declare that the research was conducted in the absence of any commercial or financial relationships that could be construed as a potential conflict of interest.
Publisher’s note
All claims expressed in this article are solely those of the authors and do not necessarily represent those of their affiliated organizations, or those of the publisher, the editors and the reviewers. Any product that may be evaluated in this article, or claim that may be made by its manufacturer, is not guaranteed or endorsed by the publisher.
Author disclaimer
The views, statements, findings, conclusions, and recommendations expressed herein are those of the authors and do not necessarily reflect the views of the State of Florida or any of its sub-agencies.
Supplementary material
The Supplementary Material for this article can be found online at: https://www.frontiersin.org/articles/10.3389/fmars.2024.1287457/full#supplementary-material
Supplementary Figure 1 | Map of sample colonies within the Coral ECA. Left panel highlights Lineage 1, right panel highlights Lineage 2. SCTLD affectedness is indicated by color, Lineage indicated by shape, clonal group indicated by triangle. The grey background is hill shaded lidar topography.
Supplementary Figure 2 | Map of sample colonies within the Lower Keys region. Top panel highlights Looe Key, bottom panel highlights Sand Key. SCTLD affectedness is indicated by color, Lineage 2 indicated by circles, clonal group indicated by other shapes. O. franksii colonies indicated by ‘+’. The grey background is hill shaded lidar topography.
Supplementary Figure 3 | Dendrograms identifying clusters of samples based on Identity-by-State matrix calculations, classed by the percentage of monitoring visits during which a colony had active SCTLD lesions; (A) dataset with clones, (B) clones-removed dataset. Regions are denoted by shape; disease affectedness rankings are denoted by color. The dashed red line indicates the minimum genetic distance threshold for clonal groups. Technical replicates denoted by “*”, clonal groups denoted by letter. Orbicella franksi colonies are labeled and were later removed from further analyses.
Supplementary Figure 4 | Principal coordinates analysis showing clustering of samples by disease affectedness rankings (color) and region (shape). Rankings were assigned based on the percentage of monitoring visits during which a colony was actively diseased (0 = 0%, 1= >0-25%, 2= >25-50%, 3= >50-75%, 4=>75-99.9%, 5 = 100%.) Individual samples are represented by transparent points. Population centroids are indicated by solid points. Percent variation is explained by each axis is indicated. (A) shows all samples, (B) shows Lineage 1 ECA, (C) shows Lineage 2 ECA and Lower Keys.
Supplementary Table 1 | Table displaying information about collection date, and angle, depth, and orientation of where sample was taken on parent colony.
Supplementary Table 2 | Table displaying number of times a colony was visited and the percentage a colony was viewed to have disease. Rankings were assigned based on the percentage of monitoring visits during which a colony was actively diseased (0 = 0%, 1= >0-25%, 2= >25-50%, 3= >50-75%, 4=>75-99.9%, 5 = 100%.).
References
Aalto E. A., Micheli F., Boch C. A., Espinoza Montes J. A., Broch Woodson C., De Leo G. A. (2019). Catastrophic mortality, allee effects, and marine protected areas. Am. Nat. 193 (3), 391–408. doi: 10.1086/701781
Aeby G., Ushijima B., Bartels E., Walter C., Kuehl J., Jones S., et al. (2021). Changing stony coral tissue loss disease dynamics through time in Montastraea cavernosa. Front. Mar. Sci. 8. doi: 10.3389/fmars.2021.699075
AGRRA (2023)Stony coral tissue loss disease. Available at: https://www.agrra.org/coral-disease-outbreak/ (Accessed September 1, 2023).
Alegría-Ortega A., Sanín-Pérez M. J., Quan-Young L. I., Londoño-Mesa M. H. (2021). Genetic structure of Orbicella faveolata population reveals high connectivity among a marine protected area and Varadero reef in the Colombian Caribbean. Aquat. Conserv.: Mar. Freshw. Ecosyst. 31 (4), 764–776. doi: 10.1002/aqc.3489
Alvarez-Filip L., Estrada-Saldívar N., Pérez-Cervantes E., Molina-Hernández A., González-Barrios F. J. (2019). A rapid spread of the stony coral tissue loss disease outbreak in the Mexican Caribbean. PeerJ 7, e8069. doi: 10.7717/peerj.8069
Aranda M., Li Y., Liew Y. J., Baumgarten S., Simakov O., Wilson M. C., et al. (2016). Genomes of coral dinoflagellate symbionts highlight evolutionary adaptations conducive to a symbiotic lifestyle. Sci. Rep. 6 (1), 39734. doi: 10.1038/srep39734
Beavers K. M., Van Buren E. W., Rossin A. M., Emery M. A., Veglia A. J., Karrick C. E., et al. (2023). Stony coral tissue loss disease induces transcriptional signatures of in situ degradation of dysfunctional symbiodiniaceae. Nat. Commun. 14 (1), 2915. doi: 10.1038/s41467-023-38612-4
Brunelle A. (2020). “Prioritizing the largest, oldest corals for disease intervention in a coral disease-ravaged area: Southeast florida coral reef ecosystem conservation area,” in Master's thesis (Nova Southeastern University). Available at: https://nsuworks.nova.edu/hcas_etd_all/16. Retrieved from NSUWorks.
Buckley S. F., Dennison C., Baker A., Walker B. (2022). Spatio-temporal symbiont mosaics influence on SCTLD susceptibility in orbicella faveolata (Nova Southeastern University). Available at: https://nsuworks.nova.edu/cnso_osj/february-2022/day2/11/. Retrieved from NSUWorks.
Cunning R., Baker A. C. (2020). Thermotolerant coral symbionts modulate heat stress-responsive genes in their hosts. Mol. Ecol. 29 (15), 2940–2950. doi: 10.1111/mec.15526
Cunning R., Gillette P., Capo T., Galvez K., Baker A. C. (2015). Growth tradeoffs associated with thermotolerant symbionts in the coral Pocillopora damicornis are lost in warmer oceans. Coral Reefs 34 (1), 155–160. doi: 10.1007/s00338-014-1216-4
Cunning R., Parker K. E., Johnson-Sapp K., Karp R. F., Wen A. D., Williamson O. M., et al. (2021). Census of Heat Tolerance among Florida’s Threatened Staghorn Corals Finds Resilient Individuals throughout Existing Nursery Populations. Proc. R. Soc. B: Biol. Sci. 288 (1961), 20211613. doi: 10.1098/rspb.2021.1613
Dennison C. E., Karp R. F., Weiler B. A., Goncalves A. (2021). The role of algal symbionts (Genus breviolum) in the susceptibility of corals to stony coral tissue loss disease in South Florida. Florida DEP, 1–23.
Dobbelaere T., Holstein D. M., Muller E. M., Gramer L. J., McEachron L., Williams S. D., et al. (2022). Connecting the dots: transmission of stony coral tissue loss disease from the Marquesas to the dry Tortugas. Front. Mar. Sci. 9. doi: 10.3389/fmars.2022.778938
Dobbelaere T., Muller E. M., Gramer L. J., Holstein D. M., Hanert E. (2020). Coupled epidemio-hydrodynamic modeling to understand the spread of a deadly coral disease in Florida. Front. Mar. Sci. 7. doi: 10.3389/fmars.2020.591881
Drury C., Bean N. K., Harris C. I., Hancock J. R., Huckeba J., Christian Martin H., et al. (2022). Intrapopulation adaptive variance supports thermal tolerance in a reef-building coral. Commun. Biol. 5 (1), 1–10. doi: 10.1038/s42003-022-03428-3
Drury C., Paris C. B., Kourafalou V. H., Lirman D. (2018). Dispersal capacity and genetic relatedness in Acropora cervicornis on the Florida reef tract. Coral Reefs 37 (2), 585–596. doi: 10.1007/s00338-018-1683-0
Eckert R., Sturm A., Carreiro A., Klein A., Voss J. (2023). Genetically divergent shallow and mesophotic Stephanocoenia intersepta coral populations across Florida keys national marine sanctuary. Heredity. preprint. In Review. doi: 10.21203/rs.3.rs-3314946/v1
Florida Coral Disease Response Research & Epidemiology Team (2018) Case definition: Stony coral tissue loss disease. Available at: https://floridadep.gov/sites/default/files/Copy%20of%20StonyCoralTissueLossDisease_CaseDefinition%20final%2010022018.pdf.
Foll M., Gaggiotti O. (2008). A genome-scan method to identify selected loci appropriate for both dominant and codominant markers: A Bayesian perspective. Genetics 180 (2), 977–993. doi: 10.1534/genetics.108.092221
Forsman Z. H., Page C. A., Toonen R. J., Vaughan D. (2015). Growing coral larger and faster: micro-colony-fusion as a strategy for accelerating coral cover. PeerJ 3, e1313. doi: 10.7717/peerj.1313
Frys C., Saint-Amand A., Le Hénaff M., Figueiredo J., Kuba A., Walker B., et al. (2020). Fine-scale coral connectivity pathways in the Florida reef tract: implications for conservation and restoration. Front. Mar. Sci. 7. doi: 10.3389/fmars.2020.00312
Fuess L. E., Palacio-Castro A. M., Butler C. C., Baker A. C., Mydlarz L. D. (2020). Increased algal symbiont density reduces host immunity in a threatened Caribbean coral species, Orbicella faveolata. Front. Ecol. Evol. 8. doi: 10.3389/fevo.2020.572942
Gladfelter E. H., Monahan R. K., Gladfelter W. B. (1978). Growth rates of five reef-building corals in the Northeastern Caribbean. Bull. Mar. Sci. 28 (4), 728–734.
Hayes N. K., Walton C. J., Gilliam D. S. (2022). Tissue loss disease outbreak significantly alters the Southeast Florida stony coral assemblage. Front. Mar. Sci. 9. doi: 10.3389/fmars.2022.975894
Jombart T., Ahmed Ismaïl (2011). Adegenet 1.3-1: New tools for the analysis of genome-wide SNP data. Bioinformatics 27 (21), 3070–3071. doi: 10.1093/bioinformatics/btr521
Jones E., Thornber C. S. (2010). Effects of habitat-modifying invasive macroalgae on epiphytic algal communities. Mar. Ecol. Prog. Ser. 400, 87–100. doi: 10.3354/meps08391
Kamvar Z. N., Tabima J. F., Grünwald N. J. 2014Poppr: An r package for genetic analysis of populations with clonal, partially clonal, and/or sexual reproduction. PeerJ 2, e281. doi: 10.7717/peerj.281
Kassambara A. (2021). Rstatix: Pipe-friendly framework for basic statistical tests. R Package version 0.7.0.
Kelley E. R., Sleith R. S., Matz M. V., Wright R. M. (2022). Gene expression associated with disease resistance and long-term growth in a reef-building coral. R. Soc. Open Sci. 8 (4), 210113. doi: 10.1098/rsos.210113
Kemp D. W., Hernandez-Pech X., Iglesias-Prieto R., Fitt W. K., Schmidt G. W. (2014). Community Dynamics and Physiology of Symbiodinium Spp. before, during, and after a Coral Bleaching Event. Limnol. Oceanogr. 59 (3), 788–797. doi: 10.4319/lo.2014.59.3.0788
Kemp D. W., Fitt W. K., Schmidt G. W. (2008). A microsampling method for genotyping coral symbionts. Coral Reefs 27 (2), 289–293. doi: 10.1007/s00338-007-0333-8
Kopelman N. M., Mayzel J., Jakobsson M., Rosenberg N. A., Mayrose I. (2015). Clumpak: A program for identifying clustering modes and packaging population structure inferences across K. Mol. Ecol. Resour. 15 (5), 1179–1191. doi: 10.1111/1755-0998.12387
Korneliussen T. S., Albrechtsen A., Nielsen R. (2014). ANGSD: analysis of next generation sequencing data. BMC Bioinf. 15 (1), 356. doi: 10.1186/s12859-014-0356-4
Korneliussen T. S., Moltke I. (2015). NgsRelate: A software tool for estimating pairwise relatedness from next-generation sequencing data. Bioinf. (Oxford England) 31 (24), 4009–4011. doi: 10.1093/bioinformatics/btv509
LaJeunesse T. C., Parkinson J. E., Gabrielson P. W., Jeong H. J., Reimer J. D., Voolstra C. R., et al. (2018). Systematic revision of symbiodiniaceae highlights the antiquity and diversity of coral endosymbionts. Curr. Biol. 28 (16), 2570–2580.e6. doi: 10.1016/j.cub.2018.07.008
Landsberg J. H., Kiryu Y., Peters E. C., Wilson P. W., Perry N., Waters Y., et al. (2020). Stony coral tissue loss disease in florida is associated with disruption of host–zooxanthellae physiology 7. doi: 10.3389/fmars.2020.576013
Langmead B., Trapnell C., Pop M., Salzberg S. L. (2009). Ultrafast and memory-efficient alignment of short DNA sequences to the human genome. Genome Biol. 10 (3), R25. doi: 10.1186/gb-2009-10-3-r25
Lapointe B. E., Brewton R. A., Herren L. W., Porter J. W., Hu C. (2019). Nitrogen enrichment, altered stoichiometry, and coral reef decline at Looe Key, Florida Keys, USA: A 3-decade study. Mar. Biol. 166 (8), 108. doi: 10.1007/s00227-019-3538-9
Lee T. N., Williams E. (1999). Mean distribution and seasonal variability of coastal currents and temperature in the Florida Keys with implications for larval recruitment. Bull. Mar. Sci. 64 (1), 35–56.
Li Y.-L., Liu J.-X. (2018). StructureSelector: A web-based software to select and visualize the optimal number of clusters using multiple methods. Mol. Ecol. Resour. 18 (1), 176–177. doi: 10.1111/1755-0998.12719
Liu H., Stephens T. G., González-Pech R. A., Beltran V. H., Lapeyre B., Bongaerts P., et al. (2018). Symbiodinium genomes reveal adaptive evolution of functions related to coral-dinoflagellate symbiosis. Commun. Biol. 1 (1), 1–11. doi: 10.1038/s42003-018-0098-3
Manzello D. P., Matz M. V., Enochs I. C., Valentino L., Carlton R. D., Kolodziej G., et al. (2019). Role of host genetics and heat-tolerant algal symbionts in sustaining populations of the endangered coral Orbicella faveolata in the Florida Keys with ocean warming. Global Change Biol. 25 (3), 1016–1031. doi: 10.1111/gcb.14545
Meiling S., Muller E., Lasseigne D., Rossin A., Veglia A., MacKnight N., et al. (2021). Variable species responses to experimental stony coral tissue loss disease (SCTLD) exposure. Front. Mar. Sci. 8. doi: 10.3389/fmars.2021.670829
Meiling S., Muller E. M., Smith T. B., Brandt M. E. (2020). 3D photogrammetry reveals dynamics of stony coral tissue loss disease (SCTLD) lesion progression across a thermal stress event. Front. Mar. Sci. 7. doi: 10.3389/fmars.2020.597643
Miller M. W. (2014). Post-settlement survivorship in two Caribbean broadcasting corals. Coral Reefs 33 (4), 1041–1046. doi: 10.1007/s00338-014-1177-7
Miller M. W., Colburn P. J., Pontes E., Williams D. E., Bright A. J., Serrano X. M., et al. (2019). Genotypic variation in disease susceptibility among cultured stocks of elkhorn and staghorn corals. PeerJ 7, e6751. doi: 10.7717/peerj.6751
Muller E. M., Sartor C., Alcaraz N. I., van Woesik R. (2020). Spatial epidemiology of the stony-coral-tissue-loss disease in Florida. Front. Mar. Sci. 7. doi: 10.3389/fmars.2020.00163
Neely K. L., Shea C. P., Macaulay K. A., Hower E. K., Dobler M. A. (2021). Short- and long-term effectiveness of coral disease treatments. Front. Mar. Sci. 0. doi: 10.3389/fmars.2021.675349
NMFS (2014). Final listing determinations on proposal to list 66 reef-building coral species and to reclassify elkhorn and staghorn corals, final rule 79. Federal Register, 53852–54123.
Page C. A., Muller E. M., Vaughan D. E. (2018). Microfragmenting for the successful restoration of slow growing massive corals. Ecol. Eng. 123, 86–94. doi: 10.1016/j.ecoleng.2018.08.017
Pembleton L. W., Cogan N. O. I., Forster J. W. (2013). StAMPP: an R package for calculation of genetic differentiation and structure of mixed-ploidy level populations. Mol. Ecol. Resour. 13 (5), 946–952. doi: 10.1111/1755-0998.12129
Pettay D. T., Wham D. C., Smith R. T., Iglesias-Prieto R., LaJeunesse T. C. (2015). Microbial invasion of the Caribbean by an Indo-Pacific coral zooxanthella. Proc. Natl. Acad. Sci. 112 (24), 7513–7518. doi: 10.1073/pnas.1502283112
Porter J. W., Meier O. W. (1992). Quantification of loss and change in Floridian reef coral populations. Am. Zool. 32 (6), 625–640. doi: 10.1093/icb/32.6.625
Prada C., Hanna B., Budd A. F., Woodley C. M., Schmutz J., Grimwood J., et al. (2016). Empty niches after extinctions increase population sizes of modern corals. Curr. Biol. 26 (23), 3190–3194. doi: 10.1016/j.cub.2016.09.039
Precht W. F., Gintert B. E., Robbart M. L., Fura R., van Woesik R. (2016). Unprecedented disease-related coral mortality in Southeastern Florida. Sci. Rep. 6 (1), 31374. doi: 10.1038/srep31374
Puechmaille S. J. (2016). The program structure does not reliably recover the correct population structure when sampling is uneven: subsampling and new estimators alleviate the problem. Mol. Ecol. Resour. 16 (3), 608–627. doi: 10.1111/1755-0998.12512
Rippe J. P., Matz M. V., Green E. A., Medina M., Khawaja N. Z., Pongwarin T., et al. (2017). Population structure and connectivity of the mountainous star coral, Orbicella faveolata, throughout the wider Caribbean region. Ecol. Evol. 7 (22), 9234–9246. doi: 10.1002/ece3.3448
Ruzicka R. R., Colella M. A., Porter J. W., Morrison J. M., Kidney J. A., Brinkhuis V., et al. (2013). Temporal changes in benthic assemblages on Florida Keys reefs 11 years after the 1997/1998 el niño. Mar. Ecol. Prog. Ser. 489, 125–141. doi: 10.3354/meps10427
Sharp W. C., Shea C. P., Maxwell K. E., Muller E. M., Hunt J. H. (2020). Evaluating the small-scale epidemiology of the stony-coral -tissue-loss-disease in the middle Florida Keys. PloS One 15 (11), e0241871. doi: 10.1371/journal.pone.0241871
Shoguchi E., Shinzato C., Kawashima T., Gyoja F., Mungpakdee S., Koyanagi R., et al. (2013). Draft assembly of the Symbiodinium minutum nuclear genome reveals dinoflagellate gene structure. Curr. Biol. 23 (15), 1399–1408. doi: 10.1016/j.cub.2013.05.062
Shore-Maggio A., Callahan S. M., Aeby G. S. (2018). Trade-offs in disease and bleaching susceptibility among two color morphs of the Hawaiian reef coral, Montipora capitata. Coral Reefs 37 (2), 507–517. doi: 10.1007/s00338-018-1675-0
Skotte L., Korneliussen T. S., Albrechtsen A. (2013). Estimating individual admixture proportions from next generation sequencing data. Genetics 195 (3), 693–702. doi: 10.1534/genetics.113.154138
Studivan M. S., Rossin A. M., Rubin E., Soderberg N., Holstein D. M., Enochs I. C. (2022). Reef sediments can act as a stony coral tissue loss disease vector. Front. Mar. Sci. 8. doi: 10.3389/fmars.2021.815698
Sturm A. B., Eckert R. J., Carreiro A. M., Simões N., Voss J. D. (2022). Depth-dependent genetic structuring of a depth-generalist coral and its symbiodiniaceae algal communities at Campeche Bank, Mexico. Front. Mar. Sci. 9. doi: 10.3389/fmars.2022.835789
Sturm A. B., Eckert R. J., Carreiro A. M., Voss J. D. (2021). Population genetic structure of the broadcast spawning coral, montastraea cavernosa, demonstrates refugia potential of upper mesophotic populations in the florida keys. Coral Reefs 41 (3), 587–598. doi: 10.1007/s00338-021-02112-y
Titus K., O’Connell L., Matthee K., Childress M. (2022). The influence of foureye butterflyfish (Chaetodon capistratus) and symbiodiniaceae on the transmission of stony coral tissue loss disease. Front. Mar. Sci. 9. doi: 10.3389/fmars.2022.800423
Toth L. T., Kuffner I. B., Stathakopoulos A., Shinn E. A. (2018). A 3,000-year lag between the geological and ecological shutdown of Florida’s coral reefs. Global Change Biol. 24 (11), 5471–5483. doi: 10.1111/gcb.14389
Vollmer S. V., Selwyn J. D., Despard Brecia A., Roesel C. A. (2023). Genomic signatures of disease resistance in endangered staghorn corals. Science 381, 6665. doi: 10.1126/science.adi3601
Walker B. K. (2012). Spatial analyses of benthic habitats to define coral reef ecosystem regions and potential biogeographic boundaries along a latitudinal gradient. PloS One 7 (1), e30466. doi: 10.1371/journal.pone.0030466
Walker B. K., Turner N. R., Noren H. K. G., Buckley S. F., Pitts K. A. (2021). Optimizing stony coral tissue loss disease (SCTLD) intervention treatments on Montastraea cavernosa in an endemic zone. Front. Mar. Sci. 8. doi: 10.3389/fmars.2021.666224
Walker B. K., Aeby G. S., Baker A. C., Buckley S., Garg N., Hawthorne A., et al. (2023). SCTLD resistance research consortium summary report through may 2023 (Miami, FL: Florida DEP), 107.
Wang S., Meyer E., McKay J. K., Matz M. V. (2012). 2b-RAD: A simple and flexible method for genome-wide genotyping. Nat. Methods 9 (8), 808–810. doi: 10.1038/nmeth.2023
Watt-Pringle R., Smith D. J., Ambo-Rappe R., Lamont T. A. C., Jompa J. (2022). Suppressed recovery of functionally important branching acropora drives coral community composition changes following mass bleaching in Indonesia. Coral Reefs 41 (5), 1337–1350. doi: 10.1007/s00338-022-02275-2
Williams S. D., Walter C. S., Muller E. M. (2021). Fine scale temporal and spatial dynamics of the stony coral tissue loss disease outbreak within the lower Florida Keys. Front. Mar. Sci. 8. doi: 10.3389/fmars.2021.631776
Keywords: SCTLD, coral disease resistance, intraspecies variation, population genetics, Symbiodiniaceae
Citation: Klein AM, Sturm AB, Eckert RJ, Walker BK, Neely KL and Voss JD (2024) Algal symbiont genera but not coral host genotypes correlate to stony coral tissue loss disease susceptibility among Orbicella faveolata colonies in South Florida. Front. Mar. Sci. 11:1287457. doi: 10.3389/fmars.2024.1287457
Received: 01 September 2023; Accepted: 08 January 2024;
Published: 25 January 2024.
Edited by:
Sarah Annalise Gignoux-Wolfsohn, Smithsonian Environmental Research Center (SI), United StatesReviewed by:
Erinn M. Muller, Mote Marine Laboratory and Aquarium, United StatesLeah Harper, Smithsonian Environmental Research Center (SI), United States
Copyright © 2024 Klein, Sturm, Eckert, Walker, Neely and Voss. This is an open-access article distributed under the terms of the Creative Commons Attribution License (CC BY). The use, distribution or reproduction in other forums is permitted, provided the original author(s) and the copyright owner(s) are credited and that the original publication in this journal is cited, in accordance with accepted academic practice. No use, distribution or reproduction is permitted which does not comply with these terms.
*Correspondence: Allison M. Klein, Kleina2020@fau.edu; Joshua D. Voss, Jvoss2@fau.edu