Bridging the gap: The integration of eDNA techniques and traditional sampling in fish diversity analysis
 Biao Wang
 Li Jiao
  Ping You
- College of Life Science, Shaanxi Normal University, Xian, China
Introduction: Biodiversity loss poses a significant environmental challenge, particularly in aquatic ecosystems. The advent of environmental DNA (eDNA) sampling technology offers a promising tool for monitoring biological communities with purported high efficiency. Yet, its efficacy compared to traditional sampling methods remains underexplored, especially in fish diversity research.
Methods: This study conducted a comparative analysis of fish diversity and distribution across 29 sampling points within the rivers of the Changqing Nature Reserve, Central China, employing both eDNA techniques and traditional sampling methods.
Results: A total of 46 unique fish species were identified through this comprehensive approach. eDNA sampling detected 34 species, surpassing the 22 species identified by traditional methods. Interestingly, 10 species were detected by both methods, while traditional methods exclusively identified 12 species not detected by eDNA, and eDNA uniquely identified an additional 24 species. Despite eDNA's broader species detection range, traditional sampling methods typically yielded higher Shannon diversity index values. Both β-diversity indices (Bray-Curtis and Jaccard) and multivariate analyses (NMDS and PCoA) were applied, revealing no significant statistical differences in biodiversity measurement between the two sampling methods.
Discussion: The findings suggest that while eDNA sampling excels in identifying a wider range of species, it does not significantly outperform traditional methods in overall biodiversity assessment. By integrating both methodologies, this study demonstrates a more comprehensive and precise assessment of riverine biodiversity, underscoring the benefits of a synergistic approach for enhancing species detection and understanding distribution patterns. The combined methodology notably improves alpha diversity evaluations, particularly regarding Shannon diversity and Berger-Parker dominance. This integrated approach advocates for the amalgamation of data from both eDNA and conventional methods, fostering a robust and accurate biodiversity appraisal.
1 Introduction
Aquatic ecosystems are essential natural resources for sustainable human development, consisting of abiotic and biotic organisms that interact with the surrounding environment, maintaining material cycles and energy flow. The stability of aquatic ecosystems relies heavily on the presence of diverse aquatic species, with fish being one of the most diverse groups. Currently, there are approximately 28,500 described and undescribed fish species, belonging to 57 orders and 482 families. Among these species, freshwater fish constitute 40% of the total, with 9,966 known species. Preserving a healthy fish diversity is crucial for sustaining overall aquatic biodiversity and assessing the ecological health of aquatic ecosystems (Silk and Ciruna, 2005). The more accurate and comprehensive the fish data, the better it reflects the fish population dynamics and the health of the aquatic ecosystem. Therefore, finding and optimizing fish sampling methods is crucial for accurately assessing and researching fish diversity.
Traditionally, electrofishing is a productive method of sampling in traditional fisheries, but it also has well-known drawbacks. The likelihood of discovering rare species remains limited due to difficulties in sampling (Paller, 1994; MacKenzie et al., 2015). In wadeable rivers, a correct estimation of species richness implies sampling a length more than 27 times the width of the river in a single pass or increasing the number of sampling instances (Daulwater and Pert, 2003; Fischer and Paukert, 2009; Vehanen et al., 2013). In larger rivers, no single type of net has been found suitable for quantitative sampling in all existing habitats (Casselman et al., 1990; Goffaux et al., 2005; Zajicek and Wolter, 2018). In wadeable rivers, electrofishing is the standard method for catching fish. However, if the river is large and deep, it implies an overestimation of sub-surface species at the expense of mid-channel and benthic species (Pont et al., 2018; Zajicek and Wolter, 2018). Electrofishing is currently considered the most appropriate method, but in practice, a combination of several types of fishing gear is needed to correctly estimate total species richness (Casselman et al., 1990; Zajicek and Wolter, 2018), which significantly increases the cost of monitoring. After the sampling is completed, the study of river fish diversity involves biological identification, mainly through morphological classification. Morphological identification has long been the fundamental method in fish taxonomy, providing insights into fish evolution. However, morphological classification methods have limitations. They are sensitive to environmental and other factors, leading to variations in morphological standards among researchers. Consequently, there can be significant differences in species identification and classification results. Additionally, morphological characteristics of some fish species can vary greatly at different growth stages or due to fishing methods, making species identification challenging and resulting in taxonomic mistakes. To overcome these challenges, DNA barcoding technology has been combined with traditional morphological classification to improve the accuracy of species identification (Zhong et al., 2015; Piper et al,. 2019; Liu et al., 2020). However, this approach has limitations, particularly in large river basins, including low sampling efficiency, high costs, the need for specialized expertise in fish identification, potential disturbance to ecological systems, and difficulties in establishing standardized procedures. To address these challenges, the employment of integrative taxonomy is becoming increasingly necessary. This method integrates multiple data sources, including morphological, genetic, and ecological information, to provide a more comprehensive understanding of species diversity (Gomes et al., 2015). Imperfect classification retrieval systems and disagreements in classification criteria further complicate fish classification and identification work. Moreover, the non-uniform and random distribution of fish species can lead to incomplete sampling coverage, resulting in biased conclusions and underestimated biodiversity assessments (Ruttenberg, 2001; Borja and Elliott, 2013; Evans et al., 2017; Kundu et al., 2019). Its evident that researching river fish diversity through traditional sampling methods is an endeavor that requires significant effort, a lengthy duration, and substantial costs
In recent years, environmental DNA (eDNA) analysis has emerged as a powerful and innovative approach in biodiversity research and ecological monitoring. This technique involves the detection and analysis of genetic material shed by organisms into their surrounding environment, providing valuable information about species presence and abundance without direct observation or capture. eDNA technology offers several advantages, including its non-invasive nature, which minimizes disturbances to wildlife and their habitats (Dejean et al., 2012). It is particularly useful for studying elusive, endangered, or rare species that are difficult to observe directly (Goldberg et al., 2011; Thomsen et al., 2012). eDNA analysis exhibits high sensitivity and specificity in species detection, even at low concentrations. DNA shed by organisms can be amplified and identified using molecular techniques like polymerase chain reaction (PCR) and next-generation sequencing (NGS), enabling the detection of species occurring in low numbers or challenging environments, such as aquatic ecosystems (Jerde et al., 2011). This technology has been successfully applied across different ecosystems and taxonomic groups, allowing comprehensive assessments of biodiversity within a given habitat (Porter and Hajibabaei, 2018). It has also facilitated large-scale ecological monitoring and conservation efforts, providing extensive datasets to inform conservation strategies and management decisions (Kelly et al., 2014). Additionally, eDNA analysis has proven valuable in detecting invasive species, monitoring ecosystem health, and understanding species interactions (Takahara et al., 2012; Bohmann et al., 2014; Valentini et al., 2016).
Environmental DNA (eDNA) analysis heralds a significant stride in biodiversity assessment, with an escalating cadre of studies now delineating the contrasts between traditional sampling methods and eDNA technology, particularly in the realm of fish diversity within complex riverine systems. For instance, an intriguing exploration by Williford et al. (2023) within the Cedar Lakes estuary system in Texas unveiled that the species richness unearthed by eDNA methodologies resonated well with historical datasets accrued through traditional methods across a bi-seasonal timeframe. In a parallel vein, a meticulous endeavor by He et al. (2023) spanning 54 strategic locales in the Northwest Atlantic divulged that eDNA methodologies could unveil a broader spectrum of species and mirrored akin patterns of species turnover when juxtaposed against traditional trawl surveys. Adding to this, a study by Przybyla–Kelly et al. (2023) in Lakes Huron and Michigan demonstrated that eDNA methods had a significantly higher detection rate for Round Goby compared to traditional bottom trawling and angling methods. Traditional sampling paradigms, albeit lauded for their precision and reliability, exhibit inherent limitations in sample acquisition and potential ecological perturbations. Conversely, eDNA technology emanates as a beacon of non-invasiveness, efficiency, and lesser ecological disruption. Nonetheless, a suite of challenges including DNA degradation, logistical hurdles in transportation, dilution phenomena, incomplete reference databases, inconsistent efficacy in PCR amplification, and intricacies in distinguishing closely related species could potentially attenuate the sensitivity and veracity of eDNA-based species identification endeavors (Barnes et al., 2014; Valentini et al., 2016).
In light of the aforementioned, the quintessence of this study is to orchestrate a holistic comparison of these dichotomous methodologies in scrutinizing fish diversity across a triumvirate of rivers nestled within a conservation sanctuary. We aim to delve into the nuances and potential causatives engendering disparities between these methodologies in assessing fish diversity, with a visionary aim to proffer seminal insights for fish conservation, ecosystem assessment, and the larger ambit of resource management.
2 Materials and methods
2.1 Ethics statement
This study was approved by the Animal Care and Use Committee of Shaanxi Normal University. The fish being collected is not evaluated in IUCN red list status (https://www.iucnredlist.org). None of the fish had been collected is endangered or protected in China (Yue and Chen, 1998). Meanwhile, the fish sampling is permitted from the local level authority in scientific research.
2.2 Sampling sits and methods
The sampling was conducted in the Changqing Nature Reserve in central China from May to June 2021. A total of 29 sampling sites were set in three administrative regions of the reserve, with 10 sampling sites in the Huangguan region (HG), 11 in the Changqing region (CQ), and 8 in the Sangyuan region (SY) (Figure 1). In addition to collecting eDNA water samples, fish were captured using the traditional method of electric fishing within a random range of 50 meters to 200 meters upstream. Water samples were collected using disposable water bags at a distance of approximately 3 meters from the shore. At each sampling point, 3 liters of mixed water samples (0-1 m depth) were collected from the surface, middle, and bottom layers, with three replicates. Throughout the sampling process, the operators were required to wear disposable sterile gloves, which were replaced before each new sampling. Immediately after water collection, a portable water sampler and disposable glass fiber filter cups with a pore size of 0.45 micrometers were used for filtration. After filtration, the filter papers from each cup were folded and stored in anhydrous ethanol. Upon returning to the laboratory, the filter membranes were stored at -80°C.
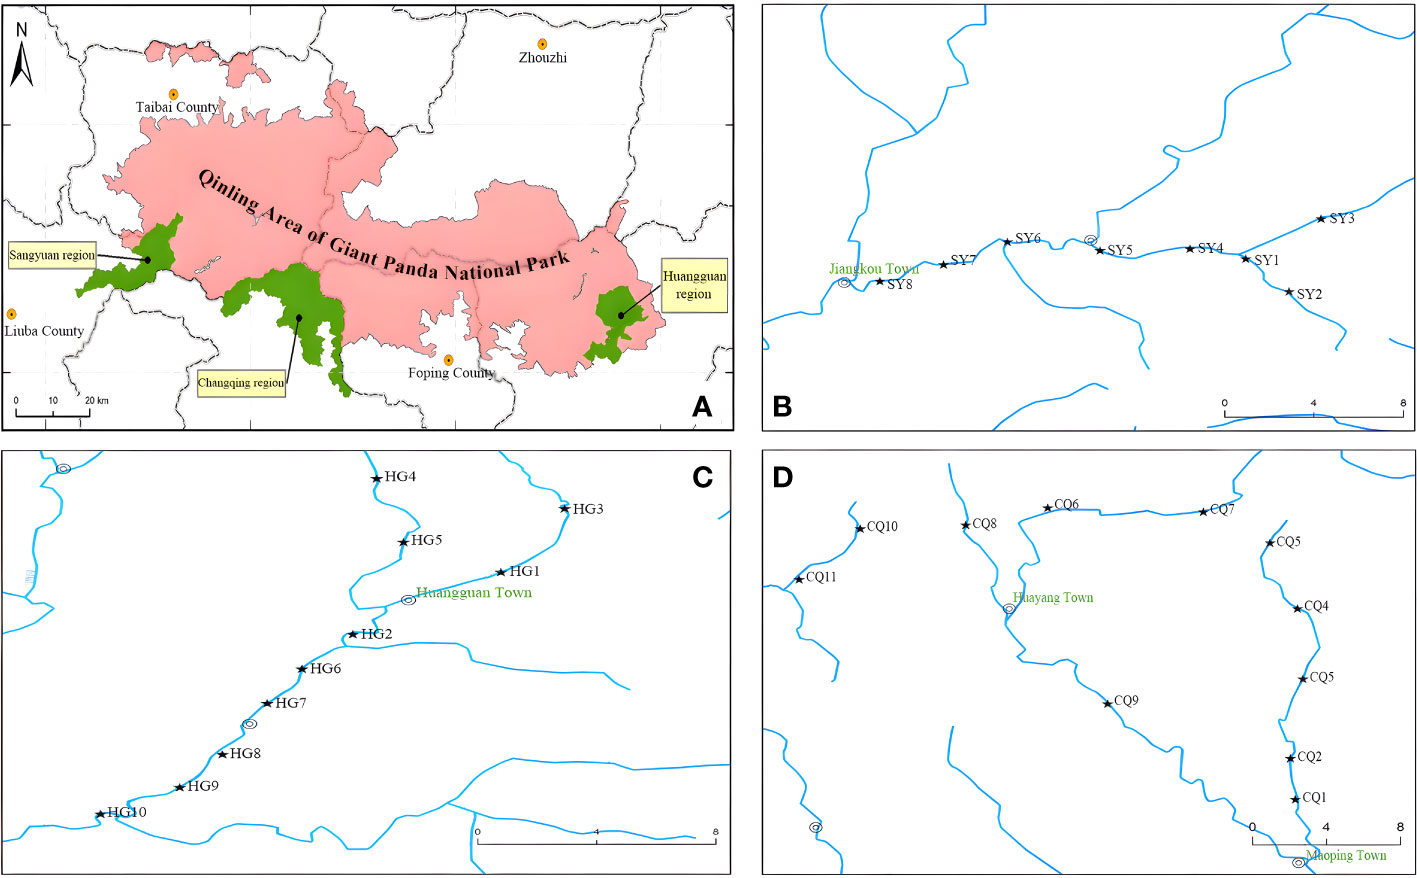
Figure 1 Maps of the sampling sits: (A) represents the entire area of Changqing Nature Reserve (SY+CQ+HG) in the Qinling Area of Giant Panda National Park; (B) represents the Sangyuan region (SY); (C) represents the Changqing region (CQ); and (D) represents the Huangguan region (HG).
The traditional sampling method employed low-voltage electric fishing, with one person applying a 12V voltage shock for approximately 10 seconds within a range of approximately 1 meter. Another person immediately proceeded with the collection. The captured fish were identified at the species level, and their measurements, including body length, body weight, and coloration, were recorded. Most fish species were identified in the field and released, while specimens of unidentified species were fixed and preserved in anhydrous ethanol, with the collection location information labeled on the vials. Upon returning to the laboratory, species identification was further confirmed using DNA barcoding techniques based on references from the literature.
2.3 eDNA sample processing methods
Total genomic DNA samples were extracted using the OMEGA Soil DNA Kit (D5625-01) (Omega Bio-Tek, Norcross, GA, USA). Prior to the DNA extraction, the filter membranes used for water sample collection were first diluted in a specific buffer solution to release the eDNA. They were then cut into smaller pieces to facilitate efficient DNA extraction. Following the manufacturers instructions and stored at -80°C prior to further analysis. The quantity and quality of extracted DNAs were measured using a NanoDrop ND-1000 spectrophotometer (Thermo Fisher Scientific, Waltham, MA, USA) and agarose gel electrophoresis, respectively.
Using the fish universal primer MiFish-U for PCR amplification of eDNA templates. This primer was used to amplify a highly variable region of the mitochondrial 12S rRNA gene, with an amplification length of approximately 163-185 bp, and is a common primer for environmental DNA macrobarcoding in fish (Miya et al., 2015). PCR amplification of the fish 12S rRNA genes was performed using the forward primer MiFish-U-F (5-GTCGGTAAAACTCGTGCCAGC-3) and the reverse primer MiFish-U-R (5-CATAGTGGGGTATCTAATCCCAGTTTG-3). A unique 7-bp barcode was on the forward primer to tag each PCR product. The PCR components contained 5 μl of buffer (5×), 0.25 μl of Fast pfu DNA Polymerase (5U/μl), 2 μl (2.5 mM) of dNTPs, 1 μl (10 uM) of each Forward and Reverse primer, 1 μl of DNA Template, and 14.75 μl of ddH2O. Thermal cycling consisted of initial denaturation at 98° for 5 min, followed by 25 cycles consisting of denaturation at 98°C for 30 s, annealing at 53°C for 30 s, and extension at 72°C for 45 s, with a final extension of 5 min at 72°C. PCR amplicons were purified with V azyme V AHTSTM DNA Clean Beads (V azyme, Nanjing, China) and quantified using the Quant-iT PicoGreen dsDNA Assay Kit (Invitrogen, Carlsbad, CA, USA). After the individual quantification step, amplicons were pooled in equal amounts, and pair-end 2×250 bp sequencing was performed using the Illlumina MiSeq platform with MiSeq Reagent Kit v3 at Shanghai Personal Biotechnology Co., Ltd (Shanghai, China).
2.4 Fish identification
In this study, a meticulous examination of morphological traits including body morphology, coloration patterns, scale characteristics, fin structures, and dental features was conducted to classify fish species. The measurable features of fish specimens were recorded with a precision of 0.01 cm. These included measurements of various dimensions such as body length, fin length, and head size. Additionally, countable characteristics such as lateral line scales, rows of scales, columns of scales, fin ray counts, gill raker counts, and pharyngeal tooth counts were enumerated. The measurements and counts were performed following established protocols (Farrag, 2022) to ensure accuracy and consistency. These morphological attributes hold substantial diagnostic value in fish taxonomy (Robins et al., 2016). To ensure accuracy and consistency in species identification, relevant taxonomic literature and field guides were consulted (Froese and Pauly, 2021). However, certain fish species exhibit pronounced morphological resemblance, rendering the sole reliance on morphological features for identification challenging. To overcome this limitation, molecular techniques were introduced as adjunctive tools, with a primary focus on DNA barcoding technology (Hebert et al., 2003). The cytochrome c oxidase subunit I (COI) gene of fish was PCR amplified (Ward et al., 2005), yielding species-specific DNA sequences. These sequences were compared against reference sequences in public databases, and species identification was accomplished through the construction of phylogenetic trees or calculation of genetic distances (Ratnasingham and Hebert, 2007). The application of molecular techniques furnished supplementary evidence, improving accurate identification of closely related fish species.
2.5 Statistical analysis
We performed aquatic bioinformatics analysis using QIIME2 2019.4 (Bolyen et al., 2018), while the OTU clustering procedure followed the Vsearch (v2.13.4) pipeline (Rognes et al., 2016). Briefly, the raw sequence data were demultiplexed using the demux plugin, followed by primer trimming using the cutadapt plugin (Martin, 2011). Subsequently, sequences were merged, filtered, and dereplicated using the functions fastq_mergepairs, fastq_filter, and derep_fulllength in Vsearch. All unique sequences were then clustered at 98% similarity (via cluster_size) followed by chimera removal (via uchime_denovo). Finally, the non-chimeric sequences were re-clustered at 97% similarity to generate OTU representative sequences and the OTU table. In this study, taxonomy assignment to OTUs was performed using the classify-sklearn naive Bayes taxonomy classifier in the feature-classifier plugin (Bokulich et al., 2018) against the NCBI NT database (retrieved 2019.8). OTUs that were assigned to bony fishes (Osteichthyes) were retained for analysis. We successfully uploaded the raw data to the NCBI SRA database. The access number for this dataset is PRJNA1021809 and the dataset can be accessed via the following link: https://www.ncbi.nlm.nih.gov/sra/PRJNA1021809.
In our study, we employed both traditional and eDNA sampling methods to identify and assess the distribution of various fish species. The traditional sampling method relied mainlyon morphological identification with the morphological traits, whereas the eDNA sampling method utilized. We implemented a suite of data preprocessing steps including quality control, clustering, and filtering on the raw reads. Species determination was based on achieving a similarity threshold of at least 97% compared to reference sequences, as advocated by Hebert et al. (2003). We calculated the relative abundance of each fish species at different sampling points by determining the proportion of a specific species relative to the total fish count at that location. The consistency in estimating relative abundance between the two methods was then assessed by calculating the correlation coefficient for each fish species.
To evaluate alpha diversity, we calculated four biodiversity indices: Shannon diversity index (Shannon, 1948), Simpson diversity index (Simpson, 1949), Berger-Parker dominance index (Berger and Parker, 1970), and Pielou evenness index (Pielou, 1966). These indices offered insights into species diversity, dominance, and evenness, and were computed using the R package ‘vegan (Oksanen et al., 2022). Beta diversity analysis, a crucial component of biodiversity studies, was conducted using Bray-Curtis and Jaccard dissimilarity metrics (Jaccard, 1901; Bray and Curtis, 1957; Real and Vargas, 1996; Anderson, 2001). These metrics evaluated the species compositional differences and proportion of shared species between samples, respectively, and were calculated using the ‘vegan package. Dimensionality reduction techniques, namely Principal Coordinates Analysis (PCoA) and Non-metric Multi-Dimensional Scaling (NMDS), were applied to visualize differences among samples in a two-dimensional space (Kruskal, 1964). Lastly, we employed the Wilcoxon signed-rank test, Pearson correlation analysis, and Mann-Whitney U test to examine whether there were differences in various indices of fish diversity among different samples (Pearson, 1895; Wilcoxon, 1945; Mann and Whitney, 1947). This provided a comprehensive statistical validation of our observations.
Finally, to more comprehensively represent the full spectrum of riverine fish dynamics as captured by the two methodologies, we orchestrated an integration of both methods. Acknowledging that each method harbors its own measurement inaccuracies and biases, we adopted a simple yet potent technique for amalgamating the data derived from both methodologies: by computing the mean of the relative abundances procured from each method, we aimed to attenuate the biases intrinsic to any singular approach. The mathematical schema for this data fusion technique is delineated as follows:
Calculation of Relative Abundance: For each species A and each sampling point B, the relative abundance RA is calculated for both eDNA and traditional methods according to:
2. Merging of Data Sets: The final, merged relative abundance is computed as:
In cases where the data for species A at sampling point B is missing in one of the methods, the relative abundance for that species at that point is considered zero for the missing method.
3 Results and discuss
3.1 Species identification and distribution assessment
In a single Illumina MiSeq sequencing run, we obtained a total of 9.97 million raw reads. Of these, 4,039,269 OTUs were identified as corresponding to fish species, providing a detailed insight into the aquatic biodiversity within our study area. After quality control, clustering, and all initial filtering steps, comprehensive data analysis revealed the presence of fish diversity consisting of six orders, twelve families, and a minimum of 34 fish species (Supplementary Tables 1, 2). This determination was based on the filtered dataset with a similarity threshold of ≥97% when compared to reference sequences. In traditional sampling, we identified four orders, six families, and twenty-two species. We employed two sampling methods for species identification and successfully identified a total of 46 species belonging to six orders, eleven families, and forty genera (Supplementary Table 3). We utilized eDNA methods to uniquely detect three non-native fish species: Oreochromis niloticus, Oncorhynchus mykiss, and Ictalurus punctatus. All three species, introduced to China as economically significant exotic species, show distinct distribution patterns. Specifically, we observed that Oncorhynchus mykiss predominantly inhabits areas HG1 and HG6, while Ictalurus punctatus is primarily found in region CQ2. These distribution patterns likely reflect the presence of eDNA from these species due to escape from aquaculture facilities. On the other hand, the distribution of Oreochromis niloticus is more dispersed, detected across all three regions. Given that this species was introduced early on for aquaculture purposes, its widespread distribution now suggests a substantial impact on the local ecosystems. The Venn diagram shows the disparities in fish species detection between the traditional method and eDNA method (Figure 2). Out of these, 10 fish species were consistently detected by both methods. Conversely, the eDNA method exclusively detected 24 additional fish species that remained undetected by the traditional method. This disparity could be attributed to the absence of these species during traditional sampling or their limited population sizes. However, owing to its capability to detect environmental DNA fragments, the eDNA method successfully captured the presence of these species, even if they had already vacated the sampling site. Nonetheless, its important to highlight that traditional methods also have their unique contributions. In our study, traditional sampling exclusively detected 12 fish species that were not identified by the eDNA approach. Intriguingly, these species exhibited relatively lower abundance within the overall fish community. To provide a data-backed perspective, the top five species in terms of abundance were as follows: Gnathopogon tsinanensis at 6.15%, Cobitis sibirica at 3.16%, Opsariichthys bidens at 2.88%, Hemibarbus maculates at 2.48%, and Gnathopogon herzensteini at 1.58%. Notably, even the most abundant among them, Gnathopogon tsinanensis, constituted only 6.15% of the total catch. These percentages, although not negligible, are not sufficiently high to label these species as “dominant” within the ecosystem. This suggests that these species, while detectable through traditional methods, are not particularly abundant in the environments we studied. Such discrepancies between eDNA and traditional methods could be attributed to a range of biological or technical factors, including but not limited to, low environmental DNA concentrations for these species or limitations inherent to each sampling and analytical method.
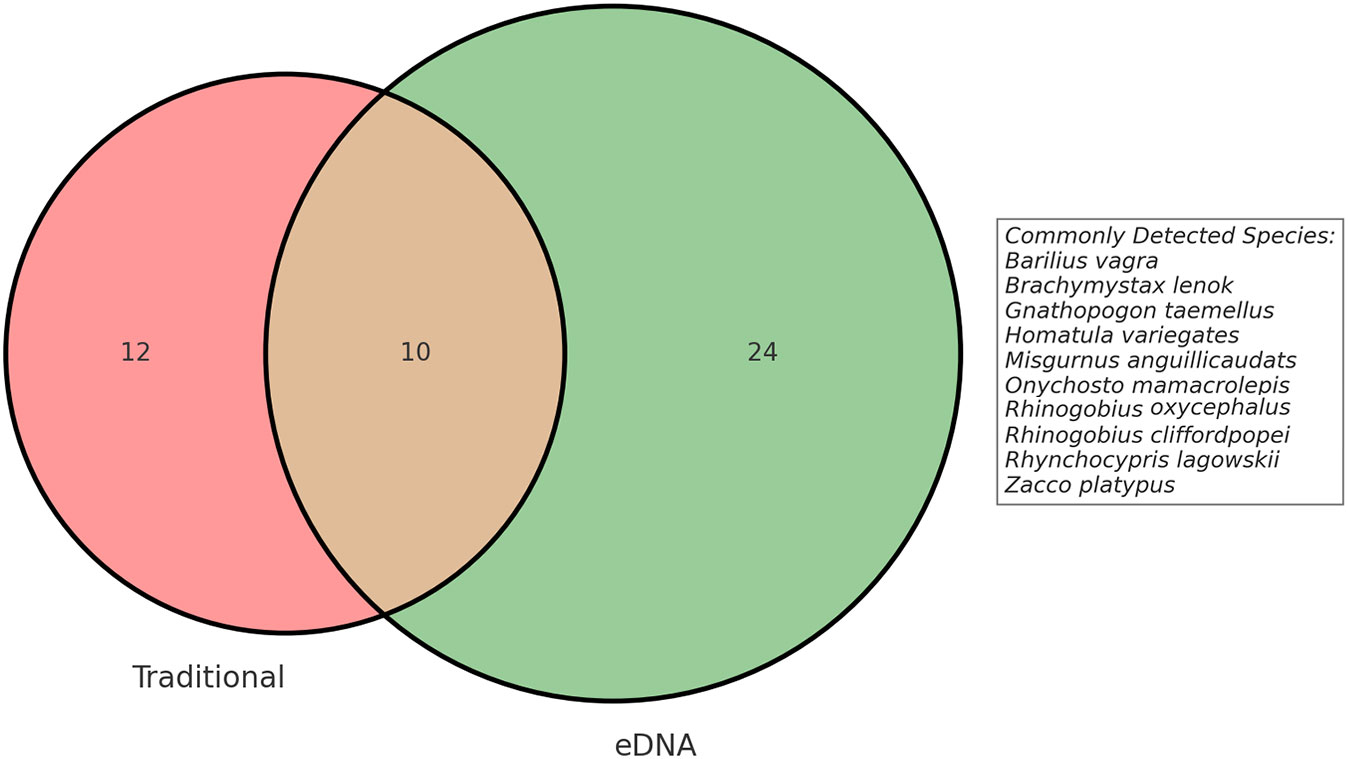
Figure 2 The Venn diagram was used to illustrate the fish species detected through the traditional sampling method and the eDNA.
In order to investigate the distribution and relative abundance of each fish species across different sampling sites, we conducted a comprehensive analysis using species abundance heatmaps (Figure 3). In the traditional sampling heatmap, we observed that certain species, such as Rhynchocypris oxycephalus and Rhynchocypris lagowskii, exhibited significantly higher relative abundance in multiple sampling sites, suggesting a wide distribution within the study area. On the other hand, specific species like Pseudorasbora parva and Gnathopogon caerulescens were found only in limited sampling sites, indicating a more restricted distribution or lower population abundance. Interestingly, similar patterns were observed in the eDNA sampling heatmap. However, notable differences were identified when comparing it with the traditional sampling method. Of particular significance was the case of two closely related species, Rhynchocypris oxycephalus and Rhynchocypris lagowskii. Traditional sampling revealed a significantly higher distribution of Rhynchocypris lagowskii compared to Rhynchocypris oxycephalus, while eDNA sampling failed to detect Rhynchocypris lagowskii almost entirely. The mitochondrial data for the two species was downloaded from NCBI, and after analyzing the 12S rRNA gene, it was found that the similarity between the two species was 96.4%. During species annotation, sequences with a similarity of 97% are usually classified as the same ASVs for annotation. The amplified DNA fragments of these two species, Rhynchocypris lagowskii and Rhynchocypris oxycephalus, are highly similar. This leads to Rhynchocypris lagowskii being incorrectly annotated as Rhynchocypris oxycephalus in the process of eDNA analysis. This suggests that during eDNA analysis, if the parameters set for annotating eDNA sequences in the samples are inappropriate, such as if the threshold is set too high or too low, it could impact the annotation results. This could lead to detection results only containing data from one of two closely related species. This further illustrates the significant differences and complementarity between traditional sampling and eDNA sampling in capturing the full spectrum of biodiversity.
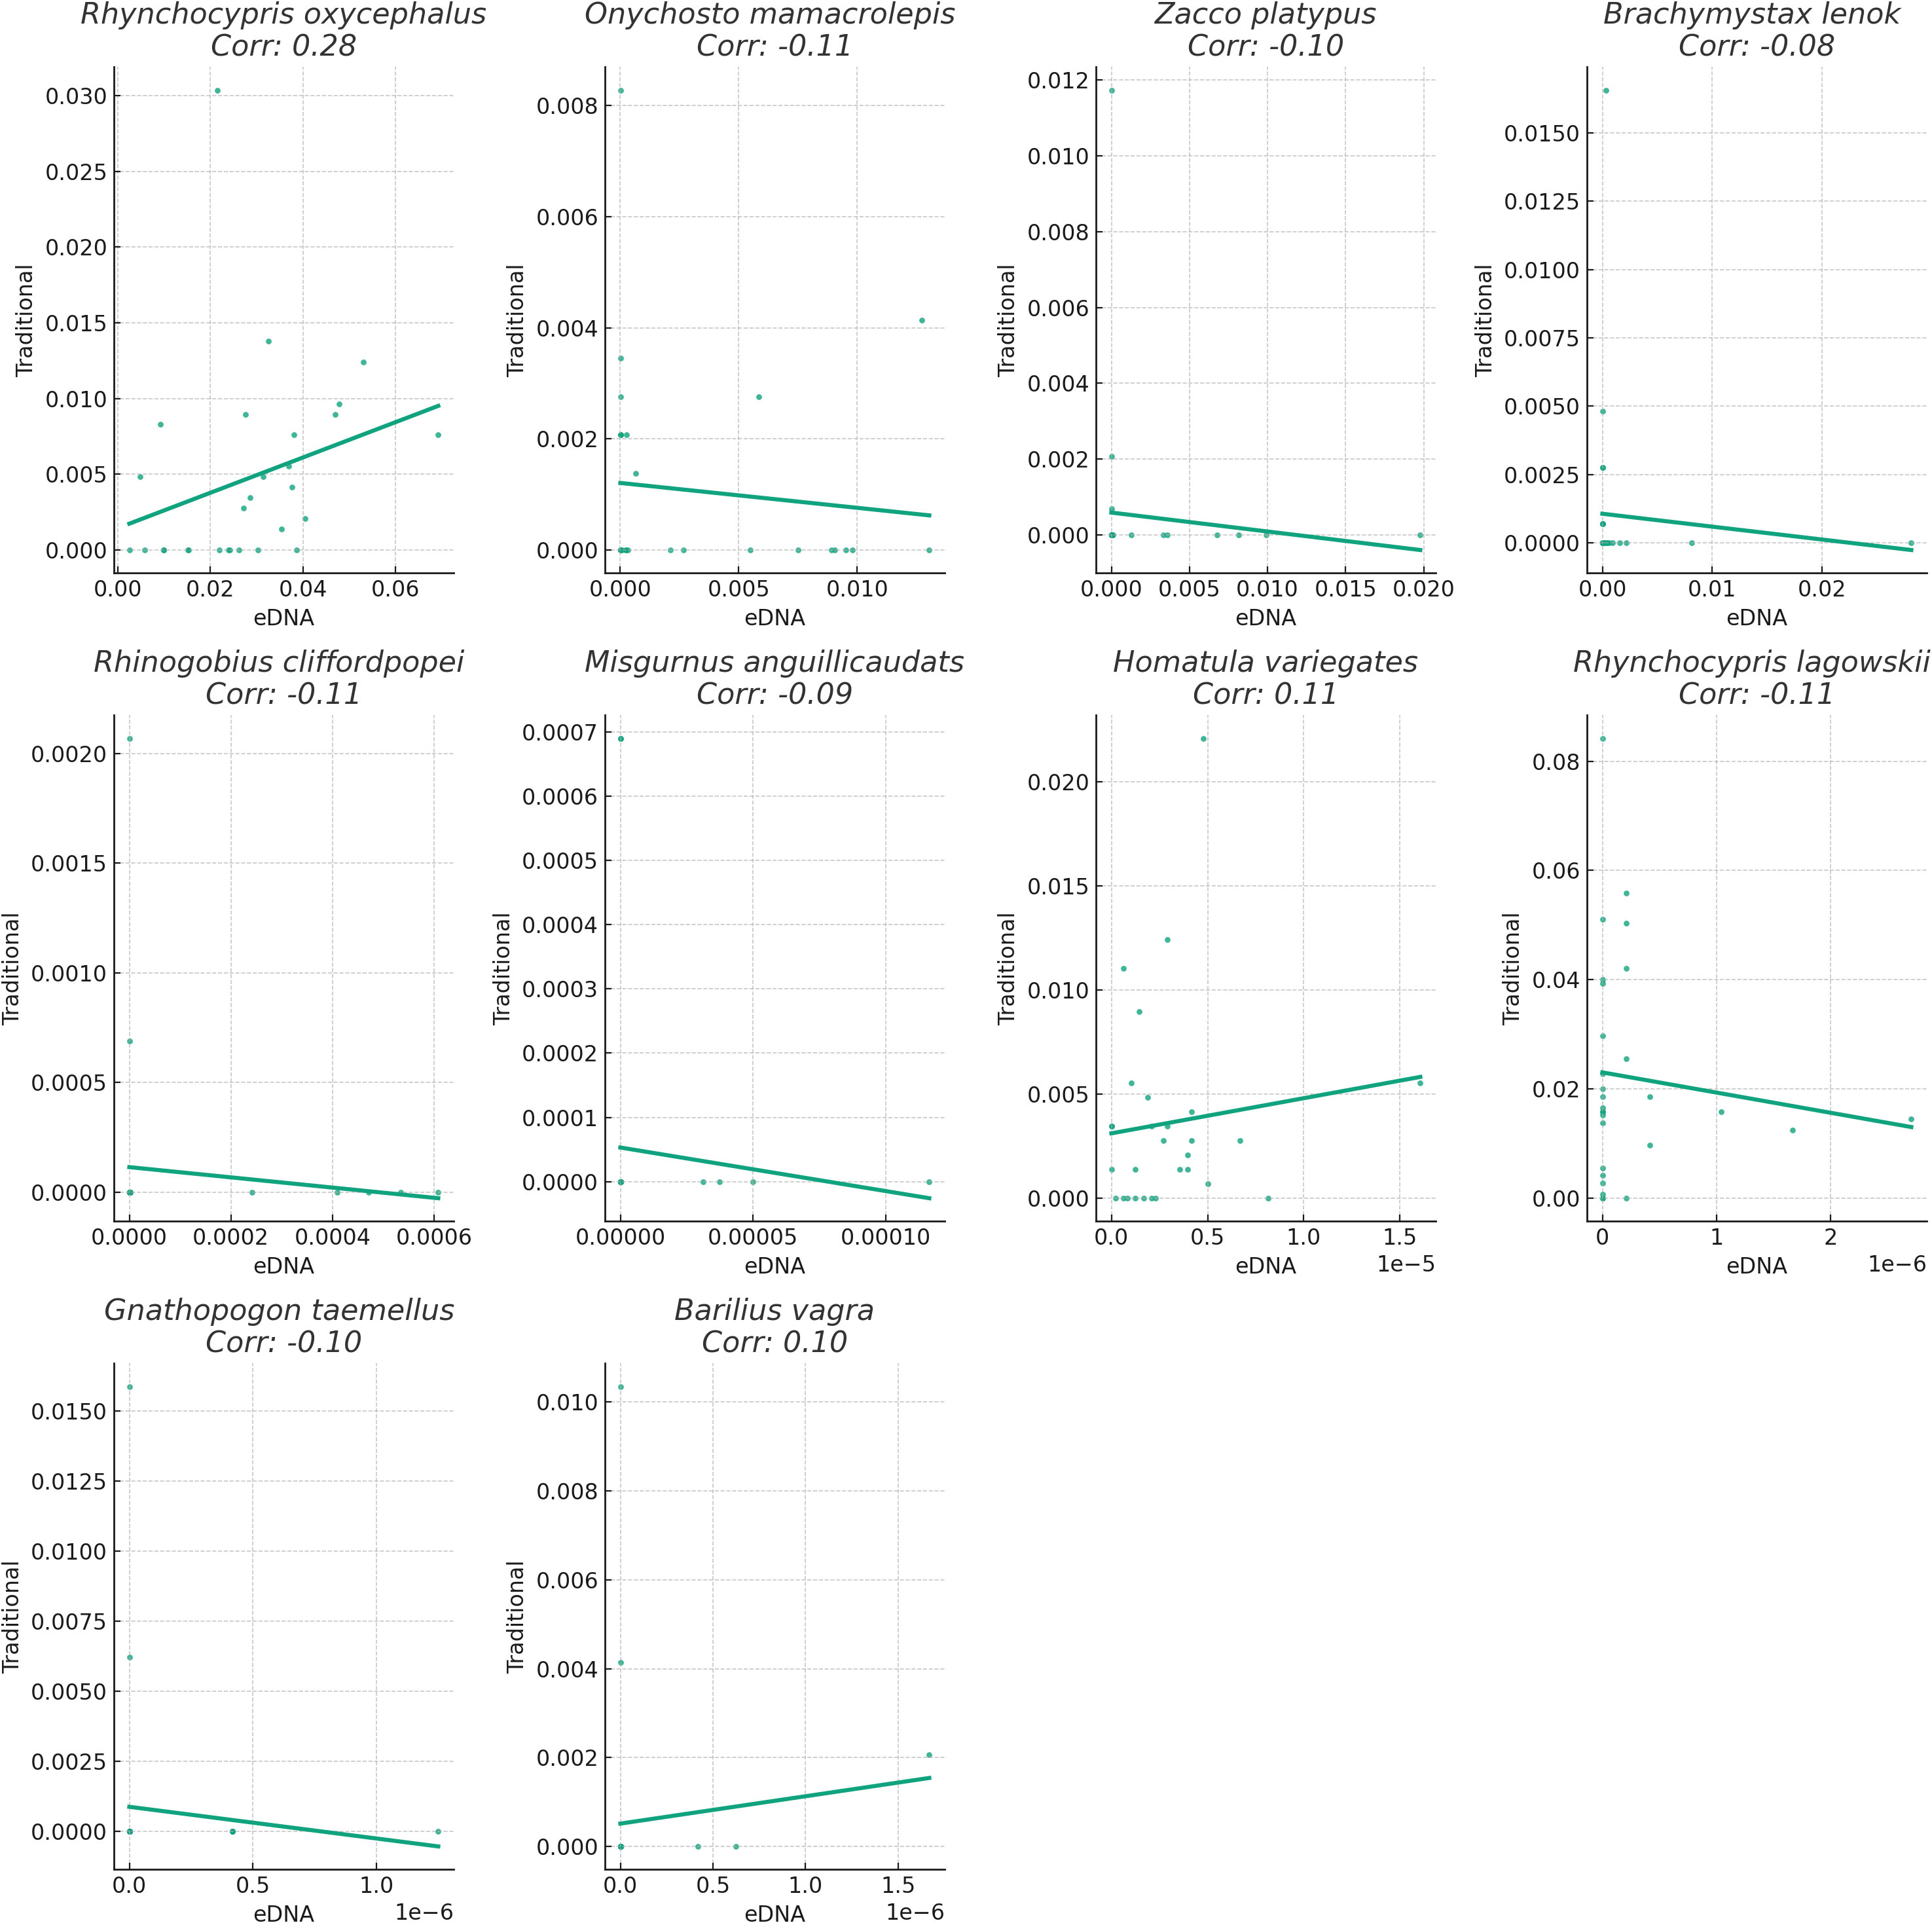
Figure 3 Linear regression graph illustrates the correlation between the relative abundance of two method. Bar length represents correlation magnitude, indicating consistency in relative abundance detection between methods.
We assessed the performance of the two methods by comparing the relative abundance of fish species across sampling points. Relative abundance was determined by calculating the proportion of each fish species within a sampling point, based on the total count of fish in that point. We computed the correlation between the two methods for each fish species to evaluate the consistency in estimating relative abundance. Our findings revealed varying degrees of correlation in the relative abundance of these fish species between the traditional sampling and eDNA sampling methods (Figure 4). This suggests potential differences in the ability of the two methods to identify and quantify fish species of relative abundance. For instance, the correlation coefficient for Rhynchocypris oxycephalus was 0.28, indicating a weak level of agreement in detecting the relative abundance of this species between the two methods. Specifically, while both methods generally captured the same directional change in relative abundance at a given sampling point, they could vary in the magnitude of this change. This suggests that although the two methods are not perfectly aligned, they both have utility in tracking general trends in the relative abundance of this species. Conversely, the correlation coefficient for Gnathopogon taemellus was -0.10, suggesting some disparities in detecting the relative abundance of this species between the two methods. In other words, when the relative abundance of this species increased at a sampling point, one method might detect the change while the other might not, or the two methods might yield conflicting results. This discrepancy could stem from differences in the detection capabilities and accuracy of the two methods, or it could be influenced by natural variations in species distribution that affect the sampling outcomes of different methods.
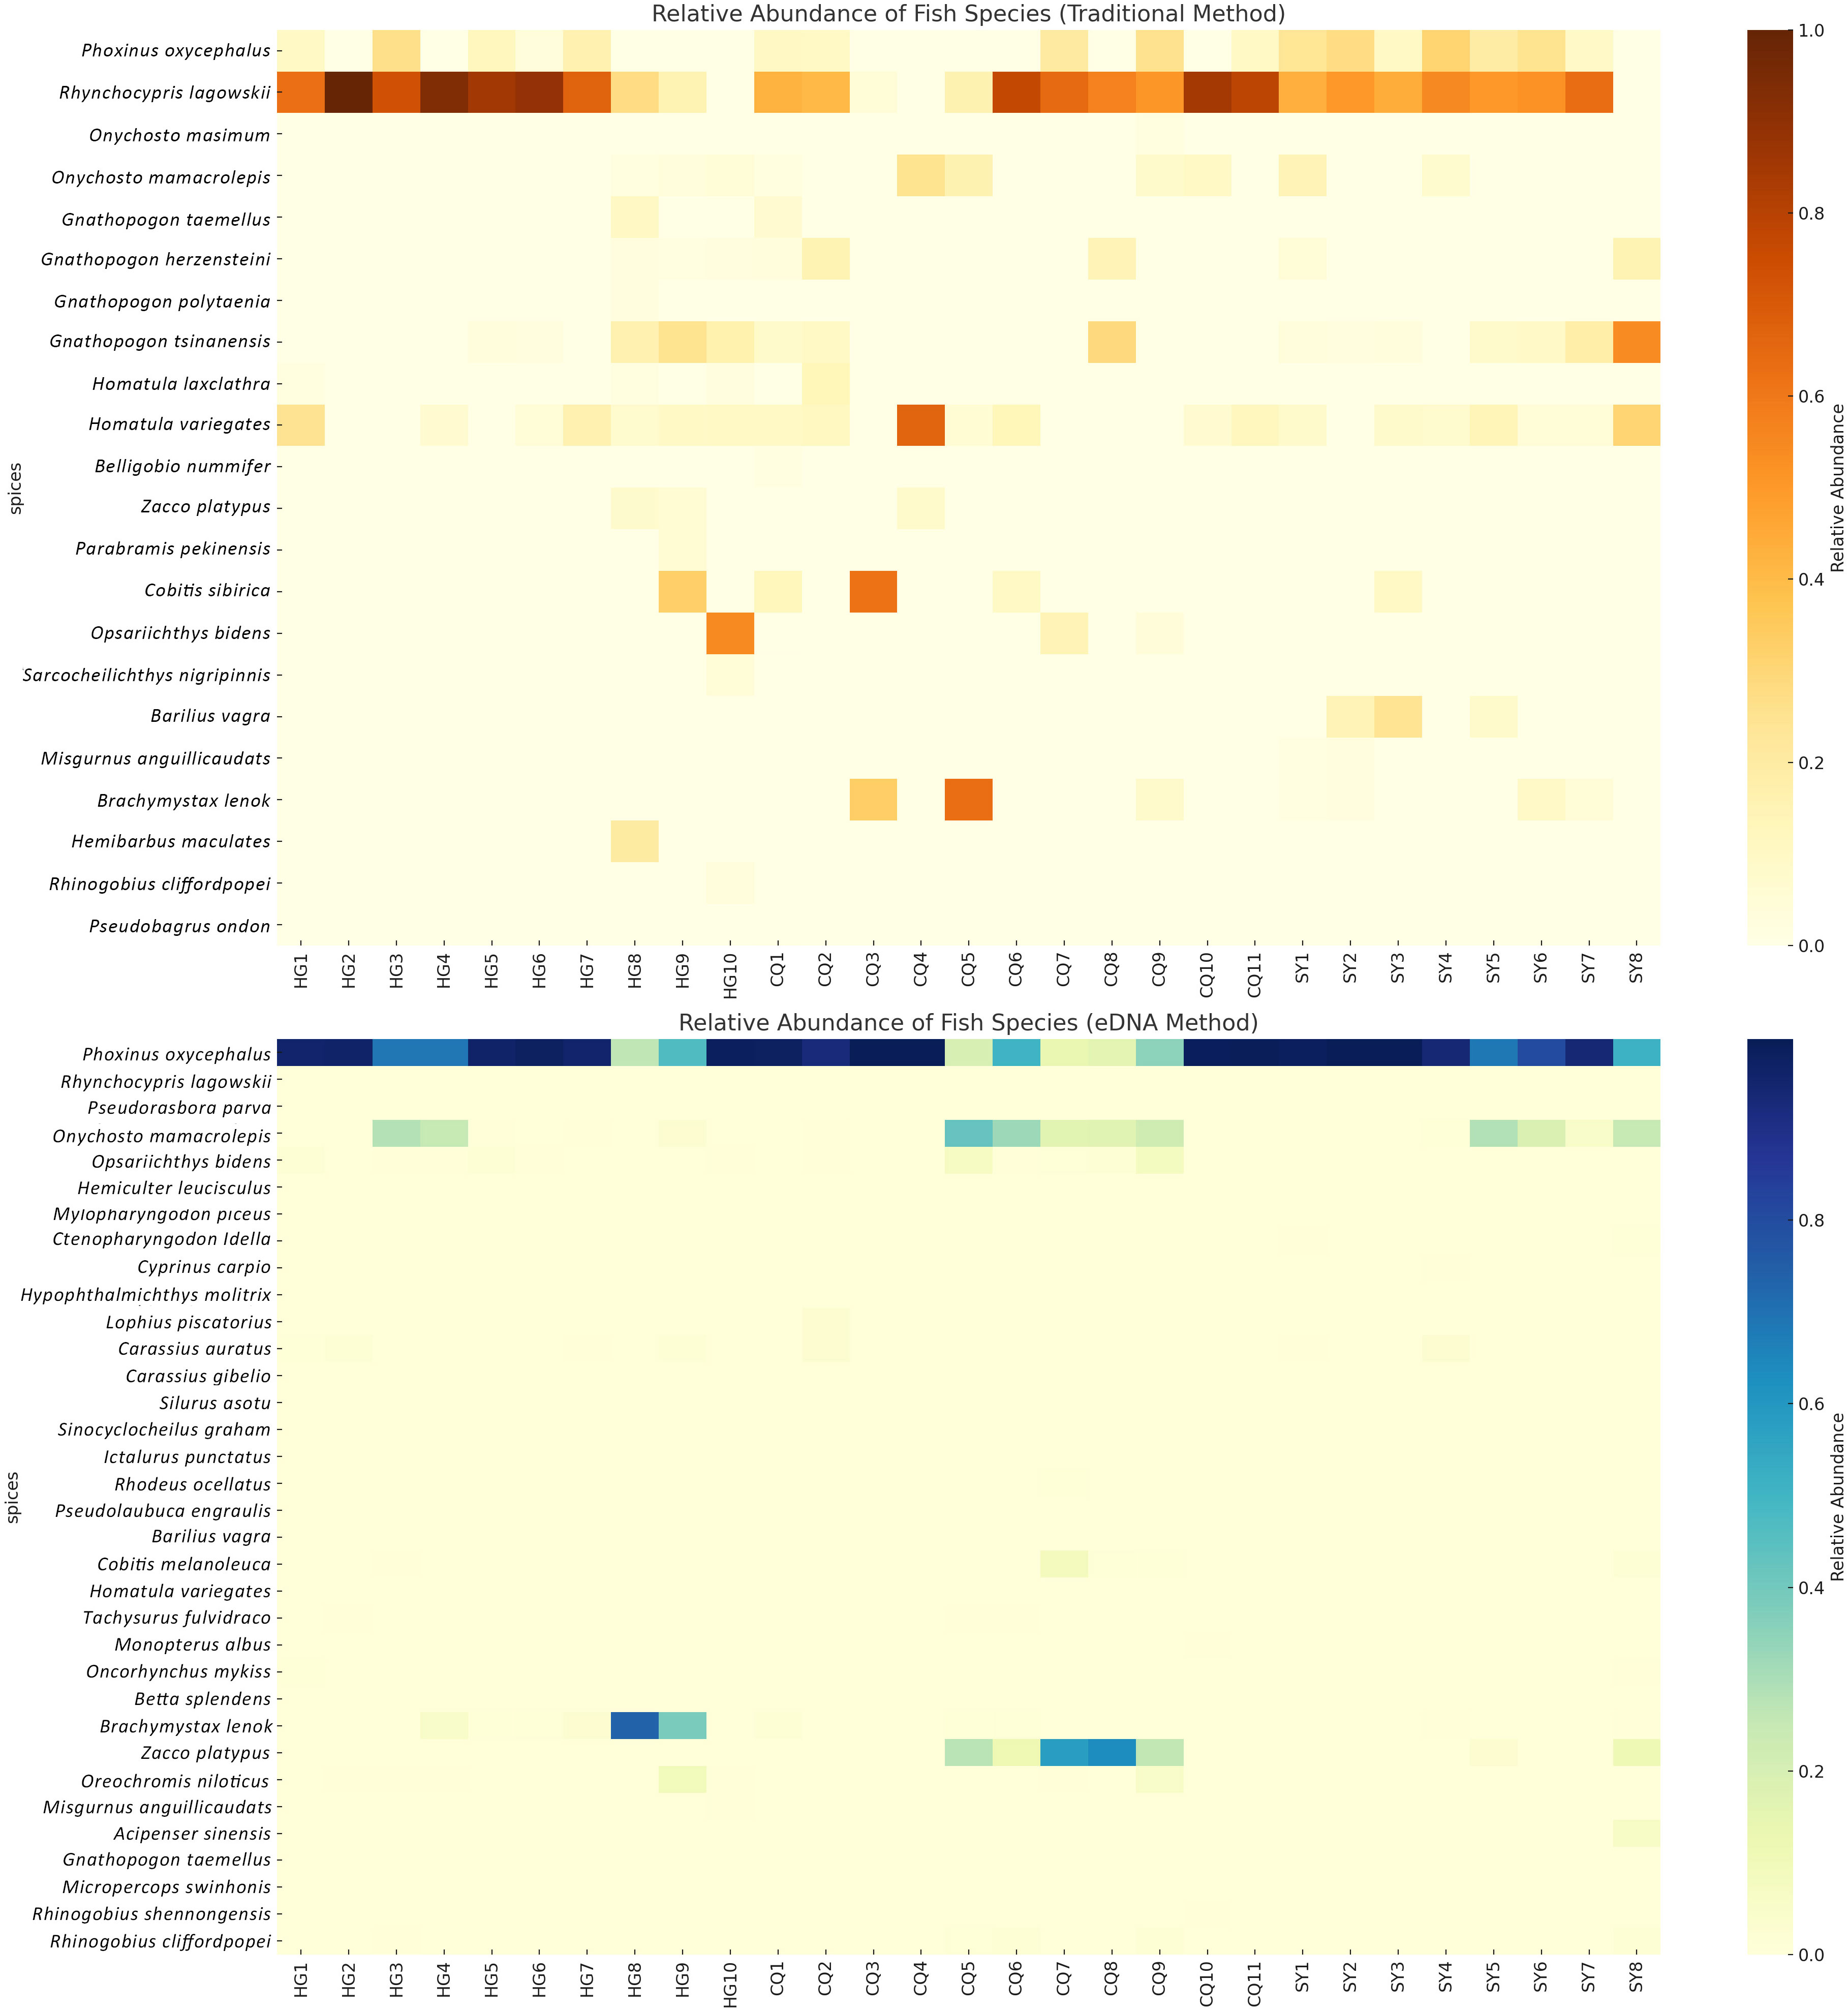
Figure 4 The heatmap displays the relative abundance of fish species at each sampling point. The top panel represents the data obtained from the traditional method, while the bottom panel represents the data obtained from the eDNA method.
3.2 Alpha diversity assessment
In the investigation, we evaluated four biodiversity indices derived from various sampling points, juxtaposing the outcomes of traditional and eDNA sampling methodologies. Each of these sampling techniques displayed unique characteristics in biodiversity assessment, potentially mirroring their specific capabilities in capturing fish species information (Figure 5). Focusing on the Shannon diversity index, our results demonstrated that the values obtained from traditional sampling methods generally surpassed those from eDNA sampling methods. This discrepancy could arise from the comprehensive species information gathered by conventional sampling techniques, while eDNA sampling outcomes might be influenced by the abundance and dispersion of DNA fragments in the water. This finding accentuates the strengths of traditional sampling methods in evaluating biodiversity, concurrently shedding light on certain limitations of eDNA sampling methods. In the analysis of the Simpson diversity index, we noted a broader range of outcomes from traditional sampling, potentially indicating a superior capacity in gauging species richness. Conversely, eDNA sampling results appeared more clustered, possibly signaling a higher consistency in capturing species richness. When examining the Berger-Parker Dominance Index (BPD), we observed higher values with the eDNA technology. This might imply that different sampling techniques can lead to different biases in the results. Traditional sampling methods may miss certain species that are hard to capture or less visible, while eDNA technology might detect these species more effectively. Additionally, eDNA technology could be more sensitive to certain species, leading to their overrepresentation in the samples, and therefore a higher proportion in the overall sample. Lastly, for the Pielou Evenness Index, traditional sampling methods often yield higher values compared to eDNA sampling methods. This could be due to traditional sampling methods potentially being better at capturing the true distribution of species, especially when these species are relatively evenly distributed in the environment. At specific sampling points, we also uncovered intriguing phenomena (Supplementary Table 4). For instance, at the HG1 sampling point, both the Shannon and Berger-Parker indices from traditional sampling were relatively high, indicating greater fish biodiversity at this location. These indices were relatively low in eDNA sampling. In contrast, at the CQ5 sampling point, these indices from traditional sampling were relatively low, whereas eDNA sampling revealed higher values. These discrepancies might be a manifestation of detection variations between traditional and eDNA sampling methods.
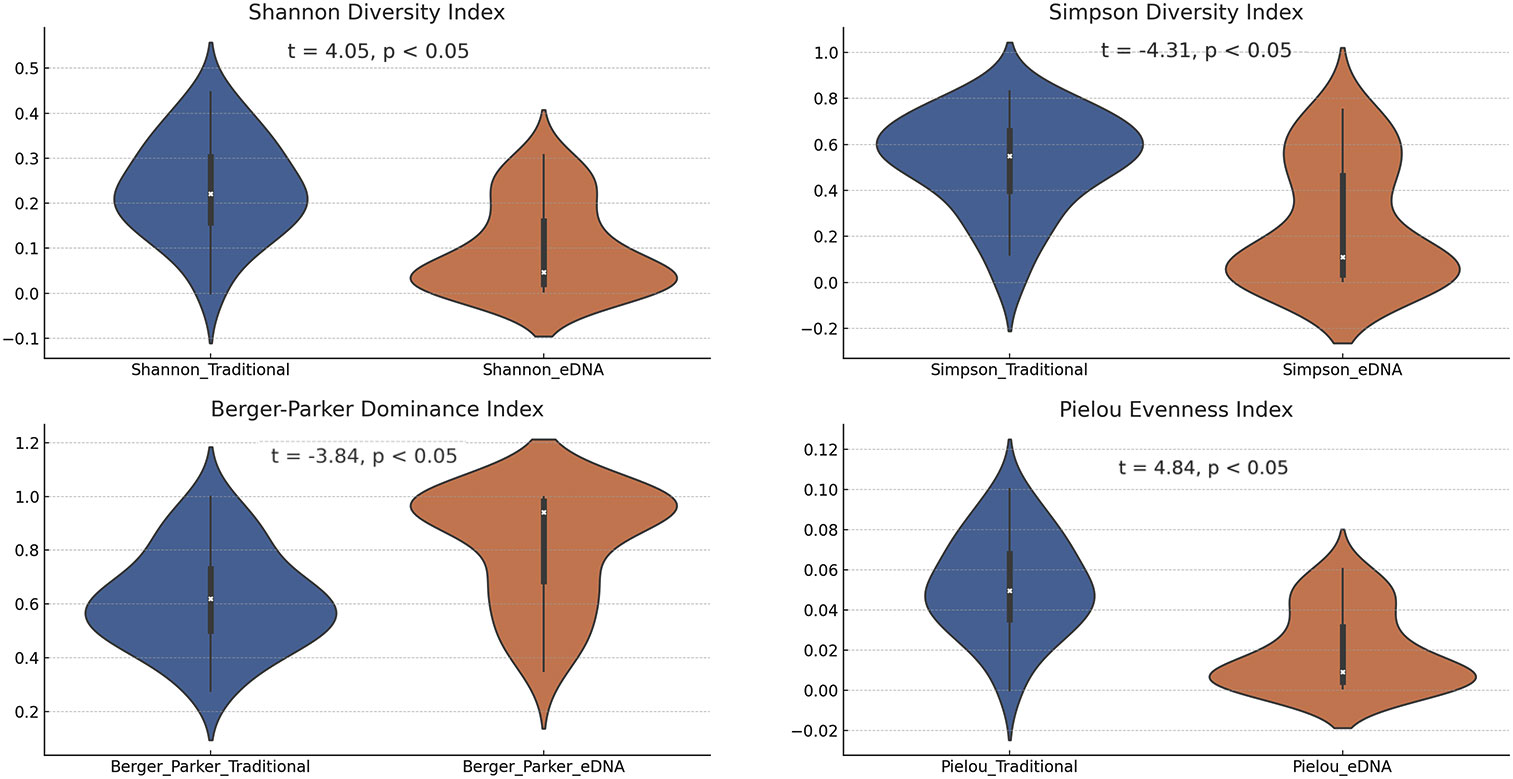
Figure 5 The violin plots present the four biodiversity indices calculated using the two sampling methods.
Furthermore, we conducted a correlation analysis among the four biodiversity indices (Supplementary Figure 1), elucidating the relationships between the diversity indices obtained from traditional and eDNA sampling methods. Specifically: (a) The correlation for the Shannon diversity index was 0.05. This suggests no significant positive or negative correlation between the Shannon diversity indices obtained from traditional and eDNA sampling methods. This could indicate variations in the ability of the two methods to capture fish biodiversity, or it could be due to inherent fluctuations in the Shannon diversity index across different samples. (b) The correlation for the Simpson diversity index was 0.14. Although this value is slightly larger, it still implies a relatively weak relationship between the Simpson diversity indices obtained from traditional and eDNA sampling methods. This could be reflective of differences between the two methods in assessing biodiversity, or it might be due to natural variations in diversity among samples. (c) The correlation for the Berger-Parker dominance index was 0.16. Similarly, this value indicates no significant positive or negative correlation between the Berger-Parker dominance indices obtained from traditional and eDNA sampling methods. This could be due to differences in the ability of the two methods to capture the distribution of dominant species. (d) The correlation for the Pielou evenness index was 0.05. This value suggests no significant positive or negative correlation between the Pielou evenness indices obtained from traditional and eDNA sampling methods. This could indicate differences in the two methods ability to assess community evenness or variations in evenness among samples.
Taken together, these results reveal a relatively low correlation between the traditional and eDNA sampling methods across these four biodiversity indices. This could suggest inherent differences between the two sampling methods in capturing and assessing biodiversity, dominance, and evenness (Anderson et al., 2011). These disparities could be ascribed to variations in the sampling methods themselves—for instance, the skills and tools used in traditional sampling or the steps involved in sample processing, DNA extraction, and sequence analysis in eDNA sampling (Bohmann et al., 2014; Valentini et al., 2016). Additionally, these differences could also stem from the inherent variability in biological communities, where biodiversity, dominance, and evenness can significantly fluctuate across different samples and environments (Hajibabaei et al., 2011; Piggott, 2016). These potential factors warrant careful consideration and further investigation in actual biodiversity research.
3.3 Beta diversity assessment
In this research, we employed two methodologies - eDNA and traditional methods - as well as two beta diversity indices - Bray-Curtis and Jaccard - to assess the fish species diversity across 29 sampling points in rivers, highlighting the differences in species composition between eDNA sampling and traditional sampling methods. we visualized the sampling results and index values using heatmaps (Supplementary Figure 2), providing an intuitive illustration of the differences between the sampling points. This comprehensive approach allows for a detailed exploration of the complex interplay between sampling methods and beta diversity metrics in understanding riverine fish diversity.
From the heatmap of Bray-Curtis indices obtained through eDNA sampling, we observed a significant variation in the average values across all sampling points, ranging from 0.31 to 0.70. This suggests that the beta diversity measured by eDNA sampling and Bray-Curtis indices shows considerable differences among different sampling points. Each sampling point of beta diversity index also demonstrated certain variability, potentially reflecting the influence of environmental conditions, fish population dynamics, or sampling techniques. However, when we turned to the heatmap of Jaccard indices from eDNA sampling, we found that the average values of all sampling points were close to 1, indicating significant differences in fish communities among different sampling points. This could be because the Jaccard index places more emphasis on the presence or absence of species rather than their relative abundance, hence even some rare species that are difficult to sample through traditional methods may greatly influence the Jaccard index.
Simultaneously, we also examined the results from traditional sampling. In the heatmap of Bray-Curtis indices from traditional sampling, we noted a considerable variation in the average values across all sampling points, ranging from 0.48 to 0.86. This could reflect the sensitivity of traditional methods to differences in species abundance, as well as the influence of environmental conditions and fish population dynamics at different sampling points. When we used the Jaccard index to evaluate the beta diversity from traditional methods, we found that the average values of all sampling points were also close to 1, indicating significant differences in fish communities among different sampling points. This could be because traditional methods can detect more species, including some rare ones that are difficult to sample through eDNA sampling.
Conducted in-depth statistical analyses of these results, which included the Wilcoxon signed-rank test, Pearson correlation analysis (Table 1), and the creation of Bland-Altman plots (Supplementary Figure 3). For the Bray-Curtis index, the results from eDNA sampling and traditional methods showed a significant positive correlation (Pearson correlation coefficient r = 0.33, p< 0.001). Although the correlation is not very strong, it still suggests that both methods can yield consistent results in most instances. However, the results from the Wilcoxon signed-rank test showed a statistically significant difference between the outcomes from the two methods (p< 0.001). This indicates that, despite their overall agreement, there may be significant discrepancies at some specific sampling points. As for the Jaccard index, the results from eDNA sampling and traditional methods exhibited a very strong positive correlation (Pearson correlation coefficient r = 0.94, p< 0.001). This means that the two methods are capable of yielding consistent results in almost all instances. However, the results from the Wilcoxon signed-rank test showed no statistically significant difference between the outcomes of the two methods (p = 0.18). The consistency of the measurements from the two methods can also be intuitively seen in the Bland-Altman plots. Most points lie between the blue lines, which represent the 95% confidence intervals of the differences, suggesting that the results from the two methods are consistent at most sampling points. However, some points lie outside the blue lines, indicating substantial discrepancies between the measurements from the two methods at these sampling points.
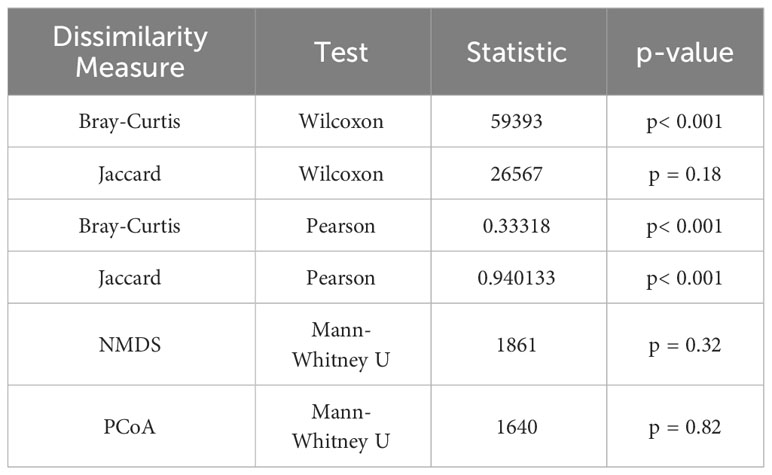
Table 1 Wilcoxon signed-rank test and Pearson correlation analysis and Mann-Whitney U test.
To conclude, our preliminary statistical analyses and visualization results illuminate the differences between eDNA and traditional methods in measuring fish beta diversity, as well as the distinct characteristics of the Bray-Curtis and Jaccard beta diversity indices. While both eDNA sampling and traditional methods can yield consistent results in most instances, significant discrepancies can occur under certain specific circumstances. This may be due to the unique characteristics of each sampling method, such as sampling efficiency, sensitivity to environmental disturbances, among others. These results highlight the complexity of fish communities at each sampling point, and shed light on the advantages and limitations of the two sampling methods and two beta diversity indices in reflecting this complexity. Therefore, it is essential that these differences are taken into account for a more accurate interpretation and understanding of the research results when utilizing these methods for biodiversity research. Future research could further delve into the reasons for these differences and explore how to better leverage these methods and indices to assess and monitor fish species diversity. Ultimately, our study underscores the need for nuanced approaches in biodiversity research, reflecting the intricate interplay between methodological choices and ecological realities.
To delve deeper into the potential statistical differences between the two sampling methods — environmental DNA (eDNA) and traditional sampling — in measuring biodiversity, we conducted preliminary non-metric multidimensional scaling (NMDS) and principal coordinate analysis (PCoA) on the Bray-Curtis and Jaccard indices (Figure 6). In the NMDS plot, the sample points of eDNA sampling and traditional sampling show significant separation on the first dimension (x-axis), especially the points of eDNA sampling and traditional sampling based on the Bray-Curtis index, which are largely distributed in two different areas on the first dimension. This may suggest that eDNA sampling and traditional sampling may have different tendencies when measuring biodiversity. However, on the second dimension (y-axis), there is some overlap of sample points between eDNA sampling and traditional sampling, especially the sample points based on the Jaccard index, which may imply that in certain respects, these two methods may yield similar results. In the PCoA plot, we attempted to identify the directions that explain the most sample variability and used these directions (i.e., principal coordinates) as the axes of the graph. We can see that the distribution of eDNA data and traditional data on the first principal coordinate of Bray-Curtis and Jaccard indices shows certain differences, suggesting that eDNA sampling and traditional sampling methods may vary in capturing sample diversity. However, on the second principal coordinate, the sample distribution of these two methods is more similar, indicating that in certain aspects, the results from these two methods may bear some resemblance.
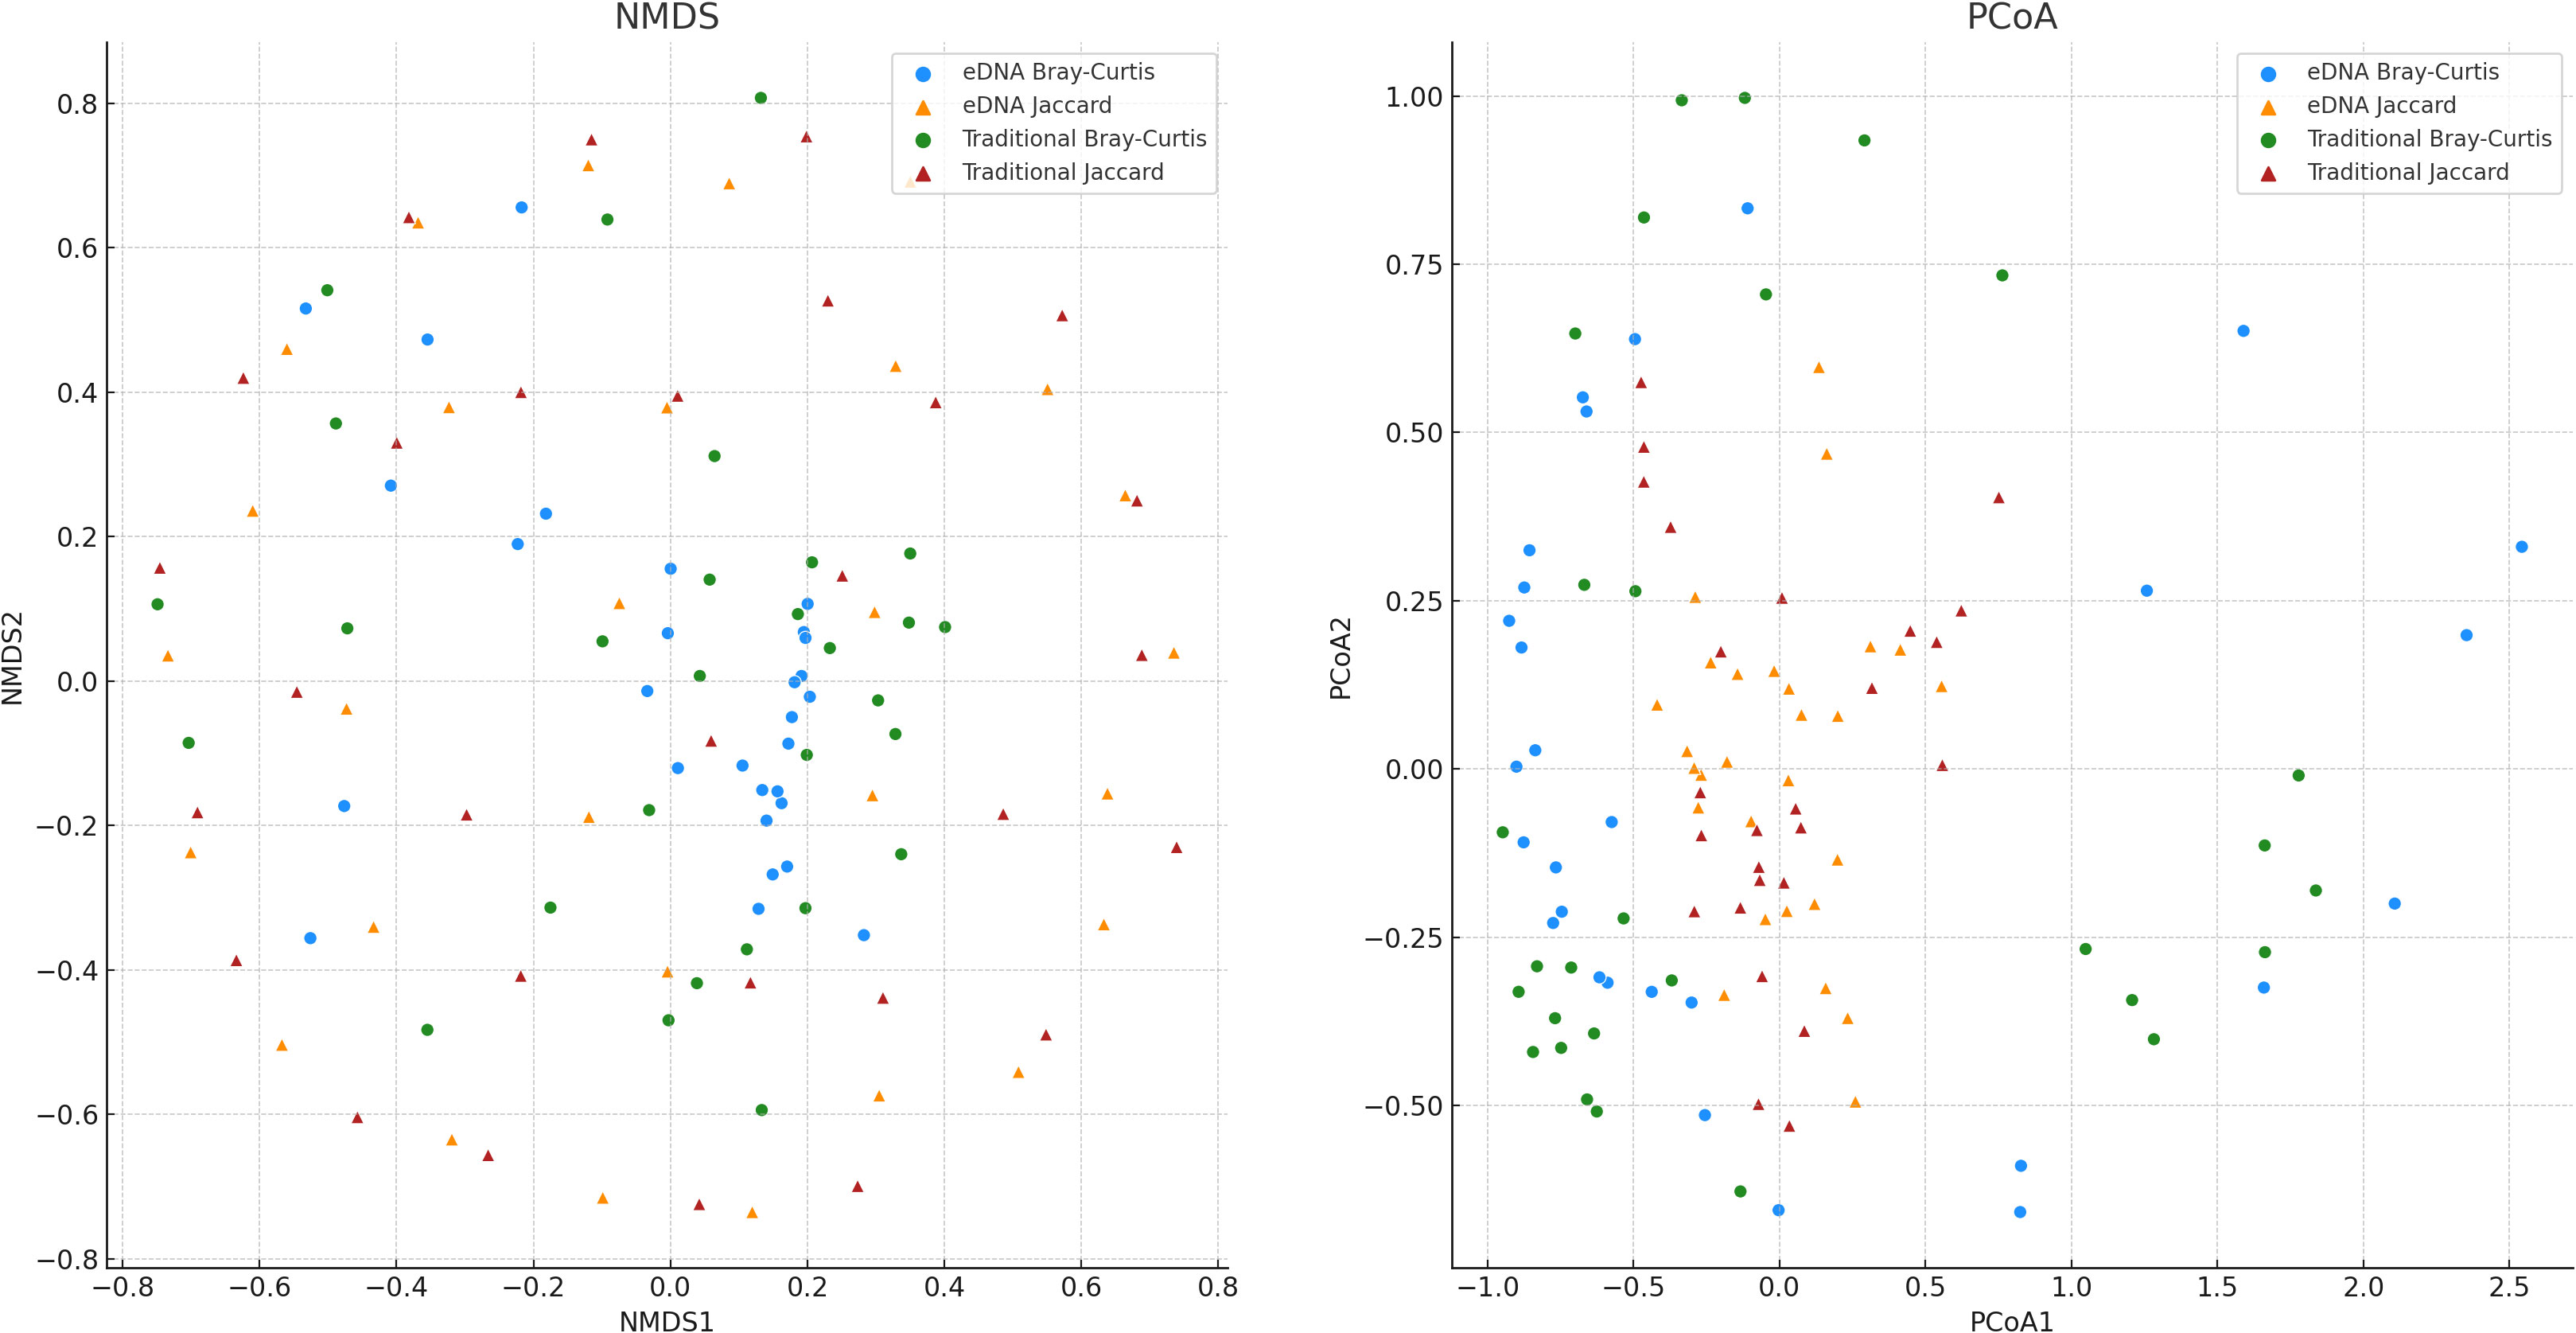
Figure 6 The results of Non-metric Multidimensional Scaling (NMDS) applied to the Bray-Curtis and Jaccard dissimilarity, resulting in dimensionality reduction. And, the results of Principal Coordinate Analysis (PCoA) applied to the Bray-Curtis and Jaccard dissimilarity, also resulting in dimensionality reduction. Each point represents a sample, with the color indicating the dissimilarity metric used (Bray-Curtis or Jaccard), and the shape representing the sampling method (eDNA or traditional sampling).
While preliminary observations from the NMDS and PCoA graphs showed distribution differences between eDNA data and traditional data, these results dont conclusively determine the superiority of one sampling method over the other, nor do they definitively establish the presence of significant differences between the two methods. To probe this question with greater precision, we performed an additional Mann-Whitney U test (Table 1), a statistical procedure employed to assess whether significant differences exist in the overall distribution of two independent samples. From the NMDS results, we found no significant difference in the distribution between eDNA sampling and traditional sampling (p>0.05). This suggests that in terms of measuring the overall similarity of biodiversity among samples - as indicated by the NMDS - both methods may exhibit no significant differences. Similarly, the PCoA results also revealed no significant difference in the distribution between eDNA sampling and traditional sampling (p>0.05). This insinuates that when quantifying the overall similarity of biodiversity among samples - as represented by the PCoA - these two methods may again show no significant differences.
In summary, although eDNA sampling and traditional sampling may have differences in the ways they measure biodiversity, from a statistical perspective, there are no significant differences between the two in measuring riverine fish biodiversity. This may suggest that these two sampling methods differ in their ability to capture biodiversity, but the technical differences in processing samples or measuring biodiversity did not result in significant differences in the statistical outcomes.
3.4 Bridging the gap of two methods
The examination of both eDNA and traditional sampling methods elucidates that a reliance on either approach in isolation falls short of rendering a comprehensive portrayal of the ecological scenarios faced by riverine fish species. The integration of both methodologies stands to furnish a more holistic perspective for performing species distribution analysis and alpha diversity analysis, thereby enriching our understanding of the riverine ecosystem dynamics.
Upon an encompassing examination of species diversity across three distinct rivers, achieved through the harmonization of two independent analytical methodologies, we attained a more thorough understanding. Initially, a species composition investigation was conducted, wherein heatmap visualization (Figure 7) conspicuously illustrated high relative abundance distribution traits of two phylogenetically proximate species within the same genus, Rhynchocypris oxycephalus and Rhynchocypris lagowskii, across numerous sampling locales. For instance, at sampling locale HG1, Rhynchocypris oxycephalus manifested a relative abundance of 52.86%, whilst at HG5, it was 53.85%; at HG3, Rhynchocypris oxycephalus exhibited a relative abundance of 47.50%, concurrently, Rhynchocypris lagowskii manifested a relative abundance of 36.53%; at HG7, the relative abundances of Rhynchocypris oxycephalus and Rhynchocypris lagowskii were 55.97% and 33.64% respectively. This pronounced richness may signify a dominant or prevalent occurrence of these species within these vicinities. Such distribution delineations may echo a semblance of ecological requisites and adaptability, encompassing preferences towards water quality, food resource availability, and habitat conditions. Given their close phylogenetic relationship, these species may share a spectrum of ecological and biogeographical attributes, inclusive but not limited to, resilience towards certain environmental stressors or adaptability to specific habitats. This also might elucidate the co-existence of these species at multiple sampling locales, with sustained relatively high abundances. Collectively, the distribution and abundance paradigms of these closely related species may serve as a direct manifestation of their ecological and evolutionary historical congruencies. Also, we can derive from this amalgamated relative abundance data, multiple ecological phenomena and patterns were discerned. Initially, at certain sampling locales (e.g., HG3 and HG4), Onychostoma macrolepis demonstrated a high relative abundance of 14.22% and 12.48% respectively, insinuating a particular congeniality of these environmental conditions for this species. Conversely, at HG5 and HG6, the relative abundance of Opsariichthys bidens was merely 1.16% and 0.32% respectively, potentially portraying a rare or endangered status of this species at these locales. Subsequently, at locales such as SY7, notable species richness and equilibrium were observed with the presence of Rhynchocypris oxycephalus (51.60%), Rhynchocypris lagowskii (31.82%), and Onychostoma macrolepis (2.80%), often heralded as indicators of ecosystem health. Additionally, subtle variances like the relative abundance of Opsariichthys bidens at CQ10 and CQ11 sampling locales being 0.12% and 0.05% respectively, could be precipitated by seasonal or geographical determinants. Lastly, at sampling locales HG8 and HG9, the relative abundances of most species were notably diminished, potentially indicative of ecological degradation instigated by environmental stressors or anthropogenic activities.
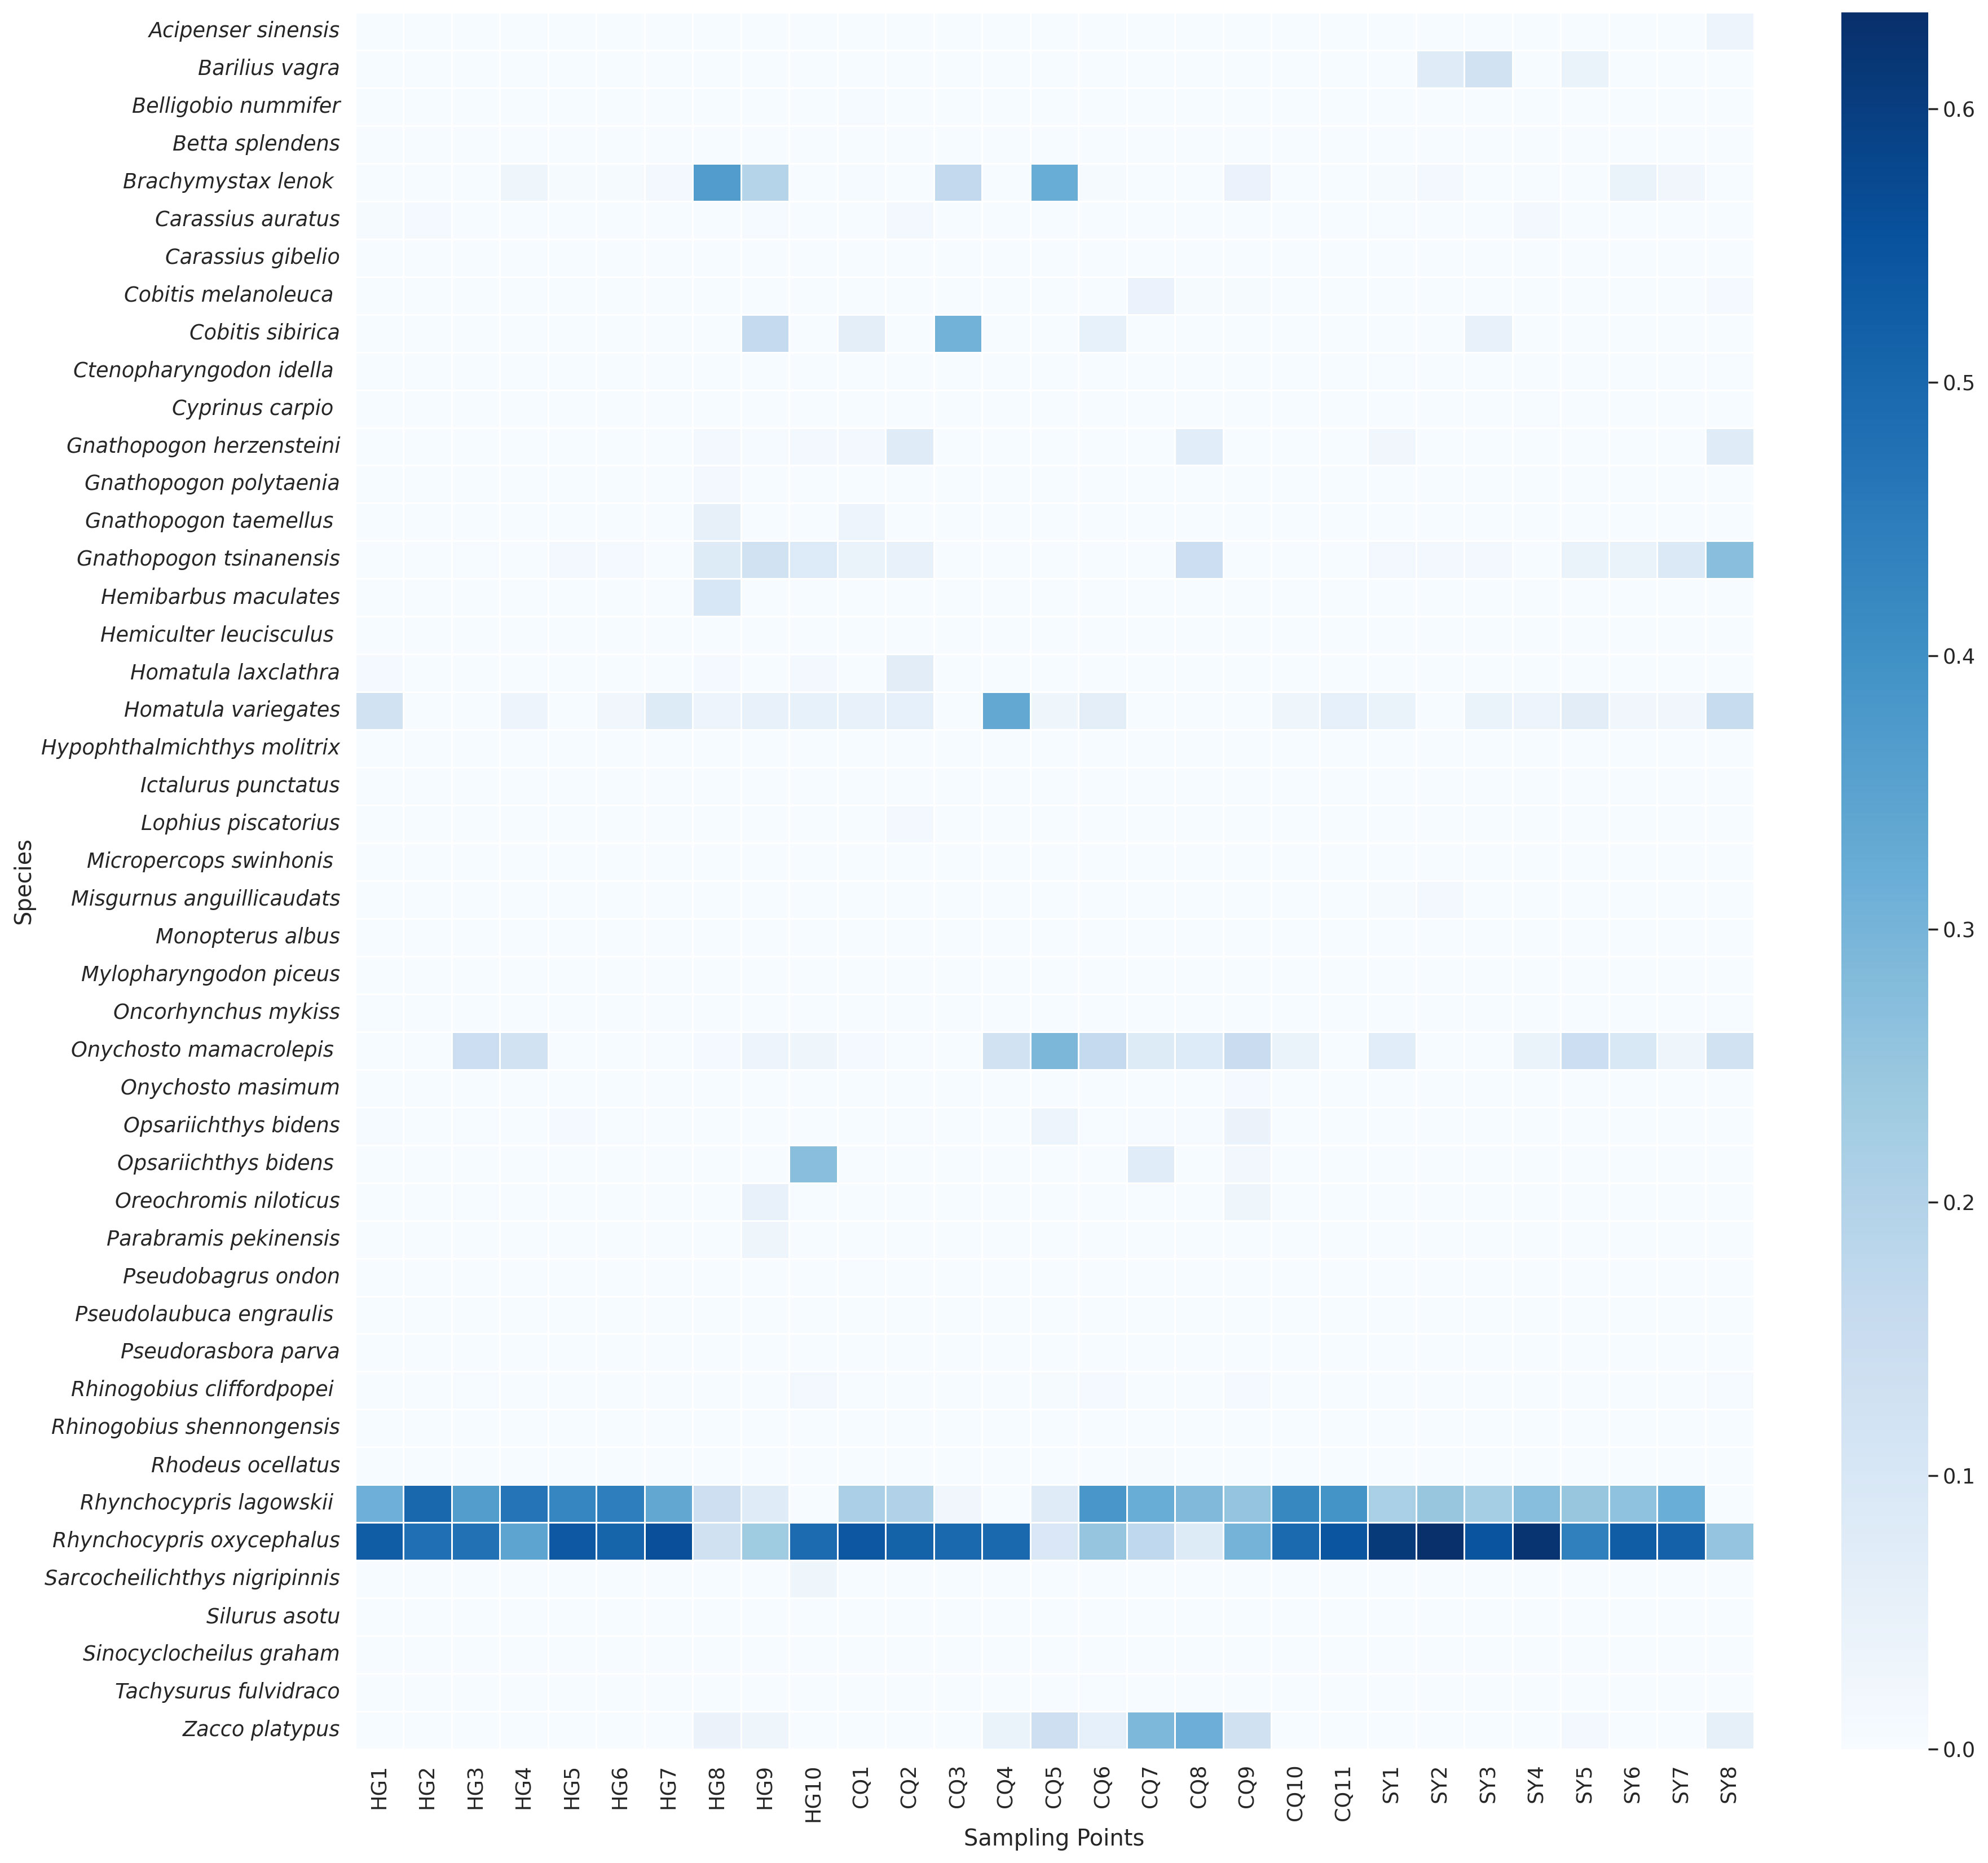
Figure 7 The heatmap displays the relative abundance of fish species at each sampling point following the integration of both methods.
Subsequently, we employed the eDNA method, traditional method, and their integrated data respectively for the three rivers to conduct alpha diversity calculations. We computed the four indices mentioned earlier, and by averaging these indices, it was easily observed from the radar chart that the data, post-integration of both methods, usually exhibited more comprehensive characteristics (Figure 8). Particularly in the assessment of Shannon diversity and Berger-Parker dominance, the integrated method demonstrated significant superiority across all three rivers. This indicates that the integrated method can not only capture species richness more comprehensively but also effectively prevent the over-dominance of a single species. In the evaluation of Simpson diversity and Pielou evenness, the integrated method also showed relatively good performance, especially in the rivers of the Huangguan and Sangyuan region. However, its worth noting that in the rivers of the Changqing region, the traditional method displayed a slight advantage in the assessment of Simpson diversity. This might suggest that under certain specific environments or conditions, the traditional method may still possess some applicability and advantages. Nevertheless, overall, this minor advantage is not sufficient to offset the comprehensive advantages demonstrated by the integrated method in other aspects of evaluation.
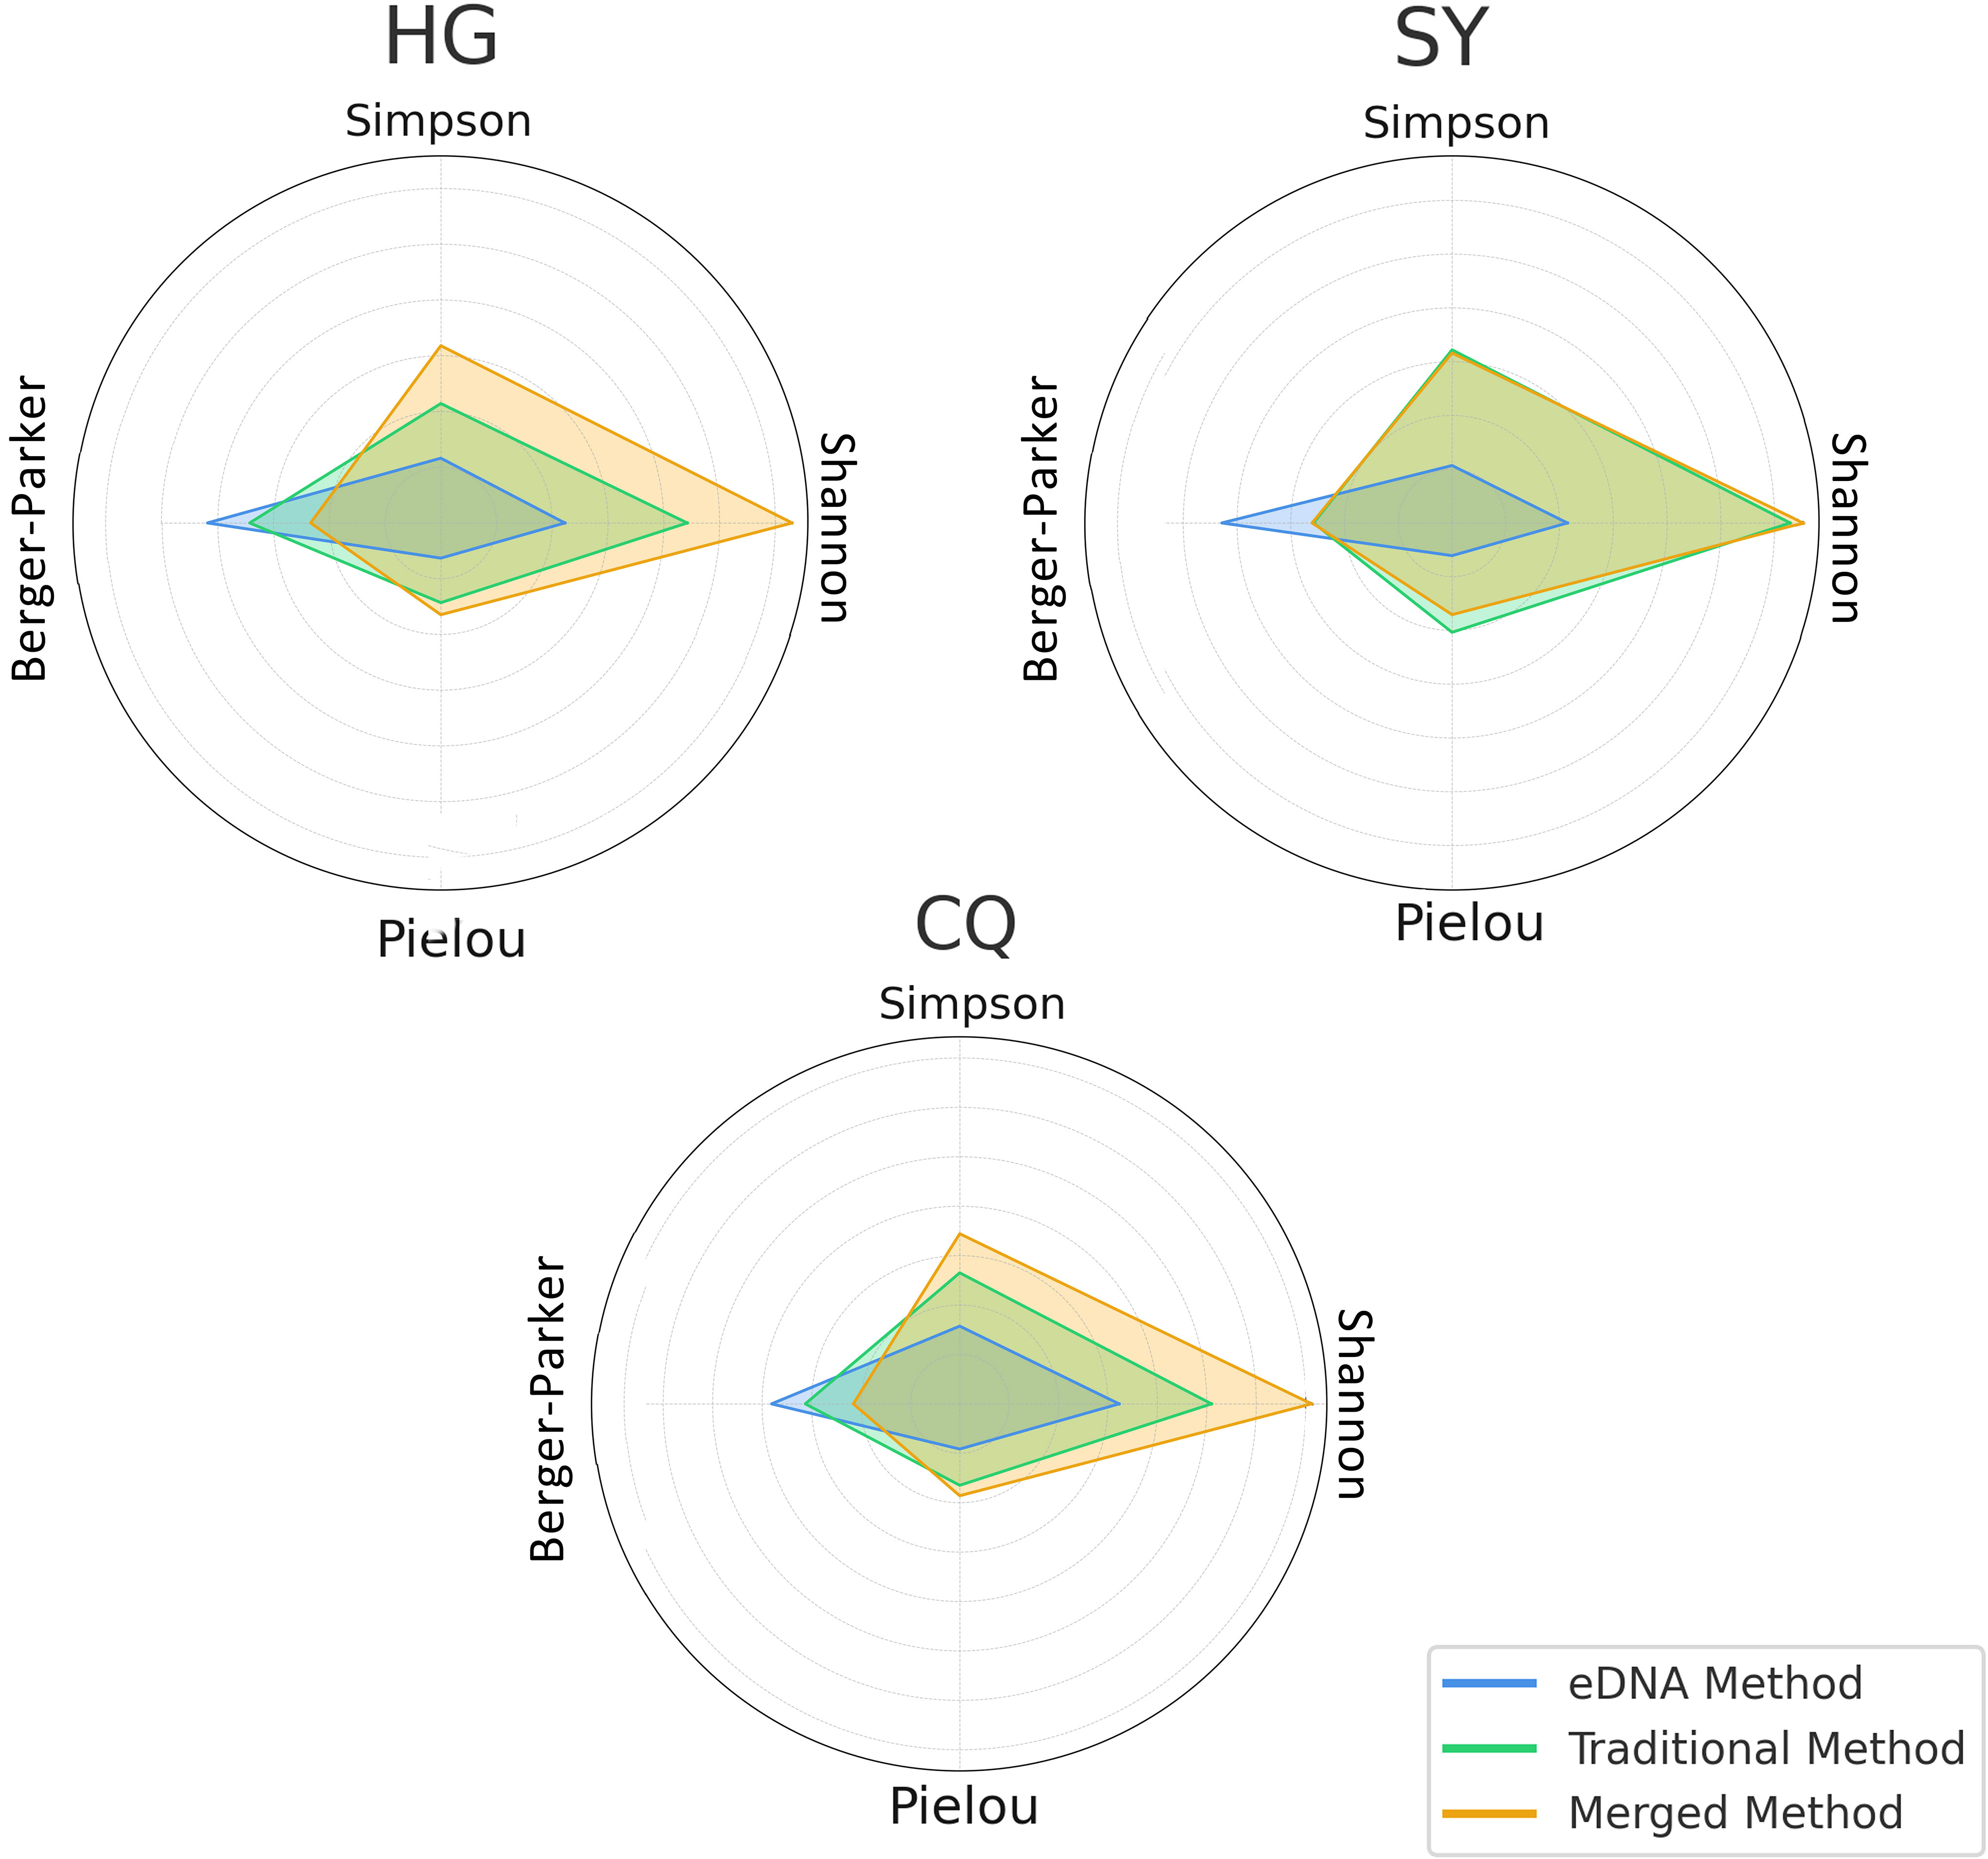
Figure 8 The radar chart separately exhibits the average diversity indices for each river area under two different sampling methods as well as after integrating both methods.
In summation, the amalgamation of data gleaned from both eDNA and conventional methodologies typically engenders a more robust and precise appraisal of biodiversity. This synergistic approach not only elucidates a more holistic depiction of biological diversity but also avails a more balanced and comprehensive spectrum of ecological information, which is pivotal for the long-term surveillance and preservation of biodiversity. By melding diverse methodologies and datasets, we attain a more exacting understanding and assessment of the diversity and health status of riverine ecosystems, thereby furnishing invaluable insights for future ecological preservation and management endeavors.
4 Conclusion
In this study, a meticulous examination of both traditional and eDNA sampling methodologies was conducted to garner a nuanced understanding of fish diversity across selected riverine ecosystems. The comparative analysis aimed at unraveling the intrinsic merits and demerits of each approach concerning species identification, abundance estimation, α-diversity, and β-diversity. Our findings elucidate that while eDNA sampling holds promise in detecting a broader spectrum of fish species, it grapples with challenges, particularly in distinguishing certain closely related species. Conversely, traditional methods exhibit prowess in accurately detecting some fish species that elude the eDNA method. When venturing into the realm of α-diversity indices, encompassing the Shannon diversity index, Simpson diversity index, Berger-Parker dominance index, and Pielou evenness index, a distinct narrative unfolded. Both methodologies manifested unique characteristics in encapsulating fish species information, albeit with intrinsic variations in capturing and assessing biological diversity, dominance, and evenness. In the discourse of β-diversity, a parity was observed between eDNA and traditional sampling in measuring fish species diversity, insinuating that the divergent capabilities of both methods in capturing biological diversity do not transmute into significant discrepancies in statistical outcomes.
In order to bridge the gap in species distribution and alpha diversity between traditional sampling and eDNA sampling, we integrated the two data. The crux of the analysis across three distinct rivers of the [Area Name] region, leveraging the synergistic potential of both analytical paradigms, not only furnished a more intricate understanding of species diversity but also underscored the quintessence of an integrated analytical lens. The conspicuous patterns of relative abundance distribution, especially among phylogenetically proximate species, unveiled a nuanced interplay of ecological, biogeographical, and evolutionary factors that underpin species distribution and abundance in these ecosystems. Such insights are paramount in advancing our grasp of ecosystem health, species interactions, and the overarching ecological narratives that govern these riverine ecosystems. The comparative evaluation of diversity indices particularly underscored the superior analytical breadth afforded by the integrated methodology.
In summation, the integration of eDNA and traditional sampling methodologies has birthed a compelling narrative for a synergistic approach in ecological analyses. This union engenders a more robust, precise, and holistic appraisal of biodiversity, offering a balanced and comprehensive ecological narrative indispensable for long-term monitoring, conservation, and informed management of biodiversity within riverine ecosystems. The wealth of insights gleaned from melding these diverse methodologies and datasets not only enriches our understanding of the complex ecological fabric but also furnishes a robust framework for future ecological preservation and management endeavors. Through this integrative ljigens, we are better poised to navigate the complex ecological, evolutionary, and conservation narratives pivotal for the sustainable management and preservation of our invaluable riverine ecosystems. The findings underscore the imperative of amalgamating these two methods in future biodiversity research to procure more comprehensive and accurate results, thereby significantly contributing to the broader discourse of ecological preservation and management in riverine ecosystems.
Data availability statement
The original contributions presented in the study are publicly available. This data can be found here: https://www.ncbi.nlm.nih.gov, BioProject: PRJNA102180.
Ethics statement
The animal study was approved by the Animal Care and Use Committee of Shaanxi Normal University. The study was conducted in accordance with the local legislation and institutional requirements.
Author contributions
BW: Data curation, Formal analysis, Investigation, Methodology, Resources, Writing – original draft. LJ: Data curation, Formal analysis, Investigation, Methodology, Resources, Writing – review & editing. LN: Data curation, Formal analysis, Investigation, Resources, Writing – review & editing. MW: Data curation, Formal Analysis, Investigation, Writing – review & editing. PY: Conceptualization, Funding acquisition, Project administration, Resources, Supervision, Writing – review & editing.
Funding
The author(s) declare financial support was received for the research, authorship, and/or publication of this article. The work was supported by the National Natural Science Foundation of China (31872203).
Acknowledgments
The authors would like to thank Professor Xinping Ye (College of Life Science, Shaanxi Normal University) for assistance with some information materials. This work was funded by grants from the National Natural Science Foundation of China (31872203).
Conflict of interest
The authors declare that the research was conducted in the absence of any commercial or financial relationships that could be construed as a potential conflict of interest.
Publisher’s note
All claims expressed in this article are solely those of the authors and do not necessarily represent those of their affiliated organizations, or those of the publisher, the editors and the reviewers. Any product that may be evaluated in this article, or claim that may be made by its manufacturer, is not guaranteed or endorsed by the publisher.
Supplementary material
The Supplementary Material for this article can be found online at: https://www.frontiersin.org/articles/10.3389/fmars.2024.1289589/full#supplementary-material
References
Anderson M. J. (2001). A new method for non-parametric multivariate analysis of variance. Austral Ecol. 26 (1), 32–46. doi: 10.1111/j.1442-9993.2001.01070.pp.x
Anderson M. J., Crist T. O., Chase J. M., Vellend M., Inouye B. D., Freestone A. L., et al. (2011). Navigating the multiple meanings of β diversity: a roadmap for the practicing ecologist. Ecol. Lett. 14, 19–28. doi: 10.1111/j.1461-0248.2010.01552.x
Barnes M. A., Turner C. R., Jerde C. L., Renshaw M. A., Chadderton W. L., Lodge. D. M. (2014). Environmental conditions influence eDNA persistence in aquatic systems. Environ. Sci. Technol. 48, 1819–1827. doi: 10.1021/es404734p
Berger W. H., Parker F. L. (1970). Diversity of planktonic Foraminifera in deep-sea sediments. Science 168, 1345–1347. doi: 10.1126/science.168.3937.1345
Bohmann K., Evans A., Gilbert M. T. P., Carvalho G. R., Creer S., Knapp M., et al. (2014). Environmental DNA for wildlife biology and biodiversity monitoring. Trends Ecol. Evol. 29, 358–367. doi: 10.1016/j.tree.2014.04.003
Bokulich N. A., Kaehler B. D., Rideout J. R., Dillon M., Bolyen E., Knight R., et al. (2018). Optimizing taxonomic classification of marker-gene amplicon sequences with QIIME 2's q2-feature-classifier plugin. Microbiome 6, 90. doi: 10.1186/s40168-018-0470-z
Bolyen E., Rideut J. R., Dillon M. R., Bokulich N. A., Abnet C., Al-Ghalith G. A., et al. (2018). QIIME 2: Reproducible, interactive, scalable, and extensible microbiome data science. PeerJ 6, e27295.
Borja N., Elliott M. (2013). Marine monitoring during an economic crisis: The cure is worse than the disease. Mar. Pollut. Bull. 68, 1–3. doi: 10.1016/j.marpolbul.2013.01.041
Bray J. R., Curtis J. T. (1957). An ordination of the upland forest communities of southern Wisconsin. Ecol. Monogr. 27, 325–349. doi: 10.2307/1942268
Casselman J. M., Penczak T., Carl L., Mann R. H. K., Holcik J., Woitowich W. A. (1990). An evaluation of fish sampling methodologies for large river systems. Polisch Archiv fur Hydrobiology 37, 521–551. Available at: https://www.researchgate.net/publication/285770079.
Daulwater D. C., Pert E. J. (2003). Electrofishing effort and fish species richness and relative abundance in Ozark Highland streams in Arkansas. North Am. J. Fisheries Manage. 23, 1152–1166. doi: 10.1577/MO1-144
Dejean T., Valentini A., Miquel C., Taberlet P., Bellemain E., Miaud C. (2012). Improved detection of an alien invasive species through environmental DNA barcoding: the example of the American bullfrog Lithobates catesbeianus. J. Appl. Ecol. 49, 953–959. doi: 10.1111/j.1365-2664.2012.02171.x
Evans N. T., Shirey P. D., Wieringa J. G., Mahon A. R., Lamberti G. A. (2017). Comparative cost and effort of fish distribution detection via environmental DNA analysis and electrofishing. Fisheries 42, 90–99. doi: 10.1080/03632415.2017.1276329
Farrag M. M. S. (2022). Biometrics of Aquatic Animals. Recent Advances in Biometrics. doi: 10.5772/intechopen.102957
Fischer J. R., Paukert C. P. (2009). Effects of sampling effort, assemblage similarity and habitat heterogeneity on estimates of species richness and relative abundance of stream fishes. Can. J. Fisheries Aquat. Sci. 66, 277–290. doi: 10.1139/F08-209
Froese R., Pauly D. (2021). FishBase (World Wide Web electronic publication). Available at: www.fishbase.org.
Goffaux D., Grenouillet G., Kestemont P. (2005). Electrofishing versus gillnet sampling for the assessment of fish assemblages in large rivers. Archiv fur Hydrobiologie 162, 73–90. doi: 10.1127/0003-9136/2005/0162-0073
Goldberg C. S., Pilliod D. S., Arkle R. S., Waits L. P. (2011). Molecular detection of vertebrates in stream water: a demonstration using Rocky Mountain tailed frogs and Idaho giant salamanders. PloS One 6, e22746. doi: 10.1371/journal.pone.0022746
Gomes L. C., Pessali T. C., Sales N. G., Pompeu P. S., Carvalho D. C. (2015). Integrative taxonomy detects cryptic and overlooked fish species in a neotropical river basin. Genetica 143, 581–588. doi: 10.1007/s10709-015-9856-z
Hajibabaei M., Shokralla S., Zhou X., Singer G. A. C., Baird D. J. (2011). Environmental barcoding: a next-generation sequencing approach for biomonitoring applications using river benthos. PLOS ONE 6 (4), e17497.
He X., Jeffery N. W., Stanley R. R. E., Hamilton L. C., Rubidge E. M., Abbott C. L. (2023). eDNA metabarcoding enriches traditional trawl survey data for monitoring biodiversity in the marine environment. ICES J. Mar. Sci. 80, 1529–1540. doi: 10.1093/icesjms/fsad083
Hebert P. D. N., Cywinska A., Ball S. L., deWaard J. R. (2003). Biological identifications through DNA barcodes. Proc. R. Soc. Lond. B. Biol. Sci. 270, 313–321.
Jaccard P. (1901). Etude comparative de la distribution florale dans une portion des Alpes et des Jura. Bull. la Societe Vaudoise Des. Sci. Naturelles 37, 547–579. doi: 10.5169/SEALS-266450
Jerde C. L., Mahon A. R., Chadderton W. L., Lodge D. M. (2011). Sight-unseen detection of rare aquatic species using environmental DNA. Conserv. Lett. 4, 150–157. doi: 10.1111/j.1755-263X.2010.00158.x
Kelly R. P., Port J. A., Yamahara K. M., Crowder L. B. (2014). Using environmental DNA to census marine fishes in a large mesocosm. PloS One 9, e86175. doi: 10.1371/journal.pone.0086175
Kruskal J. B. (1964). Multidimensional scaling by optimizing goodness of fit to a nonmetric hypothesis. Psychometrika 29, 1–27. doi: 10.1007/BF02289565
Kundu S., Rath S., Laishram K., Pakrashi A., Das U., Tyagi K., et al. (2019). DNA barcoding identified selected ornamental fishes in Murti river of East India. Mitochondrial DNA Part B 4, 594–598. doi: 10.1080/23802359.2018.1561220
Liu K., Zhao S., Yu Z., Zhou Y., Zhou C. (2020). Application of DNA barcoding in fish identification of supermarkets in Henan province, China: More and longer COI gene sequences were obtained by designing new primers. Food Res. Int. 136, 109516.2. doi: 10.1016/j.foodres.2020.109516
MacKenzie D. I., Nichols J. D., Kawanishi K., Bailey L. L. (2015). Improving inferences in population studies of rare species that are detected imperfectly. Ecology 86, 1101–1113. doi: 10.1890/04-1060
Mann H. B., Whitney D. R. (1947). On a test of whether one of two random variables is stochastically larger than the other. Ann. Math. Stat. 18, 50–60. doi: 10.1214/aoms/1177730491
Martin M. (2011). Cutadapt removes adapter sequences from high-throughput sequencing reads. EMBnet J. 17, 10–12. doi: 10.14806/ej.17.1.200
Miya M., Sato Y., Fukunaga T., Sado T., Poulsen J. Y., Sato K., et al. (2015). MiFish, a set of universal PCR primers for metabarcoding environmental DNA from fishes: detection of more than 230 subtropical marine species. R. Soc. Open Sci. 2, 150088. doi: 10.1098/rsos.150088
Oksanen J., Simpson G. L., Blanchet F. G., Kindt R., Legendre P., Minchin P. R., et al. (2022). vegan: community ecology package (R Package Version 2). (CRAN), 6–4.
Paller M. H. (1994). Relationships between fish assemblage structure and stream order in south carolina coastal plain streams. Trans. Am. Fisheries Soc. 123, 150–161. doi: 10.1577/1548-8659(1994)123<0150:RBFASA>2.3.CO;2
Pearson K. (1895). Note on regression and inheritance in the case of two parents. Proc. R. Soc. London 58, 240–242. doi: 10.1098/rspl.1895.0041
Pielou E. C. (1966). The measurement of diversity in different types of biological collections. J. Theor. Biol. 13, 131–144. doi: 10.1016/0022-5193(66)90013-0
Piggott M. P. (2016). Evaluating the effects of laboratory protocols on eDNA detection probability for an endangered freshwater fish. Ecol. Evol. 6, 2739–2750. doi: 10.1002/ece3.2083
Piper A. M., Batovska J., Cogan N. O. I., Weiss J., Cunningham J. P., Rodoni B. C., et al. (2019). Prospects and challenges of implementing DNA metabarcoding for high-throughput insect surveillance. GigaScience 8 (8), giz092. doi: 10.1093/gigascience/giz092
Pont D., Rocle M., Valentini A., Civade R., Jean P., Maire A., et al. (2018). Environmental DNA reveals quantitative patterns of fish biodiversity in large rivers despite its downstream transportation. Sci. Rep. 8, 10361. doi: 10.1038/s41598-018-28424-8
Porter T. M., Hajibabaei M. (2018). Scaling up: a guide to high-throughput genomic approaches for biodiversity analysis. Mol. Ecol. 27, 313–338. doi: 10.1111/mec.14478
Przybyla–Kelly K., Spoljaric A. M., Nevers M. B. (2023). Round goby detection in lakes huron and michigan—An evaluation of eDNA and fish catches. Fishes 8, 41. doi: 10.3390/fishes8010041
Ratnasingham S., Hebert P. D. (2007). BOLD: The barcode of life data system (www.barcodinglife.org). Mol. Ecol. Notes 7, 355–364. doi: 10.1111/j.1471-8286.2007.01678.x
Real R., Vargas J. M. (1996). The probabilistic basis of Jaccard's index of similarity. Systematic Biol. 45, 380–385. doi: 10.1093/sysbio/45.3.380
Robins C. R., Ray G. C., Douglass W. (2016). A field guide to atlantic coast fishes (North America: Houghton Mifflin Harcourt).
Rognes T., Flouri T., Nichols B., Quince C., Mahe F. (2016). VSEARCH: a versatile open source tool for metagenomics. PeerJ 4, e2584. doi: 10.7717/peerj.2584
Ruttenberg B. I. (2001). Effects of artisanal fishing on marine communities in the Galapagos Islands. Conserv. Biol. 15, 691–1699.s. doi: 10.1046/j.1523-1739.2001.99556.x
Shannon C. E. (1948). A mathematical theory of communication. Bell System Tech. J. 27, 379–423. doi: 10.1002/j.1538-7305.1948.tb01338.x
Silk N., Ciruna K. (2005). A practitioner’s guide to freshwater biodiversity conservation (Island Press), 61–65.
Takahara T., Minamoto T., Doi H. (2012). Using environmental DNA to estimate the distribution of an invasive fish species in ponds. PloS One 7, e48155. doi: 10.1371/journal.pone.0035868
Thomsen P. F., Kielgast J., Iversen L. L., Wiuf C., Rasmussen M., Gilbert M. T. P., et al. (2012). Monitoring endangered freshwater biodiversity using environmental DNA. Mol. Ecol. 21, 2565–2573. doi: 10.1111/j.1365-294X.2011.05418.x
Valentini A., Taberlet P., Miaud C., Civade R., Herder J., Thomsen P. F., et al. (2016). Next-generation monitoring of aquatic biodiversity using environmental DNA metabarcoding. Mol. Ecol. 25, 929–942. doi: 10.1111/mec.13428
Vehanen T., Sutela T., Jounela P., Huusko A., Maki-Petays A. (2013). Assessing electric fishing sampling effort to estimate stream fish assemblage attributes. Fisheries Manage. Ecol. 20, 10–20. doi: 10.1111/j.1365-2400.2012.00859.x
Ward R. D., Zemlak T. S., Innes B. H., Last P. R., Hebert P. D. N. (2005). DNA barcoding Australia's fish species. Philos. Trans. R. Soc. B: Biol. Sci. 360, 1847–1857. doi: 10.1098/rstb.2005.1716
Wilcoxon F. (1945). Individual comparisons by ranking methods. Biometrics Bull. 1, 80–83. doi: 10.2307/3001968
Williford D., Hajovsky P., Anderson J. (2023). Environmental DNA compliments traditional sampling for monitoring fish communities in a Texas estuary. North Am. J. Fisheries Manage. 43 (5). doi: 10.1002/nafm.10937
Yue P. Q., Chen Y. Y. (1998). Endangered in China red data book of endangered animals Pisces (Beijing: Science Press).
Zajicek P., Wolter C. (2018). The gain of additional sampling methods for the fish-based assessment of large rivers. Fisheries Res. 197, 15–24. doi: 10.1016/j.fishres.2017.09.018
Keywords: environmental DNA (eDNA), traditional sampling, fish species identification, biodiversity, indices assessing and monitoring species diversity
Citation: Wang B, Jiao L, Ni L, Wang M and You P (2024) Bridging the gap: The integration of eDNA techniques and traditional sampling in fish diversity analysis. Front. Mar. Sci. 11:1289589. doi: 10.3389/fmars.2024.1289589
Received: 06 September 2023; Accepted: 01 February 2024;
Published: 16 February 2024.
Edited by:
Meng Yan, City University of Hong Kong, Hong Kong SAR, ChinaReviewed by:
Jack Chi-Ho Ip, Lingnan University, Hong Kong SAR, ChinaSergio Ramírez-Amaro, Spanish Institute of Oceanography (IEO), Spain
Copyright © 2024 Wang, Jiao, Ni, Wang and You. This is an open-access article distributed under the terms of the Creative Commons Attribution License (CC BY). The use, distribution or reproduction in other forums is permitted, provided the original author(s) and the copyright owner(s) are credited and that the original publication in this journal is cited, in accordance with accepted academic practice. No use, distribution or reproduction is permitted which does not comply with these terms.
*Correspondence: Ping You, youping@snnu.edu